
Multiple Recent Colonizations of the Australian Region by the Chydorus sphaericus Group (Crustacea: Cladocera)

 ,
,  ,
, 
Abstract
:1. Introduction
2. Materials and Methods
2.1. Field Collection and Preliminary Morphological Analysis
2.2. Genetic Analysis
3. Results
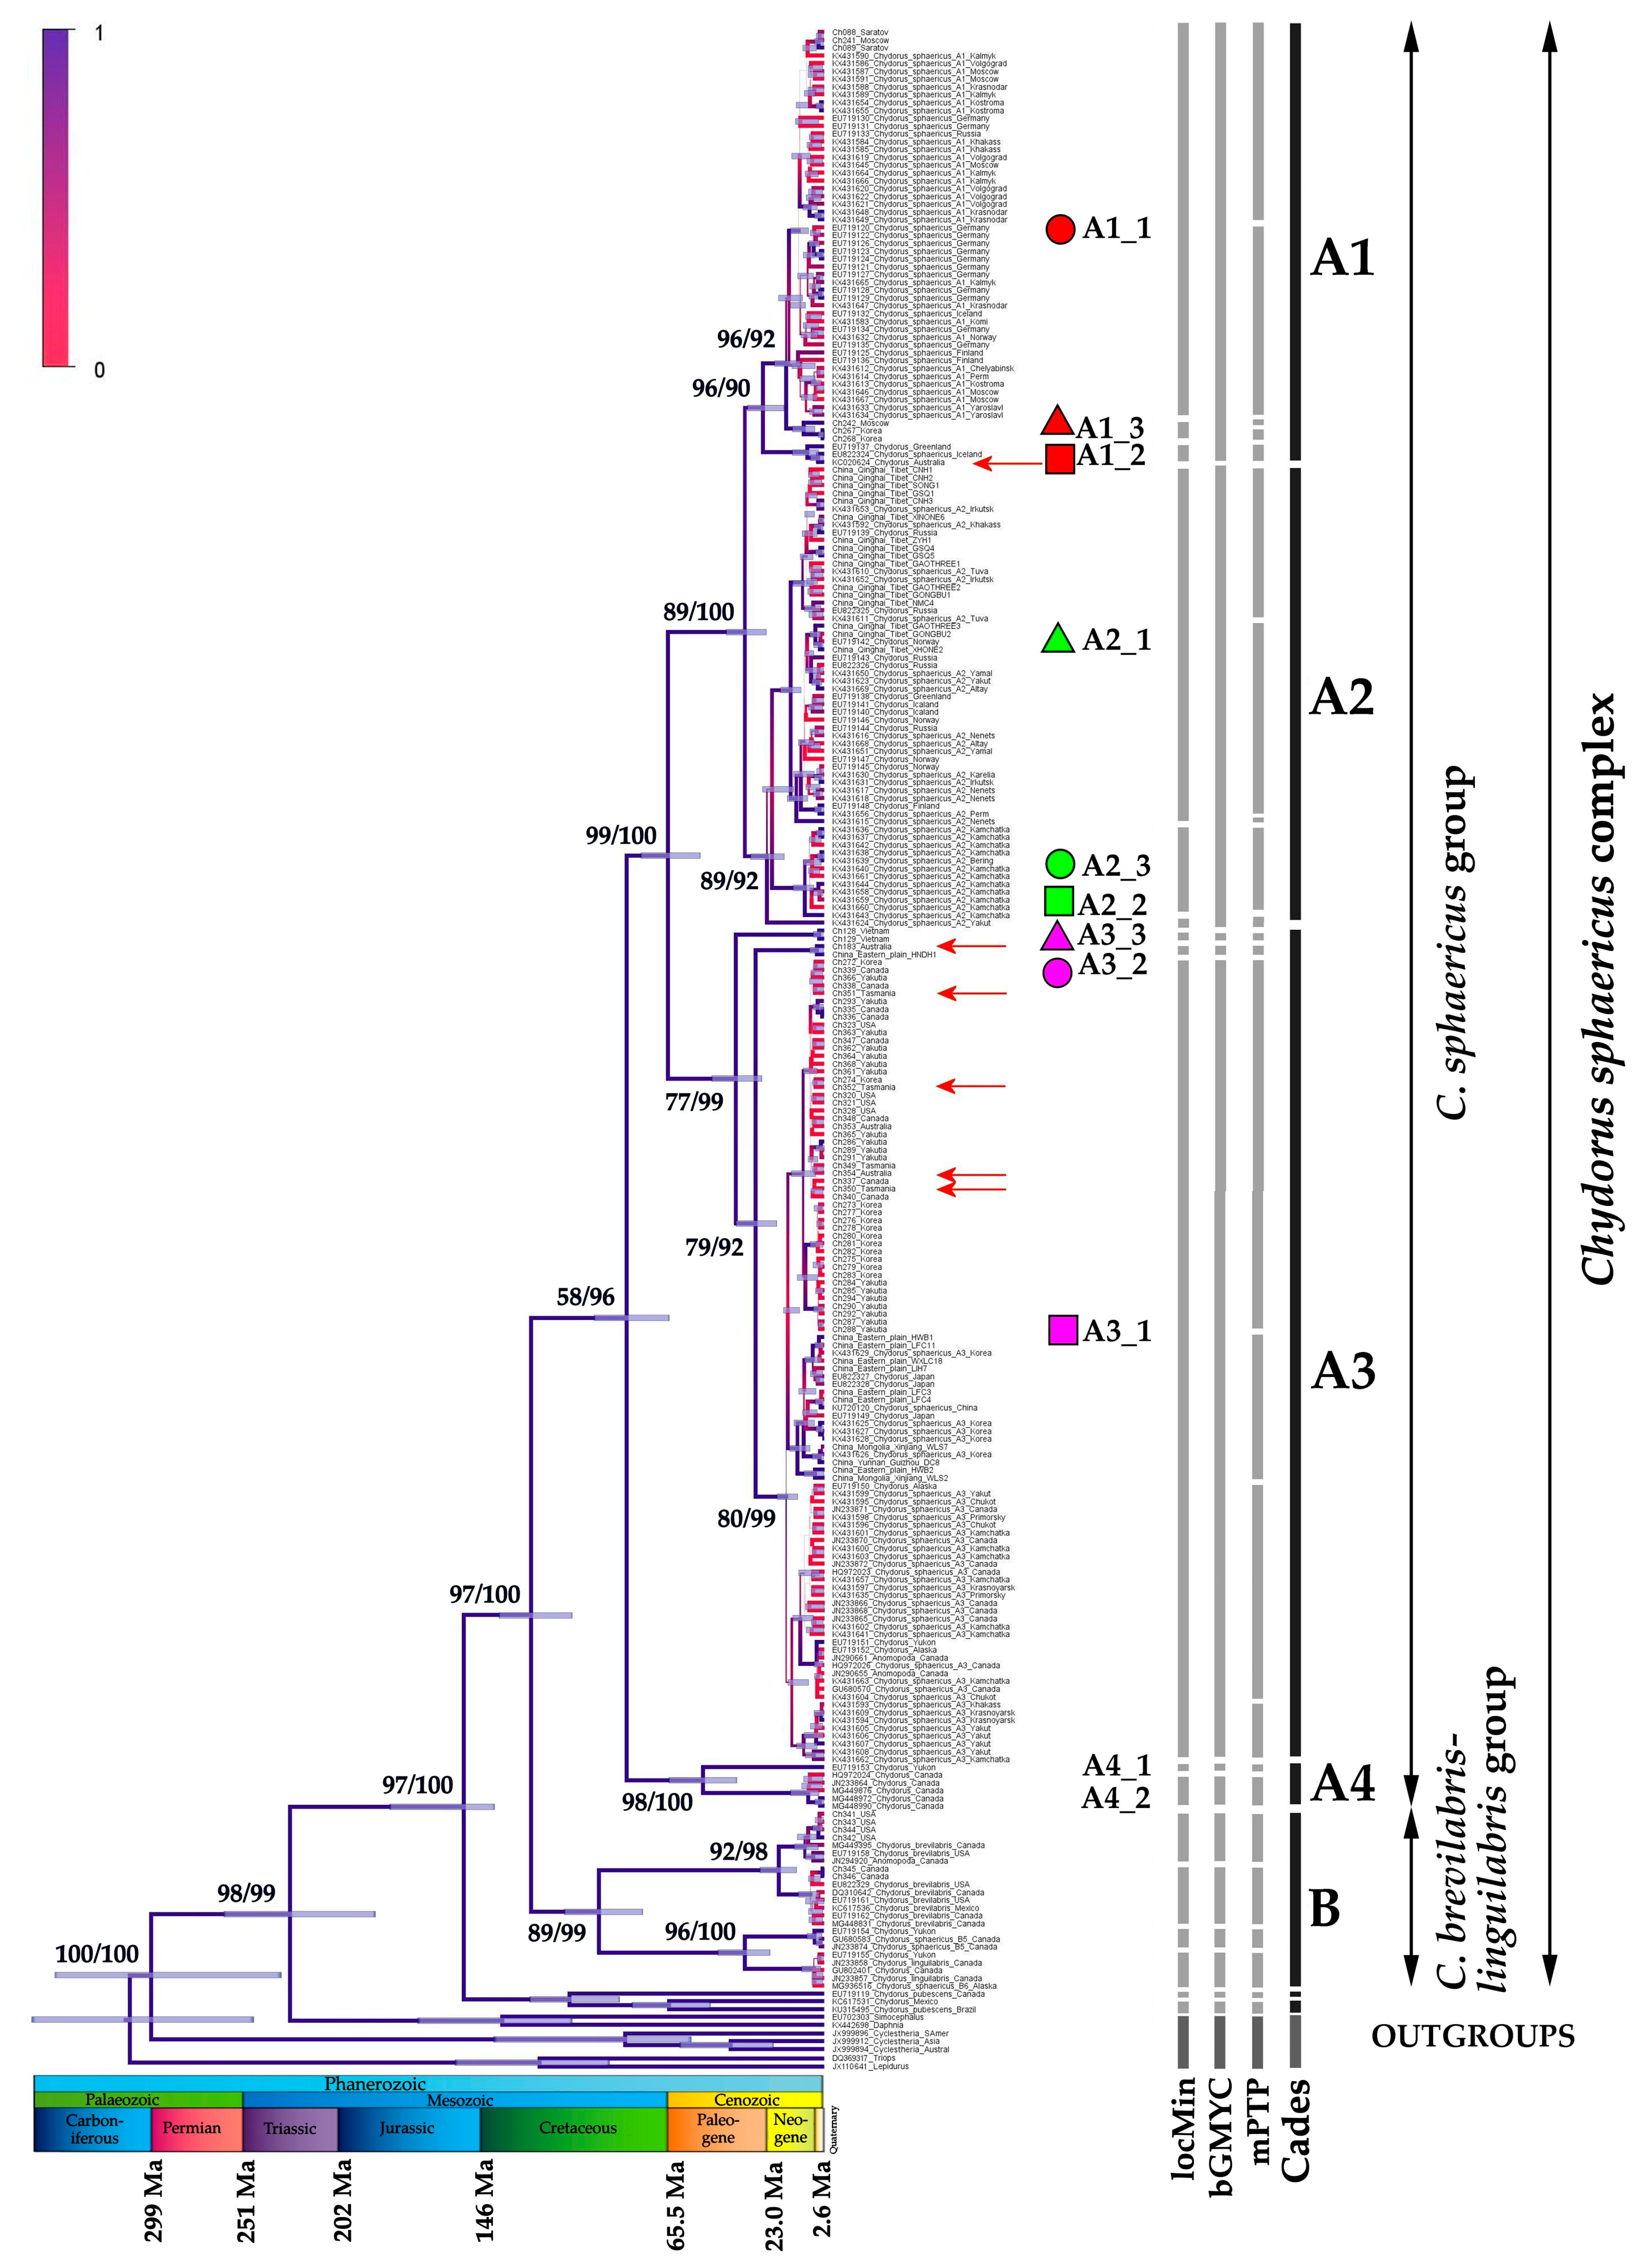
- (1)
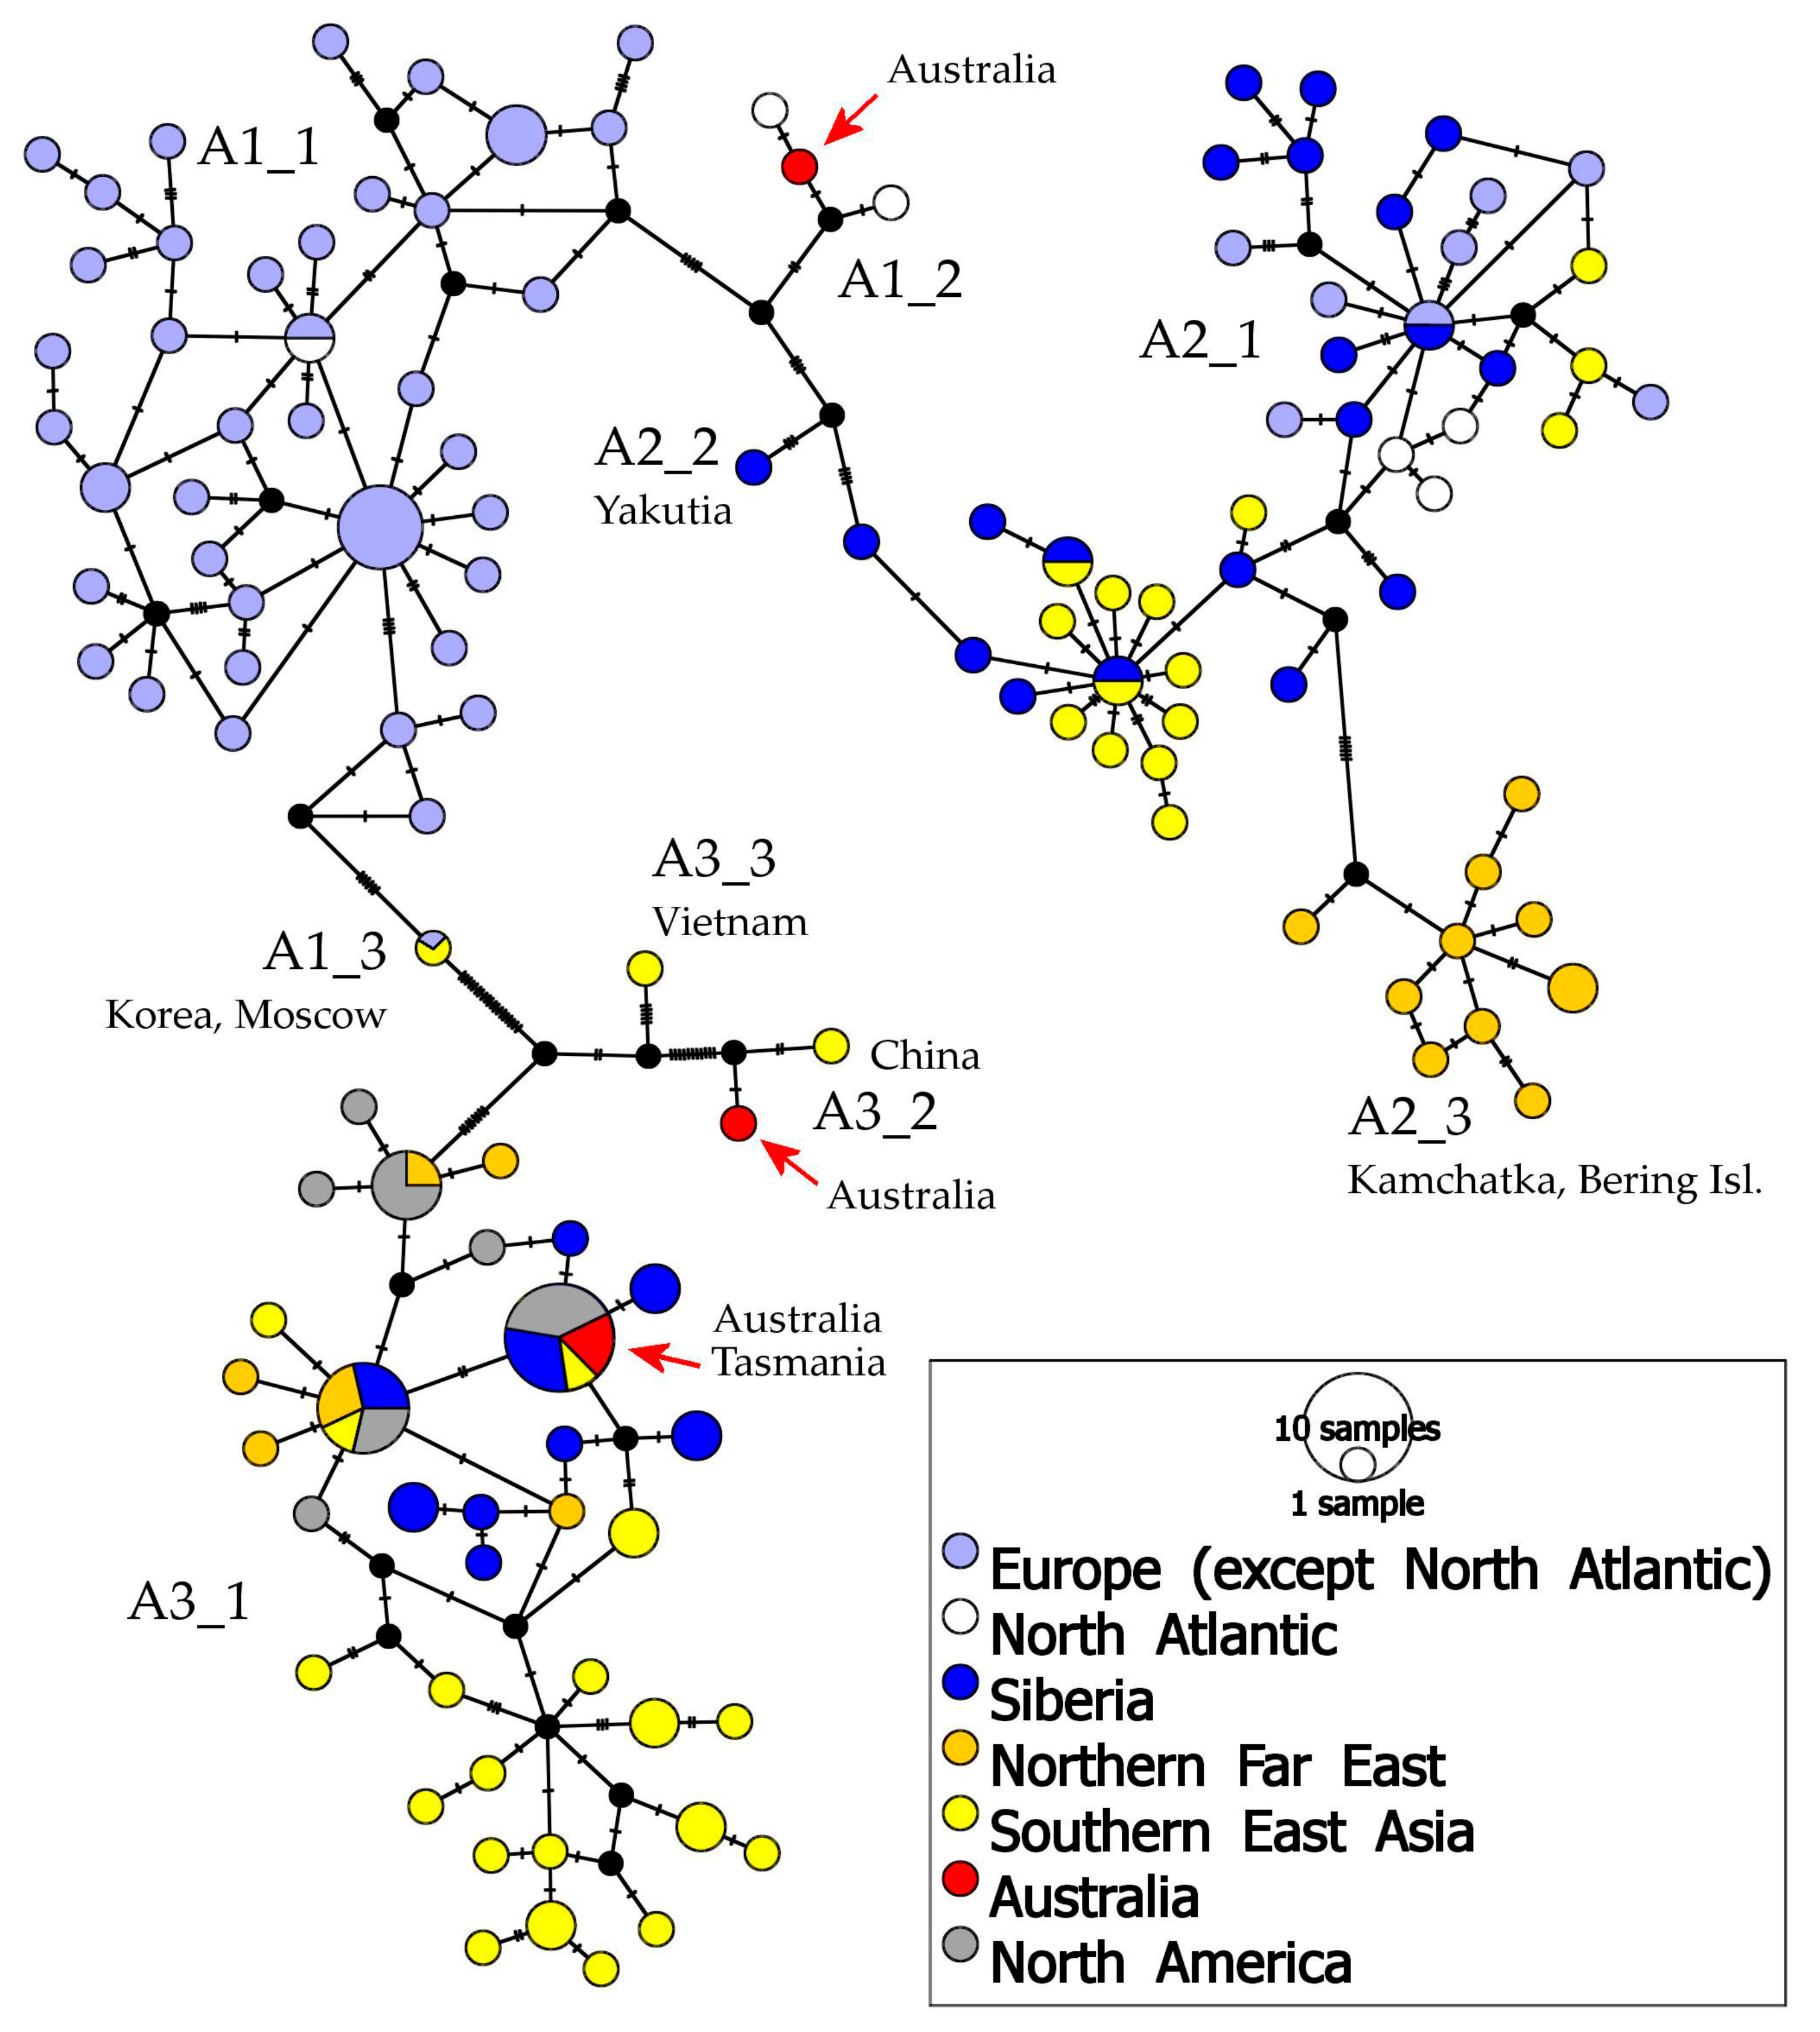
- A1 which is found in Europe, Greenland, western Siberia, with a single population in Australia;
- (2)
- A2 which is present in northern Europe, Greenland, Siberia, northern Far East, and Tibet;
- (3)
- A3 which has a wide distribution area, from eastern Siberia to northern and southern Far East and northern North America, having some populations in Australia; and
- (4)
- A4 which is present in northern North America (and is not discussed below as it was represented in our analysis by few populations and is not known from Australia).

4. Discussion
5. Conclusions
Supplementary Materials
Author Contributions
Funding
Data Availability Statement
Acknowledgments
Conflicts of Interest
References
- Avise, J.C.; Arnold, J.; Ball, R.M.; Bermingham, E.; Lamb, T.; Neigel, J.E.; Reeb, C.A.; Saunders, N.C. Intraspecific phylogeography: The mitochondrial DNA bridge between population genetics and systematics. Annu. Rev. Ecol. Syst. 1987, 18, 489–522. [Google Scholar] [CrossRef]
- Avise, J.C. Phylogeography: The History and Formation of Species; Harvard University Press: Cambridge, UK; London, UK, 2000; ISBN 0674666380. [Google Scholar]
- Hewitt, G.M. The genetic legacy of the Quaternary ice ages. Nature 2000, 405, 907–913. [Google Scholar] [CrossRef] [PubMed]
- Hewitt, G.M. The structure of biodiversity—Insights from molecular phylogeography. Front. Zool. 2004, 1, 4. [Google Scholar] [CrossRef] [Green Version]
- Lessios, H.A.; Kessing, B.D.; Pearse, J.S. Population structure and speciation in tropical seas: Global phylogeography of the sea urchin diadema. Evolution 2001, 55, 955–975. [Google Scholar] [CrossRef]
- Duncan, K.M.; Martin, A.P.; Bowen, B.W.; de Couet, H.G. Global phylogeography of the scalloped hammerhead shark (Sphyrna lewini). Mol. Ecol. 2006, 15, 2239–2251. [Google Scholar] [CrossRef] [PubMed]
- Underhill, P.A.; Passarino, G.; Lin, A.A.; Shen, P.; Lahr, M.M.; Foley, R.A.; Oefner, P.J.; Cavalli-Sforza, L.L. The phylogeography of Y chromosome binary haplotypes and the origins of modern human populations. Ann. Hum. Genet. 2001, 65, 43–62. [Google Scholar] [CrossRef] [PubMed]
- Kotov, A.A. Morphology and Phylogeny of the Anomopoda (Crustacea: Cladocera); KMK Scientific Press Ltd.: Moscow, Russia, 2013; ISBN 9785873179237. [Google Scholar]
- Adamowicz, S.J.; Purvis, A. How many branchiopod crustacean species are there? Quantifying the components of underestimation. Glob. Ecol. Biogeogr. 2005, 14, 455–468. [Google Scholar] [CrossRef]
- Lampert, W. Daphnia: Development of a Model Organism in Ecology and Evolution; International Ecology Institute: Oldendorf/Luhe, Germany, 2011; ISBN 978-3-946729-21-1. [Google Scholar]
- Smirnov, N.N. Physiology of the Cladocer, 2nd ed.; Academic Press: Cambridge, MA, USA, 2017; ISBN 9780128051948. [Google Scholar]
- Frey, D.G. Questions concerning cosmopolitanism in Cladocera. Arch. Hydrobiol. 1982, 93, 484–502. [Google Scholar]
- Frey, D.G. A new species of the Chydorus sphaericus Group (Cladocera, Chydoridae) from Western Montana. Int. Rev. Gesamten Hydrobiol. Hydrogr. 1985, 70, 1–20. [Google Scholar] [CrossRef]
- Van Damme, K.; Sinev, A.Y.; Dumont, H.J. Separation of Anthalona gen.n. from Alona Baird, 1843 (Branchiopoda: Cladocera: Anomopoda): Morphology and evolution of scraping stenothermic alonines. Zootaxa 2011, 2875, 1–64. [Google Scholar] [CrossRef]
- Neretina, A.N.; Kotov, A.A. Diversity and distribution of the Macrothrix paulensis species group (Crustacea: Cladocera: Macrothricidae) in the tropics: What can we learn from the morphological data. Ann. Limnol. Int. J. Limnol. 2017, 53, 425–465. [Google Scholar] [CrossRef]
- Korovchinsky, N.M. Cladocera: Ctenopoda: Families Sididae, Holopediidae & Pseudopenilidae (Branchiopoda: Cladocera); Backhuys Publishers; Margraf Publishers GmbH: Weikersheim, Germany, 2018; ISBN 978-3-8236-1756-3. [Google Scholar]
- Taylor, D.J.; Finston, T.L.; Hebert, P.D.N. Biogeography of a widespread freshwater crustacean: Pseudocongruence and cryptic endemism in the North American Daphnia laevis complex. Evolution 1998, 52, 1648–1670. [Google Scholar] [CrossRef] [PubMed]
- Mergeay, J.; Aguilera, X.; Declerck, S.; Petrusek, A.; Huyse, T.; de Meester, L. The genetic legacy of polyploid Bolivian Daphnia: The tropical Andes as a source for the North and South American D. pulicaria complex. Mol. Ecol. 2008, 17, 1789–1800. [Google Scholar] [CrossRef] [PubMed]
- Adamowicz, S.J.; Petrusek, A.; Colbourne, J.K.; Hebert, P.D.; Witt, J.D. The scale of divergence: A phylogenetic appraisal of intercontinental allopatric speciation in a passively dispersed freshwater zooplankton genus. Mol. Phylogenet. Evol. 2009, 50, 423–436. [Google Scholar] [CrossRef] [PubMed]
- Kotov, A.A.; Garibian, P.G.; Bekker, E.I.; Taylor, D.J.; Karabanov, D.P. A new species group from the Daphnia curvirostris species complex (Cladocera: Anomopoda) from the eastern Palaearctic: Taxonomy, phylogeny and phylogeography. Zool. J. Linn. Soc. 2020, 191, 772–822. [Google Scholar] [CrossRef]
- Sinev, A.Y.; Karabanov, D.P.; Kotov, A.A. A new North Eurasian species of the Alona affinis complex (Cladocera: Chydoridae). Zootaxa 2020, 4767, 115–137. [Google Scholar] [CrossRef]
- Belyaeva, M.; Taylor, D.J. Cryptic species within the Chydorus sphaericus species complex (Crustacea: Cladocera) revealed by molecular markers and sexual stage morphology. Mol. Phylogenet. Evol. 2009, 50, 534–546. [Google Scholar] [CrossRef]
- Xu, S.; Hebert, P.D.N.; Kotov, A.A.; Cristescu, M.E. The noncosmopolitanism paradigm of freshwater zooplankton: Insights from the global phylogeography of the predatory cladoceran Polyphemus pediculus (Linnaeus, 1761) (Crustacea, Onychopoda). Mol. Ecol. 2009, 18, 5161–5179. [Google Scholar] [CrossRef]
- Millette, K.; Xu, S.; Witt, J.D.S.; Cristescu, M.E. Pleistocene-driven diversification in freshwater zooplankton: Genetic patterns of refugial isolation and postglacial recolonization in Leptodora kindtii (Crustacea, Cladocera). Limnol. Oceanogr. 2011, 56, 1725–1736. [Google Scholar] [CrossRef]
- Kotov, A.A.; Karabanov, D.P.; Bekker, E.I.; Neretina, T.V.; Taylor, D.J. Phylogeography of the Chydorus sphaericus group (Cladocera: Chydoridae) in the Northern Palearctic. PLoS ONE 2016, 11, e0168711. [Google Scholar] [CrossRef] [Green Version]
- Bekker, E.I.; Karabanov, D.P.; Galimov, Y.R.; Haag, C.R.; Neretina, T.V.; Kotov, A.A. Phylogeography of Daphnia magna Straus (Crustacea: Cladocera) in Northern Eurasia: Evidence for a deep longitudinal split between mitochondrial lineages. PLoS ONE 2018, 13, e0194045. [Google Scholar] [CrossRef] [PubMed]
- Neretina, A.N.; Karabanov, D.P.; Sacherova, V.; Kotov, A.A. Unexpected mitochondrial lineage diversity within the genus Alonella Sars, 1862 (Crustacea: Cladocera) across the Northern Hemisphere. PeerJ 2021, 9, e10804. [Google Scholar] [CrossRef] [PubMed]
- Crease, T.J.; Omilian, A.R.; Costanzo, K.S.; Taylor, D.J. Transcontinental phylogeography of the Daphnia pulex species complex. PLoS ONE 2012, 7, e46620. [Google Scholar] [CrossRef] [Green Version]
- Taylor, D.J.; Connelly, S.J.; Kotov, A. The Intercontinental phylogeography of neustonic daphniids. Sci. Rep. 2020, 10, 1818. [Google Scholar] [CrossRef] [PubMed]
- Garibian, P.G.; Karabanov, D.P.; Neretina, A.N.; Taylor, D.J.; Kotov, A.A. Bosminopsis deitersi (Crustacea: Cladocera) as an ancient species group: A revision. PeerJ 2021, 9, e11310. [Google Scholar] [CrossRef] [PubMed]
- Smirnov, N.N. Mesozoic Anomopoda (Crustacea) from Mongolia. Zool. J. Linn. Soc. 1992, 104, 97–116. [Google Scholar] [CrossRef]
- Schwentner, M.; Clavier, S.; Fritsch, M.; Olesen, J.; Padhye, S.; Timms, B.V.; Richter, S. Cyclestheria hislopi (Crustacea: Branchiopoda): A group of morphologically cryptic species with origins in the Cretaceous. Mol. Phylogenet. Evol. 2012, 66, 800–810. [Google Scholar] [CrossRef]
- Van Damme, K.; Kotov, A.A. The fossil record of the Cladocera (Crustacea: Branchiopoda): Evidence and hypotheses. Earth-Sci. Rev. 2016, 163, 162–189. [Google Scholar] [CrossRef]
- Sharma, P.; Kotov, A.A. Molecular approach to identify sibling species of the Ceriodaphnia cornuta complex (Cladocera: Daphniidae) from Australia with notes on the continental endemism of this group. Zootaxa 2013, 3702, 79–89. [Google Scholar] [CrossRef] [Green Version]
- Bollens, S.M.; Cordell, J.R.; Avent, S.; Hooff, R. Zooplankton invasions: A brief review, plus two case studies from the northeast Pacific Ocean. Hydrobiologia 2002, 480, 87–110. [Google Scholar] [CrossRef]
- Ricciardi, A. Are modern biological invasions an unprecedented form of Global Change. Conserv. Biol. 2007, 21, 329–336. [Google Scholar] [CrossRef] [PubMed]
- Pyšek, P.; Richardson, D.M. Invasive Species, environmental change and management, and health. Annu. Rev. Environ. Resour. 2010, 35, 25–55. [Google Scholar] [CrossRef] [Green Version]
- Dgebuadze, Y.Y. Invasions of alien species in Holarctic: Some results and perspective of investigations. Russ. J. Biol. Invasions 2014, 5, 61–64. [Google Scholar] [CrossRef]
- Dexter, E.; Bollens, S.M. Zooplankton invasions in the early 21st century: A global survey of recent studies and recommendations for future research. Hydrobiologia 2019, 847, 309–319. [Google Scholar] [CrossRef] [PubMed]
- Perrings, C.; Dehnen-Schmutz, K.; Touza, J.; Williamson, M. How to manage biological invasions under globalization. Trends Ecol. Evol. 2005, 20, 212–215. [Google Scholar] [CrossRef]
- Morais, P.; Reichard, M. Cryptic invasions: A review. Sci. Total Environ. 2018, 613–614, 1438–1448. [Google Scholar] [CrossRef]
- Petit, R.J. Biological invasions at the gene level. Divers. Distrib. 2004, 10, 159–165. [Google Scholar] [CrossRef]
- Wells, L. Effects of alewife predation on zooplankton populations in Lake Michigan. Limnol. Oceanogr. 1970, 15, 556–565. [Google Scholar] [CrossRef]
- MacIsaac, H.J.; Grigorovich, I.A.; Hoyle, J.A.; Yan, N.D.; Panov, V.E. Invasion of Lake Ontario by the Ponto–Caspian predatory cladoceran Cercopagis pengoi. Can. J. Fish. Aquat. Sci. 1999, 56, 1–5. [Google Scholar] [CrossRef]
- Havel, J.E.; Hebert, P. Daphnia lumholtzi in North America: Another exotic zooplankter. Limnol. Oceanogr. 1993, 38, 1823–1827. [Google Scholar] [CrossRef]
- Havel, J.E.; Colbourne, J.K.; Hebert, P. Reconstructing the history of intercontinental dispersal in Daphnia lumholtzi by use of genetic markers. Limnol. Oceanogr. 2000, 45, 1414–1419. [Google Scholar] [CrossRef]
- Kotov, A.A.; Taylor, D.J. Daphnia lumholtzi Sars, 1885 (Cladocera: Daphniidae) invades Argentina. J. Limnol. 2014, 73. [Google Scholar] [CrossRef] [Green Version]
- Urabe, J.; Ishida, S.; Nishimoto, M.; Weider, L.J. Daphnia pulicaria, a zooplankton species that suddenly appeared in 1999 in the offshore zone of Lake Biwa. Limnology 2003, 4, 35–41. [Google Scholar] [CrossRef]
- Mergeay, J.; Verschuren, D.; de Meester, L. Cryptic invasion and dispersal of an American Daphnia in East Africa. Limnol. Oceanogr. 2005, 50, 1278–1283. [Google Scholar] [CrossRef]
- So, M.; Ohtsuki, H.; Makino, W.; Ishida, S.; Kumagai, H.; Yamaki, K.G.; Urabe, J. Invasion and molecular evolution of Daphnia pulex in Japan. Limnol. Oceanogr. 2015, 60, 1129–1138. [Google Scholar] [CrossRef]
- Hebert, P.; Witt, J.D.S.; Adamowicz, S.J. Phylogeographical patterning in Daphnia ambigua: Regional divergence and intercontinental cohesion. Limnol. Oceanogr. 2003, 48, 261–268. [Google Scholar] [CrossRef] [Green Version]
- Ishida, S.; Taylor, D.J. Quaternary diversification in a sexual Holarctic zooplankter, Daphnia galeata. Mol. Ecol. 2006, 16, 569–582. [Google Scholar] [CrossRef]
- Kotov, A.A.; Taylor, D.J. Contrasting endemism in pond-dwelling cyclic parthenogens: The Daphnia curvirostris species group (Crustacea: Cladocera). Sci. Rep. 2019, 9, 1–10. [Google Scholar] [CrossRef] [Green Version]
- Lieder, U. The Bosmina kessleri-like morphotype of Eubosmina in Lake Muskoka, Ontario, Canada, as putative interspecific hybrids. Hydrobiologia 1991, 225, 71–80. [Google Scholar] [CrossRef]
- Haney, R.A.; Taylor, D.J. Testing paleolimnological predictions with molecular data: The origins of Holarctic Eubosmina. J. Evol. Biol. 2003, 16, 871–882. [Google Scholar] [CrossRef] [Green Version]
- Karabanov, D.P.; Garibian, P.G.; Bekker, E.I.; Sabitova, R.Z.; Kotov, A.A. Genetic Signature of a Past Anthropogenic Transportation of a Far-Eastern Endemic Cladoceran (Crustacea: Daphniidae) to the Volga Basin. Water 2021, 13, 2589. [Google Scholar] [CrossRef]
- Korovchinsky, N.M. The Cladocera (Crustacea: Branchiopoda) as a relict group. Zool. J. Linn. Soc. 2006, 147, 109–124. [Google Scholar] [CrossRef] [Green Version]
- Karabanov, D.P.; Bekker, E.I.; Kotov, A.A. Underestimated consequences of biological invasions in phylogeographic reconstructions as seen in Daphnia magna (Crustacea, Cladocera). Zool. Zh. 2020, 99, 1232–1241. [Google Scholar] [CrossRef]
- Ratnasingham, S.; Hebert, P. A DNA-Based Registry for All Animal Species: The Barcode Index Number (BIN) System. PLoS ONE 2013, 8, e66213. [Google Scholar] [CrossRef] [Green Version]
- Dumont, H.J.; Negrea, S. Introduction to the Class Branchiopoda; Backhuys: Leiden, The Netherlands, 2002; ISBN 9057821125. [Google Scholar]
- Figuerola, J.; Green, A.J. Dispersal of aquatic organisms by waterbirds: A review of past research and priorities for future studies. Freshw. Biol. 2002, 47, 483–494. [Google Scholar] [CrossRef] [Green Version]
- Fontaneto, D. Long-distance passive dispersal in microscopic aquatic animals. Mov. Ecol. 2019, 7, 1–10. [Google Scholar] [CrossRef] [Green Version]
- Darwin, C. On the Dispersal of Freshwater Bivalves. Nature 1882, 25, 529–530. [Google Scholar] [CrossRef] [Green Version]
- Smirnov, N.N. Chydoridae Fauni Mira. Fauna SSSR. Rakoobraznie. [Chydoridae of the World’s Fauna. Fauna of USSR. Crustacea]; Nauka: Leningrad, Russia, 1971. [Google Scholar]
- Klimovsky, A.I.; Kotov, A.A. Cladocera (Crustacea, Branchiopoda) of Central Yakutia 3. Taxa from the Chydorus sphaericus s. l. species group (Anomopoda, Chydoridae). Zool. Zh. 2015, 94, 1257–1267. [Google Scholar] [CrossRef]
- Smirnov, N.N.; Timms, B.V. A revision of the Australian Cladocera (Crustacea). Rec. Aust. Mus. Suppl. 1983, 1, 1–132. [Google Scholar] [CrossRef]
- Korinek, V. A Guide to Limnetic Species of Cladocera of African Inland Waters (Crustacea, Branchiopoda)—Using the Morphology of Parthenogenetic Females; The International Association of Theoretical and Applied Liminology: Geneva, Switzerland, 1999; ISBN 9789988003166. [Google Scholar]
- Ueno, M. Order Branchiopoda (Class Crustacea). Fauna Nippon. 1937, 9, 1–135. [Google Scholar]
- Ji, G.-H.; Xiang, X.-F.; Chen, S.-Z.; Yu, G.-L.; Kotov, A.A.; Dumont, H.J. Annotated Checklist of Chinese Cladocera (Crustacea: Branchiopoda). Part II. Order Anomopoda (families Macrotrichidae, Eurycercidae and Chydoridae). Zootaxa 2015, 4044, 241–269. [Google Scholar] [CrossRef] [PubMed] [Green Version]
- Sinev, A.Y.; Gu, Y.; Han, B.-P. Cladocera of Hainan Island, China. Zootaxa 2015, 4006, 569–585. [Google Scholar] [CrossRef] [PubMed]
- Tanaka, S.; Ohtaka, A. Freshwater Cladocera (Crustacea, Branchiopoda) in Lake Tonle Sap and its adjacent waters in Cambodia. Limnology 2009, 11, 171–178. [Google Scholar] [CrossRef]
- Sinev, A.Y.; Korovchinsky, N.M. Cladocera (Crustacea: Branchiopoda) of Cat Tien National Park, South Vietnam. J. Limnol. 2013, 72, 125–141. [Google Scholar] [CrossRef] [Green Version]
- Van Damme, K.; Maiphae, S.; Sa-Ardrit, P. Inland swamps in South East Asia harbour hidden cladoceran diversities: Species richness and the description of new paludal Chydoridae (Crustacea: Branchiopoda: Cladocera) from Southern Thailand. J. Limnol. 2013, 72. [Google Scholar] [CrossRef] [Green Version]
- Smirnov, N.N.; de Meester, L. Contributions to the Cladocera fauna from Papua New Guinea. Hydrobiologia 1996, 317, 65–68. [Google Scholar] [CrossRef]
- Sinev, A.Y.; Yusoff, F.M. Cladocera (Crustacea: Branchiopoda) of Sabah state in Borneo Island, Malaysia. Zootaxa 2015, 4000, 581–591. [Google Scholar] [CrossRef]
- Smirnov, N.N. Check-list of the Australian Cladocera (Crustacea). Arthropoda Sel. 1995, 4, 3–6. [Google Scholar]
- King, R.L. On Australian Entomostracans—In continuation. Pap. Proc. R. Soc. Tasman. 1853, 2, 253–263. [Google Scholar]
- Sars, G.O. Additional Notes on Australian Cladocera, Raised from Dried Mud; A.W. Brogger, Printer: Copenhagen, Denmark, 1888. [Google Scholar]
- Frey, D.G. On the plurality of Chydorus sphaericus (O. F. Müller) (Cladocera, Chydoridae), and designation of a neotype from Sjaelsø, Denmark. Hydrobiologia 1980, 69, 83–123. [Google Scholar] [CrossRef]
- Smirnov, N.N. Cladocera: The Chydorinae and Sayciinae (Chydoridae) of the World; SPB Academic Publishing: Amsterdam, The Netherlands, 1996. [Google Scholar]
- Wang, J.; Ni, Y.; Hu, W.; Yin, M. Lineage diversity and gene introgression in freshwater cladoceran crustaceans of the Chydorus sphaericus species complex. Limnol. Oceanogr. 2020, 66, 95–107. [Google Scholar] [CrossRef]
- Sharma, P.; Kotov, A.A. Establishment of Chydorus sphaericus (O.F. Muller, 1785) (Crustacea: Cladocera) in Australia: Consequences of mass fish stocking from Northern Europe. J. Limnol. 2014, 73, 225–233. [Google Scholar] [CrossRef] [Green Version]
- Hebert, P.D.N.; Cywinska, A.; Ball, S.L.; Dewaard, J.R. Biological identifications through DNA barcodes. Proc. R. Soc. Lond. Ser. B Biol. Sci. 2003, 270, 313–321. [Google Scholar] [CrossRef] [PubMed] [Green Version]
- Hebert, P.D.; Cristescu, M.E. Genetic perspectives on invasions: The case of the Cladocera. Can. J. Fish. Aquat. Sci. 2002, 59, 1229–1234. [Google Scholar] [CrossRef] [Green Version]
- Okonechnikov, K.; Golosova, O.; Fursov, M. Unipro Ugene: A unified bioinformatics toolkit. Bioinformatics 2012, 28, 1166–1167. [Google Scholar] [CrossRef] [Green Version]
- Sayers, E.W.; Beck, J.; Brister, J.R.; Bolton, E.E.; Canese, K.; Comeau, D.C.; Funk, K.; Ketter, A.; Kim, S.; Kimchi, A.; et al. Database resources of the National Center for Biotechnology Information. Nucleic Acids Res. 2020, 48, D9–D16. [Google Scholar] [CrossRef] [Green Version]
- Katoh, K.; Rozewicki, J.; Yamada, K.D. MAFFT online service: Multiple sequence alignment, interactive sequence choice and visualization. Brief. Bioinform. 2017, 20, 1160–1166. [Google Scholar] [CrossRef] [Green Version]
- MAFFT Version 7. Multiple Alignment Program for Amino Acid or Nucleotide Sequences. Available online: http://mafft.cbrc.jp/alignment/software/ (accessed on 25 August 2011).
- Kalyaanamoorthy, S.; Minh, B.Q.; Wong, T.K.F.; von Haeseler, A.; Jermiin, L.S. Model Finder: Fast model selection for accurate phylogenetic estimates. Nat. Methods 2017, 14, 587–589. [Google Scholar] [CrossRef] [Green Version]
- Trifinopoulos, J.; Nguyen, L.-T.; von Haeseler, A.; Minh, B.Q. W-IQ-TREE: A fast online phylogenetic tool for maximum likelihood analysis. Nucleic Acids Res. 2016, 44, W232–W235. [Google Scholar] [CrossRef] [Green Version]
- IQ-TREE Web Server. Available online: http://iqtree.cibiv.univie.ac.at/ (accessed on 20 September 2021).
- Posada, D.; Buckley, T.R. Model Selection and Model Averaging in Phylogenetics: Advantages of Akaike Information Criterion and Bayesian Approaches over Likelihood Ratio Tests. Syst. Biol. 2004, 53, 793–808. [Google Scholar] [CrossRef]
- Nei, M.; Kumar, S. Molecular Evolution and Phylogenetics; Oxford University Press: New York, NY, USA, 2000; ISBN 0195135857. [Google Scholar]
- Fu, Y.-X. Statistical Tests of Neutrality of Mutations against Population Growth, Hitchhiking and Background Selection. Genetics 1997, 147, 915–925. [Google Scholar] [CrossRef] [PubMed]
- Tajima, F. Statistical method for testing the neutral mutation hypothesis by DNA polymorphism. Genetics 1989, 123, 585–595. [Google Scholar] [CrossRef] [PubMed]
- Rozas, J.; Ferrer-Mata, A.; Sánchez-DelBarrio, J.C.; Guirao-Rico, S.; Librado, P.; Ramos-Onsins, S.E.; Sánchez-Gracia, A. DnaSP 6: DNA Sequence Polymorphism Analysis of Large Data Sets. Mol. Biol. Evol. 2017, 34, 3299–3302. [Google Scholar] [CrossRef] [PubMed]
- Kumar, S.; Stecher, G.; Li, M.; Knyaz, C.; Tamura, K. MEGA X: Molecular Evolutionary Genetics Analysis across Computing Platforms. Mol. Biol. Evol. 2018, 35, 1547–1549. [Google Scholar] [CrossRef]
- Collins, R.A.; Boykin, L.M.; Cruickshank, R.H.; Armstrong, K.F. Barcoding’s next top model: An evaluation of nucleotide substitution models for specimen identification. Methods Ecol. Evol. 2012, 3, 457–465. [Google Scholar] [CrossRef]
- Tamura, K.; Nei, M.; Kumar, S. Prospects for inferring very large phylogenies by using the neighbor-joining method. Proc. Natl. Acad. Sci. USA 2004, 101, 11030–11035. [Google Scholar] [CrossRef] [Green Version]
- Rosenberg, M.; Anderson, C.D. PASSaGE: Pattern Analysis, Spatial Statistics and Geographic Exegesis. Version 2. Methods Ecol. Evol. 2010, 2, 229–232. [Google Scholar] [CrossRef]
- Minh, B.Q.; Schmidt, H.A.; Chernomor, O.; Schrempf, D.; Woodhams, M.D.; von Haeseler, A.; Lanfear, R. IQ-TREE 2: New Models and Efficient Methods for Phylogenetic Inference in the Genomic Era. Mol. Biol. Evol. 2020, 37, 1530–1534. [Google Scholar] [CrossRef] [Green Version]
- Hoang, D.T.; Chernomor, O.; von Haeseler, A.; Minh, B.Q.; Vinh, L.S. UFBoot2: Improving the Ultrafast Bootstrap Approximation. Mol. Biol. Evol. 2018, 35, 518–522. [Google Scholar] [CrossRef]
- Bouckaert, R.; Vaughan, T.G.; Barido-Sottani, J.; Duchêne, S.; Fourment, M.; Gavryushkina, A.; Heled, J.; Jones, G.; Kühnert, D.; De Maio, N.; et al. BEAST 2.5: An advanced software platform for Bayesian evolutionary analysis. PLoS Comput. Biol. 2019, 15, e1006650. [Google Scholar] [CrossRef] [Green Version]
- Drummond, A.J.; Suchard, M.A.; Xie, D.; Rambaut, A. Bayesian Phylogenetics with BEAUti and the BEAST 1.7. Mol. Biol. Evol. 2012, 29, 1969–1973. [Google Scholar] [CrossRef] [PubMed] [Green Version]
- Rambaut, A.; Drummond, A.J.; Xie, D.; Baele, G.; Suchard, M.A. Posterior Summarization in Bayesian Phylogenetics Using Tracer 1.7. Syst. Biol. 2018, 67, 901–904. [Google Scholar] [CrossRef] [PubMed] [Green Version]
- Drummond, A.J.; Bouckaert, R.R. Bayesian Evolutionary Analysis with BEAST2; Cambridge University Press: Cambridge, UK, 2015; ISBN 978-1-107-01965-2. [Google Scholar]
- Brown, S.D.J.; Collins, R.A.; Boyer, S.; Lefort, M.-C.; Malumbres-Olarte, J.; Vink, C.J.; Cruickshank, R.H. Spider: An R package for the analysis of species identity and evolution, with particular reference to DNA barcoding. Mol. Ecol. Resour. 2012, 12, 562–565. [Google Scholar] [CrossRef] [PubMed]
- Rangel-Medrano, J.D.; Ortega-Lara, A.; Márquez, E.J. Ancient genetic divergence in bumblebee catfish of the genus Pseudopimelodus (Pseudopimelodidae: Siluriformes) from northwestern South America. PeerJ 2020, 8, e9028. [Google Scholar] [CrossRef]
- Microsoft R Open Application Network. Available online: https://mran.microsoft.com/ (accessed on 20 May 2021).
- Pons, J.; Barraclough, T.; Gómez-Zurita, J.; Cardoso, A.; Duran, D.P.; Hazell, S.; Kamoun, S.; Sumlin, W.D.; Vogler, A.P. Sequence-based species delimitation for the DNA taxonomy of undescribed insects. Syst. Biol. 2006, 55, 595–609. [Google Scholar] [CrossRef] [PubMed] [Green Version]
- Reid, N.M.; Carstens, B.C. Phylogenetic estimation error can decrease the accuracy of species delimitation: A Bayesian implementation of the general mixed Yule-coalescent model. BMC Evol. Biol. 2012, 12, 196. [Google Scholar] [CrossRef] [Green Version]
- mPTP Web Server. Available online: http://mptp.h-its.org/ (accessed on 20 September 2021).
- Kapli, P.; Lutteropp, S.; Zhang, J.; Kobert, K.; Pavlidis, P.; Stamatakis, A.; Flouri, T. Multi-rate Poisson Tree Processes for single-locus species delimitation under Maximum Likelihood and Markov Chain Monte Carlo. Bioinformatics 2017, 33, 1630–1638. [Google Scholar] [CrossRef] [Green Version]
- Parham, J.F.; Donoghue, P.C.J.; Bell, C.J.; Calway, T.D.; Head, J.J.; Holroyd, P.A.; Inoue, J.G.; Irmis, R.B.; Joyce, W.G.; Ksepka, D.T.; et al. Best Practices for Justifying Fossil Calibrations. Syst. Biol. 2012, 61, 346–359. [Google Scholar] [CrossRef]
- Takezaki, N.; Rzhetsky, A.; Nei, M. Phylogenetic test of the molecular clock and linearized trees. Mol. Biol. Evol. 1995, 12, 823–833. [Google Scholar] [CrossRef] [Green Version]
- Kotov, A.A.; Taylor, D.J. Mesozoic fossils (>145 Mya) suggest the antiquity of the subgenera of Daphnia and their coevolution with chaoborid predators. BMC Evol. Biol. 2011, 11, 129. [Google Scholar] [CrossRef] [Green Version]
- Luchetti, A.; Forni, G.; Skaist, A.M.; Wheelan, S.J.; Mantovani, B. Mitochondrial genome diversity and evolution in Branchiopoda (Crustacea). Zool. Lett. 2019, 5, 15. [Google Scholar] [CrossRef] [PubMed]
- Wolfe, J.M.; Daley, A.C.; Legg, D.A.; Edgecombe, G.D. Fossil calibrations for the arthropod Tree of Life. Earth-Sci. Rev. 2016, 160, 43–110. [Google Scholar] [CrossRef]
- Douglas, J.; Zhang, R.; Bouckaert, R. Adaptive dating and fast proposals: Revisiting the phylogenetic relaxed clock model. PLOS Comput. Biol. 2021, 17, e1008322. [Google Scholar] [CrossRef] [PubMed]
- Gernhard, T. The conditioned reconstructed process. J. Theor. Biol. 2008, 253, 769–778. [Google Scholar] [CrossRef] [PubMed] [Green Version]
- Barido-Sottani, J.; Bošková, V.; du Plessis, L.; Kühnert, D.; Magnus, C.; Mitov, V.; Müller, N.F.; PečErska, J.; Rasmussen, D.A.; Zhang, C.; et al. Taming the BEAST—A Community Teaching Material Resource for BEAST 2. Syst. Biol. 2017, 67, 170–174. [Google Scholar] [CrossRef] [PubMed]
- Leigh, J.W.; Bryant, D.; Nakagawa, S. Popart: Full-feature software for haplotype network construction. Methods Ecol. Evol. 2015, 6, 1110–1116. [Google Scholar] [CrossRef]
- Goloboff, P.A.; Catalano, S.A. TNT version 1.5, including a full implementation of phylogenetic morphometrics. Cladistics 2016, 32, 221–238. [Google Scholar] [CrossRef]
- Matzke, N.J. Probabilistic historical biogeography: New models for founder-event speciation, imperfect detection, and fossils allow improved accuracy and model-testing. Front. Biogeogr. 2013, 5, 242–248. [Google Scholar] [CrossRef] [Green Version]
- Yu, Y.; Harris, A.; Blair, C.; He, X. RASP (Reconstruct Ancestral State in Phylogenies): A tool for historical biogeography. Mol. Phylogenet. Evol. 2015, 87, 46–49. [Google Scholar] [CrossRef]
- Sweet, A.D.; Boyd, B.M.; Allen, J.M.; Villa, S.M.; Valim, M.P.; Rivera-Parra, J.L.; Wilson, R.E.; Johnson, K.P. Integrating phylogenomic and population genomic patterns in avian lice provides a more complete picture of parasite evolution. Evolution 2017, 72, 95–112. [Google Scholar] [CrossRef]
- Matzke, N.J. Model Selection in Historical Biogeography Reveals that Founder-Event Speciation Is a Crucial Process in Island Clades. Syst. Biol. 2014, 63, 951–970. [Google Scholar] [CrossRef] [PubMed]
- Clark, J.R.; Ree, R.H.; Alfaro, M.E.; King, M.G.; Wagner, W.L.; Roalson, E.H. A Comparative Study in Ancestral Range Reconstruction Methods: Retracing the Uncertain Histories of Insular Lineages. Syst. Biol. 2008, 57, 693–707. [Google Scholar] [CrossRef] [PubMed] [Green Version]
- Landis, M.J.; Matzke, N.J.; Moore, B.R.; Huelsenbeck, J.P. Bayesian Analysis of Biogeography when the Number of Areas is Large. Syst. Biol. 2013, 62, 789–804. [Google Scholar] [CrossRef] [Green Version]
- DIVA-GIS Software. Available online: https://www.diva-gis.org/ (accessed on 20 May 2021).
- Natural Earth Dataset. Available online: https://www.naturalearthdata.com/ (accessed on 20 May 2021).
- Gillespie, R.G.; Baldwin, B.G.; Waters, J.; Fraser, C.; Nikula, R.; Roderick, G. Long-distance dispersal: A framework for hypothesis testing. Trends Ecol. Evol. 2012, 27, 47–56. [Google Scholar] [CrossRef] [PubMed]
- Chan, K. Partial migration in Australian landbirds: A review. Emu-Austral Ornithol. 2001, 101, 281–292. [Google Scholar] [CrossRef]
- E Gill, R.; Tibbitts, T.L.; Douglas, D.C.; Handel, C.M.; Mulcahy, D.M.; Gottschalck, J.C.; Warnock, N.; McCaffery, B.J.; Battley, P.F.; Piersma, T. Extreme endurance flights by landbirds crossing the Pacific Ocean: Ecological corridor rather than barrier. Proc. R. Soc. B Biol. Sci. 2008, 276, 447–457. [Google Scholar] [CrossRef] [Green Version]
- Kobayashi, T.; Shiel, R.J.; Segers, H. First record of the rotifer Lecane shieli Segers & Sanoamuang, 1994 from Australia. Aust. Zool. 2007, 34, 181–183. [Google Scholar] [CrossRef]
- Green, A.J.; Jenkins, K.M.; A Bell, D.; Morris, P.J.; Kingsford, R. The potential role of waterbirds in dispersing invertebrates and plants in arid Australia. Freshw. Biol. 2007, 53, 380–392. [Google Scholar] [CrossRef]
- Growns, I.; Ryder, D.; Kobayashi, T.; Garcia, A. Freshwater macroinvertebrates of Lord Howe Island. Ann. Mag. Nat. Hist. 2014, 48, 2675–2687. [Google Scholar] [CrossRef]
- Driscoll, P.V.; Ueta, M. The migration route and behaviour of Eastern Curlews Numenius madagascariensis. Ibis 2002, 144, E119–E130. [Google Scholar] [CrossRef]
- Wilson, J.R.; Nebel, S.; Minton, C.D.T. Migration ecology and morphometries of two Bar-tailed Godwit populations in Australia. Emu-Austral Ornithol. 2007, 107, 262–274. [Google Scholar] [CrossRef]
- Minton, C.L.; Wahl, J.O.; Gibbs, H.E.; Jessop, R.O.; Hassell, C.H.; Boyle, A.D. Recoveries and flag sightings of waders which spend the non-breeding season in Australia. Stilt 2011, 59, 17–43. [Google Scholar]
- McAllan, I.; Curtis, B.; Hutton, I.; Cooper, R.M. The birds of the Lord Howe Island Group: A review of records. Austral. Field Ornithol. 2016, 21, 1–82. [Google Scholar]
- Hutton, I. A Field Guide to the Birds of Lord Howe Island, 7th ed.; Ian Hutton: Lord Howe Island, Australia, 2021; ISBN 0-9581286-2-6. [Google Scholar]
- Dingle, H. Migration: The Biology of Life on the Move, 7th ed.; Oxford University Press: Oxford, UK, 2014; ISBN 9780199640386. [Google Scholar]
- Cornetti, L.; Fields, P.D.; Van Damme, K.; Ebert, D. A fossil-calibrated phylogenomic analysis of Daphnia and the Daphniidae. Mol. Phylogenet. Evol. 2019, 137, 250–262. [Google Scholar] [CrossRef] [PubMed]
- Schwentner, M.; Rabet, N.; Richter, S.; Giribet, G.; Padhye, S.; Cart, J.-F.; Bonillo, C.; Rogers, D.C. Phylogeny and biogeography of Spinicaudata (Crustacea: Branchiopoda). Zool. Stud. 2020, 59, e44. [Google Scholar]
- Lynch, M.; Jarrell, P.E. A method for calibrating molecular clocks and its application to animal mitochondrial DNA. Genetics 1993, 135, 1197–1208. [Google Scholar] [CrossRef]
- Bolotov, I.N.; Aksenova, O.; Bespalaya, Y.; Gofarov, M.; Kondakov, A.; Paltser, I.S.; Stefansson, A.; Travina, O.; Vinarski, M. Origin of a divergent mtDNA lineage of a freshwater snail species, Radix balthica, in Iceland: Cryptic glacial refugia or a postglacial founder event. Hydrobiologia 2016, 787, 73–98. [Google Scholar] [CrossRef]
- Wares, J.P. Natural distributions of mitochondrial sequence diversity support new null hypotheses. Evolution 2009, 64, 1136–1142. [Google Scholar] [CrossRef]
- Scourfield, D.J. A short-spined Daphnia presumably belonging to the ‘longispina’ group—D. ambigua sp.n. J. Quekett Microsc. Club 1947, 4, 127–131. [Google Scholar]
- Brooks, J.L. The Systematics of North American Daphnia; Connecticut Academy of Arts & Sciences: New Haven, CT, USA, 1957; ISBN 978-1258657659. [Google Scholar]
- Wedderburn, S.; Barnes, T.; Shiel, R. Ecological Responses to Managed Lake Water Levels Coinciding with Restocking of Yarra Pygmy Perch. In Report to the Living Murray Initiative and the South Australian Department for Environment, Water and Natural Resources; The University of Adelaide, Department of Environment, Water and Natural Resources: Adelaide, Australia, 2016. [Google Scholar]
- Department of Natural Resources and Environment Tasmania. Invasive Freshwater Species. Available online: https://nre.tas.gov.au/invasive-species/invasive-animals/invasive-freshwater-species (accessed on 10 October 2021).
- Reader, S.E.; Hay, A.C.; McGrouther, M.A. The Australian Museum Lord Howe Island Expedition 2017—Freshwater fishes. Tech. Rep. Aust. Mus. Online 2018, 26, 69–76. [Google Scholar] [CrossRef] [Green Version]
- Duggan, I.C.; Green, J.D.; Burger, D.F. First New Zealand records of three non-indigenous zooplankton species: Skistodiaptomus pallidus, Sinodiaptomus valkanovi, and Daphnia dentifera. N. Z. J. Mar. Freshw. Res. 2006, 40, 561–569. [Google Scholar] [CrossRef]
- Duggan, I.; Robinson, K.; Burns, C.; Banks, J.; Hogg, I.D. Identifying invertebrate invasions using morphological and molecular analyses: North American Daphnia ‘pulex’ in New Zealand fresh waters. Aquat. Invasions 2012, 7, 585–590. [Google Scholar] [CrossRef] [Green Version]
- Karabanov, D.P.; Bekker, E.I.; Shiel, R.J.; Kotov, A.A. Invasion of a Holarctic planktonic cladoceran Daphnia galeata Sars (Crustacea: Cladocera) in the Lower Lakes of South Australia. Zootaxa 2018, 4402, 136–148. [Google Scholar] [CrossRef] [PubMed]
- Ye, Z.; Williams, E.; Zhao, C.; Burns, C.W.; Lynch, M. The rapid, mass invasion of New Zealand by North American Daphnia “pulex”. Limnol. Oceanogr. 2021, in press. [Google Scholar] [CrossRef]
- Green, A.J. The importance of waterbirds as an overlooked pathway of invasion for alien species. Divers. Distrib. 2015, 22, 239–247. [Google Scholar] [CrossRef] [Green Version]
- Byers, J.E. Impact of non-indigenous species on natives enhanced by anthropogenic alteration of selection regimes. Oikos 2002, 97, 449–458. [Google Scholar] [CrossRef]
- Suchy, K.D.; Salki, A.; Hann, B.J. Investigating the invasion of the nonindigenous zooplankter, Eubosmina coregoni, in Lake Winnipeg, Manitoba, Canada. J. Great Lakes Res. 2010, 36, 159–166. [Google Scholar] [CrossRef]
- Vijverberg, J.; Boersma, M. Long-term dynamics of small-bodied and large-bodied cladocerans during the eutrophication of a shallow reservoir, with special attention for Chydorus sphaericus. Hydrobiologia 1997, 360, 233–242. [Google Scholar] [CrossRef]
- Basińska, A.M.; Antczak, M.; Świdnicki, K.; Jassey, V.E.J.; Kuczyńska-Kippen, N. Habitat type as strongest predictor of the body size distribution of Chydorus sphaericus (O. F. Müller) in small water bodies. Int. Rev. Hydrobiol. 2014, 99, 382–392. [Google Scholar] [CrossRef]
- BirdLife International. Available online: http://www.birdlife.org (accessed on 24 October 2020).


| Group | N | S | p | h | Hd | Pi | k | theta | D | Fs |
|---|---|---|---|---|---|---|---|---|---|---|
| A1 | 56 | 52 | 35 | 43 | 0.977 | 0.014 | 6.34 | 0.024 | −1.498 * | −38.5 |
| A2 | 59 | 53 | 27 | 53 | 0.996 | 0.017 | 8.05 | 0.025 | −1.086 * | −56.84 |
| A3 | 107 | 27 | 22 | 21 | 0.711 | 0.009 | 2.51 | 0.021 | −1.692 * | −8.55 |
| A4 | 6 | 45 | 2 | 6 | 1 | 0.035 | 15.93 | 0.046 | −1.446 * | −0.29 |
| A total | 228 | 68 | 54 | 92 | 0.931 | 0.063 | 16.31 | 0.043 | 0.548 | −34.65 |
| B total | 26 | 115 | 91 | 17 | 0.951 | 0.111 | 38.95 | 0.107 | −0.162 | 3.09 |
Publisher’s Note: MDPI stays neutral with regard to jurisdictional claims in published maps and institutional affiliations. |
© 2022 by the authors. Licensee MDPI, Basel, Switzerland. This article is an open access article distributed under the terms and conditions of the Creative Commons Attribution (CC BY) license (https://creativecommons.org/licenses/by/4.0/).
Share and Cite
Karabanov, D.P.; Bekker, E.I.; Garibian, P.G.; Shiel, R.J.; Kobayashi, T.; Taylor, D.J.; Kotov, A.A. Multiple Recent Colonizations of the Australian Region by the Chydorus sphaericus Group (Crustacea: Cladocera). Water 2022, 14, 594. https://doi.org/10.3390/w14040594
Karabanov DP, Bekker EI, Garibian PG, Shiel RJ, Kobayashi T, Taylor DJ, Kotov AA. Multiple Recent Colonizations of the Australian Region by the Chydorus sphaericus Group (Crustacea: Cladocera). Water. 2022; 14(4):594. https://doi.org/10.3390/w14040594
Chicago/Turabian StyleKarabanov, Dmitry P., Eugeniya I. Bekker, Petr G. Garibian, Russell J. Shiel, Tsuyoshi Kobayashi, Derek J. Taylor, and Alexey A. Kotov. 2022. "Multiple Recent Colonizations of the Australian Region by the Chydorus sphaericus Group (Crustacea: Cladocera)" Water 14, no. 4: 594. https://doi.org/10.3390/w14040594