
Systematic Application of Sponge City Facilities at Community Scale Based on SWMM


1
College of Forestry, Northwest A&F University, Xianyang 712100, China
2
College of Landscape Architecture and Arts, Northwest A&F University, Xianyang 712100, China
*
Author to whom correspondence should be addressed.
Water 2022, 14(4), 591; https://doi.org/10.3390/w14040591
Submission received: 19 January 2022
/
Revised: 11 February 2022
/
Accepted: 12 February 2022
/
Published: 15 February 2022
(This article belongs to the Topic Water Management in the Era of Climatic Change)
Abstract
:In the context of global climate change, many countries have taken corresponding measures to cope with the stormwater problems in urbanization. The Chinese government introduced the concept of Sponge City to improve the urban water ecological security, which is a systematic project. Taking the urban community as our research object, we studied the combination application of LID (low-impact development) measures and retention ponds in the community and then discussed the practicability of the systematic application of Sponge City facilities in the construction of community drainage systems. There are four simulation scenarios in SWMM (stormwater management model): traditional drainage scenario, LID scenario, retention pond scenario, and LID-retention pond scenario. By comparing the effects of different facilities on runoff and outflow under the six return periods of 1a, 2a, 5a, 10a, 20a, and 50a, we find that LID measures have evident effects on runoff and outflow reduction. Still, they are greatly affected by the return period. The retention pond has no noticeable impact on runoff, but it reduces the peak value of outflow and is less affected by the return period. The combination of LID and retention pond can combine their advantages, reduce the peak flow rate of the site stably and relieve the pressure of the urban drainage system. This study provides a basis for the graded implementation of Sponge City, especially for community-scale rainwater regulation.
1. Introduction
Urban stormwater management has become a global problem. In the urbanization process, the increase of underlying impervious surfaces has brought water quality and quantity issues exacerbated by extreme rainfall events caused by climate change, complicating urban runoff management [1]. Many countries have taken measures to achieve sustainable stormwater management to deal with urban stormwater problems caused by urbanization. Since the 1970s, many developed countries, such as the United States, Germany, Japan, the United Kingdom, Australia, and other countries, have developed sustainable stormwater management ideas [2]. Some countries have proposed sustainable stormwater management measures, such as the sustainable urban drainage systems (SuDS) in the U.K. [3], the water sensitive urban design (WSUD) in Australia [4], the best management practices (BMPs), the low impact development (LID), and the green infrastructure (G.I.) in the United States [5]. Some countries have put forward regulations on stormwater management to promote the development of sustainable rainwater measures, such as the German Federal Water Act (Wasserhaushaltsgesetz, WHG) that came into force in 2010 (WHG 2009) [6], and the law for promoting rainwater utilization of Japan in 2014 [7]. In general, LID mainly refers to the small, decentralized facilities at the scale before access to municipal pipelines to address the insufficient capacity of traditional channels during heavy storms [8]. On the other hand, from the perspective of urban planning, such as controlling the water permeability of the underlying surface of the city [9], and from the perspective of technology, such as conveying the rainwater to large and deep stilling basins [10], also provide a new direction for urban stormwater management. In recent years, EPA (U.S. Environmental Protection Agency) has tended to replace LID with G.I. [11]. At the same time, the WSUD in Australia coordinates the relationship between land use, multi-water cycle, and stormwater system from urban planning and urban design to improve urban elasticity.
Since the 1980s, China has experienced large-scale urbanization. In recent years, the problem of waterlogging appeared in Beijing, Wuhan, and other cities, which has got much social attention. How to protect urban water ecological security and improve the resilience and sustainability of the city has become a research hotspot in the relative professional field. To solve the problem of urban waterlogging and protect the safety of people’s lives and property, the Chinese government put forward the concept of ‘Sponge City’ at the end of 2013. It officially launched this project at the end of 2014. The construction of Sponge City takes infiltration, stagnation, storage, purification, utilization, and emission as the “six-words” principle [12], hoping to adapt to climate change and reduce natural disasters through the combination of green infrastructure and gray infrastructure. Therefore, it pays attention to stormwater treatment and site measures and pays more attention to the regional water cycle process, which needs to design large-scale solutions and build undertaking and cooperation between different scales [13].
Since implementing the ‘Sponge City’ policy, Chinese scholars have made many explorations from the perspectives of hydraulics and hydrology [14], ecology [15], urban planning [16], urban drainage engineering [17], urban landscape [18], and application of materials [19]. Solving complex urban water problems and constructing a multi-objective modern urban stormwater system requires multi-professional collaboration that faces many obstacles and challenges [20]. Therefore, it is necessary to comprehensively recognize the urban ecological relationship and consider landing ecology to obtain the highest economic benefits at a nominal possible ecological cost [21]. Achieving this aim requires integrating urban flood risk assessment, land drainage guidance, climate forecasting methods, and long-term sustainability assessments [22]. The use of stormwater quantity models in simulated urban environments promotes this goal [23], such as SWMM, HEC-HMS, MIKE URBAN. As open-source software, SWMM is widely used for urban stormwater runoff simulation and drainage systems, watershed planning, water-sensitive urban design, and Sponge City construction [24]. At the urban or catchment scale, researchers use SWMM to estimate the surface runoff of urban secondary catchment and evaluate the effectiveness of the urban drainage system [25], or combine with ArcGIS to build an urban waterlogging model for urban waterlogging risk assessment [26]. Other studies have focused on specific projects, such as Sponge City renovation, a residential area [27], an urban road [28], or a waterlogging site [29]. On a smaller scale, SWMM is used to evaluate the effectiveness of single or combined LID measures such as green roofs [30], grassed swales, and permeable pavement [31].
Since the urban water ecological problems are complex, it is necessary to protect the hydrological pattern of the city and improve the efficiency of the regional hydrological cycle in the stage of comprehensive urban planning. Therefore, to relieve the pressure of the urban drainage system and optimize urban stormwater management, it requires systematic planning in the process of the Sponge City construction, including overall planning at the urban scale, comprehensive regulation, and storage at the community scale, and source control at the residential scale. However, most existing studies only focus on one scale [9,24,25,26,27,28,29] and lack systematic research on two or more scales. To address this shortcoming of previous studies, this study creatively takes the urban community as the research object. This study discusses how to coordinate the source control of a single project and the overall regulation and storage of the community to realize the systematization of the Sponge City construction of urban community.
Taking the Airport Garden Community as an example, this study explores methods of realizing systematic allocation of Sponge City at the community scale to relieve the pressure of the urban drainage system and improve the city’s resilience. Using the advantages of the SWMM model in runoff generation and concentration calculation, drainage system simulation, and LID measures simulation, combining its geographical conditions and functional configuration, the runoff and outfall flow of this community under different scenarios of the layout of facilities in Sponge City are simulated to provide a basis for community-scale Sponge City system construction.
2. Materials and Methods
2.1. Study Area
The Airport Garden Community, located in Xixian New Area of Shaanxi Province, China, between Xi’an City and Xianyang City, is a national development zone and one of China’s first Sponge City pilot areas. Under the combined action of atmospheric circulation and topography, this region is hot and rainy in summer and cold and dry in winter. According to the statistical analysis of the maximum daily rainfall from 1960 to 2014 and the monthly average rainfall from 1981 to 2010 recorded by the national benchmark weather station in Qindu District, the annual average rainfall in this area is about 520 mm, of which the rainfall from July to September accounts for 50% of the yearly rainfall. Most of the heavy rain (daily precipitation of 25.0–49.9 mm) and rainstorms (daily precipitation of 50.00–99.9 mm) occurred during this period, which is very easy to cause natural disasters such as floods and soil erosion [32].
The total area of the study area is 54.5 hectares. Located on the loess plateau and in the north of Weihe riverbank, the terrain of the study area is flat, and the overall slope is less than 1%. According to the actual needs of this study, we selected four street areas and four roads connected with them as the research object. The overall terrain of the chosen area is high in the northwest and low in the southeast, including four independent residential areas, a commercial service area, a community service center, a primary school, two kindergartens, and a community park (Figure 1a). The park, located in the south of the community, is an essential prerequisite for undertaking the community’s stormwater and flood regulation and storage function. Before development, the land use of the study area was farmland with good hydrological conditions. After completion, the drainage in the site is a separate system that only one of the four blocks and their surrounding facilities introduced LID application, in response to the requirements of Sponge City construction, and other projects, including the park, have adopted traditional gray infrastructure. Therefore, the focus of this study is to reconstruct the local LID facilities combined with the original stormwater pipe network in the study area and how to introduce the regulation and storage tank in the community park to improve the overall elasticity of the community.
2.2. Rainfall Scenario
The rainstorm intensity formula is an essential basic model for rainstorm disaster management. It is a necessary basis for the urban rainwater drainage network design and directly relates to the reliability of urban drainage works [33]. According to The Technical Guide for Sponge City Construction in Xixian New Area, the rainstorm intensity formula in this area is [34]:
where i is the average rainfall intensity (mm/min), P is the return period of design rainfall (a); t is the rainfall duration (min). In this study, the Rain-Model-Chicago (Version 2.06) was used to calculate the rainfall time series by rainstorm intensity formula, return period (1a, 2a, 5a, 10a, 20a, and 50a), rainfall duration (t = 120 min), and the time-to-peak ratio r (0.35 [35]). Table 1 shows the design rainfall for different return periods.
2.3. Establishment of the Model
In this study, the drainage network generalization and sub-catchments division is based on the adjusted data to drain more rainwater through the community park. According to the elevation difference of the community, the original drainage design principle is to discharge the rainwater in every block into the drainage network of the nearby road in the south. This rainwater flows out of the community from west to east along the road stormwater pipeline, forming two outlets in the east of the community (Figure 1b). After the adjustment, we changed the flow direction of some road drainage pipes and took the community park as the main drainage channel. All rainwater in the community flows into the drainage pipes under the community park and then flows out the community from the outlet on the south of the site (Figure 1c). The purpose is to discharge the rainwater into the retention pond in the community park (Figure 1d). That is a more suitable design for the current situation than the existing drainage system in this community.
The sub-catchment areas are divided according to the drainage organization. The pipe network distribution of the site and the drainage network generalization are based on the pipe diameter and slope of the pipe and the branches of the pipe network. Pipe network generalization and sub-catchment division are completed in AutoCAD 2017. The CAD file is exported as a SWMM (Version 5.1.015) model file (.inp) with HS-data (Version 1.2.51) (a CAD plug-in developed by Huishui Technology). The pipe network in the study area is generalized into 58 nodes (57 junctions and one outfall), 57 conduits, and 45 sub-catchments (Figure 1c).
In the AutoCAD, we calculated the area, width of the overland flow path, average surface slope, and percent of impervious area of every sub-catchment, obtained the elevation of junction’s invert and maximum water depth of the nodes, the maximum depth of cross-section, and length of the conduit, inlet offset, and outlet offset. Each junction is a rainwater manhole, so the maximum water depth of a node is the depth of the manhole. Since the drains of all projects in this study are circular pipes, the maximum depth of the cross-section of a link is the inner diameter of these pipes. The value of each link’s inlet and outlet offset is the altitude difference between the bottom of both ends of the pipeline and the bottom of the manhole at the corresponding locations. The above values can determine the node water storage and the flow of rainwater in the drains. According to the drawing of the projects, the stormwater pipes with a diameter less than 1 m are PVC pipes, and their Manning coefficient is 0.009. The stormwater pipe with a diameter greater than or equal to 1 m is made of concrete, and its Manning coefficient is 0.013. All the above parameters are input into the SWMM model after calculation. According to the previous research results and the characteristics of the study area, the dynamic wave is selected for the flowing routing within a conduit, and Horton’s method is used to calculate surface runoff. The parameters of Horton method, Mannings N and Depth of Depression Storage are listed in Table 2.
2.4. Set Simulation Scene
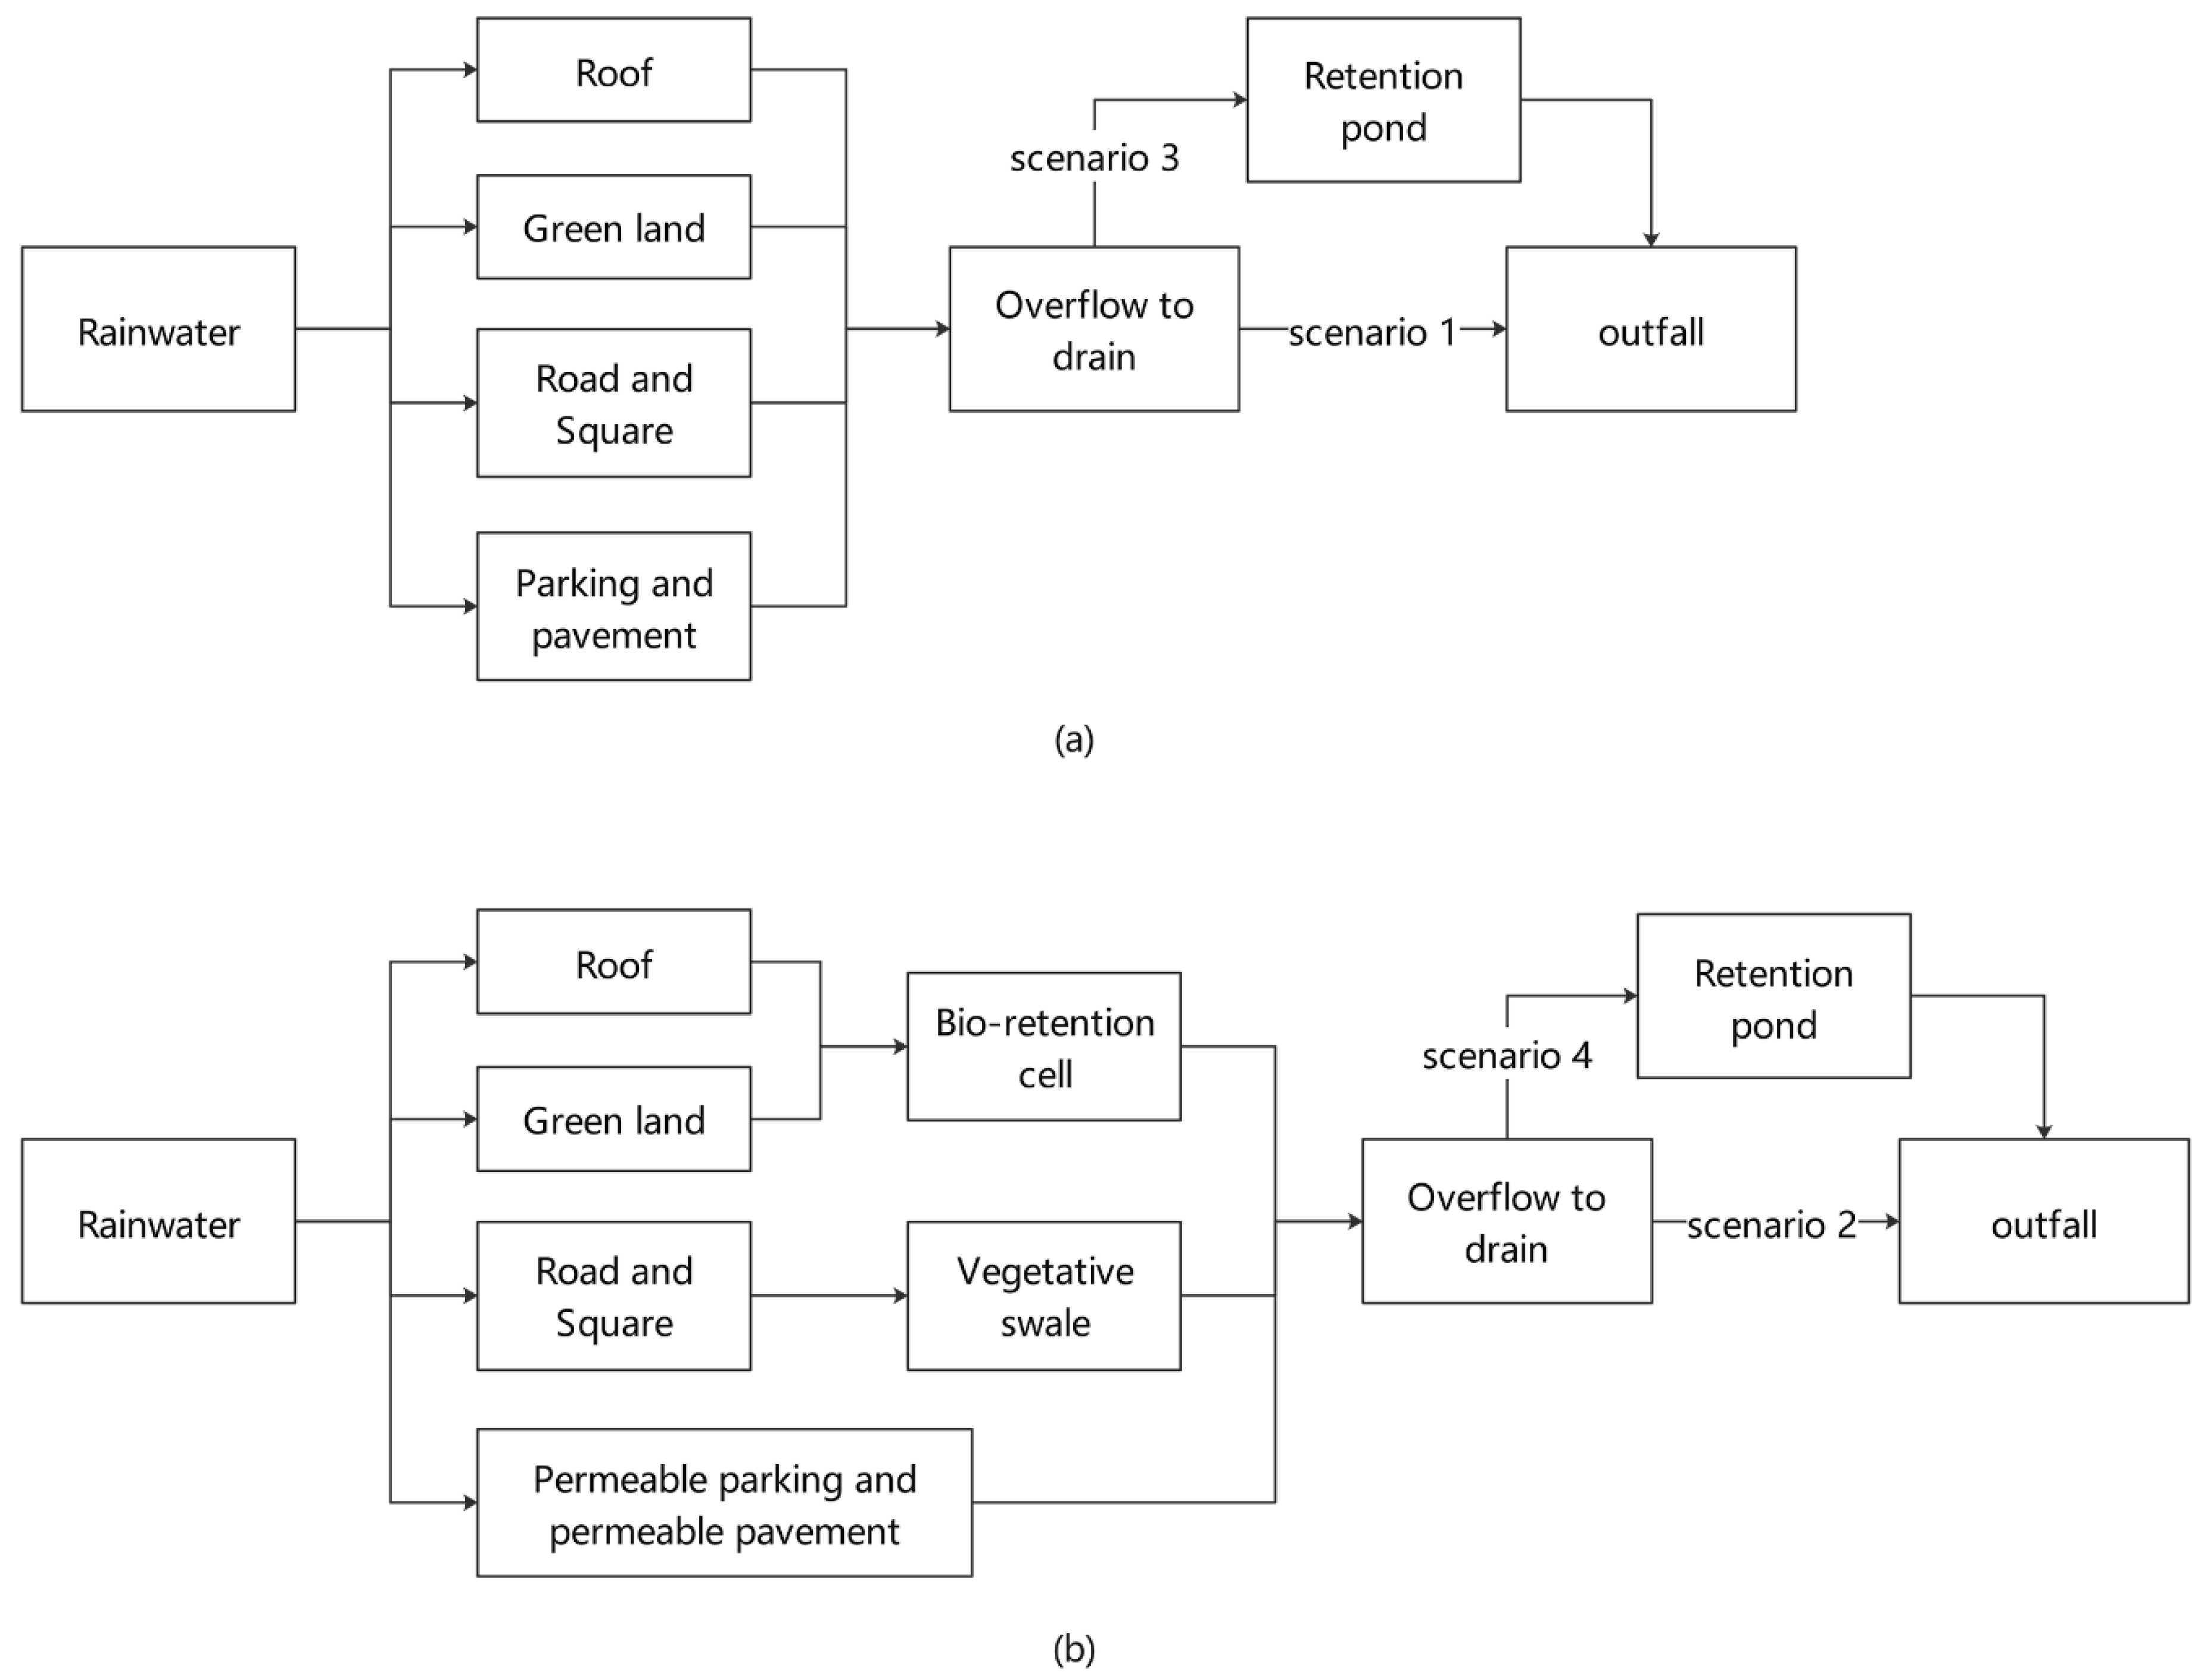
The realization of Sponge City at the community level includes two-level measures: adopting LID measures for source reduction in a single project and using existing conditions in the community to store. To study the role of these two-level measures in stormwater management, four scenarios were designed in this study: (1) no Sponge City infrastructure in the study area (noted as scenario 1), (2) LID infrastructures in each block and on the roads for source control (noted as scenario 2), (3) no LID infrastructure, and a 5199.3 m3 retention pond in the community park (noted as scenario 3), (4) LID infrastructure in each project and on roads, and a 4592.7 m3 retention pond in community park (noted as scenario 4).
On the residential scale, LID measures, which are most commonly used locally, have been selected to modify projects in the site, such as the bio-retention cell, permeable pavement, and vegetation swale. In the scenario without LID measures, runoff from impervious and pervious areas flows directly to the outlet. In the scenario with LID measures, runoff from impervious flows to the pervious area. For the municipal roads with green belt in the center or on both sides, the rainwater is discharged into the bio-retention cell in the green belt and then overflowed. In each block, the rainwater from roofs and green spaces flows into the bio-retention cells, the rainwater from roads and squares flows into the vegetation swales, and the parking spaces and the pavements are transformed into a permeable surface (Figure 2). The bio-retention cells and the vegetative swales areas were correlated with the green land area, accounting for 15% and 25% of the total green land area, respectively. The LID controls module in the SWMM model is applied to the effect evaluation of LID measures. The parameters we used are in Table 3.
At the community level, a retention pond is used to collect rainwater to prevent flooding and erosion. The retention pond is a landscape water body that can combine with green space in the park and other open urban areas, and take the stormwater as the primary water source to make up water. It has the function of stormwater storage and purification and can beautify the landscape and provide a resting place for residents. This study set the retention pond in a community park with a relatively low location in combination with the topography and landform of the community. The rainwater in the community enters the pond and is discharged when the water level reaches a certain height. The storage unites modules expressed in the parameters of the retention pond in the community park. The volume of the retention pond is determined by the volumetric method, and the formula is as follows:
where H is the design rainfall (mm), φ is the rainfall comprehensive runoff coefficient, F is the catchment area (hm2). According to the overall goal of the Sponge City construction in the Xixian New Area, the total annual runoff control rate in this area should be 80%, corresponding to 15.9 mm as the design rainfall, which is daily rainfall coming from the statistical data of local multi-year data. According to the Technical Guide for Sponge City Construction (Trial), the comprehensive rainfall-runoff coefficient is calculated by the weighted average method. After calculation, φ is 0.60 when there are no LID measures in the community, and 0.53 when the LID measures are set; the corresponding storage volume is 5199.3 m3 and 4592.7 m3, respectively. The storage units in SWMM simulated the operation of the retention pond. However, it has some limitations because it can simulate the water storage capacity of the retention pond and ignores its infiltration capacity.
V = 10HφF,
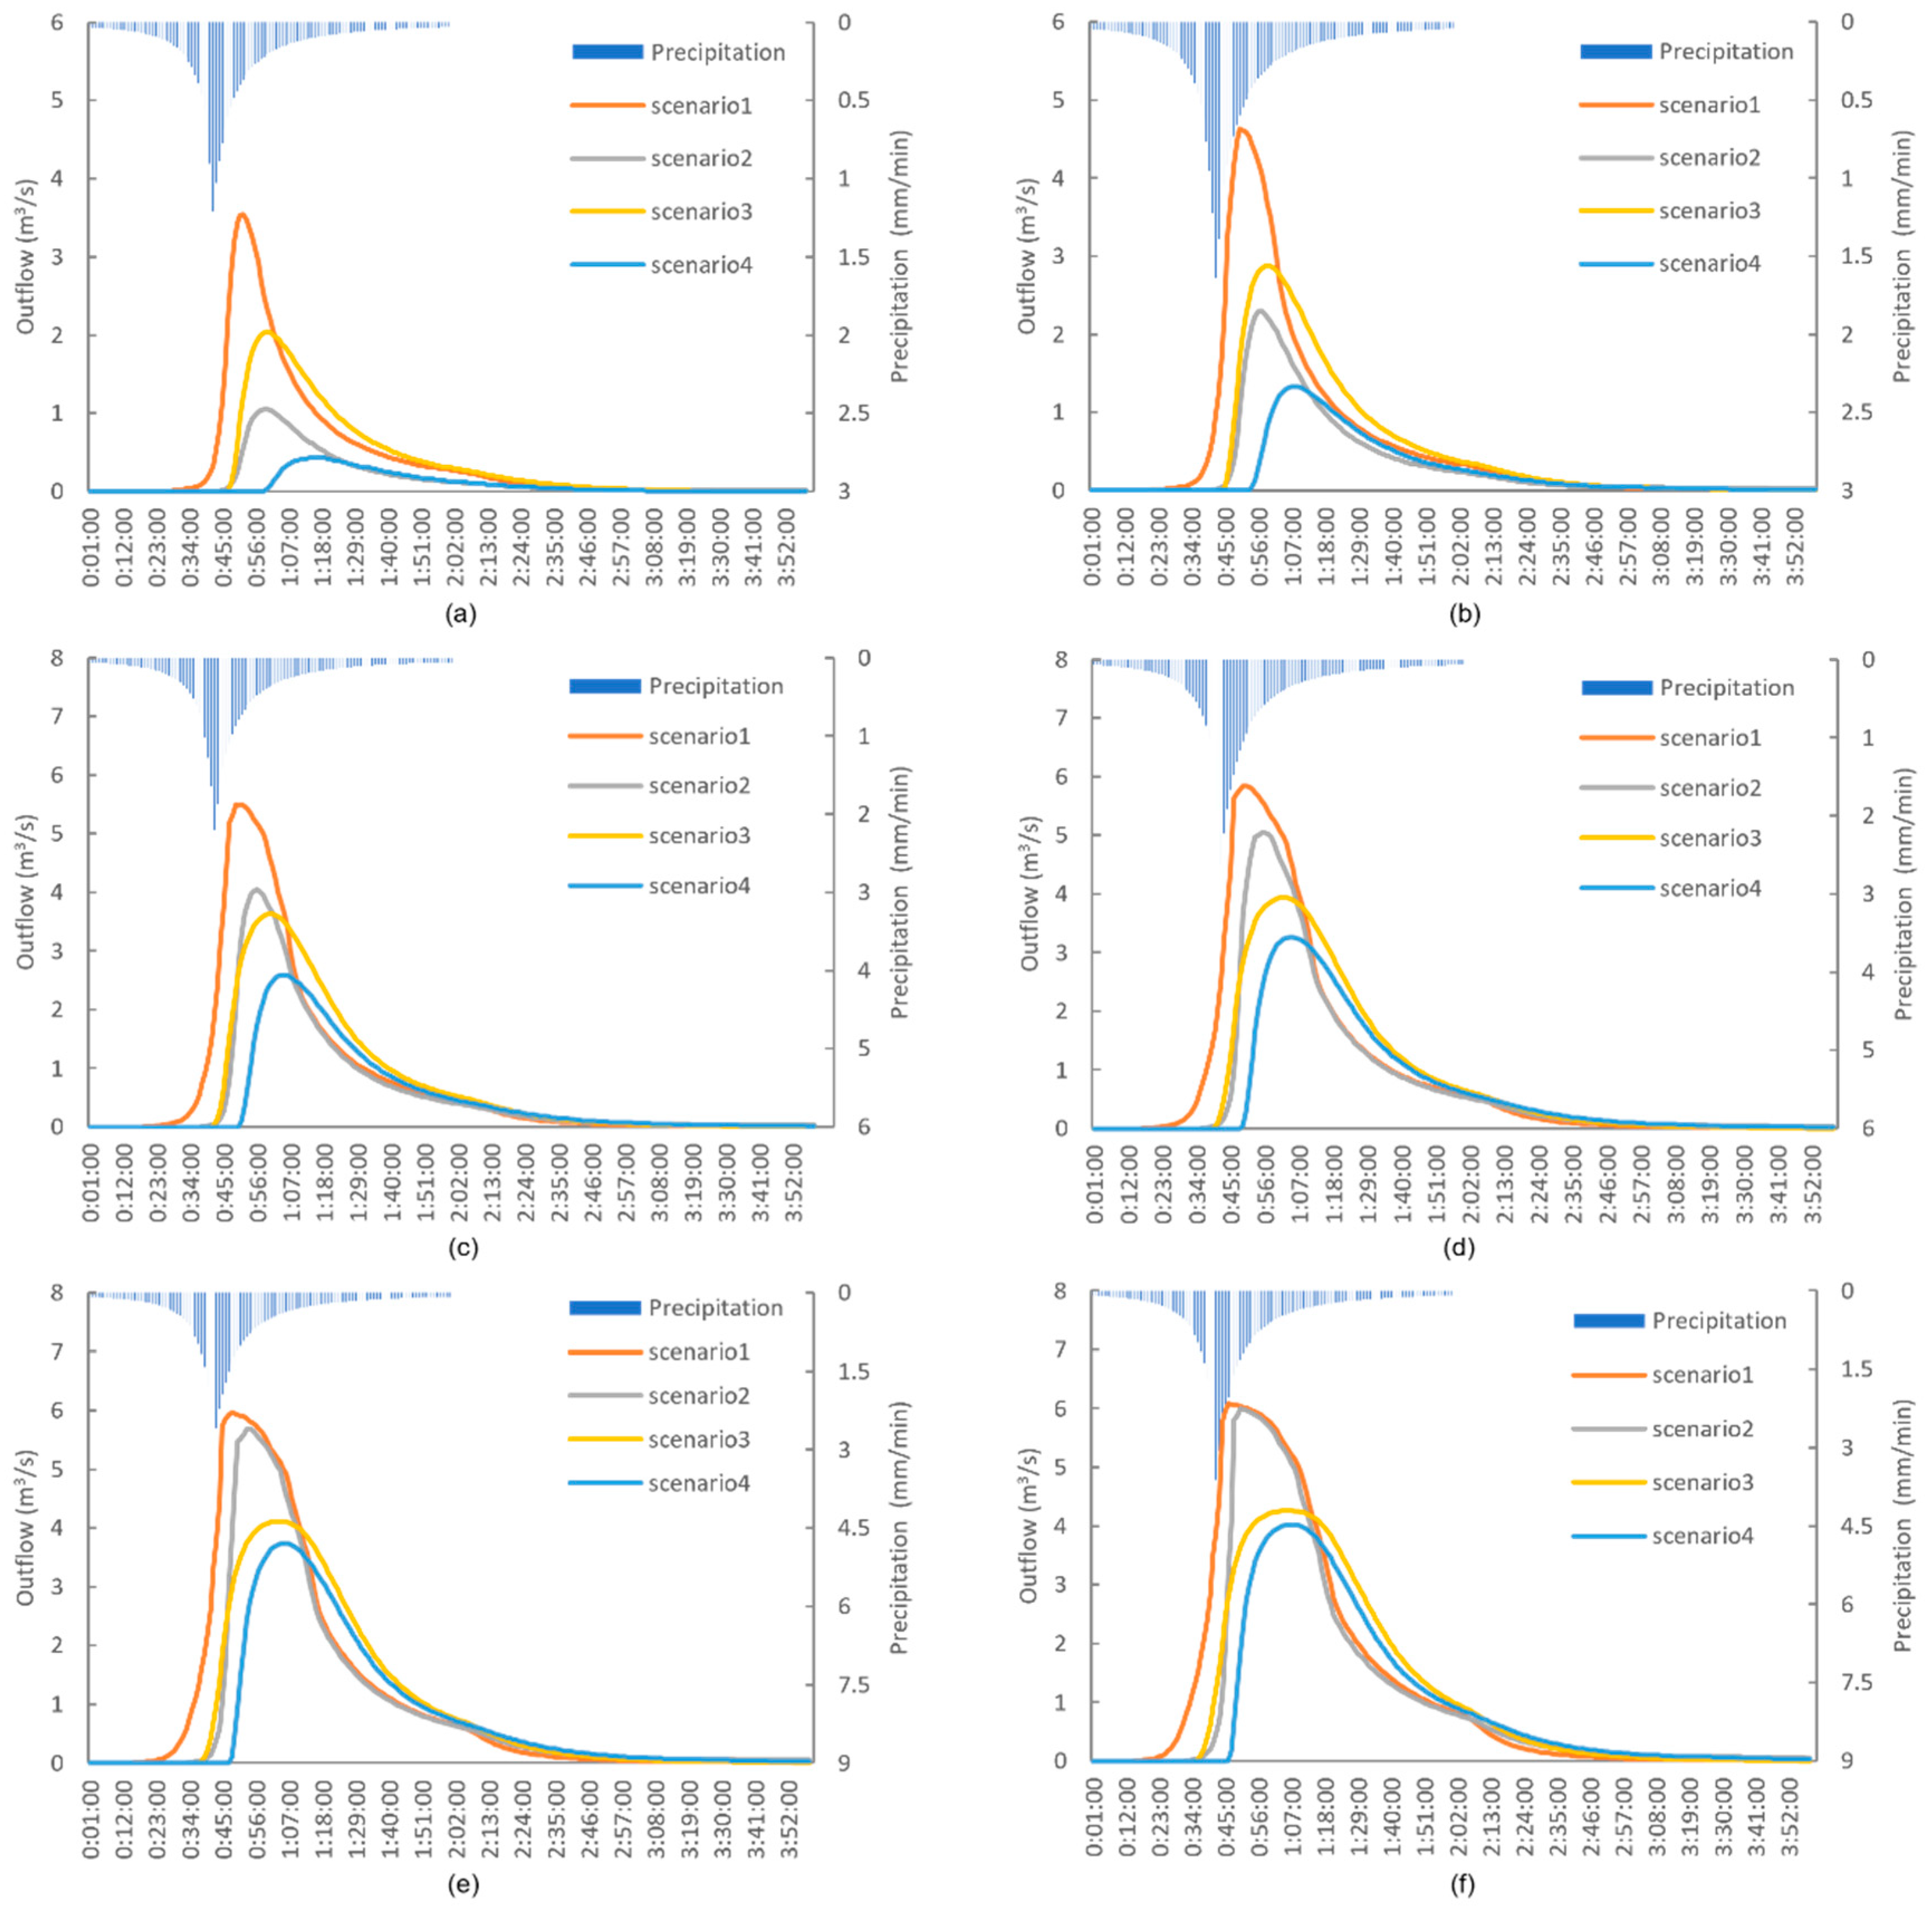
SWMM simulated the runoff and the outflow of each scenario in the return periods of 1a, 2a, 5a, 10a, 20a, 50a, respectively, and scenario 1 was used as the control group to compare and analyze the runoff generation and outflow of each scenario in different return periods. In the simulation, the rainfall duration is 120 min and the base time of runoff concentration is 240 min.
3. Results and Discussion
3.1. Effect Evaluation of LID Measures and Retention Pond
LID measures can delay the time of runoff generation and reduce runoff peak value and surface runoff, while the retention pond has little effect on runoff (Figure 3).
In scenario 2 with LID measures, the occurrence time of runoff under six return periods (1a, 2a, 5a, 10a, 20a, 50a) was delayed by 27 min, 24 min, 21 min, 19 min, 17 min, and 15 min, respectively. With the increase of the return period, the surface runoff depth reduced by LID measures was 61.6%, 44.5%, 31.5%, 27.0%, 25.2%, 24.3%, and the peak value of runoff decreased by 69.9%, 56.5%, 44.7%, 39.1%, 35.3%, 31.9%, respectively. The occurrence time of peak runoff was delayed by 6 min, 6 min, 5 min, 4 min, 4 min, and 3 min. LID measures can well reduce the surface runoff and reduce the peak runoff, and delay the generation time of runoff and the peak runoff. However, with the increase of the return period, the ability of LID measures to reduce runoff will be weakened when it reaches saturation. When the return period is 1a and 2a, the runoff of scenario 2 is less than that of scenario 1 (Figure 3a,b) for almost all the production time. Still, when the return period is greater than or equal to 5a, the curves of scenario 2 and scenario 1 gradually coincides after their respective peak (Figure 3c–f). It shows that the effect of LID measures on rainfall storage will decrease with the rise of rainfall intensity. When the return period is about 5a, the capability of LID measures is close to saturation.
Both LID measures and retention ponds can reduce total outflow, reduce peak outflow, and delay the outflow time and the peak outflow time (Figure 4). At the return periods of 1a, 2a, 5a, 10a, 20a, 50a, LID measures can delay the outflow time by 20 min, 20 min, 20 min, 19 min, 18 min, and 17 min, while the outflow time by the retention pond is delayed by 24 min, 24 min, 24 min, 23 min, 22 min, and 21 min. With the return period from low to high, LID measures postponed the peak outflow by 7 min, 7 min, 7 min, 6 min, 6 min, and 4 min, and the peak outflow time by the retention pond was postponed by 8 min, 9 min, 11 min, 12 min, 14 min, and 18 min. Both LID measures and retention ponds can effectively delay the outflow time and peak outflow time, and the regulating effect of the retention pond is better than LID measures. Especially in the regulation of peak outflow time, the retention pond can better postpone peak outflow time with the increase of the return period.
The effects of LID measures and retention pond are significantly different in total outflow and peak outflow. Although both of them will decrease with the increase of return period, the reduction of LID measures is much faster than that of the retention pond, and the regulating effect of the retention pond is relatively stable. When the return period is 1a, LID measures can reduce 61.9% of the total outflow, while the retention pond can only reduce 19.8%. LID measures reduced the peak flow by 70.3% at the same return period, while the retention pond was 42.6%. When the return period is 2a, the capability of LID measures is still better than that of the retention pond. However, when the return period is greater than or equal to 5a, the curve of scenario 2 and scenario 1 tends to coincide after the peak flow is reached. After the return period is more than 20a, the peak flow of scenario 2 is close to scenario 1. When the return period is 50a, LID measures can reduce 14.6% of total outflow and 1.3% of peak outflow, while the retention pond can reduce 14.0% of the total outflow and 30.0% of peak outflow.
LID measures improve the infiltration rate of stormwater by increasing the permeable area, and retaining and purifying some stormwater through the bio-retention cells and the vegetation swales. Therefore, LID measures can significantly reduce surface runoff and delay the generation time of runoff peak, thus reducing the total outflow and peak outflow, which better reduces the source. However, when the LID measures are close to saturation, its retention capacity to rainfall decreases significantly, so the adjustment ability of LID measures is limited in high-intensity rainfall.
The retention pond is set before the outlet, which is the secondary regulation of rainwater in the site. Its regulating effect results from the comprehensive influence of the cross-section of the pond, the elevation of inlet and outlet, and the pipe diameter of inlet and outlet. Although the retention pond will not affect the runoff, it can reduce the total outflow and the peak outflow steadily, and delay the outflow time and peak outflow time. The retention pond can further postpone the peak outflow time even in high return period scenarios. Setting the retention pond in the parks at the low point of the community can regulate rainwater, enrich the regional landscape, and increase landscape diversity.
3.2. Effect Evaluation of Comprehensive Measures
Since the retention pond cannot affect the runoff, the runoff curves of scenario 4 with both LID measures and retention, and scenario 2 with only LID measures coincide. However, under the combined action of LID measures and retention pond, the regulating ability of scenario 4 to outflow is further improved. Specifically, compared with scenario 2 and scenario 3, in scenario 4, the outflow time and peak outflow time are further delayed, and the total outflow and peak outflow are further reduced (Figure 4). When the return period is 1a, 2a, 5a, 10a, 20a, and 50a, the outflow time is delayed by 34 min, 33 min, 33 min, 32 min, 32 min, and 31 min, and the total reduction rate of outflow is 79.1%, 58.7%, 41.0%, 33.4%, 29.2%, and 27.1%, far exceeding the adjustment effect of using LID measures or retention pond. In terms of peak flow, with the increase of return period, scenario 4 postpones peak outflow time by 23 min, 17 min, 15 min, 15 min, 17 min, and 20 min, with the reduction rates of 87.6%, 71.2%, 52.9%, 44.1%, and 33.9%, respectively (Table 4). It can be seen that scenario 4 with LID measures and retention pond can reduce the peak value of outflow under different return periods. In terms of time adjustment of outflow peak, due to the combined effect of LID measures and retention pond, the delay of peak outflow time will decrease first and then rise later with the increase of return period. Even in the higher return periods, the peak time occurs later, so the comprehensive measures used in scenario 4 can better reduce the peak outflow and further postpone the peak outflow time, and relieve the overall pressure of the urban pipeline network. Compared with the single measures, the combined LID measures and the retention pond have a better impact on runoff and outflow.
4. Conclusions
Since the city is a complex system, the construction and implementation of Sponge City needs to comprehensively consider the effects of the drainage system, the road system, the green space system, the urban geomorphic features, and the water network in the city, etc. More precise and site-specific guidelines are necessary for guiding Sponge City construction in China from local scale, i.e., a residential area; to mesoscale, i.e., a community; to macroscale, i.e., a city.
So far, there are many studies that take a city [9,25,26,35,36], or a district [24,38,41,45], or a single project, i.e., a residential quarter [27,32], a university [14,37,47], or a road [29] as the research objects. However, most of these studies lack systemic measures since they all take a single scale as their research perspective. Furthermore, in studies of urban communities or some local areas, a single block is mostly generalized as a sub-catchment area, and its parameters are set according to their land-use type, which is difficult to meet the diversified needs of Sponge City construction in different regions. For example, in these studies, residential land is often given the same parameter setting; however, the actual runoff and the flow discharging into the drainage network in each residential land are different, determined by the floor area ratio and the greening rate. These neglected differences will have a significant impact on the simulation results. This study has fully considered the characteristics of each block and refined the sub-catchments and drainage networks in the block, which can make the research results closer to reality.
Taking the Airport Garden community as our research area, this study discussed the systematic application of the Sponge City facilities on the community scale. After the reconstruction of the community’s current drainage system, the community’s SWMM model is established. It should emphasize that if we completely redesign, our transformation scheme may be unrealistic, but as an adjustment to the current situation, this scheme is more implementable and suitable. Subsequently, the LID measures and a retention pond are applied to the community. The LID measures are applied to each independent residential area and the supporting projects in the community. The retention pond is set before the rainwater outlet of the community to realize further regulation and storage.
The simulation results show that LID measures significantly reduce the source of runoff. However, with the increase of the return period, LID measures tend to be saturated, and the effect of flow regulation decreases significantly. It is difficult to relieve the pressure of the urban drainage network in the high return period. This result is consistent with previous studies [28,32,35,48,49]. Although the retention pond cannot regulate runoff, it can regulate the rainwater to reduce the total outflow and the peak outflow, delay the time of peak outflow, and relieve the overall pressure of the city pipeline network. Although the infiltration function of the retention pond is not considered due to software limitations, this has a weak impact on this study due to the limitation of collapsible loess. However, combining the two can exert their respective advantages and make the community rainwater drainage system more stable and efficient, thus achieving the expected effect of Sponge City construction. Therefore, the research results are of reference value to Sponge City construction in Northern China.
Author Contributions
Funding acquisition, S.Z.; project administration, T.G.; writing—original draft, Y.J.; writing—review and editing, L.Q. All authors have read and agreed to the published version of the manuscript.
Funding
This research was funded by 245 Qinling National Forest Ecosystem Research Station in 2021 financed by the Ministry of Education of China and Ministry of Education of China, grant number 19XJCAH001. The APC was funded by 245 Qinling National Forest Ecosystem Research Station in 2021 financed by the Ministry of Ed-ucation of China.
Institutional Review Board Statement
Not applicable.
Informed Consent Statement
Not applicable.
Data Availability Statement
Data sharing not applicable.
Conflicts of Interest
The authors declare no conflict of interest.
Abbreviations
| BMPs | best management practices |
| CAD | Computer Aided Design |
| EPA | U.S. Environmental Protection Agency |
| G.I. | green infrastructure |
| HEC-HMS | Hydrologic Modeling System |
| LID | low-impact development |
| SuDS | sustainable urban drainage systems |
| SWMM | stormwater management model |
| WHG | German Federal Water Act |
| WSUD | water sensitive urban design |
References
- Carlson, C.; Barreteau, O.; Kirshen, P.; Foltz, K. Survey to understand perspectives of low-Impact development for urban storm water management practices under climate change. J. Water Resour. Plan. Manag. 2015, 141, 4014080. [Google Scholar] [CrossRef] [Green Version]
- Che, S.Q.; Xie, C.K.; Chen, D.; Yu, B.Q. Development and constructive approaches for theories and technologies of Sponge City system. Chin. Landsc. Archit. 2015, 31, 11–15. [Google Scholar]
- Melville-Shreeve, P.; Cotterill, S.; Grant, L.; Arahuetes, A.; Stovin, V.; Farmani, R.; Butler, D. State of SuDS delivery in the United Kingdom. Water Environ. J. 2018, 32, 9–16. [Google Scholar] [CrossRef]
- Lloyd, S.D.; Wong, T.H.F.; Chesterfield, C.J. Water Sensitive Urban Design—A Stormwater Management Perspective; Cooperative Research Centre for Catchment Hydrology Centre Office: Melbourne, Australia, 2002. [Google Scholar]
- Benedict, M.A.; McMahon, E.T. Green Infrastructure: Linking Landscapes and Communities; Island Press: Washington, DC, USA, 2006. [Google Scholar]
- Walsh, C.J.; Booth, D.B.; Burns, M.J.; Fletcher, T.D.; Hale, R.L.; Hoang, L.N.; Livingston, G.; Rippy, M.A.; Roy, A.H.; Scoggins, M.; et al. Principles for urban stormwater management to protect stream ecosystems. Freshw. Sci. 2016, 35, 398–411. [Google Scholar] [CrossRef] [Green Version]
- Chang, N.B.; Lu, J.W.; Chui, T.F.M.; Hartshorn, N. Global policy analysis of low impact development for stormwater management in urban regions. Land Use Policy 2018, 70, 368–383. [Google Scholar] [CrossRef]
- Che, W.; Zhao, Y.; Li, J.Q.; Wang, W.L.; Wang, J.L.; Wang, S.S.; Gong, Y.W. Explanation of Sponge City development technical guide: Basic concepts and comprehensive goals. China Water Wastewater 2015, 31, 1–5. [Google Scholar]
- Liu, Y.J.; Zhou, Y.; Yu, J.N.; Li, P.C.; Yang, L.Q. Green space optimization strategy to prevent urban flood risk in the city centre of Wuhan. Water 2021, 13, 1517. [Google Scholar] [CrossRef]
- Crispino, G.; Contestabile, P.; Vicinanza, D.; Gisonni, C. Energy head dissipation and flow pressures in vortex drop shafts. Water 2021, 13, 165. [Google Scholar] [CrossRef]
- Che, W.; Yan, P.; Zhao, Y.; Tian, F. Development and analysis of international updated stormwater management systems. China Water Wastewater 2014, 30, 45–51. [Google Scholar]
- Jia, H.F.; Wang, Z.; Zhen, X.Y.; Clar, M.; Yu, S.L. China’s sponge city construction: A discussion on technical approaches. Front. Environ. Sci. Eng. 2017, 11, 18. [Google Scholar] [CrossRef]
- Yu, K.J.; LI, D.H.; Yuan, H.; Fu, W.; Qiao, Q.; Wang, S.S. “Sponge City”: Theory and practice. City Plan. Rev. 2015, 39, 26–36. [Google Scholar]
- Peng, G.Q. Modelling and Simulation of a Heterogeneous Feature-Based Integrated Hydraulic Model for the Processes of Urban Flooding. Doctoral Dissertation, Nanjing Normal Universtiy, Nanjing, China, 2019. [Google Scholar]
- Gong, Y.X.; Cheng, S.S.; Ji, X. Sponge city construction in Xuzhou City from the perspective of ecological security pattern. J. Fujian Norm. Univ. Nat. Sci. Ed. 2020, 36, 79–89. [Google Scholar]
- Yue, B.; Zhuo, X.; Gao, H.G. Summary and outlook of sponge city planning, Sichuan. Planners 2017, 33, 77–84. [Google Scholar]
- Ke, Q.; Wang, L.S.; Tao, T. Resilience assessment of urban rainwater drainage systems. China Water Wastewater 2016, 32, 6–11. [Google Scholar]
- Chen, X.F. Based on biological diversity to explore the design method of sponge urban landscape. Ecol. Econ. 2015, 31, 194–199. [Google Scholar]
- Liang, H.H.; Chen, S.; Zhao, B.; Zhong, Y.T.; Ma, W.J.; Li, Y. A comparative study on inundation tolerance of 7 shrub seedlings under waterlogging stress. J. Northwest For. Univ. 2020, 35, 61–67. [Google Scholar]
- Li, J.Q.; Ren, Y.Z.; Nie, A.H.; Li, X.N.; Gong, Y.W. Sponge city: Cross-disciplinary planning. Planners 2016, 32, 5–9. [Google Scholar]
- Zhai, B.H. Ecological thinking from “Urban Waterlogging” to “Sponge City”. Acta Ecol. Sin. 2016, 36, 4949–4951. [Google Scholar]
- Chan, F.K.S.; Griffiths, J.A.; Higgitt, D.; Xu, S.Y.; Zhu, F.F.; Tang, Y.T.; Xu, Y.Y.; Thorne, C.R. “Sponge City” in China—A breakthrough of planning and flood risk management in the urban context. Land Use Policy 2018, 76, 772–778. [Google Scholar] [CrossRef]
- Zoppou, C. Review of urban storm water models. Environ. Model. Softw. 2001, 16, 195–231. [Google Scholar] [CrossRef]
- Kim, H.; Jung, M.; Mallari, K.J.B.; Pak, G.; Kim, S.; Kim, S.; Kim, L.; Yoon, J. Assessment of porous pavement effectiveness on runoff reduction under climate change scenarios. Desalin. Water Treat. 2015, 53, 3142–3147. [Google Scholar] [CrossRef]
- Babaei, S.; Ghazavi, R.; Erfanian, M. Urban flood simulation and prioritization of critical urban sub-catchments using SWMM model and PROMETHEE II approach. Phys. Chem. Earth 2018, 105, 3–11. [Google Scholar] [CrossRef]
- Zhang, J. Research of Rainstorm Water Logging of Zhengzhou City Based on GIS and SWMM. Master’s Thesis, Zhengzhou University, Zhengzhou, China, 2012. [Google Scholar]
- Zhang, Q.; Su, B.L.; Yuan, J.Y. Simulating rainfall—Runoff in urban residential area based on SWMM. J. Beijing Norm. Univ. Sci. 2012, 48, 276–281. [Google Scholar]
- Hu, A.B.; Ren, X.X.; Pei, G.Z. Simulation of stormwater control effect of LID municipal road based on SWMM. China Water Wastewater 2015, 31, 130–133. [Google Scholar]
- Kou, D.L.; Peng, T.; Liu, Q.L.; Zhao, J.; Liang, Y.H. Cause analysis and modification of waterlogging point in Xianhu Road of Nanning City based on SWMM. China Water Wastewater 2018, 34, 136–138. [Google Scholar]
- Hamouz, V.; Muthanna, T.M. Hydrological modelling of green and grey roofs in cold climate with the SWMM model. J. Environ. Manag. 2019, 249, 109350. [Google Scholar] [CrossRef] [PubMed]
- Xie, J.G.; Wu, C.H.; Li, H.; Chen, G.T. Study on storm-water management of grassed swales and permeable pavement based on SWMM. Water 2017, 9, 840. [Google Scholar] [CrossRef] [Green Version]
- Liu, X.Y.; Jiang, Y.; Ding, X.H.; Zhang, S.X. Evaluation and optimization of low impact development in residential district. J. Northwest For. Univ. 2021, 36, 266–274. [Google Scholar]
- Liu, J.; Zhou, H.; Lu, C.H.; Gao, C. A review on recent advances of urban rainfall intensity-duration-frequency relationships. Adv. Water Sci. 2018, 29, 898–910. [Google Scholar]
- Ma, Y.; Ji, G.Q.; Shi, Z.H.; Ma, X. Reconstruction of rainwater system for low impact development of Qinhuang Avenue in Fengxi new town, Xixian New Area. Water Wastewater Eng. 2017, 53, 59–67. [Google Scholar]
- Ji, B.X. Xi’an Urban Rainwater Catchments Area Division and the Research of Runoff Characteristice Based on Swmm Model. Master’s Thesis, Xi’an University of Technology, Xi’an, China, 2017. [Google Scholar]
- Ma, L.J. Simulation of Hydrologic Effect of Low Impact Development of Fengxi New City in Xixian New Area Based on SWMM. Master’s Thesis, Northwest University, Xi’an, China, 2016. [Google Scholar]
- Zhang, T.Y. Research on the Application of Low Impact Development Facilities in Colleges Campus—The Case Analysis of Sponge Campus Construction in Xianyang Vocational Technical College. Master’s Thesis, Xi’an University of Architecture and Technology, Xi’an, China, 2018. [Google Scholar]
- Li, Y.J. Research on Pollution Control of Combined System Overflow in Old Urban Area of Xi’an Based on SWMM. Master’s Thesis, Xi’an University of Technology, Xi’an, China, 2020. [Google Scholar]
- Wang, S.R. Simulation of Rainfall Runoff Based on SWMM and Analysis of LID Combination Scheme. Master’s Thesis, Xi’an University of Technology, Xi’an, China, 2020. [Google Scholar]
- Qu, C. Study on Rainwater Infiltration Efficiency and SWMM Model Simulation of Sunken Green Space and Permeable Pavement—A Case Study of Chang’an Campus in Northwest University. Master’s Thesis, Northwest University, Xi’an, China, 2017. [Google Scholar]
- Hao, M.Q. Research on the Prevention Technology of Urban Waterlogging. Master’s Thesis, Xi’an Technological University, Xi’an, China, 2017. [Google Scholar]
- Han, H. Urban Rainstorm Waterlogging Simulation Research Based on Scenario Analysis. Master’s Thesis, Xi’an University of Technology, Xi’an, China, 2017. [Google Scholar]
- Xia, Z.J. Study on Rainwater Pipe Network with SWMM Model and Sponge City Concept. Master’s Thesis, Chang’an University, Xi’an, China, 2017. [Google Scholar]
- Deng, C.N. Simulation of Environmental Hydrological Effects of Urban LID in Different Spatial Scales. Master’s Thesis, Xi’an University of Technology, Xi’an, China, 2018. [Google Scholar]
- Su, H.L. Urban Rain Flood Simulation Research Based on SWMM Model—A Case Study of Xiaozhai District in Xi’an. Master’s Thesis, Xi’an University of Technology, Xi’an, China, 2018. [Google Scholar]
- Liu, L. Research on Response of LID Runoff Regulation to Rain Type. Master’s Thesis, Xi’an University of Technology, Xi’an, China, 2018. [Google Scholar]
- Li, J. Study on the Construction of Sponge City Based on SWMM in Collapsible Loess Area—An Example of a Campus in Xixian New Area. Master’s Thesis, Chang’an University, Xi’an, China, 2018. [Google Scholar]
- Bai, Y.; Zhao, N.; Zhang, R.; Zeng, X. Storm water management of low impact development in urban areas based on SWMM. Water 2018, 11, 33. [Google Scholar] [CrossRef] [Green Version]
- Zhang, Q.; Chen, S.; Cai, S.; Liu, C. Simulation of LID measures combined with stormwater detention tank. China Water Wastewater 2018, 34, 134–138. [Google Scholar]
Figure 1.
The situation in the study area: (a) Overview of the study area (base map from Google Earth); (b) The drainage system before the adjustment; (c) The drainage system after the adjustment; (d) The drainage system including a retention pond.
Figure 1.
The situation in the study area: (a) Overview of the study area (base map from Google Earth); (b) The drainage system before the adjustment; (c) The drainage system after the adjustment; (d) The drainage system including a retention pond.

Figure 2.
Drainage path in the blocks under different scenarios: (a) The drainage path without LID measures; (b) The drainage path with LID measures.
Figure 2.
Drainage path in the blocks under different scenarios: (a) The drainage path without LID measures; (b) The drainage path with LID measures.

Figure 3.
Runoff control effect under different return periods: (a) When return period is 1a; (b) When return period is 2a; (c) When return period is 5a; (d) When return period is 10a; (e) When return period is 20a; (f) When return period is 50a.
Figure 3.
Runoff control effect under different return periods: (a) When return period is 1a; (b) When return period is 2a; (c) When return period is 5a; (d) When return period is 10a; (e) When return period is 20a; (f) When return period is 50a.

Figure 4.
Outflow control effect under different return periods: (a) When return period is 1a; (b) When return period is 2a; (c) When return period is 5a; (d) When return period is 10a; (e) When return period is 20a; (f) When return period is 50a.
Figure 4.
Outflow control effect under different return periods: (a) When return period is 1a; (b) When return period is 2a; (c) When return period is 5a; (d) When return period is 10a; (e) When return period is 20a; (f) When return period is 50a.


Table 1.
The design rainfall for different return periods.
| Return Periods | Rainfall (mm) |
|---|---|
| 1a | 20.75 |
| 2a | 28.03 |
| 5a | 37.65 |
| 10a | 44.93 |
| 20a | 52.21 |
| 50a | 61.84 |
Table 2.
The parameters of Horton method, Mannings N and Depth of Depression Storage.
| Name | Property | Value |
|---|---|---|
| Horton Parameters | Max. Infil. Rate | 76.2 |
| Min. Infil. Rate | 3.81 | |
| Decay Constant | 2 | |
| Drying Time | 7 | |
| Max. Volume | 0 | |
| Mannings N * | Mannings N for the impervious area | 0.015 |
| Mannings N for the pervious area | 0.21 | |
| Depth of Depression Storage * | Depth of depression storage on the impervious area (mm) | 2.3 |
| Depth of depression storage on the pervious area (mm) | 3.81 |
* The values of Mannings N and Depth of Depression Storage are determined according to former studies with cases in Xi’an and Xianyang [35,36,37,38,39,40,41,42,43,44,45,46,47]. Mannings N for the impervious area, Mannings N for the pervious area, and Depth of Depression Storage on the impervious area are the average value of these studies [35,36,37,38,39,40,41,42,43,44,45,46,47], since these three parameters are inconsistent. Depth of Depression Storage in the pervious area is also based on former studies [44,46].
Table 3.
Parameters of LID measures.
| Layer | Parameter | Bio-Retention Cell in Residential Areas | Bio-Retention Cell on Roads | Permeable Pavement | Vegetative Swale |
|---|---|---|---|---|---|
| Surface | Berm height (mm) | 200 | 300 | 0 | 300 |
| Vegetation volume fraction | 0.2 | 0.2 | 0 | 0.2 | |
| Surface roughness | 0.15 | 0.15 | 0.013 | 0.15 | |
| Surface slope (%) | 1 | 1 | 1 | 1 | |
| Swale side slope | 50 | ||||
| Pavement | Thickness (mm) | 100 | |||
| Void ratio (voids/solids) | 0.15 | ||||
| Impervious surface fraction | 0 | ||||
| Permeability (mm/h) | 360 | ||||
| Clogging factor | 187.5 | ||||
| Soil | Thickness (mm) | 500 | 600 | ||
| Porosity | 0.43 | 0.43 | |||
| Field capacity | 0.321 | 0.321 | |||
| Wilting point | 0.221 | 0.221 | |||
| Conductivity (mm/h) | 100 | 100 | |||
| Conductivity slope | 10 | 10 | |||
| Suction head (mm) | 90 | 90 | |||
| Storage | Thickness (mm) | 300 | 450 | 400 | |
| Void ratio (voids/solids) | 0.75 | 0.75 | 0.75 | ||
| Seepage rate (mm/h) | 250 | 300 | 400 | ||
| Clogging factor | 0 | 0 | |||
| Drain | Flow coefficient (mm/h, use 0 if there is no drain) | 0 | 20 | 0 | |
| Flow exponent | 0.5 | ||||
| Offset (mm) | 0 |
Table 4.
The simulation of outfall in different scenarios.
| Return Period | Simulated Scenario | Hour of Outflow Generation | Peak Outflow (CMS) | Hour of Max. Outflow | Total Outflow Volume (106 L) |
|---|---|---|---|---|---|
| 1a | scenario 1 | 0:24:00 | 3.544 | 0:52:00 | 6.101 |
| scenario 2 | 0:44:00 | 1.053 | 0:59:00 | 2.326 | |
| scenario 3 | 0:48:00 | 2.036 | 1:00:00 | 4.89 | |
| scenario 4 | 0:59:00 | 0.44 | 1:15:00 | 1.276 | |
| 2a | scenario 1 | 0:21:00 | 4.63 | 0:50:00 | 8.493 |
| scenario 2 | 0:41:00 | 2.3 | 0:57:00 | 4.727 | |
| scenario 3 | 0:45:00 | 2.882 | 0:59:00 | 7.045 | |
| scenario 4 | 0:54:00 | 1.334 | 1:07:00 | 3.508 | |
| 5a | scenario 1 | 0:18:00 | 5.5 | 0:49:00 | 11.465 |
| scenario 2 | 0:38:00 | 4.036 | 0:56:00 | 8.186 | |
| scenario 3 | 0:42:00 | 3.63 | 1:00:00 | 9.703 | |
| scenario 4 | 0:51:00 | 2.591 | 1:04:00 | 6.762 | |
| 10a | scenario 1 | 0:17:00 | 5.844 | 0:49:00 | 13.56 |
| scenario 2 | 0:36:00 | 5.048 | 0:55:00 | 10.774 | |
| scenario 3 | 0:40:00 | 3.935 | 1:01:00 | 11.547 | |
| scenario 4 | 0:49:00 | 3.264 | 1:04:00 | 9.031 | |
| 20a | scenario 1 | 0:16:00 | 5.966 | 0:48:00 | 15.568 |
| scenario 2 | 0:34:00 | 5.693 | 0:54:00 | 13.034 | |
| scenario 3 | 0:38:00 | 4.115 | 1:02:00 | 13.328 | |
| scenario 4 | 0:48:00 | 3.741 | 1:05:00 | 11.02 | |
| 50a | scenario 1 | 0:15:00 | 6.089 | 0:46:00 | 18.035 |
| scenario 2 | 0:32:00 | 6.011 | 0:50:00 | 15.405 | |
| scenario 3 | 0:36:00 | 4.26 | 1:04:00 | 15.504 | |
| scenario 4 | 0:46:00 | 4.024 | 1:06:00 | 13.139 |
Publisher’s Note: MDPI stays neutral with regard to jurisdictional claims in published maps and institutional affiliations. |
© 2022 by the authors. Licensee MDPI, Basel, Switzerland. This article is an open access article distributed under the terms and conditions of the Creative Commons Attribution (CC BY) license (https://creativecommons.org/licenses/by/4.0/).
Share and Cite
MDPI and ACS Style
Jiang, Y.; Qiu, L.; Gao, T.; Zhang, S. Systematic Application of Sponge City Facilities at Community Scale Based on SWMM. Water 2022, 14, 591. https://doi.org/10.3390/w14040591
AMA Style
Jiang Y, Qiu L, Gao T, Zhang S. Systematic Application of Sponge City Facilities at Community Scale Based on SWMM. Water. 2022; 14(4):591. https://doi.org/10.3390/w14040591
Chicago/Turabian StyleJiang, Yu, Ling Qiu, Tian Gao, and Shuoxin Zhang. 2022. "Systematic Application of Sponge City Facilities at Community Scale Based on SWMM" Water 14, no. 4: 591. https://doi.org/10.3390/w14040591
Note that from the first issue of 2016, this journal uses article numbers instead of page numbers. See further details here.