
Effect of Different Sowing Methods on Water Use Efficiency and Grain Yield of Wheat in the Loess Plateau, China


1
College of Agriculture, Shanxi Agriculture University, No.1, Minxian South Road, Taiyuan 030006, China
2
State Key Laboratory of Sustainable Dryland Agriculture (In Preparation), Shanxi Agricultural University, Taiyuan 030006, China
*
Author to whom correspondence should be addressed.
Water 2022, 14(4), 577; https://doi.org/10.3390/w14040577
Submission received: 20 December 2021
/
Revised: 2 February 2022
/
Accepted: 3 February 2022
/
Published: 14 February 2022
(This article belongs to the Topic Water Management in the Era of Climatic Change)
Abstract
:Research has revealed that summer fallow sowing improves the water use efficiency (WUE) and grain yield of winter wheat. However, wheat yields differ yearly with crop management. A field experiment over 8 years was established in the Loess Plateau to determine the role of precipitation and soil water storage in wheat yield formation under conservation tillage. The average WUE values were 7.8, 11.0, and 12.6 t·ha−1, while the average evapotranspiration (ET) values were 334.7, 365.5, and 410 mm when the yields were 3.0, 3.0–4.5, and over 4.5 t·ha−1, respectively. Compared to drill sowing (DS), high water consumption during early growth increased the spike number, grain number, and yield. In years of intermediate or low yields, wide-space sowing (WS) and furrow sowing (FS) improved the ET, WUE, spike number, grain number, and yield of wheat compared to (DS) drill sowing. When the wheat yield was 3.0–4.5 t·ha−1, higher soil water intake during jointing, anthesis, and anthesis–maturity increased the tiller number, 1000-grain weight, and yield, related to the use of suitable tillers. Synchronous increases in grain number per spike and 1000-grain weight were observed with increased soil water content at jointing, maturity, and anthesis, as well as consumption of soil water in the latter part during the growing season.
1. Introduction
The Loess Plateau is the dominant region for cereal crop production in China. In this region, wheat (Triticum aestivum L.) covers about 56% of the arable land [1], restricted by the extraordinary variability in precipitation and evaporation during the summer fallow period [2,3]. Agriculture has been exploited in this area to guarantee food security, which has accelerated ecological deterioration, including soil physical structure degradation, water and soil pollution, and reduced crop productivity [4,5,6].
The production of winter wheat in dryland is important for regional food security [7,8]. In the Loess Plateau dryland, irrigation is not available, and rainfall is the only source of water for the production of wheat. Precipitation levels are low and unevenly distributed, whereby summer rainfall accounts for approximately 60% of the annual precipitation [9,10]. Furthermore, annual precipitation fluctuates considerably [11]. Because of the limited water resources, the main planting approach in this area is to plant one crop (winter wheat) per year and leave the land fallow in the summer [12,13].
Many agricultural management plans have been established in the past few years to improve crop production in dryland regions, with one of the most successful methods being conservation tillage, with permanent organic soil cover and mechanical soil disturbance [7]. Conservation tillage approaches include DS (drill sowing), FS (furrow sowing), and WS (wide-space sowing), and they play an active role in increasing crop yield. FS, which usually includes straw mulching, leads to reduced soil degradation and farmland erosion caused by intensive agriculture [14,15]. Previous studies reported the adverse effects of FS on soil properties such as improved soil bulk density and reduced total porosity and penetration resistance. Additionally, “reduced tillage” practices, such as WS, whereby soil is usually chisel-plowed to a depth of 25 cm, or DS, in which case soil is frequently chisel-plowed to a complexity of 20 cm, are used to alleviate soil compaction by breaking hardpans [16,17].
These reduced sowing practices have a positive outcome on rain penetration into the soil and water storage, thus improving the soil water content and increasing the tiller number, wheat grain yield, and plant WUE. The excessive use of nitrogen (N) fertilizers can have several negative effects on the environment [18]. A previous study showed that the use of controlled-release nitrogen fertilizers at sowing increased the crop yield, WUE, and economic returns by 8.5%, 10.9%, and 11.3%, respectively [19]. Another study on N fertilizers in the Loess Plateau reported that the application of an appropriate amount of N fertilizer increased the content of total wheat protein and composition of protein, leading to an improvement in the baking quality of wheat flour [20].
With an increase in the N application rate, the investment in N application should be determined to optimize economic return [21]. Soil fertility in the Loess Plateau dryland is low, especially the N level [22]. The application of N fertilizers can significantly increase the grain yield and WUE of wheat [23]. Wheat yield components include the number of tillers, grain number per spike, and 1000-grain weight. Increased coordination among yield components is required to improve crop yield potential [12,13,14]. However, some studies have shown that the contribution of the various yield components differs with the yield level, and correlation analysis between any single variable and yield does not fully explain the importance of each component [23,24,25].
Furthermore, some studies have shown a significant correlation influenced by field water consumption between wheat yield and soil moisture status over multiple growth stages from sowing to maturity [26,27]. Apparently, the sowing methods applied by farmers in the area exceed the level of sowing required to achieve high yield. The effects of water on yield, as well as the response of yield to sowing, vary with the annual precipitation level. A study on different sowing approaches in the Loess Plateau for eight consecutive years showed that, when 150 kg N·ha−1 was applied, wheat yield in the dry years increased by 14.0% relative to no nitrogen application, whereas it increased by 32.8% in the wet years [18] Therefore, the optimization of sowing methods based on precipitation is important to achieve high wheat yield in dryland while improving grain quality, economic return, and WUE (water use efficiency).
In this study, the main objectives were to determine the correlation between yield and soil water content and water consumption at different yield levels, thereby allowing (1) clarification of the correlation between soil water content at different yield levels and plant growth stages, (2) a comparison of the differences in yield components and WUE, and (3) an evaluation of the relationship between grain yield or yield components and field water consumption during key plant growth stages.
2. Materials and Methods
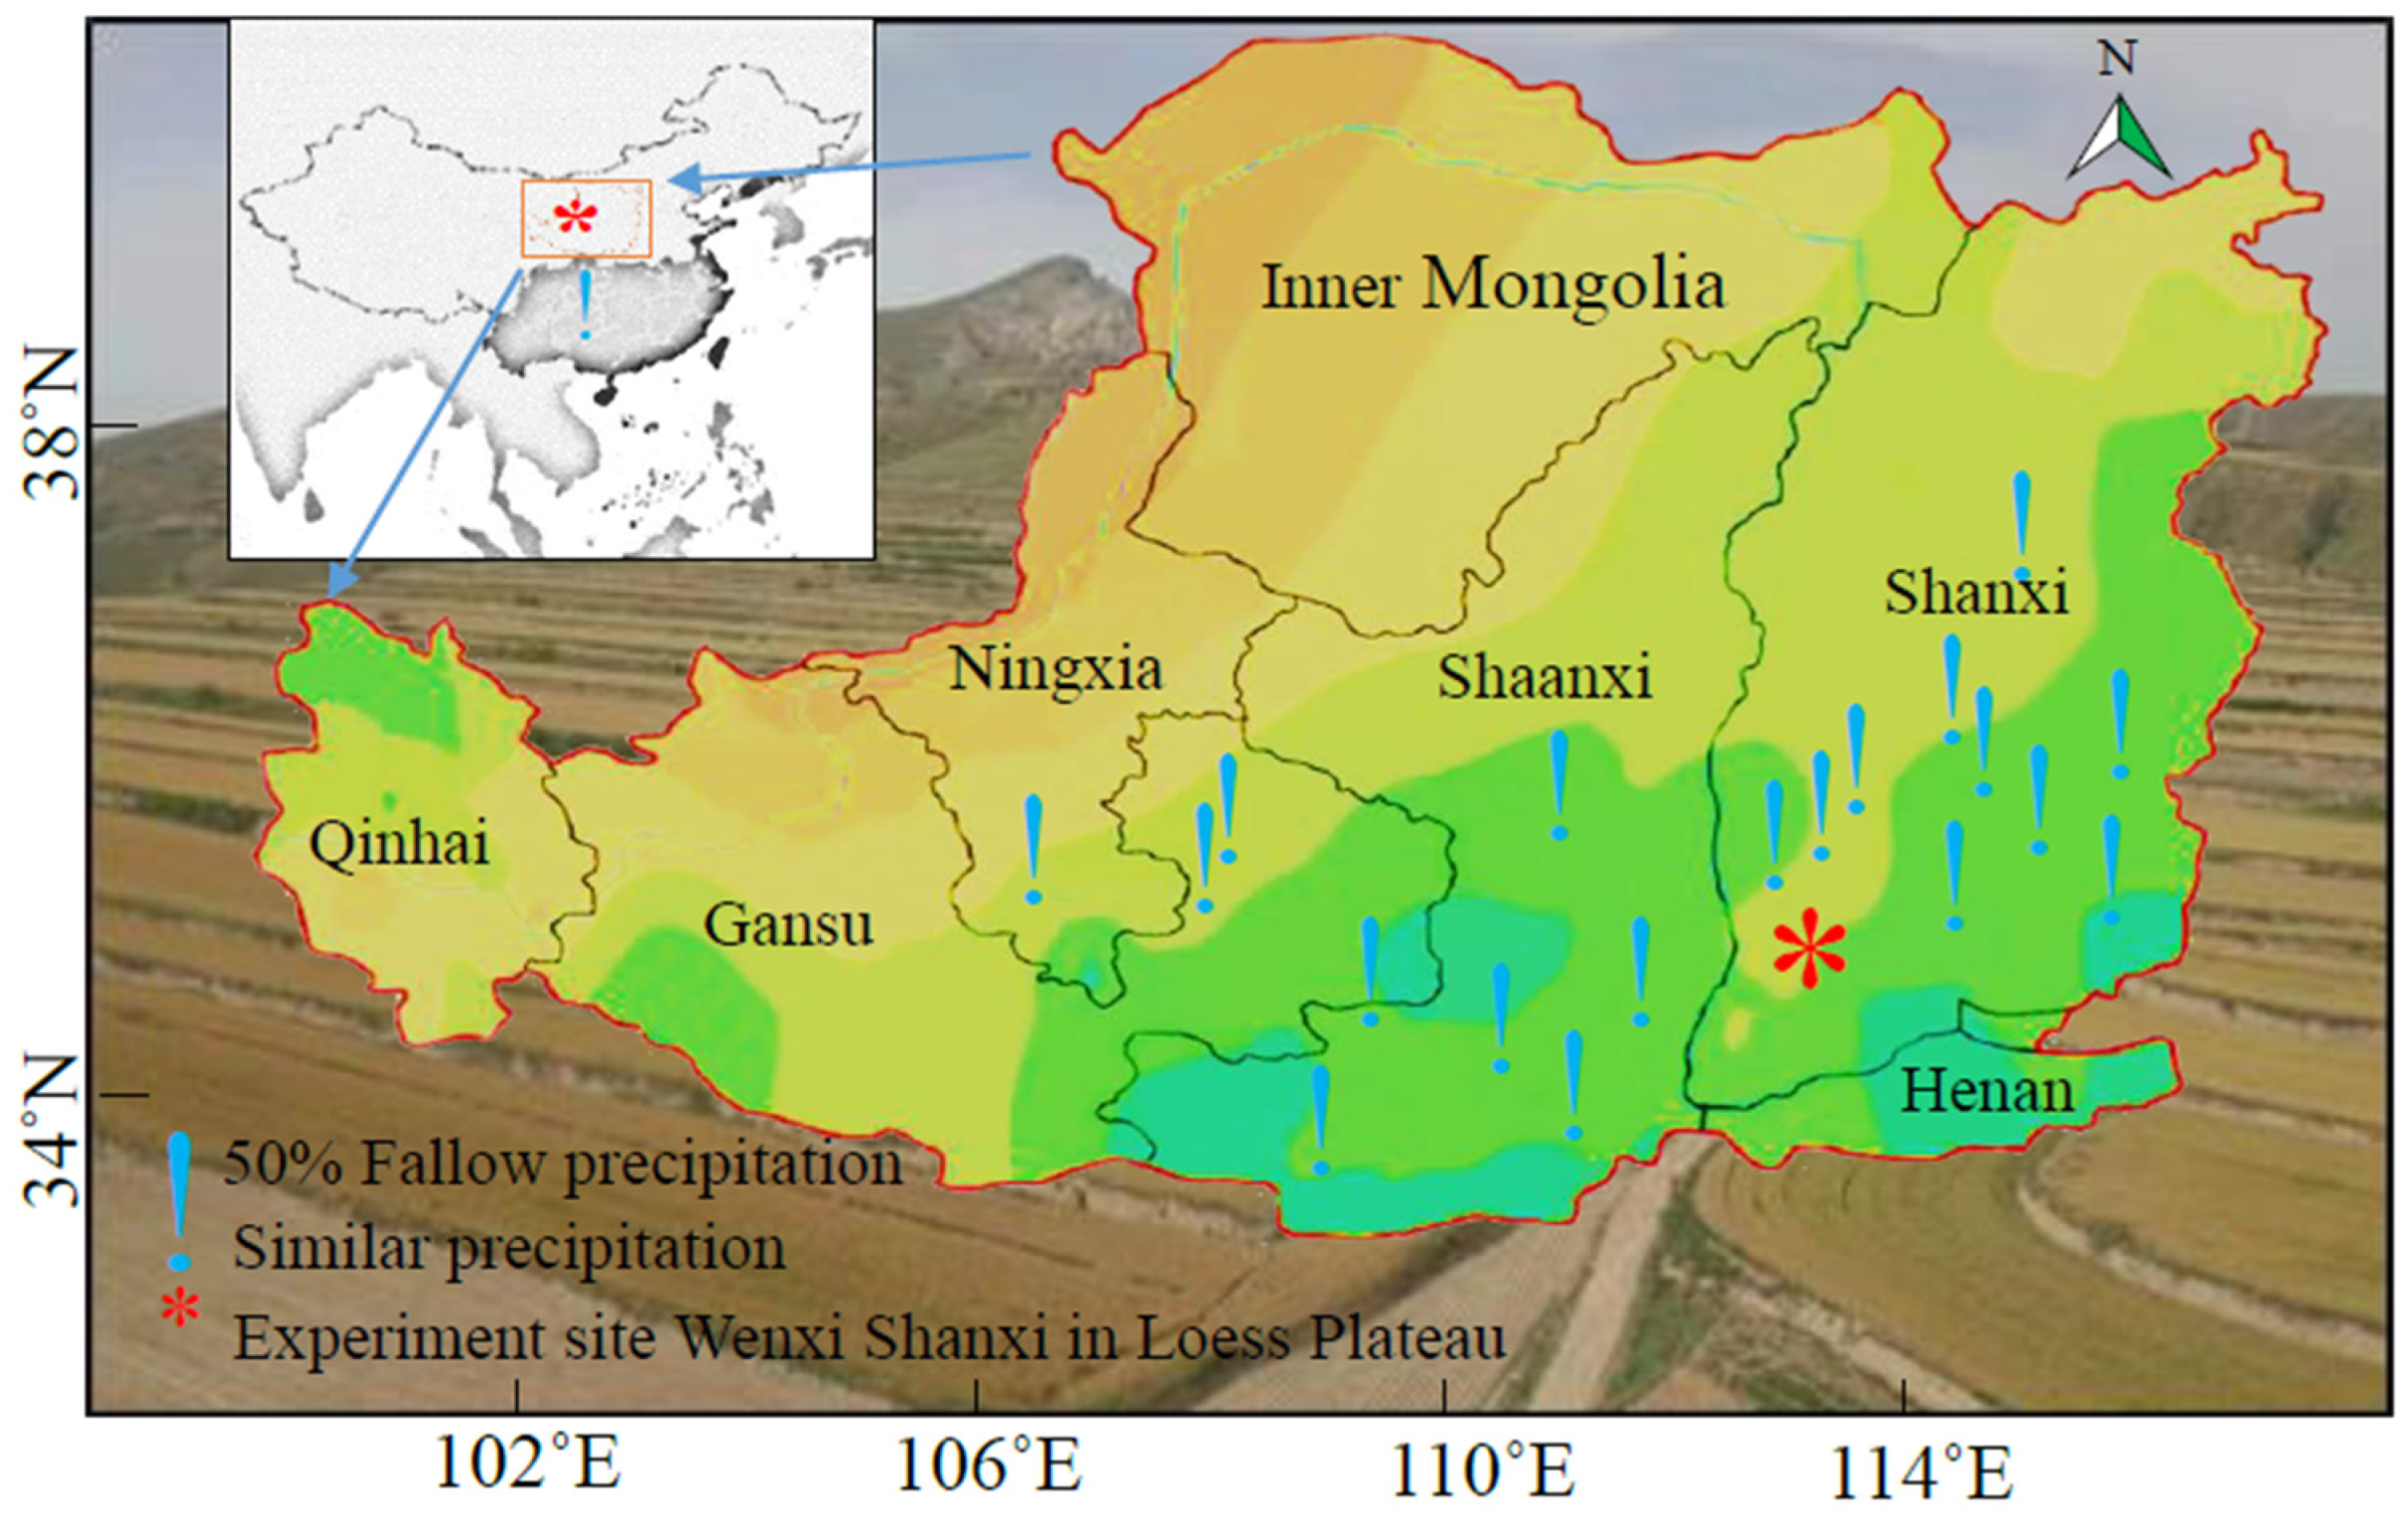
During the winter, field experiments were conducted for the winter wheat growing seasons in the years 2009–2017 at the experimental station of the Shanxi Agricultural Wenxi region, China. The study area was located in the Wenxi region (34°35′ N; 110°15′ E), Shanxi province, in the southeast of the Loess Plateau is shown in Figure 1.
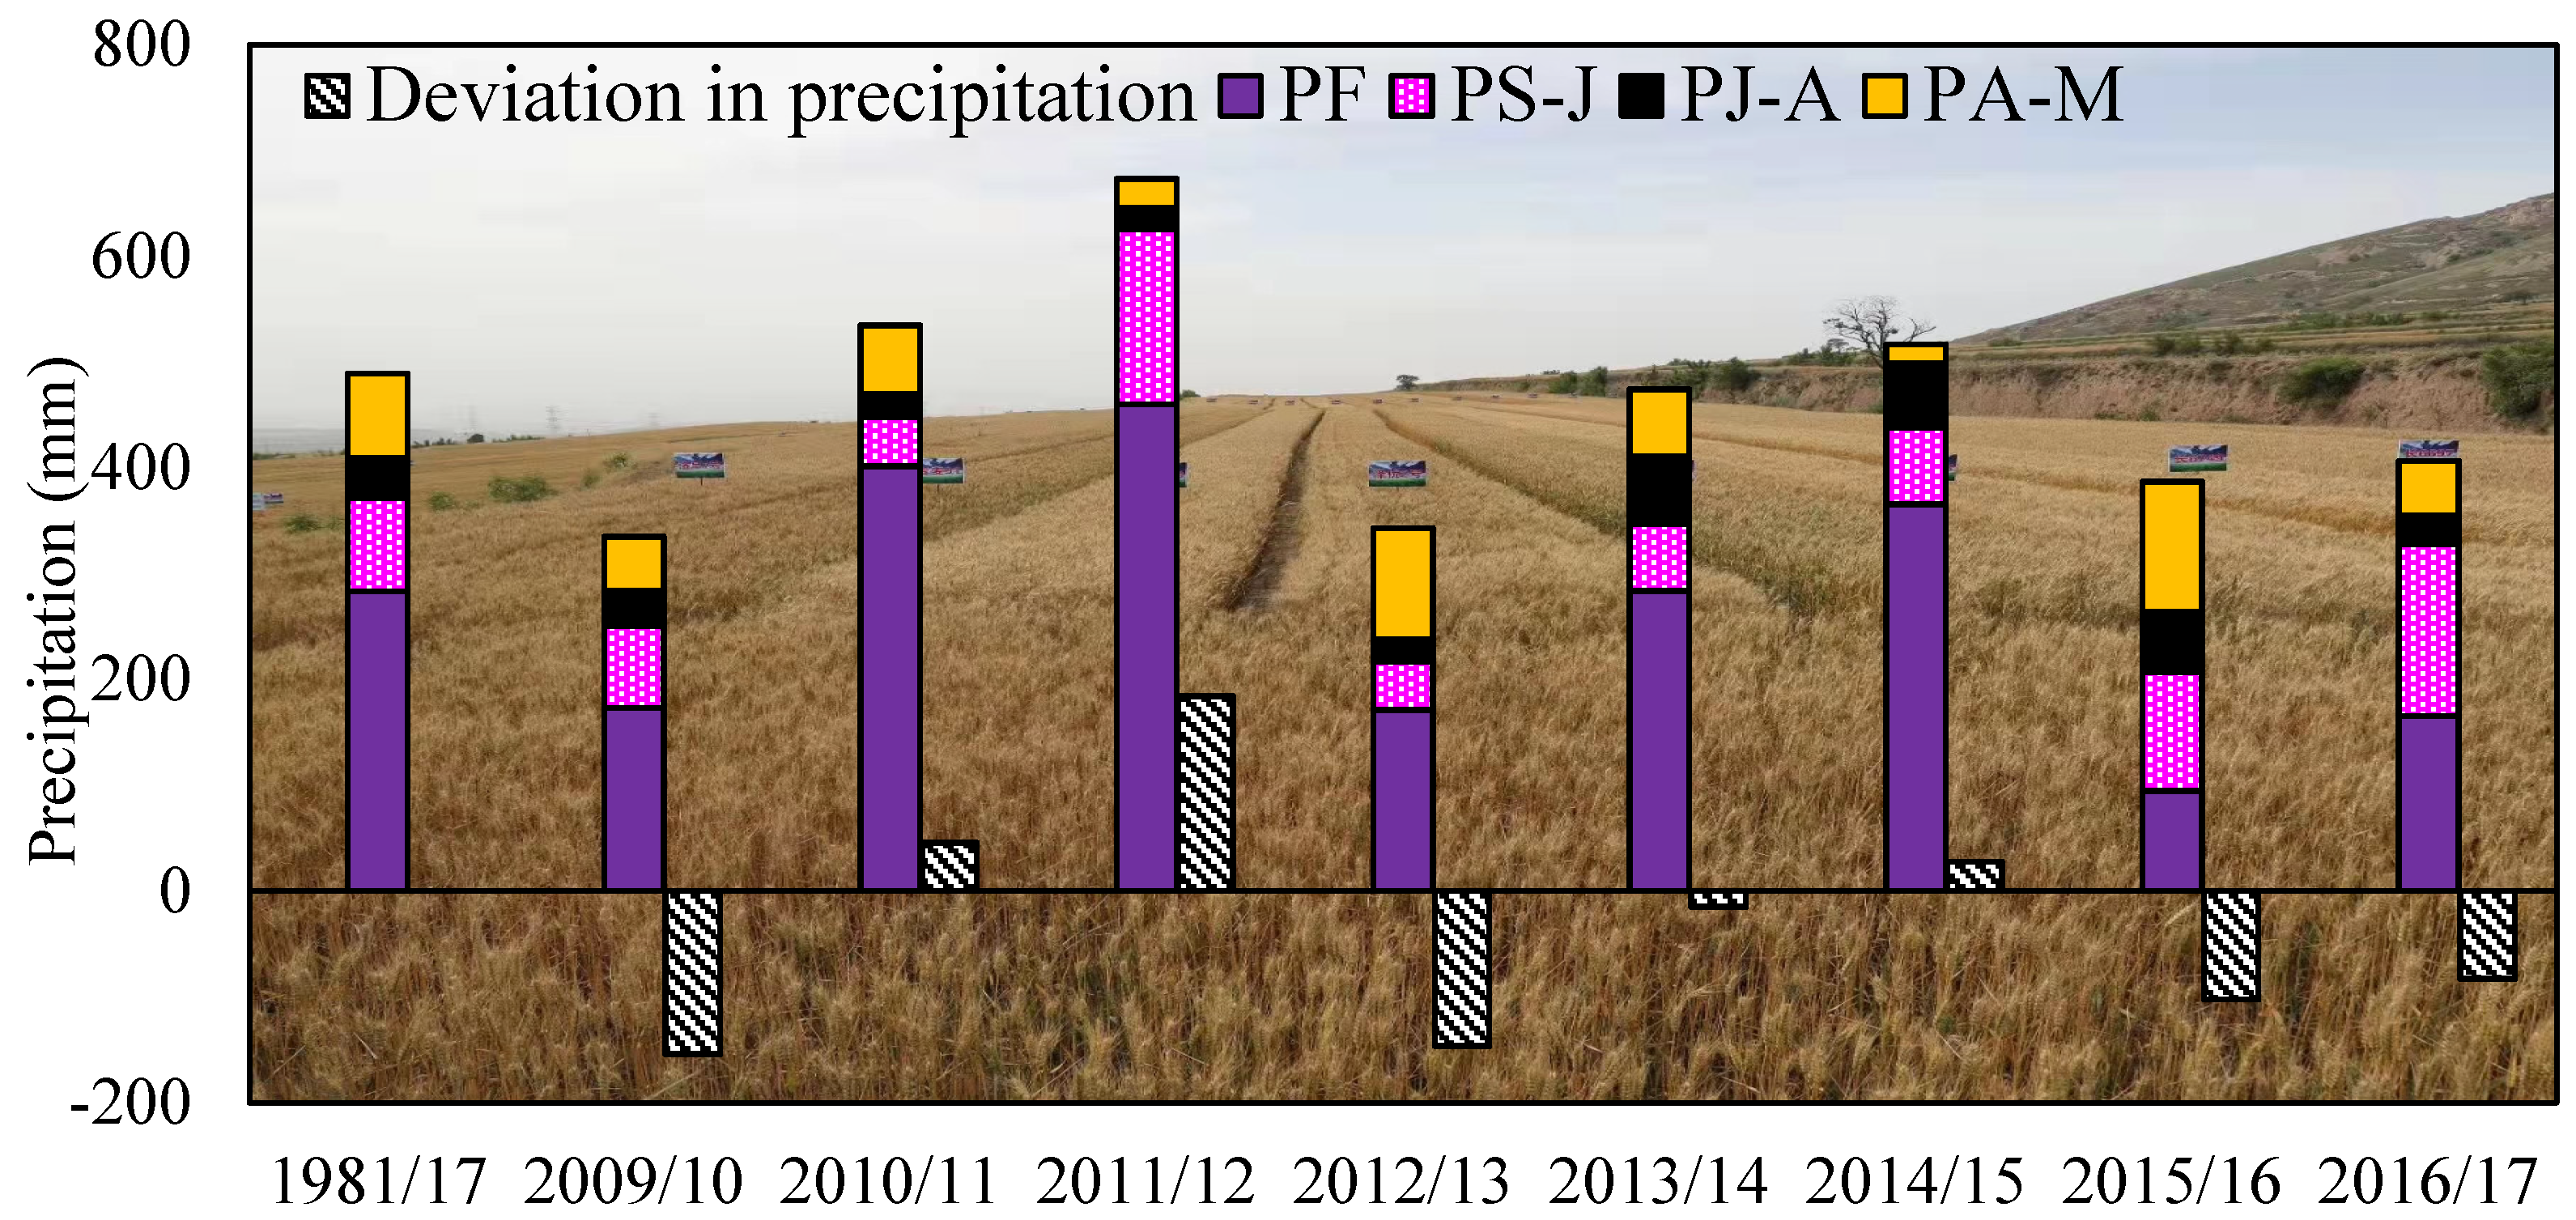
This region is characterized by a distinctive semiarid, warm temperate continental climate with an annual mean precipitation of 491 mm, annual mean temperature of 12.9 °C, annual sunshine period of 2242 h, and open pan evaporation of 1839 mm. Although the annual precipitation tends to be concentrated in the months of July through September, it displays great annual variability. The precipitation distribution over the years 1981–2017 is shown in Figure 2.
2.1. Experimental Design and Field Management
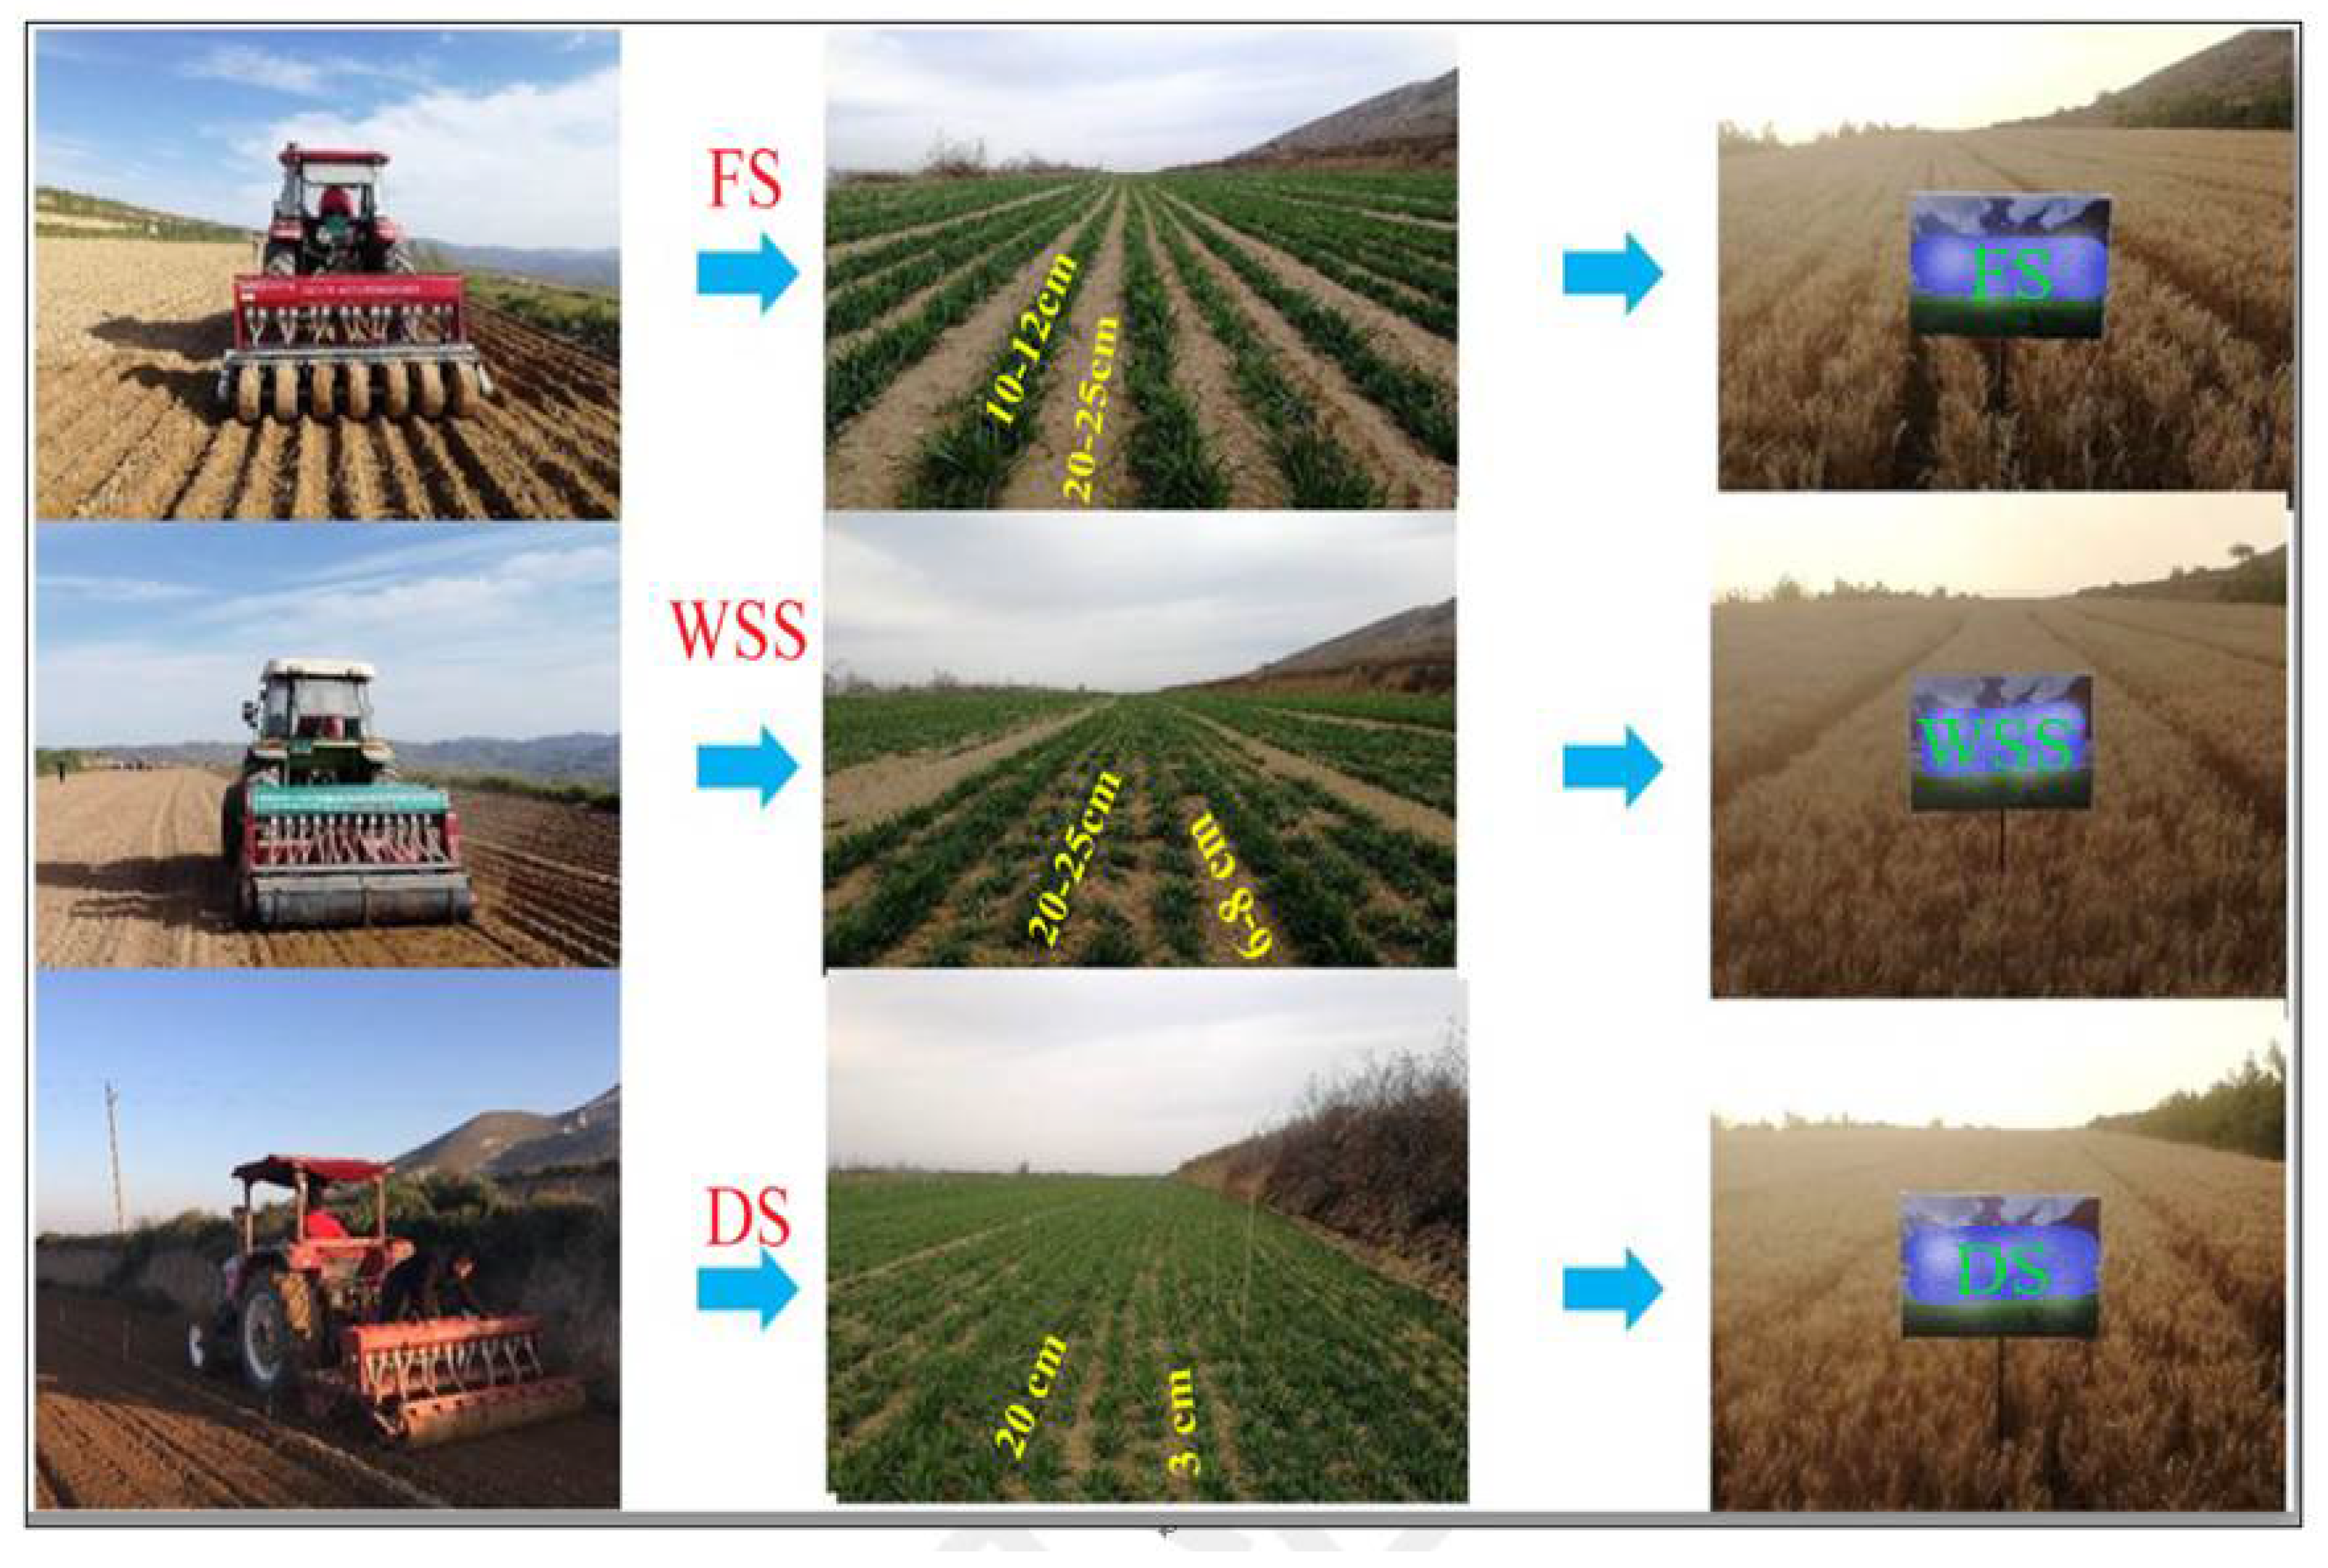
This experiment featured a single-factor randomized block design. Winter wheat (Triticum aestivum L.) cultivar ‘Yunhan 20410′ was acquired from the Shanxi Agriculture Bureau, Wenxi, China. The trial comprised three different sowing methods: (1) wide-space sowing (WS) (sowing spacing and row spacing of 8 and 25 cm, 2BMF-12/6, with auto-fertilization and tillage), (2) furrow sowing (FS) (ridge height 3/4 cm, furrow depth 6/7 cm, narrow and wide spacing 10/12 cm and 20/25 cm, and 2BMFD-17/14 multi-resolution), and (3) drill sowing (sowing spacing and row spacing of 3 cm and 20 cm, 2BXF-12 seed drill) (Figure 3).
Each plot had an area of 300 m2 (6 m × 50 m). Before planting, 150 kg N·ha−1 (urea 46%), P2O5 (38 kg·ha−1), and K2O (75 kg·ha−1) were applied consistently to the soil is shown in Table 1. During each cropping season, the planting density was 315 × 104 plants·ha−1. During each year, all plants were machine-harvested in late June. Throughout the growing season, weeds were manually controlled, and no irrigation was applied at any time during the entire experimental period.
2.2. Measurements
2.2.1. Soil Moisture
Soil water storage (SWS, mm) and soil gravimetric moisture content (GSW%) were measured gravimetrically at each plant growth stage. Soil samples were collected from a depth of 300 cm at 20 cm intervals [28]. One sample was measured as one replicate. GSW and SWS were obtained using Equations (1) and (2), respectively.
where Mw and Md are the weights (g) of dry and wet soil, respectively, pb is the soil bulk density of the given soil layer, and SD is the soil depth.
2.2.2. Evapotranspiration (ET), Precipitation, and Water Use Efficiency (WUE)
Precipitation (mm) and consumption of stored soil water (mm) in the 0–300 cm layer were used to calculate the c WUE, PUE, and evapotranspiration (ET) rate for a given cropping season using Equations (3)–(5).
where SW0 is the soil water storage before sowing, and SW1 is the soil water storage after harvest. P is the precipitation during the wheat growth period, R is the soil surface runoff, D is the deep percolation, and Pt is the total precipitation from tillage to harvest. The experimental field was flat, and the experimental plots were surrounded by ridges to inhibit runoff; in this research, R was estimated to be 0. The ground water table was deeper than 50 m in the study area, and no water was percolated to the deep soil layers; therefore, D was also considered to be 0.
Precipitation (mm) and intake of soil water for storage (mm) in the 0–300 cm layer were used to calculate the crop water consumption during different growth periods. The sum of precipitation (mm) and intake of soil water for storage (mm) in the 0–300 cm layer from sowing to plant maturity was taken as the evapotranspiration (ET) rate for a given cropping season.
2.2.3. Yield and Yield Components
Fifty plants per plot were randomly sampled at maturity from the inner rows to determine yield components including ear number and grain number per ear. Plot grain yield was determined by harvesting all plants in an area of 20 m2 and shelling them mechanically. Then, the grain was air-dried for determination of grain yield.
2.3. Statistical Analysis
The data of winter wheat growth and yield formation were processed and statistically analyzed using SAS-8.6 (SAS Institute Inc., Cary, NC, USA). In this study, two-way ANOVA was used to determine the main soil water storage and types of yield formation. When there was a significant interaction effect between soil water and yield, the least significant difference (LSD) method was used for differential analysis, while the F-test was used to determine independence; the significance level was set to α = 0.05. Differences were considered statistically significant when p ≤ 0.05.
3. Results
3.1. Soil Water Storage
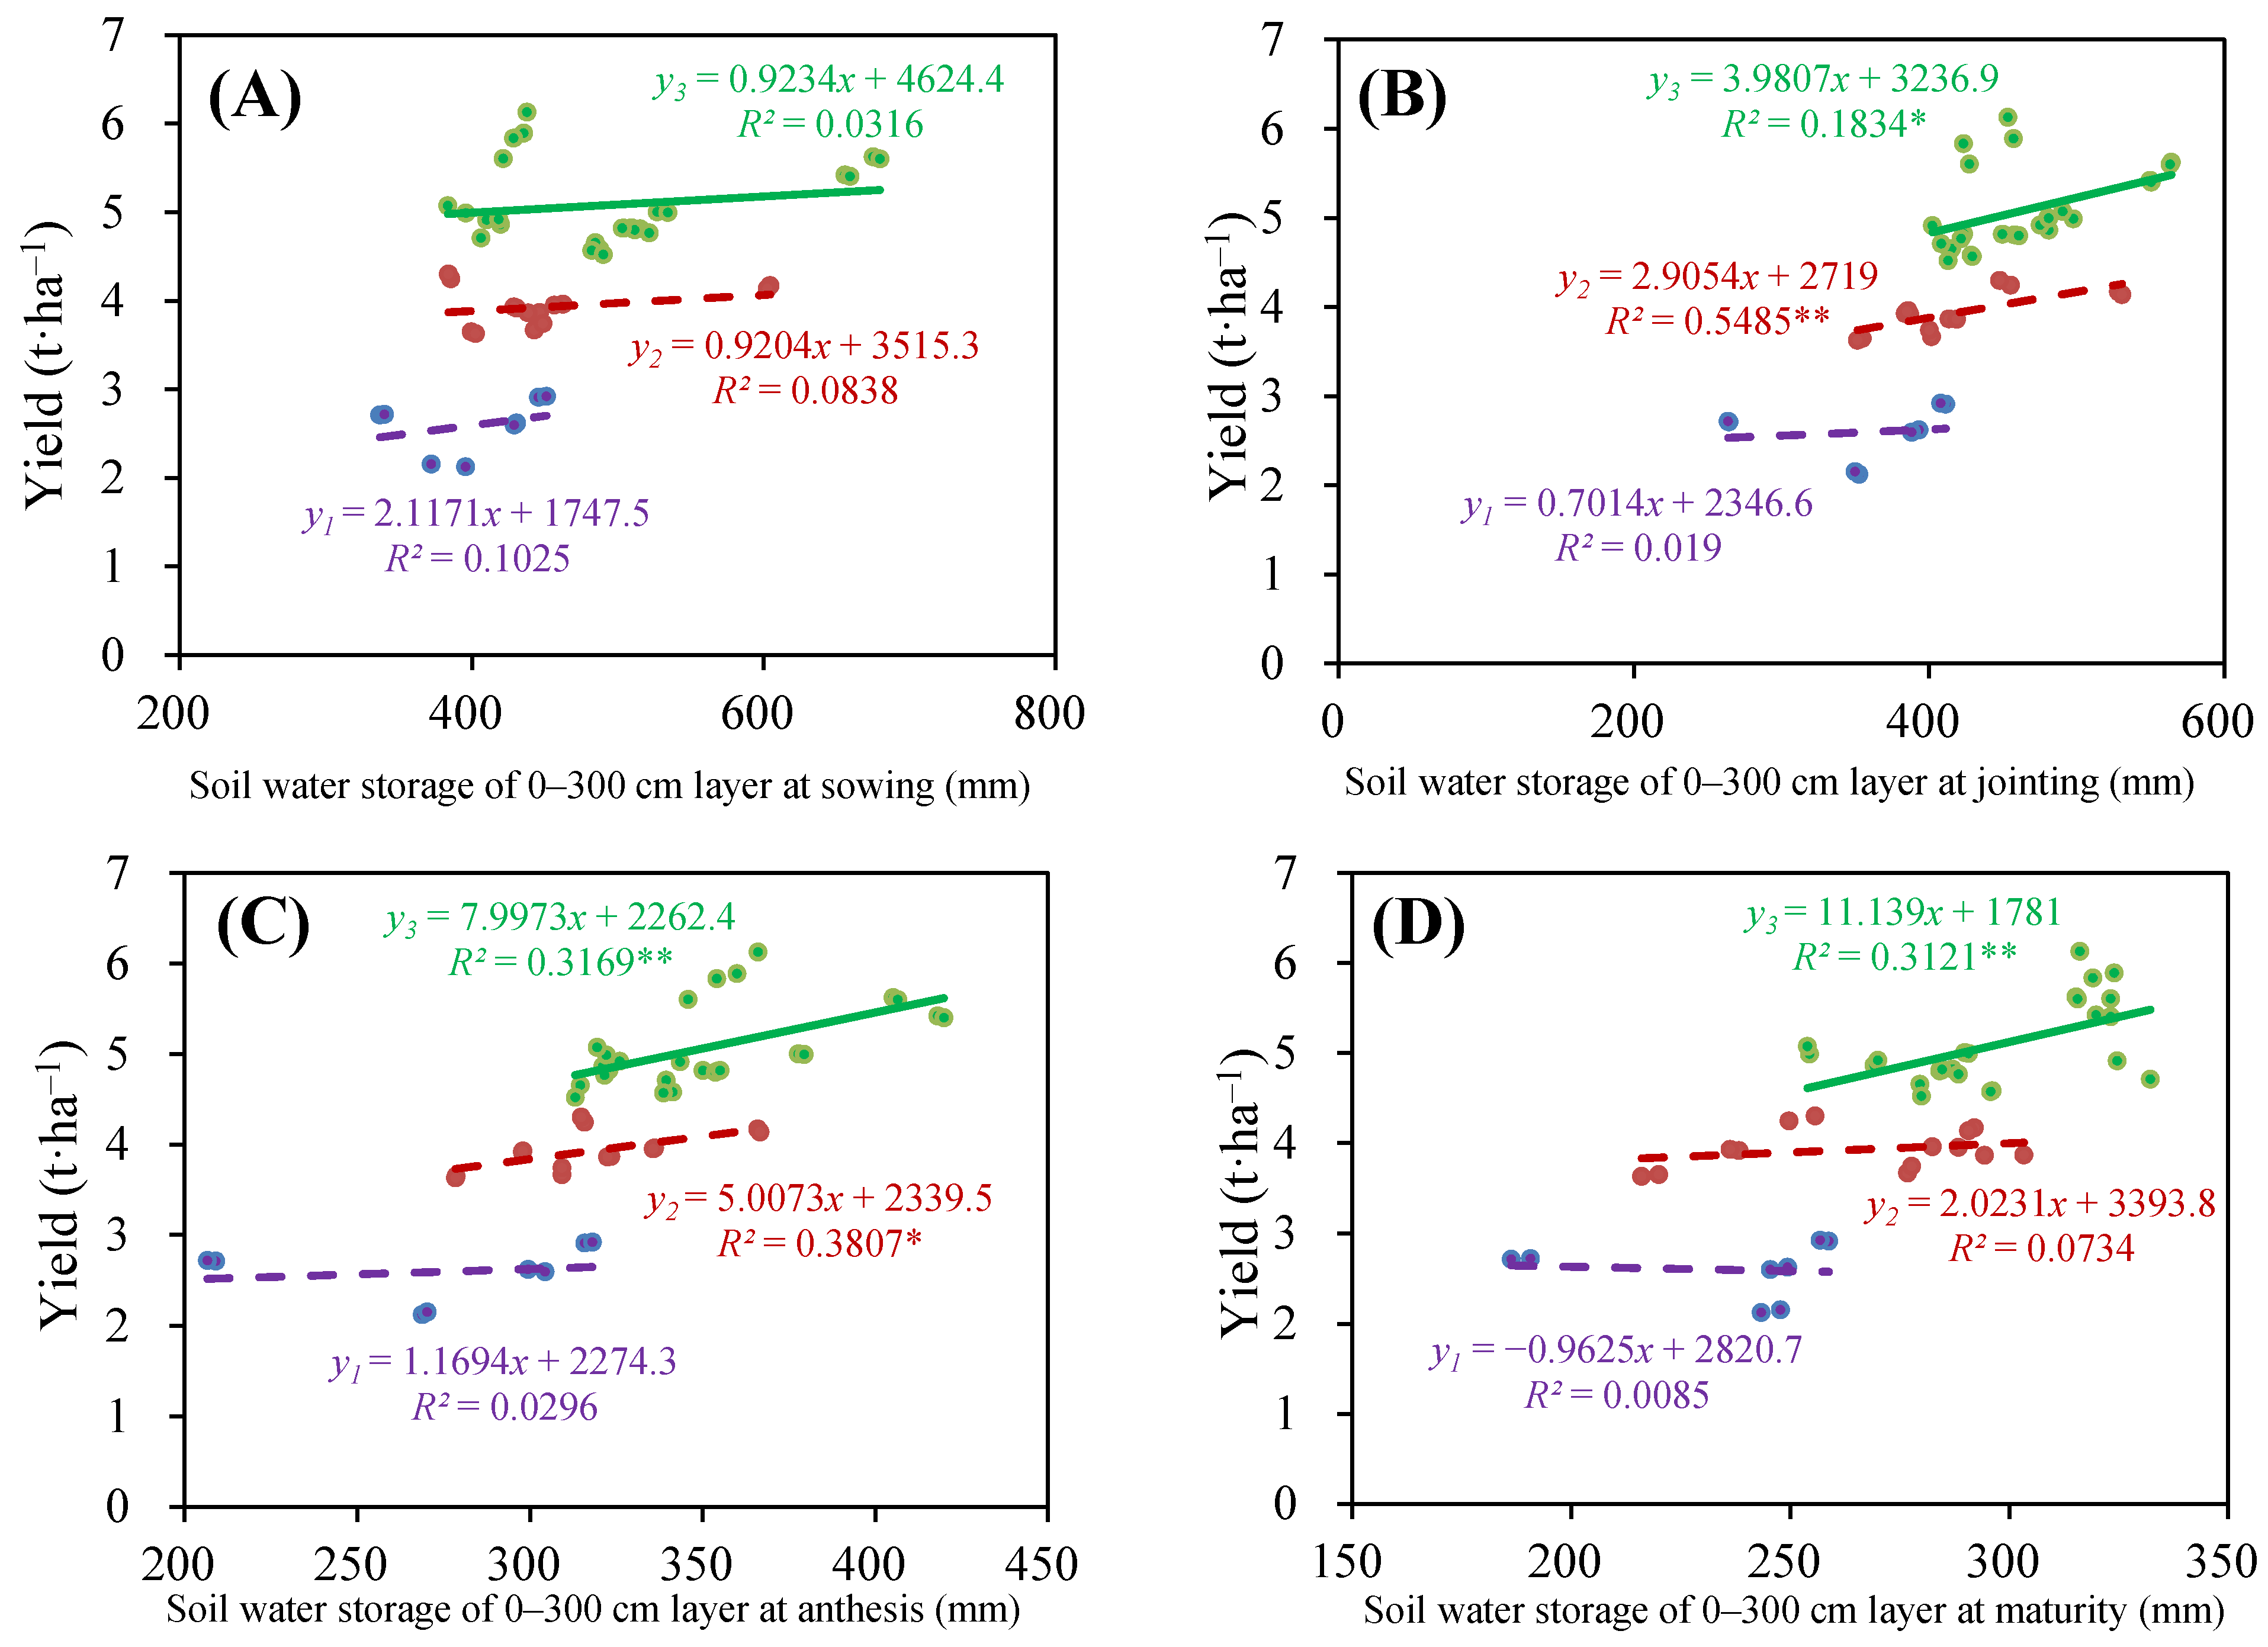
The association between yield development and soil water storage fluctuated with the yield level (Figure 4). Yield was not significantly related to soil water storage at the jointing or anthesis stages; however, with increasing soil water storage, yield first decreased and then increased. This indicated that soil water storage was higher than 388.2 mm, 331.2 mm, and 258.0 mm at the sowing, jointing, and anthesis stages, respectively (Figure 4A–C). At the intermediate yield level, yields increased with soil water storage, with the maximum soil water storage at the jointing stage (Figure 4B). Lastly, at a high yield level, yields were mostly correlated with soil water storage at the jointing, anthesis, and maturity stages. This trend was similar to that observed for the intermediate yield level (Figure 4A–C). Our results indicate that higher soil water storage during the late stages of growth is crucial for a higher yield.
3.2. Correlation between Yield Formation and Field Water Consumption
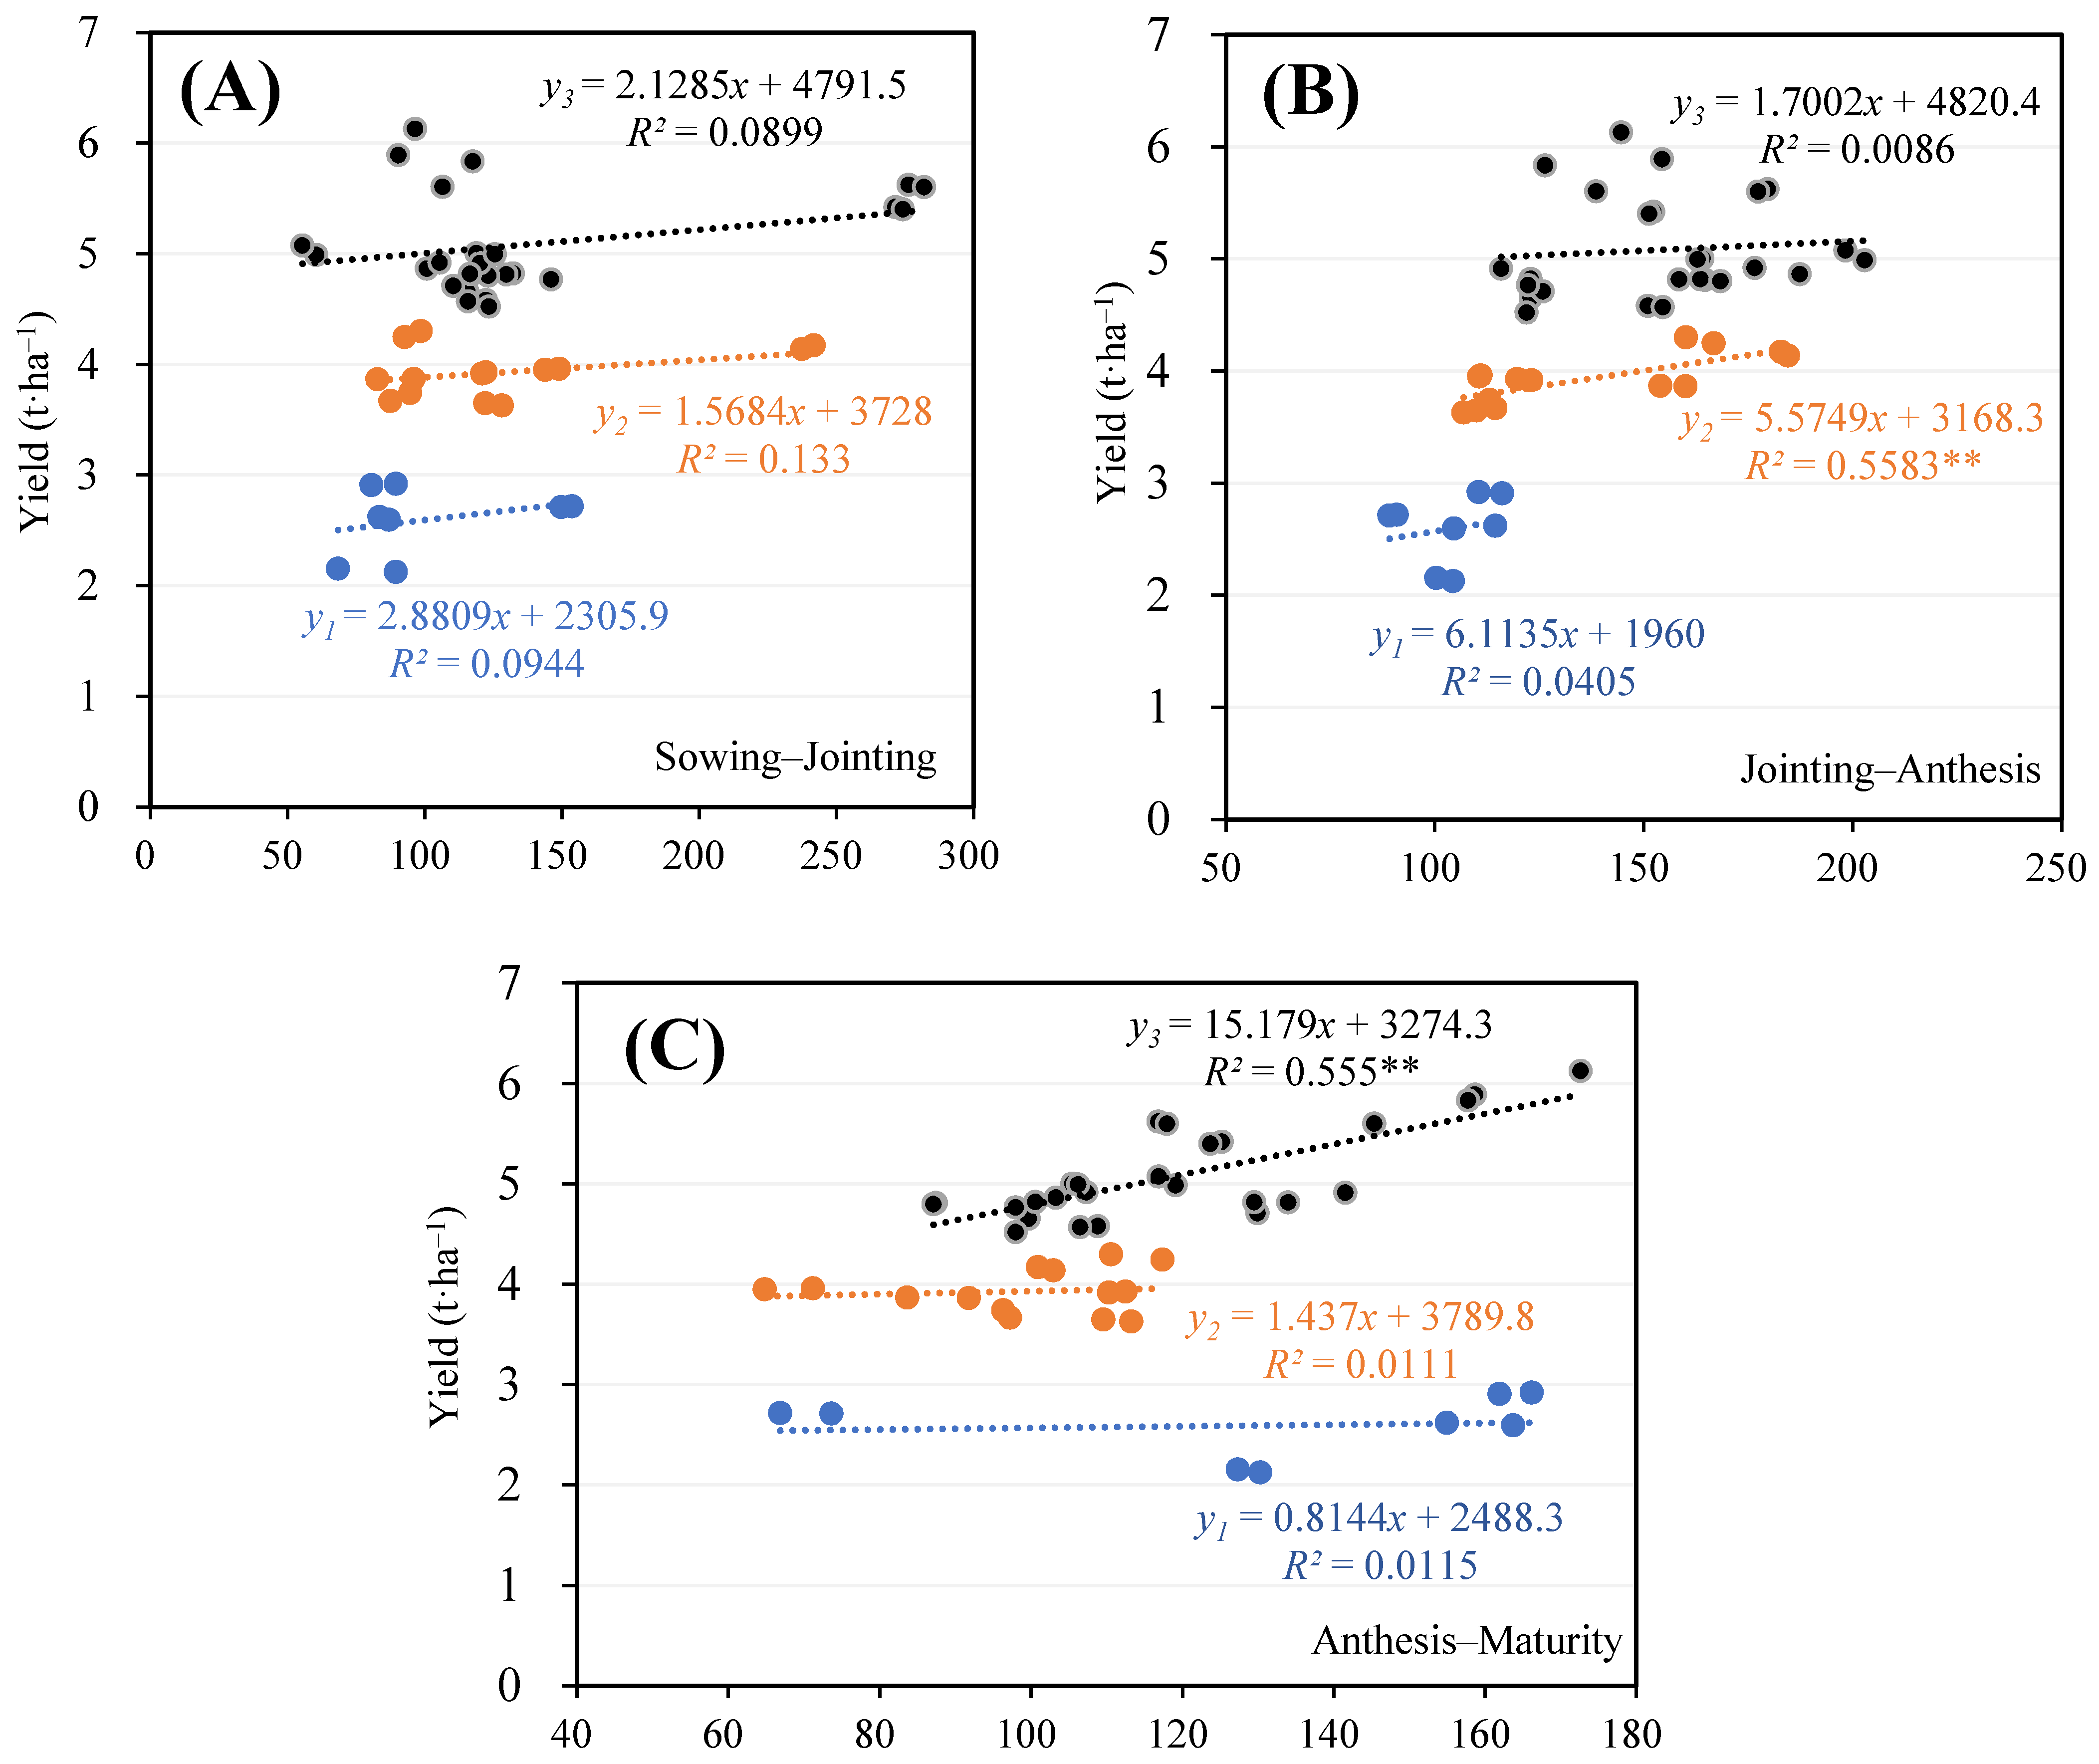
During growth, the correlation between water consumption and yield formation was different at each yield level (Figure 5). At a low yield level, yield increased with increasing soil water consumption during each growth stage, although the differences were not significant (Figure 5A–C). Yield increased with field water consumption during the jointing to anthesis stages at the intermediate yield level, as shown in Figure 5B. On other hand, at the high yield level, yield increased with water consumption during the anthesis and maturity stages (Figure 5A–C). These results indicate that higher field water consumption during late growth stages is essential to high yield.
3.3. Water Use Efficiency (WUE) and Yield Components
During the research period from 2009–2017, the lowest yield was recorded under the DS treatment in 2012–2013, while the highest yield was recorded under furrow sowing (FS) in 2015–2016, as shown in Table 2. Moreover, yield composition was different at the different yield levels. In 2012–2013, at a low yield level, the 1000-grain weight and grain number per spike were highest under the WS treatment, while the lowest yield was noted under drill sowing, with values of 300.25 × 10⁴ ha−1 and 2.14 kg·ha−1 recorded for grain yield and tiller number, respectively. Meanwhile, at the intermediate yield level, the yield, number of tillers, and grain number per ear were highest under DS in 2016–2017. At the lowest yield recorded in 2015–2016, the tiller number was also lowest. FS and WS treatments increased the number of tillers, grain number per spike, and 1000-grain weight, thereby increasing grain yield by 26.5%, and 24.5%, respectively, compared to DS. At the low yield level, the average field water consumption, WUE, and PUE were 334.7 mm, 7.8 t·ha−1, and 7.6 t·ha−1·mm−1, respectively, while the water consumption was highest in the year with the highest yield, and the WUE was also relatively high. In addition, compared with DS, FS and WS effectively improved the WUE by 11.7% and 11.9% and the PUE by 26.7% and 24.2%, respectively, in the same year.
3.4. Correlation Analysis of Yield Components and Contribution of Water Sources
The contribution of the different yield components to yield varied with yield level (Table 3). Thus, at a low yield level, the number of tillers and 1000-grain weight were positively correlated with yield. Meanwhile, at the intermediate yield level, the 1000-grain weight was negatively associated with yield, while the number of tillers and number of grains per spike were the key mechanisms for increasing yield. The association between the 1000-grain weight and yield was nonsignificant, whereas the yield was significantly improved by the number of tillers.
At the low yield level, fallow precipitation and the jointing to anthesis stages were positively correlated with the number of tillers; however, this correlation was negative during the anthesis to maturity stages (Table 4). The number of grains per spike and the 1000-grain weight were negatively correlated with precipitation. Soil water consumption during the sowing to jointing stages was positively correlated with the number of tillers. The grain number per spike and the 1000-grain weight were positively correlated with soil water consumption during the jointing to anthesis stages and during the anthesis to maturity stages. At the intermediate yield level, precipitation during the sowing to jointing stages was positively correlated with the number of tillers; however, this correlation was negative during the jointing to anthesis stages and during the anthesis to maturity stages. Precipitation during the sowing to jointing stages was negatively correlated with the grain number per spike. Lastly, the correlation between precipitation and the number of tillers at the high yield level was similar to that detected at the low yield level. Furthermore, fallow precipitation and precipitation during the sowing to jointing stages were negatively correlated with the grain number per spike, whereas this correlation was positive during the jointing to anthesis stages and during the anthesis to maturity stages. On the other hand, soil water consumption during the sowing to jointing stages and during the jointing to anthesis stages was positively correlated with the number of tillers, whereas the correlation with water consumption was negative during the anthesis to maturity stages.
The equations in Table 4 show that soil water intake from anthesis to maturity mostly influenced the number of grains per spike and 1000-grain weight under drill sowing. Furthermore, the number of tillers was positively affected by soil water consumption from jointing to maturity, the grain number per ear was affected by soil water consumption from anthesis to maturity, and the 1000-grain weight was affected by precipitation from seeding to jointing and by soil water consumption from anthesis to maturity. Lastly, the number of tillers was positively affected by fallow precipitation from seeding to anthesis at a high yield level, the grain number per spike was affected by water consumption from seeding to anthesis and by precipitation from jointing to maturity, and the 1000-grain weight was affected by fallow precipitation and precipitation during each growth stage.
4. Discussion
4.1. Wheat Grain Yield and Yield Components
Precipitation is the only source of water in arid and semiarid areas; therefore, it is the main preventive factor for the production of winter wheat [29]. Field water consumption, precipitation use efficiency, and water use efficiency were affected by the tillage treatment, thereby affecting the winter wheat yield [30]. In addition, wheat yield was significantly correlated with soil water status at numerous developmental stages from sowing to maturity [31]. In a previous study, it was reported that soil water storage from jointing to maturity was the key factor for increasing winter wheat yield in the Loess Plateau region [32], with the main stages for the water demand of winter wheat being sowing, jointing, and anthesis [33].
Soil moisture during the jointing and heading stages is particularly important in determining yield formation. The correlation between yield and soil water storage during each growth stage was different, not only related to regional differences but also to yield level [34]. In a previous study, when yield was lower than 3.00 t·ha−1, it was more strongly related to soil water storage at sowing, jointing, and anthesis [35]. When yield reached between 3.10 and 4.51 t·ha−1, it was more related to soil water storage at jointing, whereas, when it reached over 4.50 kg·ha−1, it was more related to soil water storage at jointing, maturity, and anthesis [36]. In the fallow period, tillage improved the soil water storage and field evapotranspiration, which was conducive to the improvement of yield [37]. Optimizing the spike number per hectare is a key method to maximize yield in most cereal crops because it can increase plant vigor and, hence, plant grain yield [38].
Both the number of tillers and the yield were positively correlated at different yield levels, indicating that a larger number of tillers may guarantee a higher yield from winter wheat. These results are consistent with previous studies [39]. However, the grain number per ear and 1000-grain mass were correlated with yield at different levels of yield. Thus, for example, [39] reported that, at a low yield level (less than 7.50 t·ha−1), yield was positively correlated to grain number per spike ear but negatively correlated with 1000-grain mass, whereas, at a high yield level (i.e., greater than 7.50 t·ha−1), yield was correlated with grain number per ear, but not with 1000-grain weight. In the present study, a significant relationship was found between yield and tiller number. However, when the yield was lower than 3.00 t·ha−1, it was correlated with 1000-grain weight, whereas, when the yield was 3.00 and 4.50 t·ha−1, it was significantly and negatively correlated with 1000-grain weight. In addition to the number of tillers, at low and intermediate yield levels, the 1000-grain mass and the number of grains per spike were the key yield components responsible for increasing crop yield. Similarly, at a high yield level, higher values of grain number per spike, 1000-grain weight, and number of tillers were the key to high crop yield.
4.2. Wheat Yield Formation and Water
The key yield components responsible for the formation of yield are well known to be affected by soil moisture during each growth stage and to influence each other [40]. The early growth stage is conducive to improving the spike number, while the latter growth stage is important for the spike number and 1000-grain weight [41]. The number of tillers was reported to be more closely related to water content at the early stage of growth at different yield levels, and the number of grains per ear and 1000-grain weight were more closely related to growth stage, although the specific correlation varied, especially the relative contribution to the formation of the different yield components [42]. Thus, at low yield levels, the key to improving tiller number and 1000-grain weight was soil water consumption during the period from anthesis to maturity [43]. At the intermediate yield level tested here, tiller number was affected by soil water consumption during jointing, and the effect was positive; the number of grains per spike was positively affected by water consumption during the period from anthesis to maturity [44]. In this study, the fallow period ranged from the last 10 days of June to the last 10 days of September, the sowing–jointing stage) ranged from the first 10 days of October to the first 10 days of April in the following year, the jointing–anthesis stage ranged from the middle 10 days of April to the first 10 days of May, and the anthesis–maturity stage ranged from the middle 10 days of May to the middle 10 days of June.
Soil erosion has disastrous consequences on local agricultural creation and socioeconomic improvement, thereby affecting people’s lives and property, and posing a significant threat to safety. Loess erosion is a main environmental topic that has been addressed in many studies [45,46,47]. The results of previous studies revealed large differences in soil temperature and moisture across tillage and sowing treatments in wheat [48,49]. In agriculture systems, the method of sowing is an important factor governing the soil microclimate [50,51]. Unlike tillage systems, crop residues are not incorporated in sowing systems [52,53]. The amount of soil water stored at sowing can be used as a guide when applying the basal amount of N. Additional N fertilization as top dressing can be applied when rainfall is higher than expected in the growth season [54,55]. The annual precipitation level fluctuates considerably in the Loess Plateau, as observed in this study [56].
Precipitation is also unevenly distributed within a year. Summer rainfall accounts for approximately 60% of the yearly precipitation [57,58]. The yield increase is largely because optimal sowing promotes tiller and panicle formation, leading to an increased number of spikes per unit area (Table 4). The application of optimal rates of N in years with different precipitation levels can also reduce production cost and environmental pollution [59,60]. In turn, the 1000-grain weight was found to be affected by precipitation from sowing to jointing and by soil water consumption from anthesis to maturity. Lastly, at the high yield level, the number of tillers was positively affected by fallow precipitation during the sowing and anthesis periods, the number of grains per ear was affected by water consumption during the jointing–maturity stages and by precipitation from sowing to anthesis, and the 1000-grain weight was affected by fallow precipitation during each growth stage.
4.3. Water Impact on Wheat Yield
This study showed that sowing method had no significant effect on the grain protein content. Compared to drill sowing, the protein yield of wheat could be significantly increased by wide-space sowing, and the soil moisture could be significantly increased by furrow sowing. Furthermore, the regulation ability of wide-space sowing was higher than that of furrow sowing. The results showed that the difference in protein yield was mainly caused by yield, in contrast to the results in Tai’an, Shadong province [61], where, compared to drill sowing, wide-space sowing could reduce wheat grain protein content and increase protein yield. This may be due to the differences in regional climate and soil type or may be related to wheat genotypes, which need to be verified by years of research. Analysis showed that nitrogen fertilizer could significantly increase grain protein content and yield, and its regulation ability increased with the increase in nitrogen fertilizer. This was consistent with previous studies showing that nitrogen application increased the nitrogen content in grains [62,63], thus increasing the protein content. It was also shown that the sowing method and nitrogen application rate had independent effects on nitrogen accumulation in dryland wheat [64]. This may be due to the different response of grain protein content and yield to the seeding method and nitrogen application rate; thus, further research is needed.
This study showed that the contribution rate of pre-flowering translocation to grains was more than 75%. Compared to drill sowing, the nitrogen accumulation, transshipment volume, and N harvest index of wheat plants were significantly increased by wide-space sowing and trenching tillage sowing, whereas the contribution rate of post-flowering accumulation to grains was significantly decreased by wide-space sowing and trenching tillage sowing, along with a higher regulation ability than trenching tillage sowing. This is consistent with previous studies. The large population [64] produced by wide-space sowing and double-row sowing is accompanied by an increase in plant nitrogen accumulation [65], while the premature aging phenomenon [66,67] results in accelerated filling, high pre-flowering transshipment volume, transshipment rate [68], and eventually high grain nitrogen content and harvest index [69,70]. The agent quantity of furrow sowing with the buffer effect of temperature [71] is advantageous to plant nitrogen accumulation and delays the grouting by 5–6 months at high temperatures [72]. Additionally, it increases the grain nitrogen content and harvest index [73]; however, of the land utilization rate is low, and the nitrogen accumulation and transportation are lower than under wide refined sowing. In conventional single-row seeding, the lack of seedlings and ridging at the early stage [74] reduces the wheat population, resulting in low nitrogen accumulation in plants and weak resistance to the external environment in smaller groups at the later stages [75]. A high temperature at the filling stage further reduces the transport of nitrogen to grains, resulting in a lower nitrogen content and harvest index in grains. Experimental results in the Loess Plateau showed that soil water storage before sowing was significantly and positively correlated with wheat yield in dryland. In the Weibei region of Shaanxi province and the Jinnan region of Gansu province, soil water storage before sowing showed a significant linear positive correlation with wheat grain yield, especially in dry years. The distribution of precipitation is closely related to wheat yield. If precipitation is insufficient in the early stages of the critical wheat growth period and a soil water deficit occurs, the growth and development of wheat will be significantly affected, resulting in a reduction in yield.
5. Conclusions
It can be concluded from the present study that, compared to the drill sowing method, furrow sowing and wide-space sowing were influenced by field evapotranspiration within the same year. At a low yield level, the average field water consumption, WUE, and PUE were highest in the year with the highest yield. Wide-space sowing in the fallow period improved the precipitation use efficiency, while yield components that were negatively affected by precipitation were also improved. Wide-space sowing was mainly responsible for a reduction in 1000-grain weight and grain number per spike. Therefore, in high-yield years, fallow cultivation can help adjust the relationship among the components, promote a reasonable distribution, and improve yield.
Author Contributions
Conceptualization, M.S.; methodology, H.N., M.S. and Z.G.; software, M.S.; validation, M.S. and H.N.; formal analysis, W.L.; investigation, M.S.; resources, H.N.; data curation, H.N.; writing, H.N., M.S., W.L. and Z.G. All authors read and agreed to the published version of the manuscript.
Funding
The authors are thankful to ‘Modern Agriculture Industry Technology System Construction’ (No. CARS-3124), the National Key Research and Development Program of China (No. 2018YFD020040105), the Sanjin Scholar Support Special Funds Projects, the National Natural Sci-ence Foundation of China (No. 31771727), and the ‘1331’ Engineering Key Innovation Cultiva-tion Team Organic Dry Cultivation and Cultivation Physiology Innovation Team (No. SXYBKY201733).
Institutional Review Board Statement
Not applicable.
Informed Consent Statement
Not applicable.
Data Availability Statement
The data presented in this study is available on request from the corresponding author.
Acknowledgments
The authors are thankful to ‘Modern Agriculture Industry Technology System Construction’ (No. CARS-3124), the National Key Research and Development Program of China (No. 2018YFD020040105), the Sanjin Scholar Support Special Funds Projects, the National Natural Science Foundation of China (No. 31771727), and the ‘1331’ Engineering Key Innovation Cultivation Team Organic Dry Cultivation and Cultivation Physiology Innovation Team (No. SXYBKY201733) for financial support of this study.
Conflicts of Interest
The authors declare no conflict of interest.
References
- Su, Z.; Zhang, J.; Wu, W.; Cai, D.; Lv, J.; Jiang, G.; Huang, J.; Gao, J.; Hartmanne, R.; Gabrielset, D. Effects of conservation tillage practices on winter wheat water-use efficiency and crop yield on the Loess Plateau, China. Agri. Water Manag. 2007, 87, 307–314. [Google Scholar] [CrossRef]
- Qiu, L.; Hao, M.; Wu, Y. Potential impacts of climate change on carbon dynamics in a rain-fed agroecosystem on the Loess Plateau of China. Sci. Total Environ. 2017, 577, 267–278. [Google Scholar] [CrossRef] [PubMed]
- Kang, S.Z.; Zhang, L.; Liang, Y.; Hu, X.; Cai, H.; Gu, B. Effects of limited irrigation on yield and water use efficiency of winter wheat in the Loess Plateau of China. Agri. Water Manag. 2002, 55, 203–216. [Google Scholar] [CrossRef]
- Ren, A.; Sun, M.; Xue, L.; Deng, Y.; Wang, P.; Lei, M.; Lin, W.; Yang, Z.; Gao, Z. Spatio-temporal dynamics in soil water storage reveals effects of nitrogen inputs on soil water consumption at different growth stages of winter wheat. Agri. Water Manag. 2019, 216, 379–389. [Google Scholar] [CrossRef]
- Hungria, M.; Franchini, J.C.; Brandão-Junior, O.; Kaschuk, G.; Souza, R.A. Soil microbial activity and crop sustainability in a long-term experiment with three soil-tillage and two crop-rotation systems. Appl. Soil Ecology. 2009, 42, 288–296. [Google Scholar] [CrossRef]
- Zhang, Q.; Liu, D.; Cheng, S.; Huang, X. Combined effects of runoff and soil erodibility on available nitrogen losses from sloping farmland affected by agricultural practices. Agric. Water Manag. 2016, 176, 1–8. [Google Scholar] [CrossRef]
- Friedrich, T.; Derpsch, R.; Kassam, A. Overview of the global spread of conservation agriculture. In Sustainable Development of Organic Agriculture; Apple Academic Press: Palm Bay, FL, USA, 2017; pp. 75–90. Available online: http://journals.openedition.org/factsreports/1941 (accessed on 20 December 2021).
- Jiang, C.; Wang, F.; Zhang, H.; Dong, X. Quantifying changes in multiple ecosystem ser-vices during 2000–2012 in the Loess Plateau, China, as a result of climate variability and ecological restoration. Ecol. Eng. 2016, 97, 258–271. [Google Scholar] [CrossRef]
- Wang, X.; Wang, B.; Xu, X. Effects of large-scale climate anomalies on trends in seasonal precipitation over the Loess Plateau of China from 1961 to 2016. Ecol. Indic. 2019, 107, 105643. [Google Scholar] [CrossRef]
- Cao, H.; Wang, Z.; He, G.; Dai, J.; Huang, M.; Wang, S.; Luo, L.; Sadras, V.O.; Hoogmoed, M.; Malhi, S.S. Tailoring NPK fertilizer application to precipitation for dryland winter wheat in the Loess Plateau. Field Crop. Res. 2017, 209, 88–95. [Google Scholar] [CrossRef]
- Zhu, Z.; Chen, D. Nitrogen fertilizer use in China—Contributions to food production, impacts on the environment and best management strategies. Nutr. Cycl. Agroecosyst. 2002, 63, 117–127. [Google Scholar] [CrossRef]
- Turner, N.C.; Asseng, S. Productivity, sustainability, and rainfall-use efficiency in Australian rainfed Mediterranean agricultural systems. Aust. J. Agric. Res. 2005, 56, 1123–1136. [Google Scholar] [CrossRef]
- Shi, Z.L.; Li, D.D.; Jing, Q.; Cai, J.; Jiang, D.; Cao, W.X.; Dai, T.B. Effects of nitrogen applications on soil nitrogen balance and nitrogen utilization of winter wheat in a rice-wheat rotation. Field Crop. Res. 2012, 127, 241–247. [Google Scholar] [CrossRef]
- Camarotto, C.; Ferro, N.D.; Piccoli, I.; Polese, R.; Morari, F. Conservation agriculture and cover crop practices to regulate water, carbon and nitrogen cycles in the low-lying Venetian plain. Catena 2018, 167, 236–249. [Google Scholar] [CrossRef]
- Unger, P.W.; Kaspar, T.C. Soil compaction and root growth: A review. Agron. J. 1994, 86, 759–766. [Google Scholar] [CrossRef]
- López-Garrido, R.; Madejón, E.; León-Camacho, M.; Girón, I.; Moreno, F.; Murillo, J.M. Reduced tillage as an alternative to no-tillage under Mediterranean conditions: A case study. Soil Tillage Res. 2014, 140, 40–47. [Google Scholar] [CrossRef]
- Costa, J.L.; Aparicio, V.; Cerda, A. Soil physical quality changes under different management systems after 10 years in the Argentine humid pampa. Solid Earth 2015, 6, 361–371. [Google Scholar] [CrossRef] [Green Version]
- Noor, H.; Wang, Q.; Islam, M.A.; Sun, M.; Lin, W.; Ren, A.X.; Feng, Y.; Yu, S.B.; Fida, N.; Dong, S.F.; et al. Effects of sowing methods and nitrogen rates on photosynthetic characteristics, yield and quality of winter wheat. Photosynthetica 2021, 59, 277–285. [Google Scholar] [CrossRef]
- Xu, X.; He, P.; Wei, J.; Cui, R.; Sun, J.; Qiu, S.; Zhao, S.; Zhou, W. Use of controlled-release urea to improve yield, nitrogen utilization, and economic return and reduce nitrogen loss in wheat-maize crop rotations. Agronomy 2021, 11, 723. [Google Scholar] [CrossRef]
- Raymbek, A.; Saunikov, E.; Kenenbayev, S.; Perovic, V.; Ramazanova, S. Protein content changes in wheat grain as influenced by nitrogen fertilization. Agrochim. Pisa 2017, 61, 180–189. [Google Scholar] [CrossRef]
- Liu, Z.; Yu, N.; Camberato, J.J.; Gao, J.; Liu, P.; Zhao, B.; Zhang, J. Crop production kept stable and sustainable with the decrease of nitrogen rate in North China Plain: An economic and environmental assessment over 8 years. Sci. Rep. 2019, 9, 19335. [Google Scholar] [CrossRef] [Green Version]
- Wang, L.; Palta, J.A.; Chen, W.; Chen, Y.L.; Deng, X.P. Nitrogen fertilization improved water-use efficiency of winter wheat through increasing water use during vegetative rather than grain filling. Agric. Water Manag. 2018, 197, 41–53. [Google Scholar] [CrossRef]
- Guo, S.; Zhu, H.; Dang, T.; Wu, J.; Liu, W.; Hao, M.; Li, Y.; Syers, J.K. Winter wheat grain yield associated with precipitation distribution under long-term nitrogen fertilization in the semiarid Loess Plateau in China. Geoderma 2012, 189, 442–450. [Google Scholar] [CrossRef]
- Qin, X.; Zhang, F.; Liu, C.; Yu, H.; Cao, B.; Tian, S.; Liao, Y.; Siddique, K.H.M. Wheat yield improvements in China: Past trends and future directions. Field Crop. Res. 2015, 177, 117–124. [Google Scholar] [CrossRef]
- Slafer, G.A. Genetic basis of yield as viewed from a crop physiologist’s perspective. Ann. Appl. Biol. 2003, 142, 117–128. [Google Scholar] [CrossRef]
- Sadras, V.O.; Slafer, G.A. Environmental modulation of yield components in cereals: Heritabilities reveal a hierarchy of phenotypic plasticities. Field Crop. Res. 2012, 127, 215–224. [Google Scholar] [CrossRef]
- Dewey, D.R.; Lu, K. A correlation and path-coefficient analysis of components of crested wheatgrass seed production. Agron. J. 1959, 51, 70–74. [Google Scholar] [CrossRef]
- Singh, D.; Singh, M.; Sharma, K.C. Correlation and path coefficient analysis among flag leaf area, yield and yield attributes in wheat (Triticum aestivum L.). Cereal Res. Commun. 1979, 7, 145–152. [Google Scholar]
- Cao, H.; Li, Y.; Chen, G.; Chen, D.; Qu, H.; Ma, W. Identifying the limiting factors driving the winter wheat yield gap on smallholder farms by agronomic diagnosis in North China Plain. J. Integr. Agri. 2019, 18, 1701–1703. [Google Scholar] [CrossRef]
- Ozturk, A.; Aydin, F. Effect of water stress at various growth stages on some quality characteristics of winter wheat. J. Agron. Crop. Sci. 2004, 190, 93–99. [Google Scholar] [CrossRef]
- Seddaiu, G.; Iocola, I.; Farina, R.; Orsini, R.; Iezzi, G.; Roggero, P.P. Long term effects of tillage practices and N fertilization in rainfed Mediterranean cropping systems: Durum wheat, sunflower and maize grain yield. Eur. J. Agron. 2016, 77, 166–178. [Google Scholar] [CrossRef]
- Wang, Y.; Zhang, Y.; Zhou, S.; Wang, Z. Meta-analysis of no-tillage effect on wheat and maize water use efficiency in China. Sci. Total Environ. 2018, 635, 1372–1382. [Google Scholar] [CrossRef] [PubMed]
- Sun, M.; Ren, A.; Gao, Z.; Wang, P.; Mo, F.; Xue, L.; Lei, M. Long-term evaluation of tillage methods in fallow season for soil water storage, wheat yield and water use efficiency in semiarid southeast of the loess plateau. Field Crops Res 2018, 218, 24–32. [Google Scholar] [CrossRef]
- He, G.; Wang, Z.; Li, F.; Dai, J.; Li, Q. Soil water storage and winter wheat productivity affected by soil surface management and precipitation in dryland of the Loess Plateau. China. Agric. Water Manag. 2016, 171, 1–9. [Google Scholar] [CrossRef]
- Sun, L.; Wang, R.; Li, J.; Wang, Q.; Lyu, W.; Wang, X.; Cheng, K.; Mao, H.; Zhang, X. Reasonable fertilization improves the conservation tillage benefit for soil water use and yield of rain-fed winter wheat: A case study from the Loess Plateau, China. Field Crops Res. 2019, 242, 107589. [Google Scholar] [CrossRef]
- Wang, D. Water use efficiency and optimal supplemental irrigation in a high yield wheat field. Field Crops Res. 2017, 217, 213–220. [Google Scholar] [CrossRef]
- Lin, X.; Wang, D. Effects of supplemental irrigation on water consumption characteristics, grain yield and water use efficiency in winter wheat under different soil moisture conditions at seeding stage. Acta Agron. Sin. 2017, 43, 1357–1369. [Google Scholar] [CrossRef]
- Deng, X.; Shan, L.; Zhang, H.; Turner, N.C. Improving agricultural water use efficiency in arid and semiarid areas of China. Agric. Water Manag. 2006, 80, 23–40. [Google Scholar] [CrossRef]
- Xue, L.; Khan, S.; Sun, M.; Anwar, S.; Ren, A.; Gao, Z.; Lin, W.; Xue, J.; Yang, Z.; Deng, Y. Effects of tillage practices on water consumption and grain yield of dryland winter wheat under different precipitation distribution in the loess plateau of China. Soil Tillage Res. 2019, 191, 66–74. [Google Scholar] [CrossRef]
- Weiner, J.; Griepentrog, H.W.; Kristensen, L. Suppression of weeds by spring wheat Triticum aestivum increases with crop density and spatial uniformity. J. Appl. Ecol. 2001, 38, 784–790. [Google Scholar] [CrossRef]
- Del Blanco, I.A.; Rajaram, S.; Kronstad, W.E. Agronomic potential of synthetic hexaploid wheat-derived populations. Crop. Sci. 2001, 41, 670–676. [Google Scholar] [CrossRef]
- Duan, J.; Wu, Y.; Zhou, Y.; Ren, X.; Shao, Y.; Feng, W.; Zhu, Y.; Wang, Y.; Guo, T. Grain number responses to pre-anthesis dry matter and nitrogen in improving wheat yield in the Huang-Huai Plain. Sci. Rep. 2018, 8, 1–10. [Google Scholar] [CrossRef] [PubMed]
- Dong, Z.; Zhang, X.; Li, J.; Zhang, C.; Wei, T.; Yang, Z.; Cai, T.; Zhang, P.; Ding, R.; Jia, Z. Photosynthetic characteristics and grain yield of winter wheat (Triticum aestivum L.) in response to fertilizer, precipitation, and soil water storage before sowing under the ridge and furrow system: A path analysis. Agric. For. Meteorol. 2019, 272, 12–19. [Google Scholar] [CrossRef]
- Hochman, Z. Effect of water stress with phasic development on yield of wheat grown in a semi-arid environment. Field Crops Res. 1982, 5, 55–67. [Google Scholar] [CrossRef]
- Berhe, A.A.; Barnes, R.T.; Six, J.; Marín-Spiotta, E. Role of soil erosion in biogeochemical cycling of essential elements: Carbon, nitrogen, and phosphorus. Annu. Rev. Earth Planet. Sci. 2018, 46, 521–548. [Google Scholar] [CrossRef]
- Jiang, C.; Zhang, H.Y.; Wang, X.C.; Feng, Y.Q.; Labzovskii, L. Challenging the land degradation in China’s Loess Plateau: Benefits, limitations, sustainability, and adaptive strategies of soil and water conservation. Ecol. Eng. 2019, 127, 135–150. [Google Scholar] [CrossRef]
- Juang, C.H.; Dijkstra, T.; Wasowski, J.; Meng, X.M. Loess geohazards research in China: Advances and challenges for mega engineering projects. Eng. Geol. 2019, 251, 1–10. [Google Scholar] [CrossRef]
- Johnson, M.D.; Lowery, B. Effect of three conservation tillage practices on soil temperature and thermal properties. Soil Sci. Soc. Am. J. 1985, 49, 1547–1552. [Google Scholar] [CrossRef]
- Amos, B.; Shen, H.; Arkebauer, T.J.; Walters, D.T. Effect of previous crop residue on soil surface carbon dioxide flux in maize. Soil Sci. 2007, 172, 589–597. [Google Scholar] [CrossRef]
- Lueschen, W.E. Tillage, row spacing, and planting date effects on soybean following corn or wheat. J. Prod. Agric. 1992, 5, 260. [Google Scholar] [CrossRef]
- Hatfield, J.L.; Prueger, J.H. Microclimate effects of crop residues on biological processes. Theor. Appl. Climatol. 1996, 54, 47–59. [Google Scholar] [CrossRef]
- Sims, A.L.; Schepers, J.; Olson, R.A.; Power, J.F. Irrigated corn yield and nitrogen accumulation response in a comparison of no-till and conventional till: Tillage and surface-residue variables. Agron. J. 1998, 90, 630–637. [Google Scholar] [CrossRef]
- Zhang, X.; Xin, X.; Zhu, A.; Zhang, J.; Yang, W. Effects of tillage and residue managements on organic C accumulation and soil aggregation in a sandy loam soil of the North China Plain. CATENA 2017, 156, 176–183. [Google Scholar] [CrossRef]
- Wagger, M.G.; Denton, H.P. Crop and tillage rotations: Grain yield, residue cover, and soil water. Soil Sci. Soc. Am. J. 1992, 56, 1233–1237. [Google Scholar] [CrossRef] [Green Version]
- Chen, Y.; McKyes, E. Reflectance of light from the soil surface in relation to tillage practices, crop residues and the growth of corn. Soil Tillage Res. 1993, 26, 99–114. [Google Scholar] [CrossRef]
- Shen, Y.; McLaughlin, N.; Zhang, X.; Xu, M.; Liang, A. Effect of tillage and crop residue on soil temperature following planting for a Black soil in Northeast China. Sci. Rep. 2018, 8, 1–9. [Google Scholar] [CrossRef] [Green Version]
- Van Donk, S.J.; Martin, D.L.; Irmak, S.; Melvin, S.R.; Petersen, J.L.; Davison, D.R. Crop residue cover effects on evaporation, soil water content, and yield of deficit-irrigated corn in west-central Nebraska. Trans. ASABE 2010, 53, 1787–1797. [Google Scholar] [CrossRef]
- Johnson, A.M.; Hoyt, G.D. Changes to the soil environment under conservation tillage. Horttechnology 1999, 9, 380–393. [Google Scholar] [CrossRef]
- Lobell, D.B.; Bala, G.; Duffy, P.B. Biogeophysical impacts of cropland management changes on climate. Geophys. Res. Lett. 2006, 33, 4–7. [Google Scholar] [CrossRef]
- Hirsch, A.L.; Wilhelm, M.; Davin, E.L.; Thiery, W.; Seneviratne, S.I. Can climate-effective land management reduce regional warming? J. Geophys. Res. 2017, 122, 2269–2288. [Google Scholar] [CrossRef]
- Fang, X.; Li, Y.; Nie, J.; Wang, C.; Huang, K.; Zhang, Y.; Zhang, Y.; She, H.; Liu, X.; Ruan, R. Effects of nitrogen fertilizer and planting density on the leaf photosynthetic characteristics, agronomic traits and grain yield in common buckwheat (Fagopyrum esculentum M.). Field Crop. Res. 2018, 219, 160–168. [Google Scholar] [CrossRef]
- Noor, H.; Min, S.; Khan, S.; Lin, W.; Ren, A.; Yu, S.; Ullah, S.; Yang, Z.; Gao, Z. Different sowing methods increasing the yield and quality of soil water consumption of dryland winter wheat on the loess plateau of china. Appl. Ecol. Env. Res. 2020, 18, 8285–8308. [Google Scholar] [CrossRef]
- Bijay, S.; Sharma, R.K.; Jaspreet, K.; Jat, M.L.; Martin, K.L.; Yadvinder, S.; Varinderpal, S.; Chandna, P.; Choudhary, O.P.; Gupta, R.K.; et al. Assessment of the nitrogen management strategy using an optical sensor for irrigated wheat. J. Agron. Sustain. Dev. 2011, 31, 589–603. [Google Scholar] [CrossRef] [Green Version]
- Yu, X.; Chen, X.; Wang, L.; Yang, Y.; Zhu, X.; Shao, S.; Cui, W.; Xiong, F. Novel insights into the effect of nitrogen on storage protein biosynthesis and protein body development in wheat caryopsis. J. Exp. Bot. 2017, 68, 2259–2274. [Google Scholar] [CrossRef] [PubMed]
- Zörb, C.; Ludewig, U.; Hawkesford, M.J. Perspective on wheat yield and quality with reduced nitrogen supply. Trends Plant. Sci. 2018, 23, 1029–1037. [Google Scholar] [CrossRef] [PubMed] [Green Version]
- Mullen, R.W.; Freeman, K.W.; Raun, W.R.; Johnson, G.V.; Stone, M.L.; Solie, J.B. Identifying an in-season response index and the potential to increase wheat yield with nitrogen. Agron. J. 2003, 95, 347–351. [Google Scholar] [CrossRef]
- Lu, D.; Lu, F.; Yan, P.; Cui, Z.; Chen, X. Elucidating population establishment associated with N management and cultivars for wheat production in China. Field Crop. Res. 2014, 163, 81–89. [Google Scholar] [CrossRef]
- Li, T.; Zhang, Y.; Dai, J.; Dong, H.; Kong, X. High plant density inhibits vegetative branching in cotton by altering hormone contents and photosynthetic production. Field Crop. Res. 2019, 230, 121–131. [Google Scholar] [CrossRef]
- Gregersen, P.L.; Culetic, A.; Boschian, L.; Krupinska, K. Plant senescence and crop productivity. Plant Mol. Biol. 2013, 82, 603–622. [Google Scholar] [CrossRef]
- Dong, H.; Li, W.; Eneji, A.E.; Zhang, D. Nitrogen rate and plant density effects on yield and late-season leaf senescence of cotton raised on a saline field. Field Crop. Res. 2012, 126, 137–144. [Google Scholar] [CrossRef]
- Su, W.; Kamran, M.; Xie, J.; Meng, X.; Han, Q.; Liu, T.; Han, J. Shoot and root traits of summer maize hybrid varieties with higher grain yields and higher nitrogen use efficiency at low nitrogen application rates. Peer J. 2019, 7, e7294. [Google Scholar] [CrossRef]
- Zhang, X.; Davidson, E.A.; Mauzerall, D.L.; Searchinger, T.D.; Dumas, P.; Shen, Y. Managing nitrogen for sustainable development. Nature 2015, 528, 51–59. [Google Scholar] [CrossRef] [PubMed] [Green Version]
- Kitonyo, O.M.; Sadras, V.O.; Zhou, Y.; Denton, M.D. Nitrogen supply and sink demand modulate the patterns of leaf senescence in maize. Field Crop. Res. 2018, 225, 92–103. [Google Scholar] [CrossRef] [Green Version]
- Luo, Z.; Liu, H.; Li, W.; Zhao, Q.; Dai, J.; Tian, L.; Dong, H. Effects of reduced nitrogen rate on cotton yield and nitrogen use efficiency as mediated by application mode or plant density. Field Crop. Res. 2018, 218, 150–157. [Google Scholar] [CrossRef]
- Shangguan, Z.; Shao, M.; Dyckmans, J. Effects of nitrogen nutrition and water deficit on net photosynthetic rate and chlorophyll fluorescence in winter wheat. J. Plant Physiol. 2000, 156, 46–51. [Google Scholar] [CrossRef]
Figure 1.
Location of experiment site in the Loess Plateau. The regional distribution of annual precipitation is shown in different colors on the map.
Figure 1.
Location of experiment site in the Loess Plateau. The regional distribution of annual precipitation is shown in different colors on the map.

Figure 2.
Precipitation distribution in the study area from 2009 to 2017, during the growth stage of winter wheat and the fallow season. PF, PS-J, PJ-A, and PA-M denote the precipitation during the fallow, sowing, anthesis, and maturity stages of wheat, respectively.
Figure 2.
Precipitation distribution in the study area from 2009 to 2017, during the growth stage of winter wheat and the fallow season. PF, PS-J, PJ-A, and PA-M denote the precipitation during the fallow, sowing, anthesis, and maturity stages of wheat, respectively.

Figure 3.
Illustration of sowing methods with row spacing (FS, furrow sowing; WS, wide-space sowing; DS, drill sowing), at different growth stages of wheat in the study area, Shanxi Wenxi, China.
Figure 3.
Illustration of sowing methods with row spacing (FS, furrow sowing; WS, wide-space sowing; DS, drill sowing), at different growth stages of wheat in the study area, Shanxi Wenxi, China.

Figure 4.
Correlation between soil water storage and sowing stage (y2 = FS, furrow sowing; y3 = WS, wide-space sowing; y1 = DS, drill sowing); * and ** indicate differences at the 0.05 and 0.01 probability levels, respectively. (A) Sowing stage soil water storage (B) Jointing stage soil water storage (C) Anthesis stages soil water storage (D) Maturity stages soil water storage.

Figure 5.
Correspondence between field water intake at different growth stages and yield using different sowing methods (y1 = DS, drill sowing; y2 = FS, furrow sowing; y3 = WS, wide-space sowing); (A) Jointing stage soil water storage, (B) Jointing stage- anthesis stages soil water storage, (C) Anthesis stages-maturity stages soil water storage; * and ** indicate differences at the 0.05 and 0.01 possibility levels, respectively.


Table 1.
Basic soil properties of the 0–20 cm layer in the study area from 2012–2017.
| Year | Organic Matter (g·kg−1) | Total N (g·kg−1) | Alkali-Hydrolysis N (mg·kg−1) | Available Phosphorus (mg·kg−1) |
|---|---|---|---|---|
| 2012–2013 | 8.63 | 0.71 | 32.89 | 15.73 |
| 2013–2014 | 9.18 | 0.70 | 39.32 | 16.62 |
| 2014–2015 | 9.55 | 0.68 | 37.65 | 17.64 |
| 2015–2016 | 8.54 | 0.67 | 32.79 | 19.23 |
| 2016–2017 | 9.62 | 0.69 | 32.22 | 15.28 |
| 2017–2018 | 8.07 | 0.69 | 33.42 | 16.26 |
Table 2.
Differences in yield components and WUE under DS, FS, and WS treatments.
| Sowing Methods | Tillers (104 ha−1) | Grain Number per Spike | 1000-Grain Weight (g) | Yield (t·ha−1) | Evapotranspiration (mm) | Water Use Efficiency (WUE; kg·h−1·mm−1) | Precipitation Use Efficiency (PUE; kg·h−1·mm−1) |
|---|---|---|---|---|---|---|---|
| 2009–2010 DS | 407.71 a | 20.38 c | 36.14 c | 2714.96 b | 311.98 c | 8.70 a | 8.10 b |
| 2012–2013 DS | 300.25 d | 20.37 c | 36.46 c | 2140.25 d | 310.17 c | 6.90 d | 6.24 d |
| 2012–2013 FS | 341.50 c | 22.29 b | 38.81 b | 2608.30 c | 354.10 b | 7.37 c | 7.61 c |
| 2012–2013 WS | 350.25 b | 23.17 a | 40.67 a | 2915.32 a | 362.43 a | 8.04 b | 8.50 a |
| Mean | 349.93 | 21.55 | 38.02 | 2594.71 | 334.67 | 7.75 | 7.61 |
| 2009–2010 FS | 427.18 c | 21.70 f | 39.04 c | 3639.82 f | 344.88 d | 10.55 f | 10.87 b |
| 2009–2010 WS | 453.72 b | 23.78 e | 42.08 a | 3923.57 c | 354.37 c | 11.07 e | 11.71 a |
| 2010–2011 DS | 401.04 e | 26.22 c | 40.51 b | 3705.67 e | 301.65 g | 12.28 a | 6.93 f |
| 2011–2012 DS | 485.50 a | 24.33 d | 35.44 d | 4155.60 b | 525.20 a | 7.91 g | 6.17 g |
| 2013–2014 DS | 386.65 f | 27.55 b | 39.12 c | 3866.73 d | 334.05 e | 11.58 c | 8.15 d |
| 2014–2015 DS | 417.00 d | 27.48 b | 39.14 c | 3956.22 c | 325.22 f | 12.16 b | 7.66 e |
| 2016–2017 DS | 452.12 b | 33.36 a | 35.66 d | 4274.00 a | 373.02 b | 11.46 d | 10.52 c |
| Mean | 431.89 | 26.35 | 38.71 | 3931.66 | 365.48 | 11.00 | 8.86 |
| 2010–2011 FS | 446.58 k | 28.24 g | 40.59 c,d | 4588.15 h | 340.81 j | 13.46 c | 8.58 i |
| 2010–2011 WS | 481.08 h | 28.38 f,g | 42.58 a | 4794.56 g | 361.01 i | 13.28 c | 8.97 h |
| 2011–2012 WS | 603.00 b | 26.56 h | 37.15 f | 5412.04 d | 549.04 b | 9.86 h | 8.04 k |
| 2011–2012 FS | 616.50 a | 26.74 h | 38.63 e | 5612.45 c | 575.02 a | 9.76 h | 8.34 j |
| 2013–2014 FS | 454.41 j | 28.31 f,g | 41.04 b,c | 4575.40 h | 379.48 f | 12.06 f | 9.65 f |
| 2013–2014 WS | 466.00 i | 29.63 e | 41.55 b | 4818.74 f,g | 409.82 c | 11.76 g | 10.16 e |
| 2014–2015 FS | 488.33 f,g | 28.79 f | 40.30 d | 4806.55 f,g | 380.16 f | 12.64 e | 9.30 g |
| 2014–2015 WS | 522.98 c | 29.72 e | 41.01 b,c | 4999.96 e | 391.54 e | 12.77 d,e | 9.68 f |
| 2015–2016 DS | 425.75 l | 34.78 d | 39.06 e | 4812.00 f,g | 371.90 h | 12.94 d | 12.44 c |
| 2015–2016 WS | 484.50 g,h | 36.23 b | 39.11 e | 5719.08 b | 396.09 d | 14.44 b | 14.79 b |
| 2015–2016 FS | 493.25 e,f | 37.80 a | 41.26 b | 6009.75 a | 408.60 c | 14.71 a | 15.54 a |
| 2016–2017 WS | 496.25 e | 35.57 c | 33.12 h | 4892.00 f | 390.33 e | 12.53 e | 12.04 d |
| 2016–2017 FS | 503.36 d | 35.54 c | 34.21 g | 5032.00 e | 376.52 g | 13.36 c | 12.38 c |
| Mean | 498.61 | 31.25 | 39.20 | 5082.51 | 410.02 | 12.58 | 10.76 |
| ANOVA | |||||||
| Sowing (S) | <0.001 | <0.001 | <0.001 | <0.001 | <0.001 | <0.001 | <0.001 |
| Year (Y) | <0.001 | <0.001 | <0.001 | <0.001 | <0.001 | <0.001 | <0.001 |
| S × Y | <0.001 | <0.001 | <0.001 | <0.001 | <0.001 | <0.001 | <0.001 |
Note: DS = drill sowing, FS = furrow Sowing, WS = wide-space sowing. Significant differences between different yield levels are indicated by different letters in the same treatment (p < 0.05).
Table 3.
Correlation between yield and components.
| Sowing Methods | Tillers | Number per Spike | 1000-Grain Weight | Simulation Equation |
|---|---|---|---|---|
| DS | 0.676 ** | 0.661 * | 0.634 * | Y = 5.694 × Y1 + 111.949 × Y3 − 3653.974, R2 = 0.999 |
| FS | 0.626 ** | 0.641 ** | −0.700 ** | Y = 4.558 × Y1 + 42.942 × Y2 + 831.857, R2 = 0.999 |
| WS | 0.540 ** | 0.375 * | −0.088 | Y = 8.836 × Y1 + 111.52 × Y2 + 93.9 × Y3 − 6489.48, R2 = 0.999 |
Note: DS = drill sowing, FS = furrow sowing, WS = wide-space sowing. * p < 0.05. ** p < 0.01.
Table 4.
Correlation between yield components and water source contribution.
| Sowing Methods | Yield Composition | Fallow Precipitation | Soil Water Consumption Sowing–Jointing | Precipitation Sowing–Jointing | Soil Water Consumption Jointing–Anthesis | Precipitation Jointing–Anthesis | Soil Water Consumption Anthesis–Maturity | Precipitation of Anthesis–Maturity | Simulation Equation |
|---|---|---|---|---|---|---|---|---|---|
| DS | Tillers | 0.869 ** | 0.951 ** | 0.869 ** | −0.698 ** | 0.869 ** | −0.199 | −0.869 ** | Y1 = 1.345 × X6 − 2.108 × X7 + 489.556, R2 = 0.999 |
| Grain number per ear | −0.551 * | −0.338 | −0.551 * | 0.765 ** | −0.551 * | 0.949 ** | 0.551 * | Y2 = 0.064 × X6 + 19.014, R2 = 0.999 | |
| 1000-grain weight | −0.585 * | −0.370 | −0.585 * | 0.779 ** | −0.585 * | 0.944 ** | 0.585 * | Y3 = 0.097 × X6 + 34.21, R2 = 0.999 | |
| FS | Tillers | 0.012 | −0.033 | 0.812 ** | 0.665 ** | −0.611 ** | 0.939 ** | −0.483 * | Y1 = 0.267 × X4 + 1.513 × X6 + 326.621, R2 = 0.999 |
| Grain number per ear | −0.112 | −0.785 ** | 0.368 | 0.242 | 0.120 | −0.167 | 0.069 | Y2 = 0.01 × X1 − 0.097 × X2 − 0.1 × X6 − 0.131 × X7 + 38.279, R2 = 0.999 | |
| 1000-grain weight | −0.212 | 0.360 | −0.869 ** | −0.730 ** | 0.259 | −0.470 * | 0.356 | Y3 = −0.058 × X3 + 0.051 × X6 + 41.543, R2 = 0.98 | |
| WS | Tillers | 0.345 * | 0.630 ** | 0.819 ** | 0.524 ** | 0.629 ** | −0.482 ** | −0.559 ** | Y1 = 0.375 × X1 + 0.97 × X3 + 0.732 × X5 + 355.131, R2 = 0.999 |
| Grain number per ear | −0.872 ** | −0.099 | −0.478 ** | −0.949 ** | 0.311 * | 0.253 | 0.695 ** | Y2 = 0.053 × X3 − 0.039 × X4 − 0.021 × X5 − 0.077 × X6 + 44.642, R2 = 0.99 | |
| 1000-grain weight | 0.605 ** | −0.708 ** | −0.211 | 0.269 * | −0.822 ** | 0.451 ** | 0.160 | Y3 = 0.017 × X1 + 0.061 × X3 − 0.051 × X5 + 0.051 × X7 + 37.26, R2 = 0.999 |
Note: DS = drill sowing, FS = furrow sowing, WS = wide-space sowing. * p < 0.05. ** p < 0.01.
Publisher’s Note: MDPI stays neutral with regard to jurisdictional claims in published maps and institutional affiliations. |
© 2022 by the authors. Licensee MDPI, Basel, Switzerland. This article is an open access article distributed under the terms and conditions of the Creative Commons Attribution (CC BY) license (https://creativecommons.org/licenses/by/4.0/).
Share and Cite
MDPI and ACS Style
Noor, H.; Sun, M.; Lin, W.; Gao, Z. Effect of Different Sowing Methods on Water Use Efficiency and Grain Yield of Wheat in the Loess Plateau, China. Water 2022, 14, 577. https://doi.org/10.3390/w14040577
AMA Style
Noor H, Sun M, Lin W, Gao Z. Effect of Different Sowing Methods on Water Use Efficiency and Grain Yield of Wheat in the Loess Plateau, China. Water. 2022; 14(4):577. https://doi.org/10.3390/w14040577
Chicago/Turabian StyleNoor, Hafeez, Min Sun, Wen Lin, and Zhiqiang Gao. 2022. "Effect of Different Sowing Methods on Water Use Efficiency and Grain Yield of Wheat in the Loess Plateau, China" Water 14, no. 4: 577. https://doi.org/10.3390/w14040577
Note that from the first issue of 2016, this journal uses article numbers instead of page numbers. See further details here.