Article

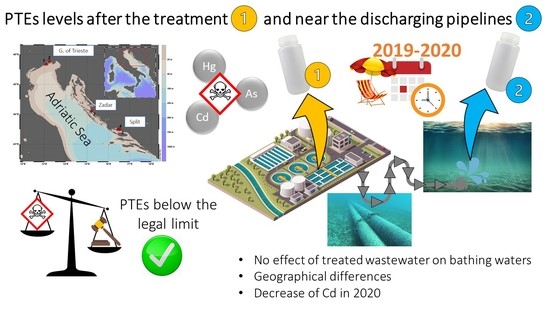
Dissolved Potentially Toxic Elements (PTEs) in Relation to Depuration Plant Outflows in Adriatic Coastal Waters: A Two Year Monitoring Survey

1
Department of Life and Environmental Sciences, Università Politecnica delle Marche, Via Brecce Bianche, 60131 Ancona, Italy
2
Department of Agricultural, Food, Environmental and Animal Sciences (Di4A), University of Udine, Via Sondrio 2/A, 33100 Udine, Italy
3
Oceanography Division, National Institute of Oceanography and Applied Geophysics—OGS, Via A. Piccard, 54, 34151 Trieste, Italy
4
Department of Health Ecology, Institute of Public Health, Kolovare 2, 23000 Zadar, Croatia
*
Authors to whom correspondence should be addressed.
Water 2022, 14(4), 569; https://doi.org/10.3390/w14040569
Submission received: 21 January 2022 / Revised: 4 February 2022 / Accepted: 11 February 2022 / Published: 14 February 2022

Abstract

:
The Adriatic Sea is vulnerable to pollution due to its low bathymetry, intense industrial activity, and tourism. In this context, a good depuration plant activity could play a key role for the maintenance of a good environmental quality. In the framework of the AdSWiM project, “Managed use of treated urban wastewater for the quality of the Adriatic Sea”, a study on dissolved potentially toxic element (PTE) levels was carried out to assess the impact of treated urban wastewaters on the quality of the bathing waters in the Adriatic Sea during the 2019 and 2020 summer period. In the present study, three areas along the Italian–Croatian coastline (Gulf of Trieste, Zadar, and Split) were identified for the monitoring of five depuration plant (DP) outflows. Water samples were collected after the treatment inside the DPs, and coastal seawater was sampled in the proximity of the discharging pipelines. Dissolved Hg, Cd, and As levels were determined with an atomic fluorescence spectrometer. Results did not show statistically significant differences between treated wastewater and seawater samples (Hg 10 ± 6 and 10 ± 4, Cd 14 ± 6 and 21 ± 8, As 610 ± 176 and 687 ± 140 ng L−1, respectively), while the geographical area and the seasonality affected the PTE concentration. Furthermore, the levels detected were lower than the European and national limits, indicating a good environmental status of the northern Adriatic Sea waters. The determination of further parameters (nutrients, microbiological indicators) must be investigated to identify possible synergistic effects. However, our results demonstrate the efficiency of DPs investigated, underlining the importance of the wastewater treatment for the protection of the Adriatic Sea.

Graphical Abstract

1. Introduction

Profitable and rational management of water resources is crucial for maintaining excellent environmental quality. Currently, the main problem lies in the treatment of wastewater from various human activities, from industry (such as metallurgical, mining, chemical, tannery, battery, and nuclear), agriculture, shipping, and household sewage, since inadequately or not fully treated waste can lead to the occurrence of pollution events. Indeed, sewage effluents can contain potentially hazardous levels of pathogens, hydrocarbons, nutrients, toxins, organic and inorganic compounds, and endocrine disruptors [1,2,3].
Among these environmental pollutants, potentially toxic elements (PTEs), such as mercury (Hg), cadmium (Cd), lead (Pb), arsenic (As), nickel (Ni), and chromium (Cr), are recognized as being among the most dangerous contaminants for the environment, the biota, and human health. PTEs have natural (e.g., crustal erosion, volcanic activity) and/or anthropic (e.g., industrial activity, mining) origins and can be transferred to different environmental compartments through soil washout, river runoff, or atmospheric transport [4,5,6].
PTEs’ mechanism of action in organisms varies with the type of element [7], but it often occurs together with bioaccumulation or biomagnification phenomena (e.g., mercury in the form of methylmercury) within biological tissues, resulting in acute or chronic toxicity [8,9]. Examples of PTEs effects are damage on the central nervous, cardiovascular, and gastrointestinal systems; lungs; kidneys; liver; endocrine glands; and bones, which can also occur after exposure at small concentrations [10].
Depuration plants (DPs) apply different technologies for the reduction of PTEs in wastewater. The main ones include physicochemical (chemical precipitation, ion exchange, and reverse osmosis), phytoremediation (phytodegradation, phytoextraction, phytostimulation, rhizofiltration, phytovolatilization, and phytostabilization), or microbial remediation processes [11,12]. Recent studies have shown that, if properly treated with PTE removal mechanisms, wastewater not only can be released into seawater without any environmental damage, but it can also become a resource, for example, in agriculture [13] or aquaculture [14].
Achieving a good water quality through direct actions and continuous monitoring has long become a priority for the European Union, which through the Marine Strategy Framework Directive (MSFD), Descriptors 8 and 9 [15], establishes limit values for concentrations of PTEs in sediments, biota, and seawater, in order to achieve good environmental status (GES).
Moreover, the Member States, through national legislation set limit values for the concentrations of PTEs present in the wastewater outflow, applying different thresholds on the basis of the receiving water body [16].
The Mediterranean Sea is particularly vulnerable to contamination phenomena due to the anthropogenic pressure of the numerous cities and industrial areas that surround it [17,18,19]. In particular, the Adriatic Sea is considered further vulnerable to contamination due to its semi-enclosed morphological structure, low bathymetry, and high river inputs. Moreover, several studies have reported that the sea zones close to the wastewater outfall pipelines are particularly sensitive and vulnerable to pollution such as high concentrations of nutrients, fecal indicator bacteria (FIB), and pharmaceutically active compounds [20,21,22,23,24,25].
Although numerous studies have been carried out on the levels of PTEs in Adriatic biota and sediments [26,27,28,29], few papers taking into consideration the levels of those contaminants in seawater have been published [30,31,32,33], and only one among them evaluated the effect of DPs in this area [34].
However, it has been demonstrated that the waters next to the discharge pipes of DPs can be used for bathing during the summer period, but the chemical, physical, and microbiological parameters must be constantly monitored [35].
This study has been conceived in the framework of the AdSWiM project “Managed use of treated urban wastewater for the quality of the Adriatic Sea” [36], with the aim of (1) determining the levels of dissolved Hg, Cd, and As, since they are recognized as priority substances by MSFD (Annex I, Part A) in three different areas in order to evaluate the quality status of the Adriatic Sea coastal waters during the 2019–2020 bathing seasons; (2) assessing for the first time the impact of five different DPs outflows in the quality of the waters; and (3) evaluating geographical and seasonal trends of PTE levels.

2. Materials and Methods

2.1. Study Area and Sampling Methodology

The Adriatic Sea extends in a northwest–southeast direction and is located between the Italian peninsula and the Balkans. The seabed of the northern zone has average bathymetry levels of 35 m, the middle Adriatic of 140 m, while the southern zone exceeds 1200 m [37]. The exchanges of water between the Adriatic basin and the Mediterranean Sea take place through the channel of Otranto. Fluvial inputs are particularly important in the northern area and influence its circulation. Runoff phenomena are also important and make the Adriatic basin a dilution basin, since the freshwater gain is about 1 m, as evaporation and precipitation almost compensate each other [38].
Five sampling stations in three different geographical areas along the Italian–Croatian coastline in the Adriatic Sea were identified (as partners of the AdSWiM project [23,36]), and for each site, two samples were collected: one sampled directly from DP outflow (after the treatment), and one collected in the coastal area, next to the DP discharging pipelines. Figure 1 shows the sampling stations: Gulf of Trieste (Lignano Sabbiadoro and San Giorgio di Nogaro DPs), Zadar (Zadar Upov Centar DP), and Split (Katalinića brig and Stupe DPs). Table 1 provides information about each DP.
In the Gulf of Trieste, samples were collected monthly during the bathing season, from April to October, in 2019 and 2020 (Table 2), according to the Italian legislation for seawater environmental quality monitoring [39]. Concerning Croatian sites, a similar sampling strategy was adopted in 2020, whereas in 2019, only a few samples were collected, due to logistical constraints (Table 2).
Before collecting water samples at sea, we obtained depth profiles of temperature, salinity, pH, turbidity, and oxygen by means of a CTD Idromar APWIN IP041D (Italian sites) and an SBE 25 Sealogger CTD Sea-Bird Electronics (Croatian sites). Seawater samples were collected with a 2 L Ruttner bottle at Italian sites, and PWS 5-L Niskin bottles Hydro-Bios at Croatian sites. Samples were collected at the bottom (between 13 and 14 m) in the Gulf of Trieste, whereas at Croatian stations, samples were collected both in surface (0.5 m) and bottom (from 34 to 42 m) waters. Aliquots destined to be analyzed for PTEs were collected into 0.5 L HDPE bottles previously decontaminated with a specific acid-cleaning procedure described in Illuminati et al. [32] and stored at −20 °C until further analyses.

2.2. PTE Analyses

The analytical determination procedure applied was the same as that described in the study by Truzzi et al. [40]. All the analytical steps were carried out in a clean room laboratory ISO 14644-1 Class 6, with areas at ISO Class 5 under laminar flow. As for sampling bottles, the same acid-cleaning procedure was performed for all the laboratory materials. Reagents were weighted using the analytical balance AT261 Mettler Toledo (Greifensee, Switzerland, readability 0.01 mg, repeatability SD = 0.015 mg). Variable volume micropipettes and neutral tips were from Brand (Transferpette, Wertheim, Germany). Ultrapure water was produced from a Milli-Q water system from Merck Millipore (Darmstadt, Germany). H4BNa (≥98.0%) was from Sigma-Aldrich; NaOH (99.99%, metal basis) was from Alfa Aesar (Thermo Fisher, Kandel, Germany); CoCl2 (97%) was from Acros Organics (Thermo Fisher, Kandel, Germany); and ascorbic acid (RPE grade), KI (RPE grade), CH4N2S (RPE grade), and HCl (32.35% RS ultrapure grade) were from Carlo Erba (Milan, Italy). The 0.45 µm mixed cellulose esters filters (47 mm diam,) were from ChemBio (Camerino, Italy). SLEW-3, NASS-6 (NRC CNRC, Ottawa, ON, Canada), and Trace Metals 1 in Seawater (QC3163, Sigma-Aldrich) were used as certified reference materials. Samples were filtered through decontaminated 0.45 µm mixed esters of cellulose filters and acidified with ultrapure grade HCl 2% (v/v). Analyses were carried out with an atomic fluorescence spectrometer (AFS) Titan 8220 (Fulltech Instruments, Rome, Italy). Argon 5.0 (99.999% purity) was used as a gas carrier. Reductant agents to produce metals hydrides were H4BNa 0.05% in NaOH 0.4% (m/v) for Hg determination; H4BNa 4.0% in NaOH 0.4%, CH4N2S 1.0% (m/v), and CoCl2 1.0 µg mL−1 for Cd determination; and H4BNa 2% in NaOH 0.5% (m/v) for As determination. For As analyses, samples were added with HCl 10% (v/v), 1% KI (m/v), and 0.5% ascorbic acid (m/v) and analyzed after 1 h. AFS instrumental parameters are reported in Table S1. Table S2 shows the instrumental limit of detection (LOD, based on 3σ, n = 10) and the limit of quantification (LOQ, based on 10σ) [41] and the quality control analyses.

2.3. Statistical Analysis

Data are expressed as arithmetic mean ± standard deviation (SD) of the performed replications (n = 3). Statistical analyses were performed using the analysis of variance (one-way ANOVA), followed by the multiple range test, after testing the homogeneity of the variance with Levene’s test. In case the data did not show a homogeneous variance, the Kolmogorov–Smirnov non-parametric test (for comparison between two groups) or the Kruskal–Wallis test (for comparison between three or more groups) was applied. Significant differences were evaluated at the 95% confidence level.
To identify which sampling sites were most similar, we applied a cluster analysis, taking into consideration the PTE annual mean levels recorded. The clustering method used was the nearest neighbor (single linkage), while the distance was expressed as squared Euclidean [42].
Experimental data were elaborated also by principal component analysis (PCA), which was carried out on standardized data; significant components were obtained through the Wold cross-validation procedure [43].
Additionally, to interpret mutual correlations among the concentrations of PTEs and CTD parameters, we performed a site-specific bivariate correlation analysis characterized by Pearson product-moment correlation matrix.
Statistical analyses were performed using Statgraphics 19 (Statgraphics Technologies Inc., The Plains, VA, USA).

3. Results

3.1. Physico-Chemical Parameters

Temperature (°C), salinity, turbidity, and dissolved oxygen seasonal trends are reported in Figure S1. The two stations located in the Gulf of Trieste showed similar temperature trends. Maximum values were reached in June 2019 (27.8 °C) and July 2020 (26.9 °C) in surface waters, while bottom waters showed the highest values in August 2019 (23.5 °C) and September 2020 (24.8 °C). Salinity in bottom water varied between 35.6 and 37.9, while in surface water, a minimum was recorded in May 2019 (26.2) and May 2020 (26.2). The dissolved oxygen was similar in 2019, while in 2020, bottom water showed lower values in both sites. Turbidity was recorded from 0.8 to 5.1 NTU with a similar trend both in surface and bottom water, but with higher values in bottom waters.
In Zadar, the maximum surface temperature was reached in July 2019 (24.7 °C) and August 2020 (24.9 °C), while in bottom waters, it ranged between 12.6 and 18.0 °C. The salinity was stable at 38.0. The dissolved oxygen varied from 7.1 to 9.1 mg L−1, while the turbidity was always lower than 1.1 NTU.
As for the Gulf of Trieste, in Slipt sampling stations, temperature trend was similar in the site of Katalinića brig and Stupe, with summer temperature maximum values of 24.7 and 23.6 °C (surface) and 15.7 and 16.5 °C (bottom) during 2019 and 2020, respectively. Salinity was stable in bottom water (38.6 ± 0.3), while on the surface, it varied from 36.7 (February 2019) to 38.6 (September 2020). Dissolved oxygen ranged between 7.3 and 9.12 mg L−1, while the turbidity was lower than 1.3 NTU.

3.2. PTEs Levels in DPs and Seawater

Dissolved concentrations of As, Cd, and Hg, expressed as mean ± SD (ng L−1), are shown in Table 3.
In the Gulf of Trieste, dissolved Hg ranged from a minimum of 4 (April 2020, San Giorgio di Nogaro sea) to a maximum of 30 (August 2019, San Giorgio di Nogaro DP) ng L−1 with no statistically significant difference (p > 0.05), neither between the overall mean levels of the two years (2019, 16 ± 7 ng L−1; 2020, 14 ± 6 ng L−1) nor between DP and sea (15 ± 8 and 15 ± 5 ng L−1, respectively). Concerning the differences between DPs, average higher concentrations were found in San Giorgio di Nogaro (17 ± 8 ng L−1) compared to Lignano Sabbiadoro (13 ± 7 ng L−1), while the seawater samples showed similar values (15 ± 5 and 15 ± 6 ng L−1). Cd lower levels were recorded in April (Lignano Sabbiadoro and San Giorgio di Nogaro DP) and May 2020 (San Giorgio di Nogaro DP), with a value below the LOD (0.5 ng L−1), while the maximum concentration was 98 ± 4 ng L−1, recorded in Lignano Sabbiadoro Sea during April 2019. The difference between the mean concentration in 2019 (30 ± 22 ng L−1) and 2020 (12 ± 10 ng L−1) was statistically significant (p = 0.0012). DP showed a general lower mean concentration with respect to seawater samples (16 ± 11 against 35 ± 26 ng L−1 in Lignano Sabbiadoro and 7 ± 8 against 24 ± 13 ng L−1 in San Giorgio di Nogaro, respectively). However, the differences between the two sites were not statistically significant (p < 0.05). As content ranged from < LOD (13 ng L−1) in San Giorgio di Nogaro DP during October 2019, April, May, and July 2020 to 1542 ± 18 ng L−1 in Lignano Sabbiadoro DP (April 2019). Statistically higher (p = 0.0011) concentrations were evidenced in 2019 (748 ± 486 ng L−1) compared to 2020 (217 ± 192 ng L−1). The mean content of As in Lignano Sabbiadoro DP was 763 ± 538 ng L−1, significantly higher than San Giorgio di Nogaro DP (62 ± 51 ng L−1), while in seawater, the concentration in the two sites was similar (511 ± 392 and 498 ± 339 ng L−1).
In the Zadar area, Hg lowest levels were found in April and June 2020, with values below the limit of detection (0.6 ng L−1), while the highest concentration was recorded in surface seawater during August 2020 (19 ± 2 ng L−1). There was no statistically significant difference (p > 0.05) between the years, but a higher mean level was recorded in 2019 (10 ± 3 ng L−1) than in 2020 (7 ± 6 ng L−1). The order of concentration in relation to the type of sample was DP (7 ± 5 ng L−1) < sea surface (8 ± 6 ng L−1) < sea bottom (9 ± 6 ng L−1). Cd level ranged between < LOD (0.5 ng L−1) in all DP samples of 2020 and 33 ± 3 ng L−1 in surface seawater during April 2019. Samples collected in 2019 showed a statistically significant higher (p = 0.0001) content than the samples of 2020 (23 ± 6 and 2 ± 2 ng L−1, respectively). DP samples presented a lower mean Cd concentration (5 ± 8 ng L−1) than seawater ones (12 ± 12 ng L−1 and 9 ± 11 ng L−1, in surface and bottom, respectively). As content ranged from 182 ± 78 ng L−1 in DP during September 2019 to 1258 ± 30 ng L−1 in surface water during June 2020. A statistically significant lower concentration (p = 0.0014) was recorded in 2019 (555 ± 244 ng L−1) than in 2020 (910 ± 228 ng L−1). The order of concentration in relation to the type of sample was DP (732 ± 341 ng L−1) < sea bottom (805 ± 318 ng L−1) < sea surface (858 ± 195 ng L−1).
In the Split area, Hg ranged from < LOD (0.6 ng L−1) in Stupe DP during April and September 2020 to 19 ± 1 ng L−1 in Katalinića brig bottom water during April 2020. There was not a statistically significant difference (p > 0.05) neither between the two sampling years (5 ± 2 ng L−1 and 7 ± 4 ng L−1, respectively) nor between Katalinića brig DP (5 ± 3 ng L−1) and Stupe DP (5 ± 4 ng L−1). Bottom water samples showed a higher content compared to the surface ones (8 ± 5 against 5 ± 2 ng L−1 in Katalinića brig and 9 ± 5 against 8 ± 3 ng L−1 in Stupe). A statistically significant reduction (p = 0.0001) of Cd was evidenced in 2020, with a mean value of 6 ± 5 compared to 34 ± 4 ng L−1 of 2019. However, the mean level of different stations was similar (12 ± 10, 10 ± 13, and 12 ± 11 ng L−1 in Katalinića brig DP, surface, and bottom water and 14 ± 8, 10 ± 14, 6 ± 10 ng L−1 in Stupe DP, surface, and bottom water, respectively). Concerning As, the lowest value (169 ± 1 ng L−1) was recorded in Katalinića brig bottom water during July 2019, while the maximum (2126 ± 43 ng L−1) was recorded in Stupe DP in July 2020. A statistically significant difference (p = 0.0108) was found between 2019 and 2020 mean levels (605 ± 248 ng L−1 and 929 ± 279 ng L−1, respectively). In the Stupe sampling station, the mean level was higher with respect to Katalinića brig (1111 ± 511, 1071 ± 197, and 894 ± 109 ng L−1 in Stupe DP, water surface, and bottom and 756 ± 263, 898 ± 123, 740 ± 308 ng L−1 in Katalinića brig DP, water surface, and bottom, respectively).

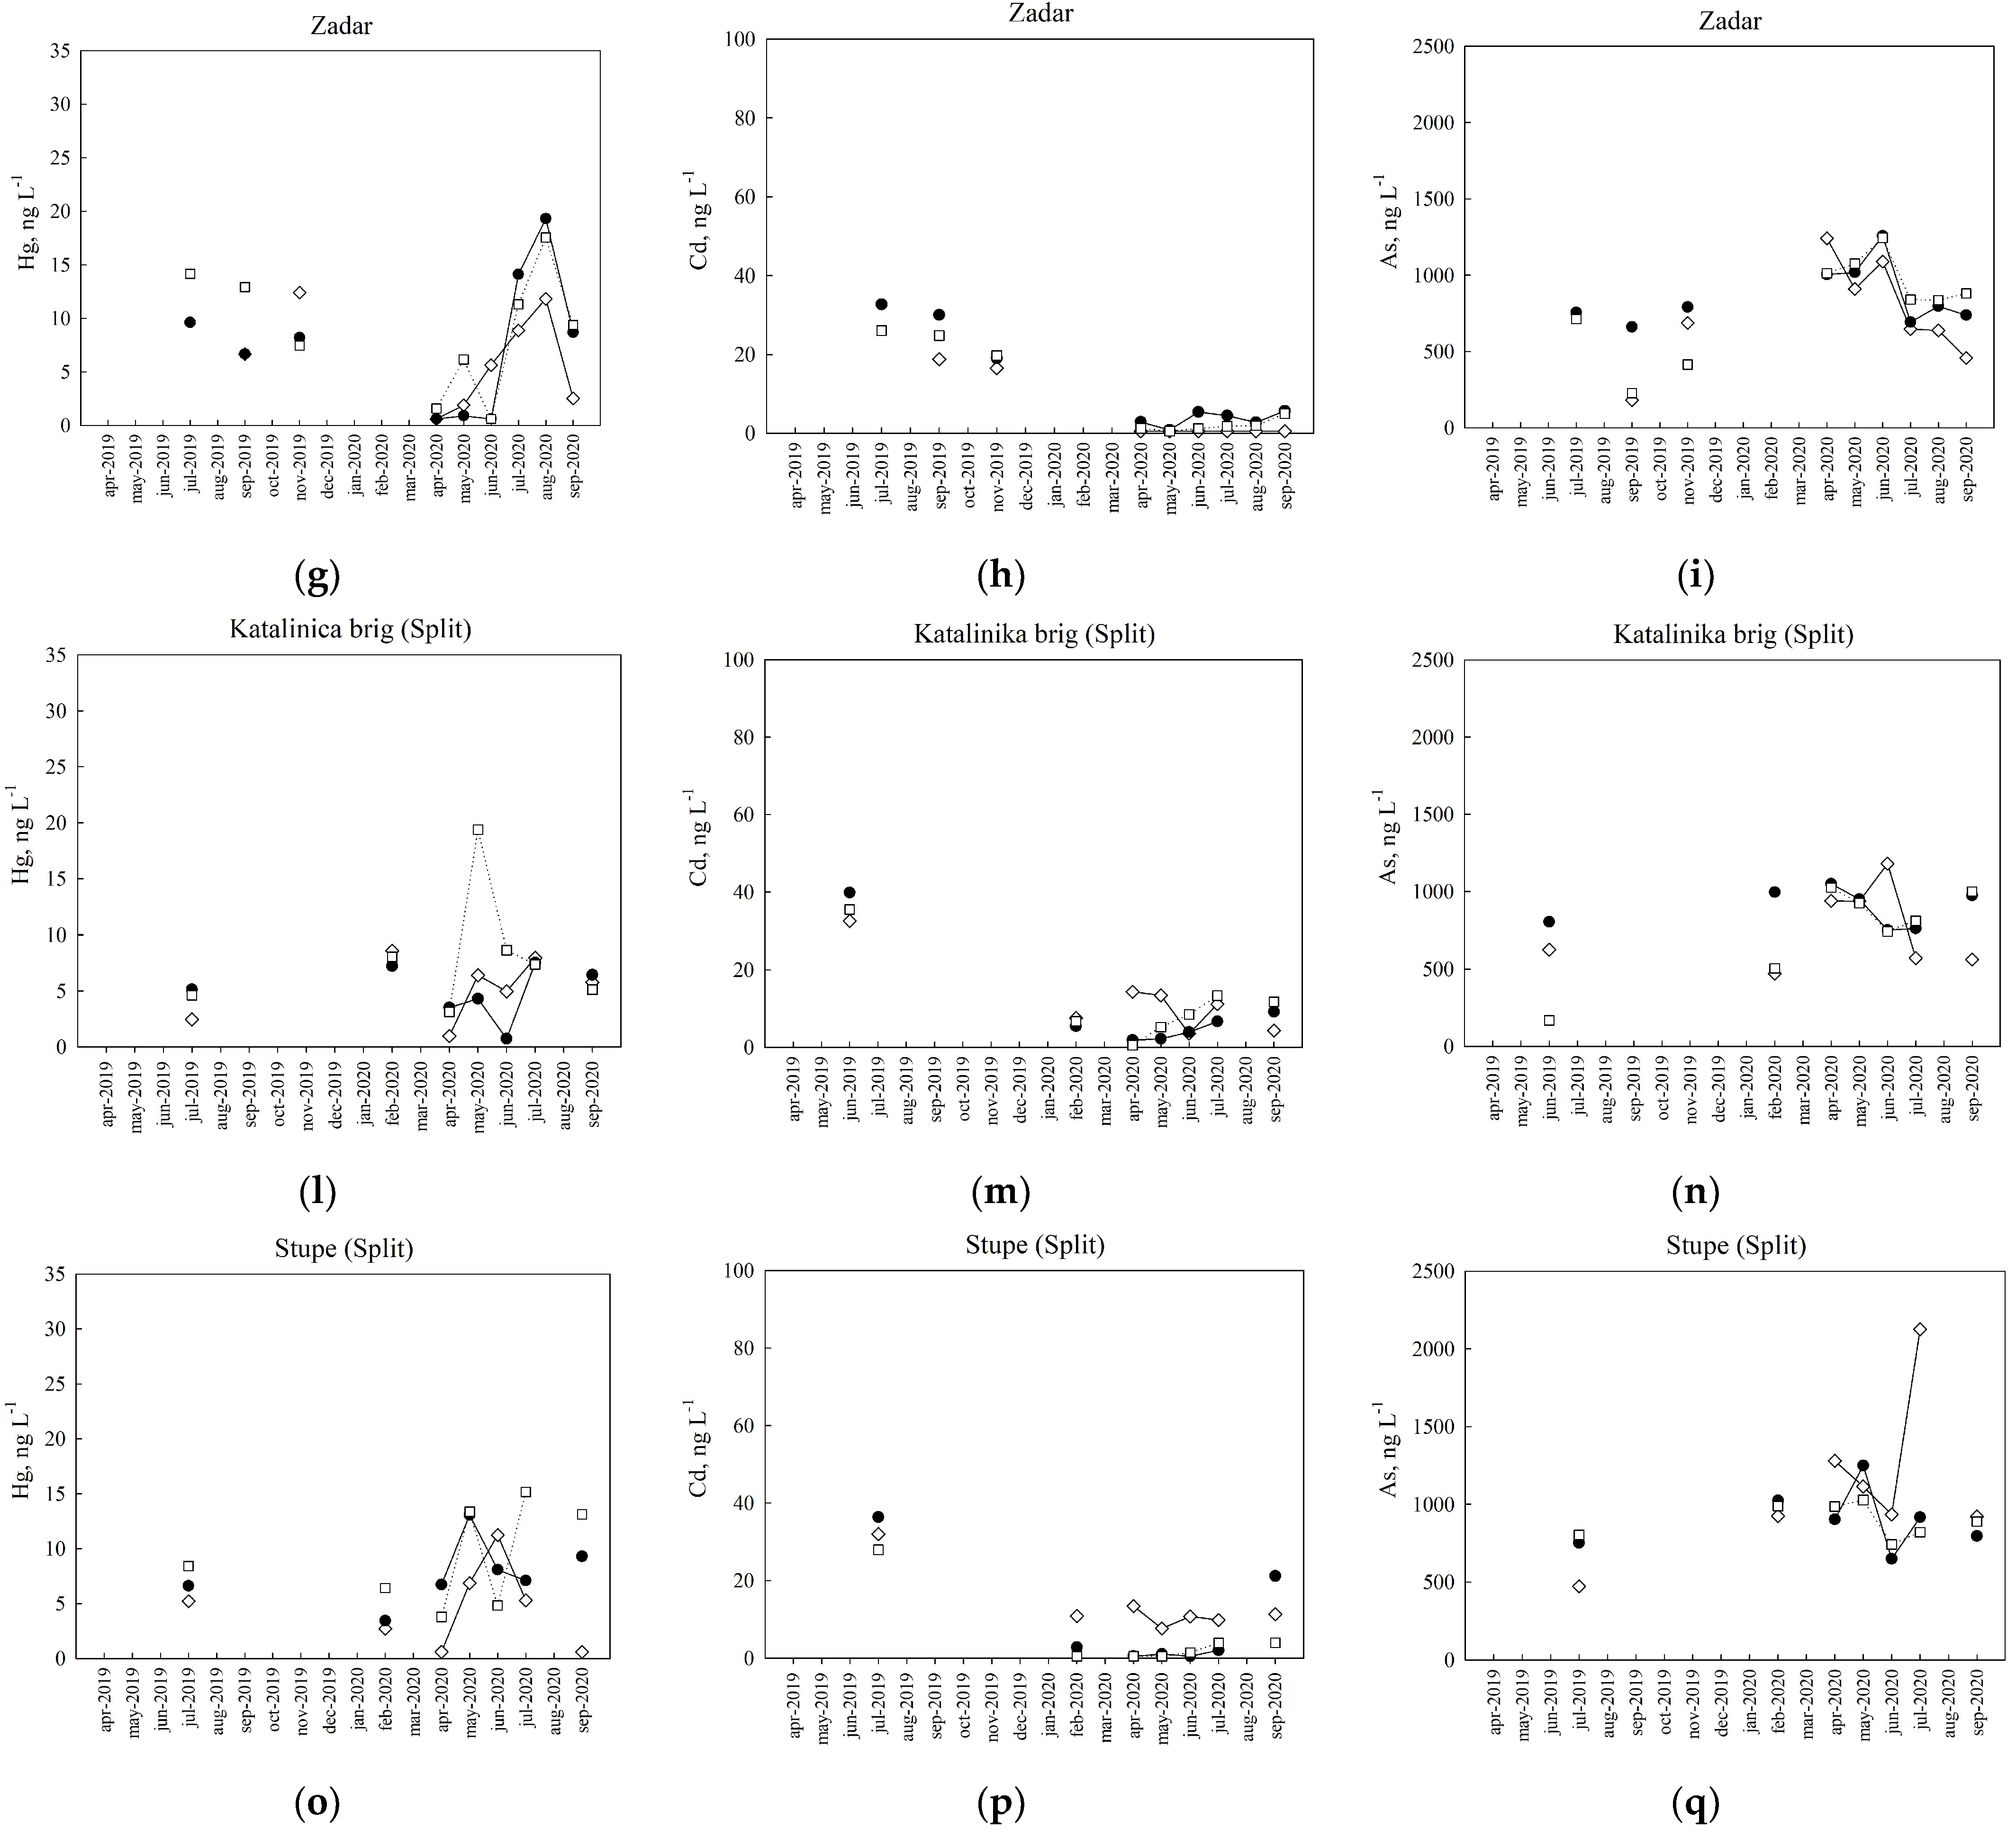
3.3. PTE Seasonal Trend

Figure 2 shows the evolution of dissolved PTEs in different sampling stations, from April 2019 to October 2020.
The Gulf of Trieste (Figure 2a,d) showed the maximum Hg value in mid-Summer 2019 (between July and August) and the last months of 2020. The dissolved Hg trend showed a similar pattern for DP and sea stations. In Zadar (Figure 2g), Hg content remained constant during 2019, decreased at the beginning of Summer 2020, and then reached the peak during August 2020. A similar situation occurred in Split (Figure 2l,o), where a minimum was recorded just before the beginning of Summer 2020 (April), and an increase occurred between May and July 2020. Considering depth, differences were evident only in Katalinića brig during the beginning of summer season and in Stupe at the end of it, with higher concentration recorded in bottom water (Figure 2l,o).
A particular trend was noticed for dissolved Cd, as a strong decrease occurred in all the sampling stations from 2019 to 2020. In particular, in the second sampling year, in the Gulf of Trieste and Zadar (Figure 2b,e,h), DP sites showed in most cases lower concentration than the seawater sample. The site of San Giorgio di Nogaro DP and Zadar DP (Figure 2e,h) often showed values below the LOD (0.5 ng L−1). In Split sites (Figure 2m,p), the seasonal trend was similar in DP and sea, except in the period between February and May 2020, where a clear decrease in Cd concentration was recorded both in surface and bottom seawater.
The levels of dissolved As recorded in the Gulf of Trieste (Figure 2c,f) were higher in 2019 compared to 2020, except for the site of San Giorgio di Nogaro DP, which showed very low values during all the two years (Figure 2f). No particular trend was noticed in this area. In Zadar and Split (Figure 2i,n,q), the trend was similar, with higher concentration recorded during March and May 2020, except for DP of Stupe, which reached the maximum level recorded in July 2020 (Figure 2q).

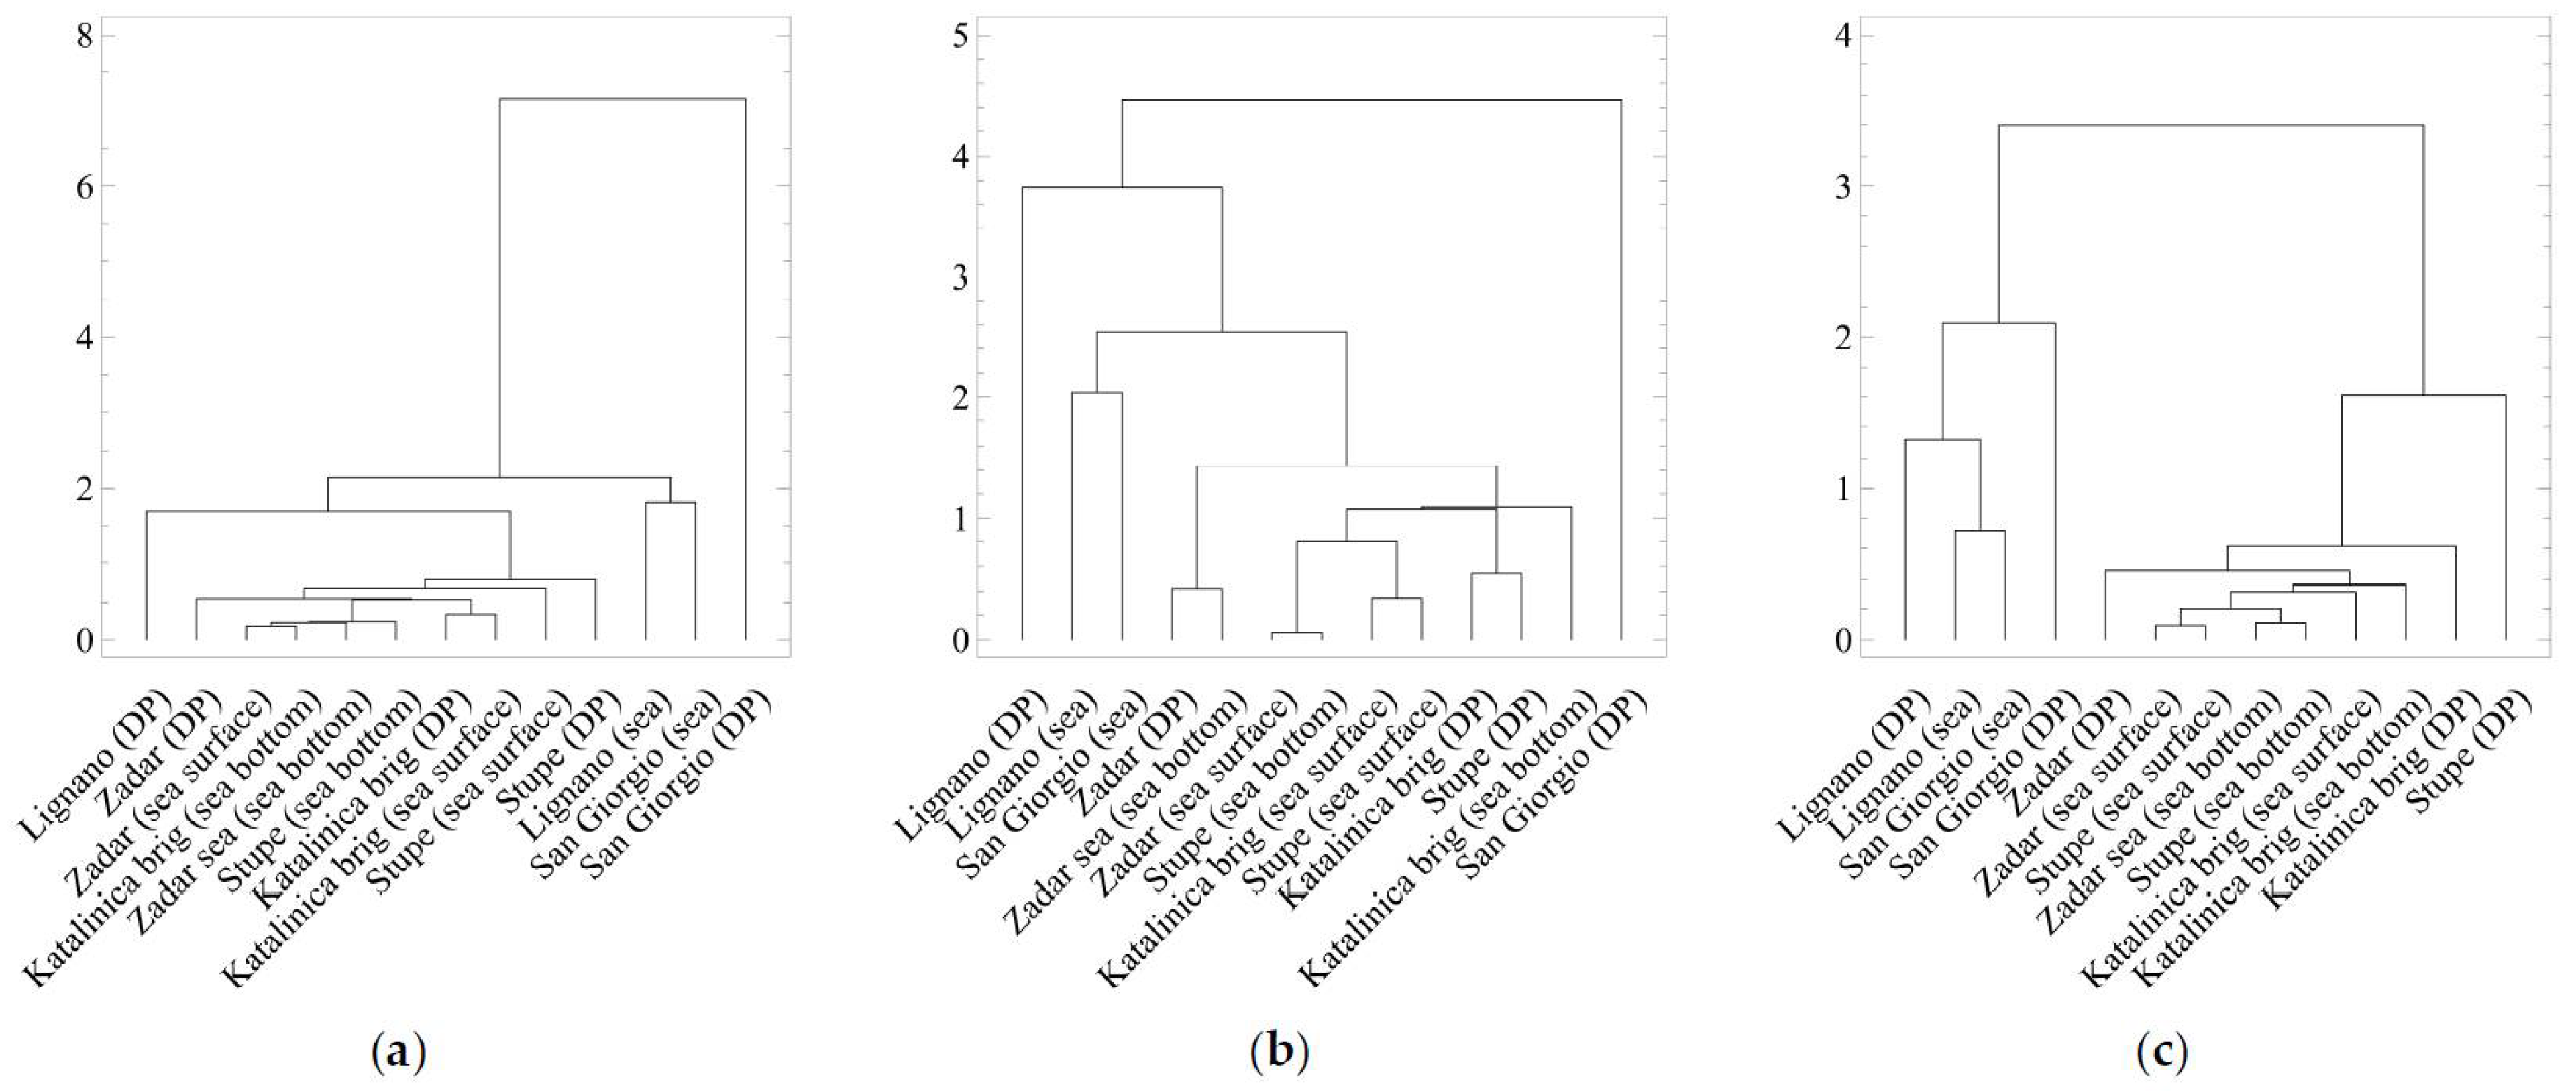
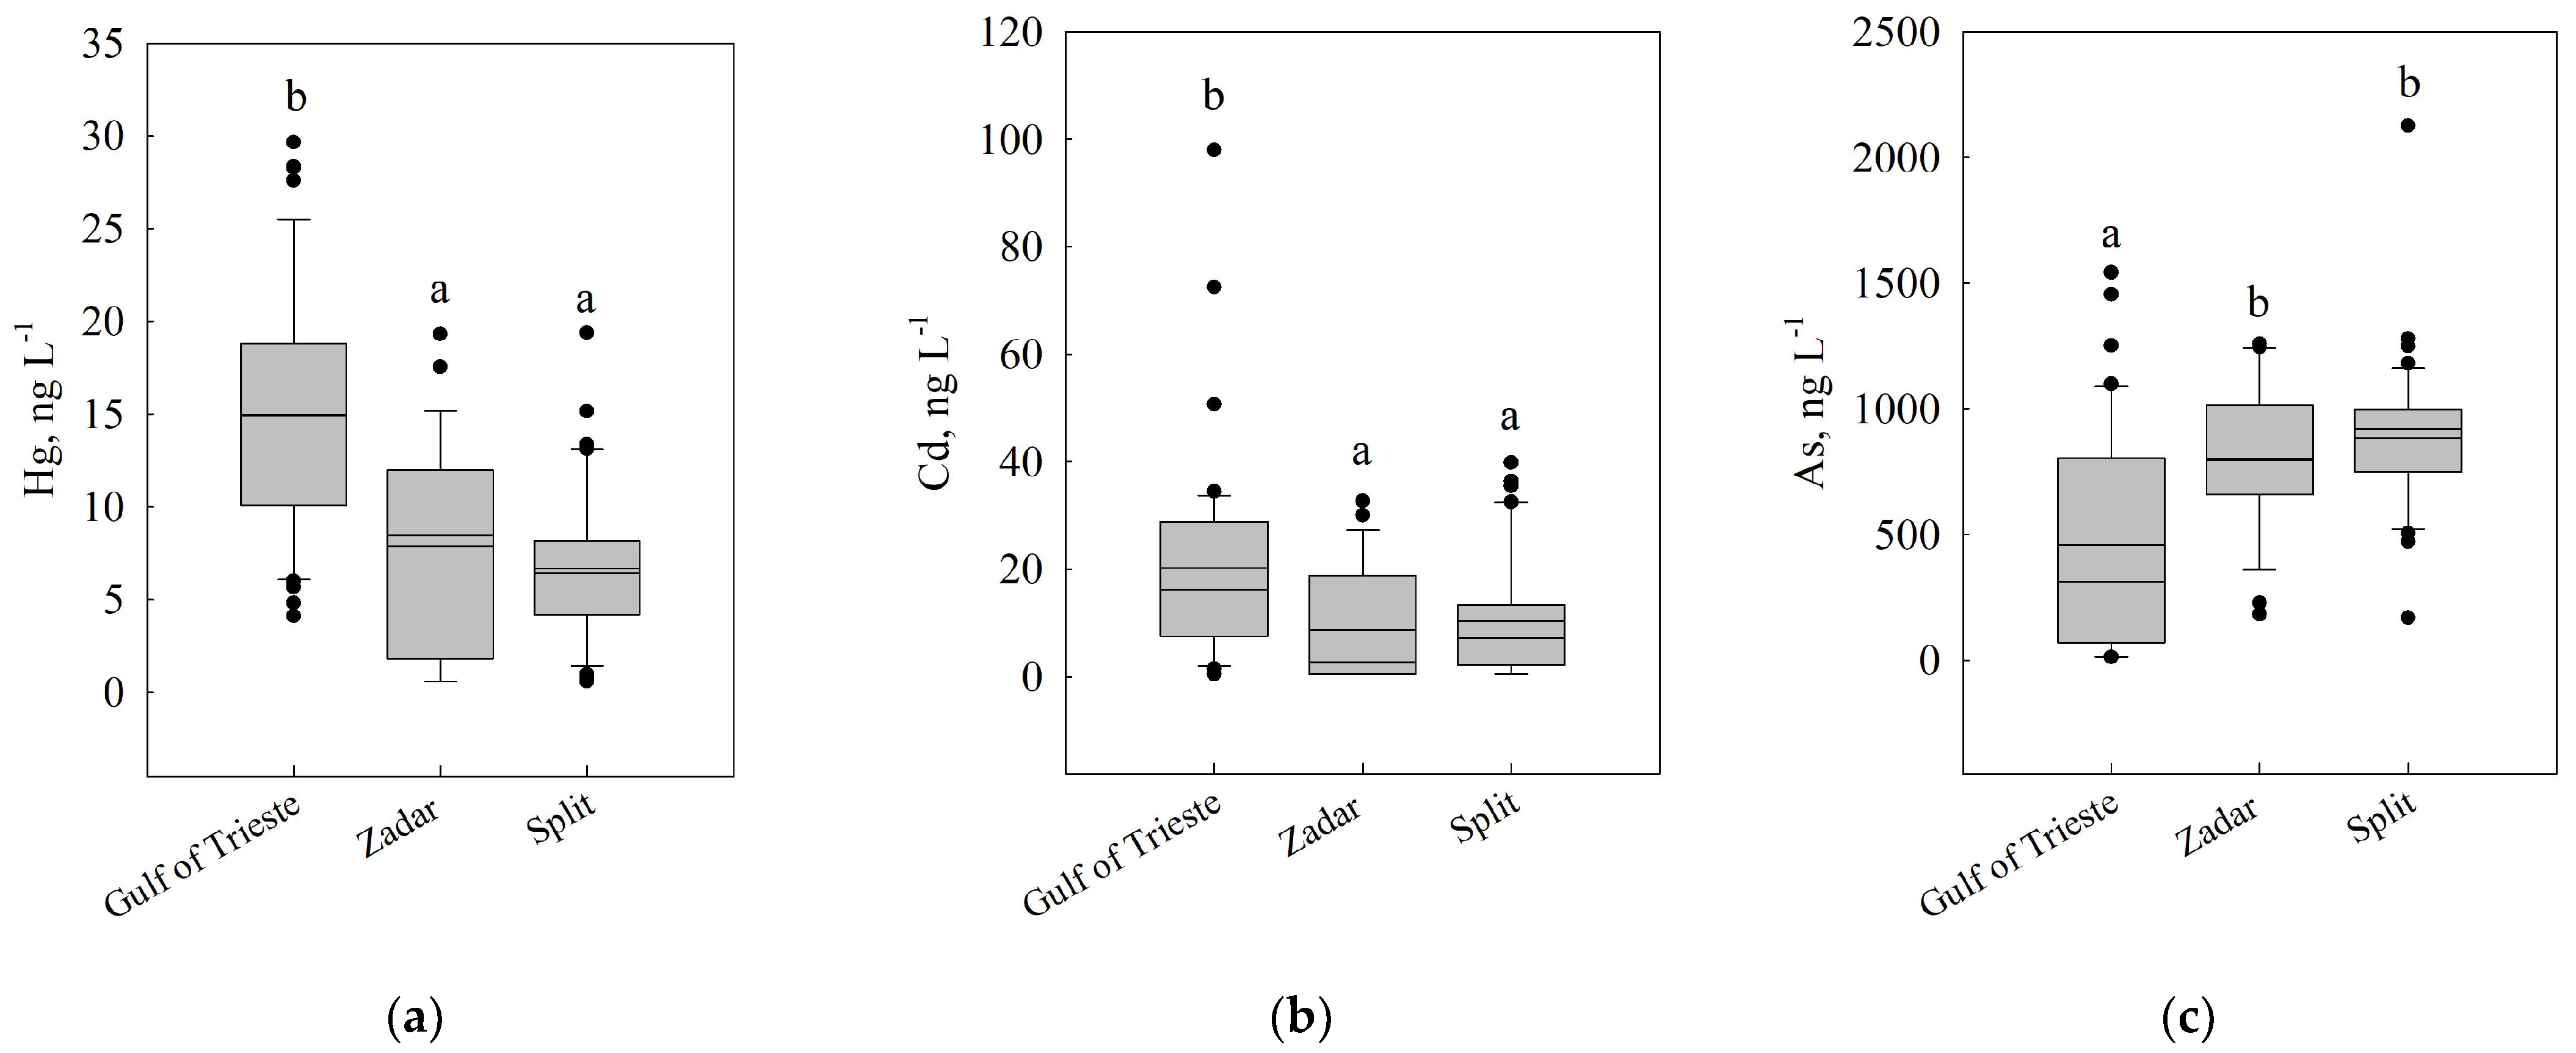
3.4. Comparison between Different Study Sites

To investigate the similarities between the sampling sites, we applied a cluster analysis taking into account the values of dissolved Hg, Cd, and As (Figure 3a).
A clear similarity was confirmed for all the sites in Croatia, as they were grouped with a distance <1, while the sampling sites in the Gulf of Trieste were similar to each other, with the exception of the DP of San Giorgio di Nogaro.
Since statistically significant differences were found in the concentrations recorded between the two sampling years with the same site for both As and Cd, we applied a second and third cluster analysis for both years. This was necessary to verify whether these fluctuations in the levels of PTEs could have influenced possible similarities between the sampling stations.
In 2019 (Figure 3b), the analysis associated the two DP sites and the two surface seawater sites of Split (Katalinića brig and Stupe). This was probably due to the proximity of the two sites, both located in the city of Split, but also due to the similarity of the treated wastewater (households waste, Table 1) and the similar treatment applied to the wastewaters by the two DPs (Table 1). Zadar DP was associated mainly with the bottom water sampled in the proximity of the Zadar discharge pipe (Figure 3b). In the Gulf of Trieste, the more similar sites were the seawater of Lignano Sabbiadoro and San Giorgio di Nogaro, while a consistent difference was found for the DP sites, which could have been due to the fact that the type of treated wastewater differed greatly as the Lignano Sabbiadoro plant also managed household wastewater, while San Giorgio di Nogaro DP purified only industrial waste (Table 1). In addition, extremely low concentrations of Cd and As at the San Giorgio di Nogaro plant and high levels of As at the Lignano Sabbiadoro plant were detected (Table 3).
The cluster analysis applied to samples of 2020 showed a similar situation to 2019 (Figure 3c), since Croatian sites were grouped except for Stupe DP, mainly due to a higher average value of As (Table 3) compared to the other sites. The sites of the Gulf of Trieste were far from those of Croatia, and the most similar sites were still the seawater ones, as in 2019.
The cluster analysis highlighted how the geographical component had a greater influence than the type of sample collected (DP or seawater), as the sites were grouped mainly according to the sampling area, showing in particular a clear division between the samples collected in Italy and Croatia, both in the 2019 and 2020 sampling years. This result was strengthened by the fact that Hg and As have geographical peculiarities, as mentioned in the previous paragraph, since the first was found at higher concentrations in the northern part of the basin while the second is known to show higher levels in the southern part of the Adriatic Sea.

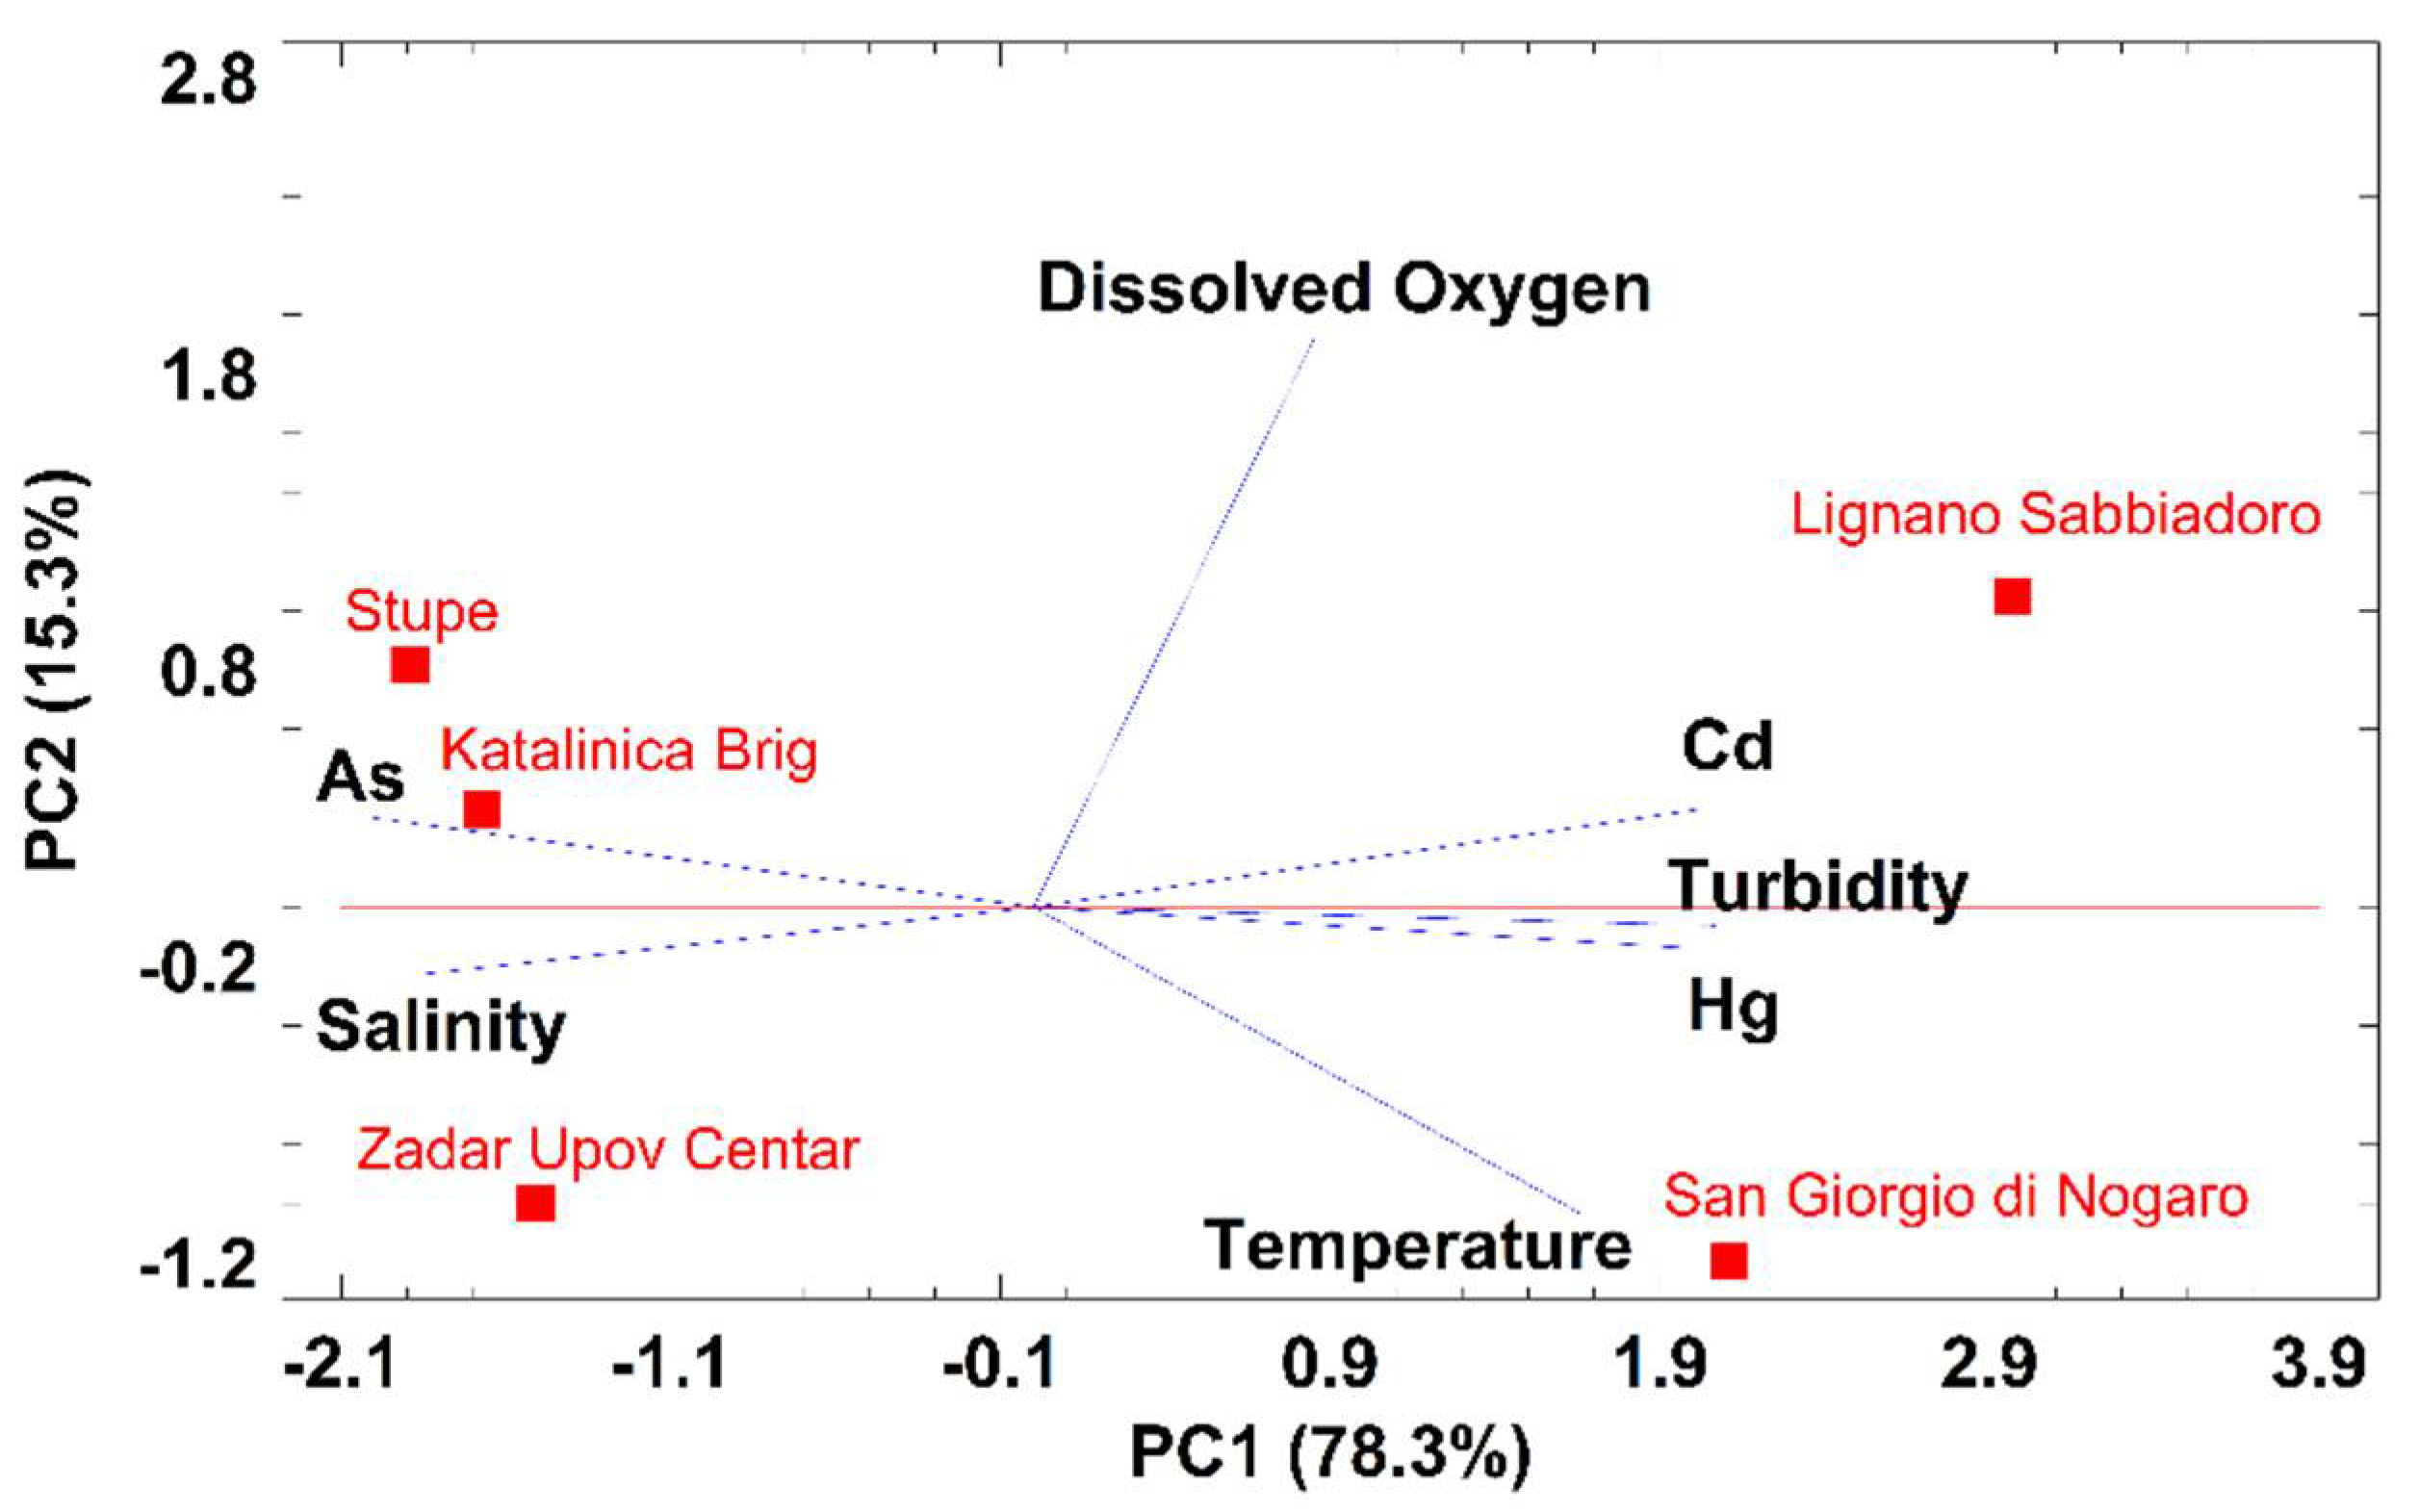
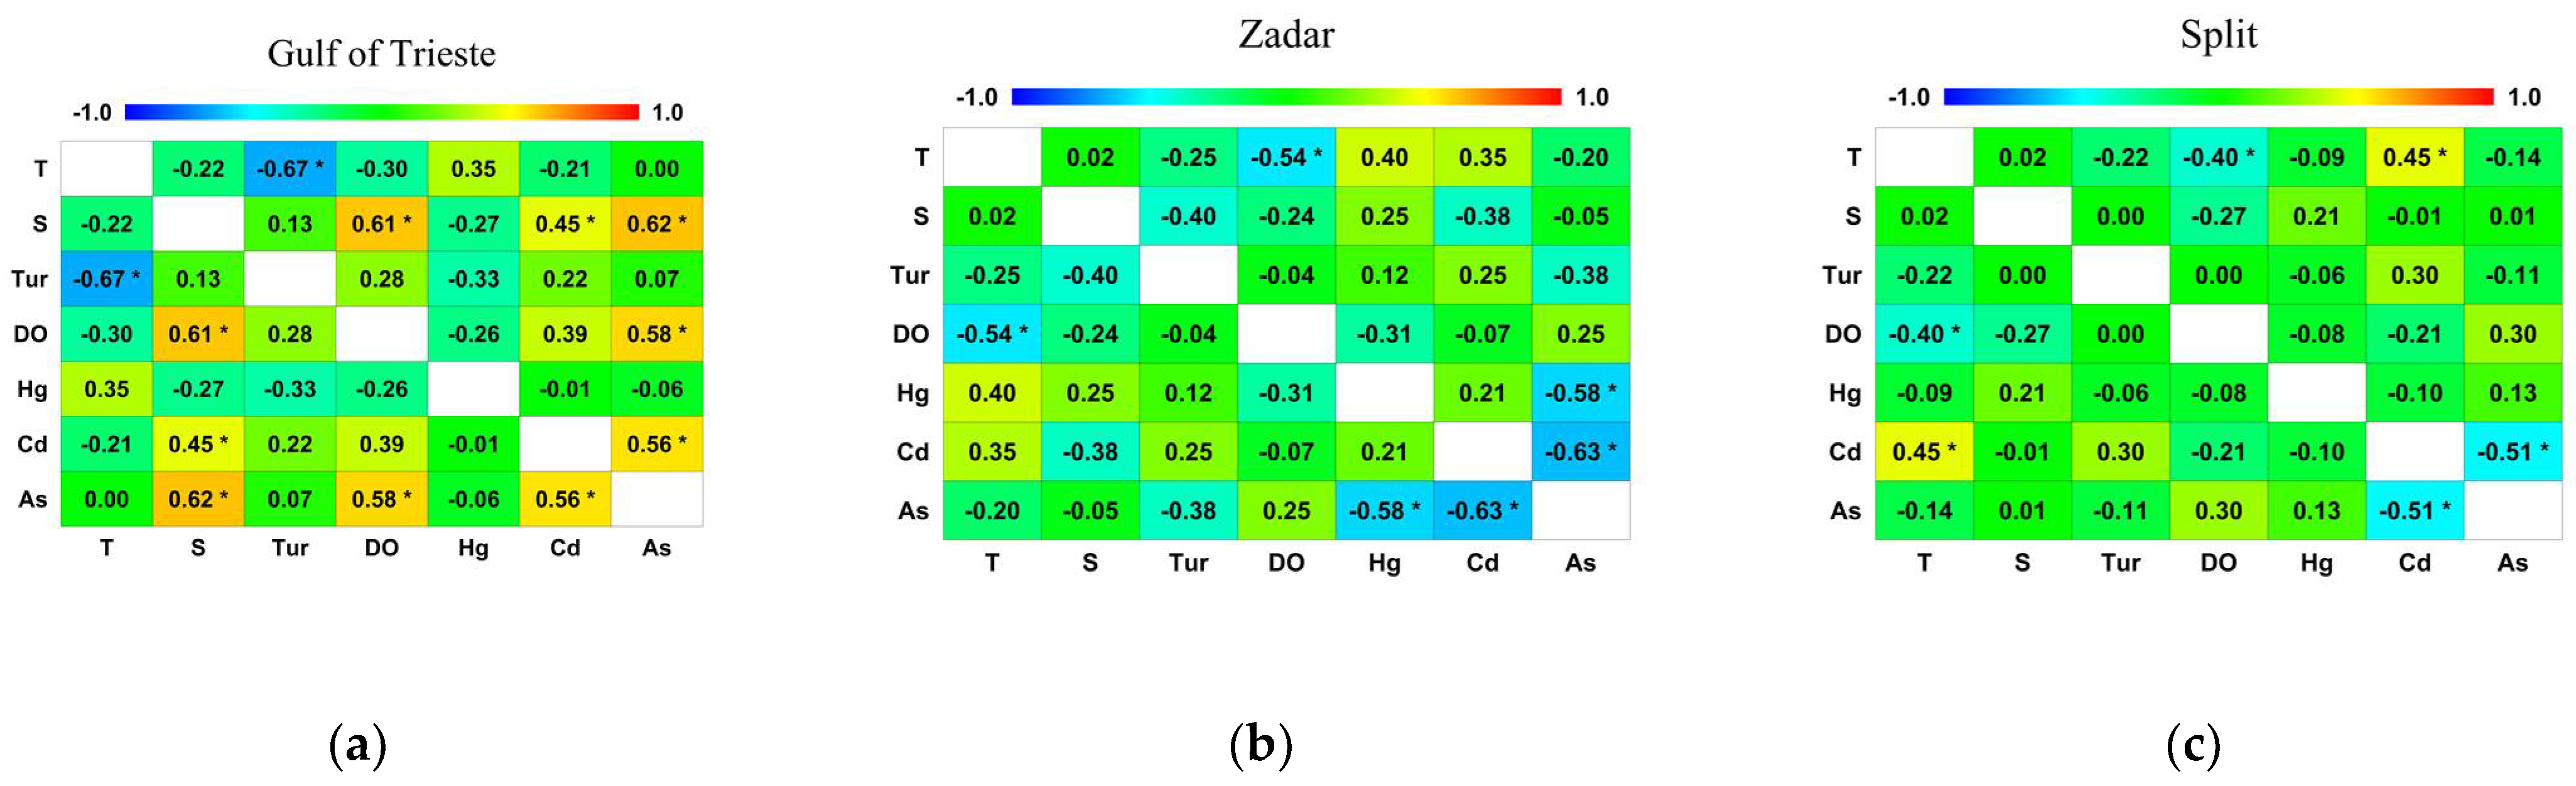
3.5. PTEs and CTD Variables

To better understand the main factors influencing the distribution of PTEs in the various investigated areas, we applied a multivariate analysis (PCA) to the overall dataset. The PCA extracted two significant, cross-validated principal components that accounted for 93.6% of the variability in the original data (Table S3).
Figure 4 shows the results of the PCA in terms of loading plot and score plot of PC1 vs. PC2.
The first principal component (PC1, 78.31%) highlighted the difference between two different groups of samples: (i) the Croatian sites (negative scores) far from Cd and Hg as they showed a very low concentration of them but associated with the salinity and As parameters; (ii) the Italian sites (positive scores), associated with a higher concentration of Cd and Hg, but also the temperature and turbidity parameters (Figure 4). The second principal component (PC2, 15.32%) separated the sampling stations of Split (Katalinića brig and Stupe) and Lignano Sabbiadoro (positive scores) from San Giorgio di Nogaro and Zadar sites (negative scores), with dissolved oxygen and temperature parameters as the main driver (Figure 4). In our opinion, this component was mainly influenced by the different hydrodynamic behavior of the water masses in the sampling areas.
The environmental conditions varied greatly from site to site (Figure S1), as in the north there is a thermocline that goes under the bottom in the warmer months, and this, therefore, leads to higher average temperatures than in Croatian coastal waters, where instead of the deeper samples, which are therefore colder, have a significant weight in the annual average. Similarly, for oceanographic reasons and the influence of freshwaters, naturally less salty waters are found in the northern area of the basin.
To reduce this environmental effect and normalize the weights of the CTD variables, we reported the statistical correlation matrices applied to each sampling area, considering all the monthly samples collected (Figure 5).
In the Gulf of Trieste, a statistically significant correlation was found between the following pairs: temperature–turbidity (p = 0.0007), dissolved oxygen–salinity (p = 0.0025), Cd–salinity (0.0371), As–salinity (p = 0.0021), dissolved oxygen–As (p = 0.0044), and Cd–As (p = 0.0066) (Figure 5a). In Zadar, the pairs of variables showing a statistically significant relationship were temperature–dissolved oxygen (p = 0.0196), Hg–As (p = 0.0119), and Cd–As (0.0048) (Figure 5b). In Split, a statistically significant correlation was found between the following pairs: temperature–dissolved oxygen (p = 0.0327), Cd–As (p = 0.0055), and Cd–temperature (p = 0.0170) (Figure 5c).
In this study, dissolved PTEs were detected with an overall mean concentration of 15 ± 7 (Hg), 20 ± 19 (Cd), and 458 ± 442 (As) ng L−1 in the Gulf of Trieste; 8 ± 6 (Hg), 9 ± 11 (Cd), 801 ± 283 (As) ng L−1 in Zadar; and 7 ± 4 (Hg), 10 ± 11 (Cd), and 883 ± 295 (As) ng L−1 in Split. The Gulf of Trieste presented statistically significant higher levels in Hg (p < 0.0001) and Cd (p = 0.0013) compared to Croatian samples, while a lower concentration in As (p < 0.0001) was detected (Figure 6).

4. Discussion

4.1. PTEs in Adriatic Sea Literature

Few studies on PTE levels have been carried out in seawater in this area (Table 4), and among them, only Cozzi et al. [34] took into consideration wastewater depuration plants as a possible source of input for these elements; however, our data are comparable with those collected from the literature.
Input sources of PTEs into the Adriatic Sea are manifold. The Po River is one of the most important ones, being responsible for metals discharge both in the dissolved and in the particulate forms [31]. Sediments on their side are not only an accumulation compartment, but can also actively represent a source of PTEs in the marine environment [44] as they may be recycled many times across the sediment–water interface before being permanently buried [45]. Moreover, atmospheric depositions driven by wind action are an important contribution that cannot be neglected in the study of biogeochemical cycles and PTE flows in the north Adriatic [46].
In the northern zone of the Adriatic Sea, a high concentration of Hg has been found both in sediments and waters, due to more than 500 years of HgS extraction from the Idrija mine, the second largest Hg mine in the world, located in the Slovenian sector of the Isonzo River drainage basin [47,48]. During mining operations, mineralized tailings generated by HgS roasting processes were dumped along the banks of the Idrijca River, swept away by floodwaters towards the Isonzo River, and finally transported into the Gulf of Trieste [49]. This could explain the higher concentration of dissolved Hg in the seawater samples of the Gulf of Trieste. Furthermore, our data are consistent with the results of studies conducted in the same area [50] or geographical zones located in north Adriatic [33,51]. Moreover, Kotnik et al. [52] also reported a concentration gradient in seawater from north to south.
We found that in the only study that connected DP and PTEs in the Adriatic Sea, a mean level of Cd of 0.08 ± 0.14 µg L−1 was reported in the proximity of the diffusion system of a DP’s pipeline located at 7.5 km from the coast of Trieste (Italy), and the author concluded that this concentration did not indicate a persistent perturbation in the water column of the site [34]. Other studies carried out in northern Adriatic [33] and Italian central coasts [30,32,53] reported Cd levels similar to our results.
Croatia is known for the high arsenic content in the aquifers coming from natural geological sources present in the eastern area [54,55,56,57]. Lazo et al. [58] evidenced that anthropogenic activities can influence PTE levels both in sediments and seawater in the Adriatic eastern coast, and a chemometric approach in the area of Montenegro [59] has associated As with both natural and anthropogenic sources. However, As values were consistent with our results, with a slightly higher range of concentrations than that of Split, which could explain the growing trend of As from north to south.
As regards the legislative aspect, the levels of PTEs measured in the outflows of the DPs were far below the limits established by national regulations [16] (from two to four orders of magnitude) (Table 4). Furthermore, all the seawater samples analyzed fell within the limit values indicated by the European MSFD for Hg and Cd and national legislation for As [60,61] (Table 4).
Table 4. Dissolved metals levels in seawater (ng L−1) from the literature. Data are expressed as mean ± SD (min–max). (T: total concentration; nd: not determined).
Location (State),
Sampling Year
HgCdAsReference
Gulf of Trieste (Italy),
2019–2020
15 ± 7
(4–30)
20 ± 19
(<0.5–98)
458 ± 442
(<13–1542)
This study
Zadar (Croatia),
2019–2020
8 ± 6
(<0.6–19)
9 ± 11
(<0.5–33)
801 ± 283
(182–1258)
This study
Split (Croatia),
2019–2020
7 ± 4
(<0.6–19)
10 ± 11
(<0.5–40)
883 ± 295
(169–2126)
This study
Gulf of Trieste (Italy)
2002–2003
nd80 ± 140nd[34]
Marano Lagoon (Italy),
2004
4.1–52.4ndnd[50]
Gulf of Trieste (Italy),
2011–2012
0.2–15ndnd[51]
Mljet National Park (Croatia),
2005–2008
0.5–24.2
(T)
6.4–18.7nd[33]
Southeast Adriatic coast (Montenegro),
2005–2007
200–20000–7400500–3100[59]
Durres Bay (Albania),
1999–2002
76.6–101.1
(T)
121–187
(T)
nd[58]
Ancona (Italy),
2005
nd14 ± 1nd[30]
Central Adriatic Sea,
2004
nd15 ± 3nd[53]
Po Plume (Italy),
2002
nd14 ± 5nd[32]
Mediterranean Sea,
1995
nd7nd[62]
Isonzo River (Italy)<LOD–8.60nd190–2310[49]
Gulf of Trieste (Italy),
2012
1nd1500[63]
Gulf of Trieste (Italy),
1990–1999
<0.20–4.9ndnd[64]
Krka River (Croatia),
1997–2000
0.50–1.10ndnd[65]
Zrmanja Riverndnd250–1740[66]
Limits
Discharge in surface waters (mg L−1)0.0050.020.5[16]
MAC-EQS (µg L−1)0.070.45 a5[60,61]
a EQS values vary depending on the hardness of the water as specified in five class categories (Class 1: <40 mg CaCO3 L−1, Class 2: 40 to <50 mg CaCO3 L−1, Class 3: 50 to <100 mg CaCO3 L−1, Class 4: 100 to <200 mg CaCO3 L−1, and Class 5: ≥200 mg CaCO3 L−1). For this study, the lowest limit value (Class 1) was taken into consideration.

4.2. Seasonal Evolution of PTEs in the Adriatic Sea

The seasonal trends of the investigated PTEs showed a significant decrease in the Cd content from 2019 to 2020, recorded in all sampling stations, while a decrease in the As content was found only in the northern stations. Although the detected concentrations remained extremely low and were not a signal of environmental contamination, this condition could have been ascribable to different factors: (i) a reduced touristic activity in these areas (caused by the lockdown period for the COVID-19 pandemic in European states during summer 2020 [67]) with a different impact on DPs; (ii) natural fluctuations of these concentrations in the marine environment due to changes in environmental parameters such as more intense rain events that can cause a higher intake of freshwater [45,53]. However, more data will be useful to define a precise interpretation of this trend, since only two bathing seasons were available.

4.3. PTEs Relation to DP Activity and Environmental Condition

The cluster analysis highlighted how the sampling sites were grouped on the basis of the geographical area, regardless of whether they had been sampled near discharging pipelines or in coastal waters. This result leads us to the conclusion that adequately treated wastewater did not compromise the environmental quality of coastal waters in the sites of interest, but it was more the natural characteristics of the area that determine the distribution of PTEs.
The PC1 (Figure 4) indicates that the chemical–physical parameters played an important role in the characterization of geographical areas, as warmer and lower salinity waters naturally occur in the northern part of the Adriatic Sea, as well as high turbidity, considering the annual average. However, it has been shown that low levels of salinity, corresponding to high river inputs, can influence the content of PTEs in the Adriatic Sea [62,63]. In our case study, we discovered a statistically significant positive correlation between Cd, As, and the salinity parameter only in the Gulf of Trieste (Figure 5).
Moreover, further differences between sites emerged as considering the site-specific statistical approach applied, and a statistically significant correlation was found between the pairs of variables Cd–As (positive in the Gulf of Trieste and negative in Croatian sites) and Hg–As (Zadar only). However, further studies with a higher temporal resolution and with a greater number of elements considered are still needed in order to better understand the behavior of dissolved PTEs and their relative distribution.

5. Conclusions

This study provides for the first time information on some dissolved potentially toxic elements (PTEs) in relation to the effect of five depuration plants (DPs) located in the Adriatic Sea during the 2019–2020 summer period. Our results showed that: (1) all the samples analyzed resulted in concentrations below the European and national legal limits, in particular, mean values were 2X below the legal limit for every PTE; (2) no particular DP effect was recorded as concentrations in DP outflow and seawater in the proximity of the DP’s discharging pipelines were similar; (3) a geographical gradient was recorded for Hg and As levels, while an analysis of the seasonal trend evidenced a strong decrease of Cd levels in 2020 in all sites.
Concerning the parameters investigated in this study, from our results, we can assume that DP discharges do not compromise the environmental quality of the surrounding marine environment in the study area.
However, continuous monitoring and further information (e.g., fecal indicator bacteria and nutrient levels) are required to better understand a possible synergic effect of treated wastewater outflow in the marine environment and to ensure the maintenance of a good environmental quality of the Adriatic Sea, as requested by Descriptors 5 and 8 of the Marine Strategy Framework Directive.

Supplementary Materials

The following supporting information can be downloaded at: https://www.mdpi.com/article/10.3390/w14040569/s1, Table S1: Instrumental parameters of Atomic Fluorescence Spectrometer (AFS) for water analyses. Table S2: Instrumental LOD and LOQ of Atomic Fluorescence Spectrometer (AFS) and accuracy control test. Figure S1: CTD parameters recorded in Lignano Sabbiadoro (a,b,c,d); San Giorgio di Nogaro (e,f,g,h); Zadar (i,l,m,n); Katalinića brig (o,p,q,r); and Stupe (s,t,u,v). Table S3: Principal Component Analysis. Eigenvalues, explained and cumulative variance, loadings of the variables for the first two PCs.

Author Contributions

Conceptualization, A.A.; methodology, A.A.; formal analysis, F.G., B.A. and M.F.; investigation, A.A. and F.G.; resources, M.C., J.Š. and S.S.; data curation, C.T. and S.I.; writing—original draft preparation, F.G.; writing—review and editing, A.A., S.I. and C.T.; visualization, F.G.; supervision, A.A.; project administration, A.A. and S.S.; funding acquisition, A.A. and S.S. All authors have read and agreed to the published version of the manuscript.

Funding

This research was funded by the 2014–2020 Interreg V-A Italy-Croatia CBC Programme through the project AdSWiM (Managed use of treated urban wastewater for the quality of the Adriatic Sea), ID 10046144.

Institutional Review Board Statement

Not applicable.

Informed Consent Statement

Not applicable.

Data Availability Statement

The data presented in this study are openly available in National Oceanographic Data Centre at doi:10.13120/j23k-n088.

Acknowledgments

The authors would like to thank the personnel of the CAFC and of BIO-RES—BIOLOGICAL RESEARCHES SOC. COOP for sampling activities. The help of R. Andričević, N. De Bortoli, C. Franci, and M. Mion throughout the implementation of the project is kindly acknowledged.

Conflicts of Interest

The authors declare no conflict of interest. The funders had no role in the design of the study; in the collection, analyses, or interpretation of data; in the writing of the manuscript; or in the decision to publish the results.

References

  1. Wear, S.L.; Thurber, R.V. Sewage Pollution: Mitigation Is Key for Coral Reef Stewardship. Ann. N. Y. Acad. Sci. 2015, 1355, 15–30. [Google Scholar] [CrossRef] [PubMed]
  2. Barakat, M.A. New Trends in Removing Heavy Metals from Industrial Wastewater. Arab. J. Chem. 2011, 4, 361–377. [Google Scholar] [CrossRef] [Green Version]
  3. Rajasulochana, P.; Preethy, V. Comparison on Efficiency of Various Techniques in Treatment of Waste and Sewage Water—A Comprehensive Review. Resour. Effic. Technol. 2016, 2, 175–184. [Google Scholar] [CrossRef] [Green Version]
  4. Vareda, J.P.; Valente, A.J.M.; Durães, L. Assessment of Heavy Metal Pollution from Anthropogenic Activities and Remediation Strategies: A Review. J. Environ. Manag. 2019, 246, 101–118. [Google Scholar] [CrossRef] [PubMed]
  5. Masindi, V.; Muedi, K.L. Environmental Contamination by Heavy Metals. In Heavy Metals; InTech: London, UK, 2018. [Google Scholar]
  6. Srivastava, A.; Siddiqui, N.A.; Koshe, R.K.; Singh, V.K. Human Health Effects Emanating from Airborne Heavy Metals Due to Natural and Anthropogenic Activities: A Review. In Advances in Health and Environment Safety; Springer: Manhattan, NY, USA, 2018; pp. 279–296. [Google Scholar]
  7. Bosch, A.C.; O’Neill, B.; Sigge, G.O.; Kerwath, S.E.; Hoffman, L.C. Heavy Metals in Marine Fish Meat and Consumer Health: A Review. J. Sci. Food Agric. 2016, 96, 32–48. [Google Scholar] [CrossRef] [PubMed]
  8. Sharma, R.K.; Agrawal, M. Biological Effects of Heavy Metals: An Overview. J. Environ. Biol. 2004, 26, 301–313. [Google Scholar]
  9. Briffa, J.; Sinagra, E.; Blundell, R. Heavy Metal Pollution in the Environment and Their Toxicological Effects on Humans. Heliyon 2020, 6, e04691. [Google Scholar] [CrossRef]
  10. Sankhla, M.S.; Kumari, M.; Nandan, M.; Kumar, R.; Agrawal, P. Heavy Metals Contamination in Water and Their Hazardous Effect on Human Health—A Review. SSRN Electron. J. 2016, 5, 759–766. [Google Scholar] [CrossRef]
  11. Ince, M.; Kaplan Ince, O. Heavy Metal Removal Techniques Using Response Surface Methodology: Water/Wastewater Treatment. In Biochemical Toxicology—Heavy Metals and Nanomaterials; IntechOpen: London, UK, 2020. [Google Scholar]
  12. Akpor, O.; Muchie, M. Remediation of Heavy Metals in Drinking Water and Wastewater Treatment Systems: Processes and Applications Environmental Microbiology View Project Mycology View Project Remediation of Heavy Metals in Drinking Water and Wastewater Treatment Systems: Processes and Applications. Int. J. Phys. Sci. 2010, 5, 1807–1817. [Google Scholar] [CrossRef]
  13. Abou-Shady, A. Recycling of Polluted Wastewater for Agriculture Purpose Using Electrodialysis: Perspective for Large Scale Application. Chem. Eng. J. 2017, 323, 1–18. [Google Scholar] [CrossRef]
  14. Zhang, F.; Man, Y.B.; Mo, W.Y.; Wong, M.H. Application of Spirulina in Aquaculture: A Review on Wastewater Treatment and Fish Growth. Rev. Aquac. 2020, 12, 582–599. [Google Scholar] [CrossRef]
  15. Directive 2008/56/EC of the European Parliament and of the Council of 17 June 2008 Establishing a Framework for Community Action in the Field of Marine Environmental Policy (Marine Strategy Framework Directive); Commission of the European Communities: Brussels, Belgium, 2008.
  16. All. 5 P. Terza, Decreto Legislativo 3 Aprile 2006, n. 152 Norme in Materia Ambientale (GU Serie Generale n.88 Del 14-04-2006—Suppl. Ordinario n. 96); Gazzetta Ufficiale: Rome, Italy, 2006.
  17. Gómez-Gutiérrez, A.; Garnacho, E.; Bayona, J.M.; Albaigés, J. Assessment of the Mediterranean Sediments Contamination by Persistent Organic Pollutants. Environ. Pollut. 2007, 148, 396–408. [Google Scholar] [CrossRef] [PubMed]
  18. Richir, J. Trace Elements in Marine Environments: Occurrence, Threats and Monitoring with Special Focus on the Coastal Mediterranean. J. Environ. Anal. Toxicol. 2016, 6. [Google Scholar] [CrossRef] [Green Version]
  19. Gao, J.; Zhang, L. Exploring the Dynamic Linkages between Tourism Growth and Environmental Pollution: New Evidence from the Mediterranean Countries. Curr. Issues Tour. 2021, 24, 49–65. [Google Scholar] [CrossRef]
  20. Afsa, S.; Hamden, K.; Lara Martin, P.A.; Mansour, H. ben Occurrence of 40 Pharmaceutically Active Compounds in Hospital and Urban Wastewaters and Their Contribution to Mahdia Coastal Seawater Contamination. Environ. Sci. Pollut. Res. 2020, 27, 1941–1955. [Google Scholar] [CrossRef]
  21. Boehm, A.B.; Graham, K.E.; Jennings, W.C. Can We Swim Yet? Systematic Review, Meta-Analysis, and Risk Assessment of Aging Sewage in Surface Waters. Environ. Sci. Technol. 2018, 52, 9634–9645. [Google Scholar] [CrossRef]
  22. Abaya, L.M.; Wiegner, T.N.; Colbert, S.L.; Beets, J.P.; Carlson, K.M.; Kramer, K.L.; Most, R.; Couch, C.S. A Multi-Indicator Approach for Identifying Shoreline Sewage Pollution Hotspots Adjacent to Coral Reefs. Mar. Pollut. Bull. 2018, 129, 70–80. [Google Scholar] [CrossRef]
  23. Fonti, V.; di Cesare, A.; Šangulin, J.; del Negro, P.; Celussi, M. Antibiotic Resistance Genes and Potentially Pathogenic Bacteria in the Central Adriatic Sea: Are They Connected to Urban Wastewater Inputs? Water 2021, 13, 3335. [Google Scholar] [CrossRef]
  24. Fanelli, M.; Truzzi, C.; Illuminati, S.; Girolametti, F.; Vagnoni, F.; Susmel, S.; Celussi, M.; Mion, M.; de Bortoli, N.; Franci, C.; et al. Impact of Depuration Plants on Nutrients Levels in North Adriatic Sea. Water 2022, in press. [Google Scholar]
  25. Figueredo, F.; Girolametti, F.; Aneggi, E.; Lekka, M.; Annibaldi, A.; Susmel, S. Plastic Electrode Decorated with Polyhedral Anion Tetrabutylammonium Octamolybdate [N(C4H9)4]4 Mo8O26 for NM Phosphate Electrochemical Detection. Anal. Chim. Acta 2021, 1161, 338469. [Google Scholar] [CrossRef]
  26. Perugini, M.; Visciano, P.; Manera, M.; Zaccaroni, A.; Olivieri, V.; Amorena, M. Heavy Metal (As, Cd, Hg, Pb, Cu, Zn, Se) Concentrations in Muscle and Bone of Four Commercial Fish Caught in the Central Adriatic Sea, Italy. Environ. Monit. Assess. 2014, 186, 2205–2213. [Google Scholar] [CrossRef] [PubMed]
  27. Spagnoli, F.; Dell’Anno, A.; de Marco, A.; Dinelli, E.; Fabiano, M.; Gadaleta, M.V.; Ianni, C.; Loiacono, F.; Manini, E.; Marini, M.; et al. Biogeochemistry, Grain Size and Mineralogy of the Central and Southern Adriatic Sea Sediments: A Review. Chem. Ecol. 2010, 26, 19–44. [Google Scholar] [CrossRef] [Green Version]
  28. Bilandžić, N.; Đokić, M.; Sedak, M. Metal Content Determination in Four Fish Species from the Adriatic Sea. Food Chem. 2011, 124, 1005–1010. [Google Scholar] [CrossRef]
  29. Droghini, E.; Annibaldi, A.; Prezioso, E.; Tramontana, M.; Frapiccini, E.; de Marco, R.; Illuminati, S.; Truzzi, C.; Spagnoli, F. Mercury Content in Central and Southern Adriatic Sea Sediments in Relation to Seafloor Geochemistry and Sedimentology. Molecules 2019, 24, 4467. [Google Scholar] [CrossRef] [PubMed] [Green Version]
  30. Annibaldi, A.; Illuminati, S.; Truzzi, C.; Scarponi, G. SWASV Speciation of Cd, Pb and Cu for the Determination of Seawater Contamination in the Area of the Nicole Shipwreck (Ancona Coast, Central Adriatic Sea). Mar. Pollut. Bull. 2011, 62, 2813–2821. [Google Scholar] [CrossRef]
  31. Annibaldi, A.; Illuminati, S.; Truzzi, C.; Libani, G.; Scarponi, G. Pb, Cu and Cd Distribution in Five Estuary Systems of Marche, Central Italy. Mar. Pollut. Bull. 2015, 96, 441–449. [Google Scholar] [CrossRef]
  32. Illuminati, S.; Annibaldi, A.; Truzzi, C.; Tercier-Waeber, M.-L.; Nöel, S.; Braungardt, C.B.; Achterberg, E.P.; Howell, K.A.; Turner, D.; Marini, M.; et al. In-Situ Trace Metal (Cd, Pb, Cu) Speciation along the Po River Plume (Northern Adriatic Sea) Using Submersible Systems. Mar. Chem. 2019, 212, 47–63. [Google Scholar] [CrossRef]
  33. Cuculić, V.; Cukrov, N.; Kwokal, Ž.; Mlakar, M. Natural and Anthropogenic Sources of Hg, Cd, Pb, Cu and Zn in Seawater and Sediment of Mljet National Park, Croatia. Estuar. Coast. Shelf Sci. 2009, 81, 311–320. [Google Scholar] [CrossRef]
  34. Cozzi, S.; Reisenhofer, E.; di Monte, L.; Cantoni, C.; Adami, G. Effect of Environmental Forcing on the Fate of Nutrients, Dissolved Organic Matter and Heavy Metals Released by a Coastal Wastewater Pipeline. Chem. Ecol. 2008, 24, 87–107. [Google Scholar] [CrossRef]
  35. Mossa, M. Field Measurements and Monitoring of Wastewater Discharge in Sea Water. Estuar. Coast. Shelf Sci. 2006, 68, 509–514. [Google Scholar] [CrossRef]
  36. Susmel, S.; Figueredo, F.; Aissa, S.; Scognamiglio, V.; Antonacci, A.; Girolametti, F.; Annibaldi, A.; Fonti, V.; Celussi, M.; Manna, V.; et al. A New Cross-Cutting Vision for the Quality of the Adriatic Sea under the Development of the Interreg Project AdSWiM. Transition from WasteWater Treatments (WWT) Plant to Water Resource Recovery Facilities (WRRFs) in Dialogue with Universities and Research. Water 2022, in press. [Google Scholar]
  37. Zavatarelli, M.; Raicich, F.; Bregant, D.; Russo, A.; Artegiani, A. Climatological Biogeochemical Characteristics of the Adriatic Sea. J. Mar. Syst. 1998, 18, 227–263. [Google Scholar] [CrossRef]
  38. Raicich, F. On the Fresh Balance of the Adriatic Sea. J. Mar. Syst. 1996, 9, 305–319. [Google Scholar] [CrossRef]
  39. Decreto 30 Marzo 2010. Definizione Dei Criteri per Determinare Il Divieto di Balneazione, Nonche’ Modalita’ e Specifiche Tecniche per l’Attuazione del Decreto Legislativo 30 Maggio 2008, n. 116, di Recepimento della Direttiva 2006/7/CE, Relativa Alla Gestione della Qualita’ delle Acque di Balneazione; Gazzetta Ufficiale: Rome, Italy, 2008.
  40. Truzzi, C.; Girolametti, F.; Giovannini, L.; Olivotto, I.; Zarantoniello, M.; Scarponi, G.; Annibaldi, A.; Illuminati, S. New Eco-Sustainable Feed in Aquaculture: Influence of Insect-Based Diets on the Content of Potentially Toxic Elements in the Experimental Model Zebrafish (Danio Rerio). Molecules 2022, 27, 818. [Google Scholar] [CrossRef]
  41. Uhrovčík, J. Strategy for Determination of LOD and LOQ Values—Some Basic Aspects. Talanta 2014, 119, 178–180. [Google Scholar] [CrossRef]
  42. Singh, K.P.; Malik, A.; Mohan, D.; Sinha, S. Multivariate Statistical Techniques for the Evaluation of Spatial and Temporal Variations in Water Quality of Gomti River (India)—A Case Study. Water Res. 2004, 38, 3980–3992. [Google Scholar] [CrossRef]
  43. Wold, S. Cross-Validatory Estimation of the Number of Components in Factor and Principal Components Models. Technometrics 1978, 20, 397–405. [Google Scholar] [CrossRef]
  44. Fabbri, D.; Gabbianelli, G.; Locatelli, C.; Lubrano, D.; Trombini, C.; Vassura, I. Distribution of Mercury and Other Heavy Metals in Core Sediments of the Northern Adriatic Sea. Water Air Soil Pollut. 2001, 129, 143–153. [Google Scholar] [CrossRef]
  45. Zago, C.; Capodaglio, G.; Ceradini, S.; Ciceri, G.; Abelmoschi, L.; Soggia, F.; Cescon, P.; Scarponi, G. Benthic Fluxes of Cadmium, Lead, Copper and Nitrogen Species in the Northern Adriatic Sea in Front of the River Po Outflow, Italy. Sci. Total Environ. 2000, 246, 121–137. [Google Scholar] [CrossRef]
  46. Rossini, P.; Guerzoni, S.; Rampazzo, G.; Quarantatto, G.; Garibbo, E.; Molinaroli, E. Atmospheric Deposition of Trace Metals in North Adriatic Sea. In Mediterranean Ecosystems; Springer Milan: Milano, Italy, 2001; pp. 123–129. [Google Scholar]
  47. Covelli, S.; Faganeli, J.; Horvat, M.; Brambati, A. Mercury Contamination of Coastal Sediments as the Result of Long-Term Cinnabar Mining Activity (Gulf of Trieste, Northern Adriatic Sea). Appl. Geochem. 2001, 16, 541–558. [Google Scholar] [CrossRef]
  48. Covelli, S.; Piani, R.; Acquavita, A.; Predonzani, S.; Faganeli, J. Transport and Dispersion of Particulate Hg Associated with a River Plume in Coastal Northern Adriatic Environments. Mar. Pollut. Bull. 2007, 55, 436–450. [Google Scholar] [CrossRef] [PubMed]
  49. Pavoni, E.; Crosera, M.; Petranich, E.; Adami, G.; Faganeli, J.; Covelli, S. Partitioning and Mixing Behaviour of Trace Elements at the Isonzo/Soča River Mouth (Gulf of Trieste, Northern Adriatic Sea). Mar. Chem. 2020, 223, 103800. [Google Scholar] [CrossRef]
  50. Covelli, S.; Acquavita, A.; Piani, R.; Predonzani, S.; de Vittor, C. Recent Contamination of Mercury in an Estuarine Environment (Marano Lagoon, Northern Adriatic, Italy). Estuar. Coast. Shelf Sci. 2009, 82, 273–284. [Google Scholar] [CrossRef]
  51. Bratkič, A.; Tinta, T.; Koron, N.; Guevara, S.R.; Begu, E.; Barkay, T.; Horvat, M.; Falnoga, I.; Faganeli, J. Mercury Transformations in a Coastal Water Column (Gulf of Trieste, Northern Adriatic Sea). Mar. Chem. 2018, 200, 57–67. [Google Scholar] [CrossRef]
  52. Kotnik, J.; Horvat, M.; Ogrinc, N.; Fajon, V.; Žagar, D.; Cossa, D.; Sprovieri, F.; Pirrone, N. Mercury Speciation in the Adriatic Sea. Mar. Pollut. Bull. 2015, 96, 136–148. [Google Scholar] [CrossRef]
  53. Annibaldi, A.; Truzzi, C.; Illuminati, S.; Scarponi, G. Recent Sudden Decrease of Lead in Adriatic Coastal Seawater during the Years 2000–2004 in Parallel with the Phasing out of Leaded Gasoline in Italy. Mar. Chem. 2009, 113, 238–249. [Google Scholar] [CrossRef]
  54. Habuda-Stanić, M.; Kuleš, M.; Kalajdžić, B.; Romić, Ž. Quality of Groundwater in Eastern Croatia. The Problem of Arsenic Pollution. Desalination 2007, 210, 157–162. [Google Scholar] [CrossRef]
  55. Ćavar, S.; Klapec, T.; Grubešić, R.J.; Valek, M. High Exposure to Arsenic from Drinking Water at Several Localities in Eastern Croatia. Sci. Total Environ. 2005, 339, 277–282. [Google Scholar] [CrossRef]
  56. Ujević Bošnjak, M.; Capak, K.; Jazbec, A.; Casiot, C.; Sipos, L.; Poljak, V.; Dadić, Ž. Hydrochemical Characterization of Arsenic Contaminated Alluvial Aquifers in Eastern Croatia Using Multivariate Statistical Techniques and Arsenic Risk Assessment. Sci. Total Environ. 2012, 420, 100–110. [Google Scholar] [CrossRef]
  57. Romić, Ž.; Habuda-Stanić, M.; Kalajdžić, B.; Kuleš, M. Arsenic Distribution, Concentration and Speciation in Groundwater of the Osijek Area, Eastern Croatia. Appl. Geochem. 2011, 26, 37–44. [Google Scholar] [CrossRef]
  58. Lazo, P.; Cullaj, A.; Baraj, B. An Evaluation of Hg, Cr and Heavy Metals Pollution in Seawater and Sediments of Durres Bay Adriatic Sea-Albania. J. Phys. IV 2003, 107, 715–720. [Google Scholar] [CrossRef]
  59. Stanković, S.; Tanaskovski, B.; Zlatić, B.; Arsenović, M.; Pezo, L. Analysis of Trace Elements in Surface Sediments, Mussels, Seagrass and Seawater along the Southeastern Adriatic Coast—A Chemometric Approach. Pure Appl. Chem. 2014, 86, 1111–1127. [Google Scholar] [CrossRef]
  60. European Parliament. Directive 2013/39/EU of the European Parliament and of the Council of 12 August 2013 Amending Directives 2000/60/EC and 2008/105/EC as Regards Priority Substances in the Field of Water Policy; European Parliament: Strasbourg, France, 2013. [Google Scholar]
  61. Tab 1/B, DECRETO LEGISLATIVO 13 Ottobre 2015, n. 172 Attuazione Della Direttiva 2013/39/UE, Che Modifica Le Direttive 2000/60/CE per Quanto Riguarda Le Sostanze Prioritarie Nel Settore Della Politica Delle Acque. (15G00186) (GU Serie Generale n.250 Del 27-10-2015); Gazzetta Ufficiale: Rome, Italy, 2015.
  62. Tankere, S.P.C.; Statham, P.J. Distribution of Dissolved Cd, Cu, Ni and Zn in the Adriatic Sea. Mar. Pollut. Bull. 1996, 32, 623–630. [Google Scholar] [CrossRef]
  63. Klun, K.; Falnoga, I.; Mazej, D.; Šket, P.; Faganeli, J. Colloidal Organic Matter and Metal(Loid)s in Coastal Waters (Gulf of Trieste, Northern Adriatic Sea). Aquat. Geochem. 2019, 25, 179–194. [Google Scholar] [CrossRef]
  64. Faganeli, J.; Horvat, M.; Covelli, S.; Fajon, V.; Logar, M.; Lipej, L.; Cermelj, B. Mercury and Methylmercury in the Gulf of Trieste (Northern Adriatic Sea). Sci. Total Environ. 2003, 304, 315–326. [Google Scholar] [CrossRef]
  65. Kwokal, Ž.; Lovrić, M. Vertical Distribution of Mercury in the Krka River Estuary. Int. J. Environ. Anal. Chem. 2006, 86, 905–914. [Google Scholar] [CrossRef]
  66. Fiket, Z.; Ivanic, M.; Turk, M.F.; Mikac, N.; Kniewald, G. Distribution of Trace Elements in Waters of the Zrmanja River Estuary (Eastern Adriatic Coast, Croatia). Croat. Chem. Acta 2018, 91, 29. [Google Scholar] [CrossRef]
  67. Cecchi, T. Analysis of Volatiles Organic Compounds in Venice Lagoon Water Reveals COVID 19 Lockdown Impact on Microplastics and Mass Tourism Related Pollutants. Sci. Total Environ. 2021, 783, 146951. [Google Scholar] [CrossRef]
Figure 1. Sampling stations in the northern Adriatic Sea: Lignano Sabbiadoro (Gulf of Trieste, ITA) (1), San Giorgio di Nogaro (Gulf of Trieste, ITA) (2), Zadar Upov Centar (Zadar, HR) (3), Katalinića brig (Split, HR) (4), and Stupe (Split, HR) (5).
Water 14 00569 g001
Figure 2. Dissolved Hg, Cd, and As (expressed as ng L−1, n = 3) in Lignano Sabbiadoro (a,b,c); San Giorgio di Nogaro (d,e,f); Zadar (g,h,i); Katalinića brig (l,m,n); and Stupe (o,p,q).
Water 14 00569 g002aWater 14 00569 g002b
Figure 3. Cluster analysis on PTE mean concentrations results as a function of sampling stations: overall mean (a), 2019 (b), and 2020 (c).
Water 14 00569 g003
Figure 4. 2D biplot of PC1 vs. PC2.
Water 14 00569 g004
Figure 5. Site-specific statistical correlation matrices applied in the Gulf of Trieste (a), Zadar (b), and Split (c). T: temperature; S: salinity; Tur: turbidity; DO: dissolved oxygen. The color scale indicates the Pearson product moment correlations between each pair of variables (from −1 to 1). * Statistically significant correlation (p < 0.05) between the pair of variables.
Water 14 00569 g005
Figure 6. Mean concentration of dissolved Hg (a), Cd (b), and As (c) in different sampling areas. Bars bearing different letters indicate a statistically significant difference among PTE levels in different geographical areas.
Water 14 00569 g006
Table 1. DP description.
DP
(Province, State)
ES Design Capacity aWastewater InputWastewater TreatmentDistance of Discharge from the Coast
(km)
Depth of Diffusors
(m)
Lignano Sabbiadoro (Udine, Italy)250,000Households and industry.Mechanical and biological treatment (primary and secondary settler), and UV and peracetic acid disinfection.7.515
San Giorgio di Nogaro (Udine, Italy)700,000Mostly from industry.Mechanical and biological treatment (primary and secondary settler), and peracetic acid disinfection.1014
Zadar Upov Centar
(Zadar, Croatia)
100,000Mostly from households.Mechanical treatment (rough and fine grid), sand and oil removal, biological treatment.233.8
Katalinića brig
(Split, Croatia)
122,000Households along with rainfall runoff wastewater.Mechanical treatment (rough and fine grid).1.341.8
Stupe
(Split, Croatia)
138,000Mostly from households.Mechanical treatment (rough and fine grid) along with sand and oil removal.2.7536.0
a Number of inhabitants for which the DP was designed.
Table 2. Sampling activity scheduled for 2019 and 2020 seasons. X: sampling carried out during the corresponding month.
JanFebMarAprMayJunJulAugSepOctNovDec
2019Gulf of Trieste XX XX X
Zadar X X X
Split X
2020Gulf of Trieste XXXX XX
Zadar XXXXXX
Split X XXX X
Table 3. Concentration of dissolved Hg, Cd, and As (n = 3) found in water sample. DP: depuration plant; Sea S.: sea surface; Sea B.: sea bottom. Data expressed as mean ± SD (ng L−1).
Sampling YearSampling StationHgCdAs
2019Gulf of Trieste
(ITA)
Lignano SabbiadoroDP14 ± 722 ± 111268 ± 214
Sea15 ± 547 ± 33857 ± 181
San Giorgio di NogaroDP21 ± 1113 ± 947 ± 24
Sea16 ± 434 ± 10785 ± 239
Zadar
(HR)
ZadarDP12 ± 118 ± 2435 ± 358
Sea S.8 ± 127 ± 7737 ± 67
Sea B.12 ± 424 ± 3452 ± 245
Split
(HR)
Katalinića brigDP2 ± 133 ± 1626 ± 26
Sea S.5 ± 140 ± 1804 ± 24
Sea B.5 ± 136 ± 3169 ± 1
StupeDP5 ± 132 ± 1473 ± 80
Sea S.7 ± 136 ± 1751 ± 1
Sea B.8 ± 128 ± 1804 ± 115
2020Gulf of Trieste
(ITA)
Lignano SabbiadoroDP13 ± 710 ± 7307 ± 229
Sea15 ± 822 ± 7203 ± 234
San Giorgio di NogaroDP14 ± 12 ± 371 ± 67
Sea14 ± 917 ± 5256 ± 129
Zadar
(HR)
ZadarDP5 ± 4<0.5831 ± 300
Sea S.7 ± 84 ± 2918 ± 215
Sea B.8 ± 62 ± 2982 ± 161
Split
(HR)
Katalinića brigDP6 ± 39 ± 5777 ± 282
Sea S.5 ± 35 ± 3913 ± 127
Sea B.9 ± 68 ± 5835 ± 195
StupeDP5 ± 411 ± 21217 ± 467
Sea S.8 ± 35 ± 8923 ± 204
Sea B.9 ± 52 ± 2909 ± 112
Publisher’s Note: MDPI stays neutral with regard to jurisdictional claims in published maps and institutional affiliations.

