
Estimation of Methane Emissions from Reservoirs Based on Country-Specific Trophic State Assessment in Korea


1
Department of e-Business, Busan University of Foreign Studies, Busan 46234, Korea
2
Department of Industrial Convergence Systems Engineering, Dongeui University, Busan 47340, Korea
3
Department of Systems Management and Engineering, Pukyong National University, Busan 48513, Korea
*
Author to whom correspondence should be addressed.
Water 2022, 14(4), 562; https://doi.org/10.3390/w14040562
Submission received: 13 January 2022
/
Revised: 10 February 2022
/
Accepted: 11 February 2022
/
Published: 12 February 2022
(This article belongs to the Topic Water Management in the Era of Climatic Change)
Abstract
:It has been reported that significant quantities of greenhouse gases are emitted from wetlands, from which emissions and their contributions to global warming have received much less attentions. Thus, a refinement to the previous published guidelines has recently been made to provide an updated and sound scientific basis for the purpose of supporting the preparation of national inventories. This study is aimed at demonstrating the applicability of the refinement for estimating methane emissions from reservoirs in the Republic of Korea. It is desirable to take the direct measurement of total methane fluxes across the reservoir surface, which may require a substantial amount of research efforts though. Alternatively, methane emissions from individual reservoirs may be estimated with relevant parameters accounting for the regional environmental characteristics. The assessment of trophic state has been employed to better represent the emissions behavior of reservoirs, based on which the methane emissions from local reservoirs in Korea are estimated. It is noted that the country has developed its own water quality index with the consideration of environmental characteristics. The seasonal variations in methane emissions are tested for their statistical significance and it is proposed that the emission estimates can be predicted from the trophic state assessment with the application of regression analysis. Following the guidelines prescribed by the refinement and procedures outlined in this study, the results from emissions estimation and prediction can be effectively used for the improvement of national inventories.
1. Introduction
The world’s water reservoirs are annually emitting carbon dioxide (CO2), methane (CH4), and other greenhouse gases (GHGs) in significant quantities, depending on a variety of different characteristics such as age, land-use prior to flooding, climate, upstream catchment and management practices [1]. It is estimated that the GHG emissions from reservoirs are roughly equivalent to 1.07 gigatons of CO2 [2], which surprisingly approach to 14% of the annual CO2 emissions of 7.8 gigatons from fossil fuel combustion [3]. With the exception of CO2, CH4 is considered the most important greenhouse gas because its global warming potential is 34 times greater than that of CO2, though its atmospheric concentration is approximately 200 times less. Especially, wetlands including reservoirs are the largest natural source of methane accounting for roughly one third of total natural and anthropogenic CH4 emissions. It is argued that the global fossil fuel emissions would have to be reduced by as much as 20% more than previous estimates to achieve the Paris Agreement targets because of the natural GHG emissions from wetlands and permafrost, which is thus critical in the assessment of emission pathways to limit global warming [4]. However, CH4 emissions from wetlands and their contribution to global warming potential were poorly assessed before mainly due to the paucity of available data [5,6,7]. Most attempts are centered on upscaling the GHG emission rates from individual waterbodies to the regional or global estimates and simply multiplying an average emission rate by the total waterbody surface area in the region of interest [8,9,10,11]. It is pointed out in [12] that this upscaling approach can be highly biased unless the emission rate measurements come from a representative sample of lakes or reservoirs in the region of interest.
Providing an updated and sound scientific basis to support the preparation and continuous improvement of national inventories, the 2019 Refinement to the 2006 IPCC Guidelines for National Greenhouse Gas Inventories [3] (hereafter referred to as ‘2019 Refinement’) has been adopted to embrace recent scientific advances and technological developments. Scientists recognized the importance of including reservoir emissions in the nation’s GHG inventory to better understand their climate impacts, and thus a significant refinement has been made to the estimation of GHG emissions from wetlands, especially from flooded lands, which is described in Chapter 7.3 of Volume 4. An exhaustive collection of related research efforts is well reviewed and presented in [3] emphasizing the urgency of accounting methane emissions from wetlands from the perspective of reporting inventories. The refinement for estimating CO2 and CH4 emissions from reservoirs provides the average emission factors for six major climate zones; boreal, cool temperate, warm temperate/dry, warm temperate/moist, tropical dry/montane, and tropical moist/wet. The emission factors for each climate zone are derived from an extensive literature survey and they are multiplied by the total area of water surface to estimate the emissions from reservoirs. Even though the region may be classified as the aggregated climate zone of ‘Cool Temperate’, it may exhibit different climatic characteristics from season to season due to the noticeable seasonal variations in temperature and precipitation. In addition, the emissions estimation can be adjusted based upon the assessment of trophic state of reservoirs. Even though feasible to obtain the region-specific estimates of emissions from reservoirs by assessing the tropic status of individual reservoirs, there hardly exists such an attempt to adopt the 2019 Refinement for estimating the GHG emissions from wetlands with the consideration of regional climatic characteristics. The objective of this study is to estimate the amount of methane emissions from reservoirs as per the procedure outlined in the 2019 Refinement. Further, it is also proposed to predict the methane emissions based on the country-specific trophic state assessment by employing the statistical regression analysis. For the purpose of this study, selected are six reservoirs in the Republic of Korea, which is recognized as the 9th largest emitter of GHG emissions with more than 700 million tons of carbon emissions in 2019 [13]. It was reported that the methane emissions from wetlands are merely 0.283 million tons equivalent to about 1% of the total methane emissions, which may seem negligible. However, the refinement has not yet been adopted to obtain the emissions estimation in the report and it is extremely probable that the refinement yields a much greater amount of total emissions from wetlands. To the best of authors’ knowledge, this study is the first attempt, at least for Korea, to apply the refinement for estimating the methane emissions from individual reservoirs. The defining aspect of this study is that the estimation of methane emissions has been carried out based on the region- or country-specific trophic state assessment method to better account for regional climatic characteristics and the trophic state assessment may also be used to predict the emissions from different reservoirs. The remainder of this manuscript is organized as follows: First, the methodology prescribed in the 2019 Refinement is briefly summarized and the index for country-specific trophic state assessment is introduced in the next section. Section 3 describes the results from the assessment of trophic state of individual reservoirs and their emissions estimation. It is also discussed that the results may be used to predict the methane emissions from reservoirs based on the trophic state assessment. The conclusions will follow in the last section.
2. Methods
2.1. Methodology Based on IPCC Guidelines
The carbon emissions from wetlands are traced from three different source categories: managed peatlands, flooded land, and inland wetland mineral soils. No refinements have been made to the categories of managed peatlands and inland wetland mineral soils. Major developments with regard to the emissions from flooded lands are included in the refinement and described in a greater detail based on the collation of extensive literature survey. The usage of guidelines for the emissions estimation is contingent upon the types of flooded lands; land converted to flooded land, flooded land remaining flooded land, and other constructed water body. All the reservoirs under investigation here can be classified as the type of flooded land remaining flooded land since all of them are more than 20 years old. It is advocated that only methane emissions are estimated in this category to avoid the double counting of CO2 emissions [3]. Annual total emissions estimation from flooded land remaining flooded land may be obtained by the following as given in [3]: First, the annual emissions from reservoir surface, denoted by , are estimated by
where and are the index for individual reservoirs and the number of reservoirs more than 20 years old in climate zone , respectively. The total area of water surface in hectare is denoted by and the CH4 emission factor from reservoirs more than 20 years old located in climate zone by measured in kg CH4/year. The emission factors may be adjusted by , if appropriate, depending upon the trophic state of individual reservoirs. In addition, denotes the annual emissions from CH4 originating from reservoirs but emitted downstream of corresponding reservoirs, which can be estimated by multiplying the emissions from water surface of individual reservoirs by the ratio of total downstream methane emission to the total flux of methane from the reservoir surface as follows:
The total annual emissions of CH4 from all reservoirs under study, denoted by , is simply the sum of emissions from water surface and downstream, that is,
If sufficient data are lacking, the default values for parameters, such as and , may be used in a blanket manner even though acknowledged in [3] that it is good practice to develop the country-specific emission factors to reduce overall uncertainty. The procedure outlined in [3] is certainly useful to estimate the methane emissions from wetlands, but a certain degree of ambiguity is inevitable without a sufficient amount of data especially related to trophic states. This study uses the default value of 0.09 with the 95% confidence interval (0.05, 0.22) for as recommended in [3] due to the lack of relevant data. On the other hand, the adjustment factor is derived from the seasonal trophic state assessment of individual reservoirs as outlined in the below. It is most desirable to employ the Tier 3 approach by taking the direct measurement of CH4 diffusion and ebullition fluxes across the reservoir surface or applying Greenhouse Gas Reservoir Tool (G-Res) model [14]. However, it may require a great deal of efforts and resources to capture both the spatial and temporal variability of emissions from a reservoir. As an alternative, the methane emissions from individual reservoirs may be estimated with the relevant parameters adjusted for trophic status and water withdrawal depths of reservoirs. For example, different values of the emission factor adjustment are recommended in [3] depending upon trophic index (TI), surface concentration of chlorophyll-a (Chl-a), total phosphorus (TP), total nitrogen (TN), Secchi depth (SD), and trophic class. The emission factor adjustment of 10.0 is to be used for a eutrophic reservoir in lieu of its default value of 1.0. It is also noted that the emissions estimation needs to take environmental circumstances as well as properties of individual reservoirs into account. The methane emission factors are highly variable in different climate zones, and it is reasonable to apply different emission factors from season to season where the average temperature and precipitation are greatly fluctuating across the year. The Republic of Korea has four distinct seasons and a significant variation in seasonal weather may be observed. For example, one of the reservoirs investigated here is located near the city of Boryeong where the annual average temperature is 12.7 degrees Celsius and the difference in monthly average temperature between hottest and coldest months is 25.9 degrees Celsius. Further, the annual rainfall total is 1191.4 mm and the precipitation is mainly concentrated in summer with the average rainfall of 652.4 mm. Six reservoirs in the central region of Korea are investigated to demonstrate the applicability of the methodology described above for estimating the methane emissions with the consideration of seasonal climatic characteristics and the trophic state of individual reservoirs.
2.2. Country-Specific Trophic State Assessment
There are about 18,000 reservoirs and dams of various sizes in the Republic of Korea and most of them are more than 20 years old [15]. The country is relatively small in terms of the land area and ranked 109th in the world with the land area of 97,230 km2. River Act of Korea designates five major river systems as National Rivers, along which a significant number of reservoirs and lakes are located. It is noted that the spatial variations in climatic characteristics are slightly noticeable, if any, compared to the seasonal variations mainly due to the small land area of Korea, and this study rather focuses on the temporal variations in methane emissions. Located in the central region of Korea, the third longest river system from the central region of Korea, called Geumgang, is selected for analysis in this study. From the perspective of data availability and readiness for the country-specific trophic state assessment, six reservoirs of different sizes, from the surface area of 59 to 7419 hectare, along the Geumgang river system are taken as shown in Table 1.
As mentioned earlier, the assessment of trophic states is crucial to better estimate the emissions from reservoirs by adjusting the emission factors. Carlson [16] proposed the use of a trophic state index () based on the measurement of SD, TP, and Chl-a from reservoirs, which is widely adopted for water quality assessment in the literature. On the other hand, it is argued in [17] that the trophic state assessment should be carried out in such a way to better represent environmental characteristics of the region of interest and the trophic state index suitable for Japanese river systems is proposed by modifying Carlson’s index. Considering regional environmental characteristics of Korea, NIER [18] also developed the water quality assessment method and proposed the trophic state index named ‘Korean Trophic State Index’ (), which is basically based on the measurement of chemical oxygen demand (COD), TP, and Chl-a from individual reservoirs [19,20,21,22,23]. It is pointed out in [20,23] that the Korean index adopts the measurement of COD in place of SD used in the Carlson’s and Japanese indices with the consideration of Korean river systems characterized by relatively short detention times and a higher intake of organic matters. The index separately evaluates the water quality of reservoirs in terms of COD, TP, and Chl-a as shown in Equations (4)–(6), respectively.
where , , and denote the trophic state indices assessed from the measurements of COD, TP, and Chl-a, respectively. Then, the overall is derived by taking the weighted average of three sub-indices in the above. The weights of 0.5, 0.25, and 0.25 are assigned to , , and , respectively, as follows:
It should be noted that the trophic state assessment is twice more influenced by than the others considering the characteristics of regional reservoirs which are highly affected by allochthonous and autochthonous organic matters [20]. The trophic state of individual reservoirs is to be determined by the value of as shown in Table 2. The index has been adopted as the official index for trophic state assessment designated by the Ministry of Environment of Korea in Ministry Notice 2013-134 since 2013. The reasoning behind the development of is beyond the scope of this study, and interested readers are referred to [17] for more detailed discussions on .
3. Results and Discussion
3.1. Seasonal Trophic State Assessment of Reservoirs
Based on the water quality data on COD, TP, and Chl-a, the trophic state of each reservoir can then be assessed season by season to capture the seasonal variations. The seasonal assessment of trophic state for individual reservoirs has been performed by [18]. Collecting data on the water quality for almost 15 years, the seasonal averages of measurement data are used to determine the trophic state season by season. In addition, the emission factors need to be adjusted for the trophic state to estimate the methane emissions from individual reservoirs. For each trophic class, the range and recommended value for adjustment factor are provided as shown in Table 2 [3]. For example, the range of adjustment factor for mesotrophic state is from 0.7 to 5.3 and it is recommended to use 3.0 when sufficient data are not available. On the other hand, the range of value is from 30 to 50 for mesotrophic reservoirs, and it seems reasonable to use the interpolated adjustment factor. Provided that , the interpolated adjustment factor can then be calculated as
.
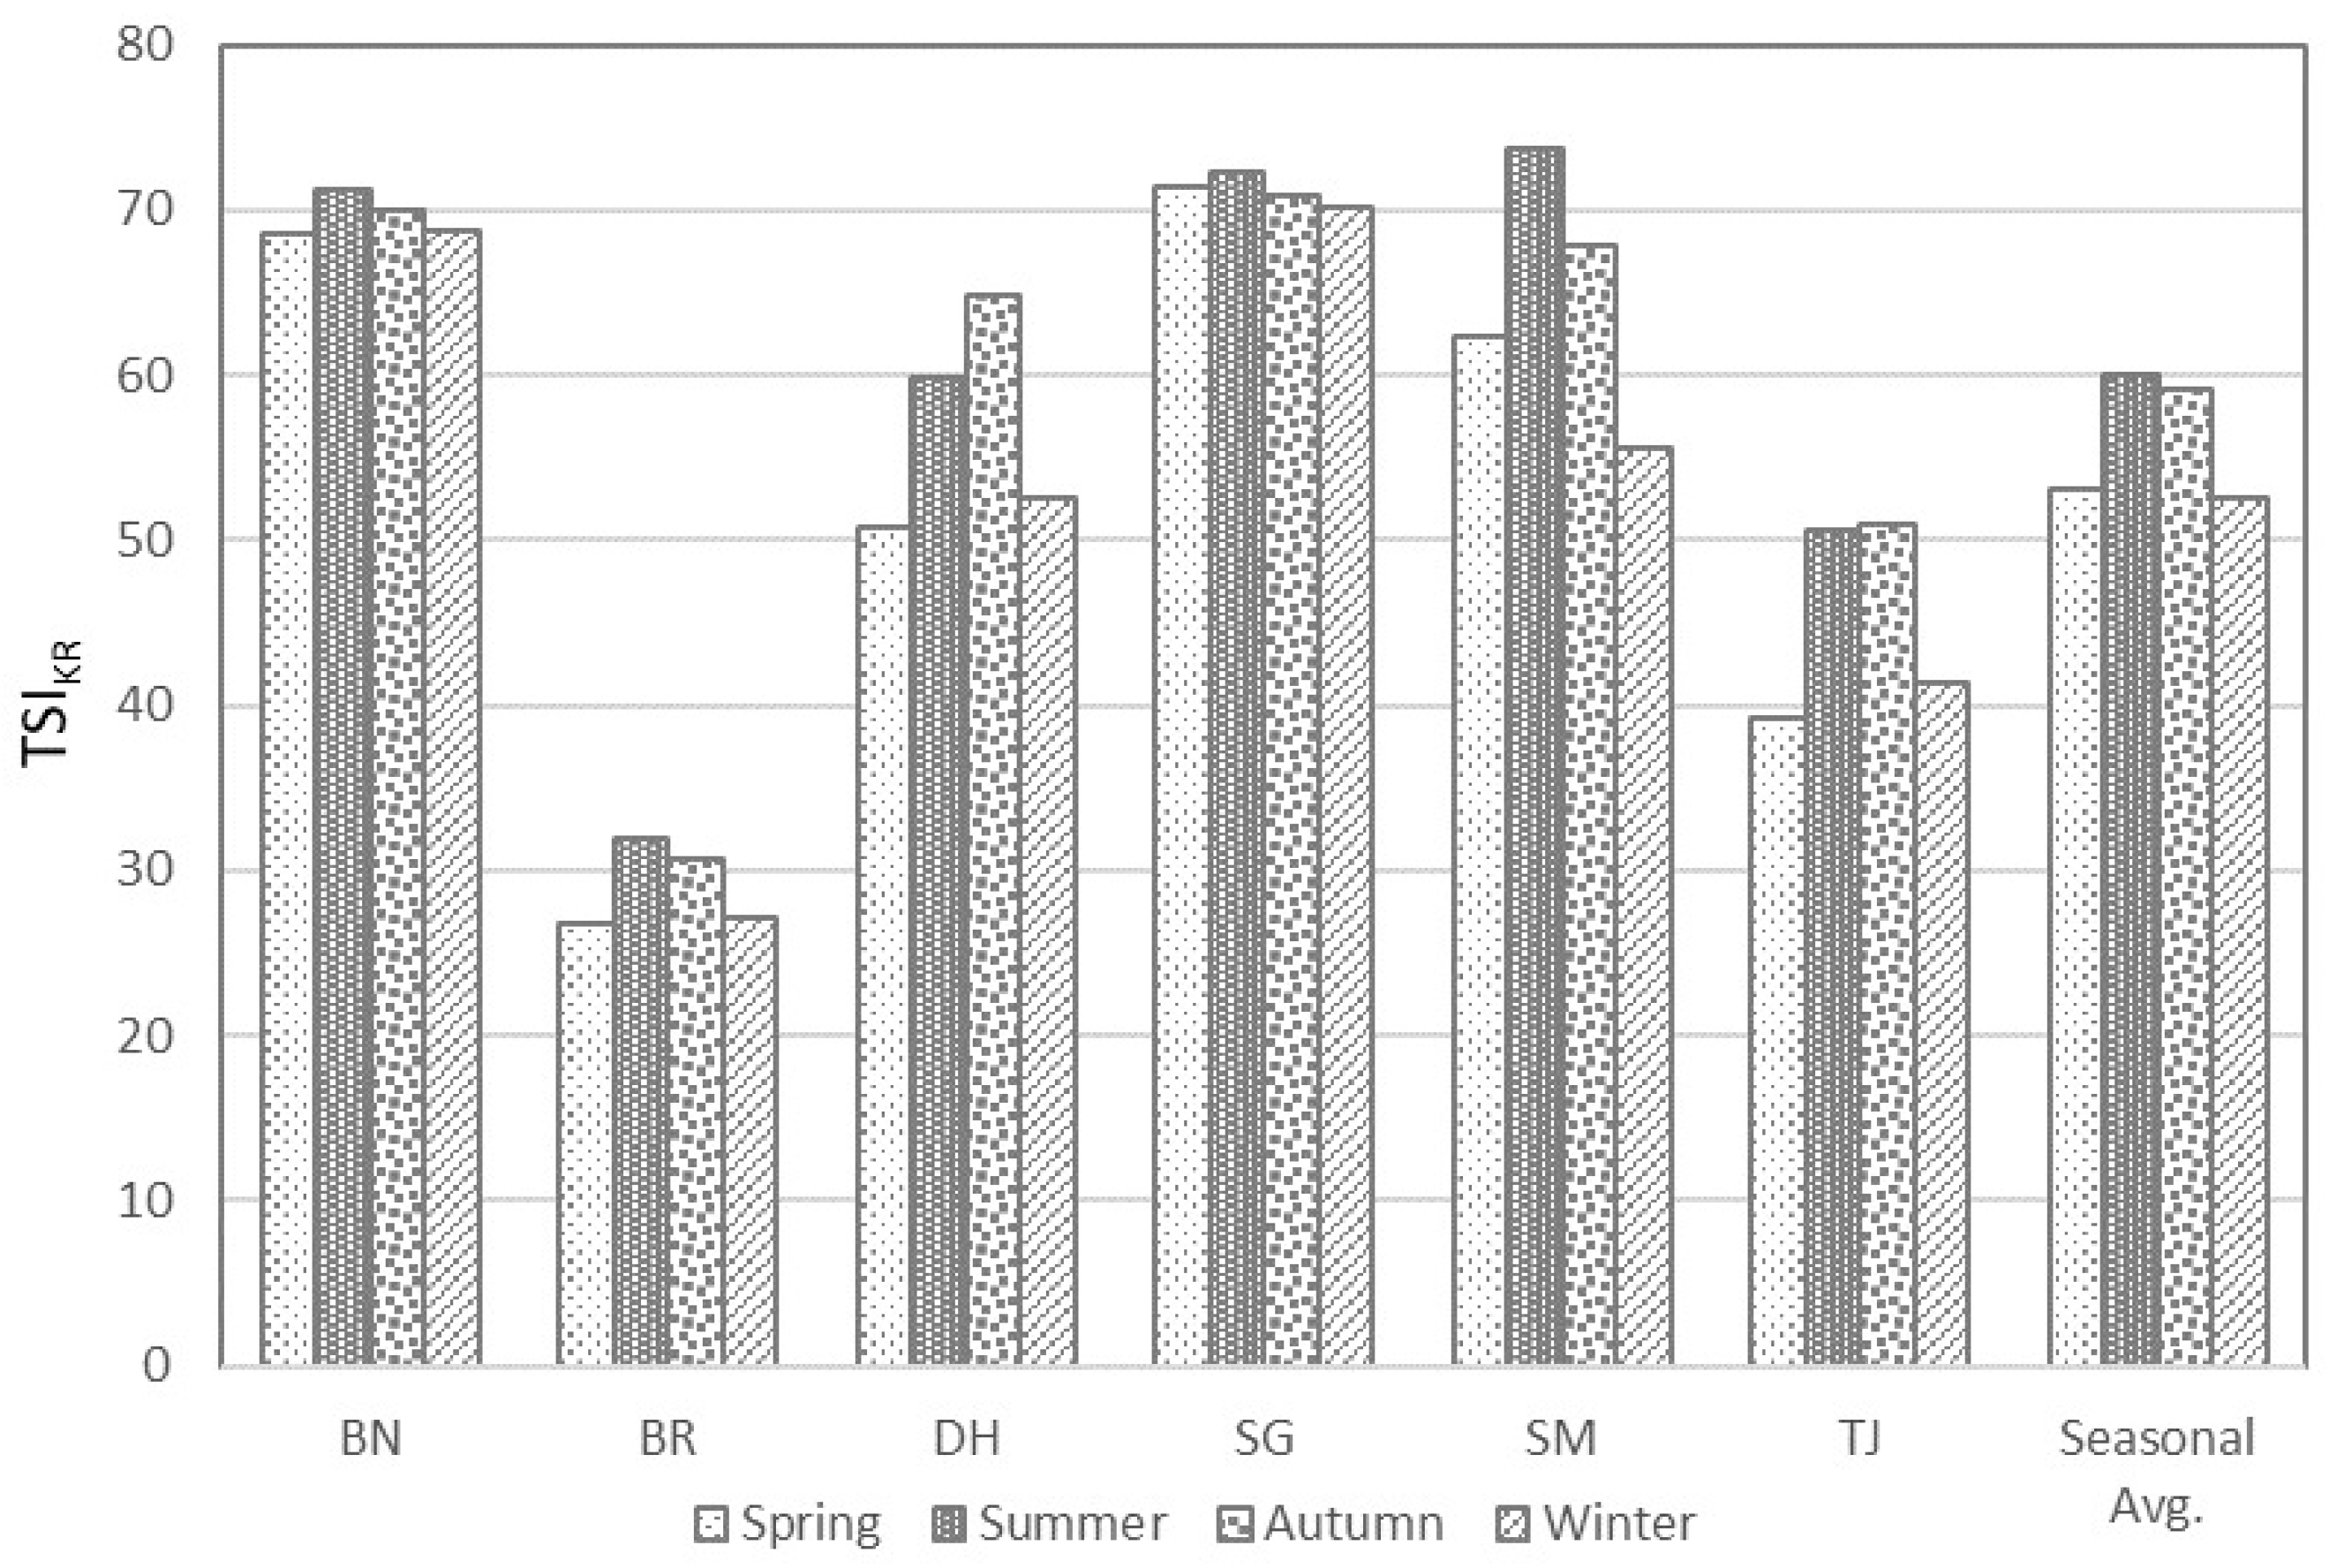
Table 3 presents the result of trophic state assessment along with the values, their standard errors, and corresponding adjustment factors. As observed from the standard errors of values, the trophic state indices do not fluctuate much throughout the data collection period. On the other hand, a relatively large seasonal variations of indices may be observed especially for such reservoirs as DH, SM, and TJ as shown in Figure 1. It is obvious that the trophic state index should be closely related to the adjustment factor, which is depicted in Figure 2. The Pearson’s correlation coefficient between them corresponds to 0.98 indicating that there exists a strong positive correlation and the seasonal variations in trophic states are well reflected in the interpolated adjustment factors.
3.2. Estimation and Prediction of Methane Emissions from Reservoirs
Derived from the G-Res model, the unadjusted emission factors are provided for each climate zone in [3]. Most of the regions in the Republic of Korea are classified as ‘Cool Temperate’ zone except for southern and eastern coastal areas, and it is recommended to use the average emissions factor of 54.0 with the 95% confidence interval (48.3, 59.5). The refinement recommends using the default value of 0.09, unless otherwise specified, for the ratio of downstream emissions to the total flux of methane from reservoir surface [3]. Using Equations (1)–(3), the methane emissions from individual reservoirs under investigation can then be estimated with the parameters outlined above. For example, the methane emissions estimation from the reservoir BN over the spring season can be obtained with the following parameters: = 54.0 for the climate zone of ‘Cool Temperate’, = 3560 for the surface area, = 13.84 for the adjustment factor, and = 0.09 for the ratio of total downstream methane emission to the total flux of methane from the reservoir surface. The surface emissions of methane are 665,150 kg CH4 and the downstream emissions are simply 59,863 kg CH4 by adopting the default value 0.09 for due to the lack of data availability, which sums up to 725,013 kg CH4. Table 4 presents the seasonal methane emissions from individual reservoirs along with the annual per hectare emissions.
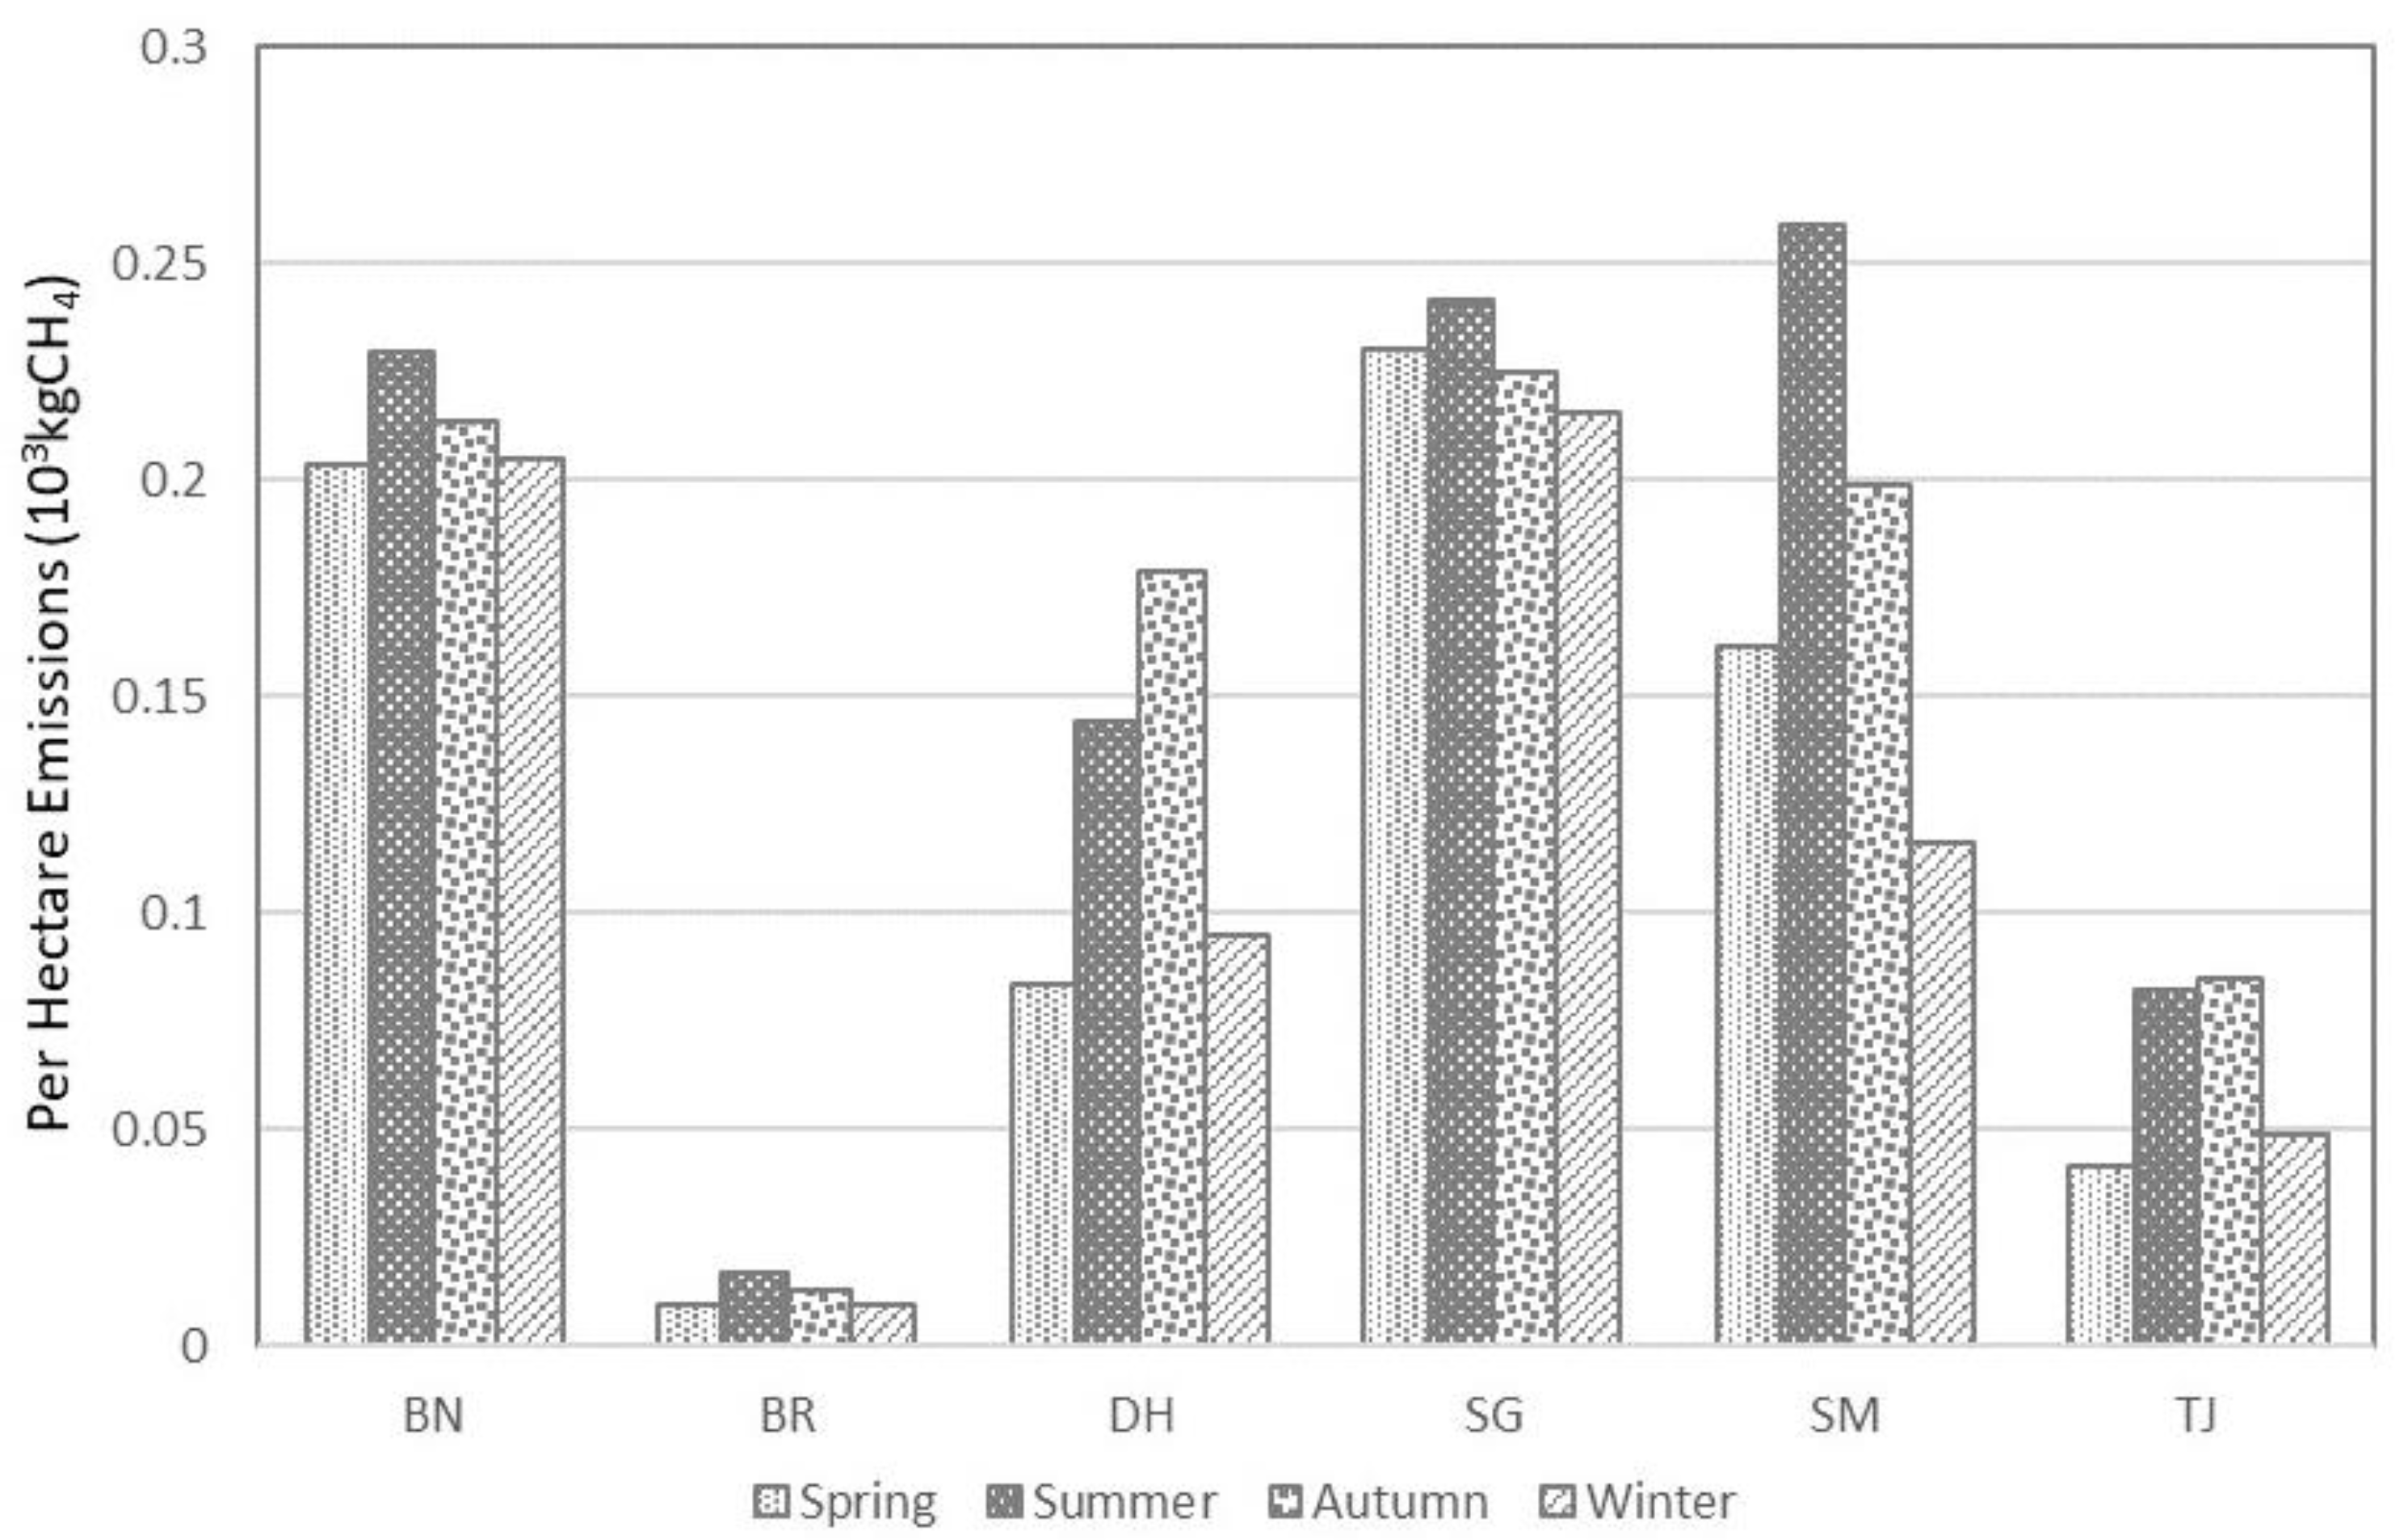
Note that the amount of per hectare methane emissions from the reservoir BR is significantly less than others, which may be contributed to the fact that the reservoir BR is mainly used for drinking water supply and the management of water quality is fairly rigorous. A relatively moderate variation is observed among the other reservoirs mainly used for agriculture. The reservoir SG exhibit the largest per hectare annual emissions of 911 kg CH4. Rim and Shin [24] pointed out that the water quality of SG is deteriorated because of increased phytoplankton biomass with rich nutrient flowing from the upper stream of watershed. It is also confirmed that the reservoir SG exhibits consistently higher adjustment factors across the year. Since the emissions are affected proportionately to the surface area, the seasonal estimates of per hectare methane emissions from individual reservoirs are compared to reduce the scale differences, which is depicted in Figure 3. Noticeable differences in seasonal estimates can be observed for the reservoirs BR, DH, SM, and TJ whereas the methane emissions from BN and SG do not much differ season by season.
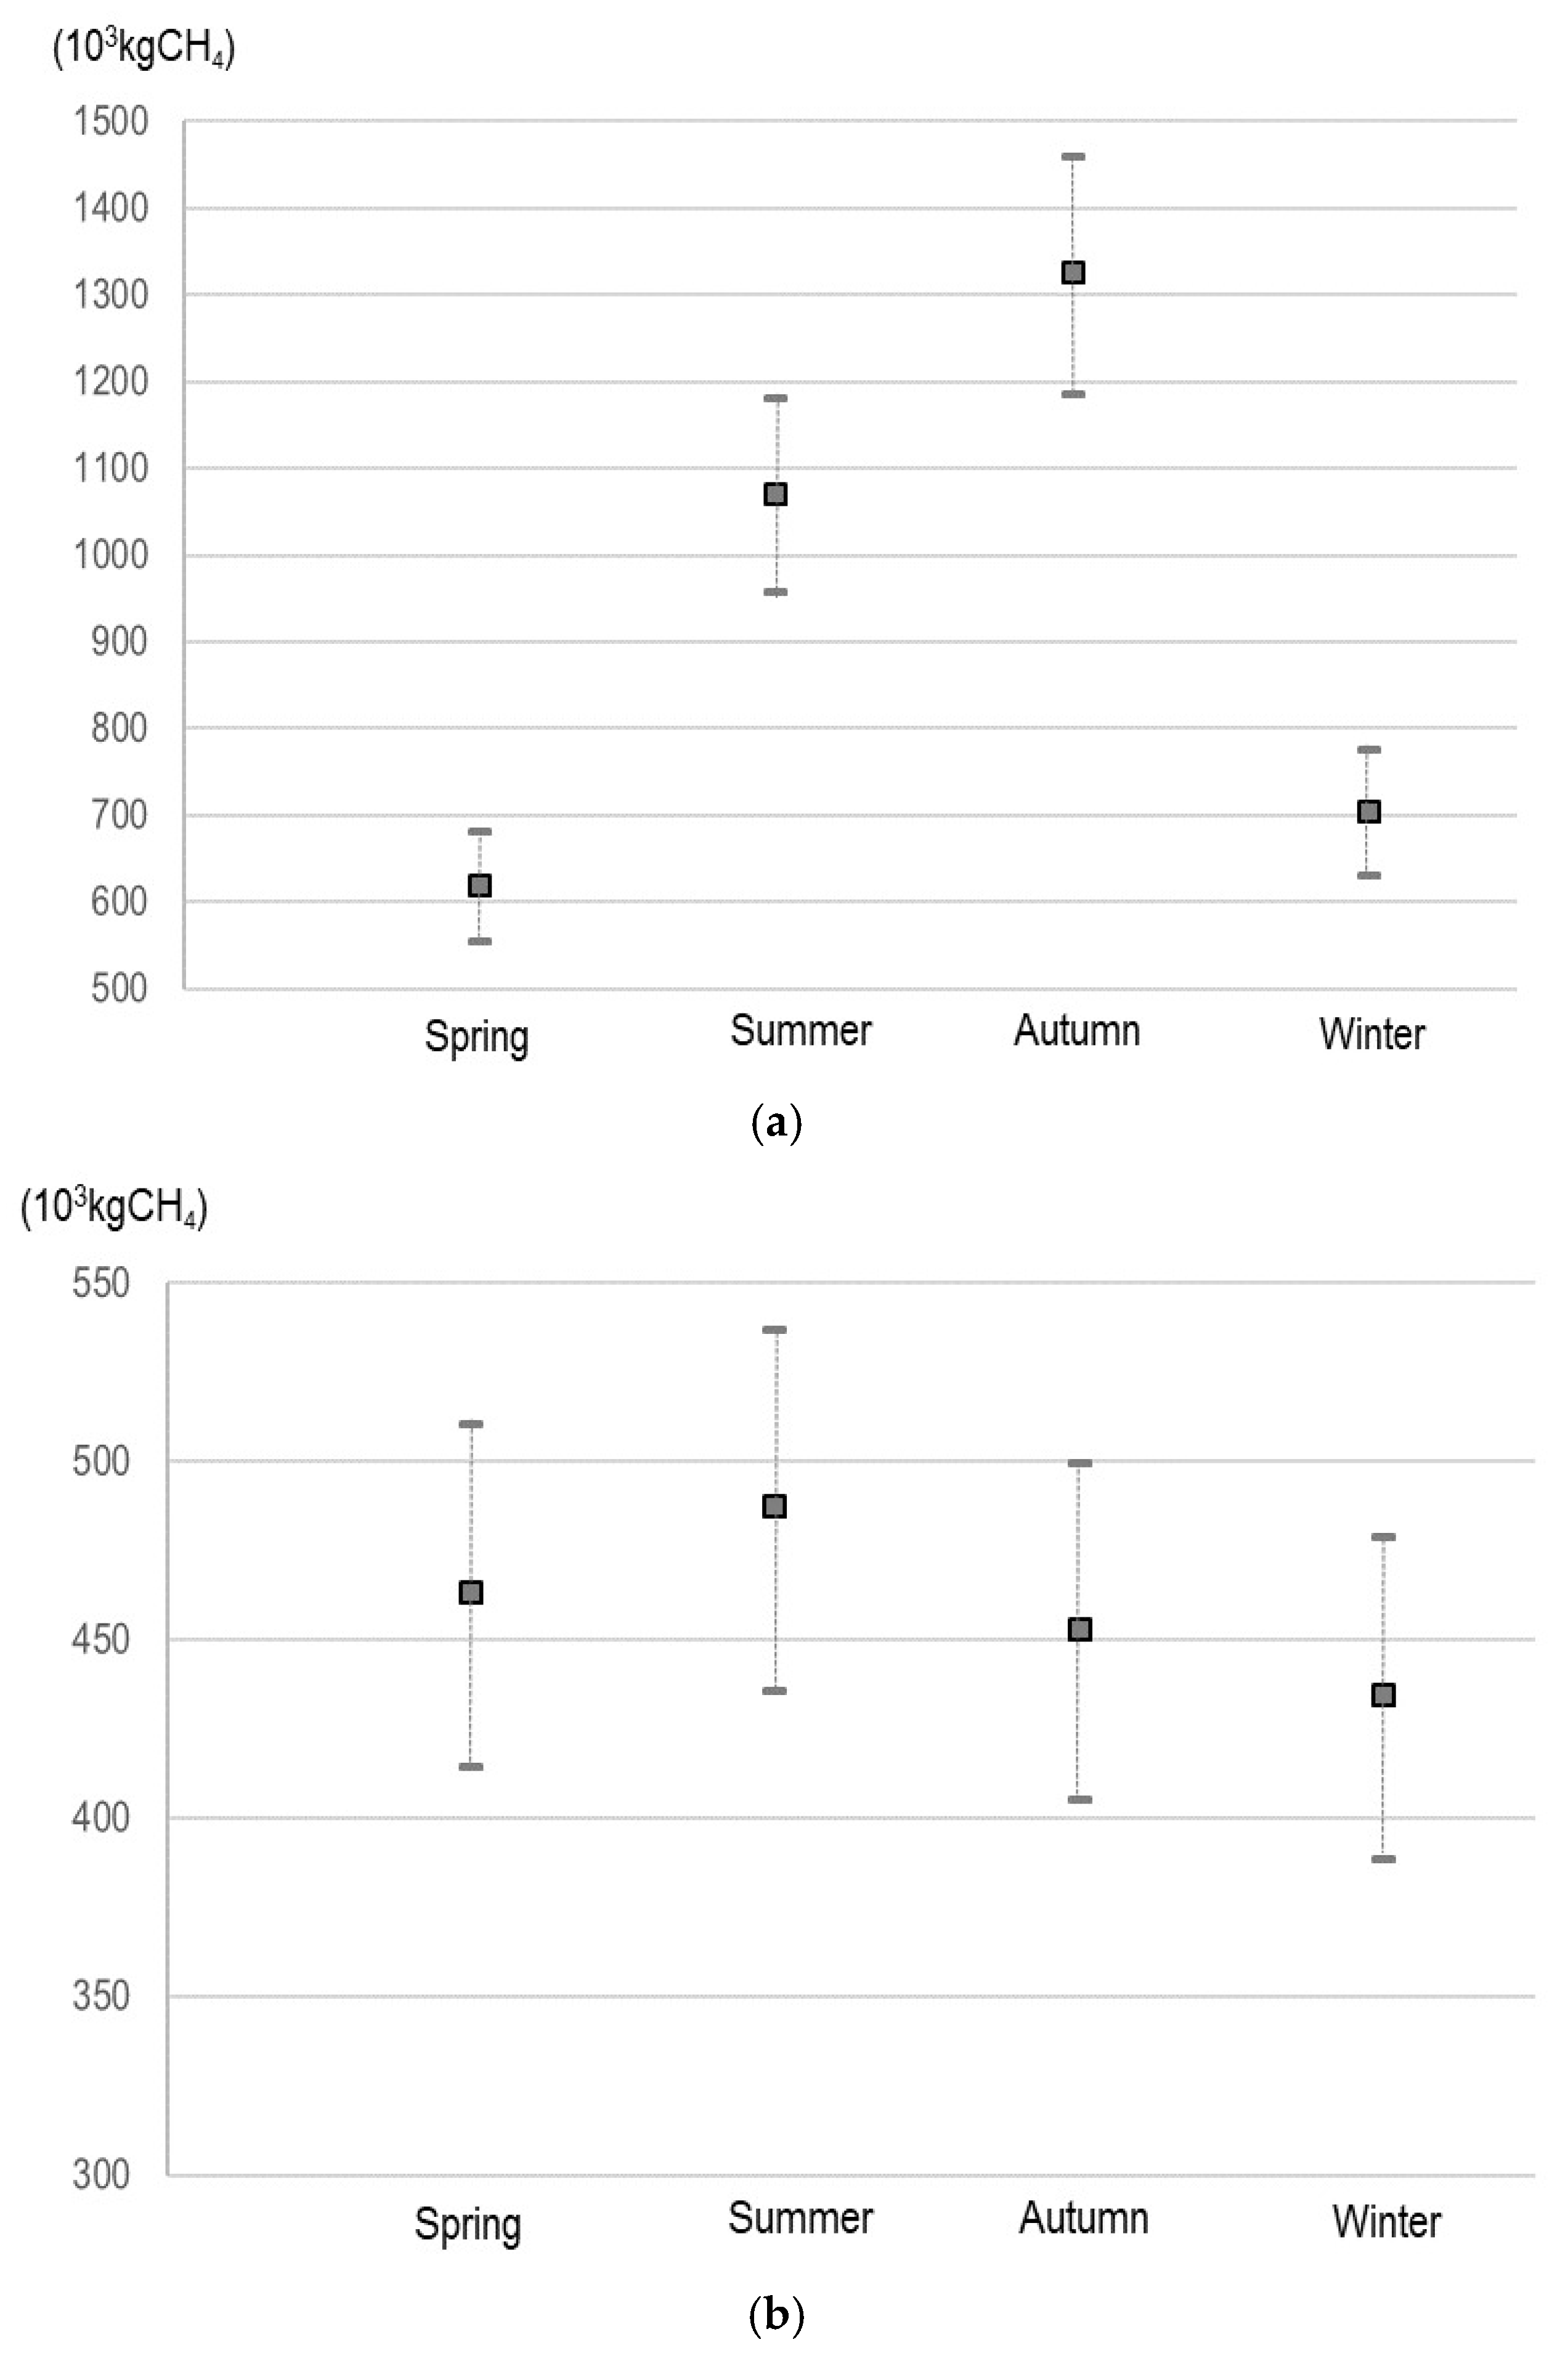
Statistical analysis can be useful to determine whether there exist statistically significant differences in methane emissions season by season. For the sake of demonstration, the confidence intervals (CIs) of seasonal emissions estimation from DH and SG are derived and depicted in Figure 4. As shown in Figure 4a, the largest amount of methane is emitted in Autumn with mean 1,325,331 kg CH4 and 95% CI of (1,185,435, 1,460,318). The annual total emissions from DH sum up to 3,719,442 kg CH4 and its 95% CI is (3,326,834, 4,098,274). It should be noted that the pairwise comparison of CIs reveals the existence of statistically significant differences in seasonal emissions with the significance level of 5%. To the contrary, all the 95% CIs of seasonal estimates of methane emissions from SG overlap with each other, as shown in Figure 4b, implying that the amount of methane emission does not differ significantly from the statistical point of view with the significance level of 5%. While emissions from DH are fluctuating seasonally to a great extent, a relatively stable amount of methane emissions is observed across the year. It is concluded that the seasonal behavior of methane emissions is quite different from one reservoir to another and it is closely related to the seasonal trophic states of individual reservoirs.
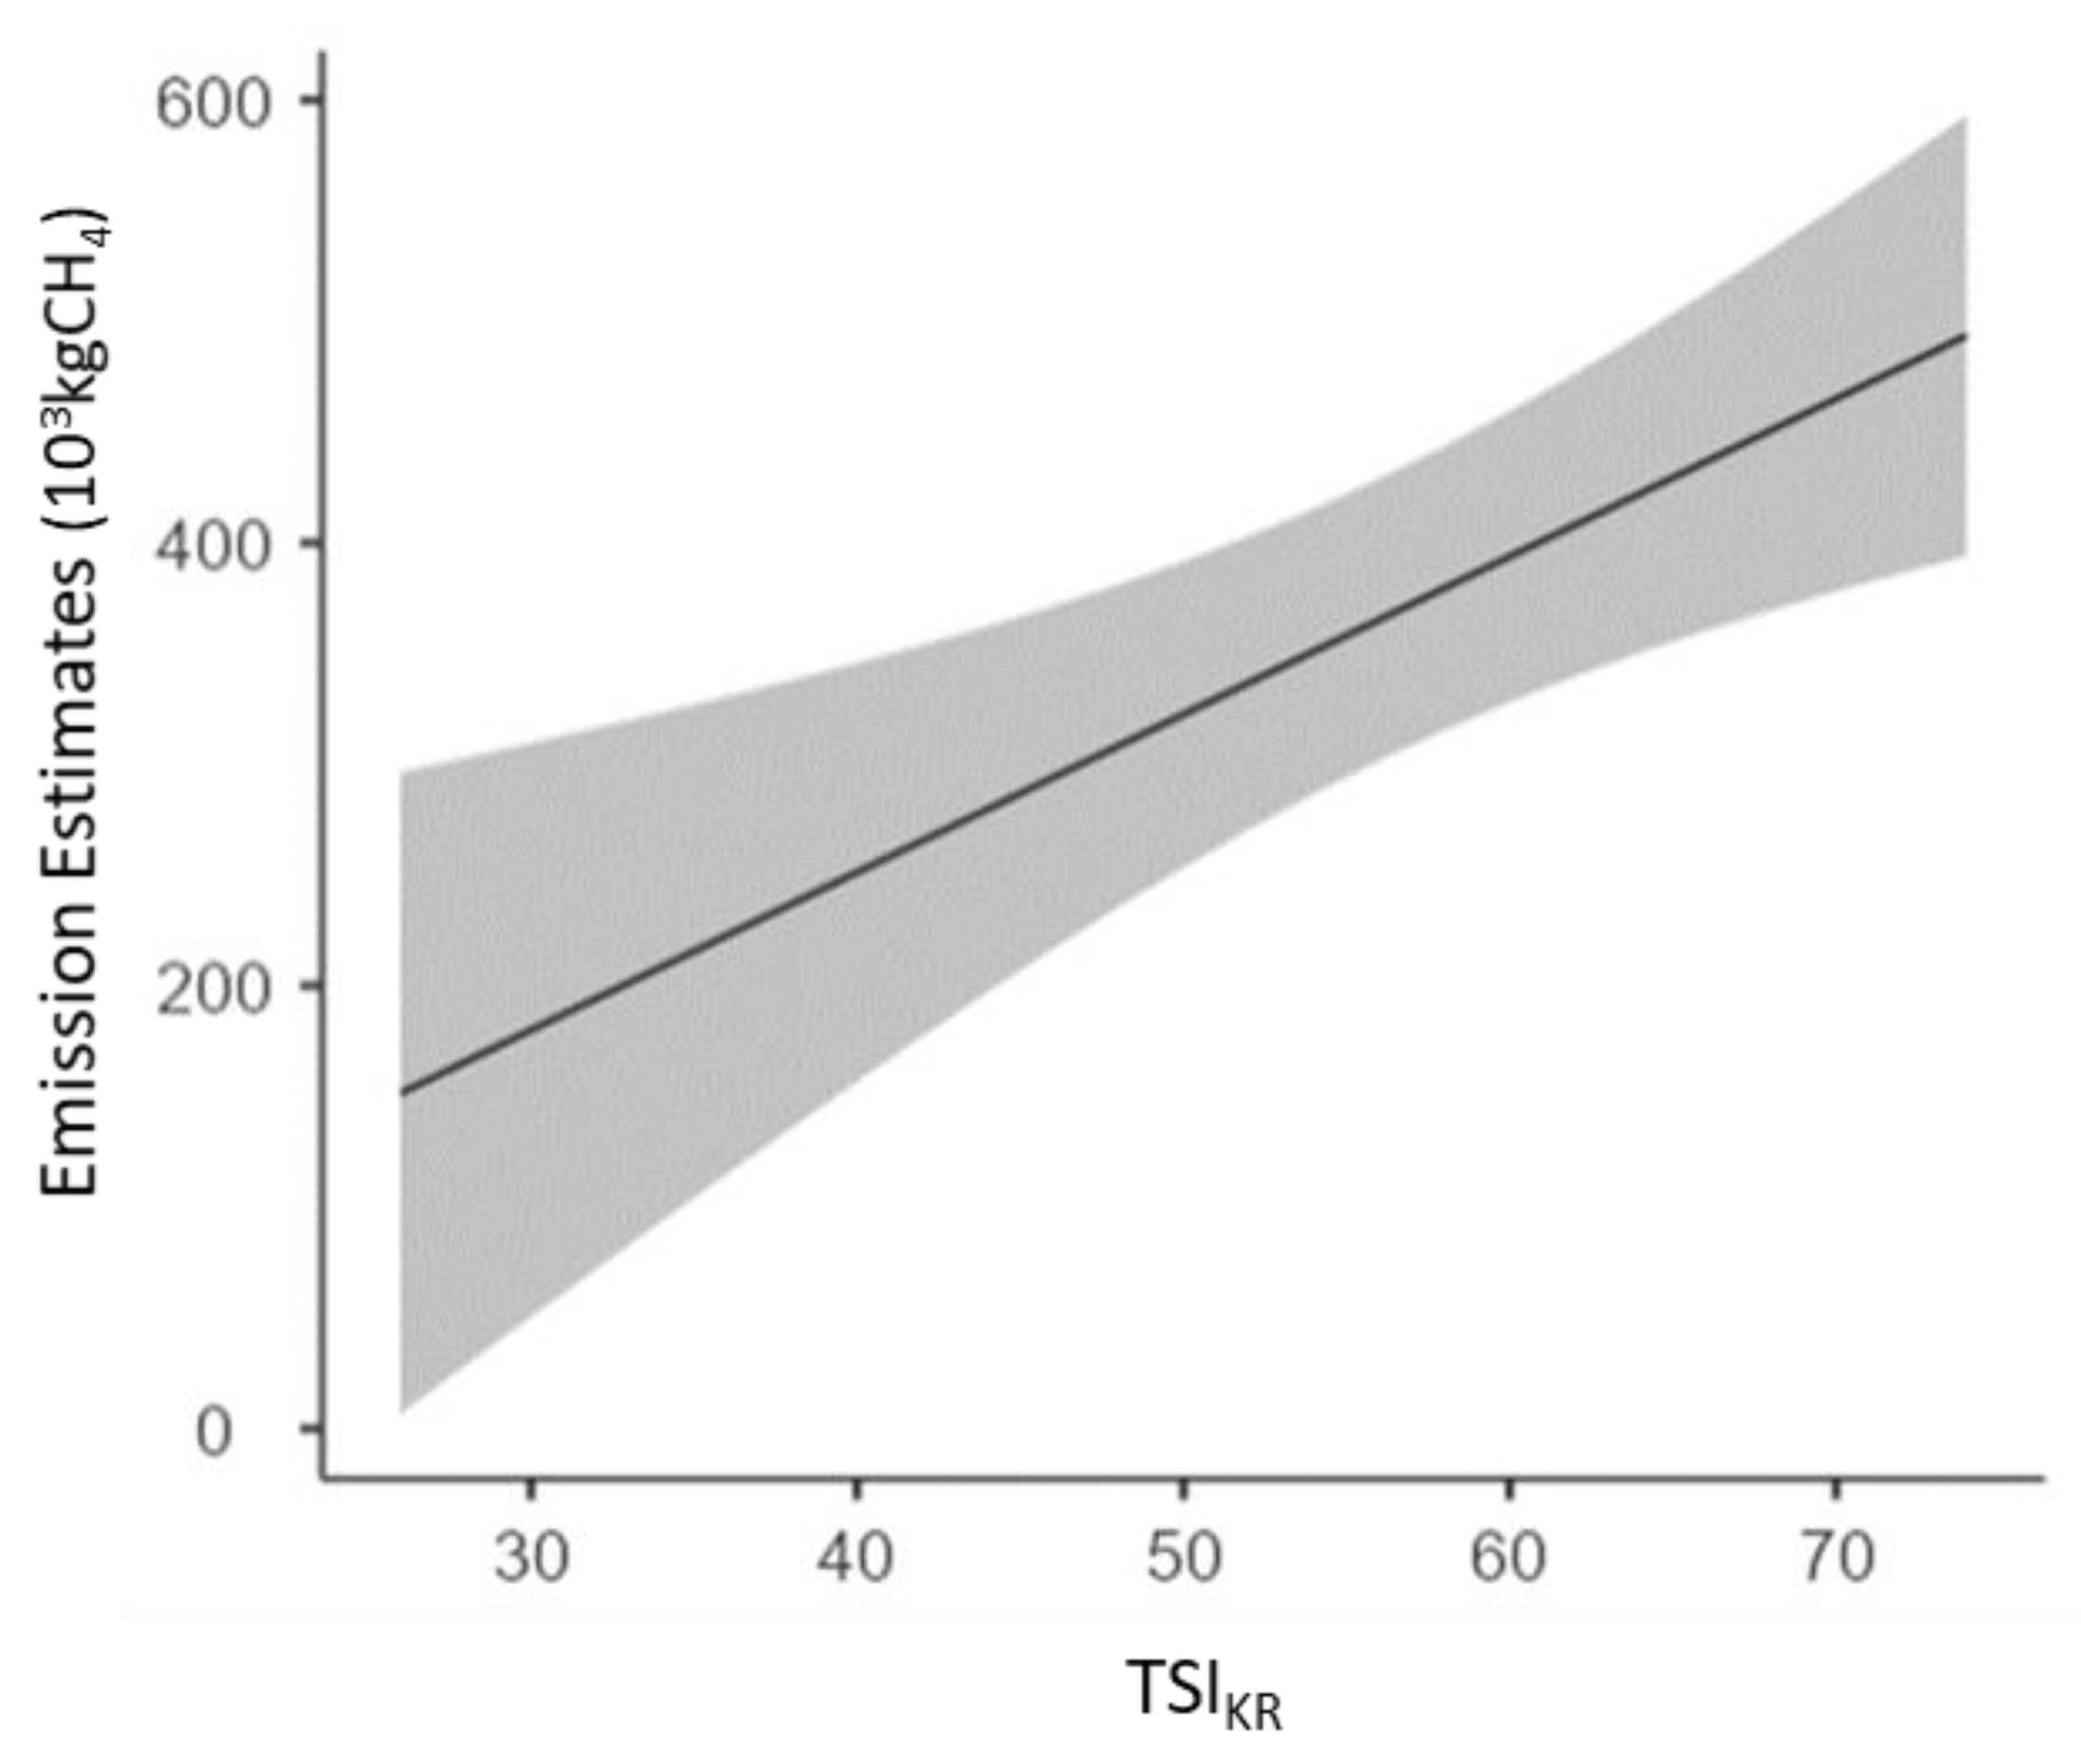
The procedure prescribed in [3] emphasizes the influence of trophic states on emissions estimation from wetland, which is further investigated by way of regression analysis. The estimates of seasonal methane emissions are regressed against surface area and the results from trophic state assessment. It is assumed that the surface area of reservoirs is constant over the years, which seems unreasonable but can be accounted for whenever sufficient data are provided. The omnibus analysis of variance (ANOVA) table and corresponding model coefficients are provided in Table 5 and Table 6, respectively, all of which indicate the statistical significance of regression model. The coefficient of determination is 0.872 implying that 87.2% of variations in the emission estimates can be explained by the model. One of the advantages of regression model is that it can be used for the purpose of prediction. The marginal means plot with respect to is constructed for a reservoir with the average surface area as depicted in Figure 5. The straight line and gray area represent the predictions on emission estimates and their 95% CI, respectively. The estimated marginal means of emission estimates are summarized in Table 7. For example, the emission estimate for a reservoir with average surface area and the mean is predicted to be 367 with the 95% CI of (303,430) measured in 103 kg CH4.
4. Conclusions
The GHG emissions from wetlands including reservoirs have received less attention from researchers in spite of their enormous impact on global warming mainly because of the low data availability. The 2019 Refinement has been adopted to embrace recent technological development and scientific advances in improving the national GHG inventories. This study is aimed at demonstrating the application of refinement for estimating the methane emissions from reservoirs in Korea. More specifically, the results from tropic state assessment for individual reservoirs are accounted for by deriving the adjusted emission factors. The Korean trophic state index is used for identifying the trophic class of reservoirs to take regional environmental characteristics into account. Additionally, the trophic state assessment is performed season by season in an effort to include the seasonal variations in the estimation of methane emissions from reservoirs. It is observed that the magnitude of seasonal variations greatly differs among reservoirs and the emissions are highly dependent upon the main use of reservoirs which affect their management practice for water quality. The differences in methane emissions are tested for their statistical significance by means of confidence intervals, and the statistically significant differences are confirmed for the reservoirs which exhibit greater seasonal variations in the trophic state assessment. Furthermore, it is shown that the emission estimates can effectively be obtained by employing the regression analysis, which may render the functional relationship between emission estimates and trophic state indices. It is thus expected that, given the surface area and seasonal trophic state index, the emission estimates of methane from the reservoir can be predicted from the statistical perspective.
To the best of authors’ knowledge, this study is one of the first attempts to apply the refinement for estimating methane emissions from wetlands. However, one of the major limitations of this study comes from the lack of validation procedure for emission estimates. Even though carried out as per the guidelines provided by IPCC, the emissions estimation still needs to be validated against the actual measurement data on the methane emissions from reservoirs. Another limitation of this study is the deficiency of uncertainty assessment to explain the sources of variations in emission estimates except for the trophic states of reservoirs. Further research efforts thus need to be directed towards securing data availability from a wide variety of different geographical contexts. In addition, more accurate estimations and even predictions on methane emissions from wetlands may be enabled by applying advanced analysis methods of statistics and data analytics. Despite unaccounted for uncertainties and opportunities for potential improvement, the procedure outlined above may provide useful tips and guidelines for an effective estimation of methane emissions from reservoirs with the considerations of regional and seasonal variations in emissions behavior.
Author Contributions
Conceptualization, C.P. and Y.J.K.; methodology, Y.C.; formal analysis, Y.C. and Y.J.K.; data curation, Y.C.; writing—original draft preparation, Y.J.K.; writing—review and editing, C.P.; supervision, C.P.; funding acquisition, Y.J.K. All authors have read and agreed to the published version of the manuscript.
Funding
This research was supported by Basic Science Research Program through the National Research Foundation of Korea (NRF) funded by the Ministry of Education (2021R1I1A3047456).
Institutional Review Board Statement
Not Applicable.
Informed Consent Statement
Not Applicable.
Data Availability Statement
Not Applicable.
Conflicts of Interest
The authors declare no conflict of interest. The funders had no role in the design of the study; in the collection, analyses, or interpretation of data; in the writing of the manuscript, or in the decision to publish the results.
Abbreviation
| ANOVA | Analysis of Variance |
| BN | Bunam Reservoir (Name) |
| BR | Boryeong Reservoir (Name) |
| Chl-a | Chlorophyll-a |
| CI | Confidence Interval |
| COD | Chemical Oxygen Demand |
| DH | Daeho Reservoir (Name) |
| GHG | Greenhouse Gas |
| G-Res | Greenhouse Gas Reservoir Tool |
| IPCC | Intergovernmental Panel on Climate Change |
| SD | Secchi Depth |
| SG | Sapgyo Reservoir (Name) |
| SM | Seokmum Reservoir (Name) |
| TI | Trophic Index |
| TJ | Tapjeong Reservoir (Name) |
| TN | Total Nitrogen |
| TP | Total Phosphorus |
| TSI | Trophic State Index |
Nomenclature
| Emission adjustment factor for trophic state in reservoir within a given climate zone | |
| Total area of water surface for reservoir located in climate zone (in hectare) | |
| Methane emission factor from reservoirs more than 20 years old located in climate zone (in kg CH4/year/hectare) | |
| Annual reservoir surface emissions of methane from all reservoirs more than 20 years old (in kg CH4/year) | |
| Annual emissions of methane originating from all reservoirs but emitted their downstream (in kg CH4/year) | |
| Total annual methane emission from all reservoirs more than 20 years old (in kg CH4/year) | |
| Number of reservoirs more than 20 years old in climate zone | |
| Ratio of total downstream emission of methane to the total flux of methane from the reservoir surface | |
| Korean Trophic State Sub-Index based on the measurement of Chl-a | |
| Korean Trophic State Sub-Index based on the measurement of COD | |
| Korean Trophic State Sub-Index based on the measurement of TP | |
| Overall Korean Trophic State Index |
References
- IPCC. 2006 IPCC Guidelines for National Greenhouse Gas Inventories, Chapter 7; Wetlands, Intergovernmental Panel on Climate Change: Geneva, Switzerland, 2006; Volume 4. [Google Scholar]
- Harrison, J.A.; Prairie, Y.T.; Mercier-Blais, S.; Soued, C. Year-2020 Global Distribution and Pathways of Reservoir Methane and Carbon Dioxide Emissions According to the Greenhouse Gas from Reservoirs (G-res) Model. Glob. Biogeochem. Cycles 2021, 35, e2020GB006888. [Google Scholar] [CrossRef]
- IPCC. 2019 Refinement to the 2006 IPCC Guidelines for National Greenhouse Inventories, Chapter 7; Wetlands, Intergovernmental Panel on Climate Change: Geneva, Switzerland, 2019; Volume 4. [Google Scholar]
- Comyn-Platt, E.; Hayman, G.; Huntingford, C.; Chadburn, S.E.; Burke, E.J.; Harper, A.B.; Collins, W.J.; Webber, C.P.; Powell, T.; Cox, P.M.; et al. Carbon Budgets for 1.5 and 2 °C Targets Lowered by Natural Wetland and Permafrost Feedbacks. Nat. Geosci. 2018, 11, 568–573. [Google Scholar] [CrossRef]
- Bridgham, S.; Megonigal, P.; Keller, J.K.; Bliss, N.B. The Carbon Balance of North American Wetlands. Wetlands 2006, 26, 889–916. [Google Scholar] [CrossRef]
- Richards, B.; Craft, C.B. Greenhouse Gas Fluxes from Restored Agricultural Wetlands and Natural Wetlands, Northwestern Indiana. In The Role of Natural and Constructed Wetlands in Nutrient Cycling and Retention on the Landscape; Vymazal, J., Ed.; Springer: Berlin/Heidelberg, Germany, 2015; pp. 17–32. [Google Scholar]
- Zhang, Z.; Zimmermann, N.E.; Stenke, A.; Li, X.; Dodson, E.L.; Zhu, G.; Huang, C.; Poulter, B. Emerging Role of Wetland Methane Emissions in Driving 21st Century Climate Change. Proc. Natl. Acad. Sci. USA 2017, 114, 9647–9652. [Google Scholar] [CrossRef] [PubMed] [Green Version]
- Barros, N.; Cole, J.J.; Tranvik, L.J.; Prairie, Y.T.; Bastviken, D.; Huszar, V.L.M.; del Giorgio, P.; Roland, F. Carbon Emission from Hydroelectric Reservoirs Linked to Reservoir Age and Latitude. Nat. Geosci. 2011, 4, 593–596. [Google Scholar] [CrossRef]
- Bastviken, D.; Tranvik, L.J.; Downing, J.A.; Crill, P.M.; Enrich-Prast, A. Freshwater Methane Emissions Offset the Continental Carbon Sink. Science 2011, 331, 50. [Google Scholar] [CrossRef] [PubMed] [Green Version]
- Cole, J.J.; Prairie, Y.T.; Caraco, N.F.; McDowell, W.H.; Tranvik, L.J.; Striegl, R.G.; Duarte, C.M.; Kortelainen, P.; Downing, J.A.; Middelburg, J.J.; et al. Plumbing the Global Carbon Cycle: Integrating Inland Waters into the Terrestrial Carbon Budget. Ecosystems 2007, 10, 172–185. [Google Scholar] [CrossRef] [Green Version]
- St. Louis, V.L.; Kelly, C.A.; Duchemin, C.A.É.; Rudd, J.W.; Rosenberg, D.M. Reservoir Surfaces as Sources of Greenhouse Gases to the Atmosphere: A Global Estimate. Bioscience 2000, 50, 766–775. [Google Scholar] [CrossRef]
- Beaulieu, J.J.; Waldo, S.; Balz, D.A.; Barnett, W.; Hall, A.; Platz, M.C.; White, K.M. Methane and Carbon Dioxide Emissions from Reservoirs: Controls and Upscaling. J. Geophys. Res. Biogeosci. 2019, 125, e2019JG005474. [Google Scholar] [CrossRef] [PubMed]
- GIR. 2019 National Greenhouse Gas Inventory Report of Korea; Greenhouse Gas Inventory and Research Center (GIR): Chungbuk, Korea, 2019.
- Prairie, Y.; Alm, J.; Harby, A.; Mercier-Blais, S.; Nahas, R. The GHG Reservoir Tool (G-res) Technical Documentation, UNESCO/IHA Research Project on the GHG Status of Freshwater Reservoirs (Version 1.12); The International Hydropower Association: London, UK, 2017. [Google Scholar]
- Park, H.G.; Jang, B.S. Introduction to Large Dams in Korea. J. Korean Soc. Civ. Eng. 2005, 53, 206–218. [Google Scholar]
- Carlson, R.E. A Trophic State Index for Lakes. Limnol. Oceanogr. 1977, 22, 361–369. [Google Scholar] [CrossRef] [Green Version]
- Aizaki, M.; Otsuki, A.; Fukushima, T.; Kawai, T.; Hosomi, M.; Muraoka, K. Application of Modified Carlson’s Trophic State Index to Japanese Lakes and Its Relationships to Other Parameters Related to Trophic State; National Institute for Environmental Studies: Tsukuba, Japan, 1981. [Google Scholar]
- NIER. Water Quality Assessment Method and Index Development; National Institute of Environmental Research: Incheon, Korea, 2006.
- Kim, E.; Sim, K.; Kim, S.; Choi, H.I. Water Quality Assessment for Reservoirs Using the Korean Trophic State Index. J. Korean Soc. Water Environ. 2012, 28, 78–83. [Google Scholar]
- Ahn, D.H.; Han, S.K.; Jo, S.J.; Lim, M. Water Quality Assessment for Geumgang River Area using the Korean Trophic State Index. J. Water Treat. 2013, 21, 13–20. [Google Scholar]
- Oh, H.J.; Jeong, H.G.; Nam, G.S.; Oda, Y.; Dai, W.; Lee, E.H.; Kong, D.; Hwang, S.J.; Chang, K.H. Comparison of Taxon-Based and Trophi-Based Response Patterns of Rotifer Community to Water Quality: Applicability of the Rotifer Functional Group as an Indicator of Water Quality. Anim. Cells Syst. 2017, 21, 133–140. [Google Scholar] [CrossRef]
- Park, J.B.; Gal, B.S.; Lee, C.K.; Hong, S.H.; Choi, M.J.; Seo, H.S. Analysis of the Trophic Characteristics of the So-Oak River Watershed Using the Korean Trophic State Index. J. Wetl. Res. 2018, 20, 330–337. [Google Scholar]
- Kim, B.C.; Kong, D.S. Examination of the Applicability of TOC to Korean Trophic State Index. J. Korean Soc. Water Environ. 2019, 35, 271–277. [Google Scholar]
- Rim, C.S.; Shin, J.K. Cluster and Factor Analyses Using Water Quality Data in the Sapkyo Reservoir Watershed. J. Korea Water Resour. Assoc. 2002, 35, 149–159. [Google Scholar]
Figure 1.
Seasonal Trophic State Assessment of Individual Reservoirs.

Figure 2.
Relationship between Trophic State Index and Adjustment Factor.

Figure 3.
Comparison of Seasonal Estimates of Methane Emissions from Individual Reservoirs.

Figure 4.
Mean and 95% CI of Methane Emissions by Season. (a) Reservoir DH. (b) Reservoir SG.

Figure 5.
Estimated Marginal Means Plot.


Table 1.
Information of Six Reservoirs.
| Name (Abbreviation) | Basin Area (ha) | Surface Area (ha) | Water Storage Capacity (103 m3) | Main Use |
|---|---|---|---|---|
| Bunam (BN) | 15,720 | 3560 | 21,100 | Agriculture |
| Boryeong (BR) | 16,360 | 217 | 116,900 | Water Supply |
| Daeho (DH) | 31,215 | 7419 | 112,000 | Agriculture |
| Sapgyo (SG) | 163,950 | 2017 | 84,082 | Agriculture |
| Seokmun (SM) | 1750 | 59 | 975 | Agriculture |
| Tapjeong (TJ) | 21,880 | 636 | 31,927 | Agriculture |
Table 2.
Classification of Trophic Class Based on the Value of
| Range of | Trophic Class | Range (Recommended Value) for Adjustment Factor |
|---|---|---|
| 0~30 | Oligotrophic | 0.7 (0.7) |
| 30~50 | Mesotrophic | 0.7~5.3 (3.0) |
| 50~70 | Eutrophic | 5.3~14.5 (10.0) |
| 70~100+ | Hypertrophic | 14.5~39.4 (25.0) |
Table 3.
Seasonal Assessment of Trophic State and Corresponding Adjustment Factor.
| Reservoir | Season | Trophic Class | Interpolated Adjustment Factor | ||
|---|---|---|---|---|---|
| Mean (Std. Error) | |||||
| BN | Spring | 68.57 | (2.63) | Eutrophic | 13.84 |
| Summer | 71.30 | (2.91) | Hypertrophic | 15.58 | |
| Autumn | 70.00 | (1.90) | Eutrophic | 14.50 | |
| Winter | 68.69 | (2.14) | Eutrophic | 13.90 | |
| BR | Spring | 26.81 | (1.30) | Oligotrophic | 0.63 |
| Summer | 31.92 | (1.62) | Mesotrophic | 1.14 | |
| Autumn | 30.68 | (0.94) | Mesotrophic | 0.86 | |
| Winter | 27.07 | (0.71) | Oligotrophic | 0.63 | |
| DH | Spring | 50.81 | (1.08) | Eutrophic | 5.67 |
| Summer | 59.80 | (1.13) | Eutrophic | 9.81 | |
| Autumn | 64.86 | (2.80) | Eutrophic | 12.14 | |
| Winter | 52.49 | (1.40) | Eutrophic | 6.45 | |
| SG | Spring | 71.34 | (2.01) | Hypertrophic | 15.61 |
| Summer | 72.31 | (1.88) | Hypertrophic | 16.42 | |
| Autumn | 70.93 | (1.99) | Hypertrophic | 15.27 | |
| Winter | 70.17 | (1.72) | Hypertrophic | 14.64 | |
| SM | Spring | 62.34 | (2.46) | Eutrophic | 10.98 |
| Summer | 73.74 | (6.11) | Hypertrophic | 17.60 | |
| Autumn | 67.86 | (1.88) | Eutrophic | 13.52 | |
| Winter | 55.60 | (0.73) | Eutrophic | 7.88 | |
| TJ | Spring | 39.19 | (2.63) | Mesotrophic | 2.81 |
| Summer | 50.59 | (1.30) | Eutrophic | 5.57 | |
| Autumn | 51.01 | (1.91) | Eutrophic | 5.76 | |
| Winter | 41.28 | (2.06) | Mesotrophic | 3.29 | |
Table 4.
Estimates of Annual Methane Emissions from Reservoirs (103 kg CH4).
| Reservoir | Spring | Summer | Autumn | Winter | Total | Per Hectare |
|---|---|---|---|---|---|---|
| BN | 725.0 | 816.2 | 759.6 | 728.2 | 3028.9 | 0.851 |
| BR | 2.0 | 3.6 | 2.7 | 2.0 | 10.4 | 0.048 |
| DH | 619.0 | 1071.0 | 1325.3 | 704.2 | 3719.4 | 0.501 |
| SG | 463.3 | 487.3 | 453.2 | 434.5 | 1838.4 | 0.911 |
| SM | 9.5 | 15.3 | 11.7 | 6.8 | 43.3 | 0.735 |
| TJ | 26.3 | 52.1 | 53.9 | 30.8 | 163.1 | 0.256 |
Table 5.
Omnibus ANOVA Table.
| Sources of Variation | Sum of Squares | Degree of Freedom | Mean Square | F-Value | p-Value |
|---|---|---|---|---|---|
| Surface Area | 2.22 × 10⁶ | 1 | 2.22 × 10⁶ | 98.7 | <0.001 |
| 266,863 | 1 | 266,863 | 11.9 | 0.002 | |
| Residuals | 472,579 | 21 | 22,504 |
Table 6.
Summary of Regression Model Coefficients.
| Predictor | Estimate | Standard Error | 95% CI | t-Value | p-Value | |
|---|---|---|---|---|---|---|
| Lower | Upper | |||||
| Intercept | −320.023 | 115.3802 | −559.9692 | −80.077 | −2.77 | 0.011 |
| Surface Area | 0.123 | 0.0124 | 0.0976 | 0.149 | 9.94 | <0.001 |
| 7.127 | 2.0696 | 2.8230 | 11.431 | 3.44 | 0.002 | |
Table 7.
Estimated Marginal Means Table.
| Marginal Mean | Standard Error | 95% CI | ||
|---|---|---|---|---|
| Lower | Upper | |||
| 40.4 (1) | 254 | 44.8 | 161 | 347 |
| 56.2 (2) | 367 | 30.6 | 303 | 430 |
| 72.1 (3) | 480 | 44.8 | 386 | 573 |
(1) mean ()–stdev (); (2) mean (); (3) mean () + stdev ().
Publisher’s Note: MDPI stays neutral with regard to jurisdictional claims in published maps and institutional affiliations. |
© 2022 by the authors. Licensee MDPI, Basel, Switzerland. This article is an open access article distributed under the terms and conditions of the Creative Commons Attribution (CC BY) license (https://creativecommons.org/licenses/by/4.0/).
Share and Cite
MDPI and ACS Style
Chung, Y.; Paik, C.; Kim, Y.J. Estimation of Methane Emissions from Reservoirs Based on Country-Specific Trophic State Assessment in Korea. Water 2022, 14, 562. https://doi.org/10.3390/w14040562
AMA Style
Chung Y, Paik C, Kim YJ. Estimation of Methane Emissions from Reservoirs Based on Country-Specific Trophic State Assessment in Korea. Water. 2022; 14(4):562. https://doi.org/10.3390/w14040562
Chicago/Turabian StyleChung, Yongjoo, Chunhyun Paik, and Young Jin Kim. 2022. "Estimation of Methane Emissions from Reservoirs Based on Country-Specific Trophic State Assessment in Korea" Water 14, no. 4: 562. https://doi.org/10.3390/w14040562
Note that from the first issue of 2016, this journal uses article numbers instead of page numbers. See further details here.