
Reported Occurrence of Multiscale Flooding in an Alpine Conurbation over the Long Run (1850–2019)
by
 , and
, and
Jean-Dominique Creutin
1, 
Juliette Blanchet
1,*,
Alix Reverdy
1,
Antoine Brochet
1,
Céline Lutoff
2 and
Yannick Robert
3 1
IGE, Grenoble INP, IRD, CNRS, Grenoble University Grenoble Alpes, F-38000 Grenoble, France
2
Pacte, Science Po Grenoble, CNRS, University Grenoble Alpes, F-38000 Grenoble, France
3
RTM-ONF, F-38000 Grenoble, France
*
Author to whom correspondence should be addressed.
Water 2022, 14(4), 548; https://doi.org/10.3390/w14040548
Submission received: 31 December 2021
/
Revised: 2 February 2022
/
Accepted: 10 February 2022
/
Published: 12 February 2022
(This article belongs to the Topic Natural Hazards and Disaster Risks Reduction)
Abstract
:This paper deals with the identification of extreme multiscale flooding events in the Alpine conurbation of Grenoble, France. During such events, typically over one to several days, the organization in space and time of the generating hydrometeorological situation triggers the concurrent reaction of varied sets of torrents and main rivers and creates diverse socioeconomic damages and disruptions. Given the limits of instrumental data over the long run, in particular at the torrent scale, we explore the potential of a database of reported extreme flood events to study multiscale flooding over a Metropolitan domain. The definition of Metropolitan events is mainly based on the database built by the RTM (Restauration des Terrains de Montagne, a technical service of the French Forest Administration). Relying on expert reports, the RTM database covers the long lifetime of this French national service for the management of mountainous areas (1850–2019). It provides quantitative information about the time and place of inundation events as well as qualitative information about the generating phenomena and the consequent damages. The selection process to define Metropolitan events simply chronologically explores the RTM database and complements it with historical research data. It looks for concurrence between site events at the same date under a chosen set of criteria. All scales together, we selected 104 Metropolitan events between 1850 and 2019. Exploring the list of dates, we examine the homogeneity of the Metropolitan events over 1850–2019 and their space–time characteristics. We evidence the existence of multiscale flooding at the Metropolitan scale, and we discuss some implications for flood risk management.
1. Introduction
Many conurbations in the Alps, Grenoble (France), have experienced numerous disastrous floods throughout history [1]. Orography favors the combination of abundant atmospheric precipitation and fast hydrologic concentration, driven by steep upper-watersheds with flashflood streams—called torrents in the Alps—and flat glacial valleys with meandering rivers. Urban areas situated in valleys are prone to combinations of torrential and riverine floods covering a range of vulnerable basin areas, say, from 1 to 10,000 km2 in the case of Grenoble.
A myriad of available studies deal with point estimates of flood occurrence in support of specific projects of urban development and water management. Most refined studies concern riverine flooding at the instrumented scale of basins over several hundreds of km2. At the torrent scale, available studies are most of the time a list of ‘reported’ site events for which historical information is available from a variety of possible sources. Torrential flooding is still a research issue pertaining to the “Problem of Ungauged Basins” [2], meaning scarce data conditions that prevent understanding runoff production [3,4].
Dealing with rare values, extreme flood occurrence studies need a long series of data. Should they be on rivers or torrents, they often face a certain paucity of instrumental data and are rarely based on runoff data alone. They follow different ways to “augment” the dataset size using either complementary instrumental data or proxies.
Quantitative hydrology extended instrumental data collection in space with the regional frequency analysis, which assumes statistical homogeneity of flood characteristics over a region and which allows flood frequency assessment over a set of basins [5]. The instrumental data extension may also consist of moving from discharge to other variables that are easier to collect. We find here, for instance, the ‘Gradex’ idea that integrates rainfall information into flood frequency analysis [6] also known as the derived distribution approach of [7,8].
Over recent decades, Palaeoflood hydrology explored different ways to extend flood data series over pre-instrumental periods using a variety of historical, botanical, and geological archives [9] (for a review). In the study region, historical [10], biological and historical [11], and paleographic studies [12] span over space scales ranging from small altitude torrents to main river streams. Both historical and paleographic data have been theoretically shown to improve extreme flood assessment [13,14]. Regional analyses may also merge space and time extensions, mixing reported historical peak flows at ungauged sites, reputed to be the maximum flood over the study period and introducing scaling properties to cover a variety of watershed surfaces [15]. Beyond palaeoflood hydrology, a variety of socioeconomic proxies are also used, such as insurance claims ([16]) or press releases [17].
In this important body of work, only a few studies explicitly tackled the question of multiscale flooding. During a generating hydrometeorological event, typically over one to several days, the storm organization in space and time triggers the concurrent reaction of a set of torrents and rivers. The multi-facets nature of multiscale flooding controls the extent of direct damages, in particular in the sensitive areas of confluence between torrents [18] or urban drainage and rivers ([19]). It also critically governs systemic disruptions, combining failures on networks such as transport [20,21,22] and energy [23] and impacting emergency response [24], businesses, and more generally the daily life of individuals [25].
The interest in multiscale flooding and the idea to look for their hydrometeorological causal events at the scale of the Alpine Bow appeared in pioneering works in the 1970s [26]. They provided archetypes of large-scale rainfall accumulation patterns associated with mesoscale atmospheric circulations and with combined responses of large Alpine rivers—typically the Danube, Po, Rhine, and Rhone Rivers and tributaries such as Adige, Durance, or Inn Rivers. Improved datasets allowed us to investigate in more details and at finer scales the meteorological and hydrological characteristics of some recent multiscale floods. This is the case of the interaction of rainfall patterns, with the basin morphology governing the contribution of the Inn River to the Upper Danube flood in 2013 compared with previous historical floods [27]. More theoretical approaches based on Extreme Value Theory analyzed extreme discharge co-occurrences over instrumented watersheds or extreme rainfall co-occurrences at gauged sites [28,29]. All of these work apply to scales that are one or two orders of magnitude larger than Metropolitan scales, which for instance in Grenoble represents a collection of 600 torrents over ca. 1400 km2 embedded in a 9000 km2 riverine basin. Moving down to Metropolitan scales is then less a problem of lack of theory and methodology than a problem of lack of data.
To our best knowledge, there is no work devoted to the question of multiscale flooding over a Metropolitan domain. This paper explores the potential of a database of reported torrential and riverine flood events to document this question. This database (i) covers a long historic period and relies on expert reports, (ii) provides quantitative information about the time and place of the floods and hence of the space scale, and (iii) brings qualitative information about the phenomena and the damages.
Moving out of the field of quantitative hydrology and its analysis of the rareness of flood causes, here, we mainly consider the rareness of the effects. The events of the dataset used are reported because they generated damages and our hypothesis is that the rareness of these effects points to the rareness of flood causes. In a framework of inadequate quantitative dataset, this paper evidences the existence of multiscale flooding at Metropolitan scale and discusses some implications for hydrological research and flood risk management.
The paper is set out as follows. Section 2 describes the observational issue, showing the limitations of the instrumental datasets at hand and the availability of more qualitative information from the historical monitoring of the RTM (Restauration des Terrains de Montagne), a technical service of the French Forest Administration. We analyze in Section 3 the part of the RTM database that covers the Metropolitan area of Grenoble over the period 1850–2019. We fundamentally illustrate the homogeneity, consistency, and completeness of the RTM database for torrential and riverine flooding. We explore in Section 4 and Section 5 the potential of the RTM database to describe Metropolitan flood events. Section 4 explains the method used to identify the co-occurrence of floods from expert reports, and Section 5 shows the homogeneity of the list of Metropolitan events and its basic properties. In Section 6, we examine the first outcomes and the potential of the Metropolitan event database.
2. The Observational Issue and the Datasets Used
2.1. Hydrometeorological Data Fail to Cover Small Scales over the Long Run
In the case of Grenoble, assessing the co-occurrence of extreme floods at Metropolitan scales embraces a set of natural and urbanized watersheds over 1 to 10,000 km2 (Figure 1). The torrential units interfering with urbanized areas can be as small as a few kilometer squared such as the Aiguille, the Corbonne, or the Manival Torrents, which cross densely urbanized and industrialized areas along the Chartreuse cliff. Their response times are typically of one hour for 30 km2, such as that found for the Sonnant Torrent in the Belledonne foothills, which is also densely urbanized in its lower part [30]. The main rivers crossing the agglomeration, the Isère and the Drac Rivers forming the Y shaped valley of the agglomeration, have basins of 5720 and 3550 km2, respectively, and times to their peaks of typically 1 to 2 days, respectively, at their confluence in Grenoble [31].
The question of multiscale flood co-occurrence is very demanding in terms of resolution of observations in time and space and in terms of time span of data series. We briefly sketch the data availability across scales in the study region using in Figure 2 a logarithmic window to show the instrumental resolution and to recall, as well, the time and space characteristics of some processes of interest [32].
Continuous discharge measurements are only available on large watersheds. The Isère River and its main tributaries are controlled by a set of gauging sites that appeared with the creation in France of the first Flood Warning Services in the 1850s [35]. For instance, the water level scale of the Isère River in Grenoble was installed in 1840, and the profile of the river is thought to be stable since the last major flood in 1859 [36]. A series of daily readings of limnimetric scales started more than one century ago (Isère River at Grenoble since 1877 and Drac River since 1904), but they present interruptions (1897–1906 for the Isère River at Grenoble for instance). These sites were automated in the late 1950s. Over their available time span, the gauging sites were highly influenced by the installation (1935–1988) and operation of upstream reservoirs for hydroelectricity production. Various studies used historical archives as a complement of instrumental data for past significant floods [35].
At smaller scale, the intricacy of torrents and urban drainage is not sufficiently monitored to analyze co-occurrences. The drainage system (over 1200 km of pipes) collects rain waters coming from 35% of the Metropolitan area, equally shared between natural and urbanized surfaces. The remaining 65% of the area consists in natural surfaces drained by torrents. Measurements in the urban sewage system are occasional (measurement campaigns) or consist in observation reports on overflows during storms. Only a few torrents over roughly six hundred are instrumented.
Rainfall measurement is also limited in resolution and series duration. The operational rain gauge network provides daily measurements over the past 60 years, with a typical resolution of 150 km2 (61 stations over the Isère Basin—ca. 9000 km2). The Metropolitan network of automatic rain gauges was developed for real-time control of urban drainage systems during the late 1990s (1 h resolution) and the 2000s (6 min resolution), with a typical inter-distance of 8 km, quite over the recommendations for urban settings [37,38]. In France, the operational radar product COMEPHORE opens in 1997 and starts to be considered for climatological studies [39]. Its coverage of the Alps is less than 10 years old [40]. The Grenoble region waited 2015 to see the nearby installation of an X-band dual-polarization radar, which is not of straightforward use in a mountain setting [41]. Radar data proved that high-resolution rainfall measurement is essential to explaining local effects of extreme rainfall events, such as that shown for instance in studies of small-scale watershed flooding [42] or debris flow triggering [43].
In summary, given our first interest in the multi-scale co-occurrence of extremes over a range of scales going below 100 km2—i.e., requiring long-term and distributed data at these scales, available hydrometeorological datasets fail to provide the necessary information to direct statistical analysis or to indirect approaches to “extend” the data [44]. This motivates our present attempt to consider another source of data, which is able to inform extreme flood co-occurrence over the long run and below a few hundreds of km2.
2.2. The Content of the RTM Database
Torrential floods have the peculiarity of triggering active sediment transport, an aggravating factor of risk that was conceptualized as soon as the 19th century with, in France, the creation in 1860 of a national service for the management of the Alpine and Pyrenean mountainous areas—RTM [45]. As part of the forest administration (Office National des Forêts), this national service had the central objective of curtailing sediment production in torrent headwaters through the active protection of tree planting (3800 km2) and civil engineering works (ca. 19,000 followed structures). With daily involvement in terrain surveillance and management, RTM capitalized over time a considerable knowledge of natural risks in mountainous areas (roughly 25% of the French territory). For instance, in Savoy (Northern French Alps), Paul Mougin, a RTM pioneer of “torrent correction”, published at the beginning of the 20th Century a book associating theoretical developments about the causes of torrential floods to the description of the torrents of the region, including a detailed list of historical flash-flood and debris flow events [46]. The RTM mission of management of altitude watersheds in state-owned forests made the service engineers the natural interlocutors of connected municipalities and authorities. Even small villages, because they were suffering flood damages from well identified torrents, had to make municipal-level economic and regulatory decisions that are well described in council minutes. The merit of RTM engineers over such “municipal chronicles” was to regularly produce, under a common framework of analysis, written reports, and advice relying on their own observations, witness interviews, press releases, as well as official municipal documents. Asserting their expertise, they broadened through time their field of investigation from its initial focus on small tributaries and hill slopes up to the larger scale of riverine inundations in close connection with the Roads and Bridges Service. All of this activity was carefully archived.
Since the 1980s, RTM extended its mission in response to the Law of 1982 on the compensation of victims of natural disasters [47]. This new mission of risk mapping in mountainous areas motivated both a systematic reporting for recent torrential site events and a substantial effort to make use of RTM archives for past site events.
As a result, throughout RTM existence, trained personnel systematically archived information about torrential risk events, constituting a pioneering and long-standing effort of climate impact observation. This archive was systematically organized in data sheets during the 1980s, digitized during the 1990s, and made publicly available via Internet during the 2010s (over 30,000 site events reported to date are available at https://rtm-onf.ign.fr accessed on 30 December 2021). The same history of torrent surveillance and management is shared by other Alpine countries, for instance, Austria, with the Forest technical Service of the Austrian Torrent and Avalanche Control, which initiated a systematic collection of torrential “flood reports” with the Austrian Forest Act in 1975 [48].
The RTM database contains information about the social and material impacts of varied phenomena—namely, at decreasing scales, from riverine and torrential floods to debris flows, landslides, or avalanches. Here, we focus on floods.
Torrential floods are distinguished from riverine inundations by the size (<100 km2) and the response time (<12 h) of the watersheds—they pertain to headwater streams of Strahler order 1 to at most 3. The Metropolitan area is paved by 139 RTM torrential units (Figure 1)—watersheds and sub-watersheds, such as the distinction between right and left tributaries or upper and lower basins for instance—with surfaces distributed log normally with a median around 4 km2 (see Figure 3). The agglomeration is concerned by 5 RTM riverine units. Three sites concern the Isère River—upstream Grenoble, in Grenoble at its confluence with the Drac River and downstream from Grenoble. The two other sites concern the Drac River and its tributary, the Romanche River, upstream from Grenoble. The sizes of the drained watersheds span between 0.16 and 172 km2 for the torrents and between roughly 1200 and 5800 km2 for the rivers.
Each event occurring at a site is characterized in the RTM database by a number of qualitative and quantitative elements of information summarized in Table 1. The name of the site and date of the event quantitatively determine the coordinate of each site event in time and space. It is fundamental for co-occurrence studies to have dates to the day, which is the cases of 68% and 88% of torrential and riverine flood events, respectively, over the period 1850–2019. The database also graduates semi-quantitatively torrential and riverine events into 4 and 3 intensity levels, respectively (see Table 2). The absence of the 1-very-weak class for rivers may be related to flood protection that is more developed on rivers and cuts damages below a certain level of flooding. In both cases, the intensity depends on physical factors and impact levels. This graduation is recent (2004–2006) and results from a long reanalysis work of the quantitative and qualitative information contained in RTM archives. For the Isère district, it took 18 months full time for an engineer of the service to cover the period post-1950. This reanalysis guarantees some homogeneity and extensiveness to the torrential information with less than 7% of the events being categorized into “unknown intensity”. Not at the core of the service missions, the riverine information has not been reanalyzed and has almost 70% of “unknown intensity”.
The database is rich in detailed narratives describing, event by event, the hazard and the vulnerability. In the case of torrential and river flooding, associated phenomena such as the precipitations and the atmospheric conditions, or the sediment transport and its morphologic consequences are often described. The vulnerability is about persons and goods. Associated quantitative information about locations, water levels, or sediment volumes are often included in the narratives.
In spite of its central mission toward engineering and land management studies and despite its confidential diffusion, the RTM database is used in academic studies, mostly about torrential flooding [50,51]. To our best knowledge, all of the application and research studies are focused on point studies and none are on flood co-occurrence.
3. Torrential and Riverine Flood Activity Reported by the RTM Database
3.1. RTM Database Covering the Metropolitan Area
We analyze in this section the part of the RTM database that covers the Metropolitan area of Grenoble over the period 1850–2019. The study domain is related to the practical aim of this work devoted to Metropolitan flooding risk. This restriction to a limited sample of 5 riverine units, and ca. 130 torrential units is a limitation of sorts with regard to the sampling of flood activity. On the other hand, this restriction allows for assuming a reasonable homogeneity of hydro-climatic conditions as well as the best level of observation quality—the RTM headquarters were installed in Grenoble at the beginning of the study period and they always had close and easy access to the observed torrents and rivers. We restricted our selection to the period 1850–2019 for two main reasons. First, it roughly covers the lifetime of the RTM Service and we expect a more homogeneous archiving work. The database covers a much larger period including historical data from other non-contemporary sources that have been collected by the Service over time. Second, this period fits with long climate reanalyzes (e.g., 1850–2014 for 20CR, [52]), and it opens the opportunity to document the atmospheric conditions of the selected multiscale flooding events. In addition, 170 years is the minimum appropriate amount of time for extreme studies, although the period looks much less fertile in major riverine floods than previous 200 years [1].
The part of the RTM database that covers the Metropolitan area of Grenoble counts 282 events on torrential units and 41 events on riverine units (Table 3). As the RTM data results from the expertise of an engineering service more than from a measurement network, our concerns go to the homogeneity and the exhaustiveness of the series of dates of these events as well as to the consistency between qualitative and quantitative information. Our aim is to show the possibilities and to understand the limits of the RTM database to help the study of the occurrence of extreme hydrometeorological events that we treat in Section 4. We successively examine the torrential and riverine datasets.
3.2. Jump of Torrential Flood Occurrence at the Turn of the 1980s
An elementary way to consider the overall homogeneity of sampling is to look at the cumulative count of site events throughout time (Figure 4). If we concentrate on torrential floods without distinction of the intensity, it seems that we have two homogeneous periods in terms of rate of occurrence—say before and after the 1980—over which the cumulative curve reasonably follows the theoretical line suggested by a Poisson assumption. The slopes of the fitted lines are the ratio of the total number of events over the number of years T of the considered period: , where is the number of events during the year t. This quite abrupt change moves from a pace of 0.9 event per year over the agglomeration to 4—a jump factor of more than 4. Given the number of considered torrential entities (139) it is easy to see that we moved in terms of return periods of the reported site events for each entity from ca. 150 years to ca. 35 years. Looking closer, it seems that the change operates more like a transition during the 1970s. A more rigorous analysis aimed at looking for a breaking date that provides the best Poisson fit over the two periods would be interesting [48], but it is not critical for our illustrative purpose here.
The jump displayed by our torrential dataset may originate from changes in the risk (hazard and/or vulnerability) and/or in the observation practice. It is shared by other Alpine studies presenting the same shape of cumulative curves. In Northeastern Italy [53], a collection of 127 debris flows from historical archives over two areas displays a jump at the same period as in France with a multiplicative factor over 15. This jump is attributed by the authors to an increased reporting effort and a better access to information that both led to a larger share of small events, which is confirmed by a decrease in the average value of debris-flow volumes by a factor of three. In Austria [48], a richer sample of 8579 torrential flood events covering all the country shows a smoother break in the cumulative curve. Using objective methods to find the date beyond which the slope stabilizes, the authors diagnose a jump occurring between 1920 and 1940 with a rate of ca. 3. This statistical diagnosis is apparently in contrast with an historical reasoning that would attribute the jump to the early 1970s with the advent a flood reports catalog (1972) and the Austrian Forest Act of 1975.
In our case, the jump looks consistent with the past of the RTM Service. As described in the previous section, broadly, two key dates articulate this history: the creation of the service in the 1860s and the extension of its missions to risk mapping at the beginning of the 1980s. The jump seen in the studied series fits with the second key date. As speculated in Italy and Austria, the evolutions toward risk mapping and the advent of data digitization influenced the RTM monitoring practice, increasing the needs for data completeness in time and space, and easing data management.
In France, similar to Italy, the jump looks to be related to a change in the share of monitoring in which we may distinguish three aspects (Table 3). First, the general break of rates marks an increased “density” of monitoring—the process collects globally four times more events after than before 1980. However, second, there is also a change in the “sensitivity” of the monitoring—the share of low-intensity events (1-very-weak) jumps by a factor 3 while the two higher intensities remain quite stable in proportion. In other words, the repartition of the intensities looks pretty stable over the complete monitoring period except for the lowest 1-very-weak. A third aspect is the change in the share of “unknown” intensity that is divided by two and the number of events dated to the day that grows by 60% (not shown), showing an improvement of the “quality” of observation in the sense that, more often since 1980, the site event reports contain enough information to qualify the intensity at precise dates.
At this point we have, on one side, elements showing a good stability of the monitoring process over the two considered periods (stable rates and shares) and, on the other side, elements that changed significantly at the turn of the 1980s such as the density, the sensitivity, and the quality of “sampling”. We may conclude that these observations are too largely influenced by the monitoring process to allow for detecting changes in risk except inside an homogeneous period. If, for instance, we take a close look to the last two decades, which can be considered homogeneous in terms of monitoring process, Figure 4 shows a quite significant break in the seasonality of the events—the occurrence of summer events look quite steady while the occurrence during other seasons marks a decay by a factor of 4. This decay coincides with the decay or a pause in the rate of highest intensities (2-weak and 3-medium). A minimal interpretation is that this change is related to hazards and not to vulnerability, which has no reason to change with seasons.
3.3. Consistency between Quantitative Information and Qualitative Narratives: Intensity versus Causes of Torrential Floods
After the above analysis of the jump in the monitoring density and quality in 1980, we illustrate now an element of homogeneity that seems to cover the whole period of existence of the RTM service—the consistency between the quantification of intensities and the content of qualitative narratives.
The definitions of torrential and riverine intensities rely on implicit relationships between all atmospheric, hydrologic, and morphologic processes. For torrents, the grid of lecture of the flood intensity given in Table 2 summarizes an expert vision of the “flashiness” of the flood (water level rising rate) and of its sediment transport capacity (volume and block sizes). This gradation rightly forgets to mention rainfall intensities that are “almost always” difficult to assess since they are measured too far or at the wrong time scale [51,54,55]. Nevertheless, the database contains a qualitative description of the causes (Table 1). This short expert summary is quite well structured around five types of causes: the rainfall, the snowmelt, the hydrological and morphological antecedent state of soils, logjams blocking the torrent, and the defective effect of structures and constructions. For example, in December 1991, the Montavie Torrent flood was caused by “Exceptional rainfall following a temperature rise (6°) on snowy soils. Rapid melt of the snow cover (15 h) and concomitant floods of all streams below 2500 m altitude”, while for the same flooding period, the Vernon Torrent flood was caused by “Abundant rainfall after a snow fall. Obstruction of a hydraulic screen at the road bend of Mutte”. This description is unfortunately missing in ca. 50% of the site events. We analyzed the 133 provided summaries (50, 70, and 13 events of intensities 1-very-weak, 2-weak, and 3-medium, respectively) after coding their contents in the above mentioned five types. Figure 5 shows that rainfall is definitely the major cause cited by the reports. Rainfall is mentioned in ca. 90% of the site events, followed by hydrology/morphology (20%), and structures and protections (15%). To make things clearer, Figure 5 only reports the cases when rainfall is the single mentioned cause. The figure shows a clear gradation with 1-very-weak events combining causes in a balanced way and 3-medium being exclusively attributed to a rainfall cause alone. This observation illustrates the consistency between the intensities and the narratives of causes given by operators. It confirms a typology of floods where snow is present but plays a minor role, structures are important factors of minor flood aggravation, and hydrology/morphology explanations fade when consequences aggravate and rainfall becomes dominant. This observation confirms in a sense the interest for relating flood occurrence to generating hydrometeorological events.
3.4. Historical Completeness of Torrential Information
The notion of completeness, developed in the fields of earthquakes and volcanic eruptions, is presented and applied to the Austrian torrential flood database in [48]. This notion is a priori well suited to historical datasets such as the RTM database that are non-exhaustive by “design”. We can hypothesize various levels of failure in the witnessing process that may lead to miss event records, and we saw in the paragraphs before that a change in the monitoring process is clearly visible. The question of the data completeness is not specific to historical data. Missing data is also a problem of instrumental series that may experience instrument malfunctions, with the additional drawback that missing data may be related to extreme situations [56].
In the absence of quantitative or qualitative reference datasets, the appreciation of the completeness of the RTM database can only be driven on a few watersheds that have been studied in depth by historians. This is the case of two watersheds that belong to the Metropolitan area: the Manival Torrent (7.3 km2—[35]) and the Rif Talon Torrent (upper basin of 1.3 km2—[57]). We also mention, out of the conurbation area and out of the range of size of the conurbation torrential basins, a larger watershed—the Guiers River (617 km2), which was also a research focus [10]. For each watershed, we have three counts: the number of common events cited by RTM and the control study, and the numbers of events and missed by the control study and by RTM, respectively. The completeness is the mere ratio between the number of events reported by the RTM archive and the total number of known events. This ratio is computed over the period between 1850 and 2019. This crude way to assess the completeness is far from the asymptotic property used by [48]. It is simply illustrative of the improvement awaited from deeper historical investigations.
For the two torrential watersheds, the completeness is 67% and 93% for the Rif Talon and the Manival, respectively. It stabilizes to 87% when considering the two torrents together. The completeness of the Manival is constant before and after 1980, while the completeness of the Rif Talon increases from 50% to 83%. Belonging to the heart missions of RTM since its creation and constituting RTM units, the two watersheds benefit of a close surveillance and, in terms of completeness, they are probably representative of the other torrential units of the conurbation. For the Guiers River the completeness over the study period is only 29%. With a size two orders of magnitude larger and a dramatic jump in completeness from 19% to 83% before and after 1980, this watershed is probably more representative of the performance of the service for a river that entered in their mission after the 1980 (see below the completeness for river data).
The RTM archive is undoubtedly non-exhaustive and the arduous but rewarding historical work on torrents claimed by [10] is certainly necessary to do in the future. The problem is its cost when looking at hundreds of units. Conversely, this problem shows the value of RTM archives.
3.5. Homogeneity and Completeness of Reported Riverine Event Occurrence until It Pauses in the 1970s
For rivers, the striking result is that the 1970s marked the end of a rather homogeneous 120-year series of damaging events reported by RTM, with the three last reported events occurring in 1968, 1970 and 1992, which leads to respectively 40 and 1 events before and after 1980 (Figure 6). The occurrence rate of 32 site events per century corresponding to the Poisson assumption slope over the period 1850–1979 is quite representative of the curve in spite of quite large sampling fluctuations—we consider only two rivers instead of over one hundred torrents. The effect of reservoirs and protection work programs looks plausible in explaining the pause of the flooding activity, as far as it produces damages. As indicated in Figure 6, the program of dam constructions on the Isère and Drac Rivers upstream Grenoble started in the 1930s and ended with the 1980s, with the essential of capacity being reached in 1960. As also shown schematically in Figure 6, a quite sustained 50-year series of 25 floods from 1910 to 1960 triggered different projects of protection that certainly contributed to alleviate damages and hence the number of reported damaging floods. The pause does not mean the end of catastrophic floods. An artificial change in the river regime, despite the rule of “transparency” to floods followed by the dam management as well as a sensible shift of the vulnerability level, together modified the “damage regime”.
The comparison with the research historical database “Historisque” (named after the research project described in [35] and used in [1]) is useful to appreciate the completeness of the RTM series. The comparison is not straightforward for three reasons—the research data series stops in 1970; the detection criteria are a little different; and most important, the considered hydrological units are not strictly the same.
The first point is easy to solve since there is a consensus to consider that the recent series of outflows overgrowing the decadal level had no significant impact, except marginal overflows that interrupted the traffic on a submersible express way designed in the Isère River bed. The second point is also minor since the definition of the three levels of flood intensity of “Historisque” data is based on the appreciation of submersions and damages to protection works, bridges, and roads [35], and thus, it is quite close to the RTM definitions given in Table 2. The major difference is the consideration of changes in the river bed morphology mentioned in “Historisque”. The third point—the difference in terms of hydrological units—comes from the fact that the RTM database distinguishes in the agglomeration territory five sites (river reaches of quite precise extension in the conurbation, as seen in Section 2), while the research database considers only two “sites”—the two main rivers and, more vaguely, the first kilometers of their upstream valleys touching Grenoble. Hence, the RTM series may count up to five sites for the same flood event when the “Historisque” dataset counts at most two sites. In order to make the two series comparable, we simply pooled together the three RTM sites of the Isère River and the two RTM sites of the Drac and Romanche Rivers.
As a result and as expected from the results shown above for the Guiers River, the performance of the RTM database in terms of exhaustiveness for the largest rivers of our study is quite low. The research database looks both more substantial and more homogeneous.
In terms of rate of occurrence, the research database provides ca. 170% more events per year than the RTM database after “reduction” to two sites (20 and 54 event per century). Over the period 1850–1970 covered by the “Historisque” dataset, the completeness is 36% and is equal for the two rivers. As suggested by the cumulative curves displayed for the Isère River for instance (yellow curves in Figure 6), the completeness is not homogeneous throughout the period 1850–1970. While the cumulative curve of counts for the research database follows the Poisson line reasonably well, the curve of RTM counts shows two periods, say, before and after 1910. The completeness triples from 20% to 60%. We have no specific explanation for this change, but the heterogeneity of the RTM archive—riverss have long been outside the missions of the Service—is more plausible than any methodological change in the constitution of the Historisque dataset.
The rate of dating to the day in the RTM database is higher for rivers than for torrents (36 over 41 site events, i.e., almost 90%), and it is surprisingly stable with time if we look for instance before and after 1910 (roughly 80 to 90%), which is perhaps due to the capacity of the service to follow events in real time. The availability of dates to the day is low in the “Historisque” data available in publications (24 over 64, i.e., less than 40%).
After the above illustrations of the content of the RTM database, we move now to the identification of multiscale flooding events that mainly rely on the RTM database complemented for rivers essentially by research data.
4. Processing the RTM Database to Define Metropolitan Flooding Events
By a Metropolitan event, we understand the occurrence of one or several damaging floods on rivers and/or torrents of the conurbation of Grenoble within a short period of time—typically one or two calendar days. This definition implicitly assumes the occurrence of a hydrometeorological event that organizes storms in space and time and triggers the concurrent reaction of one to several torrents and rivers. We establish our database by aligning on a common list of Metropolitan event dates the 323 RTM site events complemented by 80 site events coming from narrative sources from National to Municipal annals and expert archives such as those of the Roads and Bridges Administration or of RTM itself, as well as from historical data published about the Isère and Drac Rivers and a few torrents, such as the Manival or the Vorz Torrents, in the Grenoble agglomeration [35,36,58].
4.1. Expert Selection from an Expert Database
The selection process of Metropolitan events is in a sense simplistic: (a) explore chronologically a core database, and discard the events not dated to the day; (b) select the site events of minimum intensity, and complement this list using information available from other databases; and (c) for each site event, look for coincidence with other site events at the same date and decide to define a set of concurrent site events occurring during neighboring days as a Metropolitan event.
As explained in the previous section, the RTM database offers by far the best assets to be the core dataset of our selection—in first place, the space resolution of the dataset is outstanding. Furthermore, we also saw that the richness of this database is, to some extent, hidden behind the digitization of expert reports merging quantitative and qualitative elements of information. Then, applying the above selection process becomes in turn an expert problem. The solution is in a manual processing of the core and complementary datasets that allows for a critical analysis of the narratives in terms of consistency check and hierarchizing and, hence, allows for the ongoing construction of the processing rules regarding, for instance, the event dating and intensity thresholds.
We can elaborate more about the processing of event intensities (step b). Being interested in Metropolitan events, we thought about taking a minimum level of gravity for the selected events. Putting side by side the definitions of the torrential and riverine intensities, looking in particular to impact information, and considering the change in rate of the different intensities in 1980, we suggest to give a lesser role to the lowest torrential intensity 1-very-weak and to consider all riverine intensities (including Unknown). We thus discarded the isolated torrential events of the categories 1-very-weak and Unknown. We nevertheless kept the nonisolated torrential events of 1-very-weak and Unknown intensities. The reasoning is open to discussion but essentially focuses on our central interest for co-occurring floods.
To be more specific about event dates and duration, we can explain why we can select under the same Metropolitan event different site events that occurred over neighboring days (step c). The reasons are all together (i) practical and linked to the construction of the source database, and (ii) methodological and linked to the aim of the constructed database. In practice, for the experts that feed the source database, the dating to the day poses a difficulty in choosing between two successive calendar days for both short and long fuse events. For torrential flooding, it is common that neighboring watersheds touched during the same night by a storm are dated on two successive days, simply because the event runs over the midnight boundary. For riverine flooding, the same occurs with the additional difficulty that high waters may last more than one day. Beyond this practical difficulty of dating site events, the decision to group a set of such events into a Metropolitan event also depends on the aim of the study. As our interest is about the co-occurrence of floods at different scales and, ultimately, weather conditions, we found quite often that the conurbation is touched by a series of flooding events over more than two consecutive days. These series of events may concern the reaction of torrents and/or rivers, in summer similar to in winter, under the influence of a long-lasting weather perturbation. For instance, on the 1st of July 1987, the area of Grenoble experienced 6 days of stormy weather with damaging torrential floods in the agglomeration on the first and fifth days and damaging floods in neighboring areas on the other 4 days. The decision to build such long-lasting Metropolitan events may be backed-up by information contained in the narratives and by the examination of site events that may have occurred in the vicinity of the Metropolitan area—in particular to gain elements of meteorological description that confirm the unity of a generating weather system. This “reconstruction” of the circumstances of the Metropolitan event may sometimes lead to the certainty that site events not dated to the day may be attributed to the event.
At the end, the ongoing construction of the rules led to replication of the above selection loop twice, selecting the Metropolitan events based on dates and discarding the individual very weak events. The first loop identified the various practical and methodological difficulties and helped the construction of the rule set, and the second one stabilized and verified a final list of events. At the end, each Metropolitan event is described through a mix of quantitative and qualitative information that compiles the information about site events (Table 4).
4.2. Global Characteristics of the Selection Process
The selection process aggregated 323 RTM site events as well as 80 site events coming from complementary sources into 104 Metropolitan events (see Table 5). This aggregation results from the co-occurrence analysis in three ways: the basic need of co-occurrence detection—we only used events dated to the day; the definition of Metropolitan events with regard to a minimal intensity at sites—we discarded some isolated low intensity site events; and the co-occurrence effect itself—many Metropolitan events involve more than one site event. Below, we examine the respective weights of torrents and rivers that are given step by step in Table 5. For each step, we present rates R of reduction that are percentages of discarded events: , where N is the initial number of events at the current step and n is the final number. For the final step where coincidence events are merged, this rate takes into account that multiscale events contain torrential and riverine site events: where and represent the number of torrential and multiscale Metropolitan events.
For torrents, the elimination of the events not dated to the day reduced the information of the RTM database by 32% (Table 5), with a large unbalance between the periods before and after 1980 (49% and 19%, respectively). Overall, the intensity selection is marginal—it discarded in total 20 isolated events (10%) of very low or unknown intensity (2% before 1980 and 15% after 1980). The use of complementary information at the torrential scale is also marginal (16% addition, mixing 34% addition before 1980 and 6% after 1980). This step brought back six RTM site events not dated to the day before 1980. The co-occurrence effect further reduces the number of events by 65% in a way that is not very sensitive to the period (56% and 71% before and after 1980, respectively).
For rivers, the selection process works much differently. Most RTM site events are dated to the day (88%), and the use of complementary information is massive (165%) and highly unbalanced between periods since the RTM database is almost empty for rivers after 1980. The co-occurrence effect reduces the number of events by 48% in a way that is very sensitive to the period (53% and 0% before and after 1980, respectively).
The final step in the selection that yields Metropolitan events and its co-occurrence effect deserves some additional comments. This step is central we regard to the question of multiscale flooding. The rates of reduction that we present above for torrents and rivers appear to be high in general, to be higher for torrents than rivers (65% and 48%, respectively), and to be more stable through time for torrents than for rivers.
The rates of reduction are close to the probability that a flood site event co-occurs with at least another site event. Hence, for all scales together, almost two flood events over a score of three co-occurs with at least one other flood. The stability of the rate through time means that the assessment of the co-occurrence is not sensitive to the observation rate that shows a jump in the 1980s (Figure 4).
5. Basic Properties of the 104 Resulting Metropolitan Events
To appreciate the result of the above described selection process, below, we examine the homogeneity of the Metropolitan events over the 1850–2019 period and their space–time characteristics.
5.1. Homogeneity of the List of Metropolitan Events
As performed above about RTM data at sites, an elementary way to consider the homogeneity of the selected list of Metropolitan events is to look at cumulative counts of events over the observation period (Figure 7).
The cumulative function for purely torrential events shows at the turn of the 1980s the same jump in the occurrence rate as the RTM torrential flood occurrence. The amplitude of the jump is quite comparable—while for the RTM torrential floods dated to the day, the rate jumps by a factor of 7, the rate of purely torrential Metropolitan floods increases by a factor of 5. In terms of return period, torrential Metropolitan events drop from ca. 6 years before 1980 to 1.2 years after. The explanation of the moderation of the jump is chiefly in a higher number of discarded isolated RTM low intensity events (1-very-weak) after the turn of the 1980s (14% after 1980 instead of 5% before). Another singularity of this cumulative function is to present two empty periods of about 20 years—17 years at the beginning of the archive and 21 years between 1930 and 1951. Sampling effects are possible but other explanations such as the period during the second world war may also be considered.
The cumulative function of purely riverine Metropolitan events closely follows the Poisson assumption over all periods, displaying a global return period of 5 years. The pause in damaging river floods seen after 1992 in the RTM database is obliterated by the introduction of complementary information about a recent series of seven decadal flow peaks between 1999 and 2015 that caused few disorders—we can only mention a breach in a dike under works in May 2015. The cumulative function of multiscale events (co-occurrence of torrential and riverine flooding) looks also quite homogeneous although its roughly decadal occurrence brings sampling effects that may explain marked steps with three events in the 1850s or five events in 8 years in 1954–1961 and long plateaus with almost empty 40-year periods over 1856–1899 and 1961–2002. The current pause after a last event in November 2002 evokes the same type of plateau. We must finally keep in mind that, with regard to riverine flooding, the study period matches the significant gap in extremes that followed the middle of the 19th century mentioned on the Isère River [1] and on other Alpine rivers such as the Rhine [59].
The cumulative function embracing all types of events displays a moderate jump after 1980—the rate is multiplied by a factor of 2.2, dropping from a return period of 2 to 1 year. It shows a period of deficit before 1900 that is related to the deficit of purely torrential events mentioned above. There is not much to add in terms of completeness compared with what is said in Section 3 and in the previous section devoted to the effect of completeness on the co-occurrence characteristics.
5.2. Time and Space Characteristics of Metropolitan Events
The selection process ends with a vast majority of events lasting one or two calendar days (52% and 25%). Long-lasting Metropolitan events are thus rather an exception. If we make the distinction between purely torrential Metropolitan events (53 events over 104, i.e., 51%), purely riverine events (33%), and multiscale events (16%), the distribution of event durations slightly evolves (see Figure 8). The events lasting three days or more represent less than 10% of the purely torrential Metropolitan events, 30% of purely riverine events, and 53% of multiscale events. Looking to the space extent of Metropolitan events through the crude measure of the number of touched RTM watershed units, the selection process leads to a majority of events involving multiple sites (Figure 9). Obviously 100% of the multiscale events are multisites. The Metropolitan events involving several torrents represent 57% of purely torrential events, while those involving several rivers only make 30% of purely riverine events. Another way to examine the same counts is to integrate the multiscale events. For instance, when a torrential flood occurs at a torrent site, other torrents or rivers experience flooding at the same time in 70% of cases, and when a riverine flood occurs at a river site, other rivers or torrents experience flooding in 53% of cases. There is no correlation between the time and space extents of the Metropolitan events—the percentages of explained variance are below 10% for both torrential and riverine (not shown).
These results are, to some degree, expected from general considerations about basin response times and generating weather. Torrents react promptly to local rainstorms while rivers take more time to react to extended rainfall patterns. The governing mechanisms are nonetheless a complex mixture of geometrical and hydrometeorological considerations, and the interpretation of Figure 8 and Figure 9 deserve a detailed analysis that is beyond the scope of this paper.
6. Conclusive Comments on the Created Metropolitan Dataset
This paper explores the potential of a database of reported damaging flood events at torrential and riverine sites to document the question of multiscale flooding over an Alpine Metropolitan domain—the conurbation of Grenoble (France)—over the period 1850–2019.
The study shows the importance of the notion of “Metropolitan flood events” with, in a majority of cases, a concomitance of damaging floods at several sites of the Metropolitan domain. The consequence for risk management is twofold. The co-occurrence effect decreases by a factor of three for the frequency of Metropolitan flood damages and disruptions compared with the case of independent site events. Symmetrically, during Metropolitan events, damages and disruptions are often at multiple scales, potentially creating more complex situations to manage. Methodologically, the application of the notion of concomitance helped to criticize the semi-qualitative RTM dataset. For instance, we have been able to check the consistency between dates and the consistency of the narratives about the phenomena at stake and the gradation of their intensity. This test looks original with regard to available monographs on torrents or rivers.
The study faces a number of limitations linked to the daring bet we made in front of a patent lack of data. Our bet is to use reported flood damaging as a sensor of flood rareness. This “human sensor” suffers from various limitations with regard to exhaustiveness and homogeneity. Compared with deeper historical research conducted on a few torrents and on the main rivers, the exhaustiveness of the database varies from ca. 80% for torrents and 30% for rivers in accordance with the historical mission of the RTM service essentially linked to upper-watersheds and erosion. While the homogeneity of the database in space, with the same tessellation of torrential and riverine units over the study period, is doubtlessly an asset, the homogeneity in time is more a limitation. A visible change of torrential event frequency around 1980 looks to be related to a change in the RTM service mission, and a pause in damaging river flooding after 1970 seems to be explained by improved river bank protection and upstream reservoir regulation. These limitations invite more precise investigations on the RTM database production process throughour time and to complement historians with the digitization of the RTM archive—a project currently under work. Overall, our bet looks acceptable for pointing to extreme weather events over the study area but not to assess their frequency.
The main potential of the presented dataset is to open the analysis of the causative effects of multiscale flooding in the study region [60]. Ongoing studies already follow two different perspectives. First, from an hydrometeorological point of view, we study the atmospheric conditions prevailing during Metropolitan events. This includes exploring synoptic circulation patterns represented by weather classification as well as finer characteristics represented by atmospheric indicators such as in [61]. The goal here is to define whether these variables are “unusual” at the dates leading to Metropolitan events compared with the climatology. Second, from an hydrological point of view, we study the space–time properties of precipitation and runoff patterns, and concomitancy at catchment scale during Metropolitan events. This requires using a distributed hydrological model fed by reanalyzed precipitation fields, leading us de facto to restrict to recent events. In both cases, a difficulty is the lack of models and data at the scale of torrential watersheds—the most resolved precipitation and atmospheric data represent scales larger than a few tens of kilometers squared.
Author Contributions
Conceptualization, J.-D.C.; methodology, J.-D.C. and J.B.; validation, J.-D.C., J.B. and A.R.; formal analysis, J.-D.C., J.B. and A.R.; investigation, J.-D.C., J.B. and A.R.; resources, J.-D.C., A.R., A.B. and Y.R.; data curation, J.-D.C., A.R. and Y.R.; writing—original draft preparation, J.-D.C.; writing—review and editing, J.B. and A.R.; visualization, J.-D.C. and A.R.; supervision, J.-D.C. and J.B.; project administration, J.B. and C.L.; funding acquisition, J.-D.C., J.B. and C.L. All authors have read and agreed to the published version of the manuscript.
Funding
This work is part of a collaboration between the University Grenoble Alpes and Grenoble Alpes Métropole, the Metropolitan authority of Grenoble conurbation (deliberation 12 of the Metropolitan Council of 27 May 2016). Part of this work was funded by the IND-EX project with the support of the Rhône Alpes Region in France and by the HYDRODEMO project with the support of the European Union via the FEDER-POIA program and thanks to French state funds via the FNADT-CIMA program.
Informed Consent Statement
Informed consent was obtained from all subjects involved in the study.
Data Availability Statement
The RTM data used in this study can be freely downloaded at https://rtm-onf.ign.fr accessed on 30 December 2021.
Acknowledgments
The authors are particularly grateful to Students Aurélie Dupire and Alexandre Kost, who contributed to the collection of information from various archives that helped the database processing. The authors are indebted to the present and past engineers of the RTM service who built the database. The RTM service has been created and funded over time by the French ministries in charge of agriculture and environment.
Conflicts of Interest
The authors declare no conflict of interest.
References
- Cœur, D. La Plaine de Grenoble Face aux Inondations, 1st ed.; 2008; Available online: https://livre.fnac.com/a2442770/Denis-Coeur-La-plaine-de-Grenoble-face-aux-inondations (accessed on 8 May 2021).
- Sivapalan, M.; Takeuchi, K.; Franks, S.W.; Gupta, V.K.; Karambiri, H.; Lakshimi, V.; Liang, X.; McDonnell, J.J.; Mendiondo, E.M.; O’Connell, P.E.; et al. IAHS Decade on Predictions in Ungauged Basins (PUB), 2003–2012: Shaping an exciting future for the hydrological sciences. Hydrol. Sci. J. 2003, 48, 857–880. [Google Scholar] [CrossRef] [Green Version]
- Chaponnière, A.; Boulet, G.; Chehbouni, A.; Aresmouk, M. Understanding hydrological processes with scarce data in a mountain environment. Hydrol. Process. 2008, 22, 1908–1921. [Google Scholar] [CrossRef] [Green Version]
- Dehotin, J.; Breil, P.; Braud, I.; de Lavenne, A.; Lagouy, M.; Sarrazin, B. Detecting surface runoff location in a small catchment using distributed and simple observation method. J. Hydrol. 2015, 525, 113–129. [Google Scholar] [CrossRef]
- Hosking, J.R.M.; Wallis, J.R. Regional Frequency Analysis: An Approach Based on L-Moments; Cambridge University Press: Cambridge, UK, 1997. [Google Scholar]
- Paquet, E.; Garavaglia, F.; Garçon, R.; Gailhard, J. The SCHADEX method: A semi-continuous rainfall-runoff simulation for extreme flood estimation. J. Hydrol. 2013, 495, 23–37. [Google Scholar] [CrossRef]
- Eagleson, P.S. Dynamics of flood frequency. Water Resour. Res. 1972, 8, 878–898. [Google Scholar] [CrossRef]
- Gottschalk, L.; Weingartner, R. Distribution of peak flow derived from a distribution of rainfall volume and runoff coefficient, and a unit hydrograph. J. Hydrol. 1998, 208, 148–162. [Google Scholar] [CrossRef]
- Wilhelm, B.; Ballesteros-Canovas, J.; Macdonald, N.; Toonen, W.; Baker, V.; Barriendos, M.; Benito, G.; Brauer, A.; Corella, J.; Denniston, R.; et al. Interpreting historical, botanical, and geological evidence to aid preparations for future floods. Wiley Interdiscip. Rev. Water 2018, 6, e1318. [Google Scholar] [CrossRef] [Green Version]
- Lang, M.; Coeur, D.; Lallement, C.; Naulet, R. Valorisation de L’information Historique Pour la Prédéterminiation du Risque D’inondation: Application au Bassin du Guiers. Ingénieries Eau-Agric.-Territ. 1998, 6, 3–13. [Google Scholar]
- Astrade, L.; Jacob-Rousseau, N.; Bravard, J.P.; Allignol, F.; Simac, L. Detailed chronology of mid-altitude fluvial system response to changing climate and societies at the end of the Little Ice Age (Southwestern Alps and Cévennes, France). Geomorphology 2011, 133, 100–116. [Google Scholar] [CrossRef]
- Wilhelm, B.; Ballesteros Canovas, J.A.; Corella Aznar, J.P.; Kämpf, L.; Swierczynski, T.; Stoffel, M.; Støren, E.; Toonen, W. Recent advances in paleoflood hydrology: From new archives to data compilation and analysis. Water Security 2018, 3, 1–8. [Google Scholar] [CrossRef]
- Hosking, J.R.M.; Wallis, J.R. The Value of Historical Data in Flood Frequency Analysis. Water Resour. Res. 1986, 22, 1606–1612. [Google Scholar] [CrossRef] [Green Version]
- Hosking, J.R.M.; Wallis, J.R. Paleoflood Hydrology and Flood Frequency Analysis. Water Resour. Res. 1986, 22, 543–550. [Google Scholar] [CrossRef] [Green Version]
- Nguyen, C.C.; Gaume, E.; Payrastre, O. Regional flood frequency analyses involving extraordinary flood events at ungauged sites: Further developments and validations. J. Hydrol. 2014, 508, 385–396. [Google Scholar] [CrossRef] [Green Version]
- Le Bihan, G.; Payrastre, O.; Gaume, E.; Moncoulon, D.; Pons, F. The challenge of forecasting impacts of flash floods: Test of a simplified hydraulic approach and validation based on insurance claim data. Hydrol. Earth Syst. Sci. 2017, 21, 5911–5928. [Google Scholar] [CrossRef] [Green Version]
- Llasat, M.C.; Llasat-Botija, M.; Petrucci, O.; Pasqua, A.A.; Rosselló, J.; Vinet, F.; Boissier, L. Towards a database on societal impact of Mediterranean floods within the framework of the HYMEX project. Nat. Hazards Earth Syst. Sci. 2013, 13, 1337–1350. [Google Scholar] [CrossRef] [Green Version]
- Roca, M.; Martín-Vide, J.; Martin-Moreta, P. Modelling a torrential event in a river confluence. J. Hydrol. 2009, 364, 207–215. [Google Scholar] [CrossRef]
- Muthusamy, M.; Rivas Casado, M.; Salmoral, G.; Irvine, T.; Leinster, P. A Remote Sensing Based Integrated Approach to Quantify the Impact of Fluvial and Pluvial Flooding in an Urban Catchment. Remote Sens. 2019, 11, 577. [Google Scholar] [CrossRef] [Green Version]
- Versini, P.A.; Gaume, E.; Andrieu, H. Assessment of the susceptibility of roads to flooding based on geographical information—Test in a flash flood prone area (the Gard region, France). Nat. Hazards Earth Syst. Sci. 2010, 10, 793–803. [Google Scholar] [CrossRef] [Green Version]
- Kilgarriff, P.; McDermott, T.K.J.; Vega, A.; Morrissey, K.; O’Donoghue, C. The impact of flooding disruption on the spatial distribution of commuter’s income. J. Environ. Econ. Policy 2019, 8, 48–64. [Google Scholar] [CrossRef]
- Braud, I.; Lagadec, L.R.; Moulin, L.; Chazelle, B.; Breil, P. A method to use proxy data of runoff-related impacts for the evaluation of a model mapping intense storm runoff hazard: Application to the railway context. Nat. Hazards Earth Syst. Sci. 2020, 20, 947–966. [Google Scholar] [CrossRef] [Green Version]
- Koks, E.; Pant, R.; Thacker, S.; Hall, J.W. Understanding Business Disruption and Economic Losses Due to Electricity Failures and Flooding. Int. J. Disaster Risk Sci. 2019, 10, 421–438. [Google Scholar] [CrossRef] [Green Version]
- Dong, S.; Esmalian, A.; Farahmand, H.; Mostafavi, A. An integrated physical-social analysis of disrupted access to critical facilities and community service-loss tolerance in urban flooding. Comput. Environ. Urban Syst. 2020, 80, 101443. [Google Scholar] [CrossRef]
- Gourley, J.; Erlingis, J.; Smith, T.; Ortega, K.; Hong, Y. Remote collection and analysis of witness reports on flash floods. J. Hydrol. 2010, 394, 53–62. [Google Scholar] [CrossRef]
- Vivian, H. Averses extensives et crues concomitantes dans l’Arc Alpin. Houille Blanche 1978, 6, 415–429. [Google Scholar] [CrossRef] [Green Version]
- Blöschl, G.; Nester, T.; Komma, J.; Parajka, J.; Perdigão, R.A.P. The June 2013 flood in the Upper Danube Basin, and comparisons with the 2002, 1954 and 1899 floods. Hydrol. Earth Syst. Sci. 2013, 17, 5197–5212. [Google Scholar] [CrossRef] [Green Version]
- Asadi, P.; Davison, A.C.; Engelke, S. Extremes on river networks. Ann. Appl. Stat. 2015, 9, 2023–2050. [Google Scholar] [CrossRef]
- Blanchet, J.; Creutin, J.D. Co-Occurrence of Extreme Daily Rainfall in the French Mediterranean Region. Water Resour. Res. 2017, 53, 9330–9349. [Google Scholar] [CrossRef]
- Obled, C.; Zin, I.; Gautheron, A. Etude de la Réponse Hydrologique du Sonnant d’Uriage: Essai de Transfert à des Bassins Voisins; Technical report; Pôle Alpin Risques Naturels: Saint-Martin-d’Hères, France, 2005. [Google Scholar]
- Auffray, A.; Clavel, A.; Jourdain, S.; Ben Daoud, A.; Sauquet, E.; Lang, M.; Obled, C.; Panthou, G.; Gautheron, A.; Gottardi, F.; et al. Reconstitution hydrométéorologique de la crue de l’Isère de 1859. Houille Blanche 2011, 44–50. [Google Scholar] [CrossRef] [Green Version]
- Blöschl, G.; Sivapalan, M. Scale issues in hydrological modelling: A review. Hydrol. Process. 1995, 9, 251–290. [Google Scholar] [CrossRef]
- Orlanski, I. A Rational Subdivision of Scales for Atmospheric Processes. Bull. Am. Meteorol. Soc. 1975, 56, 527–530. [Google Scholar]
- Marchi, L.; Borga, M.; Preciso, E.; Gaume, E. Characterisation of selected extreme flash floods in Europe and implications for flood risk management. J. Hydrol. 2010, 394, 118–133. [Google Scholar] [CrossRef]
- Lang, M.; Coeur, D.; Brochot, S. Information Historique et Ingénierie des Risques Naturels: L’Isère et le Torrent du Manival. 2003. Available online: https://www.documentation.eauetbiodiversite.fr/notice/0000000001642879e0d0355280903526 (accessed on 8 May 2021).
- Vivian, H. Les crues de l’Isère à Grenoble et l’aménagement actuel des digues. Rev. Geogr. Alp.-J. Alp. Res. 1969, 57, 53–84. [Google Scholar] [CrossRef]
- Schilling, W. Rainfall data for urban hydrology: What do we need? Atmos. Res. 1991, 27, 5–21. [Google Scholar] [CrossRef]
- Einfalt, T.; Arnbjerg-Nielsen, K.; Golz, C.; Jensen, N.E.; Quirmbach, M.; Vaes, G.; Vieux, B. Towards a roadmap for use of radar rainfall data in urban drainage. J. Hydrol. 2004, 299, 186–202. [Google Scholar] [CrossRef]
- Le Roy, B.; Lemonsu, A.; Kounkou-Arnaud, R.; Brion, D.; Masson, V. Long time series spatialized data for urban climatological studies: A case study of Paris, France. Int. J. Climatol. 2020, 40, 3567–3584. [Google Scholar] [CrossRef]
- Beck, J.; Bousquet, O. Using Gap-Filling Radars in Mountainous Regions to Complement a National Radar Network: Improvements in Multiple-Doppler Wind Syntheses. J. Appl. Meteorol. Climatol. 2013, 52, 1836–1850. [Google Scholar] [CrossRef] [Green Version]
- Delrieu, G.; Khanal, A.; Yu, N.; Cazenave, F.; Boudevillain, B.; Gaussiat, N. Preliminary investigation of the relationship between differential phase shift and path-integrated attenuation at the X band frequency in an Alpine environment. Atmos. Meas. Tech. 2020, 13, 3731–3749. [Google Scholar] [CrossRef]
- Yakir, H.; Morin, E. Hydrologic response of a semi-arid watershed to spatial and temporal characteristics of convective rain cells. Hydrol. Earth Syst. Sci. 2011, 15, 393–404. [Google Scholar] [CrossRef] [Green Version]
- Marra, F.; Nikolopoulos, E.I.; Creutin, J.D.; Borga, M. Radar rainfall estimation for the identification of debris-flow occurrence thresholds. J. Hydrol. 2014, 519, 1607–1619. [Google Scholar] [CrossRef]
- Pfister, L.; Brönnimann, S.; Schwander, M.; Isotta, F.A.; Horton, P.; Rohr, C. Statistical reconstruction of daily precipitation and temperature fields in Switzerland back to 1864. Clim. Past 2020, 16, 663–678. [Google Scholar] [CrossRef] [Green Version]
- Carladous, S.; Piton, G.; Recking, A.; Liébault, F.; Richard, D.; Tacnet, J.M.; Bouvet, P.; Kuss, D.; Philippe, F.; Quefféléan, Y.; et al. Towards a better understanding of the today French torrents management policy through a historical perspective. In Proceedings of the 3rd European Conference on Flood Risk Management Innovation, Implementation, Integration, Lyon, France, 17–21 October 2016; Volume 7, pp. 1–12. [Google Scholar] [CrossRef] [Green Version]
- Blanchard, R. Les torrents de la Savoie. Rev. Géogr. Alp. 1914, 2, 453–468. [Google Scholar]
- Besson, L. Les risques naturels. Rev. Géographie Alp. 1985, 73, 321–333. [Google Scholar] [CrossRef]
- Heiser, M.; Hübl, J.; Scheidl, C. Completeness analyses of the Austrian torrential event catalog. Landslides 2019, 16, 2115–2126. [Google Scholar] [CrossRef] [Green Version]
- Barriendos, M.; Coeur, D.; Lang, M.; Llasat, M.; Naulet, R.; Lemaitre, F.; Barrera-Escoda, A. Stationarity analysis of historical flood series in France and Spain (14th–20th centuries). Nat. Hazards Earth Syst. Sci. 2003, 3, 583–592. [Google Scholar] [CrossRef] [Green Version]
- Navratil, O.; Evrard, O.; Esteves, M.; Ayrault, S.; Lefèvre, I.; Legout, C.; Reyss, J.L.; Gratiot, N.; Némery, J.; Mathys, N.; et al. Core-derived historical records of suspended sediment origin in a mesoscale mountainous catchment: The River Bléone, French Alps. J. Soils Sediments 2012, 12, 1463–1478. [Google Scholar] [CrossRef]
- Jomelli, V.; Pavlova, I.; Giacona, F.; Zgheib, T.; Eckert, N. Respective influence of geomorphologic and climate conditions on debris-flow occurrence in the Northern French Alps. Landslides 2019, 16, 1871–1883. [Google Scholar] [CrossRef]
- Compo, G.P.; Whitaker, J.S.; Sardeshmukh, P.D.; Matsui, N.; Allan, R.J.; Yin, X.; Gleason, B.E.; Vose, R.S.; Rutledge, G.; Bessemoulin, P.; et al. The Twentieth Century Reanalysis Project. Q. J. R. Meteorol. Soc. 2011, 137, 1–28. [Google Scholar] [CrossRef]
- Marchi, L.; Tecca, P.R. Some Observations on the Use of Data from Historical Documents in Debris-Flow Studies. Nat. Hazards 2006, 38, 301–320. [Google Scholar] [CrossRef] [Green Version]
- Borga, M.; Stoffel, M.; Marchi, L.; Marra, F.; Jakob, M. Hydrogeomorphic response to extreme rainfall in headwater systems: Flash floods and debris flows. J. Hydrol. 2014, 518, 194–205. [Google Scholar] [CrossRef]
- Marra, F.; Nikolopoulos, E.; Creutin, J.; Borga, M. Space–time organization of debris flows-triggering rainfall and its effect on the identification of the rainfall threshold relationship. J. Hydrol. 2016, 541, 246–255. [Google Scholar] [CrossRef]
- Gaume, E.; Borga, M. Post-flood field investigations in upland catchments after major flash floods: Proposal of a methodology and illustrations. J. Flood Risk Manag. 2008, 1, 175–189. [Google Scholar] [CrossRef]
- Kuss, D.; Robert, Y.; Bertrand, C.; Debroize, N.; Nicaise, J.B. Etude de Bassin de Risque Torrent du Rif Talon; Technical Report; RTM/ONF: New York, NY, USA, 2014. [Google Scholar]
- Allignol, F.; Arnaud, F.; Champagnac, J.D.; Delannoy, J.J.; Deline, P.; Fudral, S.; Gasquet, D.; Legaz, A.; Paillet, A.; Ployon, E.; et al. Étude intégrée du Bassin Versant du Vorz Consécutive à la Crue des 22 et 23 Aout 2005; Technical Report; EDYTEM: Le Bourget-du-Lac, France, 2008. [Google Scholar]
- Wetter, O. The potential of historical hydrology in Switzerland. Hydrol. Earth Syst. Sci. 2017, 21, 5781–5803. [Google Scholar] [CrossRef] [Green Version]
- Tarasova, L.; Merz, R.; Kiss, A.; Basso, S.; Blöschl, G.; Merz, B.; Viglione, A.; Plötner, S.; Guse, B.; Schumann, A.; et al. Causative classification of river flood events. WIREs Water 2019, 6, e1353. [Google Scholar] [CrossRef] [Green Version]
- Blanc, A.; Blanchet, J.; Creutin, J.D. Characterizing large-scale circulations driving extreme precipitation in the Northern French Alps. Int. J. Climatol. 2022, 42, 465–480. [Google Scholar] [CrossRef]
Figure 1.
Map (left) of the RTM torrential units of the Grenoble conurbation colored according to the number of events observed over the 1850–2019 period. Map (right) showing the Metropolitan area nested in the Isère and Drac watersheds.
Figure 1.
Map (left) of the RTM torrential units of the Grenoble conurbation colored according to the number of events observed over the 1850–2019 period. Map (right) showing the Metropolitan area nested in the Isère and Drac watersheds.

Figure 2.
Logarithmic (base 10) window showing the instrumental time and space resolution and their period of availability in the study area of Grenoble agglomeration, France (dotted grey rectangles—the upper time-limit of the rectangles is not meaningful). The time and space characteristics of four atmospheric processes controlling rainfall formation at different scales are shaded in light blue after [33]. The relationship established by [34] from extreme flash floods in Europe between the response time of a basin and its size is represented in bold dotted green. From the cited literature, we also show the response times of three rivers (blue crosses—after hydrographs shown in [31]) and one torrent (red cross—after [30]) of the agglomeration. The size of the Metropolitan torrential units of the RTM database are represented in orange (the bold part of the line represents the inter-quantiles 10% to 90% and the thin part the min–max interval—the response time is taken from the relationship of [34]). The two continuous grey rectangles summarize the datasets used in this study.

Figure 3.
Cumulative distribution function (CDF) of the size of the 139 Metropolitan RTM units in a semi-logarithmic graph. The red curve shows the most likely log-normal CDF.
Figure 3.
Cumulative distribution function (CDF) of the size of the 139 Metropolitan RTM units in a semi-logarithmic graph. The red curve shows the most likely log-normal CDF.

Figure 4.
Cumulative count of torrential flood events reported in the RTM database over the period 1850–2019. In total, 282 torrential events (light grey curve) have been reported over the period. The represented slopes (dark grey lines) are computed after a Poisson hypothesis (ratio between the total counts and the duration of the considered periods—1850–1970 and 1980–2019). The cumulative counts for three classes of flood intensity are displayed in green (1-very-weak), yellow (2-weak) and red (3-medium). The cumulative counts for the Summer season and the other three seasons pulled together are displayed in dotted blue and dotted red, respectively.

Figure 5.
Distribution of the torrential flooding causes for 133 reported RTM events for which a narrative of causes is proposed. We distinguish five types of causes: rainfall as the single cause of the flood (blue), snow melt (green), soil moisture and river morphology (yellow), logjams blocking the torrent (orange), and counter-efficient structure protection (red). The proportions are given for the three RTM classes of intensity that are attributed to the considered basins over the study period (the single 4-high intensity event that occurred in 1867 has no narrative about causes).

Figure 6.
Cumulative counts of riverine flood events reported in the RTM database over the period 1850–2019. In total, over the period, 41 events have been reported for the 5 RTM riverine sites (continuous thin grey curve). Taking into account the multiple-site events—i.e., events concerning several sites of either the Isère or the Drac Rivers—these 41 events reduce to 28 events (continuous bold grey curve), among which 18 events concern the Isère River (yellow bold curve) and 10 events concern the Drac River (orange bold curve). These last two curves are compared with the series of 51 events of the “Historisque” research dataset for the Isère (dashed yellow curve) and Drac Rivers (dashed orange curve). The represented slopes (dotted grey lines) are the ratios between the total counts and the duration of the considered period (Poisson hypothesis). The time evolution of the storage capacity of the reservoirs built on the Isère an Drac Rivers (dotted black curve graduated in percent of the final capacity reached in the 1990’s—right hand y-axis) as well as the temporality of the main post-World-War-II protection programs (three dotted grey bars representing successively the so-called Schneider Project, the update of Grenoble dikes, and the rising of the Isère Left Bank dike) are also sketched on the graph (arbitrary y-coordinate).

Figure 7.
Cumulative count of Metropolitan flood events over the period 1850–2019. In total 104, Metropolitan events (light grey curve) have been selected over the period. The cumulative counts for events that occurred on rivers only (blue curve); on torrents only (red curve); and the multiscale events, i.e., co-occurrence of torrential and riverine flooding (dotted orange curve), are also plotted in the same coordinate systems, with the years (x-Axis) and the event counts (y-Axis).

Figure 8.
Distribution of the duration of Metropolitan events in days. The number of events (y-Axis) is given as a function of the duration (x-Axis) for events involving only torrents (green curve, 53 events in total) and only rivers (orange curve, 34 events), for multiscale events (yellow dotted curve, 17 events), and for all the events (blue dotted curve, 104 events).

Figure 9.
Distribution of the number of RTM watershed units touched by Metropolitan events. The number of events (y-Axis) is given as a function of the number of units (x-Axis) for events involving only torrents (green curve, 53 events in total) and only rivers (orange curve, 34 events), for multiscale events (yellow dotted curve, 17 events), and for all the events (blue dotted curve, 104 events).


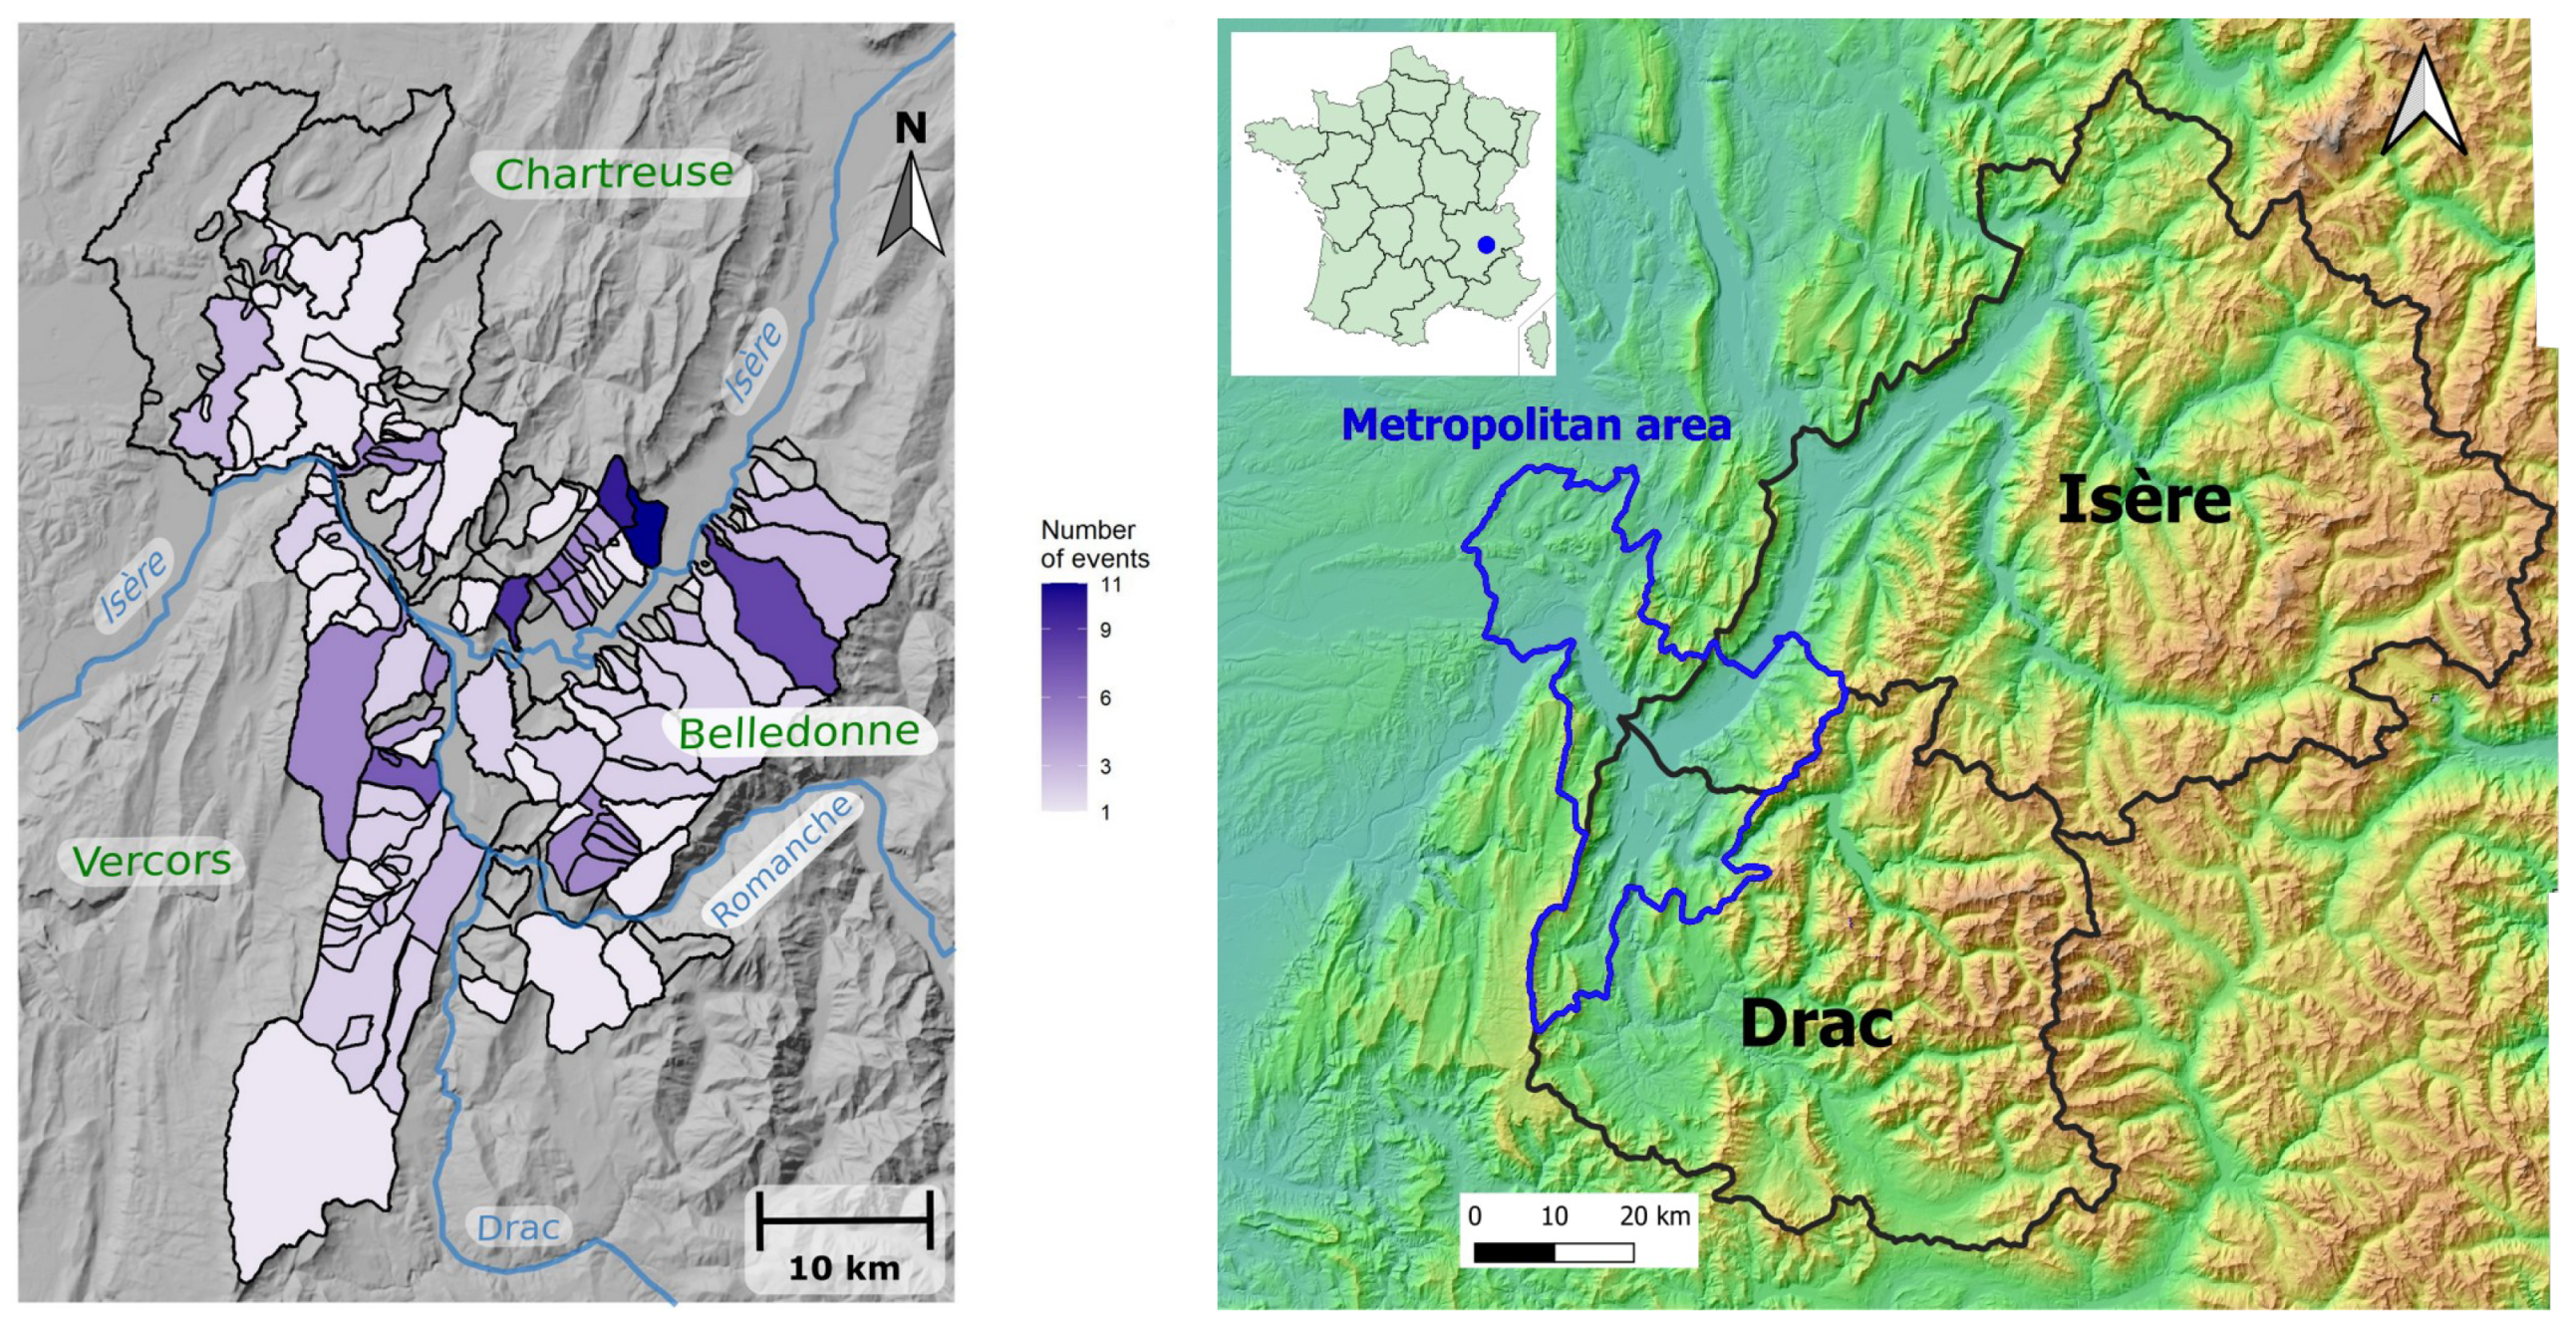
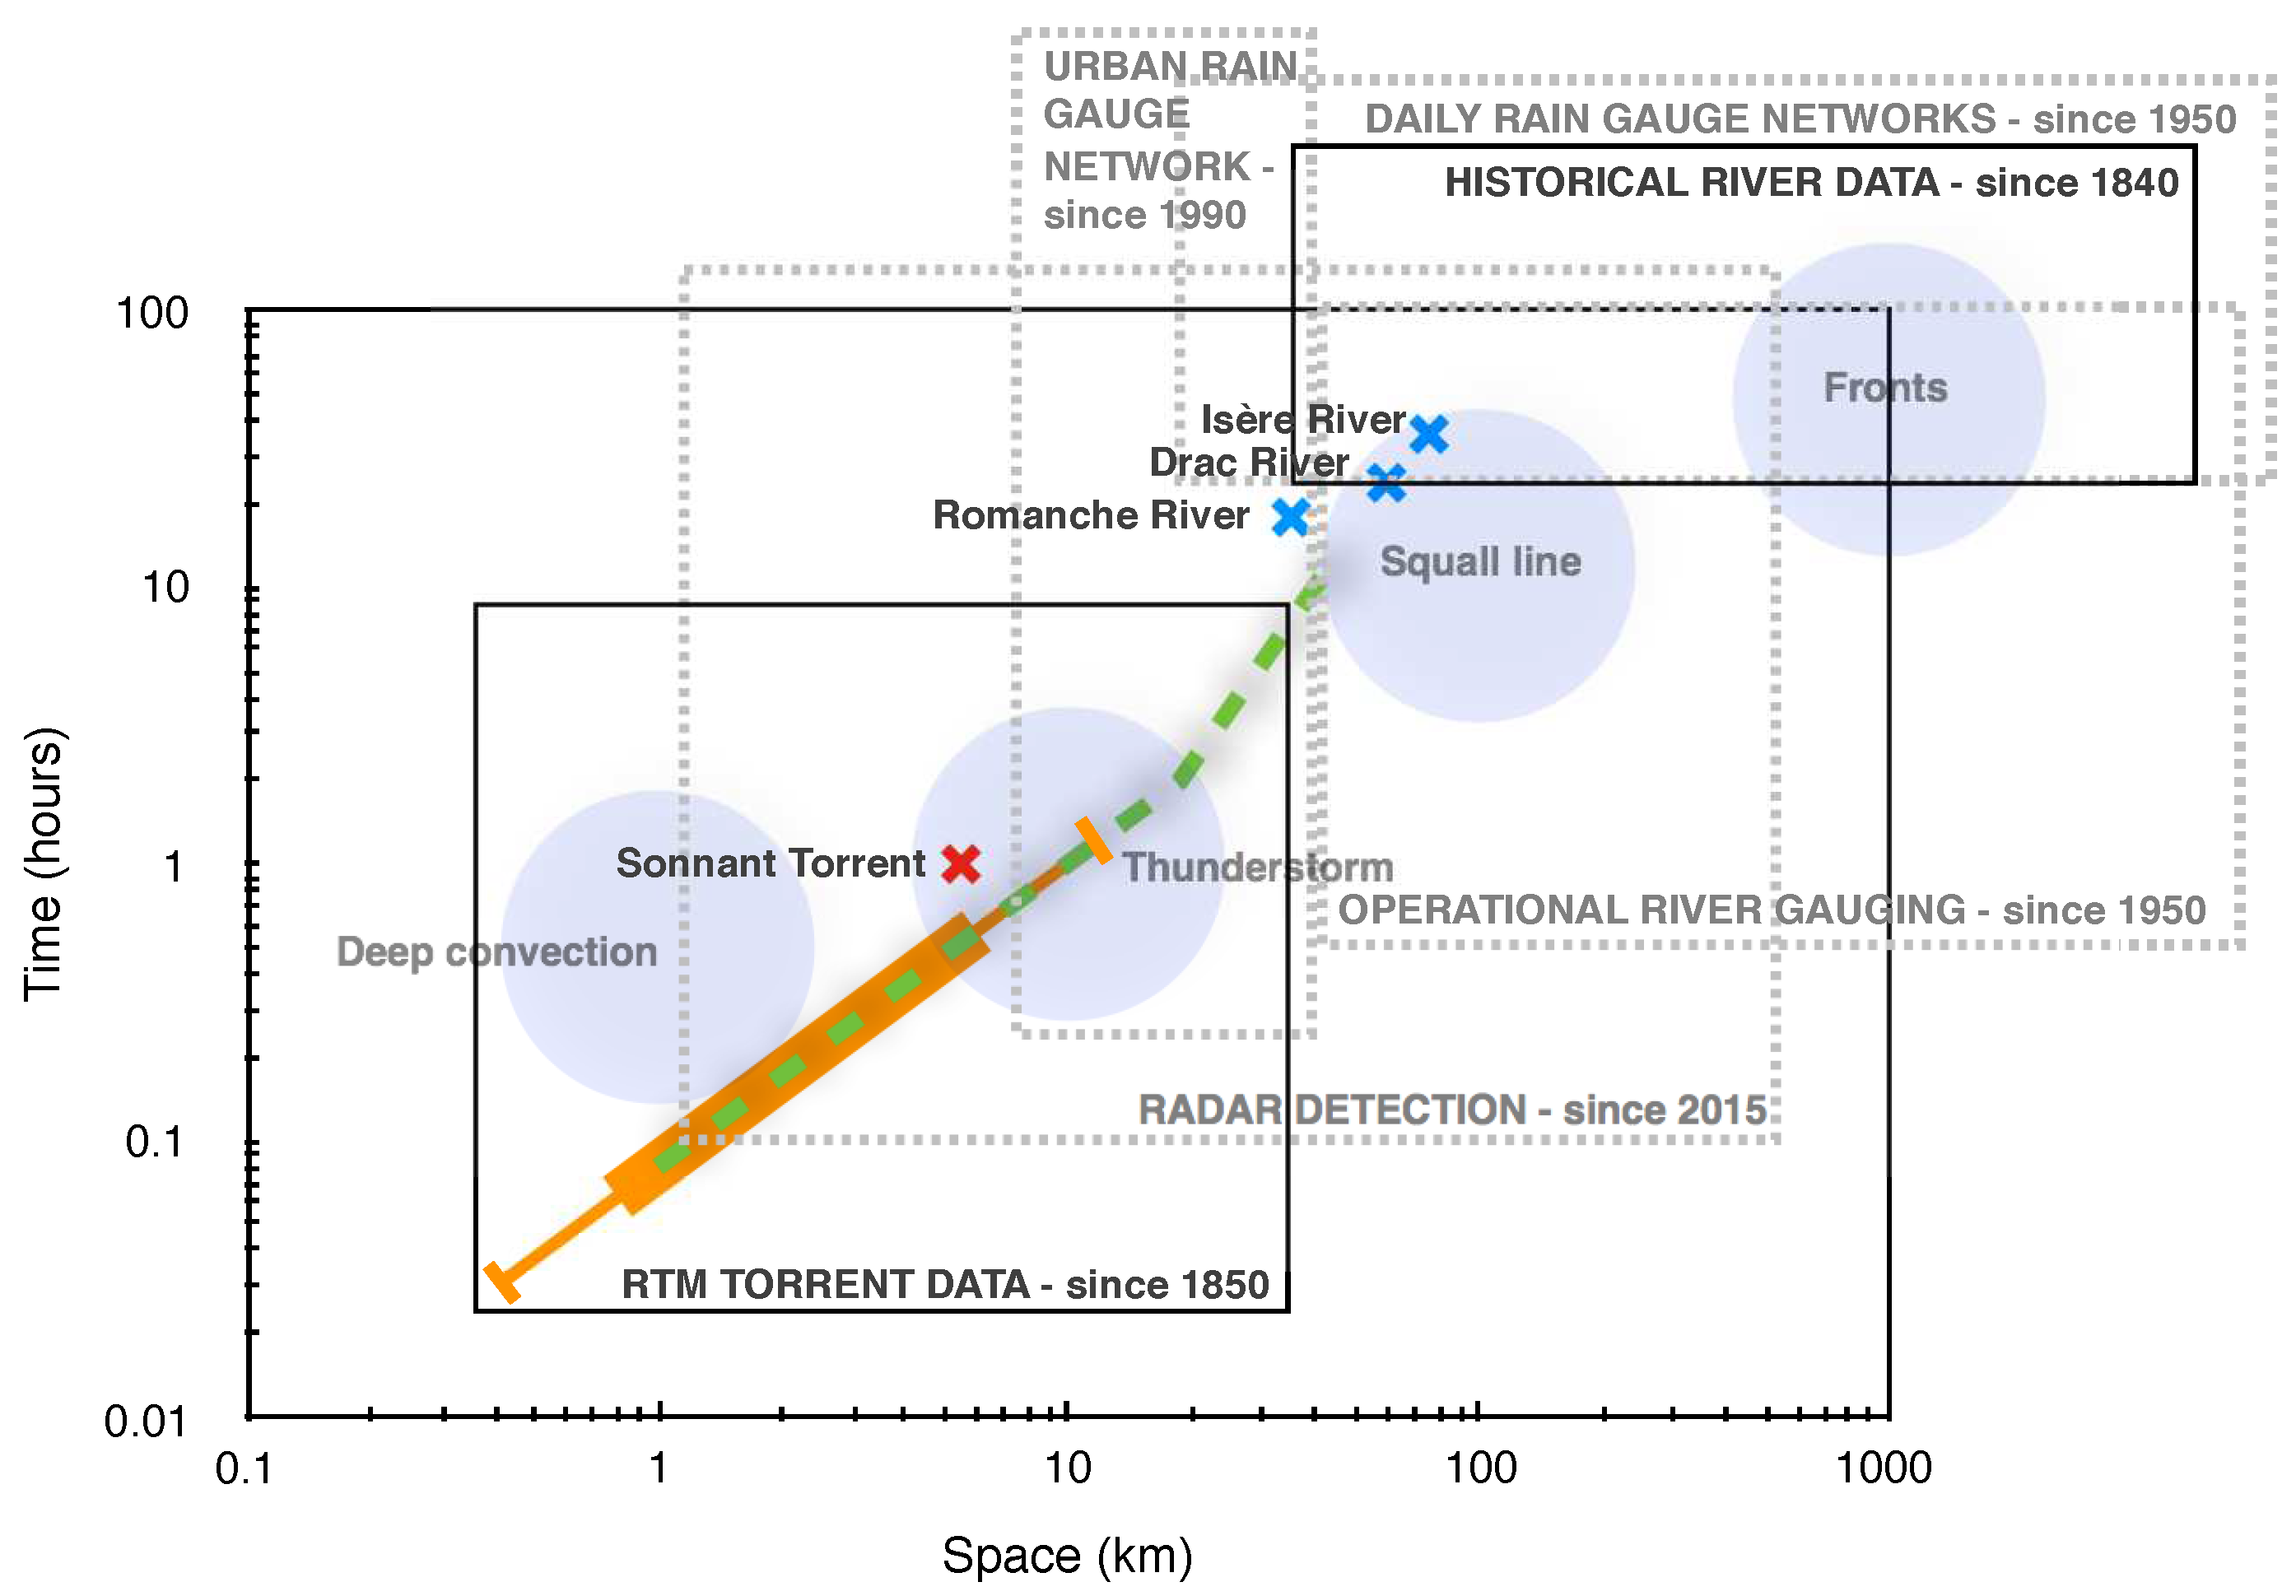
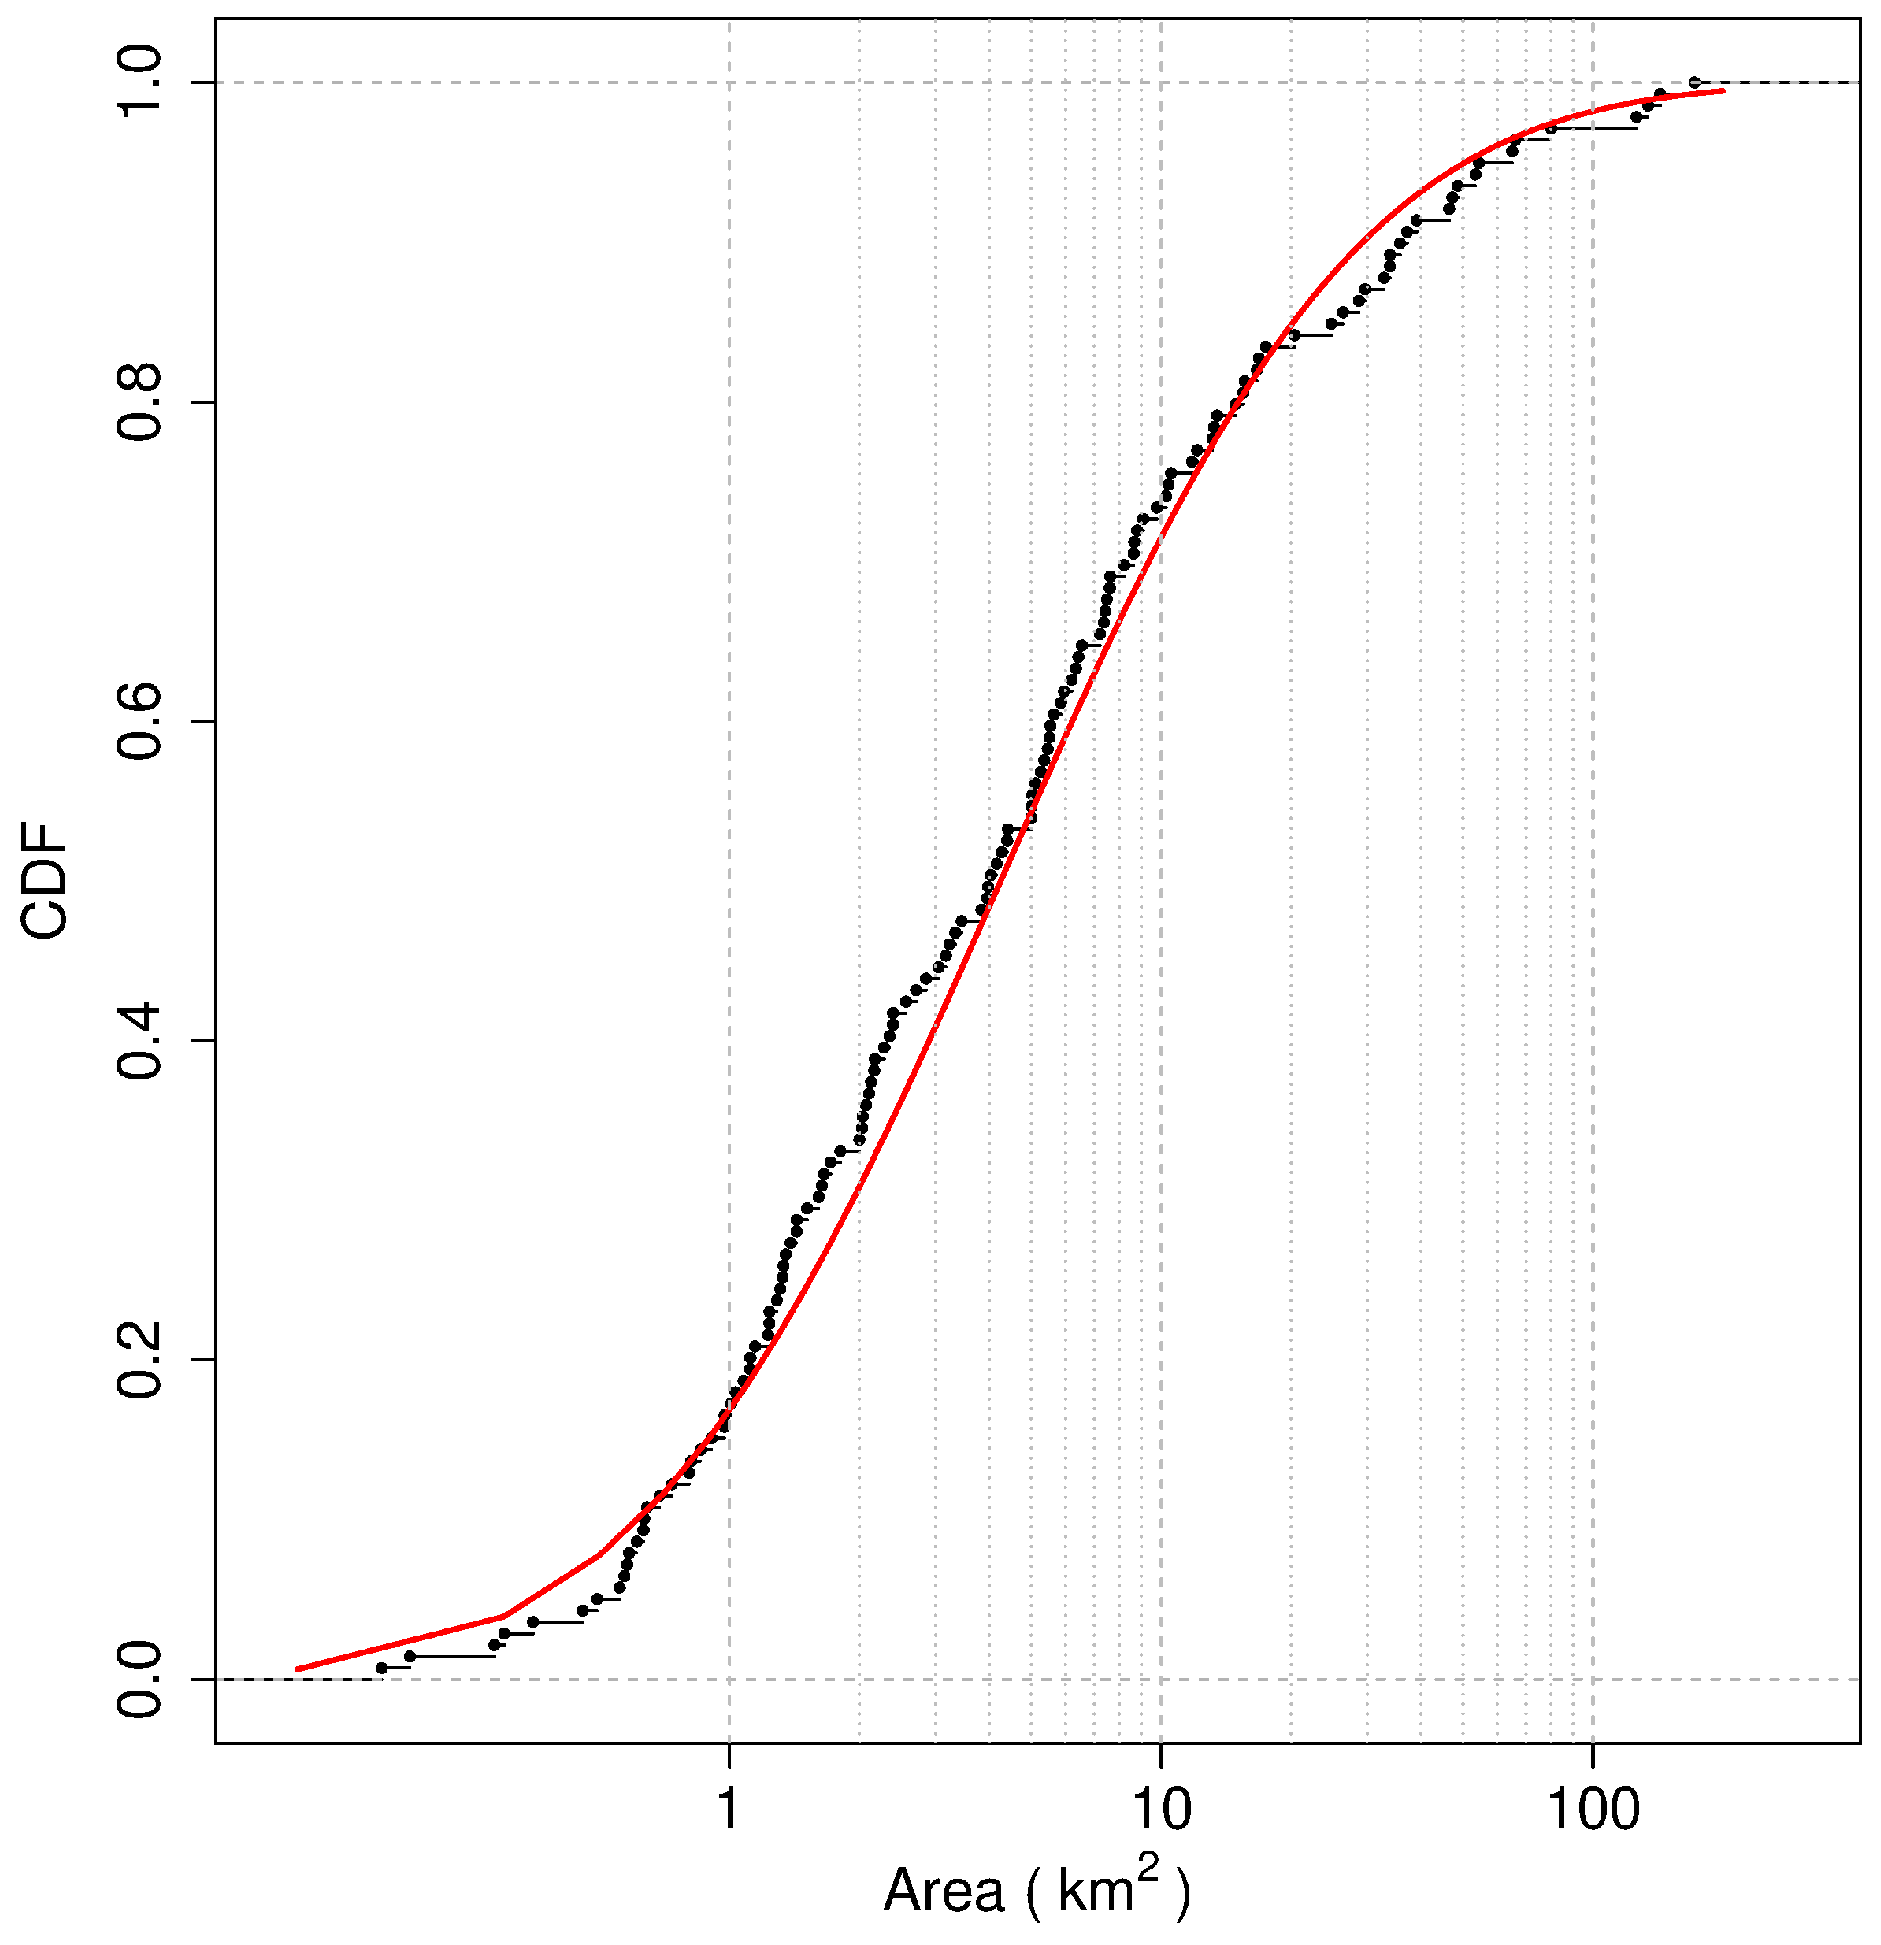
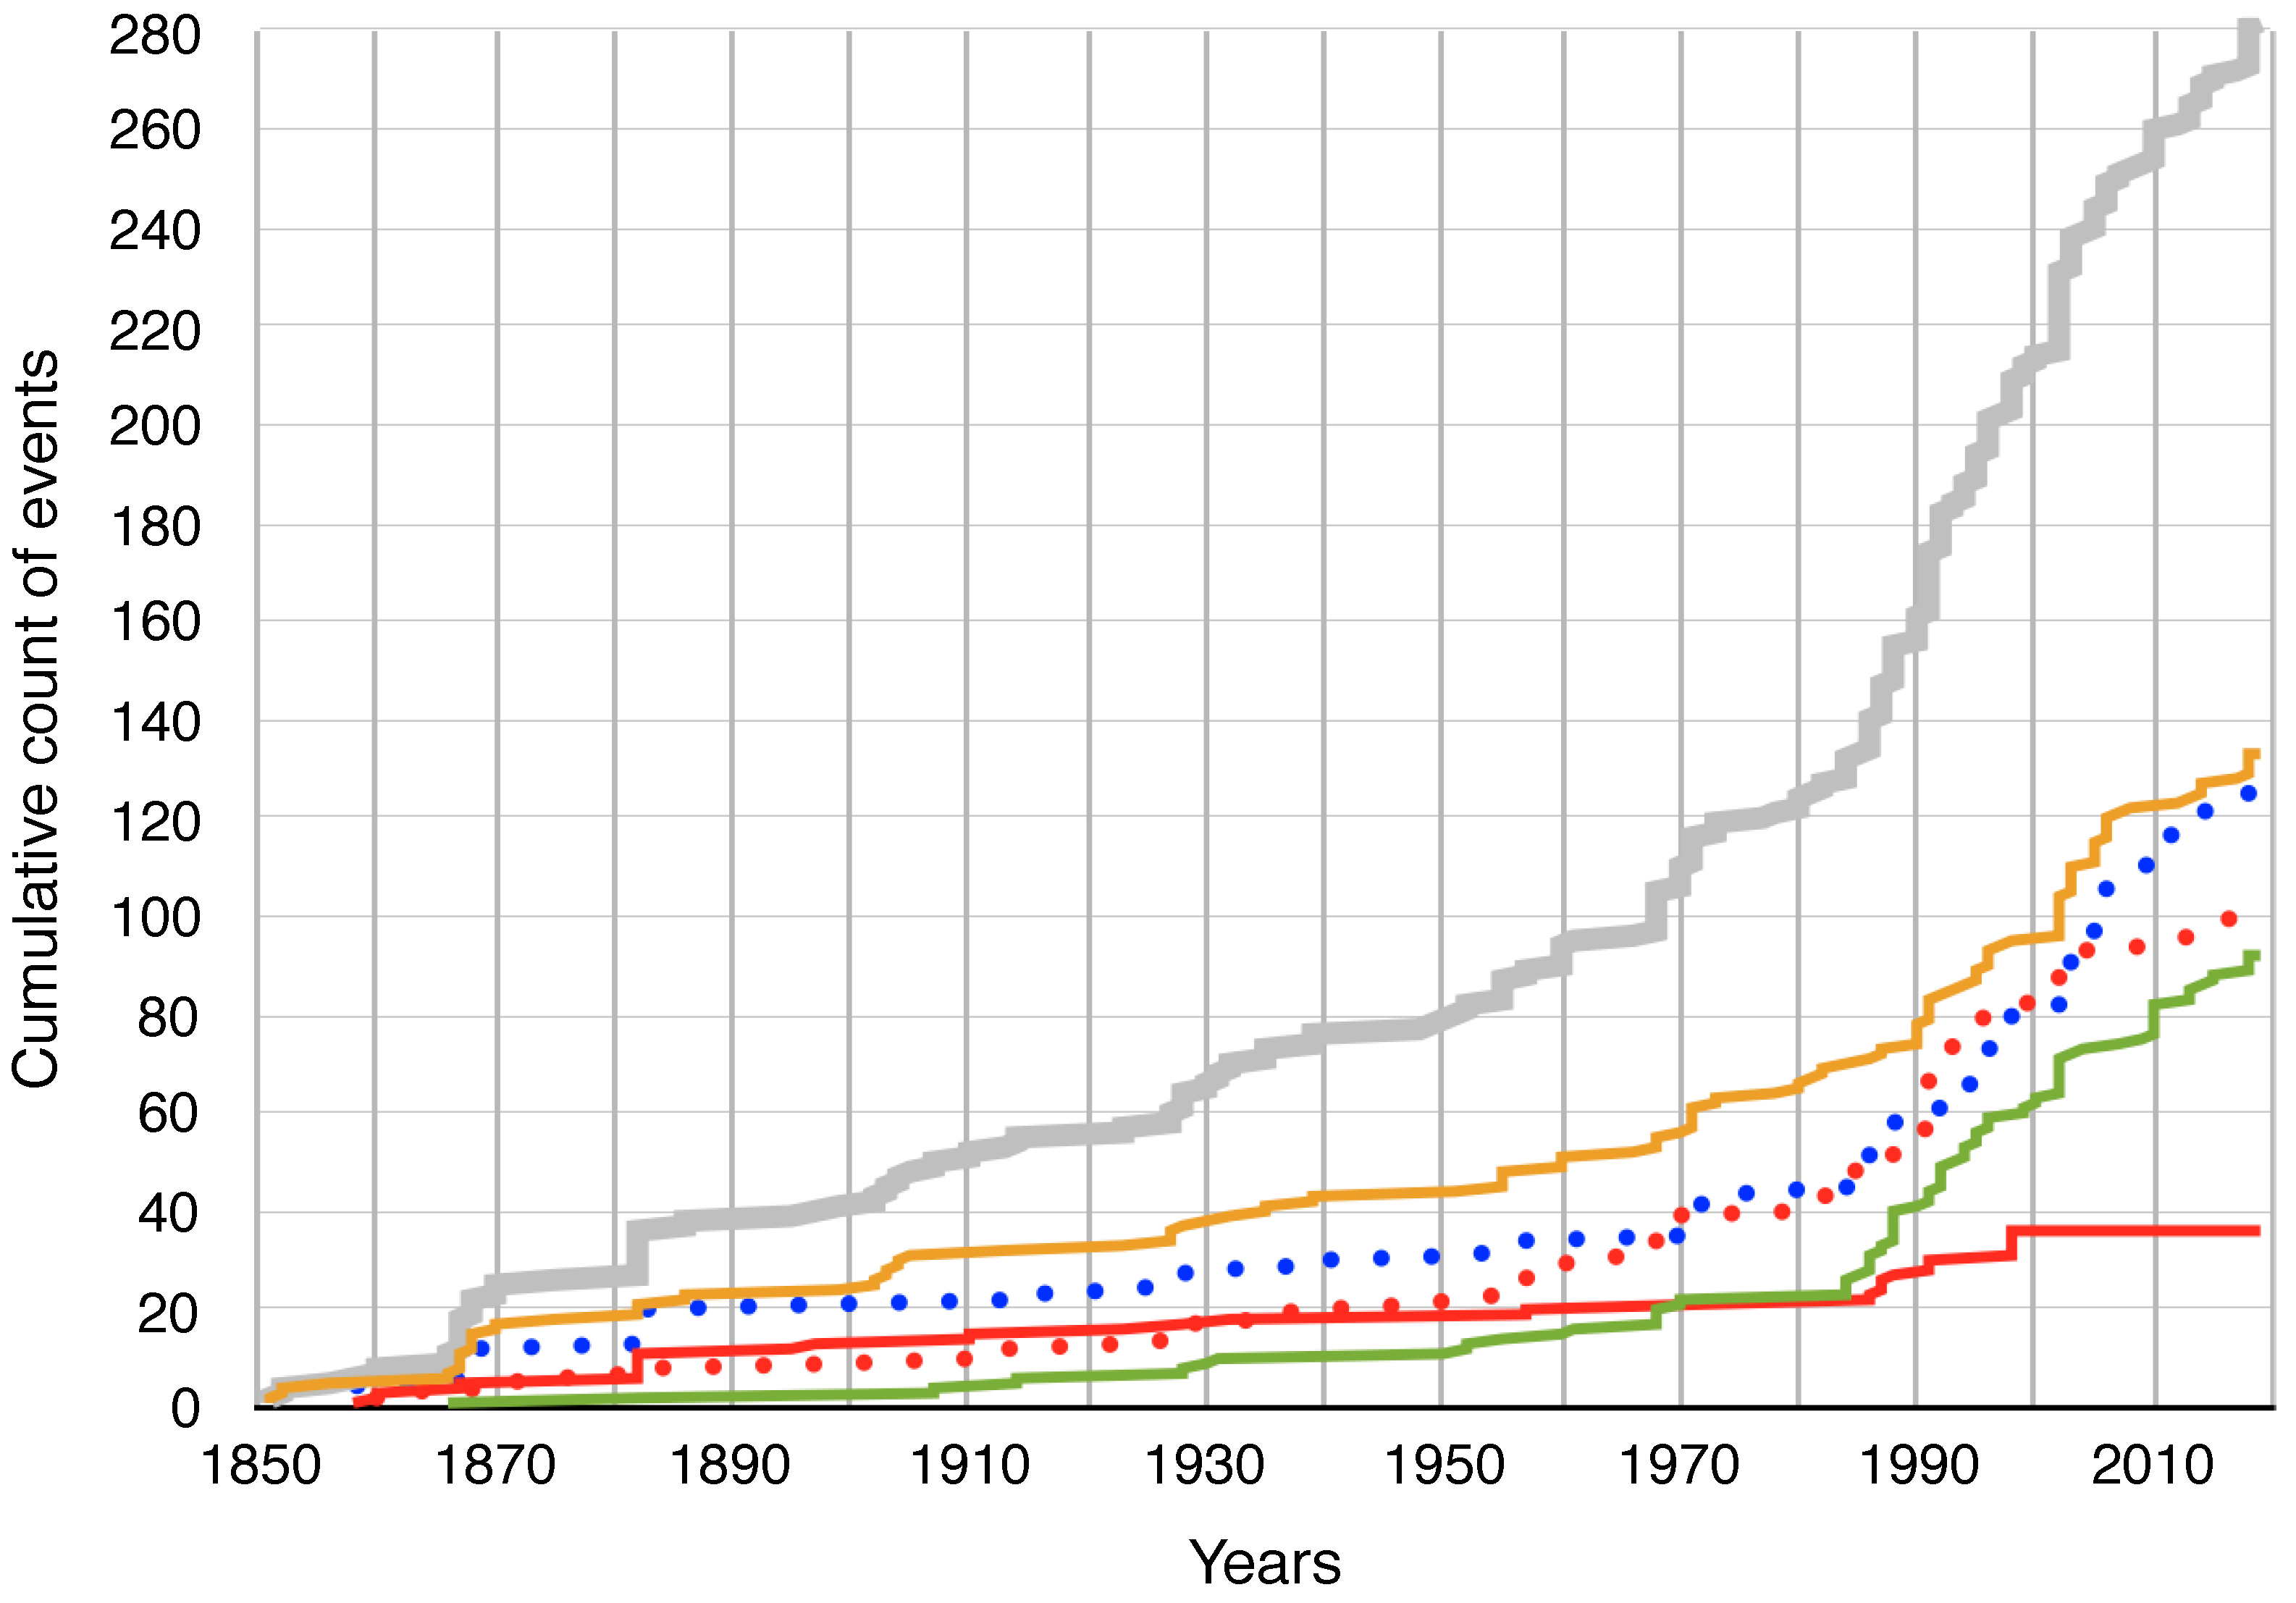
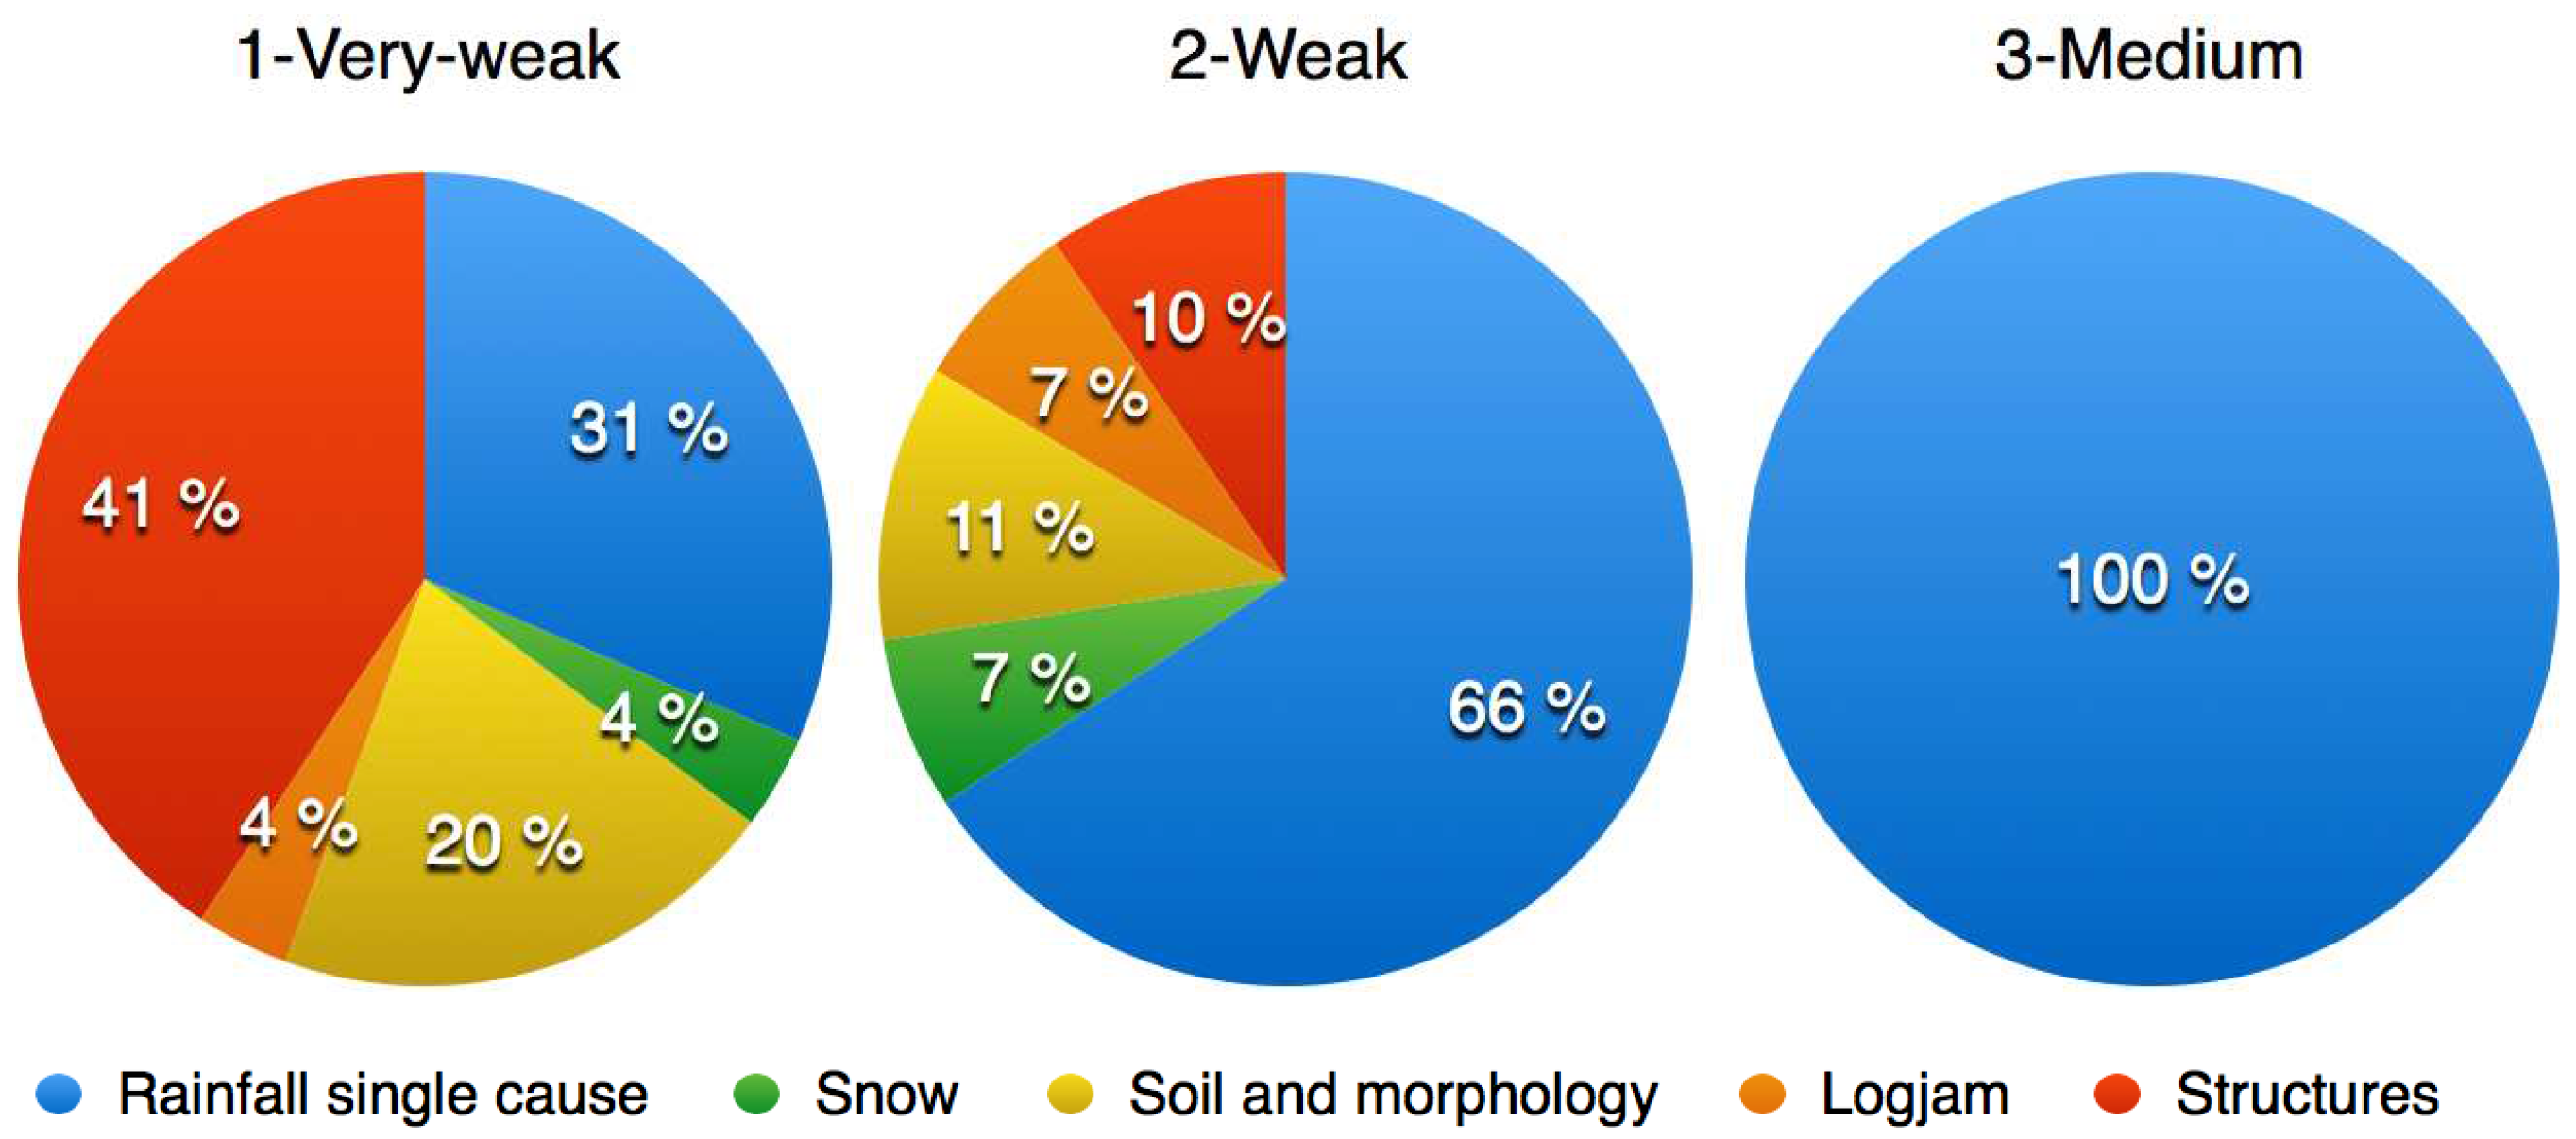
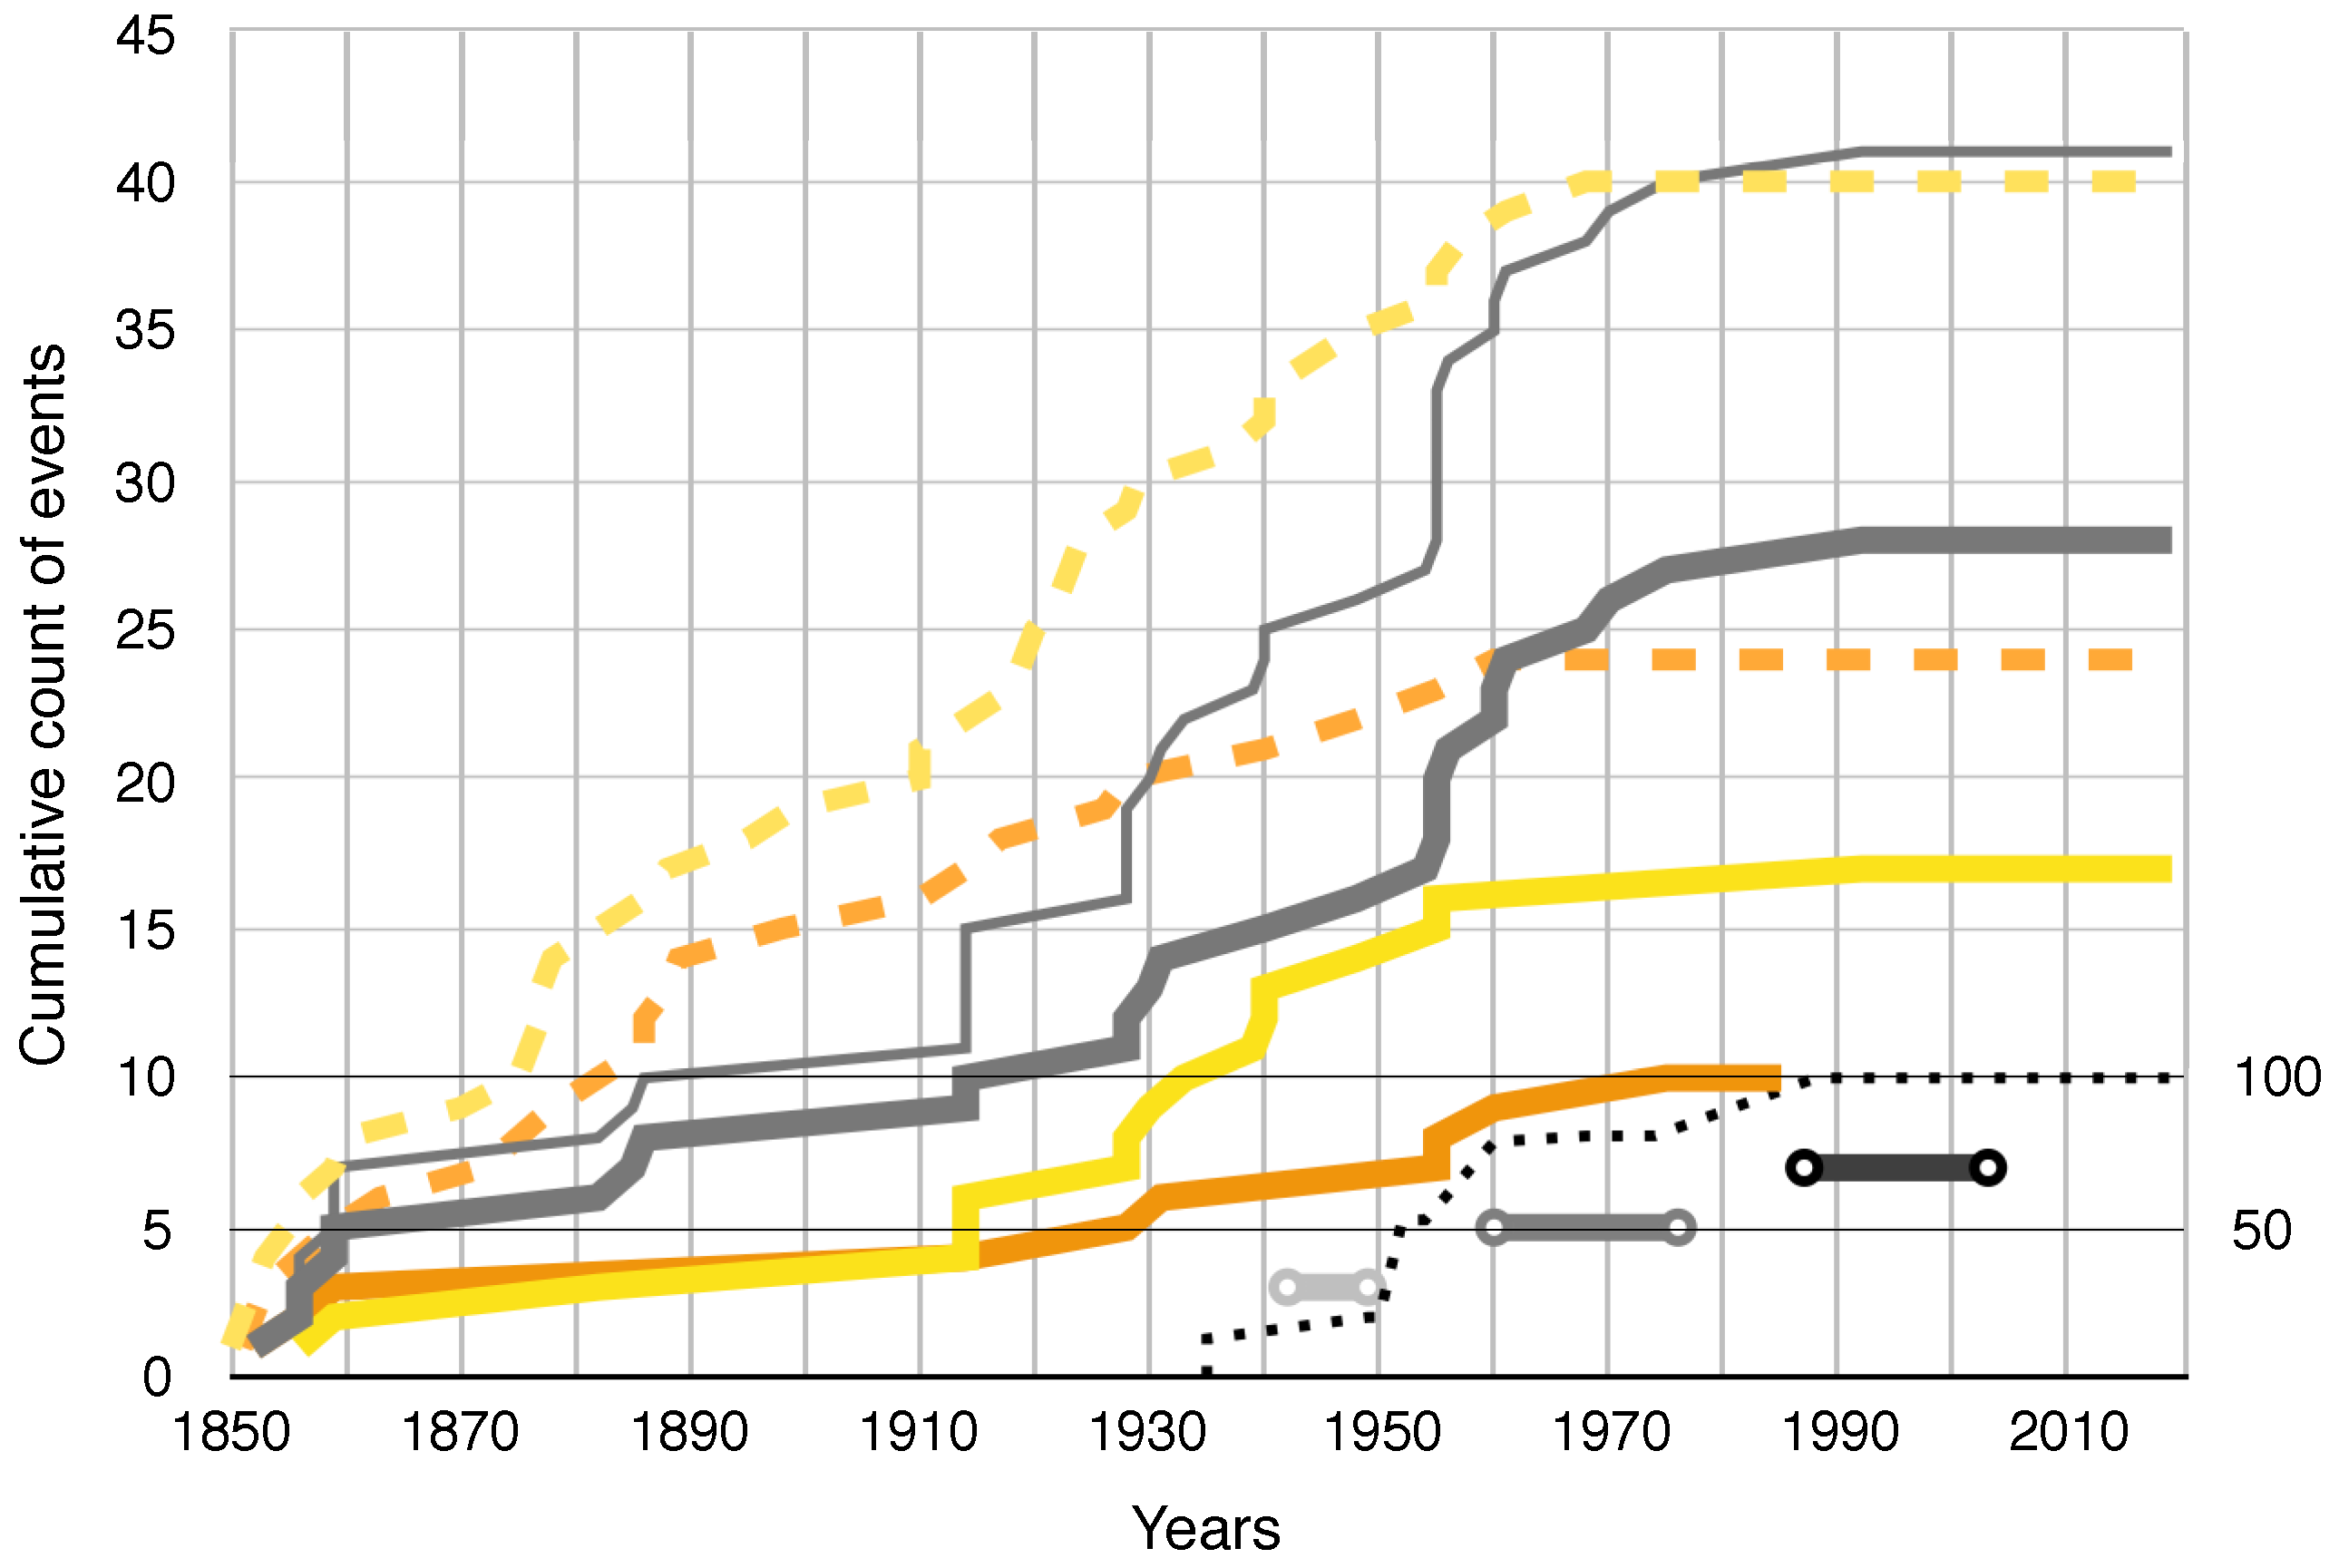
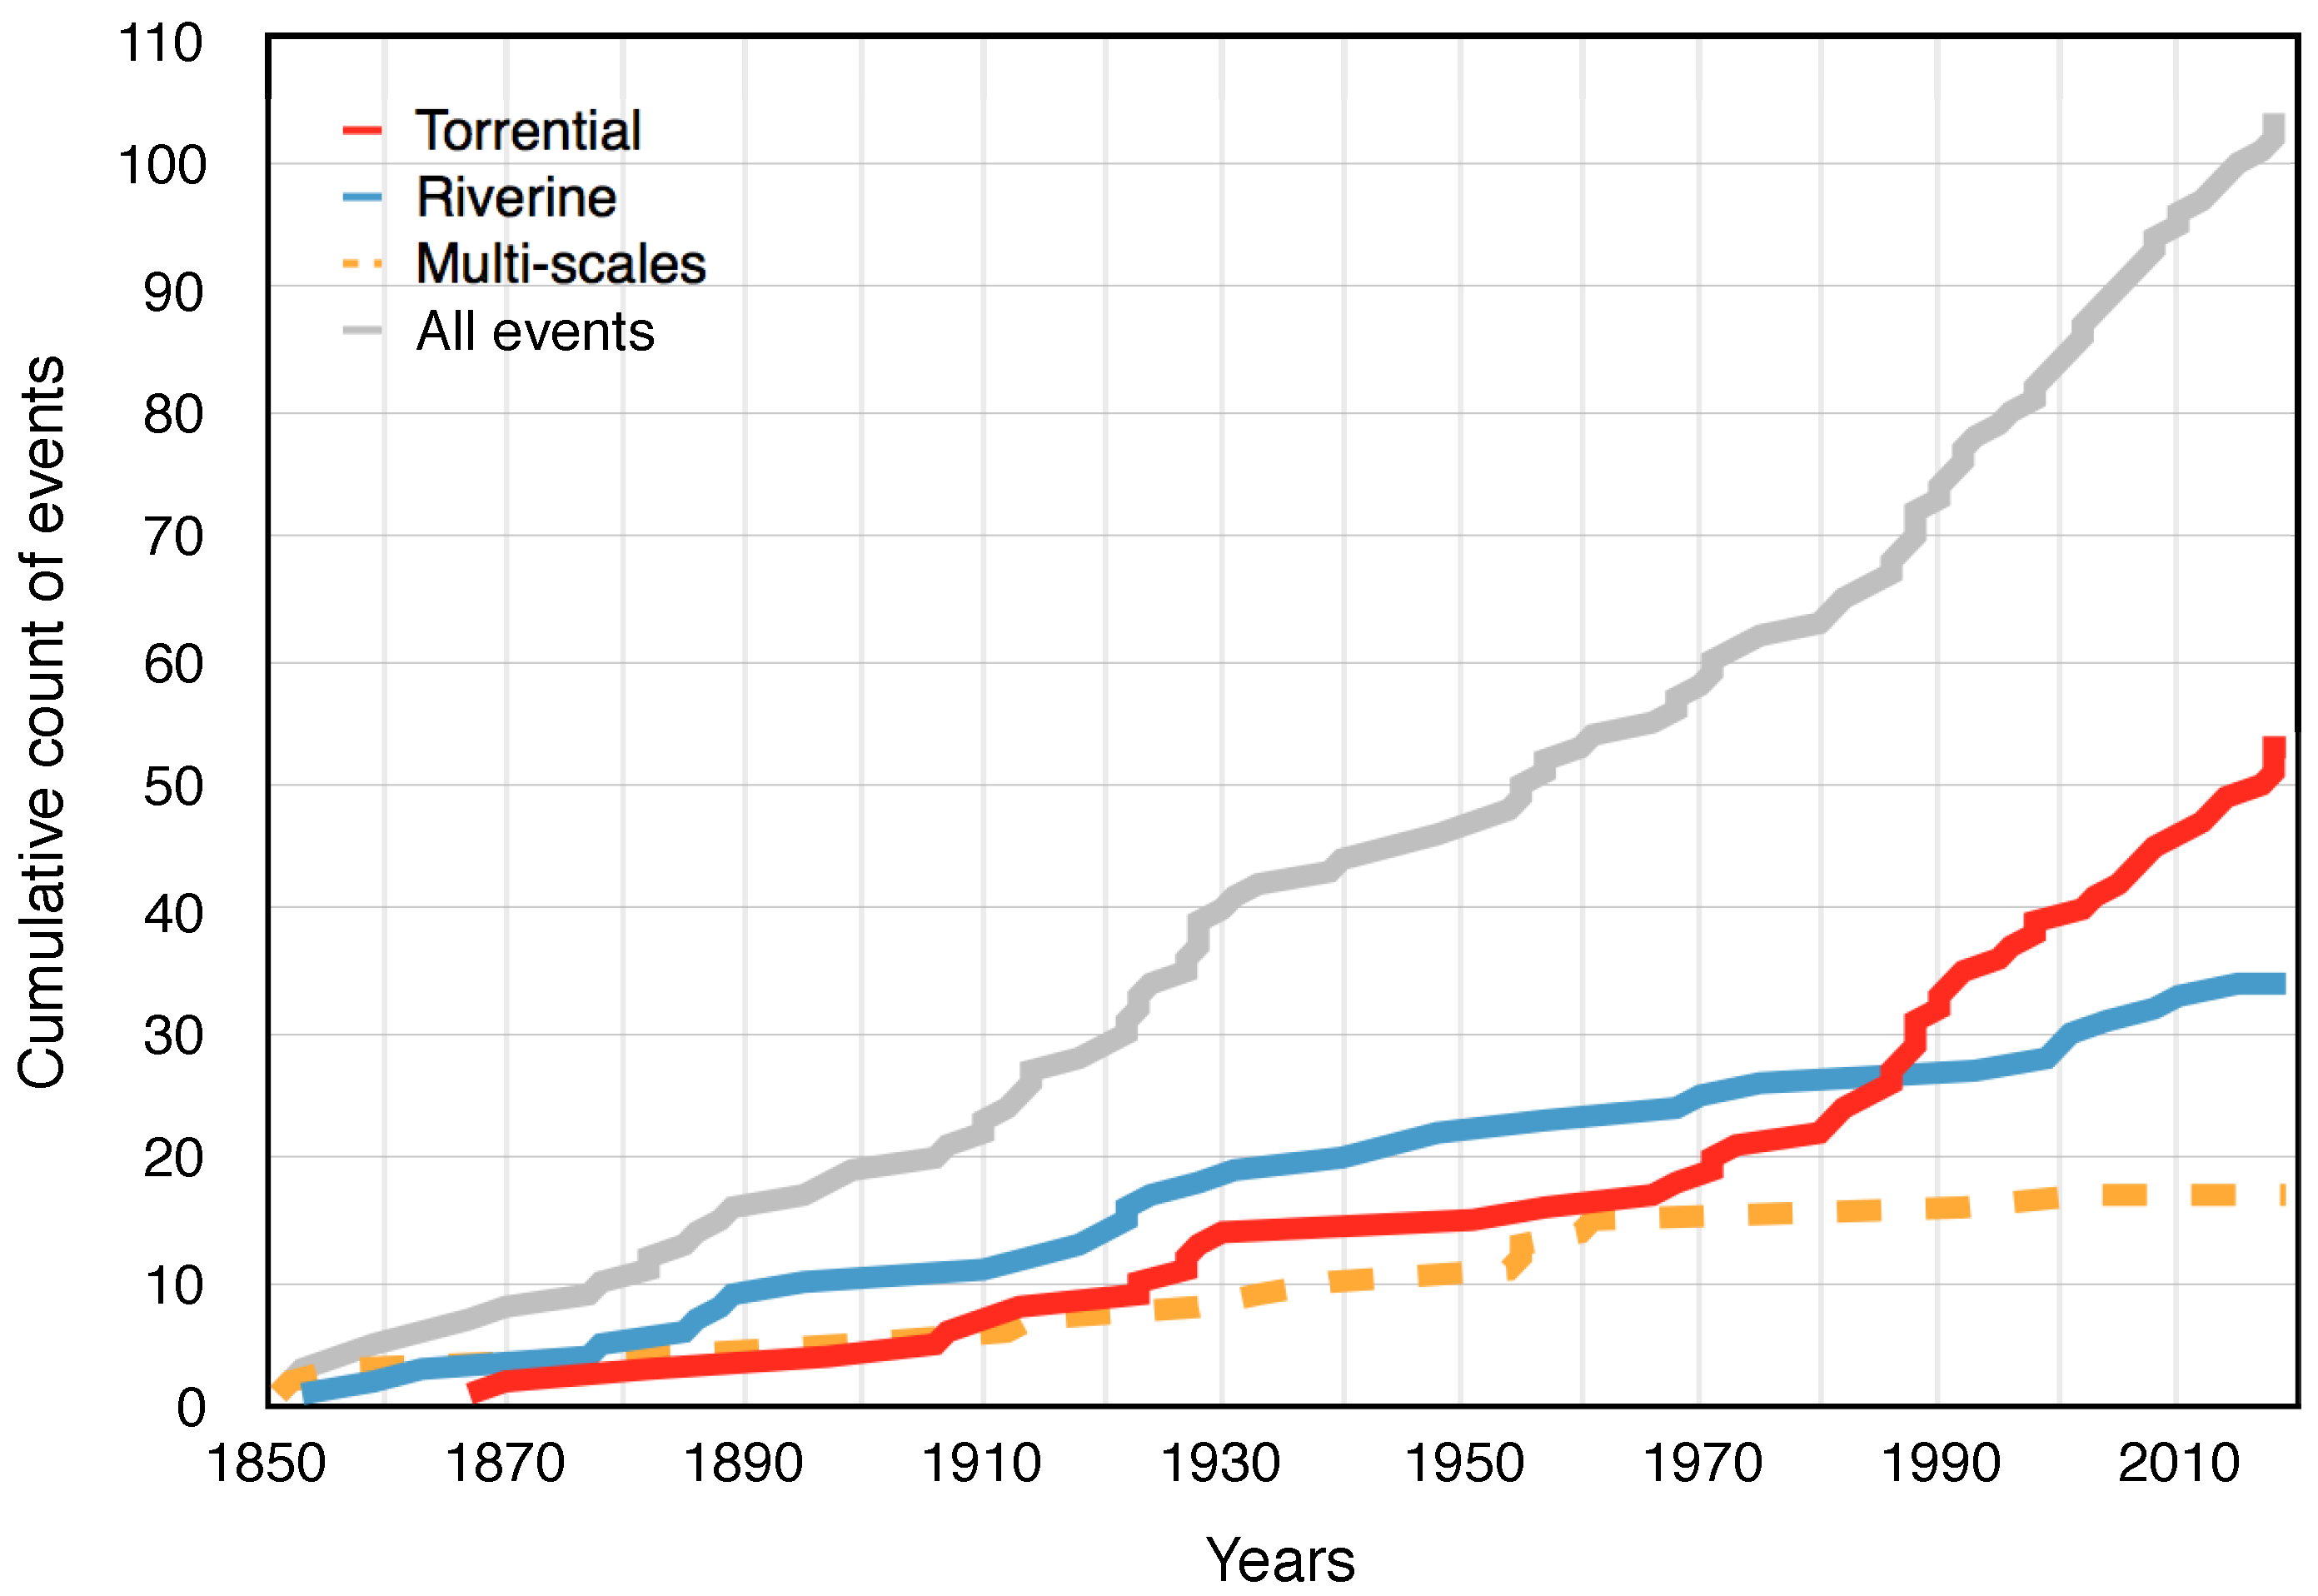
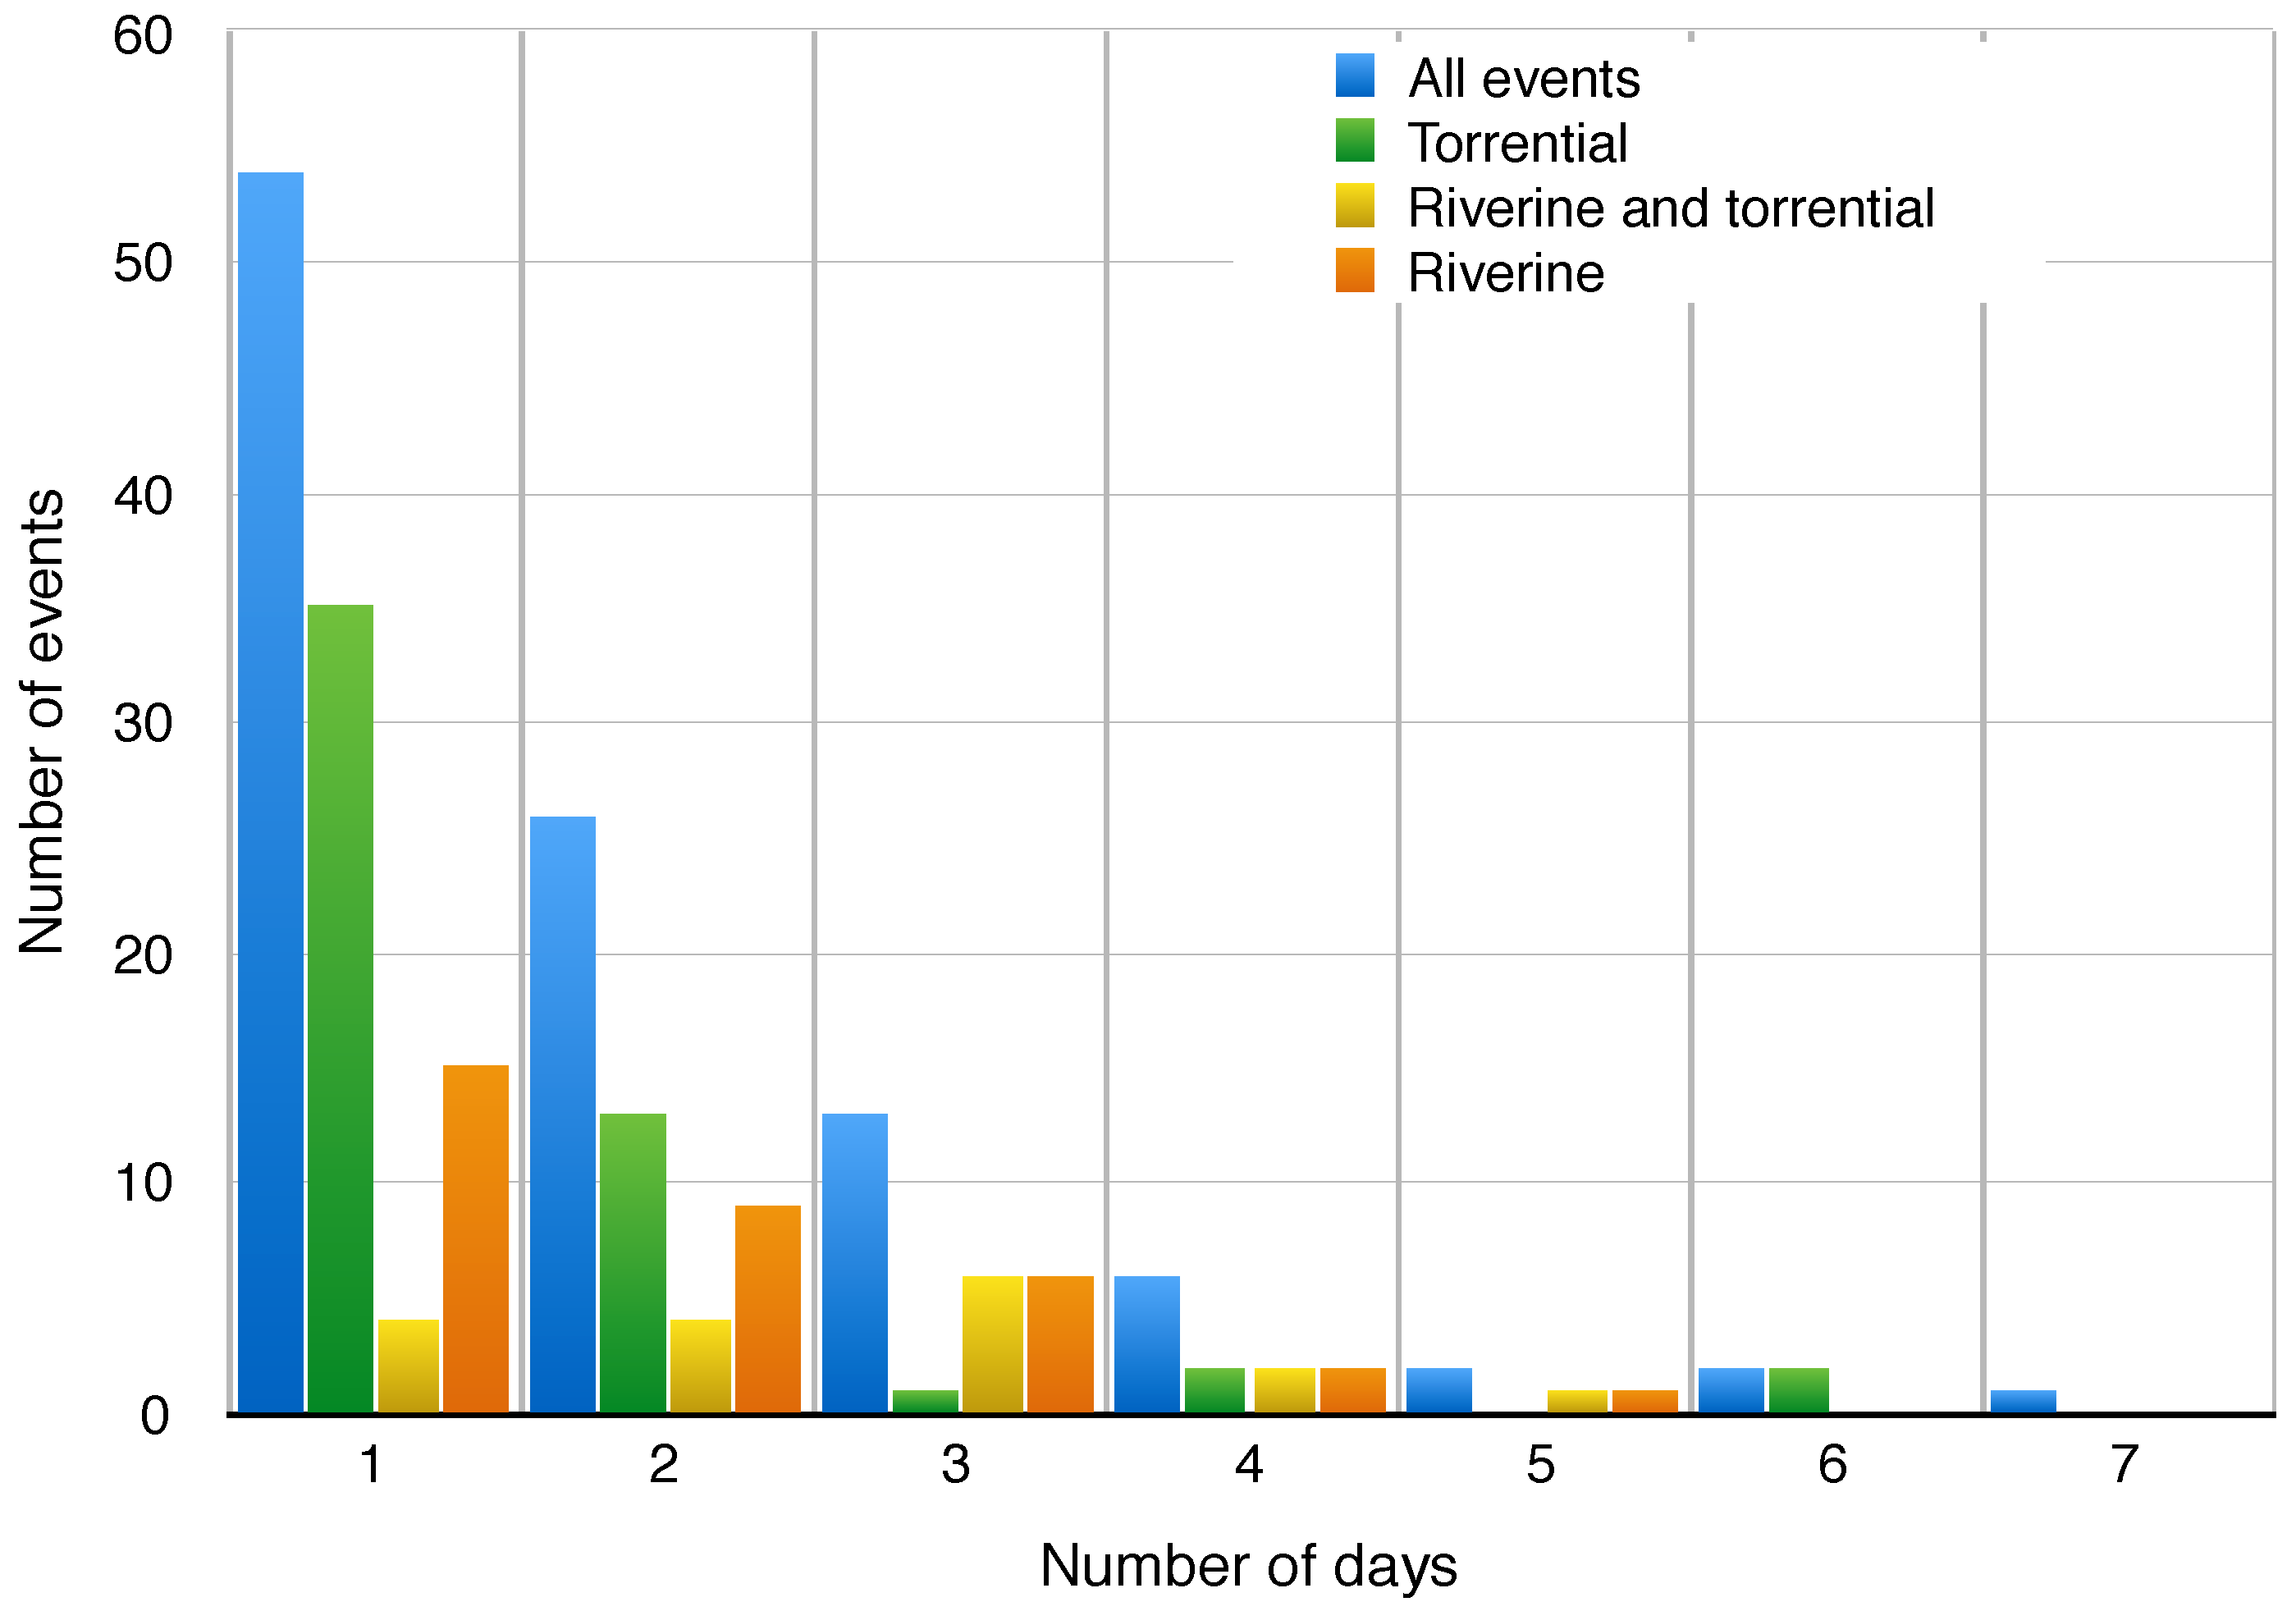
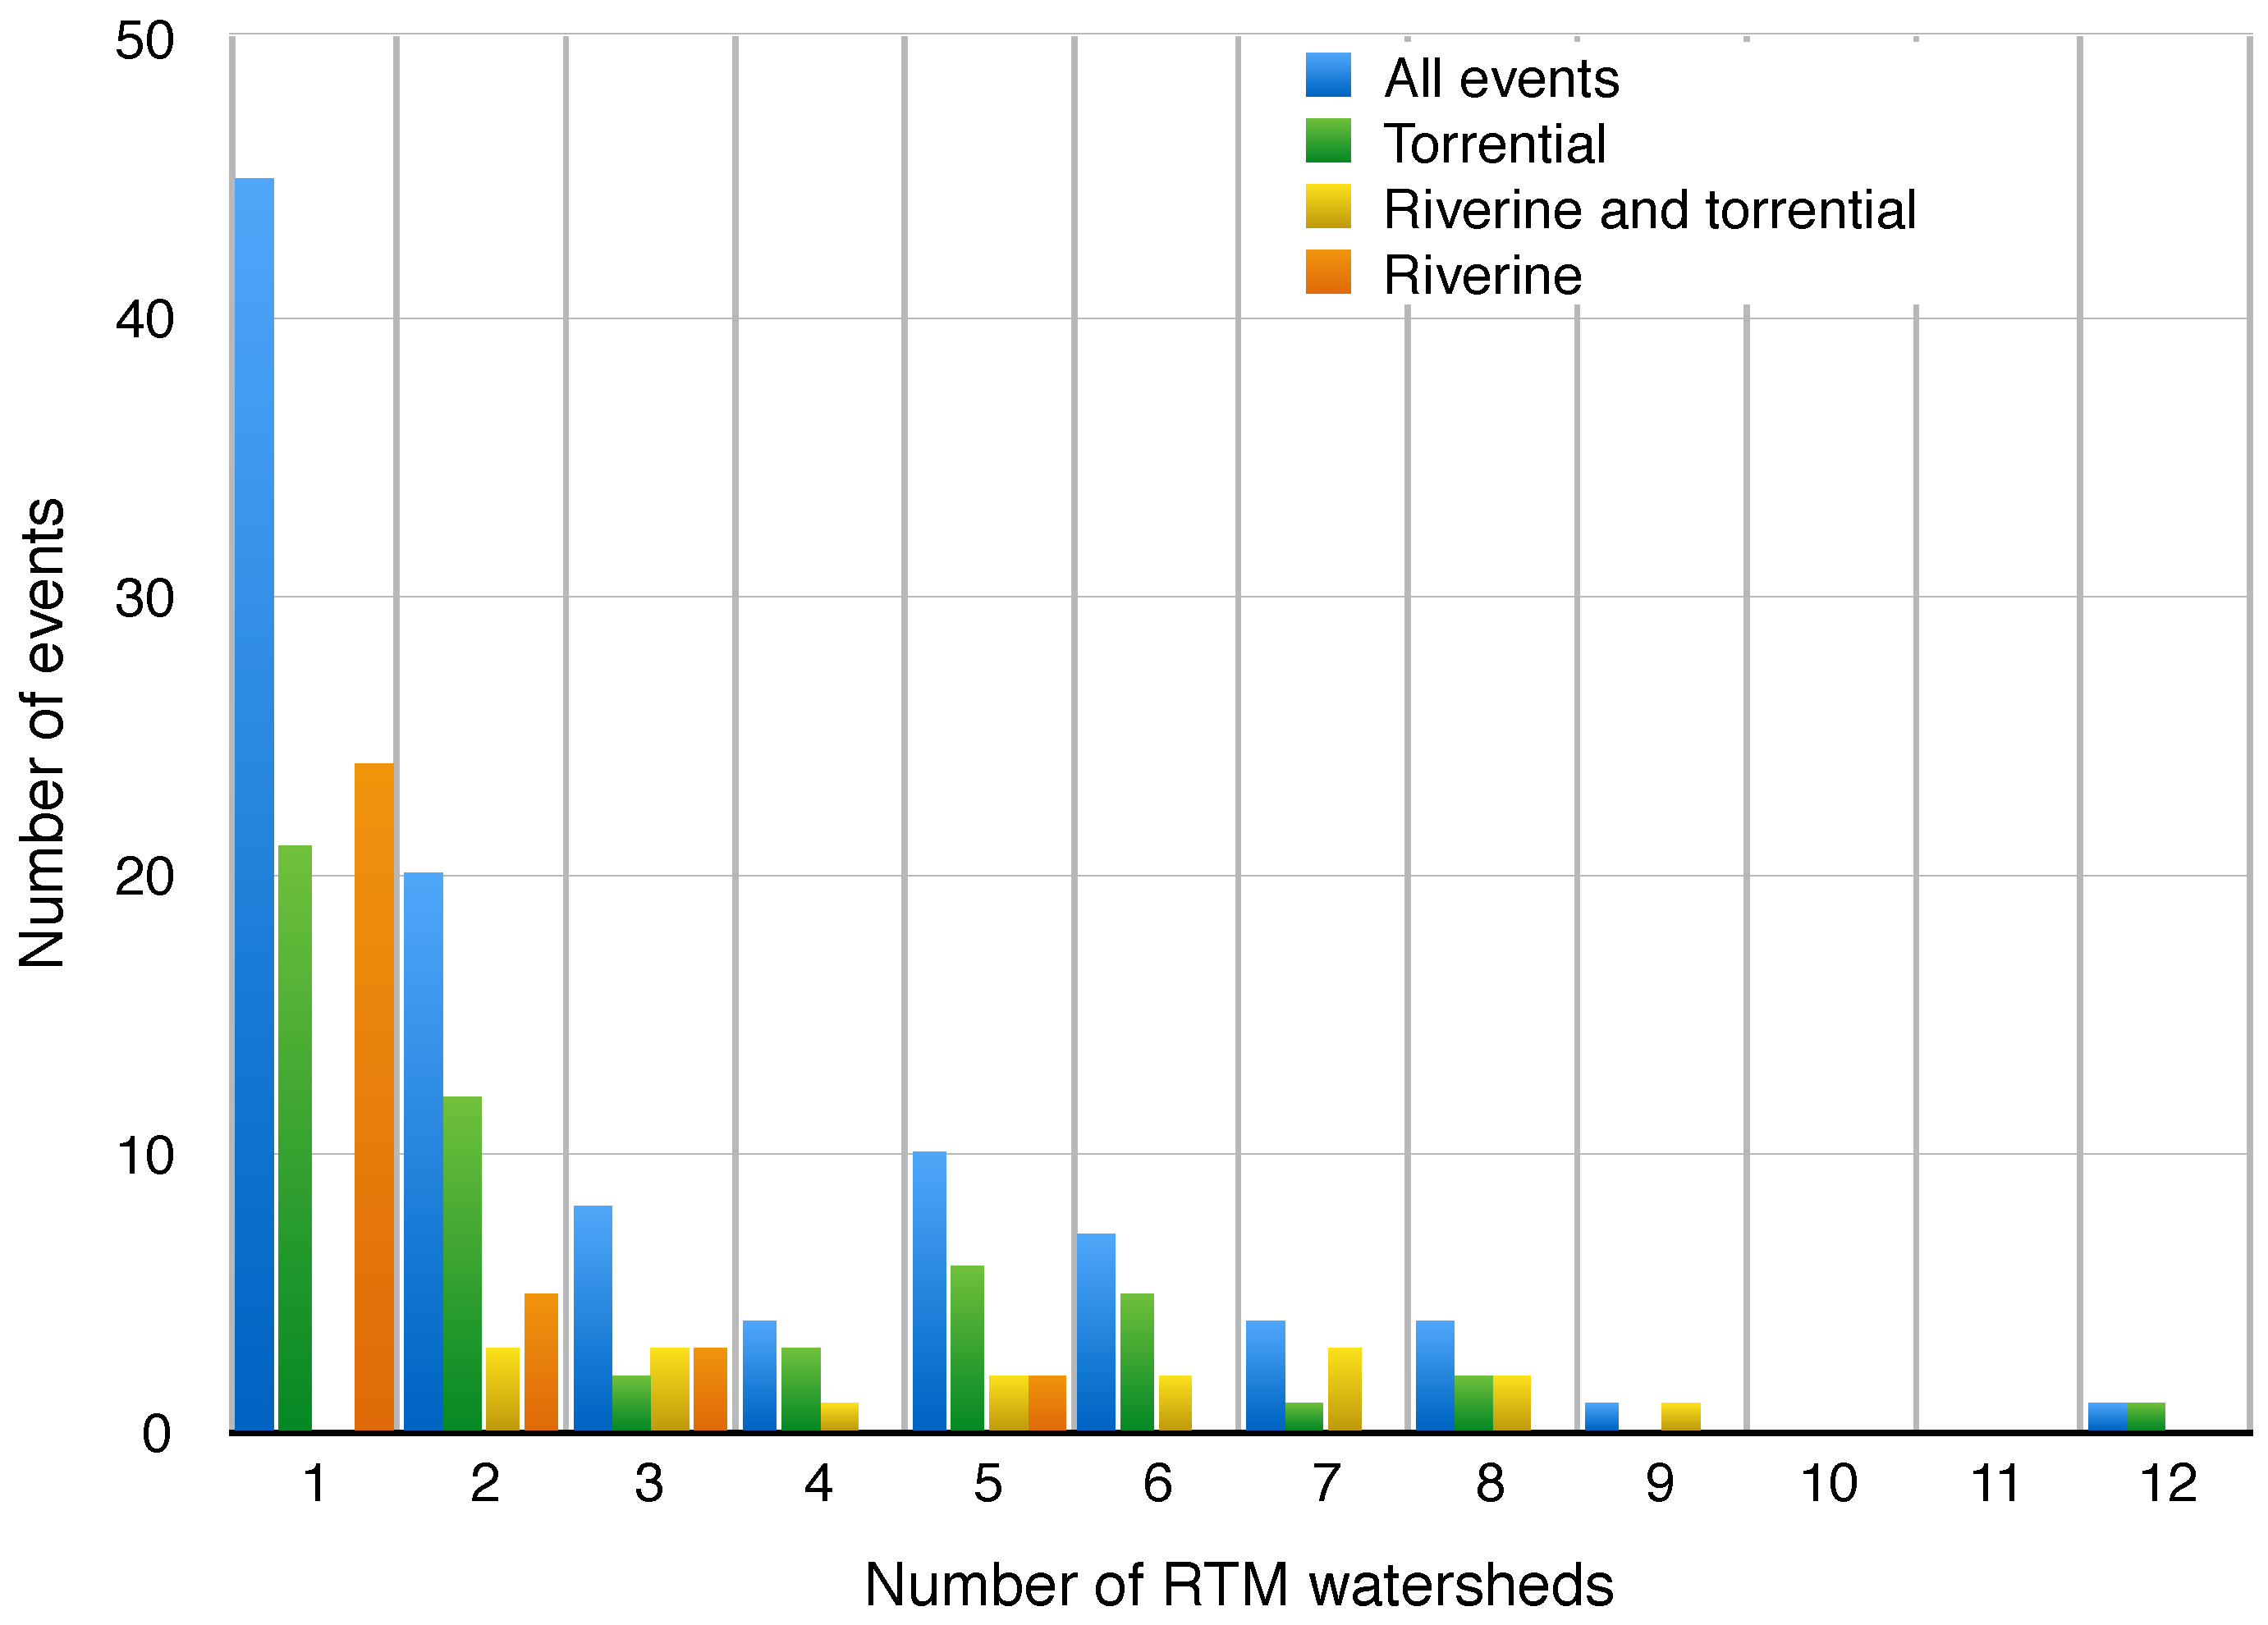
Table 1.
Content of the RTM database for the description of an event at a site.
| Nature | Variable | Description |
|---|---|---|
| General | Phenomenon | Torrential floods and inundations in our case |
| Name of the site | Name of the watershed or sub-watershed (Quantitative) | |
| Date of event | Date of the day (sometimes only the month or the year) (Quantitative) | |
| Municipalities | List of affected municipalities (Quantitative) | |
| Hazard | General description | Narrative of typically 50 words (Qualitative) |
| Causes | Meteorological and hydrological conditions (Qualitative and Quantitative elements on storm duration for instance) | |
| Space organization | Up-/downstream details (Qualitative and Quantitative elements on volumes of transported material for instance) | |
| Link with other sites | Often missing (Qualitative) | |
| Intensity | (Semi-quantitative) (see Table 2) | |
| Duration | Often about the storm duration (Quantitative) | |
| Vulnerability | Victims | Yes/no |
| Damages or disruptions | Yes/no | |
| Information on victims | Location and number of victims, nature (injury, death) (Semi- quantitative) | |
| Information on damages | Location, time, water levels and sediment volumes, type (road, houses), sometime costs (Semi-quantitative) |
Table 2.
Description of the four classes of torrential flood intensity and of the three levels of riverine flooding defined for the RTM database as well as river flooding classes defined for the Historisque database [35,49].
| Torrents | 1-Very-Weak | 2-Weak | 3-Medium | 4-Strong |
|---|---|---|---|---|
| Physical parameters | ||||
| Water rising rate (m/h) | <1 m/12 h | 1–2 m/2–12 h | 1 m/1–2 h | >1 m/1 h |
| Volume of deposit (m3) | <1000 | 1000–10,000 | 10,000–100,000 | >100,000 |
| Alluvial fan coverage (%) | minor bed | <10% | 10–50% | 50–100% |
| Biggest blocks (cm) | 10 | 10–50 | 50–100 | >100 |
| Impacts | ||||
| Buildings | none | destruction of cabins | local damages in building structures | ruined buildings basement erosion |
| Roads | none | temporary cuts | local road damages | damaged dikes, roads or bridges |
| Geomorphic | minor bank damages | local breaches in banks and dikes | local bed transformations | generalized change of morphology |
| Rivers RTM | 1 | 2 | 3 | |
| Physical parameters | ||||
| Submersion level (m) | <0.50 | 0.50 to 1–2 | >1–2 | |
| Submersion duration (d) | 1 | few | week | |
| Impacts | ||||
| Buildings | damages in | damages in first basements | ruined buildings floors | |
| Roads | temporary cuts | local road damages | damaged dikes, roads or bridges | |
| Natural and agricultural space | limited impact | noticeable impact | consequential damages | |
| Rivers “Historisque” | Ordinary rise or small flood—Cl. 1 | Extraordinary or intermediate flood—Cl. 2 | Catastrophic flooding or large flood—Cl. 3 | |
| Physical parameters | ||||
| Submersion extension | No river channel overflowing except restricted areas | River channel overflowing—Water in streets or sectors | Overflowing of zones away from channels—Destructive effects | |
| Morphology | Overflows depend on bed obstruction and state of dikes | Very large flood perimeter and heavy sediment transport | Large morphological changes to the river (meander captures) | |
| Impacts | ||||
| Linear damage extension | Micro damages (in decameters) | Meso damages (in hectometers) | Macro damages (in kilometers) | |
| Roads, bridges, crops | No serious damage or destruction | Destabilized bridges | Destroyed bridges and sections of roadways, lost crops | |
| Hydraulic infrastructures | Minor damage to hydraulic installations (mills, irrigation channels) | Severe damage to hydraulic installations or partial destruction | Severe damage or complete destruction of infrastructures close to the river |
Table 3.
Number of flood events that occurred on the 139 torrential sites of the Metropolitan area over three different periods of time (first sets of rows) and for five flood intensity levels (columns—“Unknown” means that the intensity is not qualified). The shares represent the percentage of qualified events for each intensity (1- to 4-) and the percentage of not qualified events (Unknown). The rates represent the number of events per year over the period or slope of the cumulative curve. Separate counts are given for the events dated to the day and for the different intensities. The last set of rows gives the ratios of shares and rates between the two periods.
| 1850–2019 | 1-Very-Weak | 2-Weak | 3-Medium | 4-High | Unknown | Total |
|---|---|---|---|---|---|---|
| Number of events | 92 | 133 | 36 | 1 | 20 | 282 |
| Share | 35% | 51% | 14% | 0% | 7% | |
| Rate | 0.54 | 0.78 | 0.21 | 0.01 | 0.12 | 1.66 |
| 1850–1979 | ||||||
| Number of events | 22 | 64 | 21 | 1 | 13 | 121 |
| Share | 8% | 24% | 8% | 0% | 5% | |
| Rate | 0.17 | 0.49 | 0.16 | 0.01 | 0.10 | 0.93 |
| 1980–2019 | ||||||
| Number of events | 70 | 69 | 15 | 0 | 7 | 161 |
| Share | 27% | 26% | 6% | 0% | 2% | |
| Rate | 1.75 | 1.73 | 0.38 | 0.18 | 4.03 | |
| Jump between periods | ||||||
| Share jump | 3.2 | 1.1 | 0.7 | 0.0 | 0.5 | |
| Rate jump | 10.3 | 3.5 | 2.3 | 1.8 | 4.3 |
Table 4.
Summary description of the content of the Metropolitan database.
| Quantitative information |
|---|
| Date of the event |
| Duration |
| Type coding (torrential, riverine, multi-scales) |
| Source coding (RTM, complementary) |
| Number of torrential sites |
| Number of riverine sites |
| RTM Intensity at sites |
| Coeur 2008’s Intensity |
| River outflows |
| Name of sites |
| List of municipalities with damages |
| Qualitative information—summary narrative |
| Description of the phenomenon |
| Description of the damages |
Table 5.
The number of flood events over different periods of time (columns) and through different steps of selection (rows) to constitute the Metropolitan flood database. The five main sets of rows are (i) counts of RTM site events, (ii) number of RTM site events dated to the day, (iii) number of RTM site events selected according to a minimum intensity, (iv) counts of flood events aggregated from complementary sources such as the “Historisque” dataset, and (v) counts of Metropolitan flood events. For the RTM database (four first sets), we indicate the percentage of events discarded from one processing step to the next on the RTM database. For Metropolitan events (last set), the given percentages are the ratios between the number of site events and the number of Metropolitan events, taking multiscale events, torrential, and riverine, into account.
| 1850–2019 | 1850–1979 | 1980–2019 | ||||
|---|---|---|---|---|---|---|
| RTM database | 323 | 161 | 162 | |||
| Torrential | 282 | 121 | 161 | |||
| Riverine | 41 | 40 | 1 | |||
| Dated to the day | 229 | 98 | 131 | |||
| Torrential | 193 | 32% | 62 | 49% | 131 | 19% |
| Riverine | 36 | 12% | 36 | 10% | 0 | 100% |
| Intensity selection | 219 | 106 | 113 | |||
| Torrential | 173 | 10% | 61 | 2% | 112 | 15% |
| Riverine | 37 | −3% | 36 | 0% | 0 | |
| With complementary sources | 299 | 169 | 130 | |||
| Torrential | 201 | −16% | 82 | −34% | 119 | −6% |
| Riverine | 98 | −165% | 88 | −144% | 10 | |
| Metropolitan flood events | 104 | 65% | 62 | 63% | 42 | 68% |
| Torrential | 53 | 65% | 21 | 56% | 32 | 71% |
| Riverine | 34 | 48% | 26 | 53% | 8 | 0% |
| Multiscale (torrent-river) | 17 | 15 | 2 |
Publisher’s Note: MDPI stays neutral with regard to jurisdictional claims in published maps and institutional affiliations. |
© 2022 by the authors. Licensee MDPI, Basel, Switzerland. This article is an open access article distributed under the terms and conditions of the Creative Commons Attribution (CC BY) license (https://creativecommons.org/licenses/by/4.0/).
Share and Cite
MDPI and ACS Style
Creutin, J.-D.; Blanchet, J.; Reverdy, A.; Brochet, A.; Lutoff, C.; Robert, Y. Reported Occurrence of Multiscale Flooding in an Alpine Conurbation over the Long Run (1850–2019). Water 2022, 14, 548. https://doi.org/10.3390/w14040548
AMA Style
Creutin J-D, Blanchet J, Reverdy A, Brochet A, Lutoff C, Robert Y. Reported Occurrence of Multiscale Flooding in an Alpine Conurbation over the Long Run (1850–2019). Water. 2022; 14(4):548. https://doi.org/10.3390/w14040548
Chicago/Turabian StyleCreutin, Jean-Dominique, Juliette Blanchet, Alix Reverdy, Antoine Brochet, Céline Lutoff, and Yannick Robert. 2022. "Reported Occurrence of Multiscale Flooding in an Alpine Conurbation over the Long Run (1850–2019)" Water 14, no. 4: 548. https://doi.org/10.3390/w14040548
Note that from the first issue of 2016, this journal uses article numbers instead of page numbers. See further details here.