
Nitrogen Transport/Deposition from Paddy Ecosystem and Potential Pollution Risk Period in Southwest China
by
 , ,
, ,
Shufang Guo
1,2,†, 
Tiezhu Yan
1,†,
Limei Zhai
1,*,
Haw Yen
3,
Jian Liu
4,
Wenchao Li
1 and
Hongbin Liu
1 1
Key Laboratory of Nonpoint Source Pollution Control, Ministry of Agriculture and Rural Affairs/Institute of Agricultural Resources and Regional Planning, Chinese Academy of Agricultural Sciences, Beijing 100081, China
2
Institute of Agricultural Environment and Resources, Yunnan Academy of Agricultural Sciences, Kunming 650201, China
3
Blackland Research and Extension Center, Texas A&M Agrilife Research, Texas A&M University, Temple, TX 76502, USA
4
School of Environment and Sustainability, Global Institute for Water Security, University of Saskatchewan, Saskatoon, SK S7N 0X4, Canada
*
Author to whom correspondence should be addressed.
†
These authors contributed equally to this work.
Water 2022, 14(4), 539; https://doi.org/10.3390/w14040539
Submission received: 28 December 2021
/
Revised: 4 February 2022
/
Accepted: 8 February 2022
/
Published: 11 February 2022
(This article belongs to the Special Issue Point-Source and Diffuse Water Pollution)
Abstract
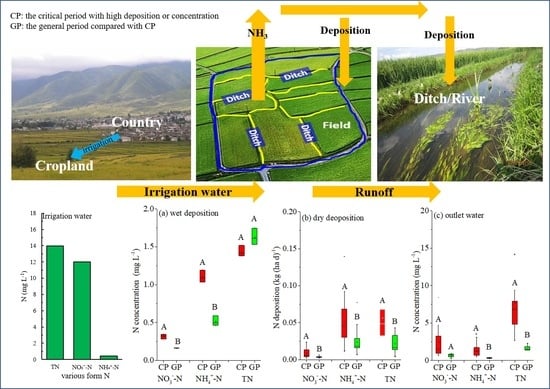
:Nitrogen (N) losses through runoff from cropland and atmospheric deposition contributed by agricultural NH3 volatilization are important contributors to lake eutrophication and receive wide attention. Studies on the N runoff and atmospheric N deposition from the paddy ecosystem and how the agriculture-derived N deposition was related to NH3 volatilization were conducted in the paddy ecosystem in the Erhai Lake Watershed in southwest China. The critical period (CP) with a relatively high total N (TN) and NH4+-N deposition occurred in the fertilization period and continued one week after the completion of fertilizer application, and the CP period for N loss through surface runoff was one week longer than that for deposition. Especially, the mean depositions of NH4+-N in the CP period were substantially higher than those in the subsequent period (p < 0.01). Moreover, agriculture-derived NH4+ contributed more than 54% of the total NH4+-N deposition in the CP period, being positively related to NH3 volatilization from cropland soil (p < 0.05). The N concentrations were higher in the outlet water of ditches and runoff in May than in other months due to fertilization and irrigation. Therefore, to reduce the agricultural N losses and improve lake water quality, it is important to both reduce agricultural NH4+-N deposition from NH3 volatilization and intercept water flow from the paddy fields into drainage ditches during the CP.
1. Introduction
Eutrophication of lakes and reservoirs resulting from an excess input of nitrogen (N) was recognized as an important water environmental problem worldwide [1,2,3,4]. Especially, the eutrophication of inland freshwater lakes threatens the ecological functions of lakes, freshwater supply and flood mitigation [5]. A total of 54%, 53%, 46% and 28% of lakes in Asia, Europe, North America and Africa face eutrophication problems, respectively, according to statistics from the Water Research Commission, South Africa [6]. In China, approximately one third of all lakes are freshwater ones, but currently, most freshwater lakes are in mesotrophic or eutrophic condition [7]. A large N load delivered to watersheds was one of the primary causes for the frequent occurrence of algae blooming in lakes [5]. Agriculture was estimated to be the source of 57% of the N entering water bodies in China and 37–82% of N losses into surface waters in western Europe [8,9]. Therefore, agriculture activities and the associated N losses impose serious potential “downstream” pressure on aquatic environments [10,11].
Nitrogen outputs from cropland vary because of agricultural activities (e.g., seasonal fertilization) [12,13,14,15]. Previous studies showed that N losses in rice systems mainly occurred via leaching, gaseous losses and surface water runoff [16,17]. NH3 is the primary form of reactive N from cropland [18,19]. NH3 volatilization from paddy fields accounted for 17.7% (14.4–21.0%) of the N applied, primarily found within two weeks following each fertilization event [20]. For example, NH3 concentrations increased sharply and reached peak values after N fertilizer application in both the North China Plain and in the double rice region of subtropical China [21,22]. Additionally, NH3 was a critical contributor to N deposition in high NH3 emission areas through dry and wet deposition [23]. Large NH3 emission sources contributed to high N loads in nearby ecosystems through dry deposition [24,25]. The NH4+-N and TN in wet deposition in a rice agroecosystem were both significantly positively related to NH3 volatilization from paddy fields primarily because of fertilization [26]. Moreover, the use of N fertilizer was positively related to wet N deposition in China [27,28]. While studies of ecological effects of increased N deposition on the eutrophication of lakes could be found in literature [29,30], there were few studies that distinguish the N deposition derived from cropland (Refs.) [31,32]. Previous studies showed that the contribution of atmospheric N deposition reached approximately 16% of N input in the Taihu (eastern China) and Dianchi lakes (southwest China) [33,34]. However, those N depositions were influenced by multiple sources. Therefore, a quantitative evaluation of N deposition derived from cropland and a determination of the critical period of N deposition are useful to develop efficient strategies for alleviating the current condition of eutrophication in lakes.
Agricultural runoff was recognized as an important driver of water quality degradation in southwest China [35]. Lakes in southwest China, such as the Yunnan Plateau lakes, were in a typical initial stage of eutrophication, and they had also received more attention in socioeconomic development [36,37,38,39]. More than 78% of cropland in the Yunnan Plateau area was rice paddy fields [36]. Tang et al. [40] reported that the N load from farmland is one of the primary influencing factors of eutrophication, primarily from paddy land in the northern watershed of Erhai Lake. N losses via hydrological processes from agricultural land increased with an increase in N fertilizer application rates [41]. Moreover, N concentration in runoff increased considerably when runoff occurred immediately after fertilization [42,43] and thus had direct and great effects on water pollution [15]. However, there was no quantitative evaluation on the duration period of high N concentration in runoff in regional levels in the literature.
The rice growing season is from May to October (which is also the wet season), whereas precipitation and runoff were the two primary drivers for the N transfer to lakes. The primary goal of this study was to test the hypothesis that the contribution of cropland to N losses by runoff and deposition were different in time. Specifically, three objectives were defined: (1) understand the temporal change of N losses in runoff and N deposition after agricultural activities; (2) identify the high load period of N output via runoff and N deposition in an agricultural region; (3) explore the relationship between NH3 emissions and N deposition in agricultural ecosystems and the contribution of farmland to N deposition.
2. Materials and Methods
2.1. Site Description
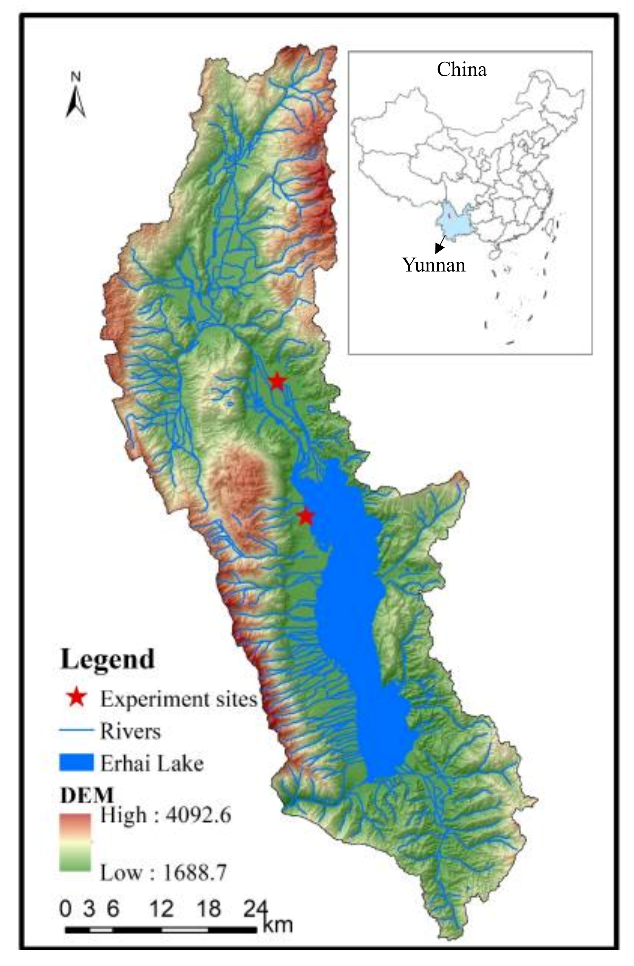
Erhai Lake is the second largest plateau freshwater lake in a typical agriculture-dominated watershed in the Yunnan Plateau area, which is in the Mesotrophic status [1]. The percentage of agricultural areas, water bodies (river/lakes) and forest/grass areas are 13.6%, 9.81% and 62.5%, respectively. The main experiment site (100°03′58″ E, 26°02′43″ N, 1934 m a.s.l.) is located in Eryuan county on the northern side of Erhai Lake, Yunnan province, China (Figure 1). A total of 60% of the water in Erhai Lake comes from inflows at the northern tip where the paddy-upland rotation fields are distributed on more than 224 × 104 ha, contributing approximately 26.6% of cropland. The study region covered more than 100 ha with a typical paddy-upland rotation. The Yong’an River crosses the downstream of this region, which is one of the primary three rivers flowing to Erhai Lake. The surface runoff water and responding rainfall in paddy-upland rotation were collected in Dali city (100°07′10″ E, 25°53′44.7″ N, 1968 m a.s.l.) to the west of Erhai Lake. In the southwest monsoon climate zone, the study areas were on a typical low latitude plateau. The annual mean temperature is 15.3 °C, and the mean annual precipitation is 1048 mm. Approximately 85–96% of the precipitation is distributed in the rainy season from May to October [44].
The dominant source of nitrogen is agriculture in the catchment [45]. Rice seedlings were transplanted between late May and early June in southwest China, and the transplanting date ranged from 15 May to 22 May in 2017. Most fields were transplanted immediately followed by basal fertilization, with fewer fields fertilized approximately seven days after rice transplanting as top dressing or not fertilized. Urea or compound fertilizer mixed with urea (2:1) (60–200 kg N ha−1) as the basal or top dressing fertilizer was used to fertilize the paddy fields from 15 May to 25 May. The cattle manure was applied by 1.5 t ha−1; urea (46% N) and calcium superphosphate (12% P2O5) were applied before rice transplanting, and potassium sulphate (50% K2O) was applied in the jointing stage. The cattle manure had a water content of 75%, N of 1.9%, P2O5 of 1.22% and K2O of 1.22%. Irrigation water was from a wetland in the upstream that flowed through a channel to the village and then to the cropland. The concentrations of TN, NO3--N and NH4+-N in the irrigation water were 14.0 mg L−1, 12.0 mg L−1 and 0.42 mg L−1, respectively. The inflow and outflow of the field always occurred simultaneously, so continuous irrigation water flooded the fields, with the fields full and water overflowing into ditches continuously.
2.2. Measurement of N Deposition
Natural rainwater was collected manually immediately after precipitation events using a rain gauge cleaned by distilled water beforehand. The sealed lids of buckets were opened only when the rainfall happened. When the rainfall continued, daily samples (9:00 a.m. to 9:00 a.m. the next day) were collected and stored in clean polyethylene bottles. Some precipitation samples were discarded from the final analysis because of low volumes (<10 mL) that did not permit a complete chemical analysis. The collected rain samples were frozen at −20 °C until analysis. The plastic buckets were cleaned with deionized water after each collection. The three sampling buckets were installed at the height of 1 m above the field surface in the center of this agricultural region. The concentrations of NH4+-N, NO3−-N and TN and rainfall depth were determined.
Simulated rainfalls were conducted on sunny days to obtain wet deposition and thus discuss the relationship between N deposition and NH3 emission from soil after fertilization. Simulated rainfall events were performed from 8 May to 30 June in the center of the rice ecosystem region to mitigate the influences of transportation and human activities. A rainfall simulator (QYJY-501, Qingyuan Measurement Technology, Co., Ltd., Xi’an, China) was fixed in the paddy field to achieve a consistent rate of uniform rainfall. The rainfall intensities could be controlled by water pressures and nozzle sizes through the computer system. The rainfall nozzles were positioned 4 m aboveground and covered 25 m2. Four groups of nozzles produced a rainfall with uniformity greater than 80%. The diameter of the simulated raindrops ranged from 0.37 mm to 6.0 mm, which was similar to natural raindrop in distribution and size [46].
Three collectors were placed under the covered region of the simulated system on a stand to avoid the interference of soil and rice plants but at a low height above the paddy water to flush NH3 close to the ground. The simulated rainfall continued 20 min from 9:30 a.m. to 9:50 a.m. daily with uniform rainfall intensity except the natural rainfall days. When rainfall simulations were finished, water in collectors was collected into bottles to determine the concentrations of total N (TN), NO3−-N and NH4+-N.
The TN concentrations of water samples were determined before being filtered. Concentrations of TN were determined by alkaline potassium persulfate oxidation centrifugation and UV spectrophotometry [47]. Water samplings after being filtered through a 0.45 μm membrane were automatically pumped into an AA3 Autoanalyzer (Bran + Luebbe, Norderstedt, Germany) for determination of NO3−-N and NH4+-N concentrations by flow injection analysis technology [48].
Dry deposition of water-soluble gaseous or aerosol species and coarse and fine particles was collected using plastic buckets with a depth of 5 cm of distilled water as the surrogate surface [49]. Three plastic buckets were placed near the wet container at the height of 1 m above the field surface. The dry depositions were collected and flushed by distilled water into plastic bottles containing flush water at 9:00 a.m. every day. The samples were analyzed for NH4+-N, NO3−-N and TN concentrations. The dry deposition was calculated as
where C is the concentration of nitrogen (mg L−1), V is the volume of water (L) and A is the area covered by the container (m2).
Dry deposition (kg ha−1 d−1) = C × V/A × 10−5
2.3. Measurement of NH3 Volatilization
The NH3 volatilization flux was measured with a continuous airflow enclosure method using a chamber [44]. The NH3 volatilization collection device consisted of a chamber, a vent pipe, a chemical trap bottle and a vacuum pump, which were linked by plastic pipes to form a limited and confined space. A chemical trap bottle filled with 60 mL of 0.05 mol L−1 H2SO4 was used to absorb the ammonia gas [50]. The air was pumped for 2 h in the morning (from 10:00 a.m. to 12:00 p.m.) and pushed the airflow through the H2SO4 for each treatment. The NH4+-N concentrations were determined for the ammonia absorbents by AA3 Autoanalyzer for NH4+-N determination [48]. We measured NH3 volatilization from two fields fertilized by urea (46% N, 69 kg N ha−1) with compound fertilizer (10% N, 45 kg N ha−1) and compound fertilizer (15% N, 75 kg N ha−1). There were three replicates per treatment. The daily ammonia volatilization flux was calculated from the average of the fluxes measured on each day. The daily measurement was conducted every day from 10 May to 30 May, and then measurements were conducted every 2 days. The ammonia volatilization flux F was calculated as follows:
where F (kg ha−1 d−1) is the ammonia volatilization flux, C (mol L−1) is the NH4+-N concentration of the absorbing liquid, V (mL) is the volume of dilute sulfuric acid as absorption liquid, r (cm) is the semi-diameter of the chamber and t (h) is the sampling time.
F = C × V × 14 × 10−2 × 24/(3.14 × r2 × t)
2.4. Surface Water Monitoring
The paddy field water and ditch water were sampled evenly within the rice growing region. The irrigation water was sampled from channels before they entered the fields during the irrigation period. A sample of paddy field water was composed of five subsamples randomly collected from a field to obtain a composite sample at one sampling point in the study region. The water was sampled daily from 15 May to 31 May, then sampled every two days and later every five days. The runoff water drained from each plot using the runoff pool constructed near the plots in Dali city. The runoff samples were blended and taken after rainfall events. The water was stored in 200 mL polyethylene bottles for analysis of TN, NH4+-N and NO3−-N concentrations.
2.5. Statistical Analyses
The statistical analyses were performed, and graphs were prepared using the SPSS 19.0 statistical software package and Origin 9.0 software. Most of the data are presented as the mean ± SD (standard deviation) in the figures. Regression analyses were performed to evaluate the relationships between N deposition and NH3 emissions. The significance of differences between the two periods was tested by the Kruskal–Wallis test at 95% confidence intervals. Differences were considered statistically significant at p < 0.05.
3. Results
3.1. NH3 Volatilization
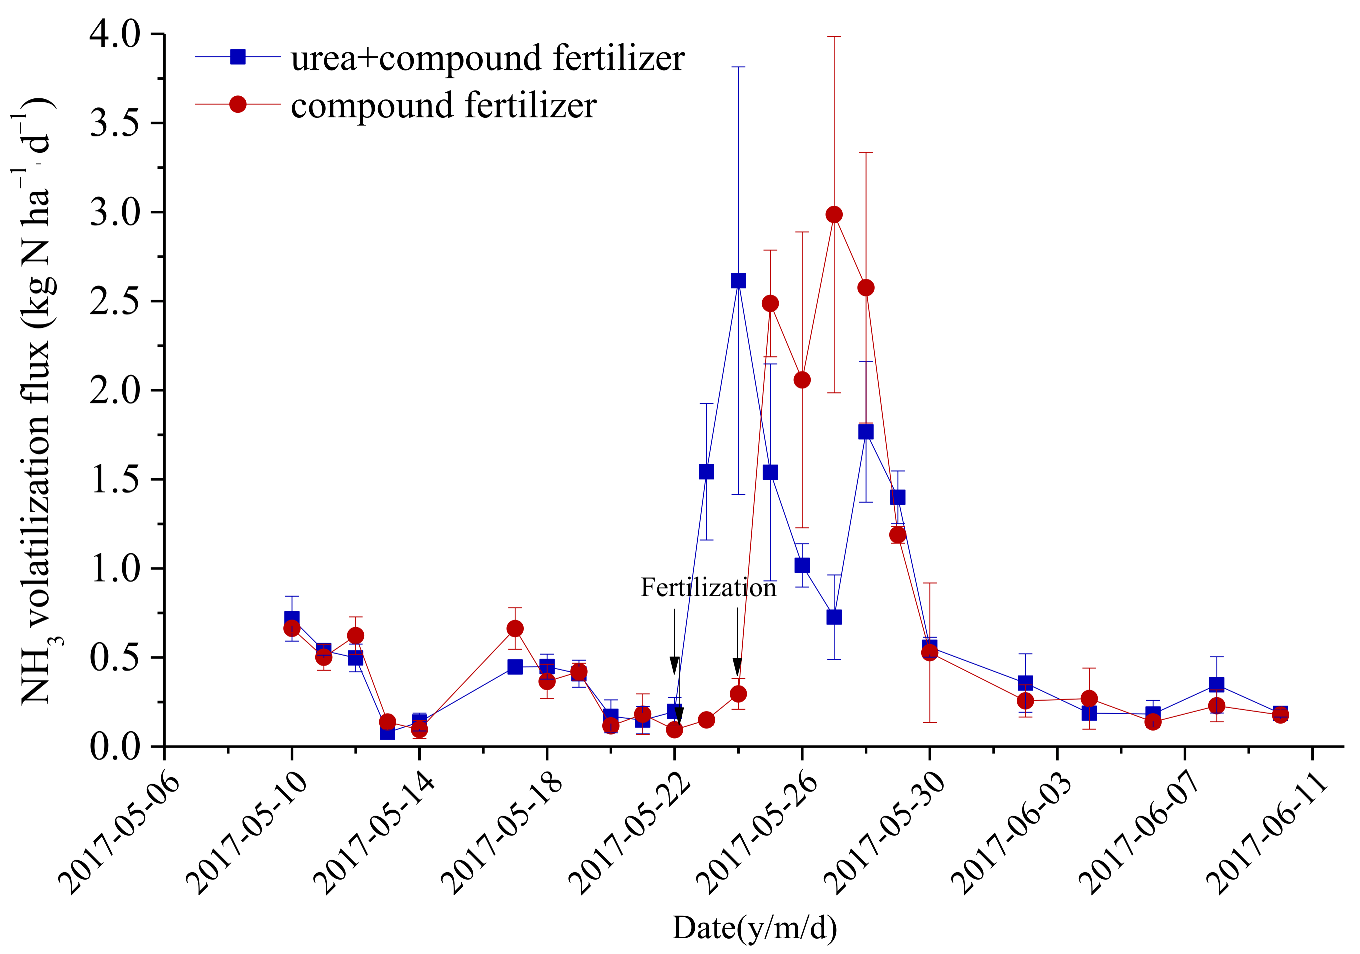
The temporal variations indicated that the NH3 volatilization rate increased and reached the peak value two to four days after fertilization, and then a rapid decrease was observed at seven days after fertilization in the paddy field (Figure 2). The trends of NH3 volatilization from the field fertilized by urea with a compound fertilizer exhibited similar patterns to those in the field fertilized by compound fertilizer, but the peak time appeared earlier. The cumulative NH3 emissions from the fields fertilized by urea mixed with compound fertilizer and compound fertilizer were 16.1 kg N hm−2 and 17.2 kg N hm−2, accounting for 14.2% and 22.9% of N applied, respectively.
3.2. Wet and Dry Deposition of N
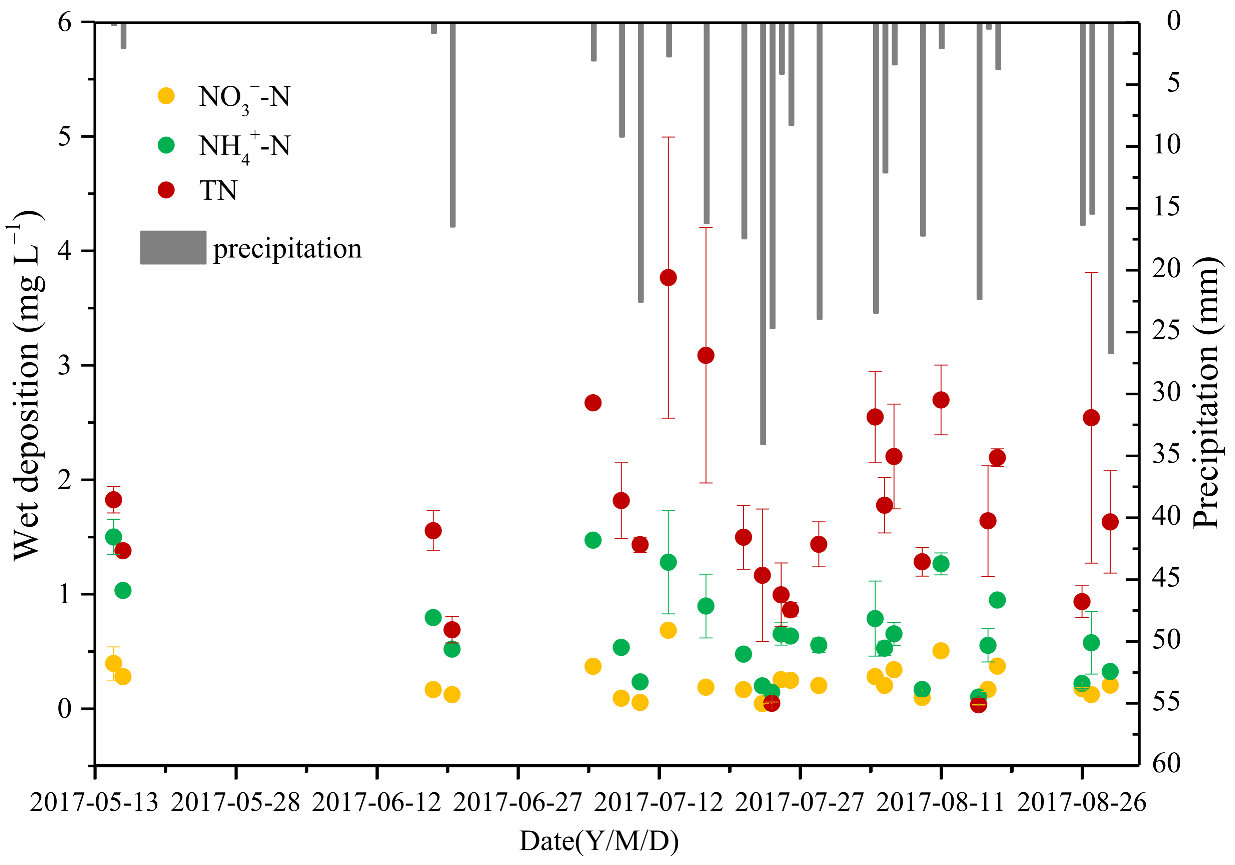
The concentrations of TN and NH4+-N in wet deposition showed large variations with the ranges of 0.14 mg L−1 to 3.77 mg L−1 and 0.10 to 1.50 mg L−1, respectively, while the variation in NO3−-N concentrations was relatively stable (Figure 3). The fertilization period continued from 15 May to 25 May due to dispersed management. The high value of the volume concentration of NH4+-N appeared (averaged 1.07 mg L−1) when the fertilization occurred and lasted six days after the completion of fertilizer application (approximately two weeks), which was increased by 153% compared with the average concentration in rainfall occurring in the later period of the rice growing season. The NH4+-N and NO3−-N concentrations were negatively related to rainfall depth (p < 0.01). Because of the high depth and frequent rainfall from July to September, the wet deposition of TN, NH4+-N and NO3−-N was 4.50 kg ha−1, 1.37 kg ha−1 and 0.55 kg ha−1, respectively, which were higher amounts than those in May and June.
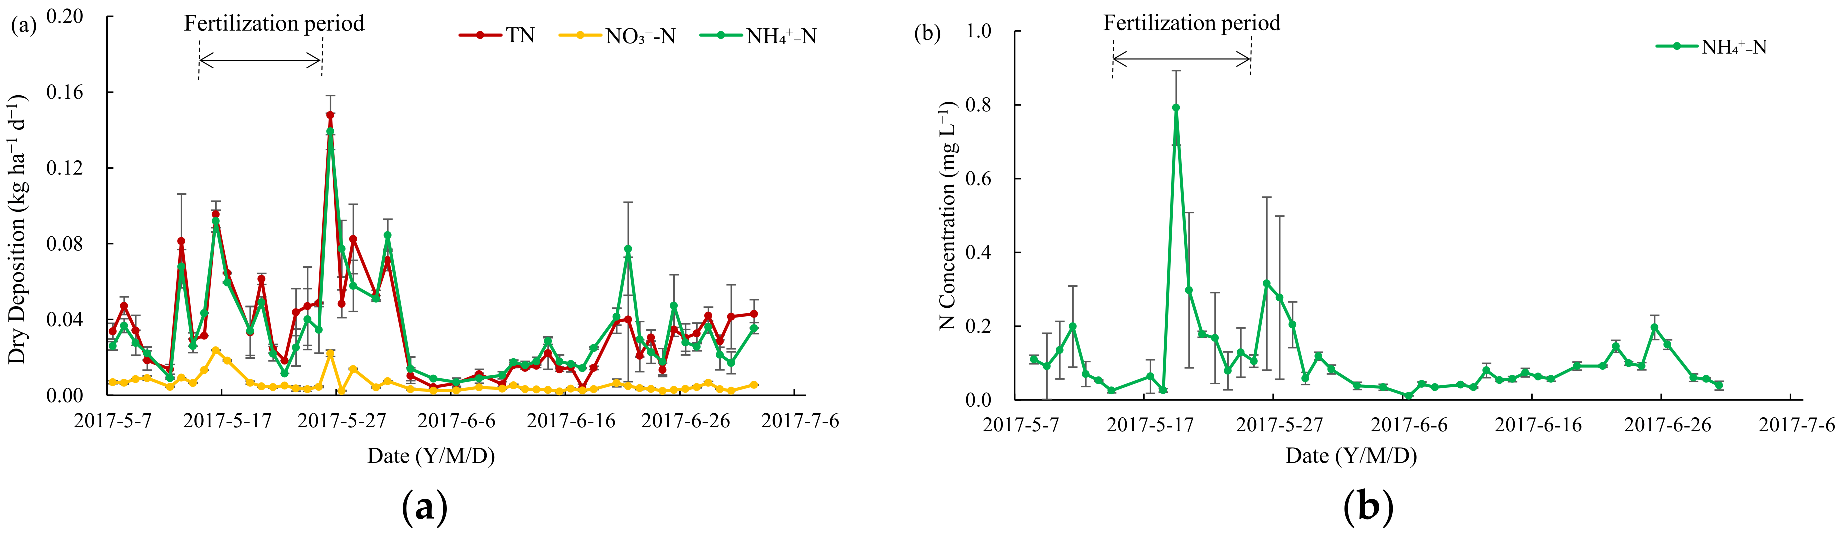
The dry deposition rate of TN, NH4+-N and NO3−-N was 0.004–0.15 kg ha−1 d−1, 0.007–0.14 kg ha−1 d−1 and 0.002–0.02 kg ha−1 d−1, respectively (Figure 4a). The primary form was NH4+-N, contributing more than 57% of TN. TN and NH4+-N depositions increased substantially when the basal fertilizer application occurred, remained one week after the completion of fertilizer application and then declined, while NO3−-N depositions were relatively stable during the experimental period. Moreover, the depositions of different N forms were all significantly positively related to NH3 volatilization from cropland. Concentrations of NH4+-N in simulated rainfall varied from 0.01 mg L−1 to 0.79 mg L−1, and the highest concentration occurred three to four days after the basal fertilization (Figure 4b). The NH4+-N concentrations in simulated rainfall began to decline and remained stable one week after the completion of fertilization.
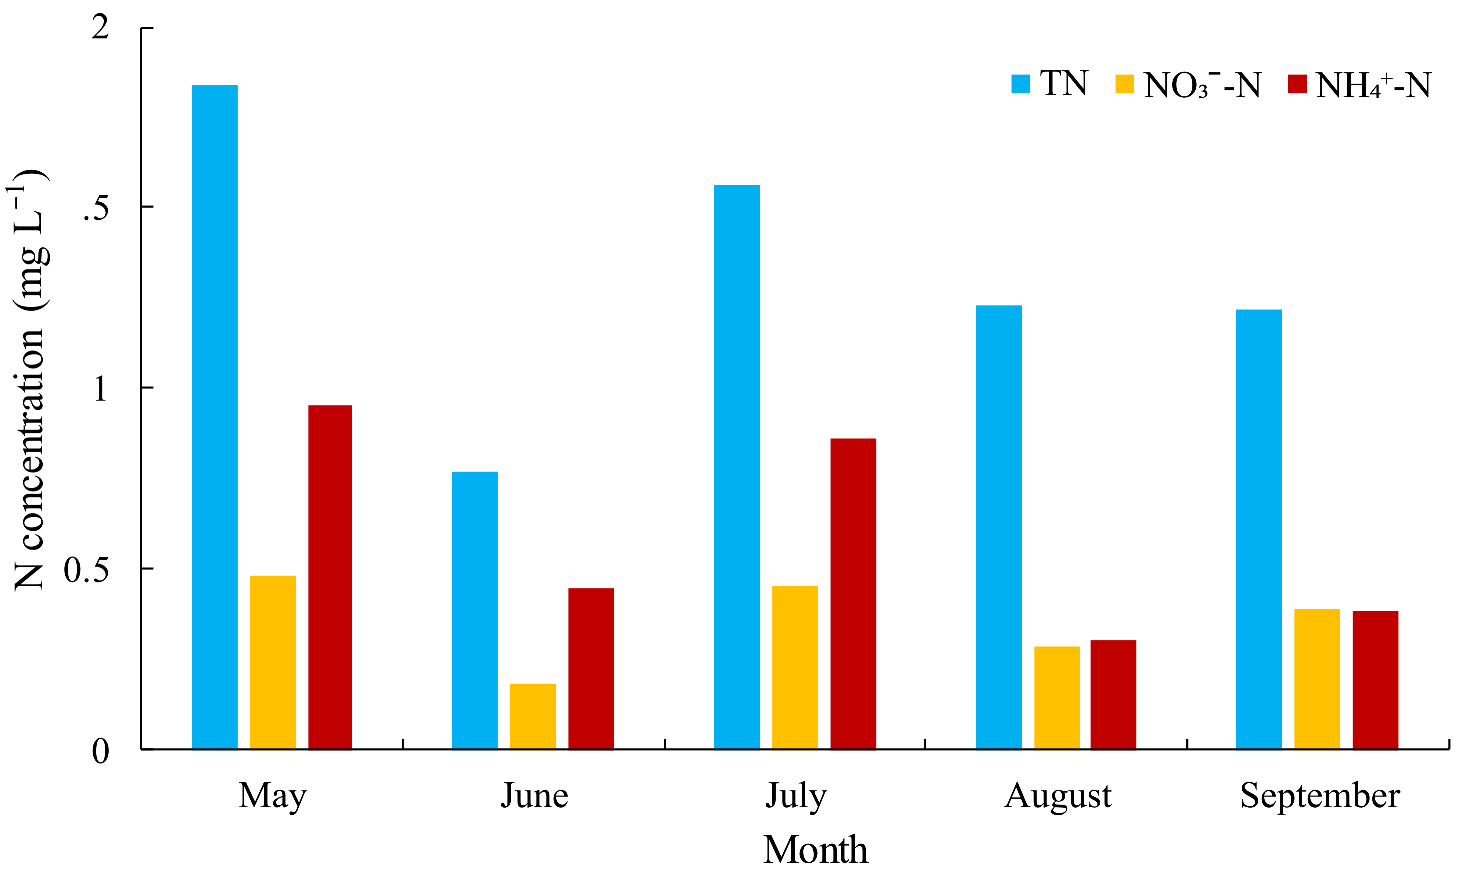
In the western part of Erhai Lake, the concentrations of TN, NO3−-N and NH4+-N in wet deposition showed large variations with the ranges of 0.77–1.84 mg L−1, 0.18–0.48 mg L−1 and 0.30–0.96 mg L−1, respectively (Figure 5). The high value of the volume concentration of NH4+-N appeared (averaged 0.96 mg L−1 and 0.86 mg L−1 in May and July, respectively) when the fertilization occurred, which was increased by 113% and 150% compared with the concentration in next month.
3.3. N Concentrations in Surface Water
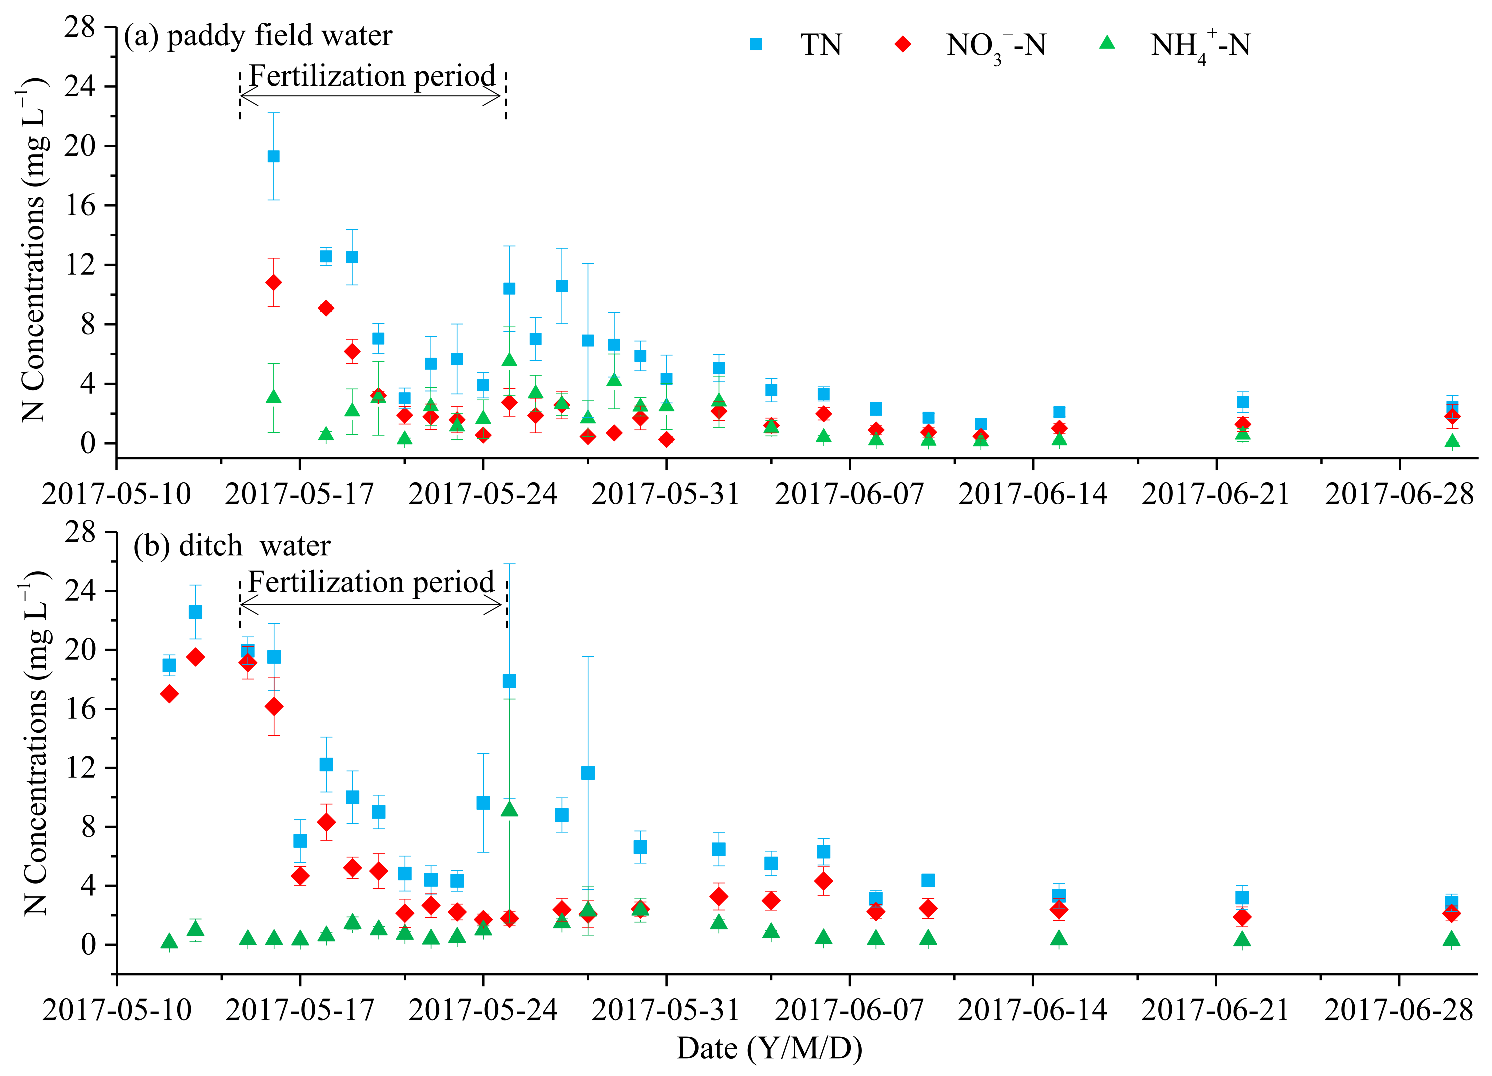
The paddy field water was drained into ditches and then entered a tributary flowing to the lake. Concentrations of TN, NO3−-N and NH4+-N in paddy field water were in the ranges of 1.29–23.6 mg L−1, 0.26–10.82 mg L−1 and 0.06–5.51 mg L−1, respectively (Figure 6a). Concentrations of TN, NO3−-N and NH4+-N were also substantially higher when the basal fertilizer application occurred than concentrations after this period and lasted two weeks after the completion of fertilizer application. The concentrations of TN, NO3−-N and NH4+-N in ditch water were significantly affected by paddy field water (p < 0.01). Concentrations of TN, NO3−-N and NH4+-N in ditch water varied from 2.84 to 22.6 mg L−1, 1.71 to 19.5 mg L−1 and 0.07 to 9.07 mg L−1, respectively (Figure 6b). TN and NO3−-N concentrations in ditch water increased, while NH4+-N concentrations decreased compared with those in paddy field water. The primary N form in paddy field water was NH4+-N during fertilization period until one week after the completion of fertilizer application, and NO3−-N in paddy field water and ditch water contributed 17.8–95.9% of TN in the entire experimental period.
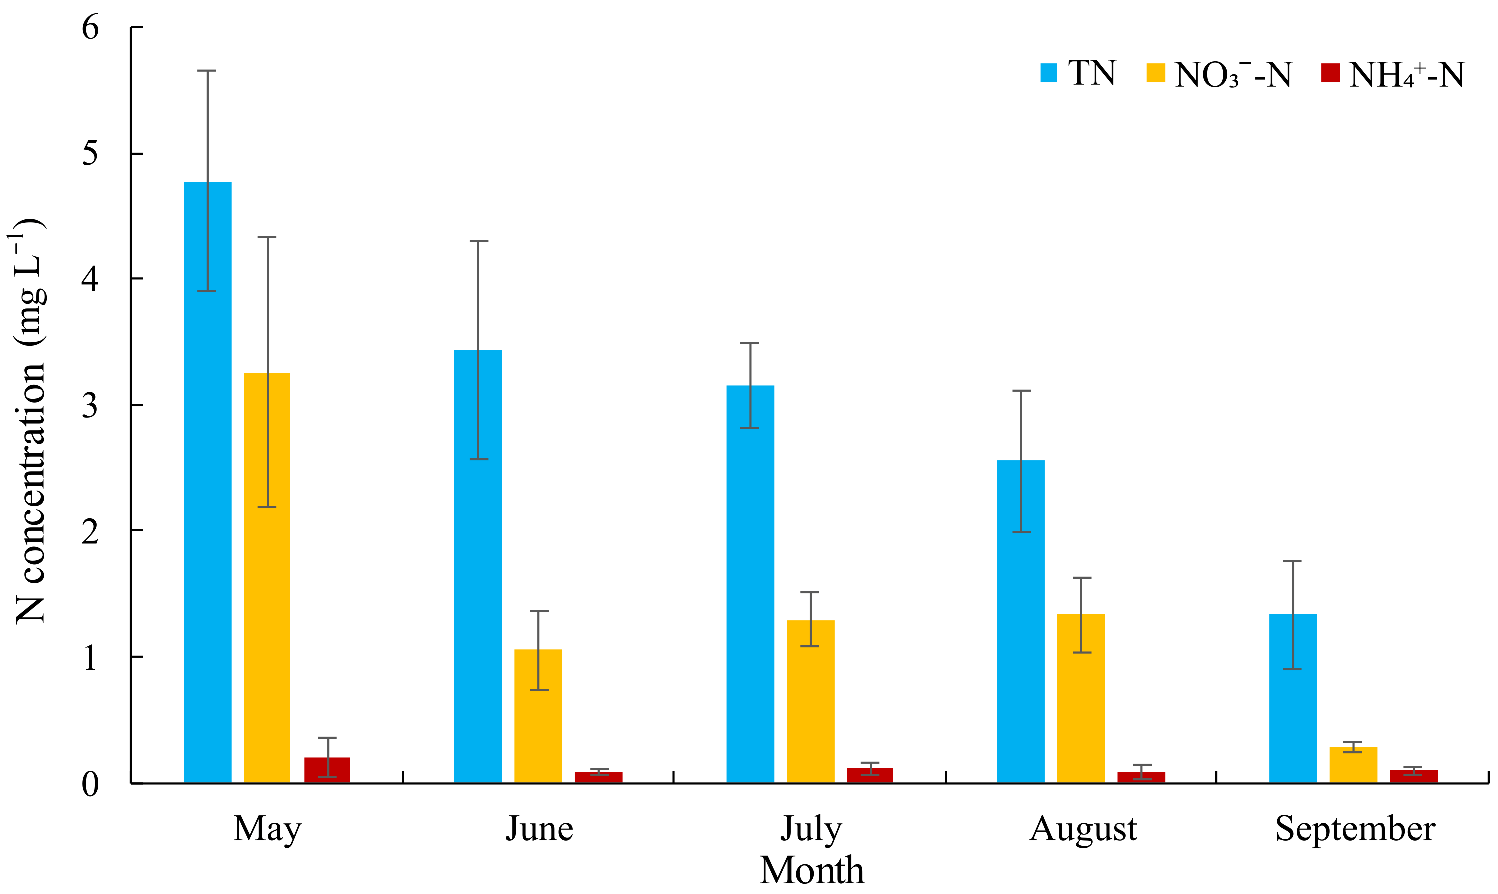
The concentrations of TN, NO3−-N and NH4+-N in runoff water were in the ranges of 2.55–4.78 mg L−1, 1.06–3.26 mg L−1 and 0.83–0.20 mg L−1, respectively (Figure 7). Concentrations of TN, NO3−-N and NH4+-N were higher in May when the N fertilizer application occurred than concentrations from June to September, respectively.
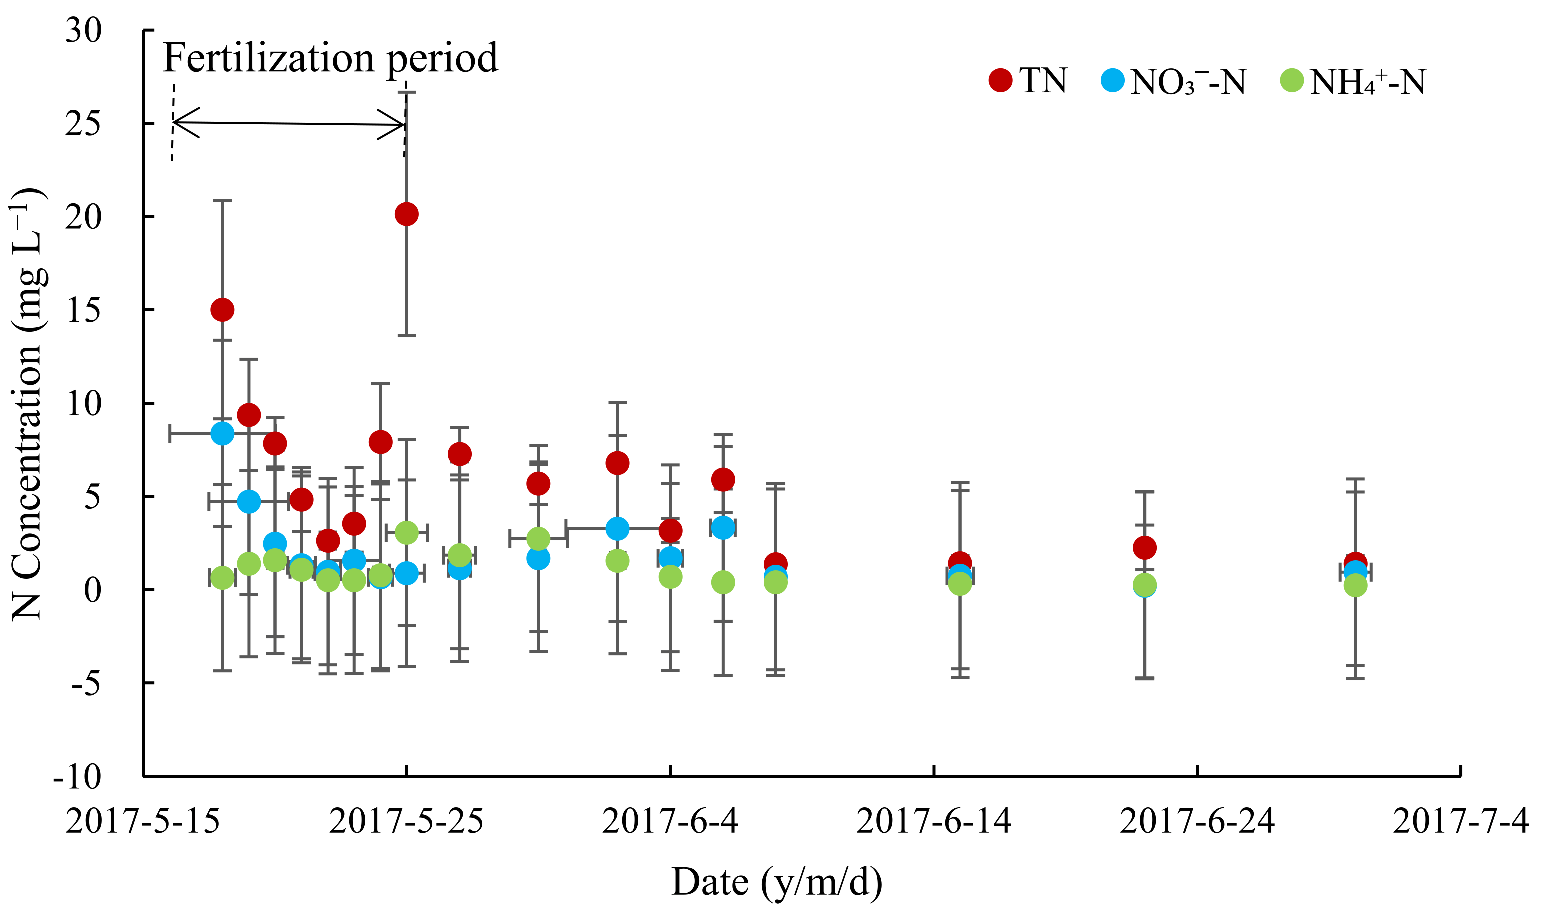
The flow at the ditch outlet was the primary source of N input to the tributary flowing to the lake, influenced directly by ditch water (p < 0.01). TN and NH4+-N concentrations of outlet water ranged from 2.63–20.1 mg L−1 (average 7.71 mg L−1) to 0.50–3.06 mg L−1 (average 1.37 mg L−1) during fertilization period until two weeks after the completion of fertilizer application, respectively, and were higher by 377% and 322% than concentrations after this period, respectively (p < 0.05) (Figure 8). Accordingly, concentrations of TN, NO3−-N and NH4+-N from ditch water to outlet water decreased by 14.5%, 41.3% and 13.6%, respectively.
3.4. Critical Period of Nitrogen Load via Deposition and Runoff
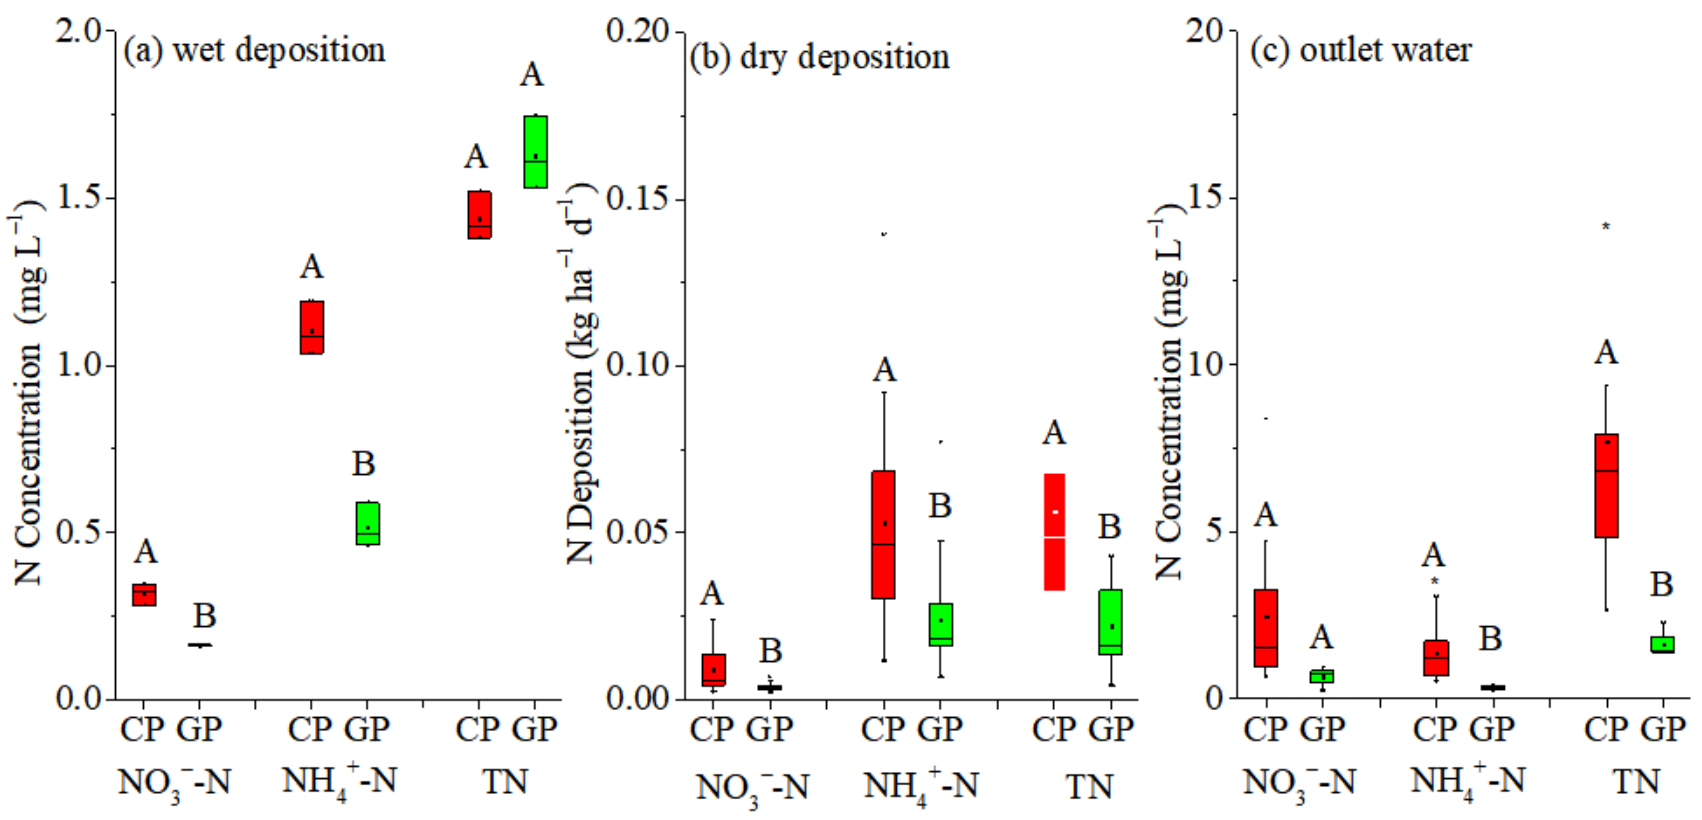
The critical period of higher concentrations or depositions of N (CP period) was during the fertilization period up until one to two weeks after the completion of fertilizer application compared with the other periods (general period, defined as the GP period). Based on the division of periods, the average volume-weighted concentrations of NO3−-N and NH4+-N in the CP period were 0.29 mg L−1 and 1.07 mg L−1, respectively, which were 95.9% and 114% higher, respectively, than those in wet deposition in the GP period (p < 0.01) (Figure 9a). However, the TN concentration was not different between the two periods. The mean NH4+-N concentration in deposition from cropland accounted for 54.5% of atmospheric NH4+-N deposition in natural rainfall. For dry deposition, the mean depositions of NO3−-N, NH4+-N and TN in the CP period were 0.009 kg ha−1 d−1, 0.055 kg ha−1 d−1 and 0.058 kg ha−1 d−1, respectively, which were 144%, 120% and 155% higher, respectively, than those in the GP period (p < 0.01) (Figure 9b). The cropland contributed approximately 53.4% of dry deposition of NH4+-N. The higher period of TN and NH4+-N concentrations in outlet water was prolonged one week compared with that for deposition. The average NO3−-N concentration in outlet water in the CP period was 52.8% higher than that in the GP period (Figure 9c).
3.5. Relationship between N Deposition and NH3 Volatilization
The dry depositions of TN, NH4+-N and NO3--N in the rice ecosystem were positively related to NH3 volatilization rates from cropland (Figure 10a) (p < 0.05). The wet depositions of TN and NH4+-N were positively related to NH3 volatilization rates, but only TN depositions had a significant relationship to NH3 volatilization rates (Figure 10b) (p < 0.05).
4. Discussion
4.1. Relationship between NH3 Volatilization and N Deposition
Positive correlations were found between the depositions of TN and NH4+-N and NH3 volatilization from cropland (Figure 10a,b). These correlations are consistent with those of a previous study across all land use types in China conducted by Xu et al. [51], who reported that positive correlations were also found between NH3 emissions and NHx deposition fluxes across 43 monitoring sites. It has been reported that about 90% of all atmospheric NH3 is from a local source, and the ambient NH3 concentration is the most useful parameter for evaluating changes in NH3 emission [52]. Agriculture activities are the largest sources of NH3 emissions because of animal husbandry and NH3-based fertilizer applications [53,54]. Previous studies showed that sites within major agricultural regions have experienced larger increases in NH4+ concentrations than those of urban-affected sites [55,56]. Therefore, high-intensity NH3 emissions in farmland regions lead to a higher concentration of NH3 in the atmosphere than in other regions [57,58,59,60]. For example, NH3 concentrations increased sharply after N fertilizer application related to NH3 volatilization in both the North China Plain and a double rice region in subtropical China [21,22,61,62]. Because of the short atmospheric lifetime and high dry deposition velocity, NH3 typically deposited near the emission source, and NH3 concentrations generally decay exponentially some distance away from a source because of dispersion and dilution [63]. For example, Xu et al. [64] showed that the concentration of NH3 decreased by 64% at a 640 m distance from its source, while Asman et al. [65] found a 70% reduction at a 4 km distance from the source. In agroecosystems, variations in monthly NH4+-N concentrations are much greater than those for NO3−-N, primarily related to NH3 and NOx emissions and precipitation [14].
4.2. Critical Period of Nitrogen Deposition and Runoff
The paddy fields affected both wet and dry deposition by NH4+-N primarily (Figure 3, Figure 4 and Figure 5). This result is consistent with the findings by Cui et al. [14] who showed that NH4+-N contributed 68% of wet inorganic N deposition in southeast China. NH4+-N originated from agricultural emissions using δ15N-NHX values [66]. In this study, high NH4+-N depositions were observed in the fertilization period and continued one week after the completion of fertilizer application, while low and stable N depositions occurred after this period (Figure 3 and Figure 4). The NH3 volatilization rate reached a peak one to three days after fertilization and then decreased to a low level from the peak value after seven to ten days in a paddy field [20]. In this study, the fertilization of paddy fields primarily occurred in the first ten days after basal fertilization, and NH3 emissions also declined one week after fertilization (Figure 2) and decreased with the decline of NH4+-N concentrations in field water (p < 0.01). Temporal variations in NH3 emissions due to fertilization led to large temporal variations in NH4+-N depositions. In addition, the duration of fertilization in the ecosystems determined the length of the critical period. Moreover, differences in the N deposition between the two periods were particularly large (Figure 9). Liu et al. [67] showed that N deposition rates in April, June, July and August when farmers apply N fertilizer are often greater than those in other months. N fertilizer use is significantly related to wet N deposition [27,28]. Therefore, the critical period for N deposition was the fertilization period, which continued one week after the completion of fertilizer application in the rice ecosystem.
N concentrations in both paddy field water and ditch water increased in the fertilization period and continued two weeks after the completion of the fertilizer application (Figure 6 and Figure 8). During the rice growing season, runoff water is generated when the volume of rainfall combined with the field ponding water exceed the capacity of field berms to enclose water [68]. The duration between applications of different fertilizer sources and a runoff event can affect the concentrations of nutrients in runoff [69,70]. A portion of the N from watersheds entering river networks, particularly after applying fertilizers, is nutrients that are easily lost to channels. That was consistent with the observations of runoff water (Figure 7). A previous study also showed that TN loss from agricultural land via runoff increased with increasing N fertilizer application rates [41]. However, Tang et al. [71] found that N concentration in the overflow water was very high within approximately a week after fertilization in a paddy field. However, people with less land and decentralized operation in the Erhai Lake Watershed tended to transplant and fertilize rice one after another for approximately ten days, which prolonged the influencing time of agricultural activities on the water quality. Moreover, the attenuation coefficients of the ditch in the paddy ecosystem for TN, NO3−-N and NH4+-N were low due to the short distance (Figure 8). Therefore, the measures in the tributaries and their outlets were needed to reduce the effect of cropland on the surrounding water body and lake.
Precipitation and runoff are the two primary pathways of water supply for Erhai Lake, and so ditches and deposition are the main pathways of N input derived from cropland [72]. A previous study reported that approximately more than 65% of the agricultural nonpoint source N enters the ditch system distributed extensively in a catchment dominated by paddy fields [73]. In addition, the N concentrations of irrigation water were distinctly lower than N concentrations of the outlet of ditch water (Figure 9). Hua et al. [74] also reported on the purification role of rice fields. For the Yunnan Plateau lakes, the paddy ecosystem has a certain purification effect on water with pollution from rural areas. However, from July to September when most of the heavy rainstorms occurred, rainfall runoff was the primary driving force and carrier of the N output and high field N runoff levels, and N enrichment in the drainage water typically occurs synchronously [4,75,76]. Thus, the large amount of irrigation water and fertilizers in May and heavy rainfall from July to September were the primary factors influencing the N concentration of Erhai Lake.
Lakes in southwest China are in the initial stage of eutrophication and primarily affected by agricultural activities, which are different from those of lakes in floodplains (e.g., Taihu Lake and Chaohu Lake) in China [36,77]. Currently, in southwest China, 77.8% of the Yunnan Plateau lakes are eutrophic with high nutrient or low nutrient inputs [36]. Important drivers of lake eutrophication are agricultural runoff and nitrogen deposition [35,78,79]. In southwest China, temperature, light and trophic conditions of lakes from May to September can meet the requirements for the growth of algae or cyanobacteria [80]. For example, clear peaks of T. bourrellyi cell abundance occur in July and August every year, and monthly variations in different forms of N and P concentrations indicate that Erhai Lake can be in a eutrophic state from July to September [81]. Late May and early June is the starting point of the peaks of algae or cyanobacteria growth for lakes in southwest China, which was in accordance with the critical period of N output from cropland by deposition and runoff. Moreover, water that flows from mountains to lakes generally has a relatively fast velocity as the water passes through croplands, leading to nutrients losses. Therefore, controlling N input through runoff and deposition derived from the rice ecosystem was critical in fertilization period and continued one to two weeks after the completion of fertilizer application.
4.3. Suggestions for Agricultural Measures
Based on this study, the recommendation is that the water that flows from paddy fields into drainage ditches should be intercepted/contained while maintaining a paddy field water at a depth of 5 cm to 15 cm. For example, a paddy field can be partially blocked by increasing field berms. Water retention time will increase, and that is beneficial for nutrient reduction [82,83]. Additionally, ecological ditches and improved zeolite-ecological ditches can be used to intercept nutrient-enriched flow pathways between agricultural fields and streams in paddy ecosystems [84]. In this study, N deposition in agricultural regions is strongly dependent on the temporal pattern of NH3 emission within the region (Figure 10a,b). The ways to control N deposition are related to the sources of NH3 emissions. Proper N fertilizer management, including optimal and deep fertilization, is effective to decrease NH3 emission [85] and prevent N deposition from entering into the surrounding water. The large-scale farms may reduce the duration of fertilization because of modern agricultural equipment and thus reduce the time of high N losses [86].
5. Conclusions
In this study, the dynamic N concentration of surface runoff and N deposition derived from rice ecosystem were found frequently in a watershed within a lake system in southwest China. Our findings indicate that for the rice ecosystem, the critical period of N outputs via deposition and runoff derived from cropland was in the fertilization period and continued one to two weeks after the completion of the fertilizer application. Moreover, cropland contributed more than 54% of NH4+-N in deposition in the critical period, being positively related to NH3 emission due to fertilization. Therefore, a decrease in agricultural NH3 volatilization and interception of runoff from paddy fields into drainage ditches in the critical period are needed. The conducted work is beneficial for the overall water quality and conservation practices of lakes and reservoirs in rice growing areas.
Author Contributions
Conceptualization, S.G., L.Z., H.Y. and H.L.; Methodology, S.G. and W.L.; Software, S.G. and T.Y.; Validation, S.G. and L.Z.; Formal analysis, S.G.; Investigation, S.G.; Resources, L.Z. and H.L.; Data Curation, S.G. and T.Y.; Writing—original draft preparation, S.G. and T.Y.; Writing—review and editing, H.Y. and J.L.; Supervision, L.Z. and H.L.; Project Administration, S.G.; Funding acquisition, L.Z. and S.G. All authors have read and agreed to the published version of the manuscript.
Funding
This work was financially supported by the National Natural Science Foundation of China (42067047).
Data Availability Statement
The datasets used and/or analyzed during the current study are available from the corresponding author on reasonable request.
Conflicts of Interest
The authors declare no conflict of interests.
References
- Lin, S.; Shen, S.; Zhou, A.; Lyu, H. Sustainable development and environmental restoration in Lake Erhai, China. J. Clean. Prod. 2020, 258, 120758. [Google Scholar] [CrossRef]
- Chen, Y.Z.; Zhu, J.R. Reducing eutrophication risk of a reservoir by water replacement: A case study of the Qingcaosha reservoir in the Changjiang Estuary. Acta Oceanol. Sin. 2018, 37, 23–29. [Google Scholar] [CrossRef]
- Padedda, B.M.; Sechi, N.; Lai, G.G.; Mariani, M.A.; Pulina, S.; Satta, C.T.; Bazzoni, A.M.; Virdis, T.; Buscarinu, P.; Lugliè, A. A fast-response methodological approach to assessing and managing nutrient loads in eutrophic Mediterranean reservoirs. Ecol. Eng. 2015, 85, 47–55. [Google Scholar] [CrossRef]
- Li, W.C.; Zhai, L.M.; Lei, Q.L.; Wollheim, W.M.; Liu, J.; Liu, H.B.; Hu, W.L.; Ren, T.Z.; Wang, H.Y.; Liu, S. Influences of agricultural land use composition and distribution on nitrogen export from a subtropical watershed in China. Sci. Total Environ. 2018, 642, 21–32. [Google Scholar] [CrossRef]
- Duan, H.T.; Ma, R.H.; Xu, X.F.; Kong, F.X.; Zhang, S.X.; Kong, W.J.; Hao, J.Y.; Shang, L.L. Two-decade reconstruction of algal blooms in China’s Lake Taihu. Environ. Sci. Technol. 2009, 43, 3522–3528. [Google Scholar] [CrossRef]
- Nyenje, P.M.; Foppen, J.W.; Uhlenbrook, S.; Kulabako, R.; Muwanga, A. Eutrophication and nutrient release in urban areas of sub-saharan Africa—A review. Sci. Total Environ. 2010, 408, 447–455. [Google Scholar] [CrossRef]
- Le, C.; Zha, Y.; Li, Y.; Sun, D.; Lu, H.; Yin, B. Eutrophication of lake waters in China: Cost, causes, and control. Environ. Manag. 2010, 45, 662–668. [Google Scholar] [CrossRef]
- Vorosmarty, C.J.; McIntyre, P.B.; Gessner, M.O.; Dudgeon, D.; Prusevich, A.; Green, P.; Glidden, S.; Bunn, S.E.; Sullivan, C.A.; Reidy Liermann, C.; et al. Global threats to human water security and river biodiversity. Nature 2010, 467, 555–561. [Google Scholar] [CrossRef]
- MEP. Bulletin of National Environmental Statistics 2009; Ministry of Environmental Protection: Beijing, China, 2010. [Google Scholar]
- Chien, S.; Prochnow, L.; Cantarella, H. Recent developments of fertilizer production and use to improve nutrient efficiency and minimize environmental impacts. Adv. Agron. 2009, 102, 267–322. [Google Scholar]
- Garnier, M.; Recanatesi, F.; Ripa, M.N.; Leone, A. Agricultural nitrate monitoring in a lake basin in Central Italy: A further step ahead towards an integrated nutrient management aimed at controlling water pollution. Environ. Monit. Assess. 2010, 170, 273–286. [Google Scholar] [CrossRef]
- Yoshikawa, S.; Takahashi, H.; Sasada, Y.; Mochizuki, H. Impact of land use on nitrogen concentration in groundwater and river water. Soil Sci. Plant Nutr. 2015, 61, 898–909. [Google Scholar] [CrossRef] [Green Version]
- Tian, Y.H.; Yin, B.; Yang, L.Z.; Yin, S.X.; Zhu, Z.L. Nitrogen runoff and leaching losses during rice-wheat rotations in Taihu Lake Region, China. Pedosphere 2007, 17, 445–456. [Google Scholar] [CrossRef]
- Cui, J.; Zhou, J.; Peng, Y.; He, Y.Q.; Chan, A. Atmospheric inorganic nitrogen in wet deposition to a red soil farmland in Southeast China, 2005–2009. Plant Soil 2012, 359, 387–395. [Google Scholar] [CrossRef]
- Zhao, X.; Zhou, Y.; Min, J.; Wang, S.Q.; Shi, W.M.; Xing, G.X. Nitrogen runoff dominates water nitrogen pollution from rice-wheat rotation in the Taihu Lake region of China. Agric. Ecosyst. Environ. 2012, 156, 1–11. [Google Scholar] [CrossRef]
- Linquist, B.A.; Ruark, M.D.; Mutters, R.; Greer, C.; Hill, J.E. Nutrients and sediments in surface runoff water from direct-seeded rice fields: Implications for nutrient budgets and water quality. J. Environ. Qual. 2014, 43, 1725–1735. [Google Scholar] [CrossRef]
- Buresh, R.J.; Reddy, K.R.; Kessel, C.V. Nitrogen transformations in submerged soils. In Nitrogen in Agricultural Systems; Schepers, J.S., Raun, W.R., Eds.; American Society of Agronomy: Madison, WI, USA, 2008; pp. 401–436. [Google Scholar]
- Gu, B.J.; Ge, Y.; Ren, Y.; Xu, B.; Luo, W.D.; Jiang, H.; Gu, B.H.; Chang, J. Atmospheric reactive nitrogen in China: Sources, recent trends, and damage costs. Environ. Sci. Technol. 2012, 46, 9420–9427. [Google Scholar] [CrossRef]
- Gu, B.J.; Ju, X.T.; Chang, J.; Ge, Y.; Vitousek, P.M. Integrated reactive nitrogen budgets and future trends in China. Proc. Natl. Acad. Sci. USA 2015, 112, 8792–8797. [Google Scholar] [CrossRef] [Green Version]
- Wang, H.Y.; Zhang, D.; Zhang, Y.T.; Zhai, L.M.; Yin, B.; Zhou, F.; Geng, Y.C.; Pan, J.T.; Luo, J.F.; Gu, B.J.; et al. Ammonia emissions from paddy fields are underestimated in China. Environ. Pollut. 2018, 235, 482–488. [Google Scholar] [CrossRef]
- Shen, J.L.; Liu, X.J.; Zhang, Y.; Fangmeier, A.; Goulding, K.; Zhang, F.S. Atmospheric ammonia and particulate ammonium from agricultural sources in the North China Plain. Atmos. Environ. 2011, 45, 5033–5041. [Google Scholar] [CrossRef] [Green Version]
- Wang, J.F.; Zhu, X.; Shen, J.L.; Zeng, G.J.; Wang, J.; Wu, J.S.; Li, Y. Atmospheric ammonia/ammonium-nitrogen concentrations and wet and dry deposition rates in a double rice region in subtropical China. Environ. Sci. 2017, 38, 2264–2272. [Google Scholar]
- Zhang, L.; Vet, R.; O’Brien, J.M.; Mihele, C.; Liang, Z.; Wiebe, A. Dry deposition of individual nitrogen species at eight Canadian rural sites. J. Geophys. Res. 2009, 114, D02301. [Google Scholar] [CrossRef] [Green Version]
- Flechard, C.R.; Nemitz, E.; Smith, R.I.; Fowler, D.; Vermeulen, A.T.; Bleeker, A.; Erisman, J.W.; Simpson, D.; Zhang, L.; Tang, Y.S.; et al. Dry deposition of reactive nitrogen to European ecosystems: A comparison of inferential models across the NitroEurope network. Atmos. Chem. Phys. 2011, 11, 2703–2728. [Google Scholar] [CrossRef] [Green Version]
- Phillips, S.B.; Arya, S.P.; Aneja, V.P. Ammonia flux and dry deposition velocity from near-surface concentration gradient measurements over a grass surface in North Carolina. Atmos. Environ. 2004, 38, 3469–3480. [Google Scholar] [CrossRef]
- Su, C.G.; Yin, B.; Zhu, Z.L.; Shen, Q.R. Ammonia volatilization loss of nitrogen fertilizer from rice field and wet deposition of atmospheric nitrogen in rice growing season. Chin. J. Appl. Ecol. 2003, 14, 1884–1888. [Google Scholar]
- Zhu, J.X.; He, N.P.; Wang, Q.F.; Yuan, G.F.; Ding, W.; Yu, G.R.; Jia, Y.L. The composition, spatial patterns, and influencing factors of atmospheric wet nitrogen deposition in Chinese terrestrial ecosystems. Sci. Total Environ. 2015, 511, 777–785. [Google Scholar] [CrossRef]
- Jia, Y.L.; Yu, G.R.; He, N.P.; Zhan, X.Y.; Fang, H.J.; Sheng, W.P.; Zuo, Y.; Zhang, D.Y.; Wang, Q.F. Spatial and decadal variations in inorganic nitrogen wet deposition in China induced by human activity. Sci. Rep. 2014, 4, 3763. [Google Scholar] [CrossRef] [Green Version]
- Liang, X.Q.; Chen, Y.X.; Nie, Z.Y.; Ye, Y.S.; Liu, J.; Tian, G.M.; Wang, G.H.; Tuong, T.P. Mitigation of nutrient losses via surface runoff from rice cropping systems with alternate wetting and drying irrigation and site-specific nutrient management practices. Environ. Sci. Pollut. Res. 2013, 20, 6980–6991. [Google Scholar] [CrossRef]
- Darzi-Naftchali, A.; Shahnazari, A.; Karandish, F. Nitrogen loss and its health risk in paddy fields under different drainage managements. Paddy Water Environ. 2017, 15, 145–157. [Google Scholar] [CrossRef]
- Xie, Y.X.; Xiong, Z.Q.; Xing, G.X.; Yan, X.Y.; Shi, S.L.; Sun, G.Q.; Zhu, Z.L. Source of nitrogen in wet deposition to a rice agroecosystem at Tai lake region. Atmos. Environ. 2008, 42, 5182–5192. [Google Scholar] [CrossRef]
- Yu, G.Y.; Yang, C.L.; Liu, K.; Yang, H.Y.; Zhang, J.L. Atmosphere deposition of nitrogen and phosphorus in Lake Yangzonghai, Yun Province. J. Lake Sci. 2017, 29, 1134–1142. [Google Scholar]
- Luo, L.C.; Qin, B.Q.; Yang, L.Y.; Song, Y.Z. Total inputs of phosphorus and nitrogen by wet deposition into Lake Taihu, China. Hydrobiologia 2007, 581, 63–70. [Google Scholar] [CrossRef]
- Zhan, X.Y.; Bo, Y.; Zhou, F.; Liu, X.J.; Paerl, H.W.; Shen, J.L.; Wang, R.; Li, F.R.; Tao, S.; Dong, Y.J.; et al. Evidence for the importance of atmospheric nitrogen deposition to eutrophic lake Dianchi, China. Environ. Sci. Technol. 2017, 51, 6699–6708. [Google Scholar] [CrossRef] [PubMed]
- Li, R.Q.; Dong, M.; Zhao, Y.; Zhang, L.L.; Cui, Q.G.; He, W.M. Assessment of water quality and identification of pollution sources of plateau lakes in Yunnan (China). J. Environ. Qual. 2007, 36, 291–297. [Google Scholar] [CrossRef] [PubMed]
- Liu, W.Z.; Li, S.Y.; Bu, H.M.; Zhang, Q.F.; Liu, G.H. Eutrophication in the Yunnan Plateau lakes: The influence of lake morphology, watershed land use, and socioeconomic factors. Environ. Sci. Pollut. Res. 2012, 19, 858–870. [Google Scholar] [CrossRef]
- Wei, L.; Zhong, J.Y.; Yuan, G.X.; Fu, H.; Fan, H.B.; Ni, L.Y.; Xie, P.; Cao, T. Stoichiometric characteristics of four submersed macrophytes in three plateau lakes with contrasting trophic statuses. Ecol. Eng. 2017, 99, 265–270. [Google Scholar]
- Huang, C.C.; Zhang, L.L.; Li, Y.M.; Lin, C.; Huang, T.; Zhang, M.L.; Zhu, A.X.; Yang, H.; Wang, X.L. Carbon and nitrogen burial in a plateau lake during eutrophication and phytoplankton blooms. Sci. Total Environ. 2008, 616–617, 296–304. [Google Scholar] [CrossRef]
- Wang, X.L.; Yang, H.; Gu, Z.J.; Zhang, M.L.; Yang, B.J. A century of change in sediment accumulation and trophic status in Lake Fuxian, a deep plateau lake of Southwestern China. J. Soil Sediment 2018, 18, 1133–1146. [Google Scholar] [CrossRef]
- Tang, Q.X.; Ren, T.Z.; Lei, B.K.; Zhai, L.M.; Hu, W.L.; Zhang, J.Z.; Lin, T.; Liu, H.B. Characteristics of nitrogen and phosphorus loss in various crop rotation systems in northern watershed of Erhai Lake. Plant Nutr. Fert. Sci. 2011, 17, 608–615. [Google Scholar]
- Eghball, B.; Gilley, J.E.; Baltensperger, D.D.; Blumenthal, J.M. Long-term manure and fertilizer application effects on phosphorus and nitrogen in runoff. Trans. ASAE 2002, 45, 687–694. [Google Scholar] [CrossRef]
- Qiu, W.G.; Tang, H.; Wang, C. Rule of loss of nitrogen in the surface water of rice fields and the control technology. J. Agro-Environ. Sci. 2004, 23, 740–744. [Google Scholar]
- Kim, J.S.; Oh, S.Y.; Oh, K.Y. Nutrient runoff from a Korean rice paddy watershed during multiple storm events in the growing season. J. Hydrol. 2006, 327, 128–139. [Google Scholar] [CrossRef]
- Chen, A.Q.; Lei, B.K.; Hu, W.L.; Lu, Y.; Mao, Y.T.; Duan, Z.Y.; Shi, Z.S. Characteristics of ammonia volatilization on rice grown under different nitrogen application rates and its quantitative predictions in Erhai Lake Watershed, China. Nutr. Cycl. Agroecosys. 2015, 101, 139–152. [Google Scholar] [CrossRef]
- Hu, Y.; Peng, J.; Liu, Y.; Tian, L. Integrating ecosystem services trade-offs with paddy land-to-dry land decisions: A scenario approach in Erhai Lake Basin, southwest China. Sci. Total Environ. 2018, 625, 849–860. [Google Scholar] [CrossRef]
- Li, X.; Xiao, Q.F.; Niu, J.Z.; Dymond, S.; van Doorn, N.S.; Yu, X.X.; Xie, B.Y.; Lv, X.Z.; Zhang, K.B.; Li, J. Process-based rainfall interception by small trees in Northern China: The effect of rainfall traits and crown structure characteristics. Agric. For. Meteorol. 2016, 218–219, 65–73. [Google Scholar] [CrossRef]
- SEBA (State Environmental Protection Administration of China). Standard Methods for Water and Wastewater Monitoring and Analysis, 4th ed.; China Environmental Science Press: Beijing, China, 2002; pp. 254–281. [Google Scholar]
- Xue, L.H.; Yu, Y.L.; Yang, L.Z. Maintaining yields and reducing nitrogen loss in rice-wheat rotation system in Taihu Lake region with proper fertilizer management. Environ. Res. Lett. 2014, 9, 115010. [Google Scholar] [CrossRef]
- Huang, P.; Zhang, J.B.; Zhu, A.N.; Xin, X.L.; Zhang, C.Z.; Ma, D.H. Atmospheric deposition as an important nitrogen load to a typical agroecosystem in the Huang-Huai-Hai Plain. 1. Measurement and preliminary results. Atmos. Environ. 2011, 45, 3400–3405. [Google Scholar] [CrossRef]
- Zhang, T.; Liu, H.B.; Luo, J.F.; Wang, H.Y.; Zhai, L.M.; Geng, Y.C.; Zhang, Y.T.; Li, J.G.; Lei, Q.L.; Bashir, M.A.; et al. Long-term manure application increased greenhouse gas emissions but had no effect on ammonia volatilization in a Northern China upland field. Sci. Total Environ. 2018, 633, 230–239. [Google Scholar] [CrossRef]
- Xu, W.; Luo, X.S.; Pan, Y.P.; Zhang, L.; Tang, A.H.; Shen, J.L.; Zhang, Y.; Li, K.H.; Wu, Q.H.; Yang, D.W.; et al. Quantifying atmospheric nitrogen deposition through a nationwide monitoring network across China. Atmos. Chem. Phys. 2015, 15, 12345–12360. [Google Scholar] [CrossRef] [Green Version]
- Erisman, J.W.; Draaijers, G.P.J. Deposition processes and measurement techniques. In Atmospheric Deposition in Relation to Acidification and Eutrophication; Elservier: New York, NY, USA, 1995; Volume 63, pp. 55–77. [Google Scholar]
- Song, Y.Z.; Qin, B.Q.; Yang, L.Y.; Hu, W.P.; Luo, L.C. Primary estimation of atmospheric wet deposition of nitrogen to aquatic ecosystem of Lake Taihu. J. Lake Sci. 2005, 17, 226–230. [Google Scholar]
- Behera, S.N.; Sharma, M.; Aneja, V.P.; Balasubramanian, R. Ammonia in the atmosphere: A review on emission sources, atmospheric chemistry and deposition on terrestrial bodies. Environ. Sci. Pollut. R. 2013, 29, 8092–8131. [Google Scholar] [CrossRef]
- Fenn, M.E.; Bytnerowica, A.; Schilling, S.L.; Vallano, D.M.; Zavaleta, E.S.; Weiss, S.B.; Morozumi, C.; Geiser, L.H.; Hanks, K. On-road emissions of ammonia: An underappreciated source of atmospheric nitrogen deposition. Sci. Total Environ. 2018, 625, 909–919. [Google Scholar] [CrossRef] [PubMed] [Green Version]
- Tang, Y.S.; Braban, C.F.; Dragosits, U.; Dore, A.J.; Simmons, I.; van Dijk, N.; Poskitt, J.; Pereira, G.D.S.; Keenan, P.O.; Conolly, C.; et al. Drivers for spatial, temporal and long-term trends in atmospheric ammonia and ammonium in the UK. Atmos. Chem. Phys. 2018, 18, 705–733. [Google Scholar] [CrossRef] [Green Version]
- Edgerton, E.S.; Saylor, R.D.; Hartsell, B.E.; Jansen, J.J.; Hansen, D.A. Ammonia and ammonium measurements from the southeastern United States. Atmos. Environ. 2007, 41, 3339–3351. [Google Scholar] [CrossRef]
- Horváth, L.; Sutton, M.A. Long-term record of ammonia and ammonium concentrations at K-Puszta, Hungary. Atmos. Environ. 1998, 32, 339–344. [Google Scholar] [CrossRef]
- Walker, J.T.; Whitall, D.R.; Robarge, W.; Paerl, H.W. Ambient ammonia and ammonium aerosol across a region of variable ammonia emission density. Atmos. Environ. 2004, 38, 1235–1246. [Google Scholar] [CrossRef]
- Warner, J.X.; Dickerson, R.R.; Wei, Z.; Strow, L.L.; Wang, Y.; Liang, Q. Increased atmospheric ammonia over the world’s major agricultural areas detected from space. Geophys. Res. Lett. 2017, 44, 2875–2884. [Google Scholar] [CrossRef]
- Shen, J.L.; Li, Y.; Liu, X.J.; Luo, X.S.; Tang, H.; Zhang, Y.Z.; Wu, J.S. Atmospheric dry and wet nitrogen deposition on three contrasting land use types of an agricultural catchment in subtropical central China. Atmos. Environ. 2013, 67, 415–424. [Google Scholar] [CrossRef]
- Zhang, W.F.; Ma, L.; Huang, G.Q.; Wu, L.; Chen, X.P.; Zhang, F.S. The development and contribution of nitrogenous fertilizer in China and challenges faced by the country. Sci. Agric. Sin. 2013, 46, 3161–3171. [Google Scholar]
- Pitcairn, C.E.R.; Leith, I.D.; Sheppard, L.J.; Sutton, M.A.; Fowler, D.; Munro, R.C.; Tang, S.; Wilson, D. The relationship between nitrogen deposition, species composition and foliar nitrogen concentrations in woodland flora in the vicinity of livestock farms. Environ. Pollut. 1998, 2, 41–48. [Google Scholar] [CrossRef]
- Xu, W.; Zheng, K.; Liu, X.J.; Meng, L.M.; Huaitalla, R.M.; Shen, J.L.; Hartung, E.; Gallmann, E.; Roelcke, M.; Zhang, F.S. Atmospheric NH3 dynamics at a typical pig farm in China and their implications. Atmos. Pollut. Res. 2014, 5, 455–463. [Google Scholar] [CrossRef] [Green Version]
- Asman, W.A.H.; Pinksterboer, E.F.; Maas, H.F.M.; Erisman, J.W.; Waijersypelaan, A.; Slanina, J.; Horst, T.W. Gradients of the ammonia concentration in a nature reserve: Model results and measurements. Atmos. Environ. 1989, 23, 2259–2265. [Google Scholar] [CrossRef]
- Ti, C.; Gao, B.; Luo, Y.; Wang, X.; Wang, S.; Yan, X. Isotopic characterization of NHx-N in deposition and major emission sources. Biogeochemistry 2018, 138, 85–102. [Google Scholar] [CrossRef]
- Liu, X.J.; Ju, X.T.; Zhang, Y.; He, C.; Kopsch, J.; Zhang, F.S. Nitrogen deposition in agroecosystems in the Beijing area. Agric. Ecosyst. Environ. 2006, 113, 370–377. [Google Scholar] [CrossRef]
- Xu, A.L.; Wang, P. Phosphorus losses with surface runoff from farm lands in polder area around Taihu basin. J. Agro-Environ. Sci. 2008, 27, 1106–1111. [Google Scholar]
- Yang, S.; Chen, X.; Lu, J.; Hou, X.; Li, W.; Xu, Q. Impacts of agricultural topdressing practices on cyanobacterial bloom phenology in an early eutrophic plateau Lake, China. J. Hydrol. 2021, 594, 125952. [Google Scholar] [CrossRef]
- van Es, H.M.; Sogbedji, J.M.; Schindelbeck, R.R. Effect of manure application timing, crop, and soil type on nitrate leaching. J. Environ. Qual. 2006, 35, 670–679. [Google Scholar] [CrossRef]
- Tang, Q.X.; Ren, T.Z.; Wilko, S.; Liu, H.B.; Lei, B.K.; Lin, T.; Zhang, G.L. Study on environmental risk and economic benefits of rotation systems in farmland of Erhai Lake basin. J. Integr. Agric. 2012, 11, 1038–1047. [Google Scholar] [CrossRef]
- Tan, W.X.; Liu, P.C.; Liu, Y.; Yang, S.; Feng, S.A. A 30-year assessment of Phytoplankton blooms in Erhai Lake using Landsat imagery: 1987–2016. Remote Sens. 2017, 9, 1265. [Google Scholar] [CrossRef] [Green Version]
- Alexander, R.B.; Boyer, E.W.; Smith, R.A.; Schwarz, G.E.; Moore, R.B. The role of headwater streams in downstream water quality. J. Am. Water Resour. Assoc. 2007, 43, 41–59. [Google Scholar] [CrossRef] [Green Version]
- Hua, L.L.; Zhai, L.M.; Liu, J.; Guo, S.F.; Li, W.C.; Zhang, F.L.; Fan, X.P.; Liu, H.B. Characteristics of nitrogen losses from a paddy irrigation-drainage unit system. Agric. Ecosyst. Environ. 2019, 285, 106629. [Google Scholar] [CrossRef]
- Zeng, S.C.; Su, Z.Y.; Chen, B.G.; Wu, Q.T.; Ouyang, Y. Nitrogen and phosphorus runoff losses from orchard soils in South China as affected by fertilization depths and rates. Pedosphere 2008, 18, 45–53. [Google Scholar] [CrossRef]
- She, D.L.; Zhang, L.; Guo, X.M.; Yan, X.Y.; Zhao, X.; Xie, W.M.; Cheng, Y.; Xia, Y.Q. Limited N removal by denitrification in agricultural drainage ditches in the Taihu Lake region of China. J. Soil Sediment 2018, 18, 1110–1119. [Google Scholar] [CrossRef]
- Wang, Z.L.; Li, Y.M.; Zhang, W.L.; Zhang, H.Z.; Zhao, P. Study on nitrogen and phosphorus pollutants changes of main into lake rivers for Kunming Danchi Lake during dry and rainy seasons. J. Yunnan Agric. Univ. 2009, 24, 729–733. [Google Scholar]
- Bergtröm, A.K.; Jansson, M. Atmospheric nitrogen deposition has caused nitrogen enrichment and eutrophication of lakes in the northern hemisphere. Glob. Chang. Biol. 2006, 12, 635–643. [Google Scholar]
- Xu, W.; Zhao, Y.H.; Liu, X.J.; Dore, A.J.; Zhang, L.; Liu, L.; Cheng, M.M. Atmospheric nitrogen deposition in the Yangtze River basin: Spatial pattern and source attribution. Environ. Pollut. 2018, 232, 546–555. [Google Scholar] [CrossRef] [Green Version]
- Cao, J.; Hou, Z.Y.; Li, Z.K.; Chu, Z.S.; Yang, P.P.; Zheng, B.H. Succession of phytoplankton functional groups and their driving factors in a subtropical plateau lake. Sci. Total Environ. 2018, 631–632, 1127–1137. [Google Scholar] [CrossRef]
- Zhang, H.; Song, G.F.; Shao, J.H.; Xiang, X.F.; Li, Q.; Chen, Y.X.; Yang, P.; Yu, G.L. Dynamics and polyphasic characterization of odor-producing cyanobacterium Tychonema bourrellyi from Lake Erhai, China. Environ. Sci. Pollut. R. 2016, 23, 420–5430. [Google Scholar] [CrossRef]
- Feng, Y.W.; Yoshinaga, I.; Shiratani, E.; Hitomi, T.; Hasebe, H. Characteristics and behavior of nutrients in a paddy field area equipped with recycling irrigation system. Agric. Water Manag. 2004, 68, 47–60. [Google Scholar] [CrossRef]
- Hama, T.; Nakamura, K.; Kawashima, S.; Kaneki, R.; Mitsuno, T. Effects of cyclic irrigation on water and nitrogen mass balances in a paddy field. Ecol. Eng. 2011, 37, 1563–1566. [Google Scholar] [CrossRef] [Green Version]
- Wang, X.L.; Li, J.S.; Li, S.M.; Zheng, X.T. A study on removing nitrogen from paddy field rainfall runoff by an ecological ditch-zeolite barrier system. Environ. Sci. Pollut. Res. 2017, 24, 27090–27103. [Google Scholar] [CrossRef]
- Ju, X.T.; Gu, B.J. Status-quo, problem and trend of nitrogen fertilization in China. J. Plant Nutr. Fert. 2014, 20, 783–795. [Google Scholar]
- Ju, X.T.; Gu, B.J.; Wu, Y.Y.; Galloway, J.N. Reducing China’s fertilizer use by increasing farm size. Glob. Environ. Chang. 2016, 41, 26–32. [Google Scholar] [CrossRef]
Figure 1.
Locations of Erhai Lake Watershed and experimental site.

Figure 2.
NH3 volatilization from two fertilized paddy fields, whereas the fertilization dates were both on 22 May.
Figure 2.
NH3 volatilization from two fertilized paddy fields, whereas the fertilization dates were both on 22 May.

Figure 3.
The temporal variations of N concentration in wet deposition and the corresponding natural rainfall depth.
Figure 3.
The temporal variations of N concentration in wet deposition and the corresponding natural rainfall depth.

Figure 4.
The temporal variations of N deposition in different forms and the associated responses to NH3 volatilization in (a) dry deposition; (b) temporal variations of N concentration in simulated rainfall.
Figure 4.
The temporal variations of N deposition in different forms and the associated responses to NH3 volatilization in (a) dry deposition; (b) temporal variations of N concentration in simulated rainfall.

Figure 5.
N concentration in precipitation wet deposition in different month in Dali city.

Figure 6.
TN, NO3−-N and NH4+-N concentrations in: (a) paddy field water; (b) ditch water.

Figure 7.
TN, NO3−-N and NH4+-N concentrations in runoff water.

Figure 8.
TN, NO3−-N and NH4+-N concentrations in outlet of ditch water.

Figure 9.
N concentration of: (a) wet deposition; (b) dry deposition; (c) outlet water, in two periods. Bars with different lowercase letters and capital letters indicate substantial differences between CP and GP at p < 0.05. CP: the critical period with high deposition or concentration; GP: the general period compared with CP. In the box-plots, the small square lattice represents the arithmetic mean of the data. Boxplots indicate the 25th, 50th, and 75th percentiles and whiskers indicate the minimum and maximum values.

Figure 10.
The relationships between NH3 volatilization and (a) N dry deposition and (b) wet deposition.
Figure 10.
The relationships between NH3 volatilization and (a) N dry deposition and (b) wet deposition.

Publisher’s Note: MDPI stays neutral with regard to jurisdictional claims in published maps and institutional affiliations. |
© 2022 by the authors. Licensee MDPI, Basel, Switzerland. This article is an open access article distributed under the terms and conditions of the Creative Commons Attribution (CC BY) license (https://creativecommons.org/licenses/by/4.0/).
Share and Cite
MDPI and ACS Style
Guo, S.; Yan, T.; Zhai, L.; Yen, H.; Liu, J.; Li, W.; Liu, H. Nitrogen Transport/Deposition from Paddy Ecosystem and Potential Pollution Risk Period in Southwest China. Water 2022, 14, 539. https://doi.org/10.3390/w14040539
AMA Style
Guo S, Yan T, Zhai L, Yen H, Liu J, Li W, Liu H. Nitrogen Transport/Deposition from Paddy Ecosystem and Potential Pollution Risk Period in Southwest China. Water. 2022; 14(4):539. https://doi.org/10.3390/w14040539
Chicago/Turabian StyleGuo, Shufang, Tiezhu Yan, Limei Zhai, Haw Yen, Jian Liu, Wenchao Li, and Hongbin Liu. 2022. "Nitrogen Transport/Deposition from Paddy Ecosystem and Potential Pollution Risk Period in Southwest China" Water 14, no. 4: 539. https://doi.org/10.3390/w14040539
Note that from the first issue of 2016, this journal uses article numbers instead of page numbers. See further details here.