Article

Causation Identification and Control Measures of Deformation by Integrated Dewatering-Excavation Process Simulation of a T-Shaped Deep Foundation Pit

1
China Communications Construction Company Tunnel Engineering Bureau Co., Ltd., Beijing 100024, China
2
College of Environmental Science and Engineering, Nankai University, Tianjin 300350, China
3
Division of Water Resources Engineering, Lund University, 221 00 Lund, Sweden
*
Author to whom correspondence should be addressed.
Water 2022, 14(4), 535; https://doi.org/10.3390/w14040535
Submission received: 11 January 2022 / Revised: 9 February 2022 / Accepted: 9 February 2022 / Published: 11 February 2022
(This article belongs to the Special Issue Advances and Challenges in Hydrological Modeling and Engineering)

Abstract

:
Construction of subway line intersection stations will become more and more popular in the future. Research on the deformation characteristics in the construction process is the best way to ensure the safety of the foundation pit itself, the surrounding buildings, and adjacent subway stations. In this paper, the deformation characteristics of a T-shaped subway foundation pit during construction are studied by an integrated dewatering-excavation three-dimensional numerical simulation method. The results show that the main causation of the surface settlement around the foundation pit is the stratum compression caused by dewatering, and the main causation of the deformation of the diaphragm wall and the existing subway station is the soil deformation caused by excavation unloading. It is suggested that constructing a high-quality diaphragm wall, controlling the water level within the excavation foundation pit, strengthening the monitoring, and timely cement pouring of the bottom plate are key countermeasures to reduce the deformation. The research results of this paper have reference significance for similar projects.

1. Introduction

The construction of urban rail transit in China has been developed rapidly in recent years, and there will be more and more transfer stations to be built at subway intersections. The transfer station mainly includes “╋”, “T”, “L”, and up-down overlapping transfer modes, among which “T” transfer mode is the first choice of most subway transfer stations due to its advantages of low construction difficulty, low cost, and easier management of passenger flow. The construction method of the T-shaped subway station involves excavating the foundation pit of a new station when another station has been built and put into operation. Ensuring the safe operation of the existing station is a key task in the excavation of the new foundation pit.
Previous studies have shown that the excavation of foundation pits always induced settlement of the surrounding buildings and influenced adjacent subway tunnels [1,2,3]. There are many factors, such as excavation unloading [4,5,6], groundwater drawdown [7,8,9], unloading modulus, excavation method [10,11], space-time effect [12,13], and other factors that are related to the surrounding deformation of the foundation pit. These factors pose great challenges to the safety of the surrounding environment and the foundation pit itself. Therefore, in order to develop targeted prevention and control countermeasures, it is very important to identify the deformation component characteristics caused by various factors.
Numerical simulation is an important method to study the deformation characteristics of the deep foundation pit construction process. The excavation process had been studied by simulation method extensively. However, most of the case studies only focused on one aspect, accounting for either the rock and soil mechanical deformation of the foundation pit excavation [14,15,16] or ground surface settlement caused by the drawdown of groundwater level [17,18,19,20]. Few cases consider both types of deformation. In fact, soil and rock mechanical simulation mainly studies the deformation caused by unloading redistribute the stress state of the surrounding [21,22], and groundwater simulation mainly studies the compression deformation of soil layer caused by the increase of effective stress caused by the dewatering of groundwater [23,24]. The causation and distribution characteristics of the two types of deformations are different. In the process of foundation pit construction, it is of great significance to find out the spatial and temporal distribution characteristics of deformation caused by the various factors to put forward the key points of prevention and control in different construction stages and formulate safe and reliable construction schemes and protective measures.
In this paper, based on the “T” shaped foundation pit of Tianjin’s metro transfer station, the numerical simulation of seepage and the mechanical processes of the excavation were performed, and the deformation effect of diaphragm wall, surrounding areas and the adjacent existing subway station were analyzed. The analysis method and results could prove to be a valuable reference for similar projects.

2. Materials and Methods

2.1. Overview and Study Area

The study area was located at a transfer station of the Tianjin city subway lines 11 (under construction) and 6. The E-W and N-S directions of the station intersect in a T shape, as shown in Figure 1. The excavation foundation pit runs in the E-W directions with a length of 219.1 m and a width of 23.3 m, and the excavation depth is approximately 26 m. The existing station runs in the N-S directions with a length of 230.6 m and a width of 37.1 m, and the excavation depth is approximately 18 m. The supporting structures of the two foundation pits are all underground diaphragm walls (1.2 m in width), the diaphragm wall of the proposed E-W foundation pit and the existing N-S foundation pit extend 50 m and 36 m from the land surface, respectively. According to the design, the foundation pit has 5 rows of horizontal supports, the first (0 m in depth), third (13.4 m in depth), and fourth (23.2 m) are concrete supports, the second (7.2 m in depth) and fifth (26 m in depth) are steel supports, and every horizontal row includes 26 pillars. The main body of the station uses the opened top-down excavation method and the central part used the covered top-down excavation method. The covered excavation part is in the range of the municipal underground line pipeline.

2.2. The Engineering Geology Conditions

According to the existing geotechnical investigation [25], the foundation soils are all Quaternary unconsolidated sediments within 70 m depth. The transgression and regression in the Quaternary of this area controlled the sequence characteristics, and the foundation pit strata showed the sediment characteristics of alternative marine river lacustrine facies. The whole formation consists of three marine strata (⑥, ⑩, ⑫) and six continental strata (④, ⑦, ⑧, ⑨, ⑪, ⑬) which are refined into 11 layers according to mechanical properties, as shown in Table 1 below.

2.3. The Hydrogeological Condition

Based on the stratified characteristics of the soil layer and the permeability of each layer, the groundwater system of the foundation pit site can be conceptualized as a combination of one phreatic aquifer, three confined aquifers, and three aquitards, as listed in Table 2. The buried depth of water level of the phreatic aquifer is as follows: the first, second, and third confined aquifer are 0.5 m, 3.5 m, 4 m and 4.5 m below the ground surface, respectively. The groundwater level is found to be influenced by season and climate, and the annual fluctuation of water level is about 1 m. The diaphragm wall extends 50 in depth, cutting off the second confined aquifer. The permeability parameters of the layers are also listed in Table 2.

3. Establishment of Numerical Model

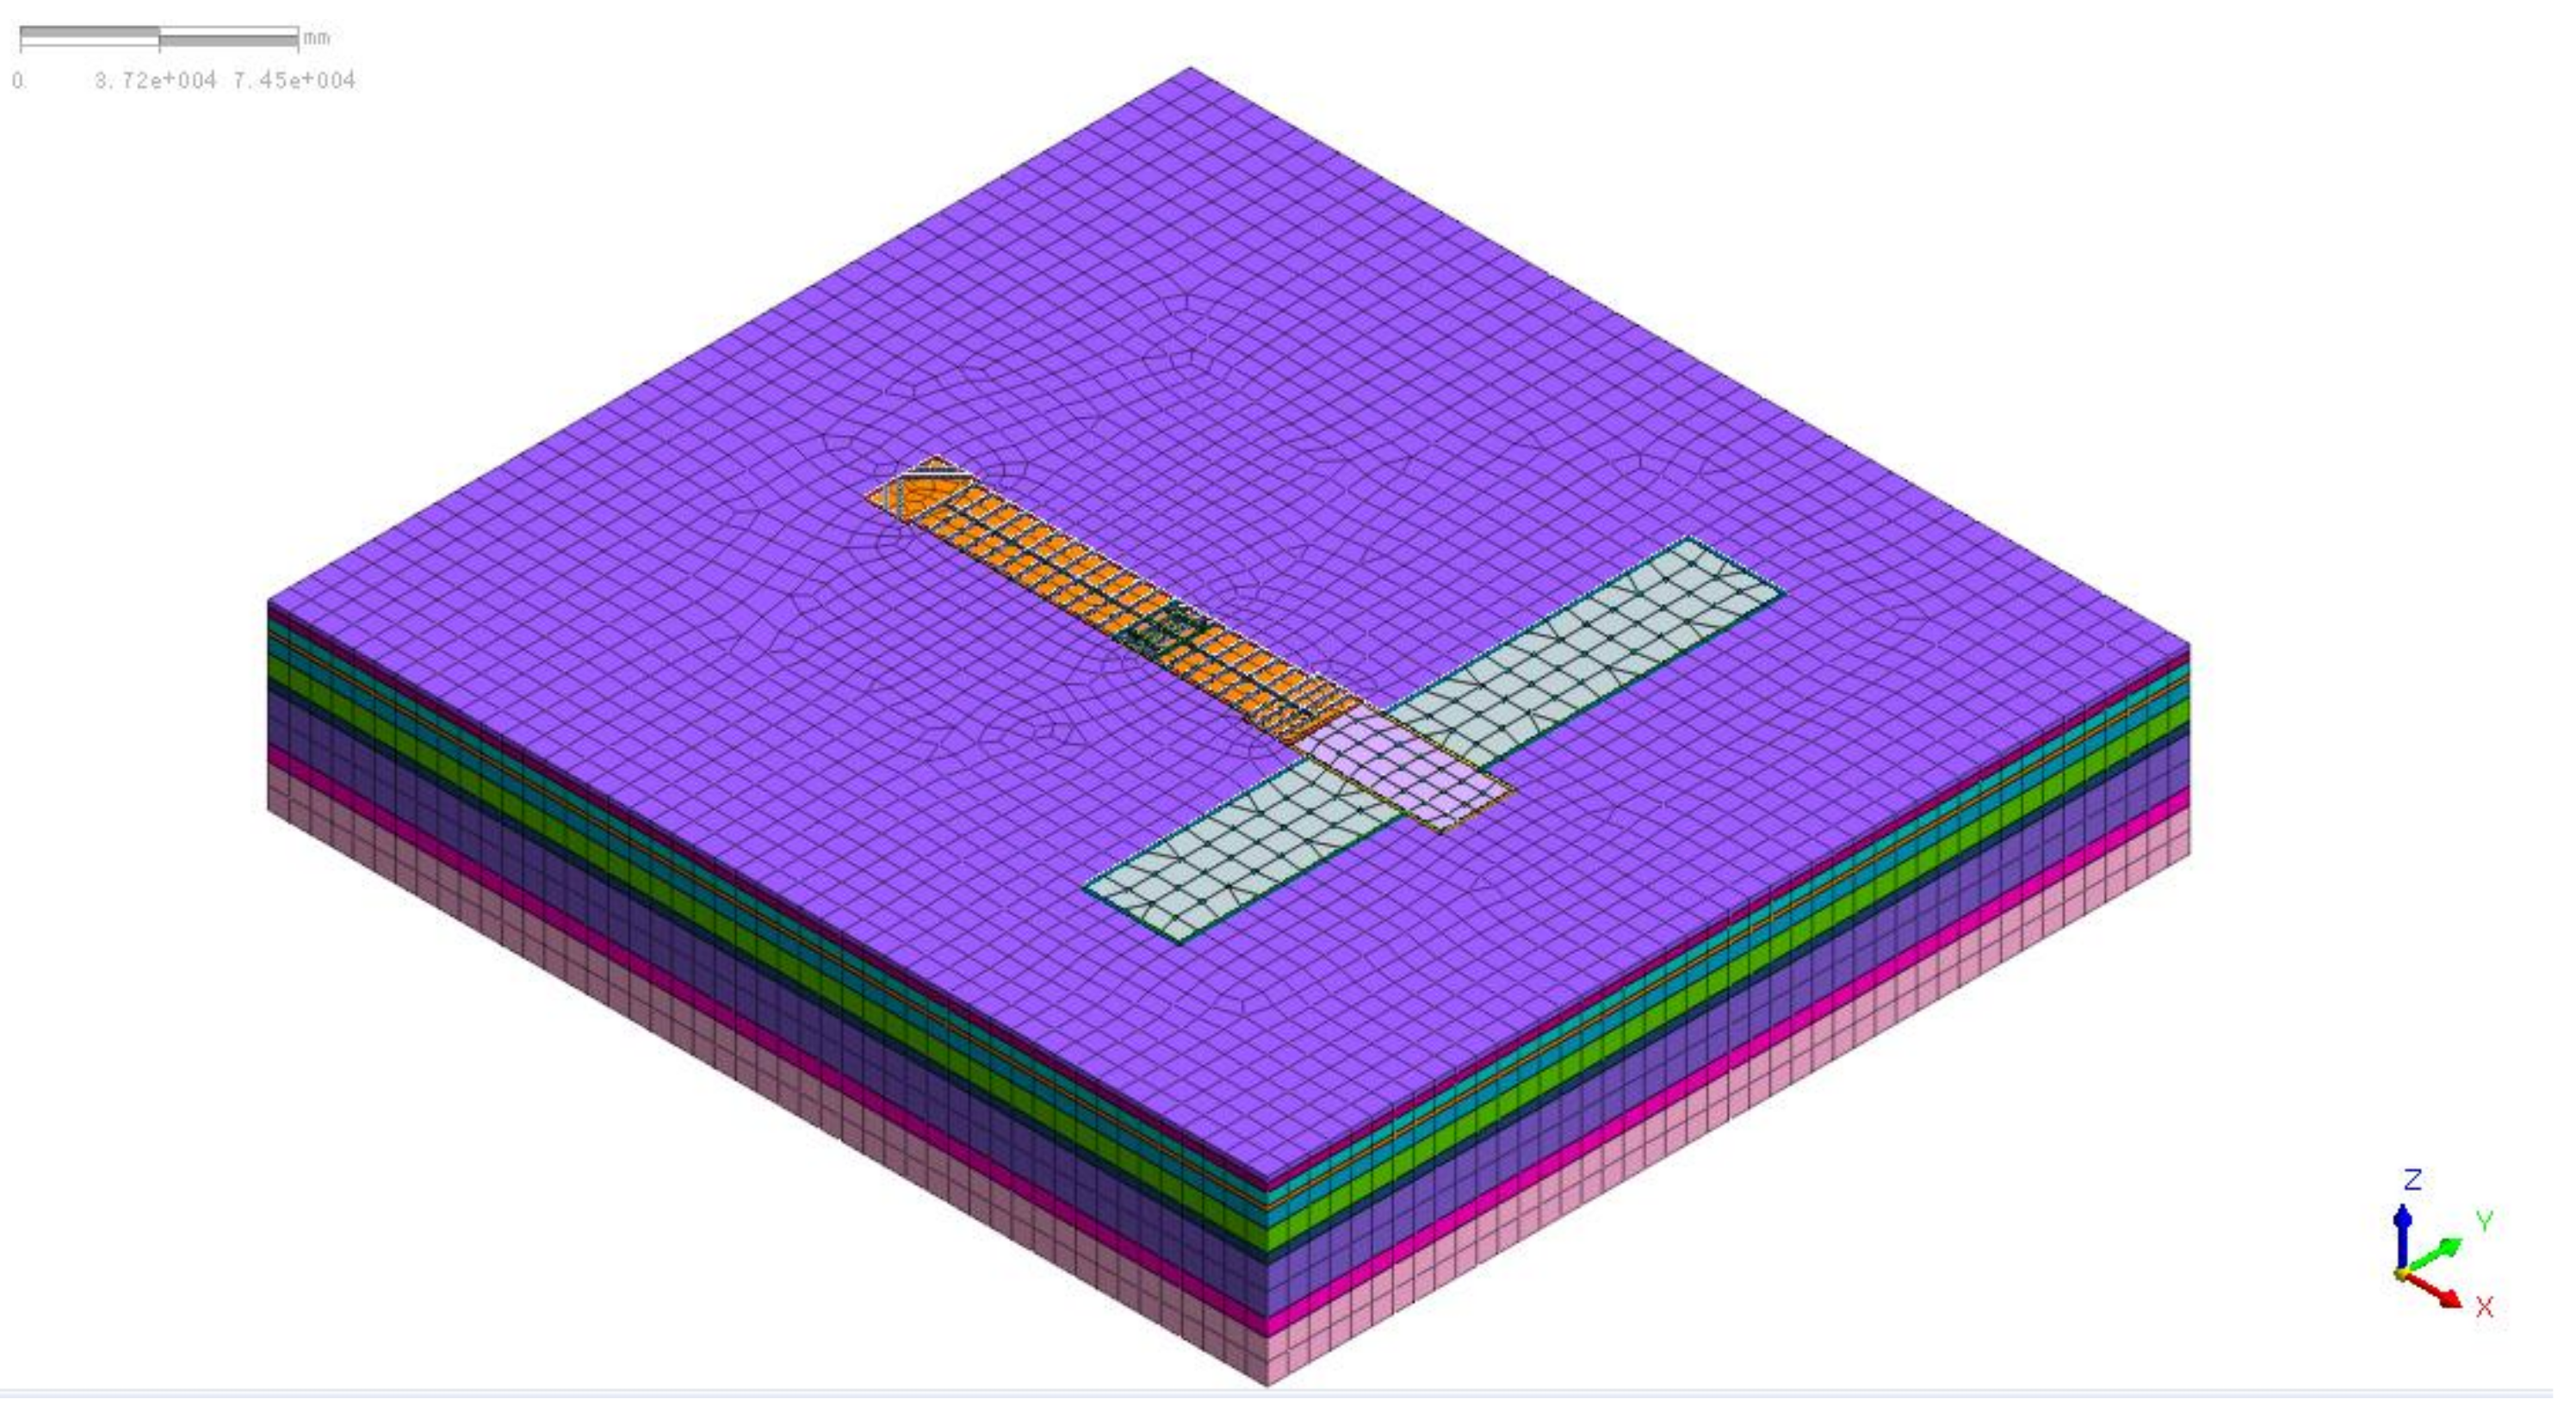
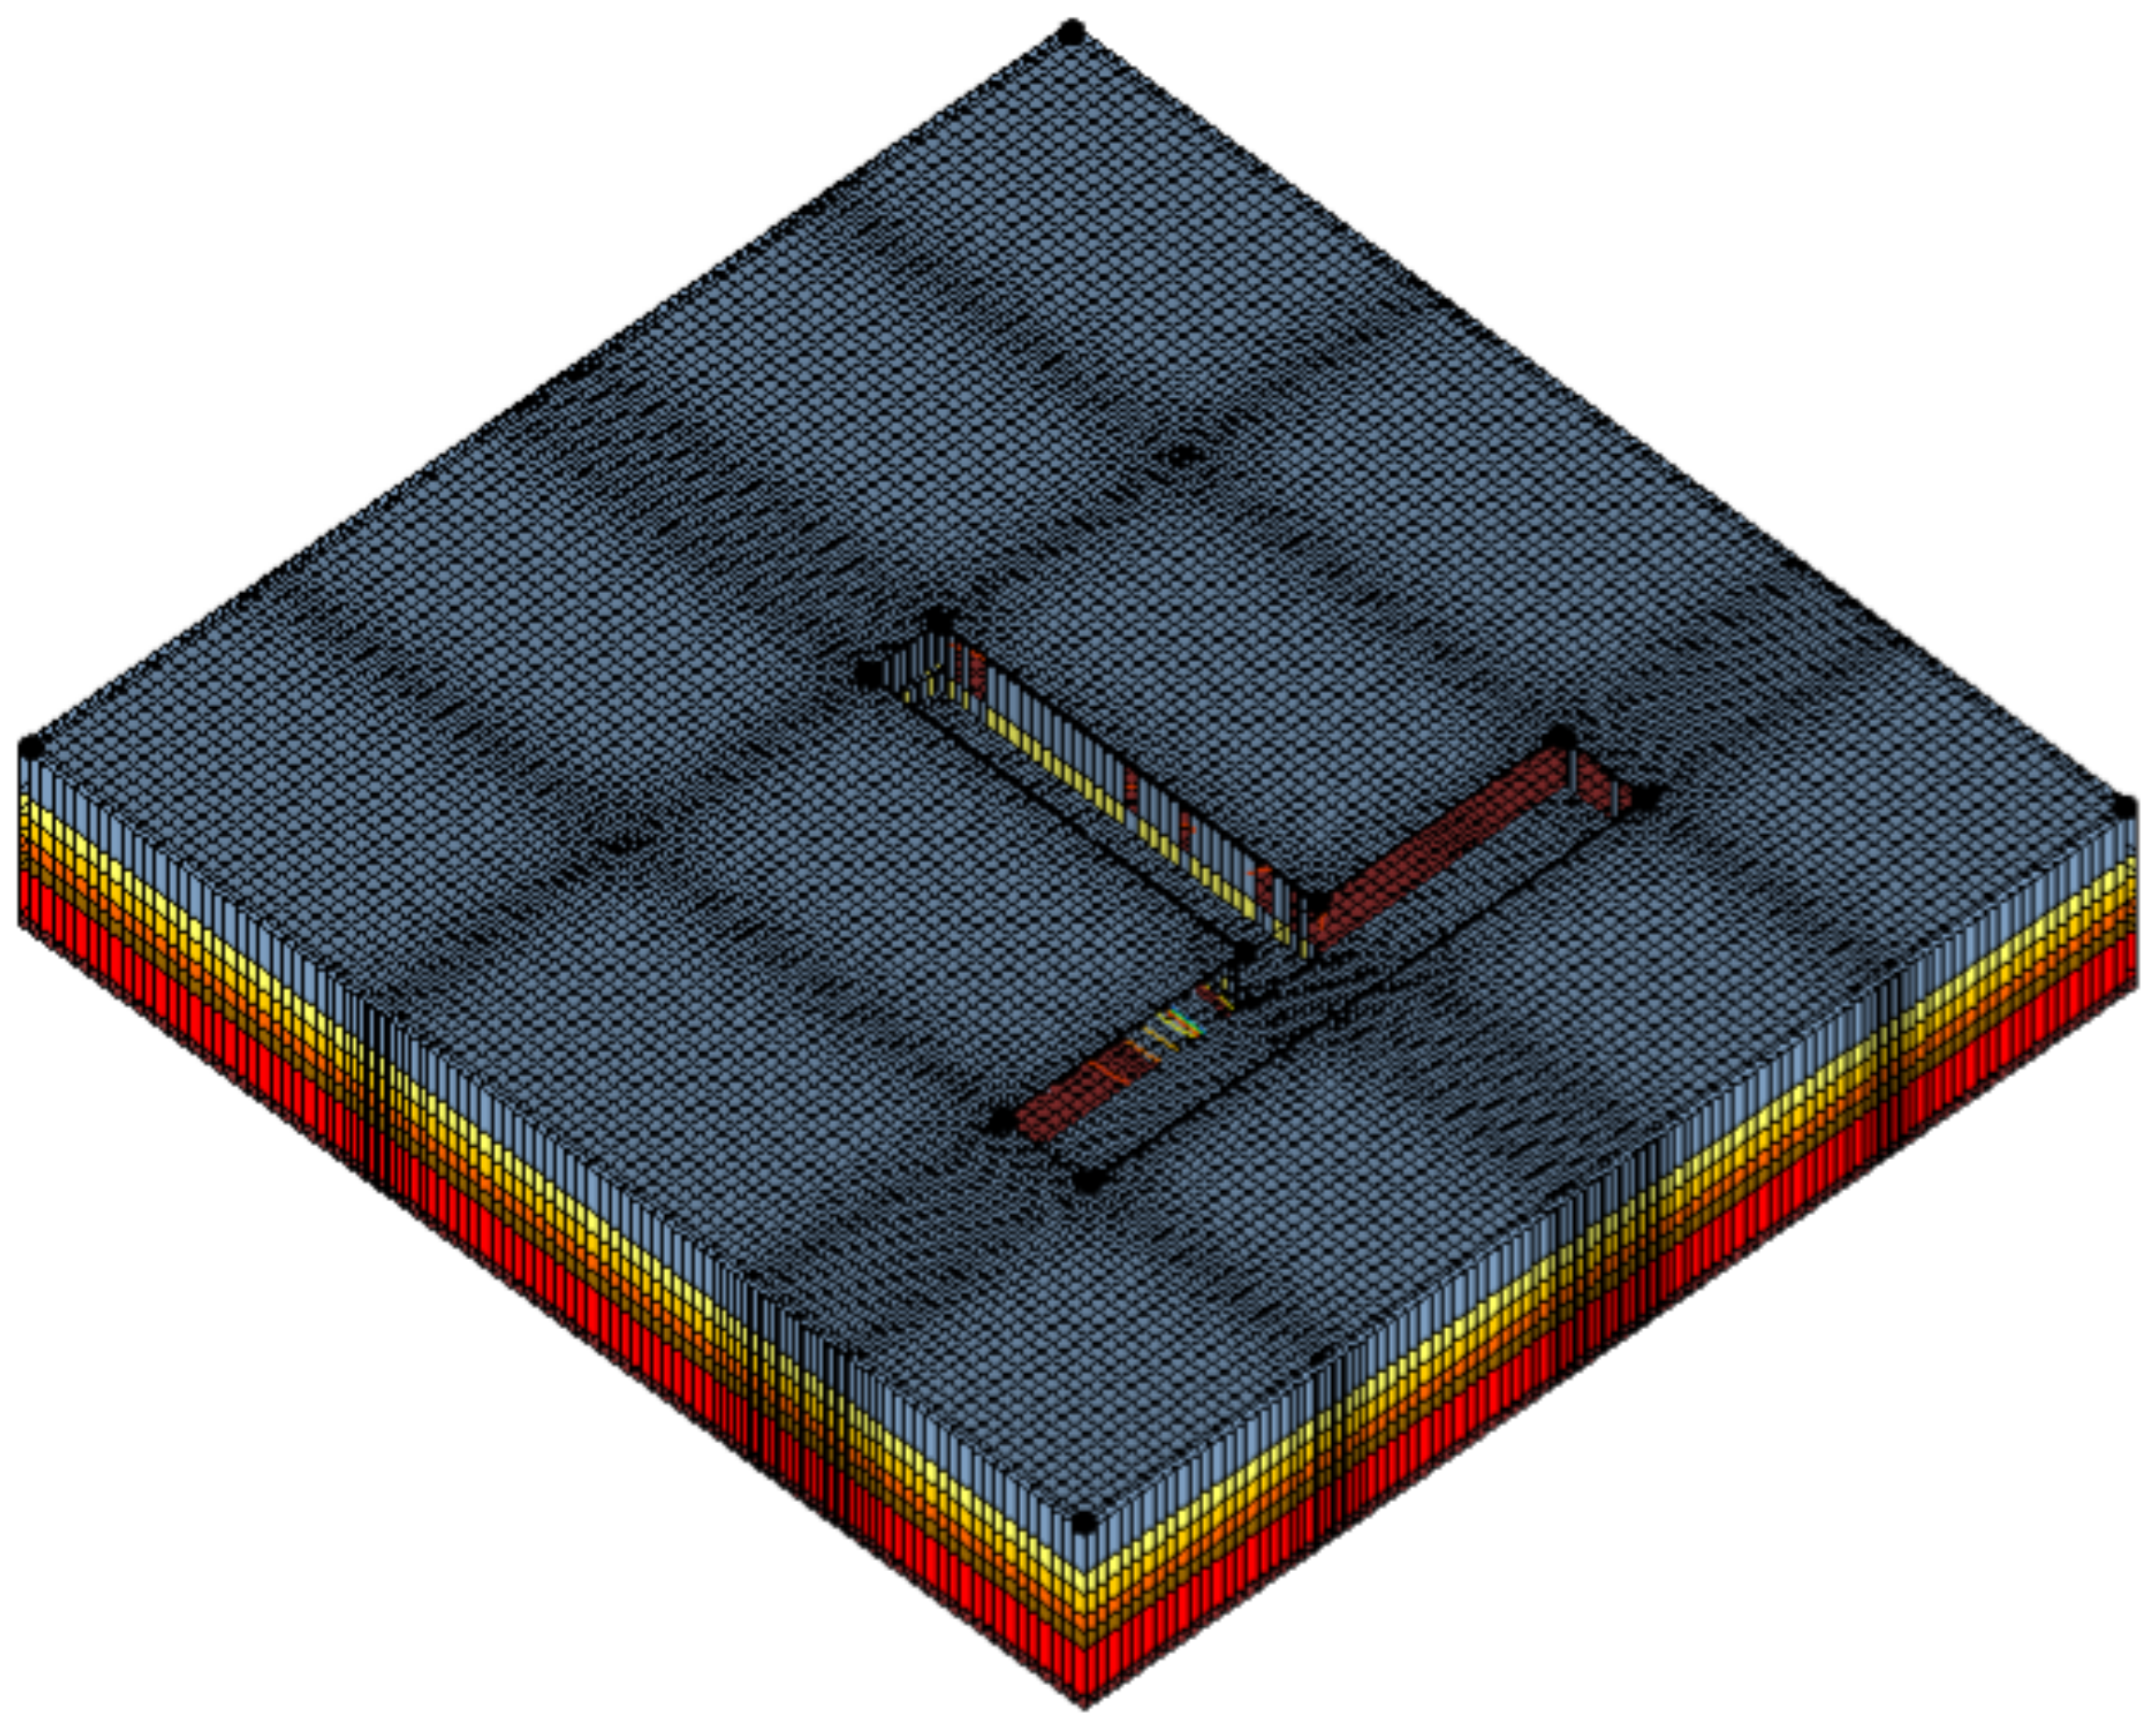
3.1. Three-Dimensional Geotechnical Model

The geotechnical finite element MIDAS/GTS software [26] is adapted for simulating and analyzing the foundation-pit excavation process. In the study process, according to the simulation results, the displacements of the diaphragm wall, adjacent subway station, and the surrounding land surface are analyzed of foundation pit excavation. According to Saint-Venant’s principle and engineering experience, the impact of excavation width on excavation depth is about 3–5 times, and the impact depth of excavation is about 2–4 times [1]. According to the actual situation and the scope of the pit’s excavation, the model size is designed and dimensioned as 350 m × 380 m × 69 m. The model setup with the distribution of each soil layer in the model is illustrated in Figure 2, with the parameters used for the soil in the calculation and analysis shown in Table 1. For the soil, we chose to adopt the Modified Mohr–Coulomb criterion; and the concrete structure uses the elastic criterion; the beam element is used to simulate the column pile, and the slab element is used to simulate the diaphragm wall and the slab. The stiffness parameters of soft soil are determined by the local empirical relationship between them and elastic modulus E, the reference secant modulus E 50 ref = 1.2 E , the reference tangent modulus E oed ref = 1.3 E , and the unloading-reloading modulus E ur ref = 8.5 E . In the calculation, the structural stress is ignored, the initial stress field is assumed to be the gravity stress field, and the soil is regarded as an elastic-plastic continuum, so the deformation generated during construction is continuous.

3.2. Three-Dimensional Dewatering Model

The MODFLOW (a modular three-dimensional finite difference groundwater flow model) software was chosen to simulate dewatering process [27]. The dimension of this dewatering model was designed the same as the geotechnical model, with the layers of the groundwater model set as seven layers, as presented in Figure 3. The hydrogeological parameters used in model are listed earlier in Table 2. The initial head of each layer is obtained from the field observation results. The boundary conditions of the model are defined as constant head boundaries since the surface head variation is neglectable. The bottom plate of the model is defined as an impervious boundary.
The subsidence caused by dewatering was calculated using the following equation [28]:
Δ b = i = 1 n b 0 i m vi S i γ w F
where Δb is the subsidence (mm); b0i is the initial thickness of layer i (m); mvi is the coefficient of volumetric compressibility of layer i (MPa−1); mvi = 1/Ei, Si is the drawdown of layer i (m); γw is the unit weight of groundwater (kN/m3); F is the subsidence empirical coefficient, equal to 1 in this study; and n is the number of layers influenced by dewatering, equal to 7.

3.3. Calculation Process and Simulation Scheme

In this study, the mechanical deformation and dewatering deformation of the foundation pit excavation were calculated respectively in two steps, and then the deformation characteristics and causation were comprehensively analyzed.
The excavation started with the construction of a 1.2 m thick diaphragm wall. The diaphragm wall was toed through the ⑫1 layers, which effectively cut off the third confined groundwater aquifer. The simulation calculation was done after the diaphragm wall was completed. In the beginning, the initial stress field is generated by applying gravity on every layer, and then, the displacement is reset to zero. The rest of the calculation is divided into five stages following the pre-defined construction scheme, as shown in Table 3.
The dewatering process calculation adopted the three-dimensional transition flow, numerical simulation model. It started at the beginning of the first excavation stage. The constant head boundaries were set around the model according to water level depth in Table 2. The water level in each stage of the foundation pit excavation is controlled to stay within 1–2 m below the foundation bottom, and the control method was mainly by adjusting the pumping volume of each stage of excavation.

4. Results

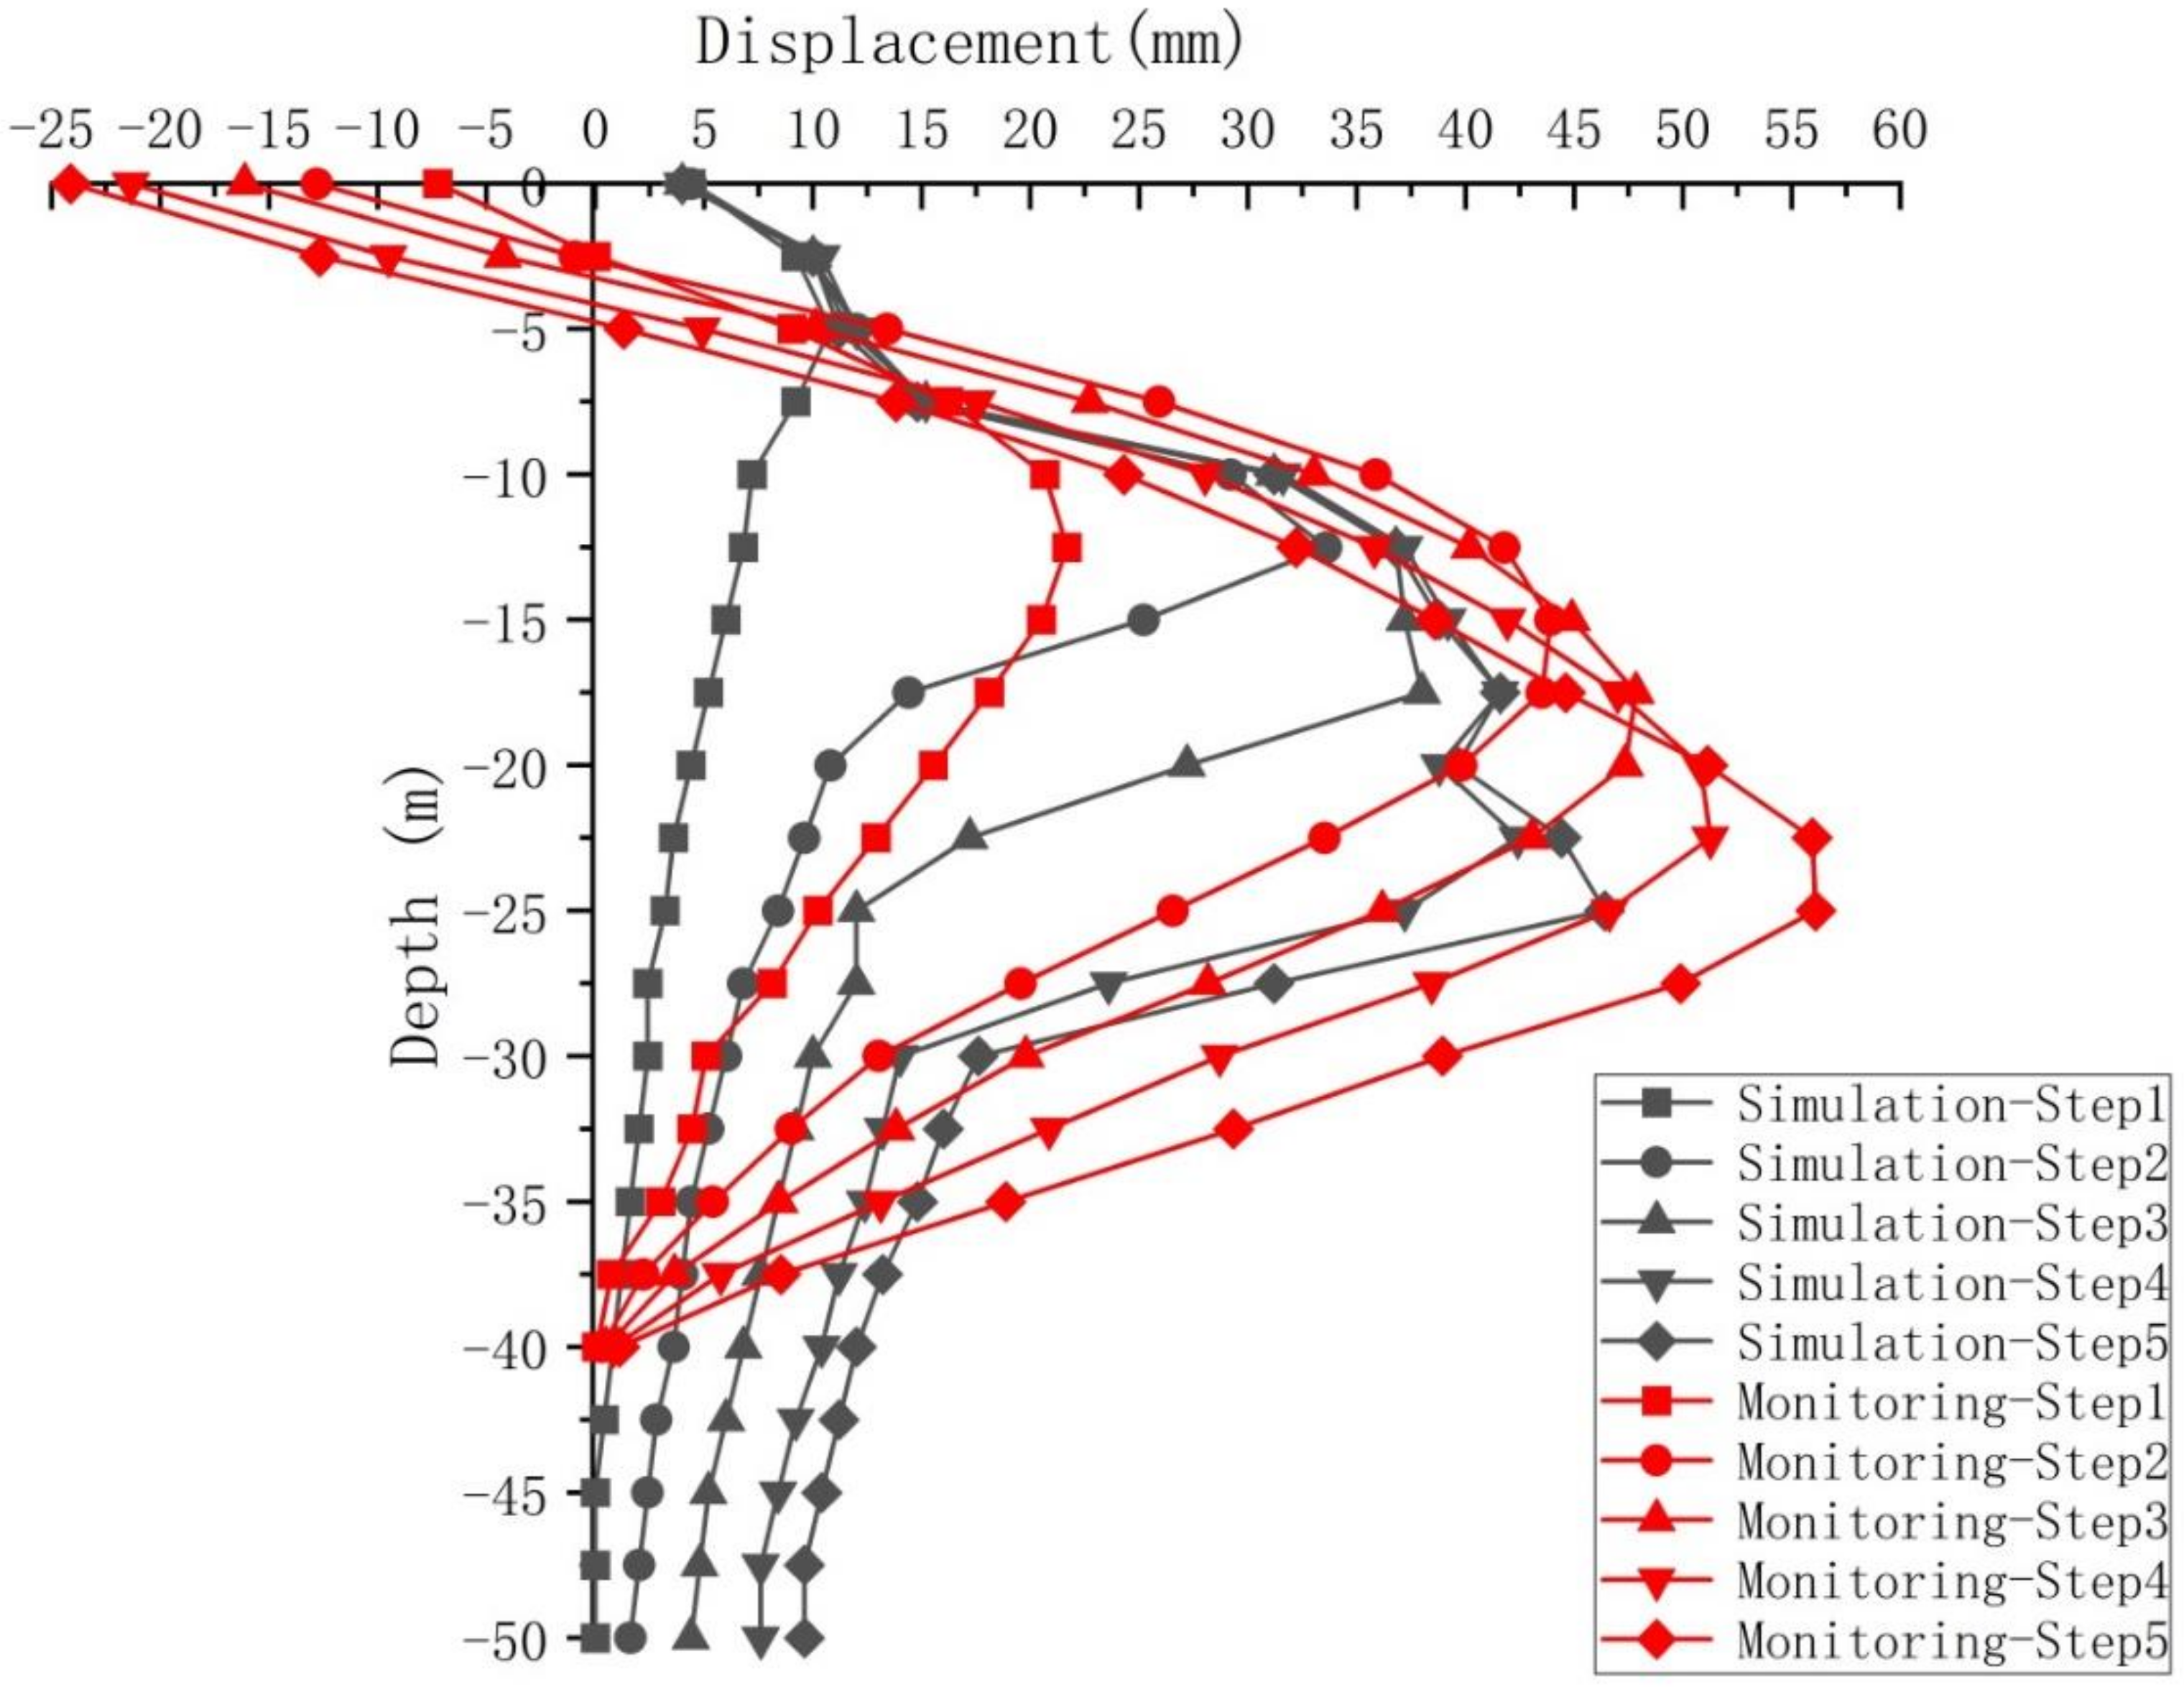
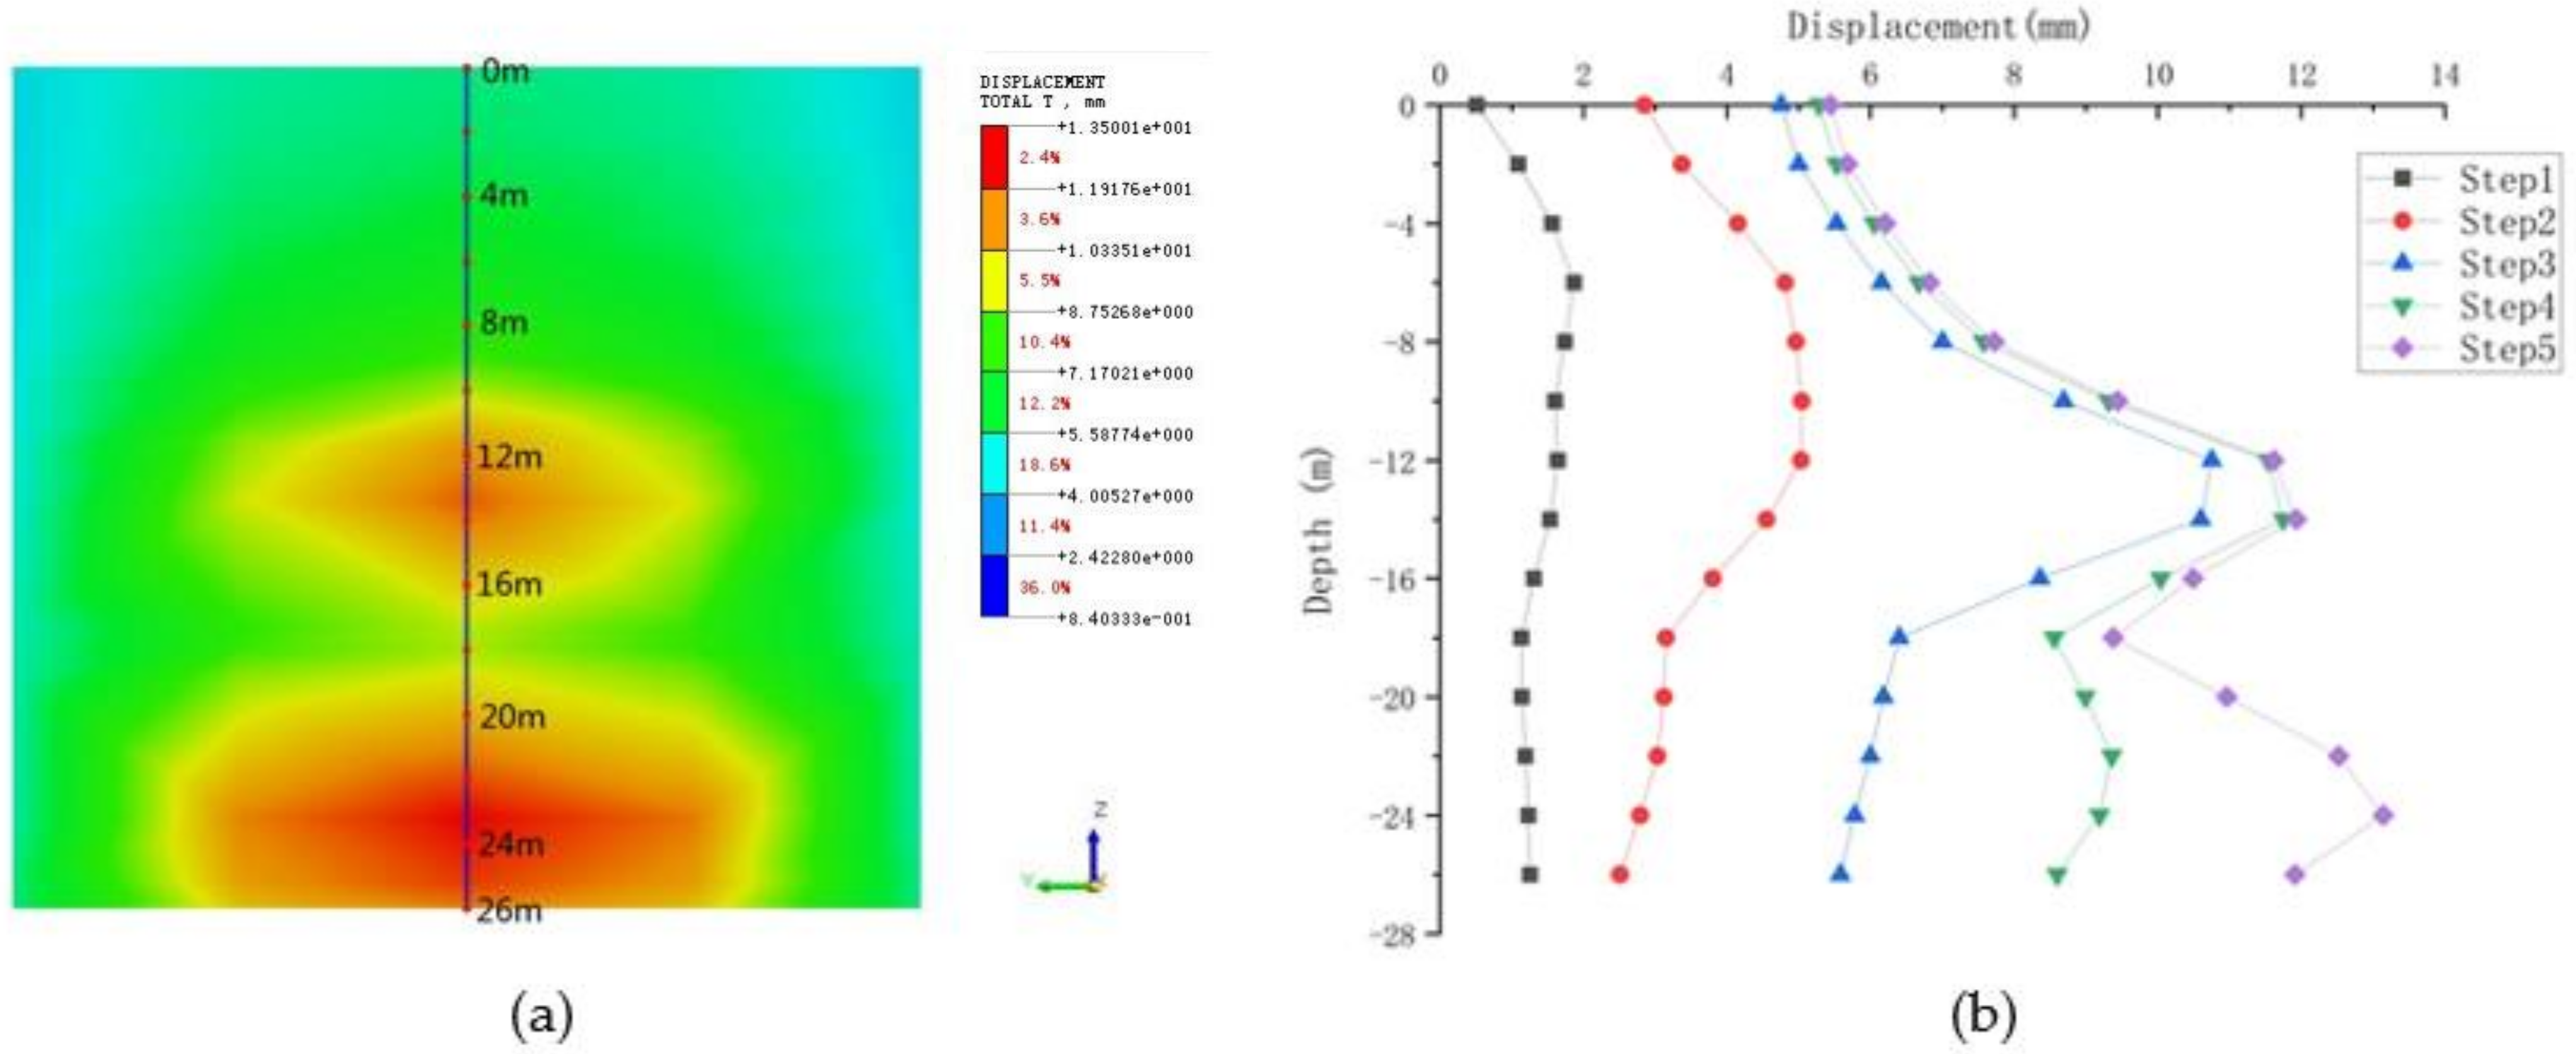
4.1. Deflections of Diaphragm Wall

The 3-D deflection pattern of the entire diaphragm when the foundation pit is excavated to 26 m depth are illustrated in Figure 4. It is easy to see from Figure 4 that the maximum deflection on each side of the foundation pit appears in the middle of the side, and the deflection of the covered excavation part is significantly smaller than that of other parts. To further investigate the displacement pattern, Figure 5 shows the extracted deflection simulation curves of the longitudinal axis of the foundation pit marked in Figure 4 of different excavation stages. As can be seen in Figure 5, with the development of the excavation, the deflection is getting increasingly large, and below the depth of each excavation step, the deflection decreases gradually. The deflection profile’s line developed as an inward “Parabolic shape” profile as excavation depth increased, and the locations of maximum wall deflections moved downward as excavation continued deeper. From the first step to the fifth step, the maximum value of the deflection of the diaphragm wall is 10.88, 36.12, 43.96, 49.56, and 55.80 mm, respectively, with the corresponding location at depths of 5, 12.5, 17.5, 22.5, and 25 m, respectively. The maximum deformation position is about at the deepest excavation of each construction stage.
Figure 5 presents both the measured and simulated values of deflections during each given stage. It can be seen from the figure that there are certain differences between the two, especially at 0 m depth on the land surface. For the deeper profile, the development trend of the deflection of the diaphragm wall acquired by the calculation results of the three-dimensional model is roughly the same as the measured situation down to depth 40 m. As groundwater is not considered in the geomechanical model, Figure 5 reveals that the deformation of the diaphragm wall is mainly the result of unloading, and the mechanical effect of inward slippage of the outside soil of the pit. The measured values show that the surface deflection values are negative, which means that the displacement direction is moving outside of the pit. We suspect that the diaphragm wall moves outward due to the large internal stress of the horizontal support of the first layer, which is probably due to the construction technique problem of the horizontal beam. The maximum monitoring depth is 40 m, and it is assumed that the deformation at this point is zero. Therefore, we believe that the monitoring value at 40 m depth does not reflect the actual deformation.

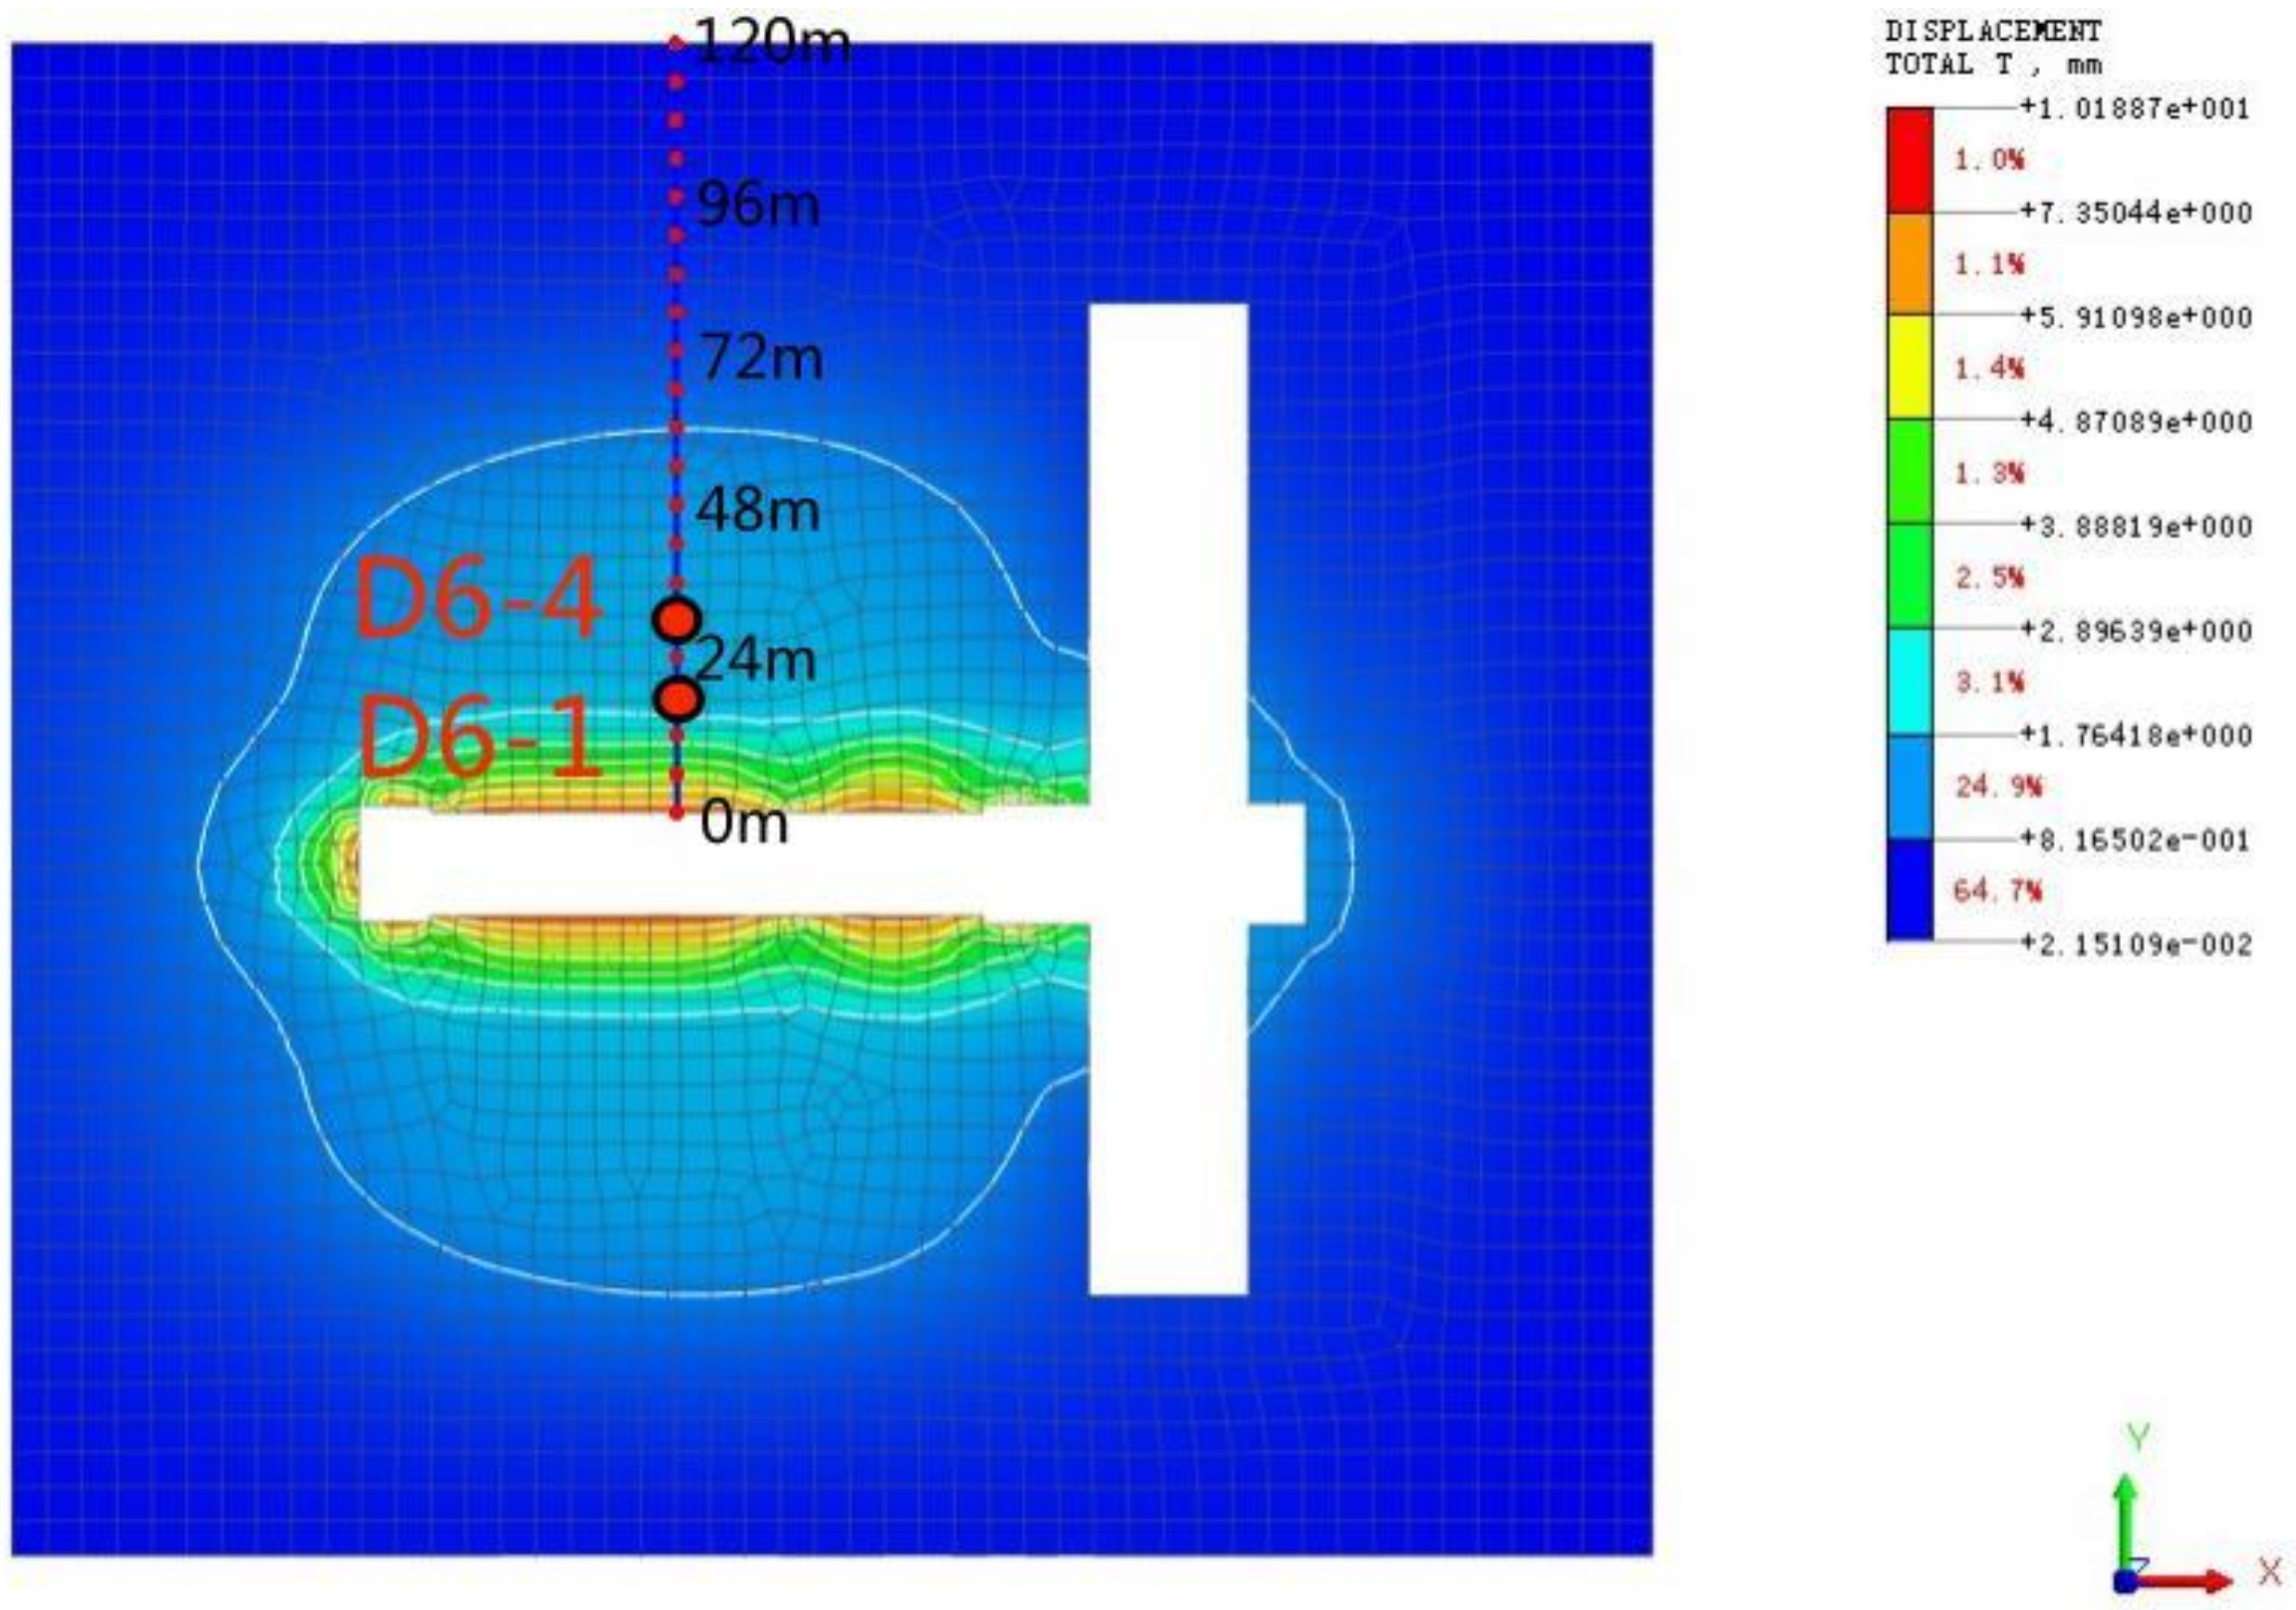
4.2. Deformation of Surrounding Land Surface Caused by Excavation

With the unloading of foundation pit excavation, the stress of the surrounding soil is disturbed and redistributed, resulting in vertical and horizontal displacement. Excessive deformation of the surrounding soil will affect surrounding buildings and underground pipelines. Figure 6 shows the contour map of accumulated surface displacement deformation in the final stage of excavation. The content in the figure shows that the deformation of surrounding soil is significantly smaller than that of foundation pit wall, with a maximum value of 9 mm, about 1/6 of the maximum deformation of the diaphragm wall. The deformation is sharply reduced at a distance of 18 m outside the foundation pit, and the deformation decreases to less than 1 mm at the distance of 50 m. It can be concluded that the simulation results demonstrated that the influence distance of soil deformation caused by excavation is about 2H (H is the excavation depth, equal to 26 m in this study).
Figure 7 shows the total displacement (Figure 7a), horizontal displacement (Figure 7b), and vertical displacement (Figure 7c) of soil outside the pit at each stage of excavation. From the first stage to the fifth stage, the total displacement, horizontal displacement and vertical displacement change from 1.8 mm to 8.5 mm, −2 mm to −7.8 mm (negative represent inward direction), and −2 mm to 3.75 mm (negative values represent the downward direction), respectively. The deformation characteristics of soil outside of the pit are determined by its causation. The excavation of the foundation pit causes the overall sliding of the soil outside the pit, which results in the horizontal displacement of the soil towards the pit. Due to the blocking action of the diaphragm wall, the soil at the contact zone with the diaphragm wall is uplifted. Furthermore, as Figure 7c demonstrated, since the soil outside the pit is mainly saturated soft soil, it forms concave and convex deformation characteristics in vertical direction under the action of horizontal moving stress.

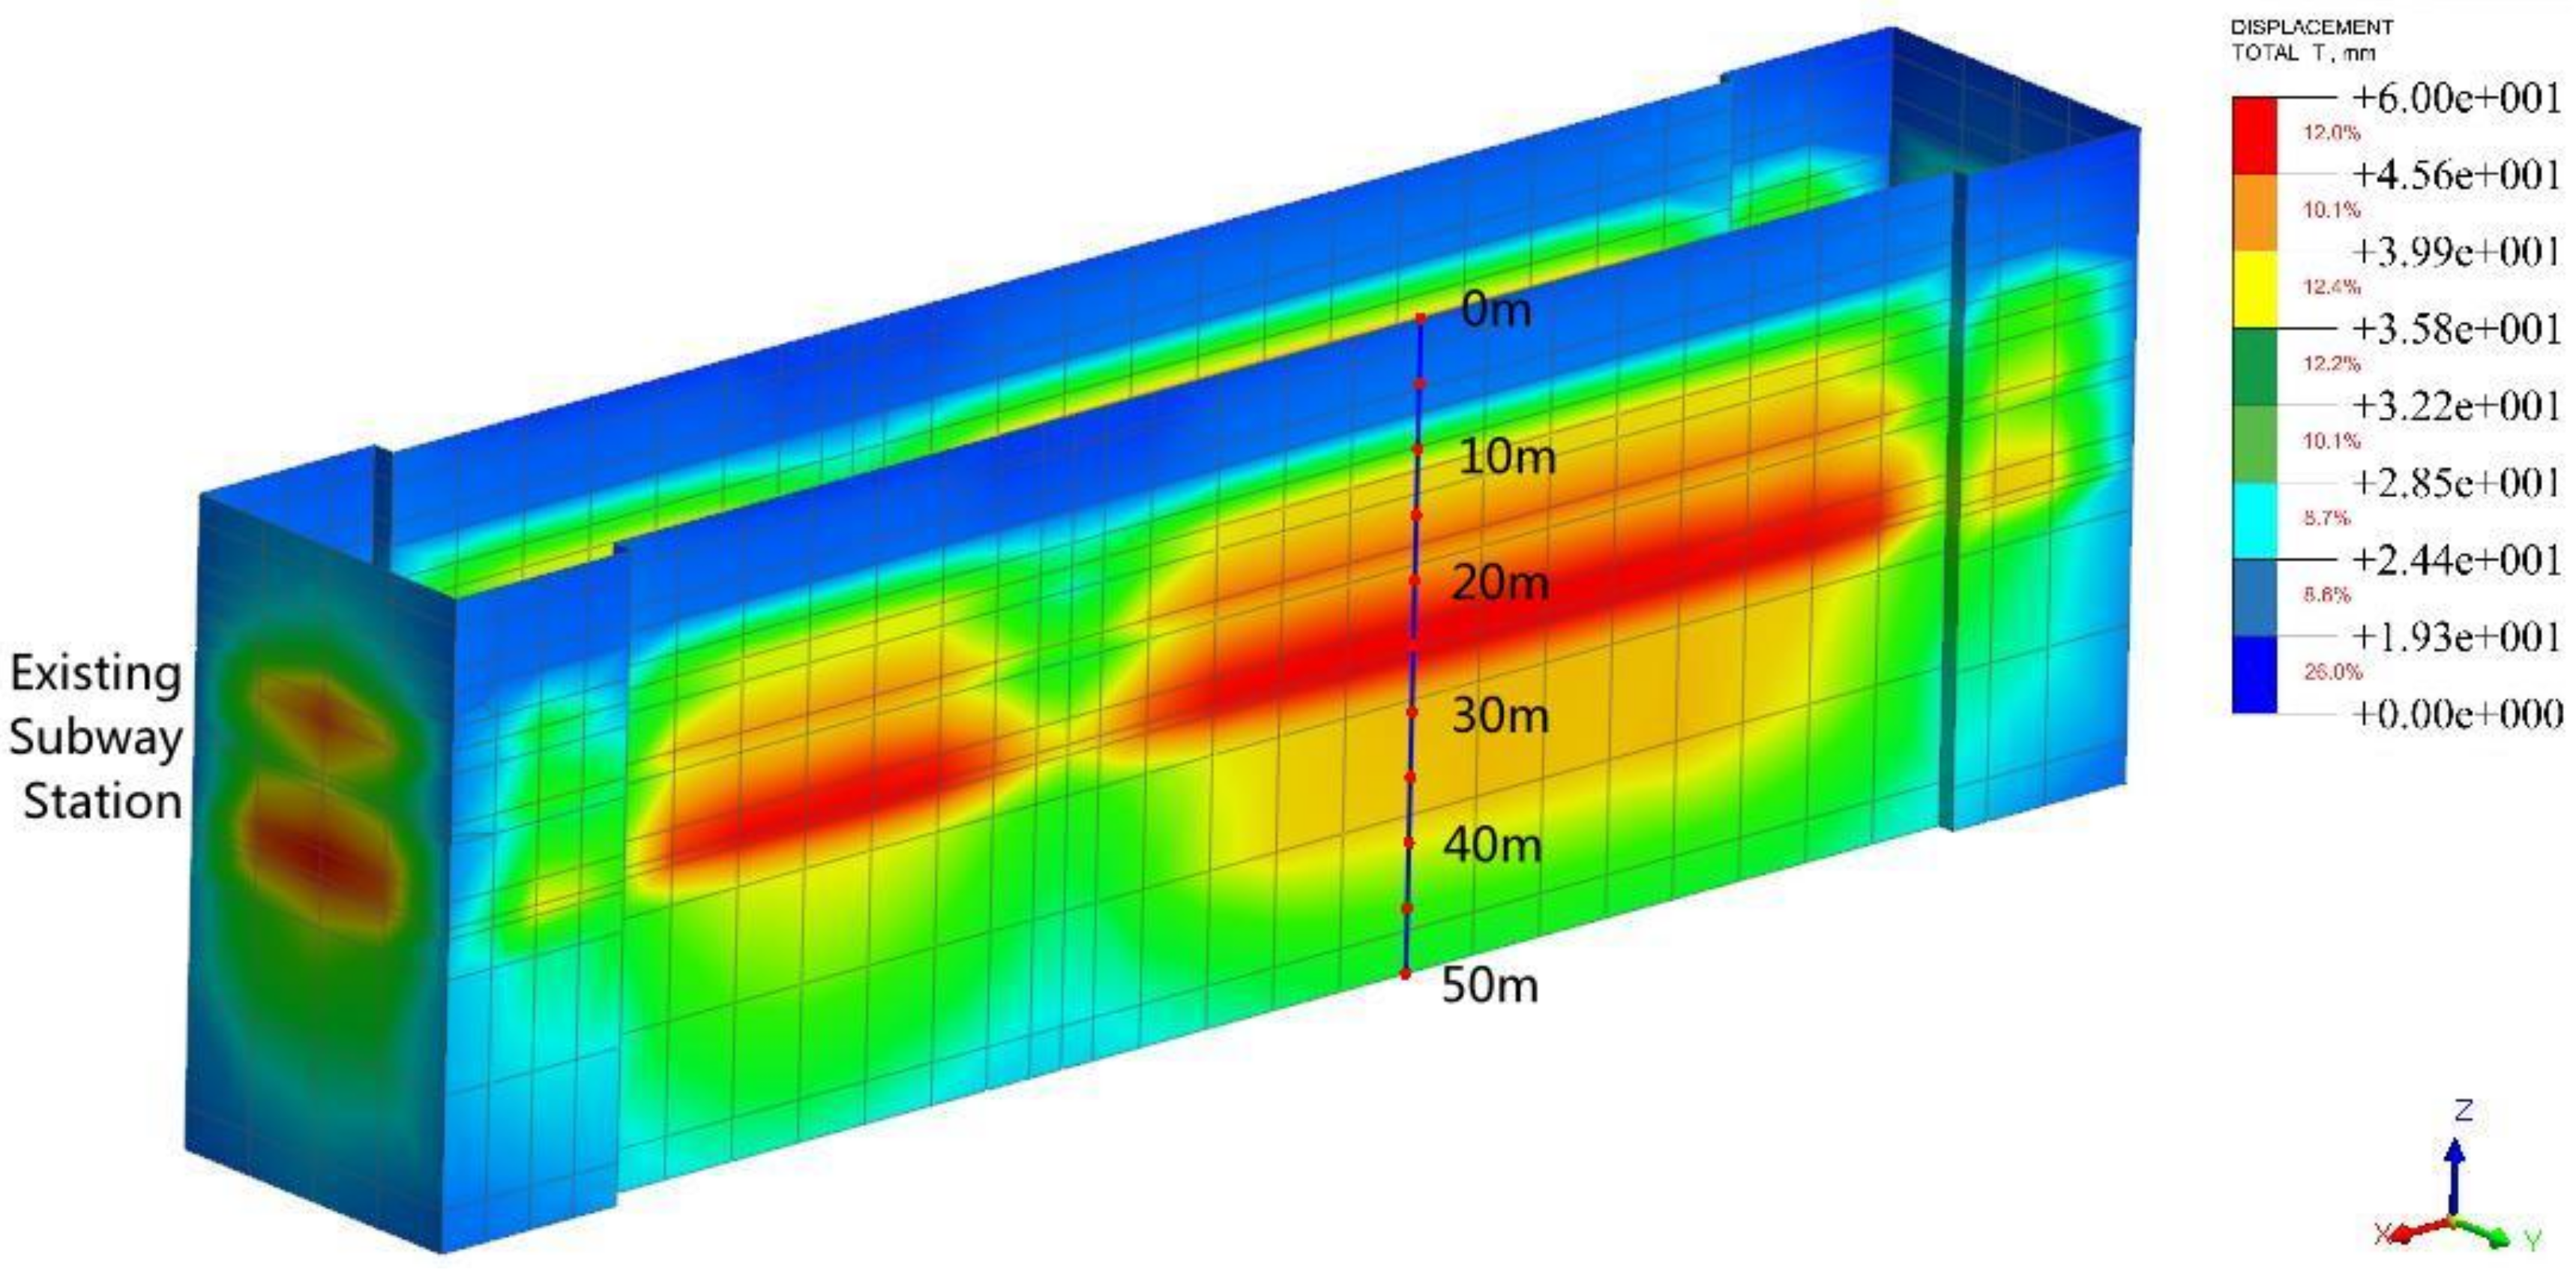
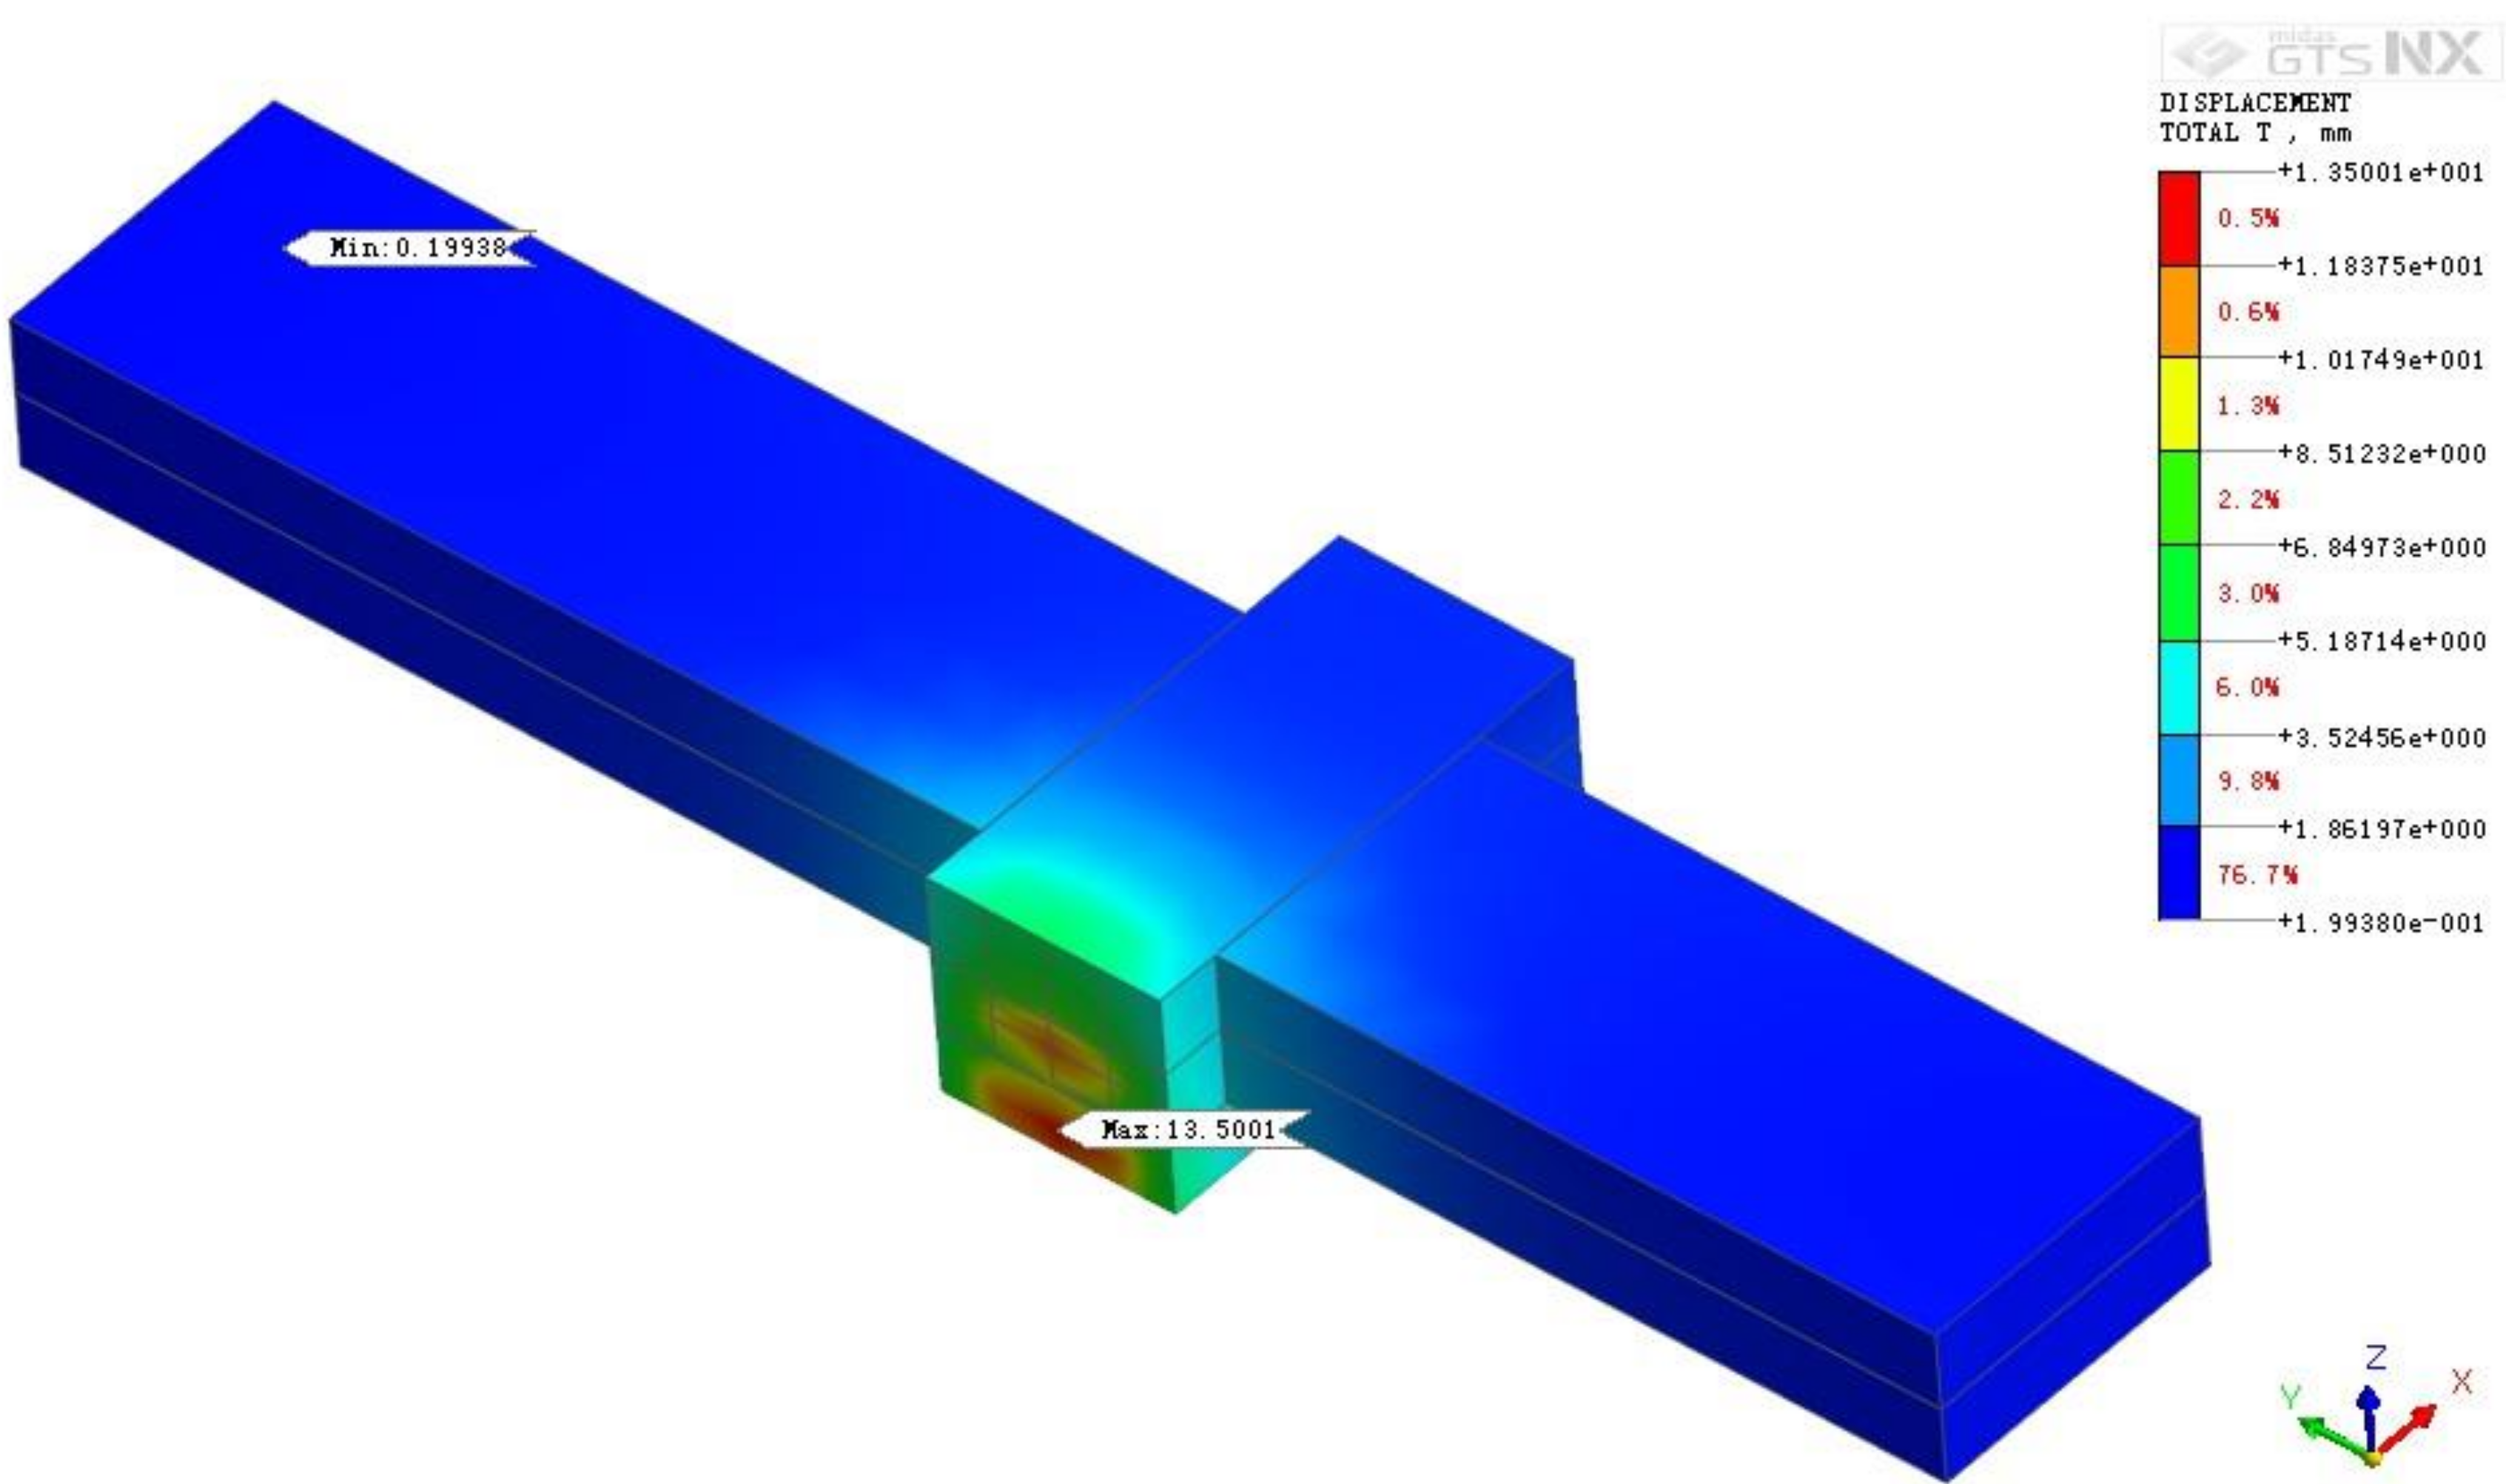
4.3. Deformation Impact on the Adjacent Subway Station Caused by Excavation

The foundation pit under construction and the adjacent existing subway station are separated by the diaphragm wall, which is in contact with the sidewall panel of the existing subway station. Figure 8 reflects the deformation characteristics of the existing subway station in the final excavation stage. It can be seen from the figure that the excavation of the foundation pit has little influence on the deformation of the existing subway station except for the side wall of the transfer section. The excavation deformation of the existing station is limited within a 10 m range of the sidewall, and the deformation decreases to less than 1 mm when the range is greater than 10 m.
Figure 9 reflects the deformation characteristics of the sidewall in each stage. It can be seen from the figure that the horizontal displacement of the sidewall increases gradually with the foundation pit excavation and reaches a maximum of 13.5 mm in the final stage. The maximum position is located at a depth of 26 m, which is within the tolerable range. Due to the existence of the baseplate of the existing station at a depth of 18 m, which acts as the horizontal support and offsets the horizontal displacement of the sidewalls, the displacement shows decreasing trend at this depth displacement. This phenomenon gives us the idea that setting horizontal bracing on the existing subway side wall can be regarded as a method to reduce deformation and ensure the safe operation of the station.

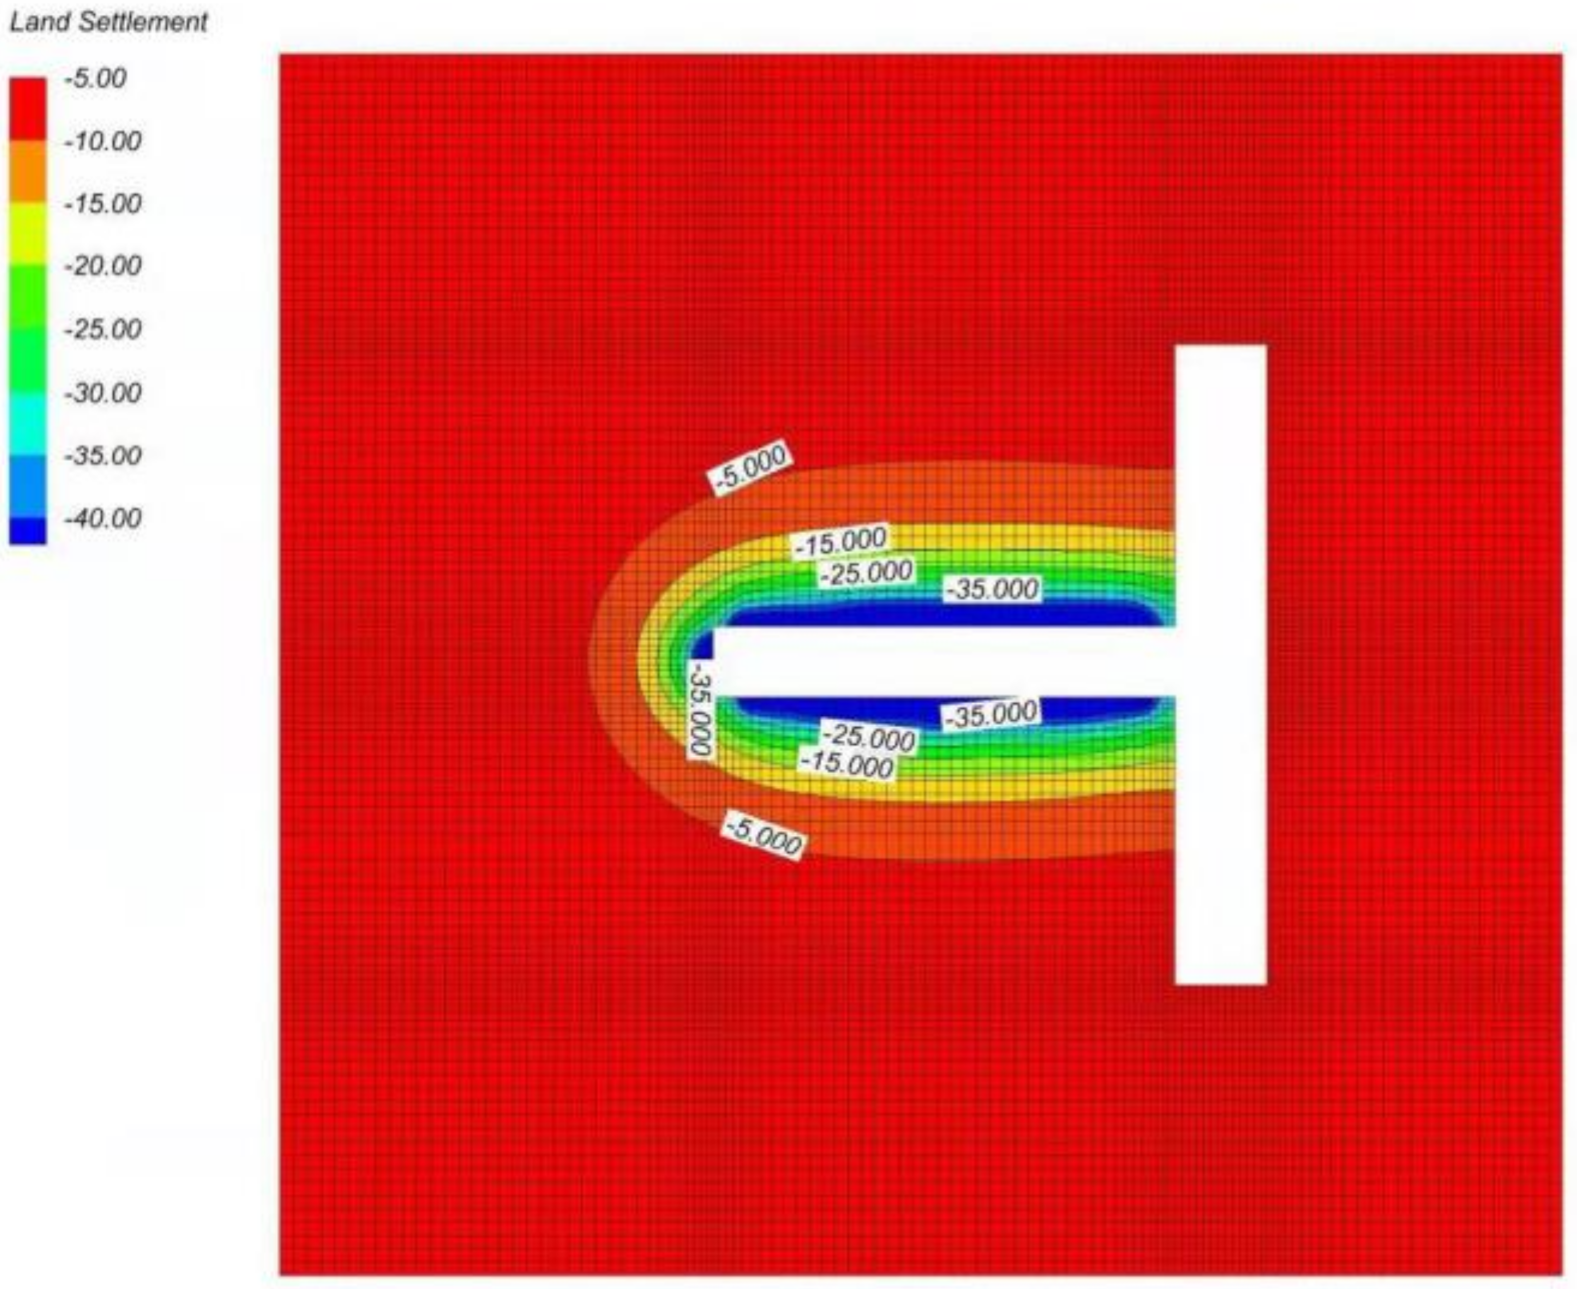
4.4. Dewatering Induced Settlement on Surrounding Land Surface

Figure 10 shows the contour map of the surface settlement in the final stage of the dewatering process. As is demonstrated in the map, within the range of 2–3 m from the edge of the foundation pit, the maximum surface settlement caused by dewatering accounts to 40 mm, in the range of 3H, with a settlement of about 5 mm. It can be concluded that simulation results reveal that the maximum influence range of dewatering settlement can go beyond the range of 3H and may have an impact on the surface buildings within the range of 3H.
As marked in Figure 6, two measurement points, DC6-1 and DC6-4, are selected as typical monitoring points to study the change law of the vertical displacement of the outer soil body during the excavation of the foundation pit. They are 18 m and 30 m away from the edge of the foundation pit, respectively. The monitoring and simulated results are plotted in Figure 11. It can be seen from the figure that the vertical displacement of soil outside the pit is mainly caused by the formation compression caused by dewatering, while the vertical displacement caused by the unloading of foundation pit excavation accounts for a small part. Figure 11 shows that the monitored values are larger than the sum of dewatering settlement and unloading displacement, which may be because the monitored values include vertical deformation components such as additional stress action caused by construction operations.

5. Discussion

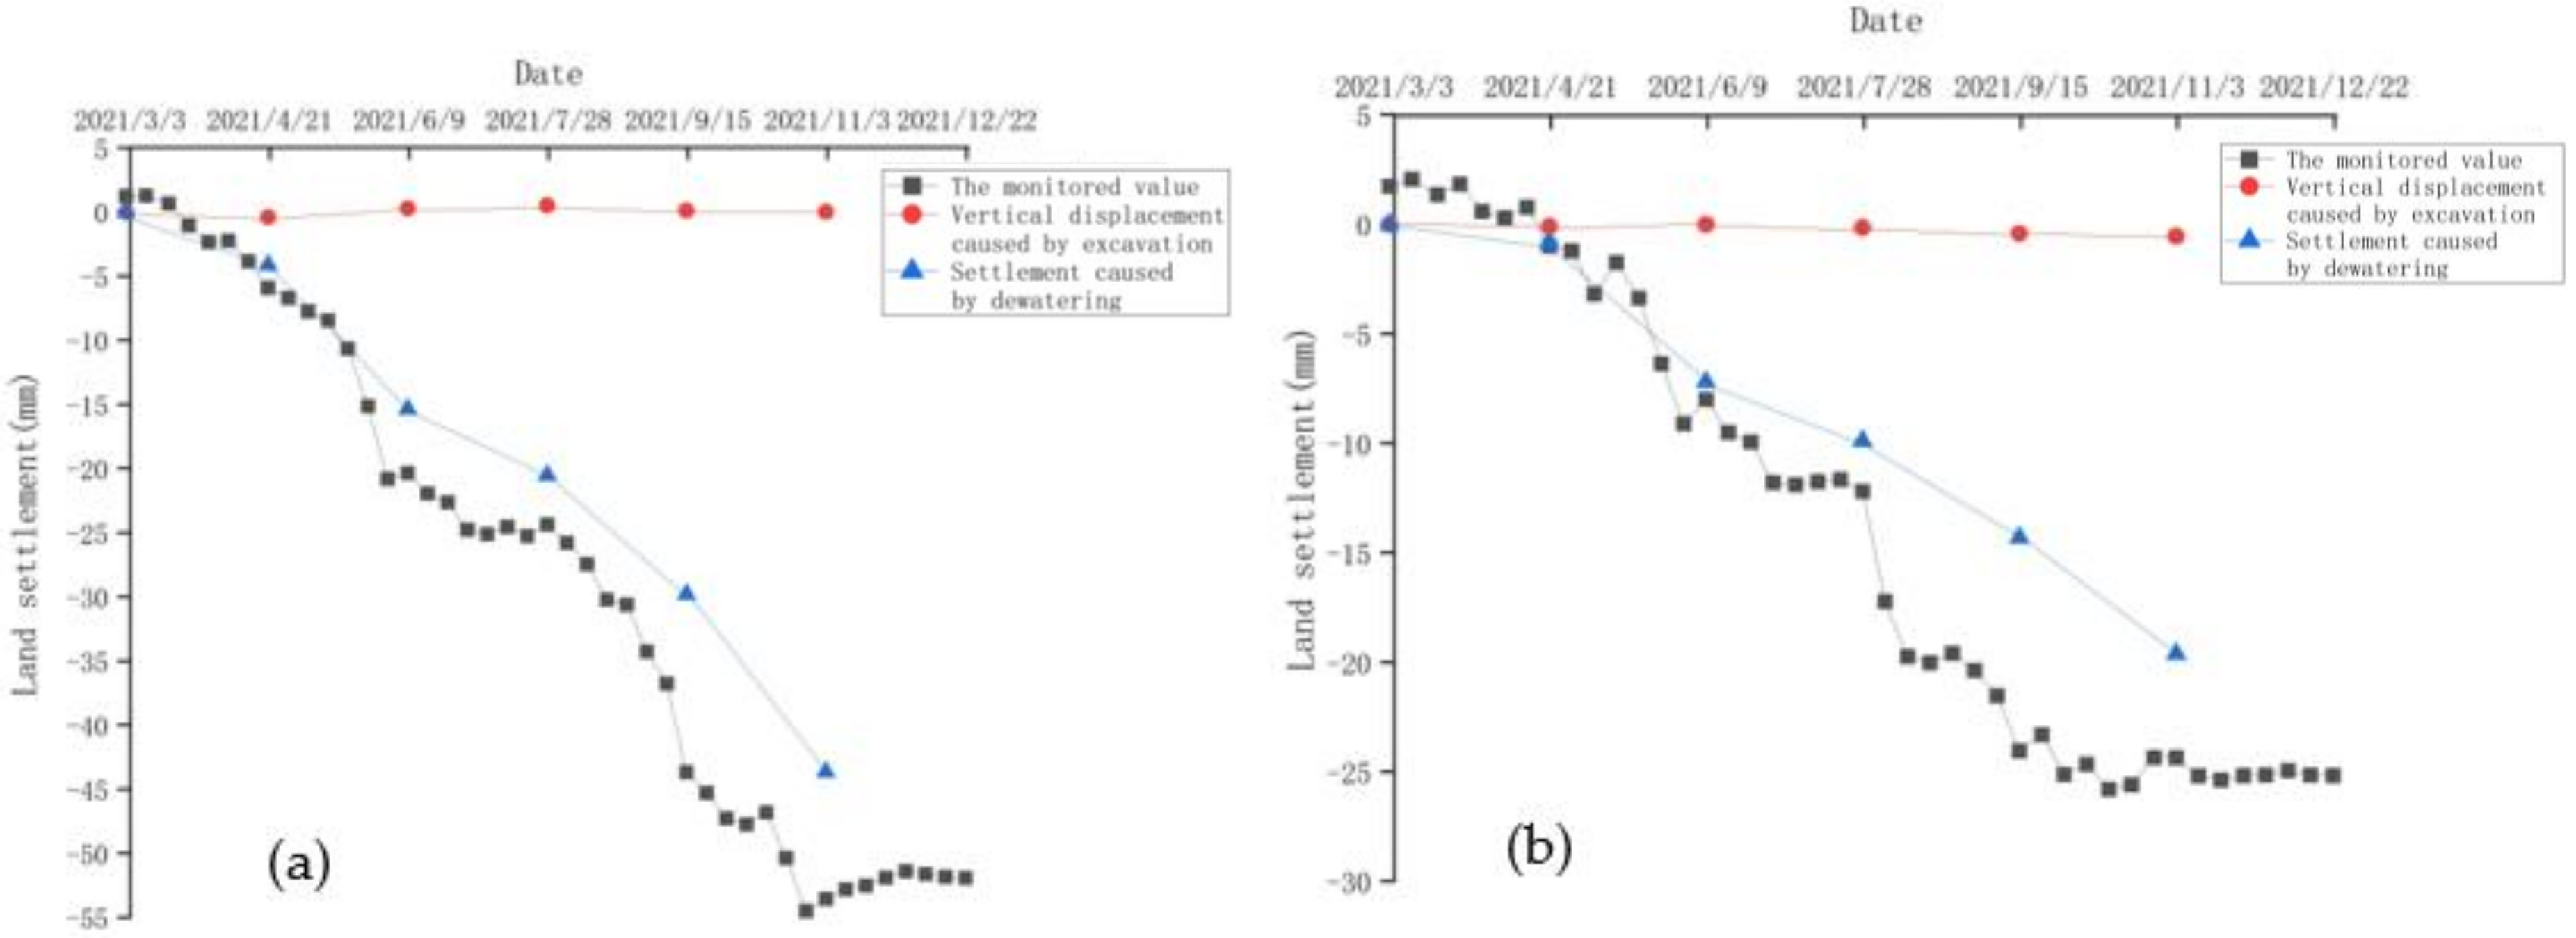
5.1. Analysis of Deformation Causation

From the above comparisons of the results from the numerical simulations and monitoring measurements, we can conclude that the causations of deformation in each part of the foundation pit are different. The maximum deformation occurs on the ground wall at the maximum excavation depth. The main reason for the deformation of the diaphragm wall is the stress action of soil sliding from outside to inside caused by excavation unloading of the foundation pit. The soil deformation outside the pit has many causations and movement directions, such as compressional settlement and swelling in vertical directions and displacement in horizontal directions. However, the main component of deformation is compressive deformation caused by dewatering, accounting for more than 90% of the whole deformation. The impact of foundation pit excavation on the adjacent existing station is mainly located at the side wall, and it has little influence on other parts of the station. The main mode of influence is the deformation of the pit wall in contact with the sidewall of the existing subway station.

5.2. The Control Countermeasure of Deformation

We can summarize the control countermeasures into below five categories:
(1)
High quality diaphragm wall construction
The diaphragm wall has dual functions, which work as the vertical retaining structure of the foundation pit and as the waterproof structure. Many foundation pit accidents are caused by water leakage of the diaphragm wall, subsidence outside the pit, and damage of the facilities inside the pit [29,30]. Suitable thickness and insertion depth in the layers, especially high-quality waterproof joints, are the key aspect to prevent the deformation of the diaphragm wall itself and soil outside the pit.
(2)
Control of water level in the foundation pit
The simulation results show that the change of water level in the foundation pit dramatically influences the water level drawdown and compression settlement outside the foundation pit. In order to reduce the soil compression outside the foundation pit, the water level in each stage should be controlled 1–2 m below the excavation depth. This water level depth not only ensures normal construction operation but also minimizes the water level drawdown in the pit.
(3)
Horizontal support construction
The simulation results show that the deformation of the diaphragm wall always occurs in the deepest part of each excavation stage. Therefore, before the next stage of excavation, timely construction of the horizontal support at the current stage is the key to prevent excessive deformation of the diaphragm wall.
(4)
Optimal construction of foundation pit bottom floor
The numerical simulation results show that the last stage of foundation pit excavation is the stage of the largest deformation of the pit bottom and the stage of the largest drop of groundwater level. At this stage, the construction method of small area excavation should be adopted. Every time a piece of soil layer is excavated, the place should be cast with cement in time to minimize the uplift of the foundation bottom floor and the influx of groundwater into the foundation pit.
(5)
Side wall protection of existing subway station
The calculation results from the model show that the designed construction method cannot completely eliminate the influence of foundation pit excavation on the existing subway. It is, therefore, suggested that the deformation monitoring of the existing subway side wall should be strengthened during construction, and the horizontal support should be set on the side wall if the deformation is too large.

6. Conclusions

Based on the above results and discussion, a number of important quantifications with following concluding points can be summarized:
  • By comparing the simulation results with the actual monitoring data, it was found that the integrated dewatering-excavation process numerical simulation method can accurately reflect the deformation characteristics of the foundation pit excavation process. The research method in this paper can be used for the deformation research of similar projects in the future.
  • The deformation of the foundation pit diaphragm wall occurs in the deepest part of each stage of excavation, and the deformation increases with the increase of excavation depth.
  • The surface deformation caused by foundation pit excavation is small, and the influence range is within 2H distance.
  • The impact of foundation pit excavation on the existing subway station is limited to the T-shaped transfer station, with little impact on other areas of the station.
  • The main cause of surface settlement and building settlement around the foundation pit is the dewatering process, and its influence range may be beyond 3H distance.
  • Constructing a high-quality diaphragm wall, controlling the water level within the excavation foundation pit, strengthening the monitoring, and timely cement pouring of the bottom plate are key countermeasures to reduce the deformation.

Author Contributions

Conceptualization, Y.Z. and L.Y.; methodology, L.Y. and Y.Y.; validation, L.Z., Y.Y. and L.Y.; formal analysis, Y.Y. and L.Y.; investigation, Y.Y., X.H. and H.L.; resources, Y.Z. and H.M.; data curation, H.L., X.H., H.M. and Y.Y.; writing—original draft preparation, L.Y. and Y.Y.; writing—review and editing, L.Z. and L.Y.; supervision, Y.Z. and H.L.; project administration, H.L. and H.M.; funding acquisition, Y.Z. All authors have read and agreed to the published version of the manuscript.

Funding

This research was funded by China Communications Construction Company (CCCC) First Highway Engineering Group Co. Ltd. (2021-KJYF-B-11).

Institutional Review Board Statement

Not applicable.

Informed Consent Statement

Not applicable.

Data Availability Statement

Not applicable.

Acknowledgments

This research was funded by China Communications Construction Company (CCCC) First Highway Engineering Group Co. Ltd. (2021-KJYF-B-11).

Conflicts of Interest

The authors declare no conflict of interest.

References

  1. Ye, S.; Zhao, Z.; Wang, D. Deformation analysis and safety assessment of existing metro tunnels affected by excavation of a foundation pit. Undergr. Space 2021, 6, 421–431. [Google Scholar] [CrossRef]
  2. Chen, F.Y.; Wang, L.; Zhang, W.G. Reliability assessment on stability of tunnelling perpendicularly beneath an existing tunnel considering spatial variabilities of rock mass properties. Tunn. Undergr. Space Technol. 2019, 88, 276–289. [Google Scholar] [CrossRef]
  3. Mangushev, R.A.; Osokin, A.I.; Garnyk, L.V. Experience in preserving adjacent buildings during excavation of large foundation pits under conditions of dense development. Soil Mech. Found. Eng. 2016, 53, 291–297. [Google Scholar] [CrossRef]
  4. Goh, A.T.C.; Zhang, F.; Zhang, W.G.; Zhang, Y.M.; Liu, H.L. A simple estimation model for 3D braced excavation wall deflection. Comput. Geotech. 2017, 83, 106–113. [Google Scholar] [CrossRef]
  5. Xu, P.; Han, Y.; Duan, H.; Fang, S. Environmental Effects Induced by Deep Subway Foundation Pit Excavation in Yellow River Alluvial Landforms. Geotech. Geol. Eng. 2015, 33, 1587–1594. [Google Scholar] [CrossRef]
  6. Chang, C.T.; Sun, C.W.; Duann, S.W.; Hwang, R.N. Response of a Taipei rapid transit system (TRTS) tunnel to adjacent excavation. Tunn. Undergr. Space Technol. 2001, 16, 151–158. [Google Scholar] [CrossRef]
  7. Zhang, W.G.; Wang, W.; Zhou, D.; Zhang, R.; Goh, A.T.C.; Hou, Z. Influence of groundwater drawdown on excavation responses –A case history in Bukit Timah granitic residual soils. J. Rock Mech. Geotech. Eng. 2018, 10, 856–864. [Google Scholar] [CrossRef]
  8. Wang, Y.; Zhang, Y.; Li, M.; Qi, Y.; Ma, T. A Numerical Investigation of the Deformation Mechanism of a Large Metro Station Foundation Pit under the Influence of Hydromechanical Processes. Geofluids 2021, 2021, 5536137. [Google Scholar] [CrossRef]
  9. Wang, J.; Wu, Y.; Liu, X.; Yang, T.; Wang, H.; Zhu, Y. Areal subsidence under pumping well–curtain interaction in subway foundation pit dewatering: Conceptual model and numerical simulations. Environ. Earth Sci. 2016, 75, 198. [Google Scholar] [CrossRef]
  10. Søren, D.E.; Per, T.; Jørgen, K.; Trine, H.V. Guidelines for tunnelling risk management: International Tunnelling Association, Working Group No. 2. Tunn. Undergr. Space Technol. 2004, 19, 217–237. [Google Scholar] [CrossRef]
  11. Shen, Y.; Wang, P.; Li, M.; Mei, Q. Application of Subway Foundation Pit Engineering Risk Assessment: A Case Study of Qingdao Rock Area, China. J. Civ. Eng. 2019, 23, 4621–4630. [Google Scholar] [CrossRef]
  12. Liu, W.; Zhao, T.S.; Zhou, W.; Tang, J.J. Safety risk factors of metro tunnel construction in China: An integrated study with EFA and SEM. Saf. Sci. 2018, 105, 98–133. [Google Scholar] [CrossRef]
  13. Yu, Y.; Wu, K.; Cui, S.; Zhang, Q.; Zhao, J.; Zhang, Z. Deformation Characteristics Analysis of Supporting Structure Caused by Deep Excavation of Large-Span Subway Parking Lot in Deep Silt Stratum. Indian Geotech. J. 2019, 49, 519–530. [Google Scholar] [CrossRef]
  14. Zhou, Z.; Chen, S.; Tu, P.; Zhang, H. An analytic study on the deflection of subway tunnel due adjacent excavation of foundation pit. J. Mod. Transport. 2015, 23, 287–297. [Google Scholar] [CrossRef] [Green Version]
  15. Gao, W.; Li, H.; Wan, W.; Zhang, A. The case study of a deep pit excavation above multiple metro tunnels and influential factors analysis on tunnel upheaval behaviors. Int. J. Eng. Technol. 2017, 9, 374–377. [Google Scholar]
  16. Liu, X.; Jian, J. Experiment and study on unloading rebound control of foundation pit above metro tunnel underground engineering and tunnels. Dixia Gongcheng Yu Suidao 2008, 2, 41–44. [Google Scholar]
  17. Zhou, N.; Vermeer, P.A.; Lou, R.; Tang, Y.; Jiang, S. Numerical simulation of deep foundation pit dewatering and optimization of controlling land subsidence. Eng. Geol. 2010, 114, 251–260. [Google Scholar] [CrossRef]
  18. Yuan, C.; Hu, Z.; Zhu, Z.; Yuan, Z.; Fan, Y.; Guan, H.; Li, L. Numerical Simulation of Seepage and Deformation in Excavation of a Deep Foundation Pit under Water-Rich Fractured Intrusive Rock. Geofluids 2021, 2021, 6628882. [Google Scholar] [CrossRef]
  19. Wang, J.X.; Hu, L.S.; Wu, L.G.; Tang, Y.Q.; Zhu, Y.F.; Yang, P. Hydraulic barrier function of the underground continuous concrete wall in the pit of Metro station and its optimization. Environ. Geol. 2009, 57, 447–453. [Google Scholar] [CrossRef]
  20. Luo, Z.; Zhang, Y.; Wu, Y. Finite element numerical simulation of three dimensional seepage control for deep foundation pit dewatering. J. Hydrodyn. 2008, 20, 596–602. [Google Scholar] [CrossRef]
  21. Zhang, J.; Xie, R.; Zhang, H. Mechanical response analysis of the buried pipeline due to adjacent foundation pit excavation. Tunn. Undergr. Space Technol. 2018, 78, 135–145. [Google Scholar] [CrossRef]
  22. Hsieh, P.-G.; Ou, C.-Y. Shape of ground surface settlement profiles caused by excavation. Can. Geotech. J. 1998, 35, 1004–1017. [Google Scholar] [CrossRef]
  23. Zhang, D.D. Coupled numerical simulation research on dewatering and land subsidence in deep foundation pit. Appl. Mech. Mater. 2013, 275–277, 1549–1552. [Google Scholar] [CrossRef]
  24. Zhang, L.; Zhou, X.; Pan, Y.; Zeng, B.; Zhu, D.; Jiang, H. Design of Groundwater Extraction in Open Cut Foundation Pit and Simplified Calculation of Ground Subsidence due to Dewatering in Sandy Pebble Soil Strata. Adv. Civ. Eng. 2020, 25, 1046937. [Google Scholar] [CrossRef]
  25. Geotechnical Engineering Investigation Report of Heiniucheng Road Station, Tianjin Subway Line 11 (Detailed Investigation); Contract Technical Report; Tianjin Geological Survey Institute: Tianjin China, 2018.
  26. MIDAS Geotechnical, Tunnel Analysis System; MIDAS Information Technology China Co., Ltd.: Beijing, China, 2014.
  27. Harbaugh, A.W.; McDonald, M.G. User’s Documentation for MODFLOW-96, an Update to the U.S. Geological Survey Modular Finite-Difference Ground-Water Flow Model; U.S. Geological Survey Open-File Report 96-485; U.S. Geological Survey: Washington, DC, USA, 1996.
  28. Ministry of Housing and Urban-Rural Development of the People’s Republic of China (MOHURD). Technical Code for Groundwater Lower in Engineering in Building and Municipal (TCGLEBM) (JGJ/T111-98); China Architecture & Building Press: Beijing, China, 1999. [Google Scholar]
  29. Li, F.; Du, X.; Zhang, M. Statistical Analysis of Accidents in Metro Construction. Chin. J. Undergr. Space Eng. 2014, 10, 474–479, (In Chinese Attached English Abstract). [Google Scholar]
  30. Hou, Y.; Zhang, D.; Li, P. Analysis and Control Measures of Safety Accidents in Beijing Subway Construction. J. Beijing Jiaotong Univ. 2009, 3, 52–59. [Google Scholar]
Figure 1. Study area location and layout.
Water 14 00535 g001
Figure 2. MIDAS/GTS numerical simulation model build-up.
Water 14 00535 g002
Figure 3. 3-D dewatering model based on MODFLOW numerical model.
Water 14 00535 g003
Figure 4. The accumulation deflections of the diaphragm wall in the five-excavation stage.
Water 14 00535 g004
Figure 5. Calculated (black) and measured (red) horizontal displacement curves of middle section of the diaphragm wall.
Water 14 00535 g005
Figure 6. The contour map of accumulated surface displacement deformation.
Water 14 00535 g006
Figure 7. Simulated land surface displacement caused by the excavation at each stage: (a) the total displacement, (b) horizontal displacement, (c) vertical displacement.
Water 14 00535 g007
Figure 8. The deformation map of the existing subway station in the final excavation stage.
Water 14 00535 g008
Figure 9. The deformation map of the existing station in each stage: (a) Horizontal displacement contour of the side wall; (b) Horizontal displacement curves of middle section of the side wall.
Water 14 00535 g009
Figure 10. The contour map of surface settlement in the final stage of dewatering process.
Water 14 00535 g010
Figure 11. Vertical displacement at the two special monitoring points: (a) DC6-1 and (b) DC6-4.
Water 14 00535 g011
Table 1. Strata and their physical and mechanical properties.
Strata
Serial
Name of
Soil Layer
Layer
Thickness (m)
Depth of Layer
Bottom (m)
Bulk Density
γ (KN/m3)
Modulus of Elasticity
E (MPa)
Cohesion
C (kPa)
Friction Angle
Φ (°)
①1mixed fill layer2.22.219.53.851813
④1silt clay3.25.419.45.7312.416.4
⑥3clay silt3.99.319.49.898.124.5
⑥4silty clay4.413.718.55.341215.2
⑦1silty clay1.815.519.75.2611.316.1
⑧2Sandy silt5.721.319.910.769.924.1
⑨1clay silt7.929.219.75.6113.117.3
⑩1Sandy silt3.933.120.76.2612.217.7
⑪1silty fine sand17.650.720.36.6116.517.6
⑫1silty clay6.35720.36.9220.718.8
⑬1Sandy silt12.169.120.27.3420.118.9
Table 2. Permeability parameters of soil layers.
AquiferSub Soil
Serial
Thickness (m)Depth of Layer
Bottom (m)
Horizontal Hydraulic Conductivity Kh (cm/s)Vertical Hydraulic Conductivity Kv (cm/s) Specific Storage Ss (1/m)Depth of Water Level (m)
Phreatic aquife①1, ④15.45.44.5 × 10−52.1 × 10−50.050.5
Aquitard⑥3, ⑥48.313.74.4 × 10−81.4 × 10−85.0 × 10−7
First confined
aquifer
⑦1, ⑧27.521.34.5 × 10−42.5 × 10−44.2 × 10−53.3
Aquitard⑨17.929.25.7 × 10−81.4 × 10−85.0 × 10−7
Second confined
aquifer
⑩1, ⑪121.550.76.7 × 10−43.7 × 10−46.3 × 10−54
Aquitard⑫16.3575.7 × 10−81.4 × 10−85.0 × 10−7
Third confined
aquifer
⑬112.169.18.4 × 10−44.2 × 10−46.3 × 10−54.5
Table 3. Pre-defined construction scheme and the calculation stages of the foundation pit excavation.
Calculate StageConstruction SequenceThe Time PeriodThe Water Level Depth of the Foundation Pit
0the diaphragm wall construction26 January 2021–3 March 2021
Initial stageGenerate the initial stress field, reset displacement to zeroStart head
1Excavation to 7.2 m in depth4 March 2021–21 April 20218.2 m
2Excavation to 13.4 m in depth22 April 2021–9 June 202114.4 m
3Excavation to 18.8 m in depth10 June 2021–28 July 202119.8 m
4Excavation to 23.2 m in depth29 July 2021–16 September 202124.2 m
5Excavation to 26 m in depth17 September 2021–13 November 202127 m
Publisher’s Note: MDPI stays neutral with regard to jurisdictional claims in published maps and institutional affiliations.

