
Design of Desanding Facilities for Hydropower Schemes Based on Trapping Efficiency


1
Spiekermann Ingenieure Gmbh, Water and Environment, 40547 Duesseldorf, Germany
2
Laboratory of Hydraulics, Hydrology and Glaciology (VAW), ETH Zurich, 8093 Zurich, Switzerland
*
Author to whom correspondence should be addressed.
Water 2022, 14(4), 520; https://doi.org/10.3390/w14040520
Submission received: 30 December 2021
/
Revised: 27 January 2022
/
Accepted: 3 February 2022
/
Published: 9 February 2022
(This article belongs to the Special Issue Advances and Challenges in Hydropower)
Abstract
:Turbine wear caused by hydro-abrasion due to suspended sediment in the turbine water has a negative impact on the power production and revenue of hydropower schemes. Efficiency of desanding facilities that reduce suspended sediment load ahead of turbines is key to limiting hydro-abrasion. Existing facilities built according to common design approaches often show lack of performance, in particular under non-ideal site-specific inlet and outlet conditions. Consequently, a new design concept that allows for the optimized design of desanding facilities at hydropower schemes has been developed based on prototype field measurements and CFD modeling. The effects of facility layout and components, such as tranquilizing racks, transition zone and outflow weir and related design parameters on the flow field and involved particle settling have been investigated in a comprehensive numerical model study. Hence, length adjustment terms were deduced from resulting changes in trapping efficiency, which allow for the estimation of the required basin length and an optimized facility layout. Compared to design approaches considering linear settling trajectories of sediment particles, the proposed procedure leads to longer settling basins in general and thus to increased trapping efficiencies of desanding facilities. Furthermore, the findings about the effect of specific facility components may allow for the optimisation of existing desanding facilities in an economical way.
1. Introduction
Suspended mineral sediments in the turbine water may damage components of hydropower schemes. In particular, turbines used in medium- and high-head configurations can be subject to hydro-abrasion. This may result in wear, which leads to a considerable efficiency reduction [1] and has substantial drawbacks, e.g., frequent operational interruptions in overhauling or replacing turbines and reduced energy production, each accompanied by financial loss. Economic and reliable desanding facility operation has become increasingly important with regard to efficient hydropower production as a renewable energy source. This is a challenge particularly in Europe because meltdown water discharge and sediment yield from glaciated catchments will increase due to glacial retreat [2].
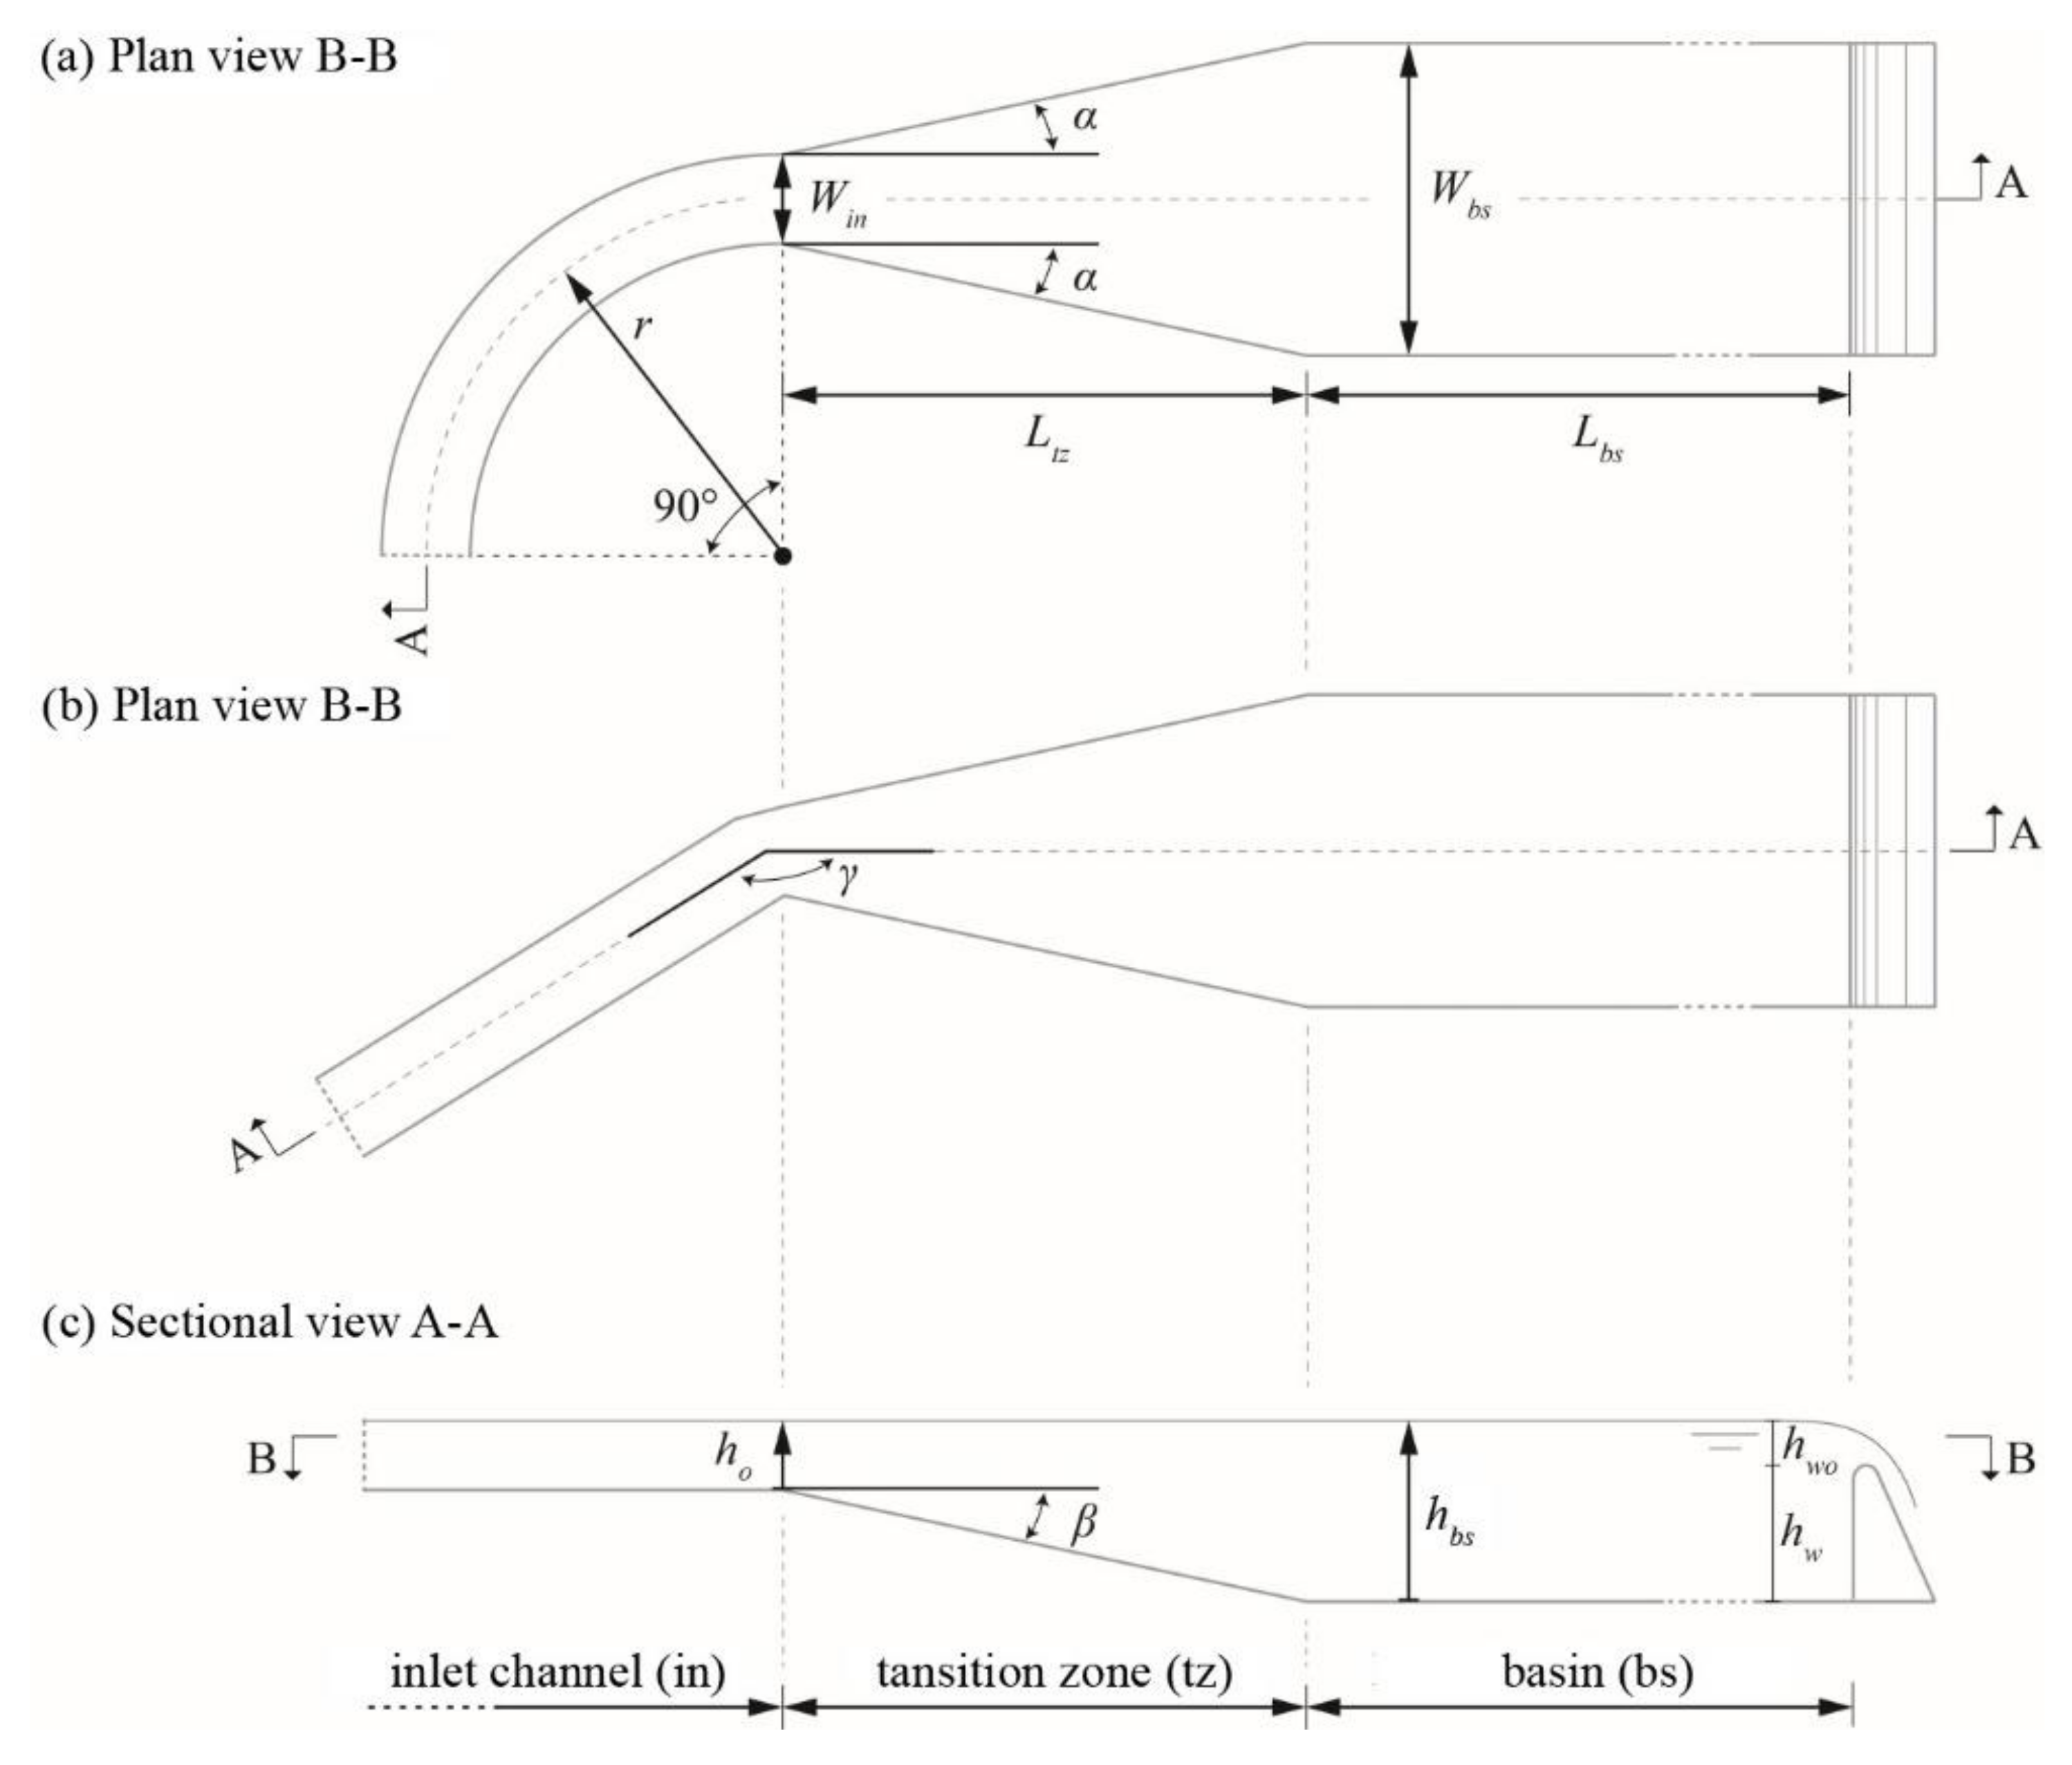
Desanding facilities are typically placed between the water intake and the penstock, and reduce the load and mean particle size of suspended sediments in the turbine water and thus limiting hydro-abrasive wear of hydro-mechanical equipment. In principle, desanding facilities are composed of (i) an inlet channel, (ii) a transition zone (defined by horizontal and vertical expansion angles), (iii) a basin and (iv) a weir to impound the flow at the basin end (Figure 1). In the basin, the flow is retarded, allowing sediment particles to sink and settle on the basin bed from where they are intermittently or continuously flushed.
Desanding facility design is commonly based on the work of Camp [3], hereinafter called the classical design approach. It presumes linear settling trajectories of all sediment particles larger than a given critical diameter dcr depending on mean longitudinal basin flow velocity and still-water settling velocity. Garde et al. [4] used their own and third party experimental data to propose a relationship between trapping efficiency and the ratio of basin length to basin depth. The accuracy of the proposed approach is stated to be within ±50%. Ortmanns and Minor [5] measured vertical flow velocity fluctuations in the basins of three facilities and proposed a settling velocity retardation term that includes geometric and hydraulic parameters. However, application of this approach is limited to a small range of input parameters underlying the investigated prototype configurations. In contrary to the aforementioned approaches, Velikanov [6] suggests calculating the required basin length based on settling probabilities, resulting in slightly smaller basin lengths than with the classical approach. In principle, these approaches are reasonable, but solely (i) the settling basin and (ii) ideal boundary conditions (i.e., uniform, homogeneous approach flow and outlet flow) are considered, often diverting from prototype conditions. Hence, actual basin hydraulics may entail facility performance that is below design expectations, as is often encountered in prototype structures.
Trapping efficiency is a commonly used quantity to assess desanding facility performance. For known sediment concentrations at the facility inlet Cin (g/L) and outlet Cout (g/L), the concentration-related trapping efficiency becomes
To improve trapping efficiencies of desanding facilities, current design recommendations include transition zone and inlet channel geometries. Suggestions for horizontal and vertical expansion angles of the transition zone can be found in [7,8,9]. Further, [8,9] recommend choosing the inlet channel length to be at least ten times its mean width and to linearly align the inlet channel with the transition zone and basin to facilitate a homogenous basin approach flow. Despite these recommendations and prototype investigations [5,10,11] that show the basin flow field to be particularly site-specific, no integral approach exists that takes such specific facility configurations into account.
In the present contribution a guideline for an optimized design of desanding facilities for hydropower schemes including a new design concept is proposed. It takes approach flow conditions, transition zone geometry including tranquilizing racks and the characteristics of the weir at the basin outlet into account and therefore considers the desanding facility as an integral system. To this end, the CFD model described in Section 2 was validated using prototype data from Paschmann et al. [10,11]. The validated model was used to study the effect of controlling design parameters and facility components on trapping efficiency by a comparative parameter study. Consequently, the results of the model validation and the correlations of facility configuration and trapping efficiency derived from the parameter study are presented and discussed in Section 3. The proposed correlations allow the estimation of adjustment terms to reduce or increase the basic basin length. In Section 4, the findings are summarized in a guideline for an optimal design of efficient desanding facilities. This includes the introduction of the enhanced design concept with a step-by-step calculation procedure for the layout of desanding facilities with specified trapping efficiency and critical particle diameter. Last but not least, the application of the new procedure is demonstrated by an example.
2. Materials and Methods
2.1. Numerical Model
For the present investigation the CFD software FLOW-3D (www.flow3d.com, accessed on 9 November 2021) was applied. The model solves the Reynolds-averaged Navier–Stokes (RANS) equations in order to compute 3D turbulent flow. In a preliminary study, different common turbulence models, i.e., standard k-ε, RNG and k-ω, were tested for typical desander geometry and evaluated regarding flow field as well as suspended sediment transport and deposition [12]. The best results were obtained with the RNG model compared to the other turbulence models. This finding is supported by other researchers [13] who suggest that the RNG model is supposed to have a superior performance in cases with boundary layer separation, recirculating flows and diffuser stall. Consequently, the RNG model was used for all simulations in this study.
Suspended sediment transport of mixed-size, non-cohesive sediments is modeled as a continuous phase using an advection–diffusion equation, i.e., a scalar transport equation. In doing so, the suspended sediments are modeled by sediment concentration (the scalar), which is advected by the fluid flow field. This is a well-established approach [14] also applied for simulation of desanding facilities and water intakes [15,16]. Despite the considerably large mean concentrations observed in desanding facilities (up to more than 2 g/L, c.f. Section 3.1.2.), variation in fluid density is commonly relatively small. Thus, it is assumed that the variation in fluid density is negligible in all the terms in the RANS equations except the gravitational term (Boussinesq approximation).
Suspended sediment can settle on the basin bed, but deposited sediment can also be entrained into the fluid flow by resuspension. These processes depend on the still-water settling velocity, which reads according to Soulsby [17]
where = kinematic viscosity of water (m2 s−1), = sediment particle diameter (m), = dimensionless particle diameter (–), = gravitational acceleration (m s−2), ρs = sediment density (kg m−3) and ρf = fluid density (kg m−3). To account for the effects of particle–particle interaction on the settling velocity, the approach of Richardson and Zaki [18] is used in the model. Sediment entrainment (resuspension) is modeled as a function of excessive dimensionless shear stress and is calculated using the pick-up function of [19]. Here, the dimensionless critical Shields parameter can be set as constant or computed using the Soulsby–Whitehouse equation [17], and the dimensionless local bed shear stress is . The bed shear velocity is calculated from the law-of-the-wall velocity profile for turbulent flows [20],
where vw = flow velocity parallel to wall (m/s), κ = von Kármán constant (–), υ = kinematic viscosity of water (m2 s−1), and the bed surface roughness ks is assumed to be proportional to the local median grain diameter of packed bed sediment. The eddy viscosity is defined as
where k = turbulent kinetic energy (m2s−2) and ε = turbulent kinetic energy dissipation rate (m2s−3); both quantities are obtained by the turbulence model.
Bed-load transport of mixed-size, non-cohesive sediments is modeled by the approach of van Rijn [21], which is suitable for sediments consisting of silt and sand fractions. Thereby, the bed-load transport rate is defined as a function of excessive dimensionless shear stress and the saltation height. However, the preliminary study [12] showed that bed-load transport is of minor importance with regard to the settling process and trapping efficiency in desanding facilities. More details about the sediment transport model and the numerical model in general can be found in [22].
The spatial resolution of the computational grid and the related sensitivity of incorporated modeling approaches were studied for typical desander geometry with straight approach flow. The wall-normal extent of the first cell at side walls and bed was chosen with regard to an adequate value for a non-dimensional wall distance y+ for wall-bounded flows [22]. This results in a value of 3 and 5 cm at side walls and bed, respectively. For free-stream-region convergence of flow field (indicated by flow velocity magnitude and turbulent kinetic energy) and sediment transport (indicated by the mass of suspended and deposited sediment and cumulative sediment outflow) was studied at four different resolutions (number of cells: 117′000, 256′000, 488′000, 828′000), with cell sizes in Cartesian directions Δx = 0.1 to 0.33 m, Δy = 0.03 to 0.3 m and Δz = 0.05 to 0.34 m. In terms of deviation (difference from the result of the highest resolution) and computation time, the second-finest mesh resolution was chosen for the computational grid for the parameter study simulations. For more information on mesh senility analysis, see [23].
2.2. Modeling of Tranquilizing Racks
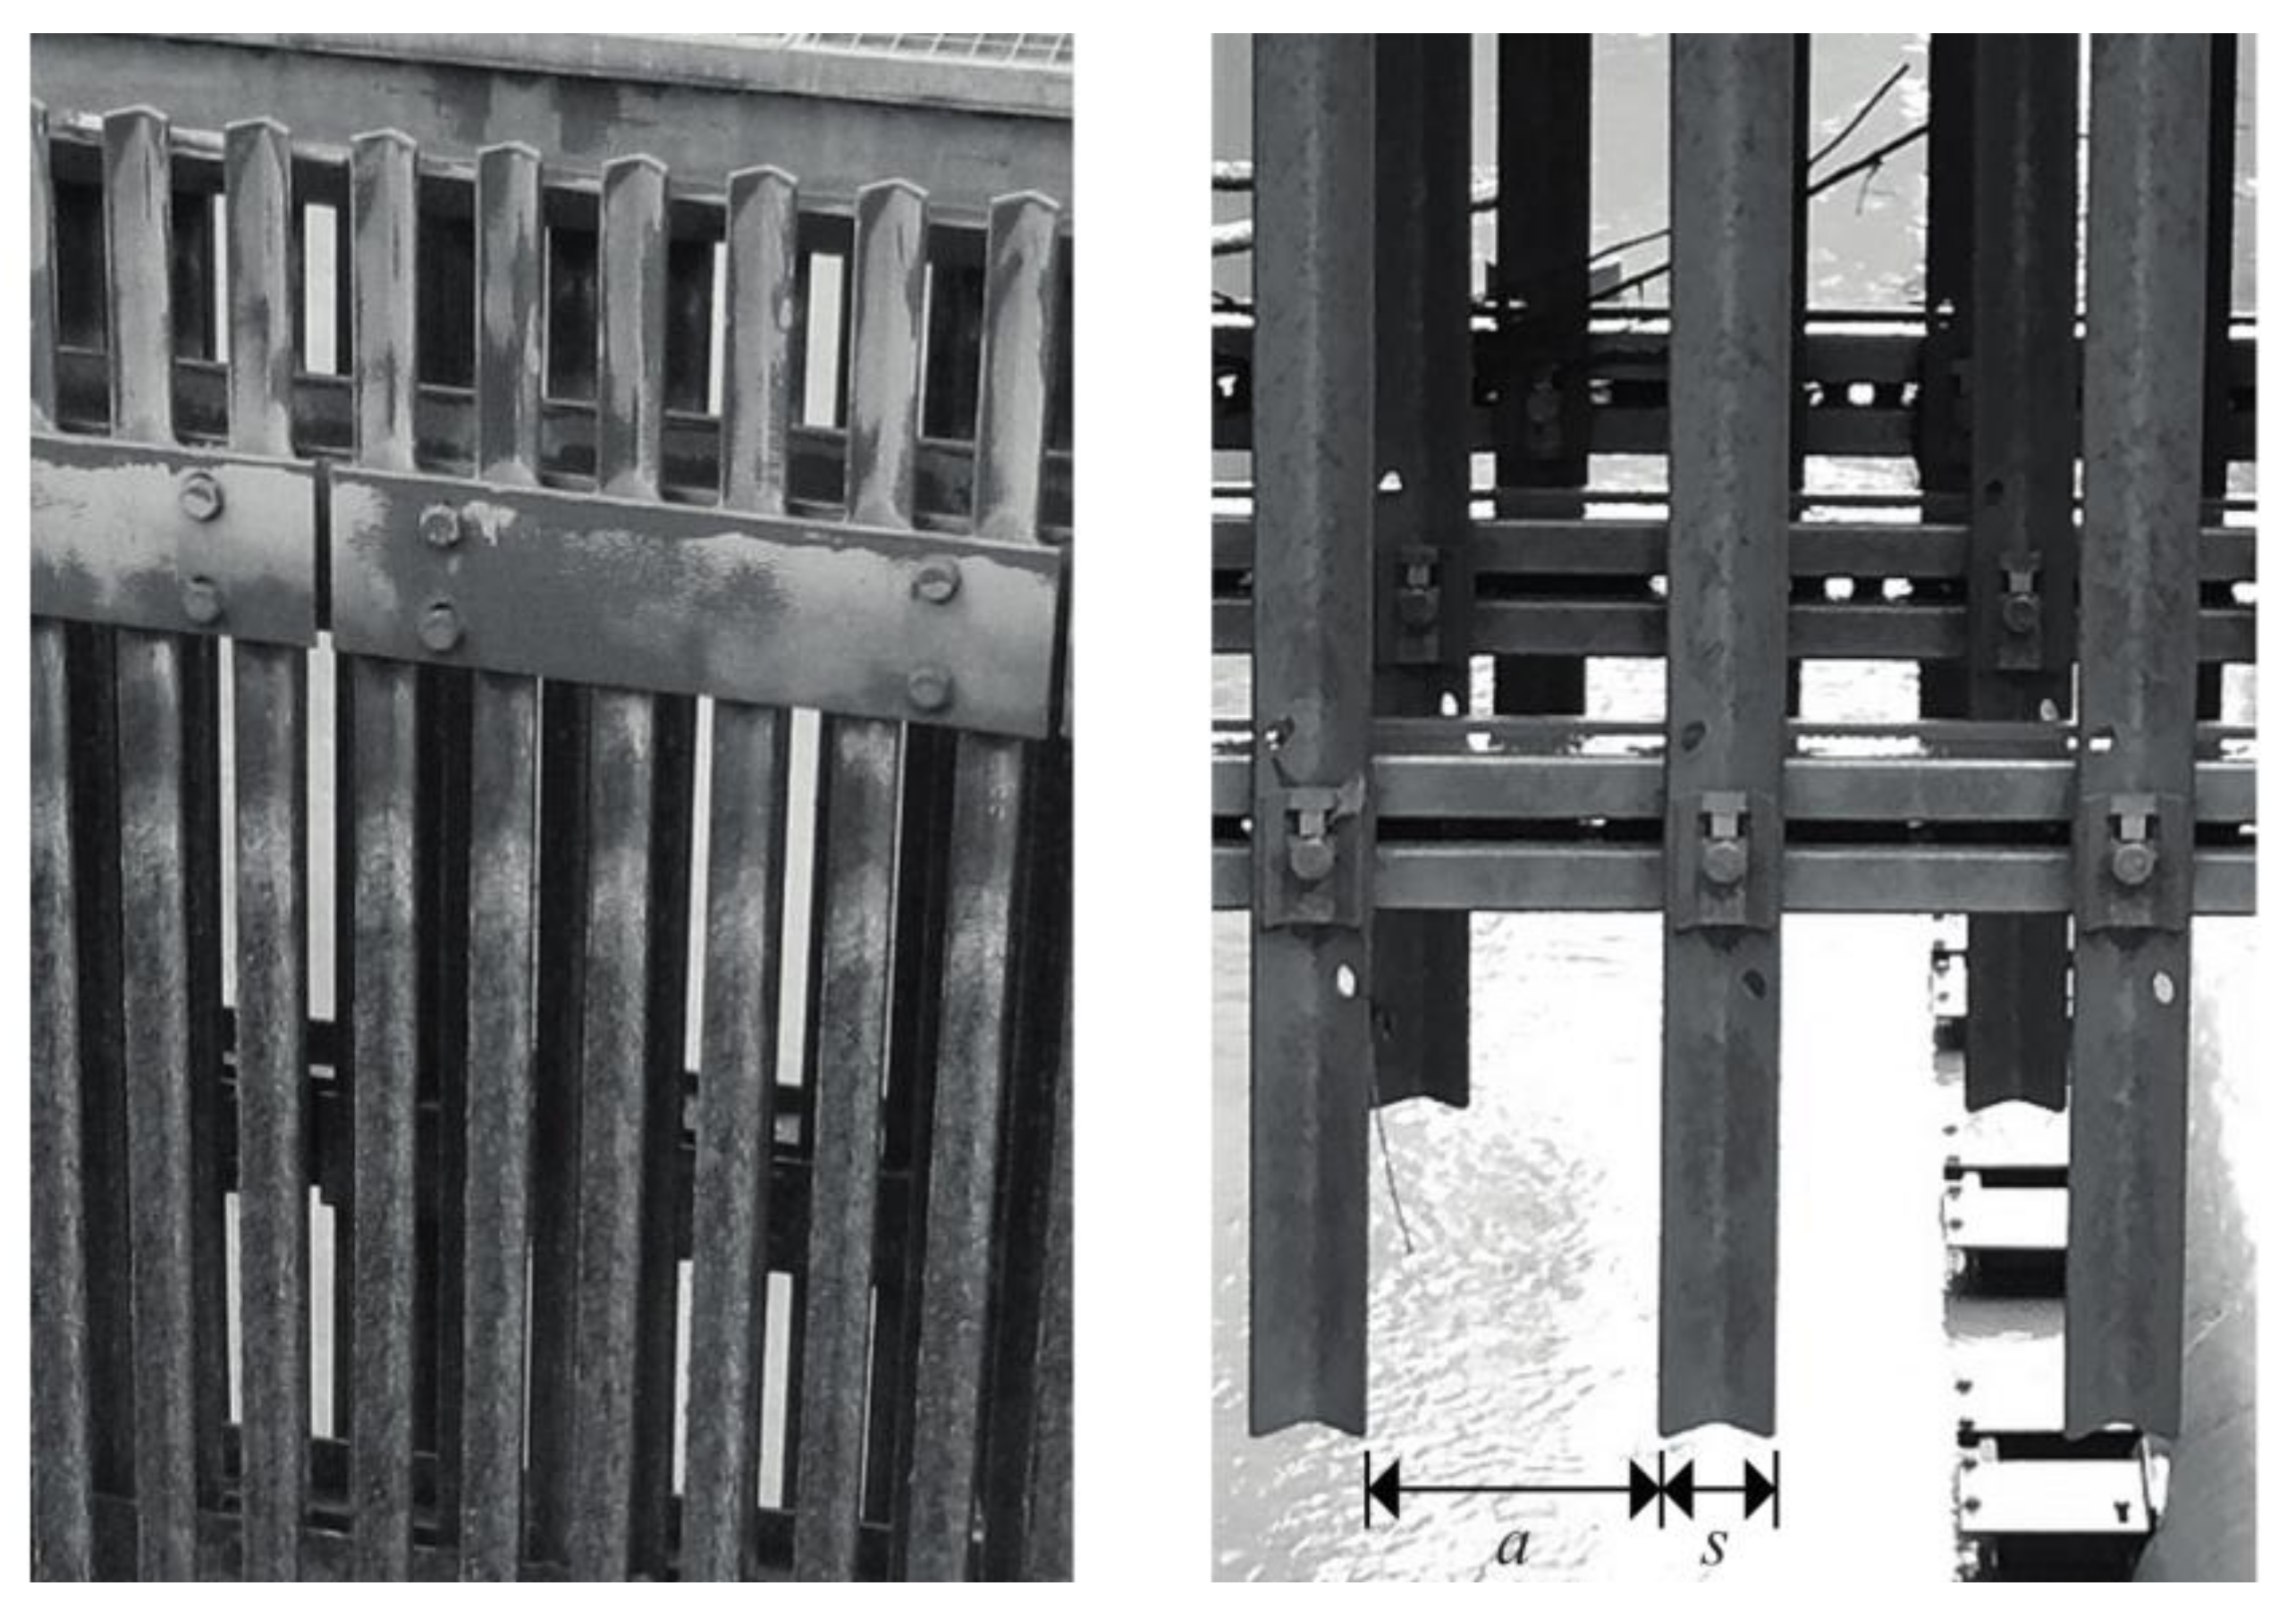
Multi-row tranquilizing racks are often installed in the transition zone to slow down and homogenize inlet channel flow. The racks are typically composed of several rows with V-shaped vertical bars of width s and distance between bars a (Figure 2). Complex flow patterns and vortex structures can occur within and downstream of rack structures [24], inducing large flow velocity and pressure gradients.
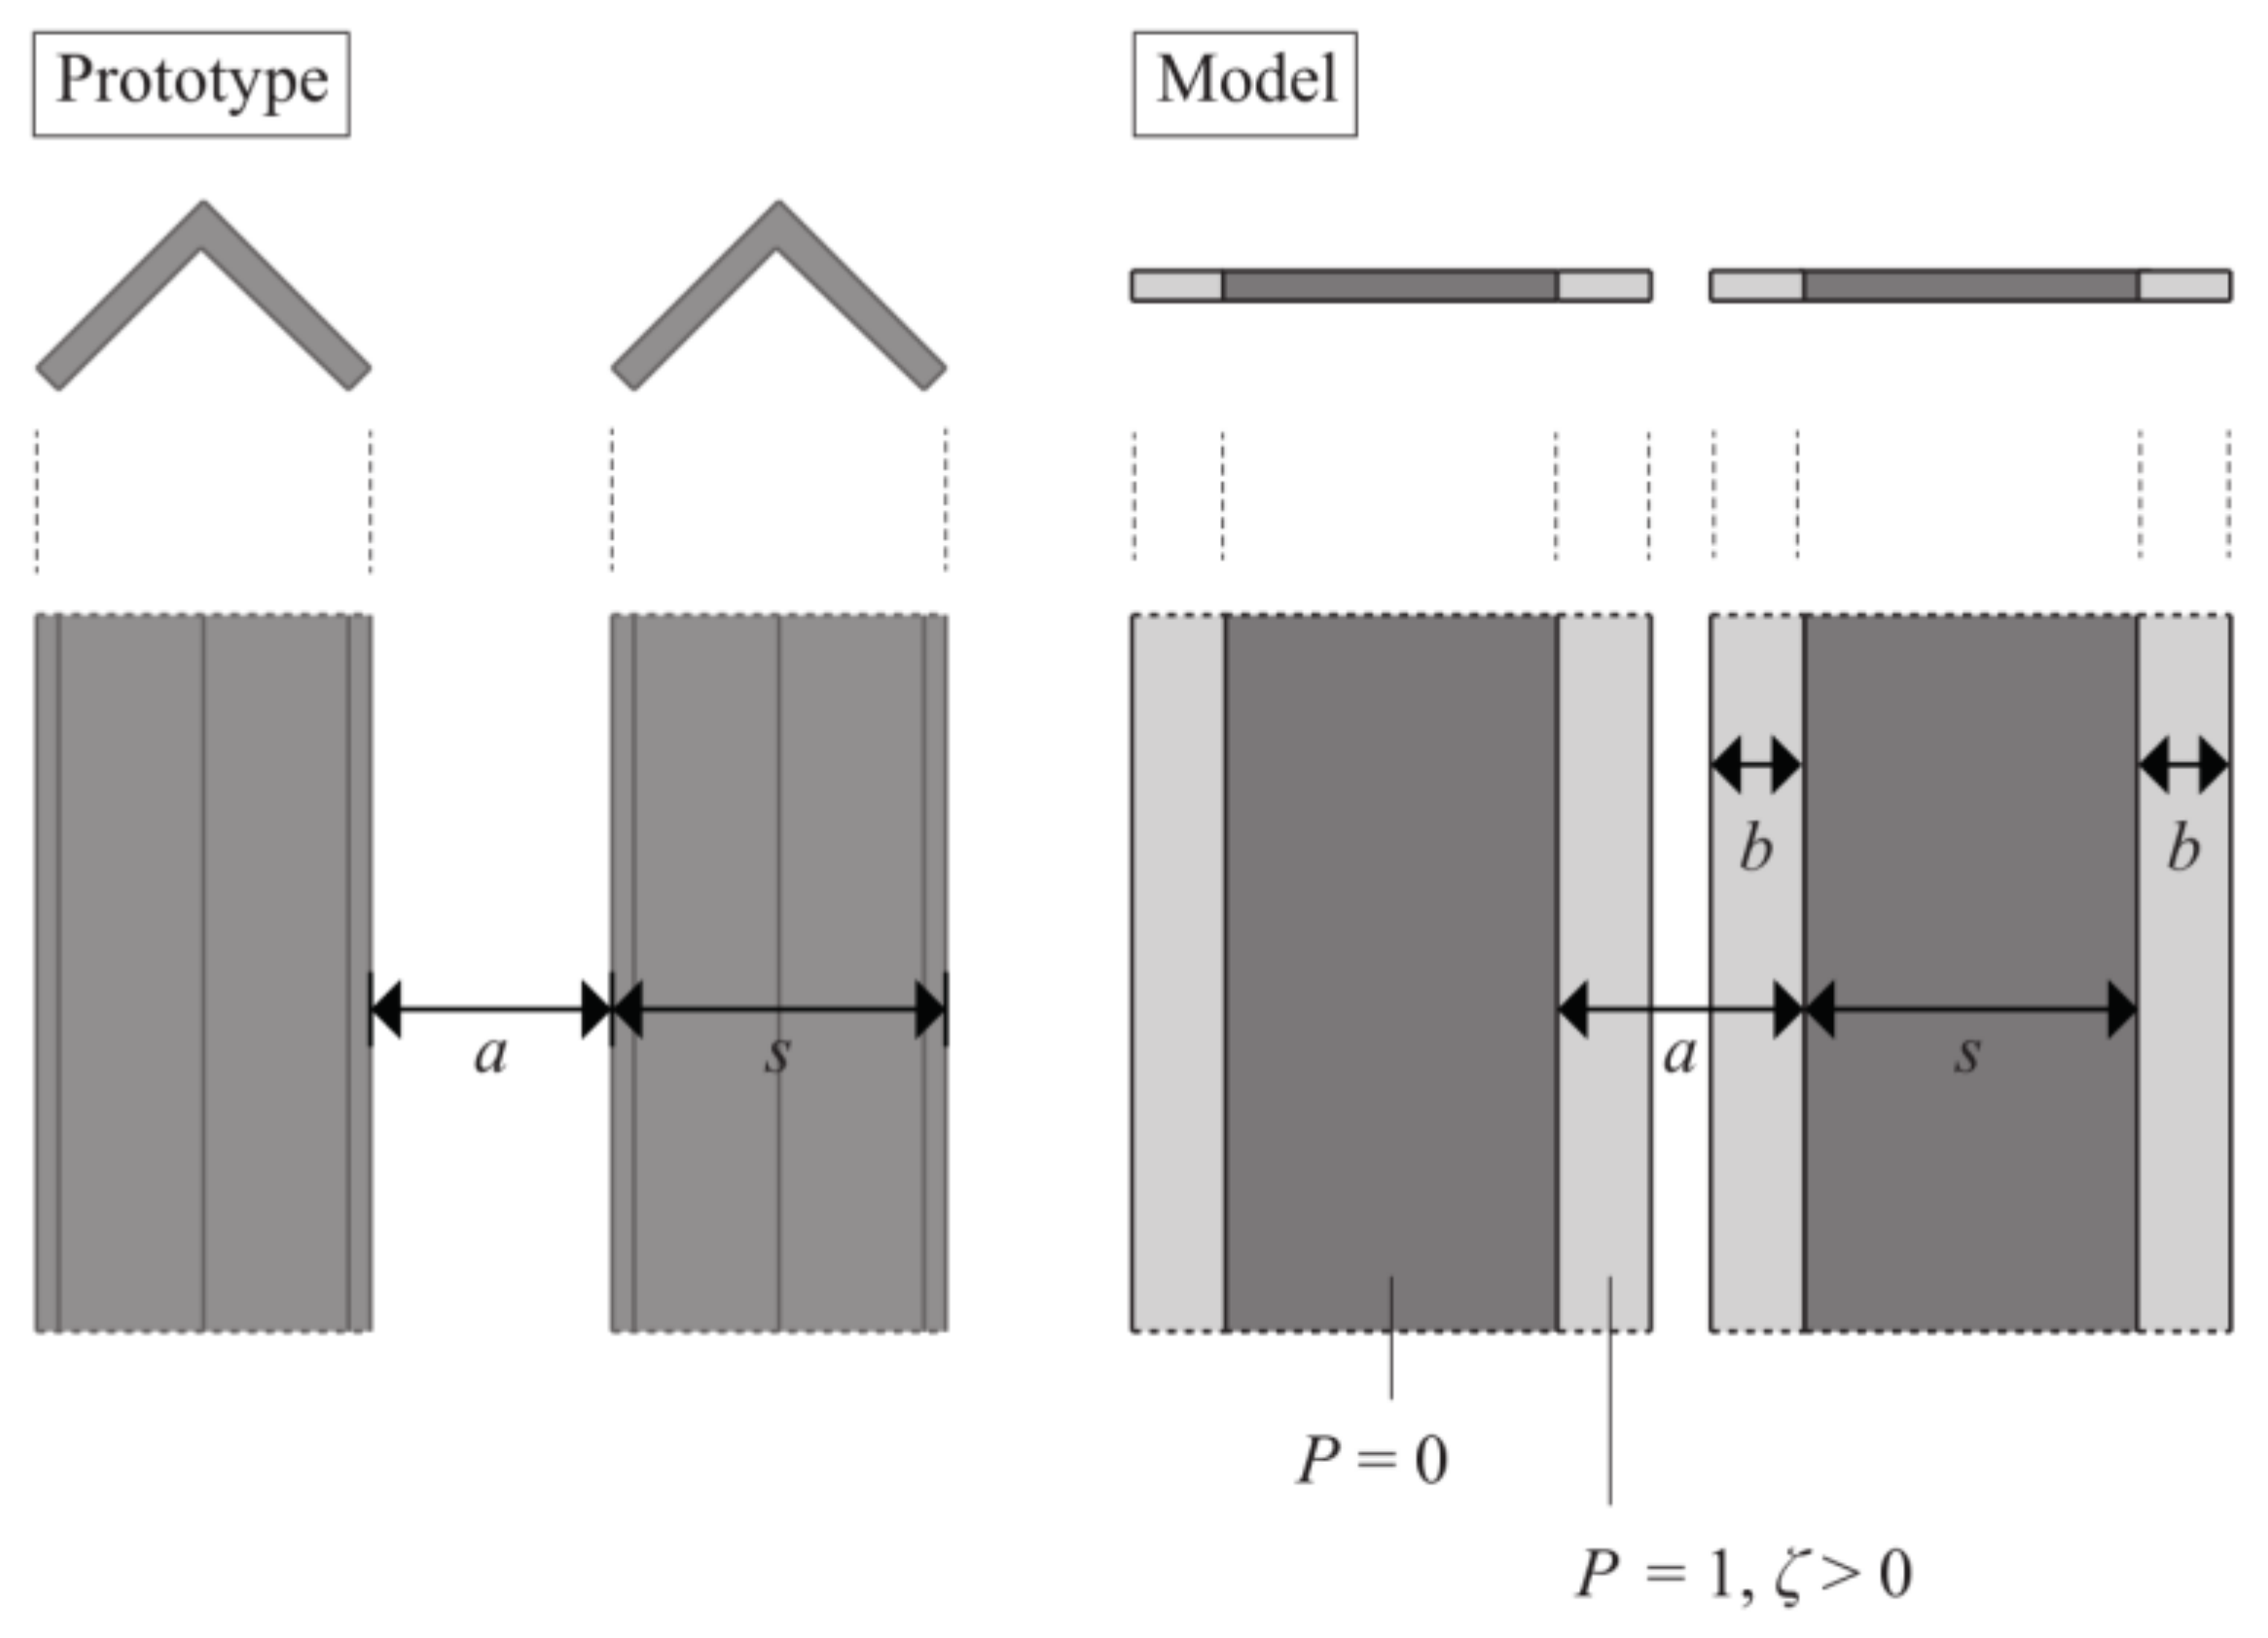
Because of their significant effect on the flow conditions in the transition zone as well as in the basin, the tranquilizing racks had to be considered in the simulations. However, resolving the hydraulic features associated with the racks requires small cell sizes, resulting in large computational grids and long simulation times. For the comprehensive parameter study, a simplified rack modeling approach was developed that makes use of so-called baffles to facilitate efficient simulations. Baffles are planar numerical model objects without extent in the third dimension that are located between computational cells. Baffles are used to modify momentum computation considering a porosity P or a head loss coefficient ζ to account for a pressure drop Δp across the baffle. In the latter case, baffles fully block the flow when P = 0, whereas P = 1 indicates unaffected flow. The combination of impermeable baffles (P = 0) and fully permeable baffles incorporating head loss (P = 1, ζ > 0) was used to model the individual rack bars as shown in Figure 3.
2.3. Parameter Study
The objective of the parameter study was to identify the effect of facility components and involved design parameters on the flow field and related particle settling using numerical simulations. The systematic parameter study implies the variation of the evaluated parameter while keeping the other parameters constant. As a basis for comparison, a reference desanding facility configuration termed “V0” with given specification of facility geometry and hydraulic conditions was defined. Based on the findings of the comprehensive parameter variation, length adjustment terms were deduced from resulting changes in trapping efficiency. Relevant facility configurations considered and discussed in the paper are listed in the Appendix A, Table A1.
2.3.1. Reference Configuration
The reference configuration V0 has a typical desanding facility geometry (Figure 1) with straight-lined inlet channel, a transition zone and a basin with horizontal bed and rectangular cross section. The transition zone length is Ltz =10 m (≥2Wbs according to [25]) and horizontal and vertical expansions ending at the same streamwise position. The transition zone horizontal expansion angle is α = 5.7, following the recommendation in [9]. At the basin end, a semi-circular weir with vertical front wall impounds the flow. For the reference configuration, discharge Qd = 4 m3/s, width Wbs = 4 m and flow depth hbs = 5 m are assumed, meeting the recommendation Wbs/hbs ≈ 0.8 given in [26]. This agrees well with existing desanding facilities in Switzerland. The resulting longitudinal mean basin flow velocity is vx = Qd/(Wbshbs) = 0.2 m/s.
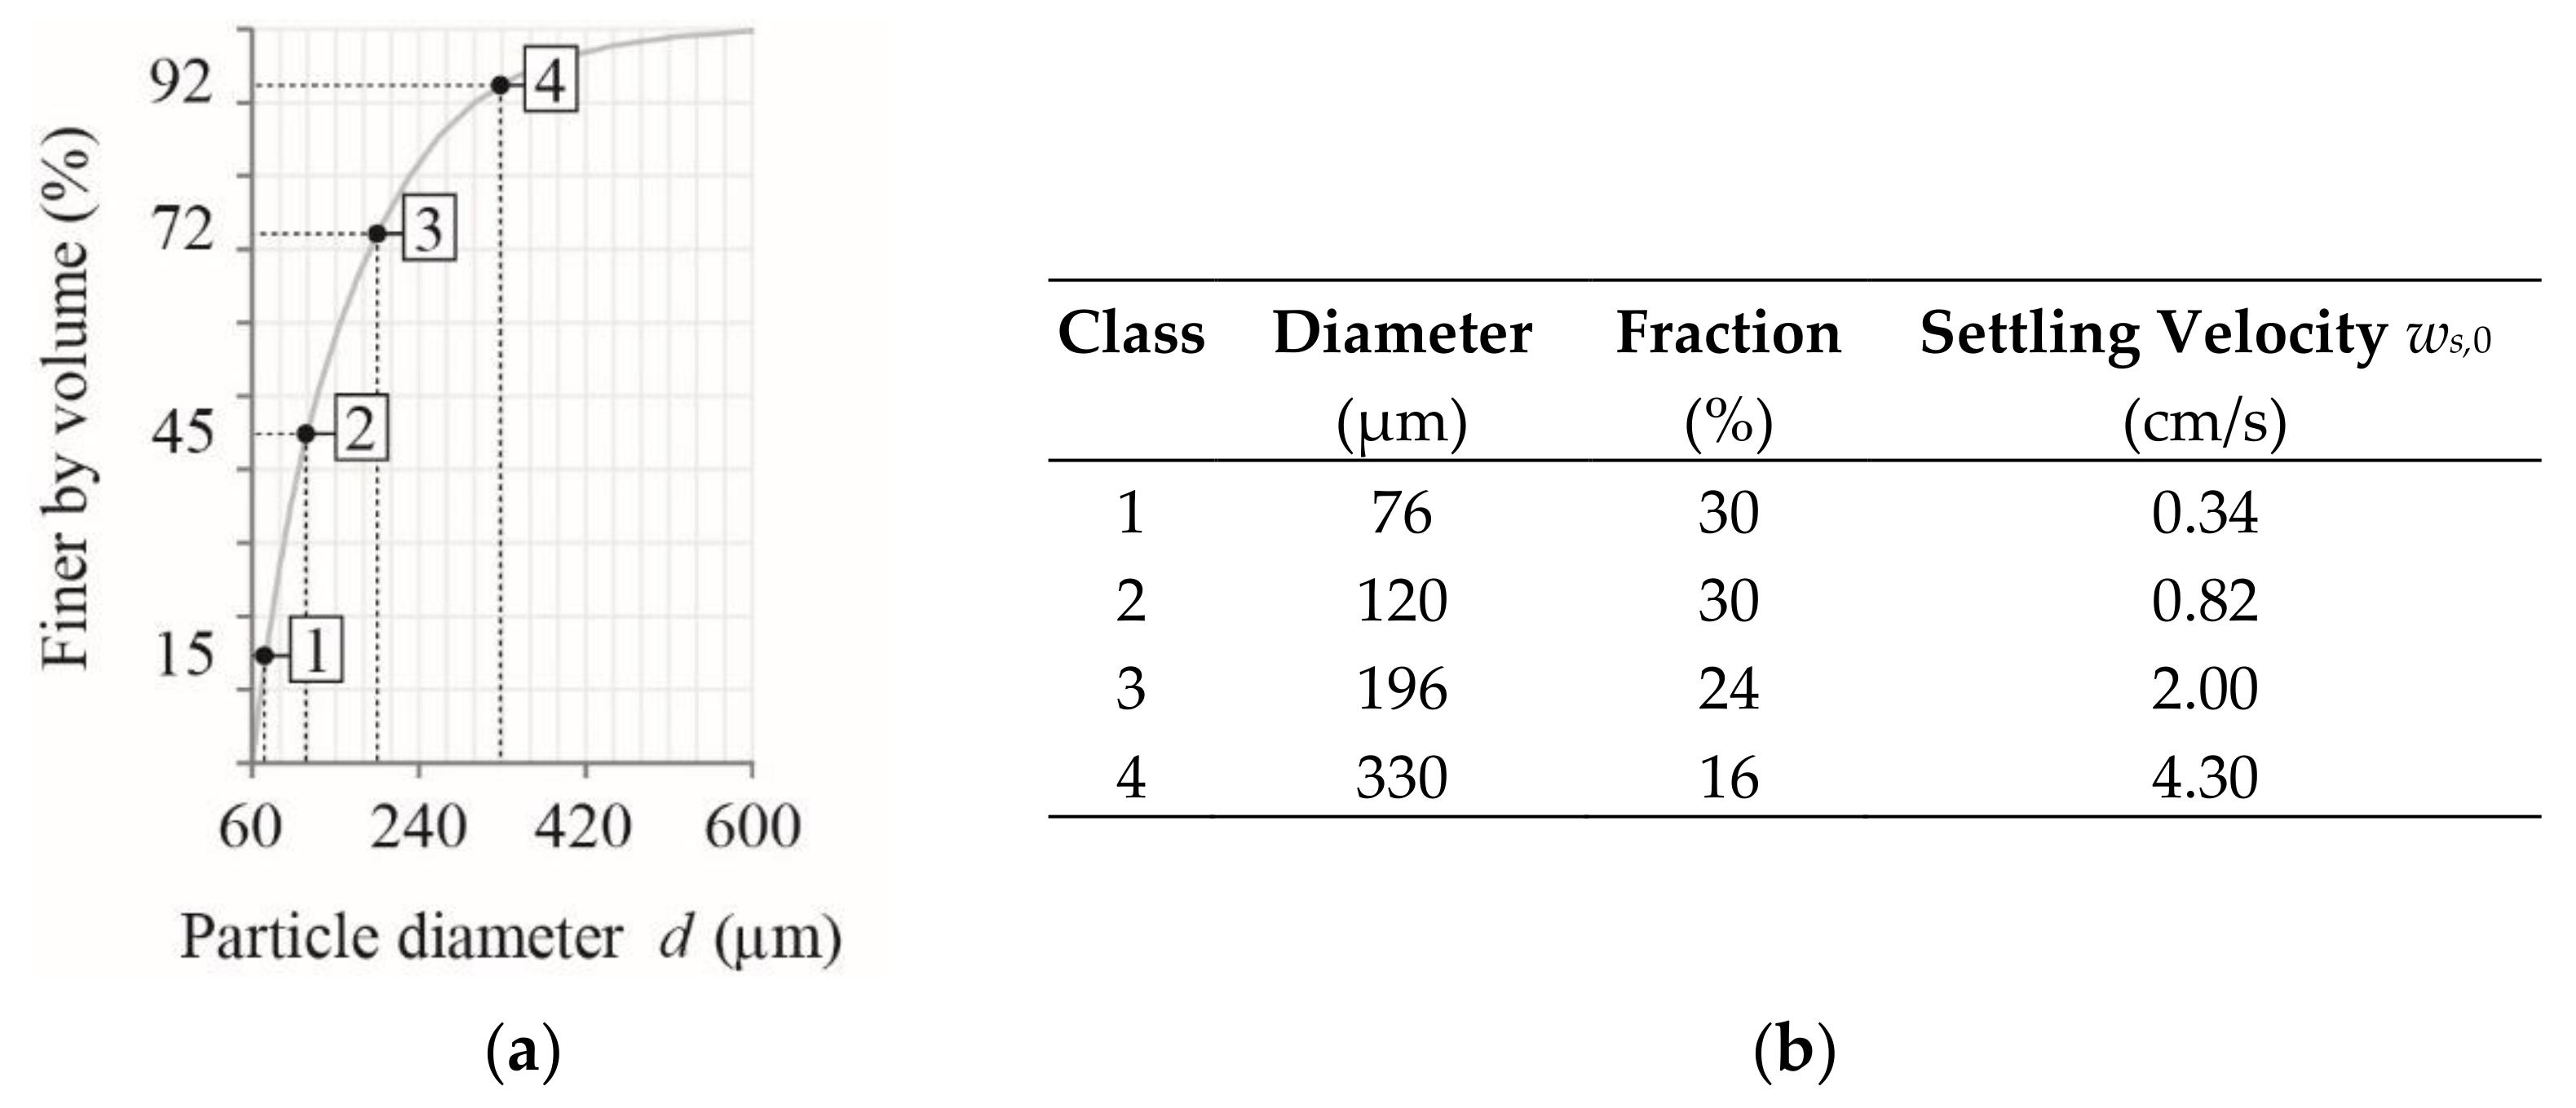
For the simulations of the parameter study, sediment was added, homogeneously distributed over the whole flow area at the upstream boundary of the computational domain. Sediment input refers to the average sediment discharge and mean particle size distribution (PSD) measured at inlet channels of investigated prototypes [10], whereas only particles in the non-cohesive fine and medium sand size range were considered (Figure 4a). For the reference desanding facility, a critical diameter of dcr = 330 µm was chosen. The PSD is discretized by four grain classes (Figure 4b).
Consequently, the still-water settling velocity for the critical diameter dcr = 330 µm can be computed according to Soulsby [17] from Equation (2) and results in ws,0 = 0.043 m/s for ρs = 2650 kg m−3 and water at 8°C with υ = 1.39∙10−6 m2 s−1. The basic basin length can be calculated for configuration V0 according to the classical design approach [3],
The resulting basic basin length = 32 m agrees well with the recommendation Lbs/Wbs ≥ 8 given in [26]. It must be pointed out that this approach only considers a linear trajectory of settling particles in a straight channel with flat bed and does not account for any geometrical variation or facility components, such as transition zone or outflow weir, respectively. Furthermore, the still-water settling velocity ws,0 is a crucial desanding facility design parameter, and its related uncertainty directly affects the calculation of the basin length. For example, for a water temperature of T = 10 °C the calculated still-water settling velocity for particles with d = 300 µm may vary by about 50% if calculated with the approach of Wu and Wang [27] (ws,0 = 0.028 m/s) or Zanke [28] (ws,0 = 0.042 m/s).
2.3.2. Parameter Variation
Parameters considered in the present study are shown in Figure 1. Basin width Wbs, basin flow depth hbs and weir characteristics are constant for all simulations. Furthermore, sediment input including PSD and the critical diameter dcr = 330 µm are identical for all simulations. For the comparative parameter study, the following parameters were varied: basin length Lbs, inlet channel Froude number Fo = vo (g ho)−1/2, with vo = inlet channel velocity and ho = inlet channel flow depth, inlet channel radius r and conjunction angle γ, respectively, transition zone horizontal expansion angle α and vertical expansion angle β and transition zone length Ltz. To achieve constant basin flow depth hbs for varying values of Fo, the inlet channel flow depth ho was accordingly adapted by shifting the inlet channel bed level. These parameters were chosen because they are (i) considered to essentially control basin approach flow conditions and consequently basin hydraulics and (ii) not considered in the classical, commonly used design approach. Table 1 gives an overview of the range of investigated parameters. All in all, the parameter study comprised some 70 simulation runs.
Moreover, tranquilizing racks were incorporated in selected configurations. The rack properties follow the characteristics of the investigated prototypes and were kept constant for each simulation. Three rows of rack bars with s = 5 cm (streamwise row spacing of 1 m) were considered, covering the whole transition zone width and flow depth. The rack bar clear spacing decreases in flow direction from a = 15 cm (first row) to a = 10 cm (second row) and finally a = 5 cm (third row).
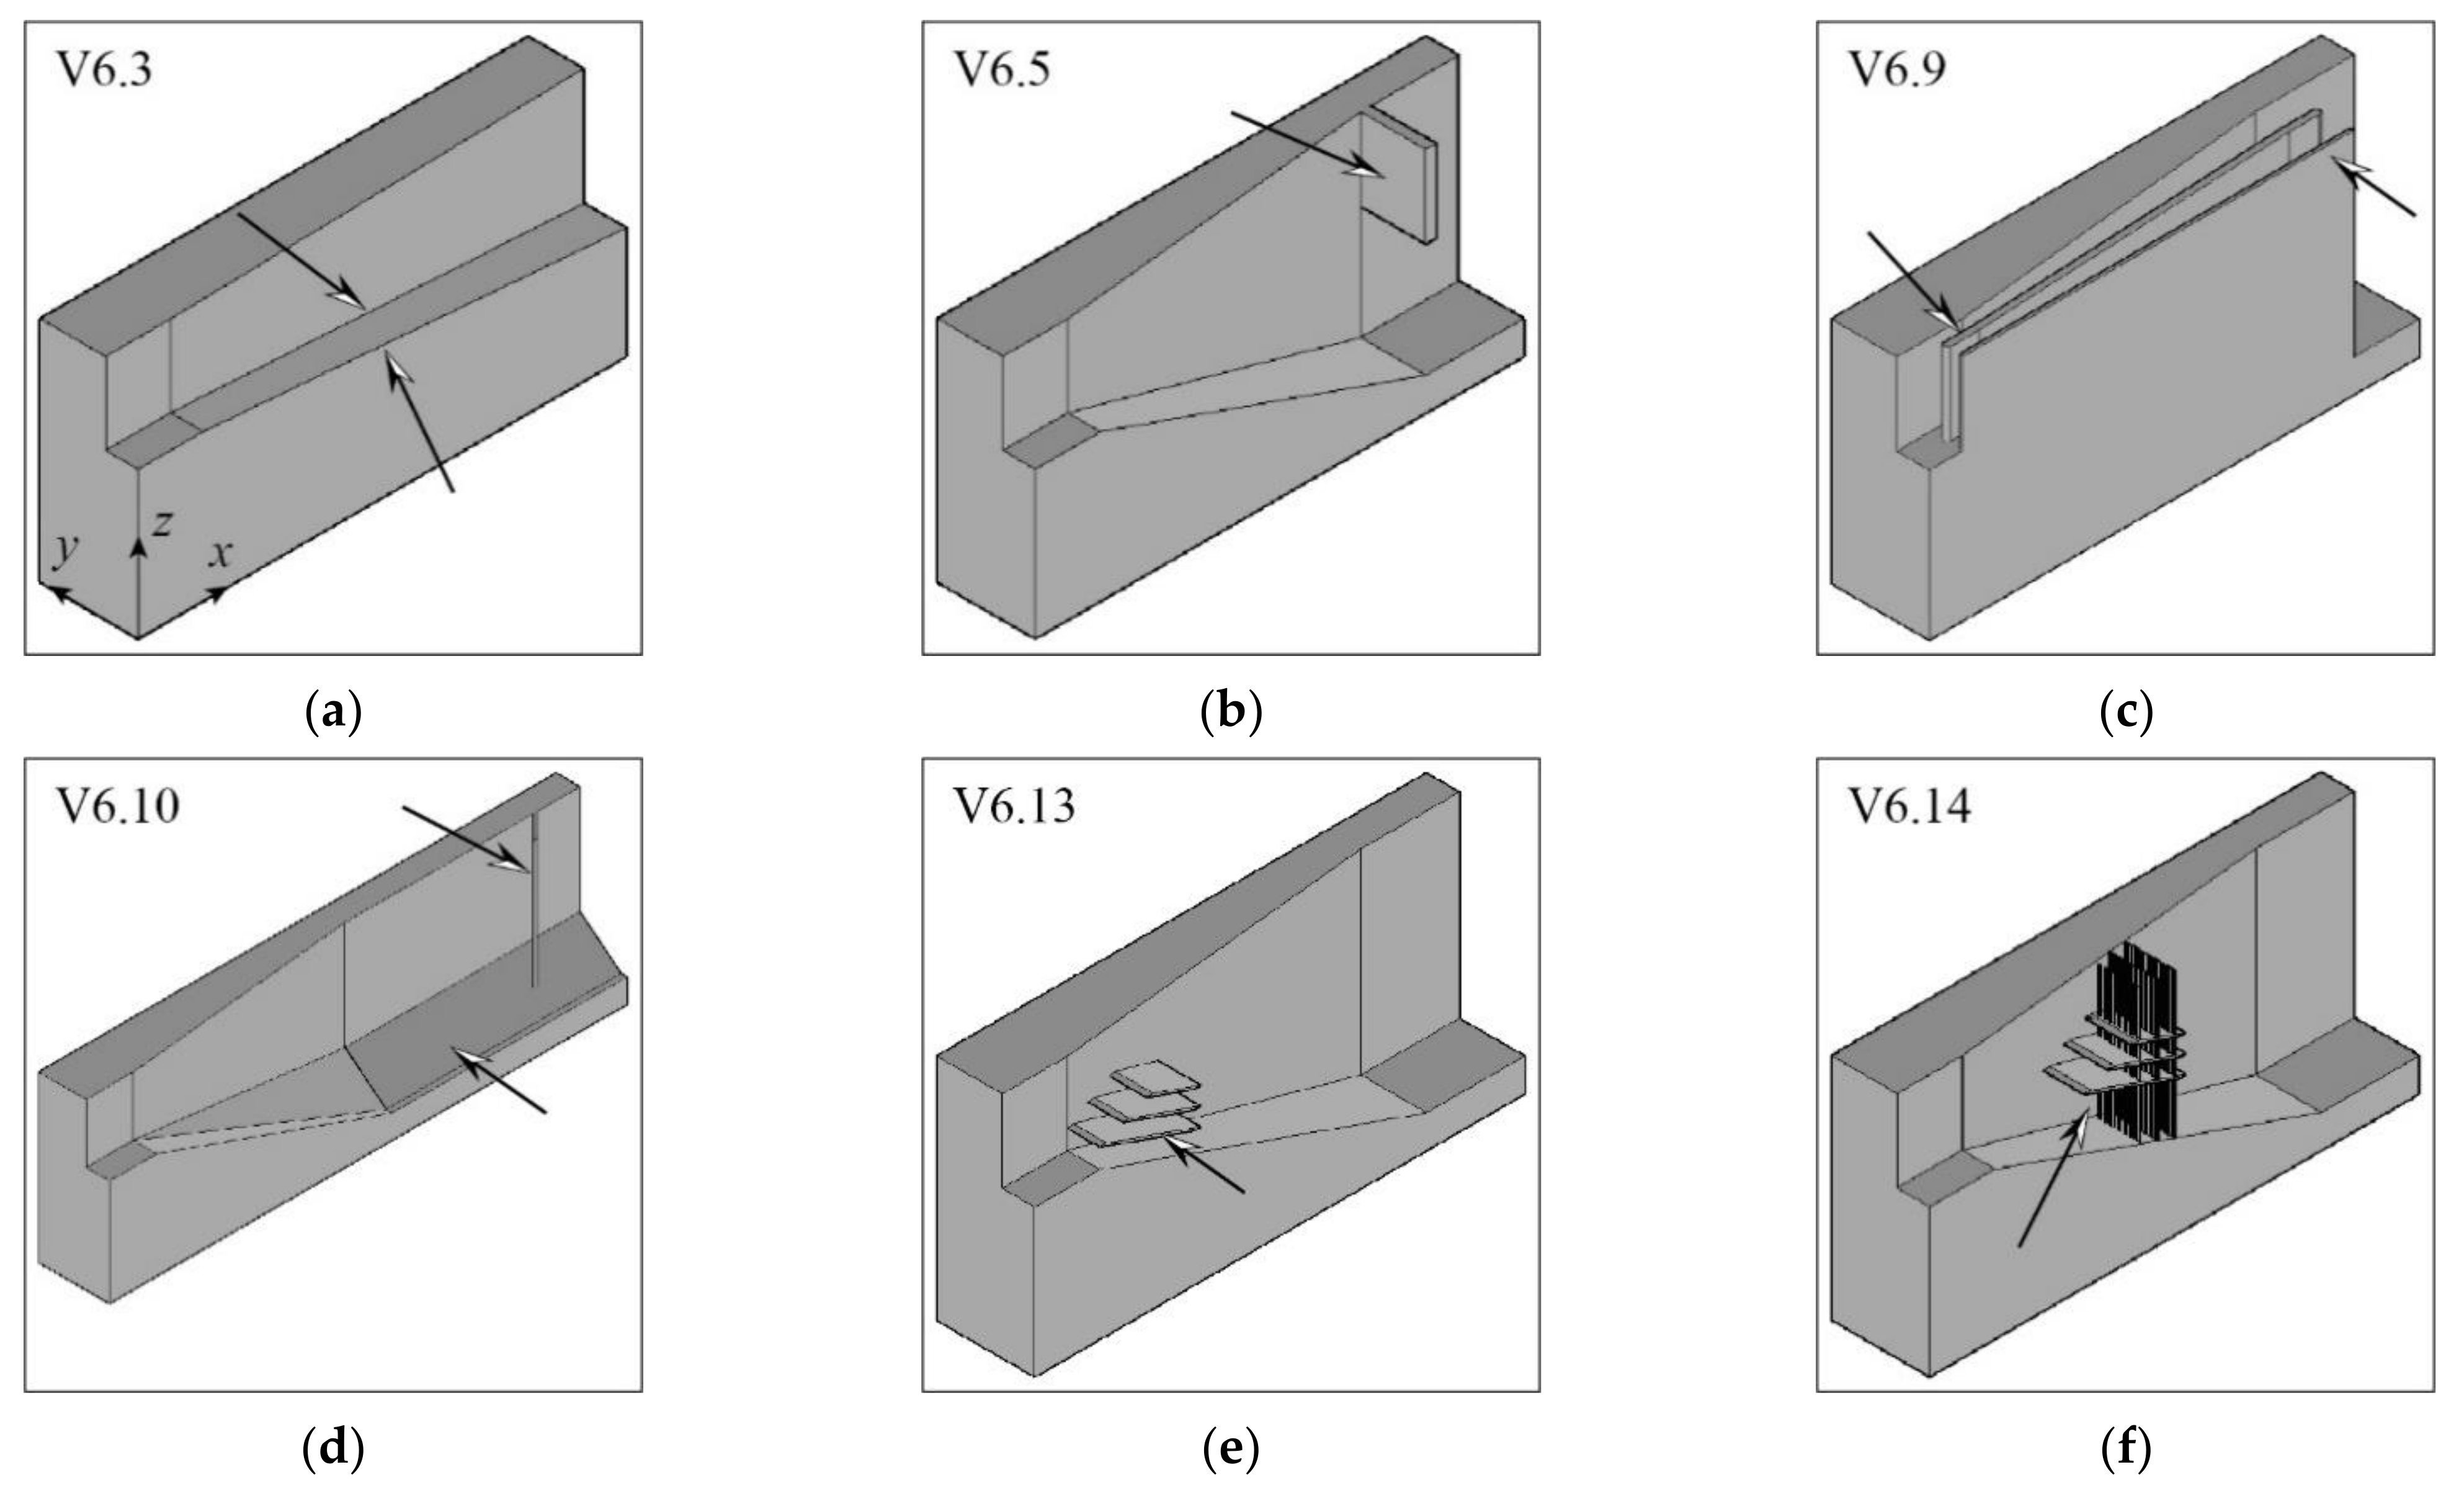
In addition, several special configurations were investigated. These comprise the incorporation of different structural components to decelerate or deflect the entering flow to improve the basin hydraulics regarding facility performance. A selection of investigated special configurations is shown in Figure 5 (for further cases refer to [23]). In some cases, the mesh had to be refined near the structural component.
2.3.3. Evaluation
The effect of parameter variation on the flow field and the settling of particles, and hence on the trapping efficiency, was assessed by evaluating the following major quantities:
- Trapping efficiency ηc as ratio of trapped sediment to sediment input, see Equation (1).
- Relative trapping efficiencyas ratio between the trapping efficiency ηc,sim resulting from corresponding parameter study simulations and the trapping efficiency ηc,V0 of the reference configuration V0 for the critical particle diameter dcr = 330 µm. Note that values of ηc,rel above unity indicate that performance of the configuration with given parameter set is better than the setting of the reference configuration, and vice versa.
- Mean basin turbulent kinetic energy (TKE) km is used as an indicator for flow turbulence and presence of eddy structures and hence as a simplified measure for flow inhomogeneity.
- Mean basin bed shear velocity u*m is an estimate for potential resuspension of particles after having settled to the basin bed.
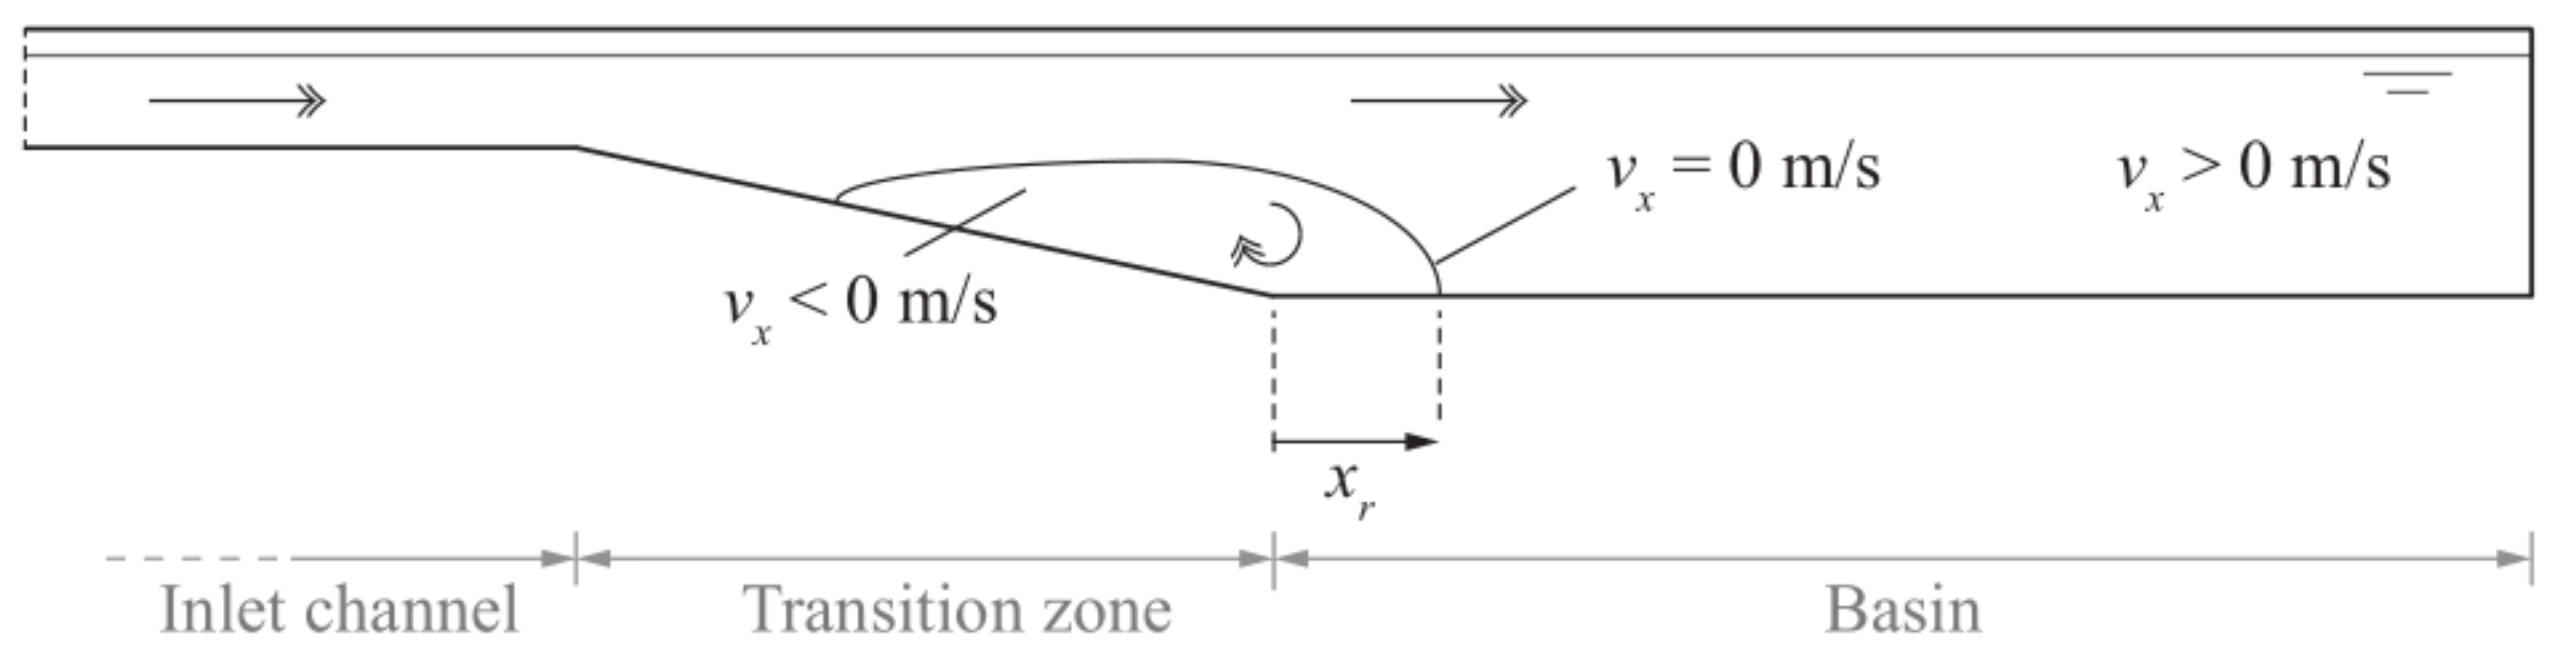
- The size of the recirculating flow zone in the basin is quantified by the length xr representing the extent (in x–z plane) of the transition zone recirculating flow into the basin (Figure 6). The extent of recirculating flow is identified by the area permanently characterized by basin longitudinal flow velocities vx ≤ 0 m/s.
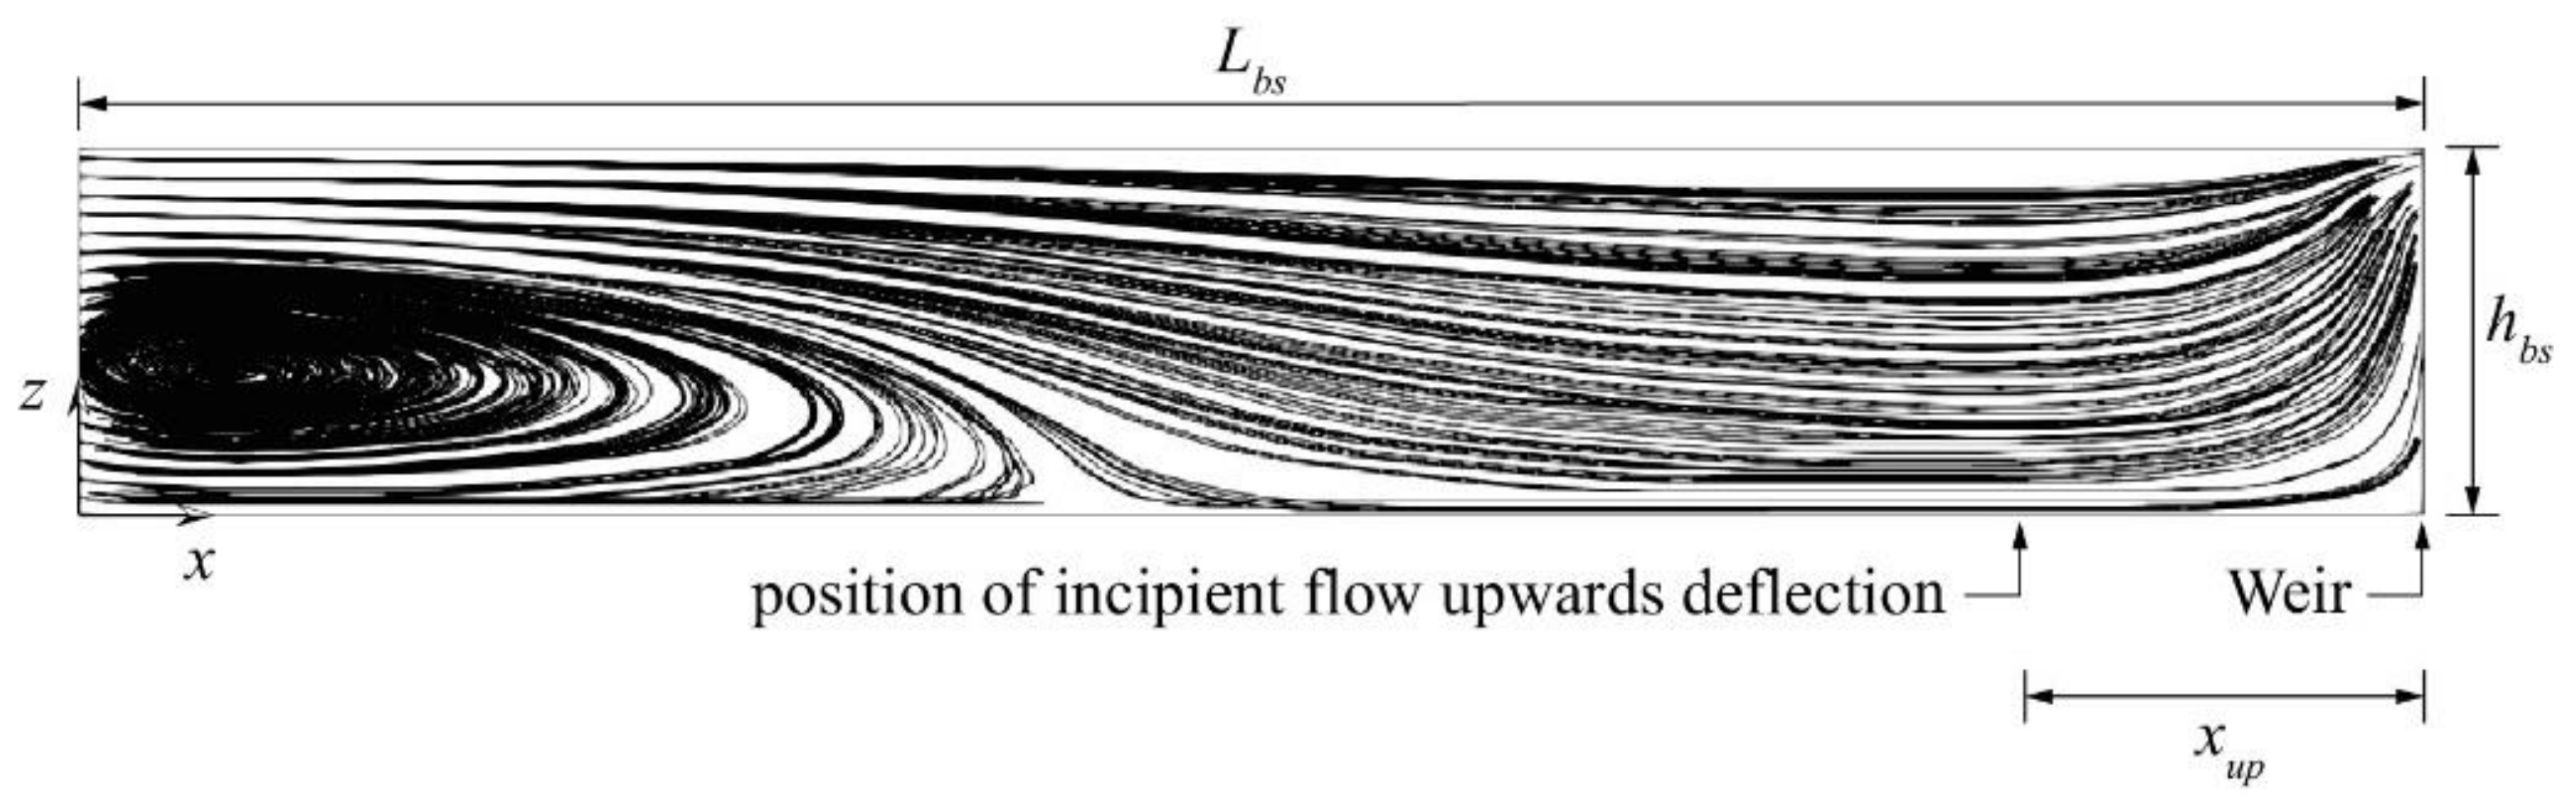
- Extent of weir approach flow, i.e., the effect of the weir on basin flow, is estimated by the distance xup for which incipient streamline upwards deflection occurs over most of the flow depth and the whole basin width upstream of the weir (Figure 7).
3. Results and Discussion
3.1. Validation of Numerical Model
The numerical model was validated using prototype data from field measurements at the Saas Balen desanding facility (see [10] for details). The basin of the Saas Balen facility has a length of 35 m, a width of 5.8 m and a mean flow depth in the basin of 3.28 m. The considered model geometry of the facility includes a slight-left-bending inlet channel, a transition zone with tranquilizing racks and an outlet weir. Flow velocities, suspended sediment concentrations (SSC) and particle size distributions (PSD) were simultaneously recorded at three different times t1 (4 pm), t2 (6:15 pm) and t3 (8:15 pm), while the mean discharge was nearly constant at 2.2 m3/s. Four acoustic Doppler velocimetry probes (ADVs) with side-looking heads were used for the 3-D flow velocity measurements in the basin. Measurements were carried out at 9 to 12 cross sections corresponding to 3 to 4 m intervals along the basin. Each cross section contained about 50 to 70 single flow velocity measuring points [10]. The measurement time was 90 s for each measuring point with a sampling frequency of 100 Hz.
The model was further validated by comparing simulation results with additional experimental data from another desanding facility acquired at the Wysswasser desander [23].
3.1.1. Flow Field
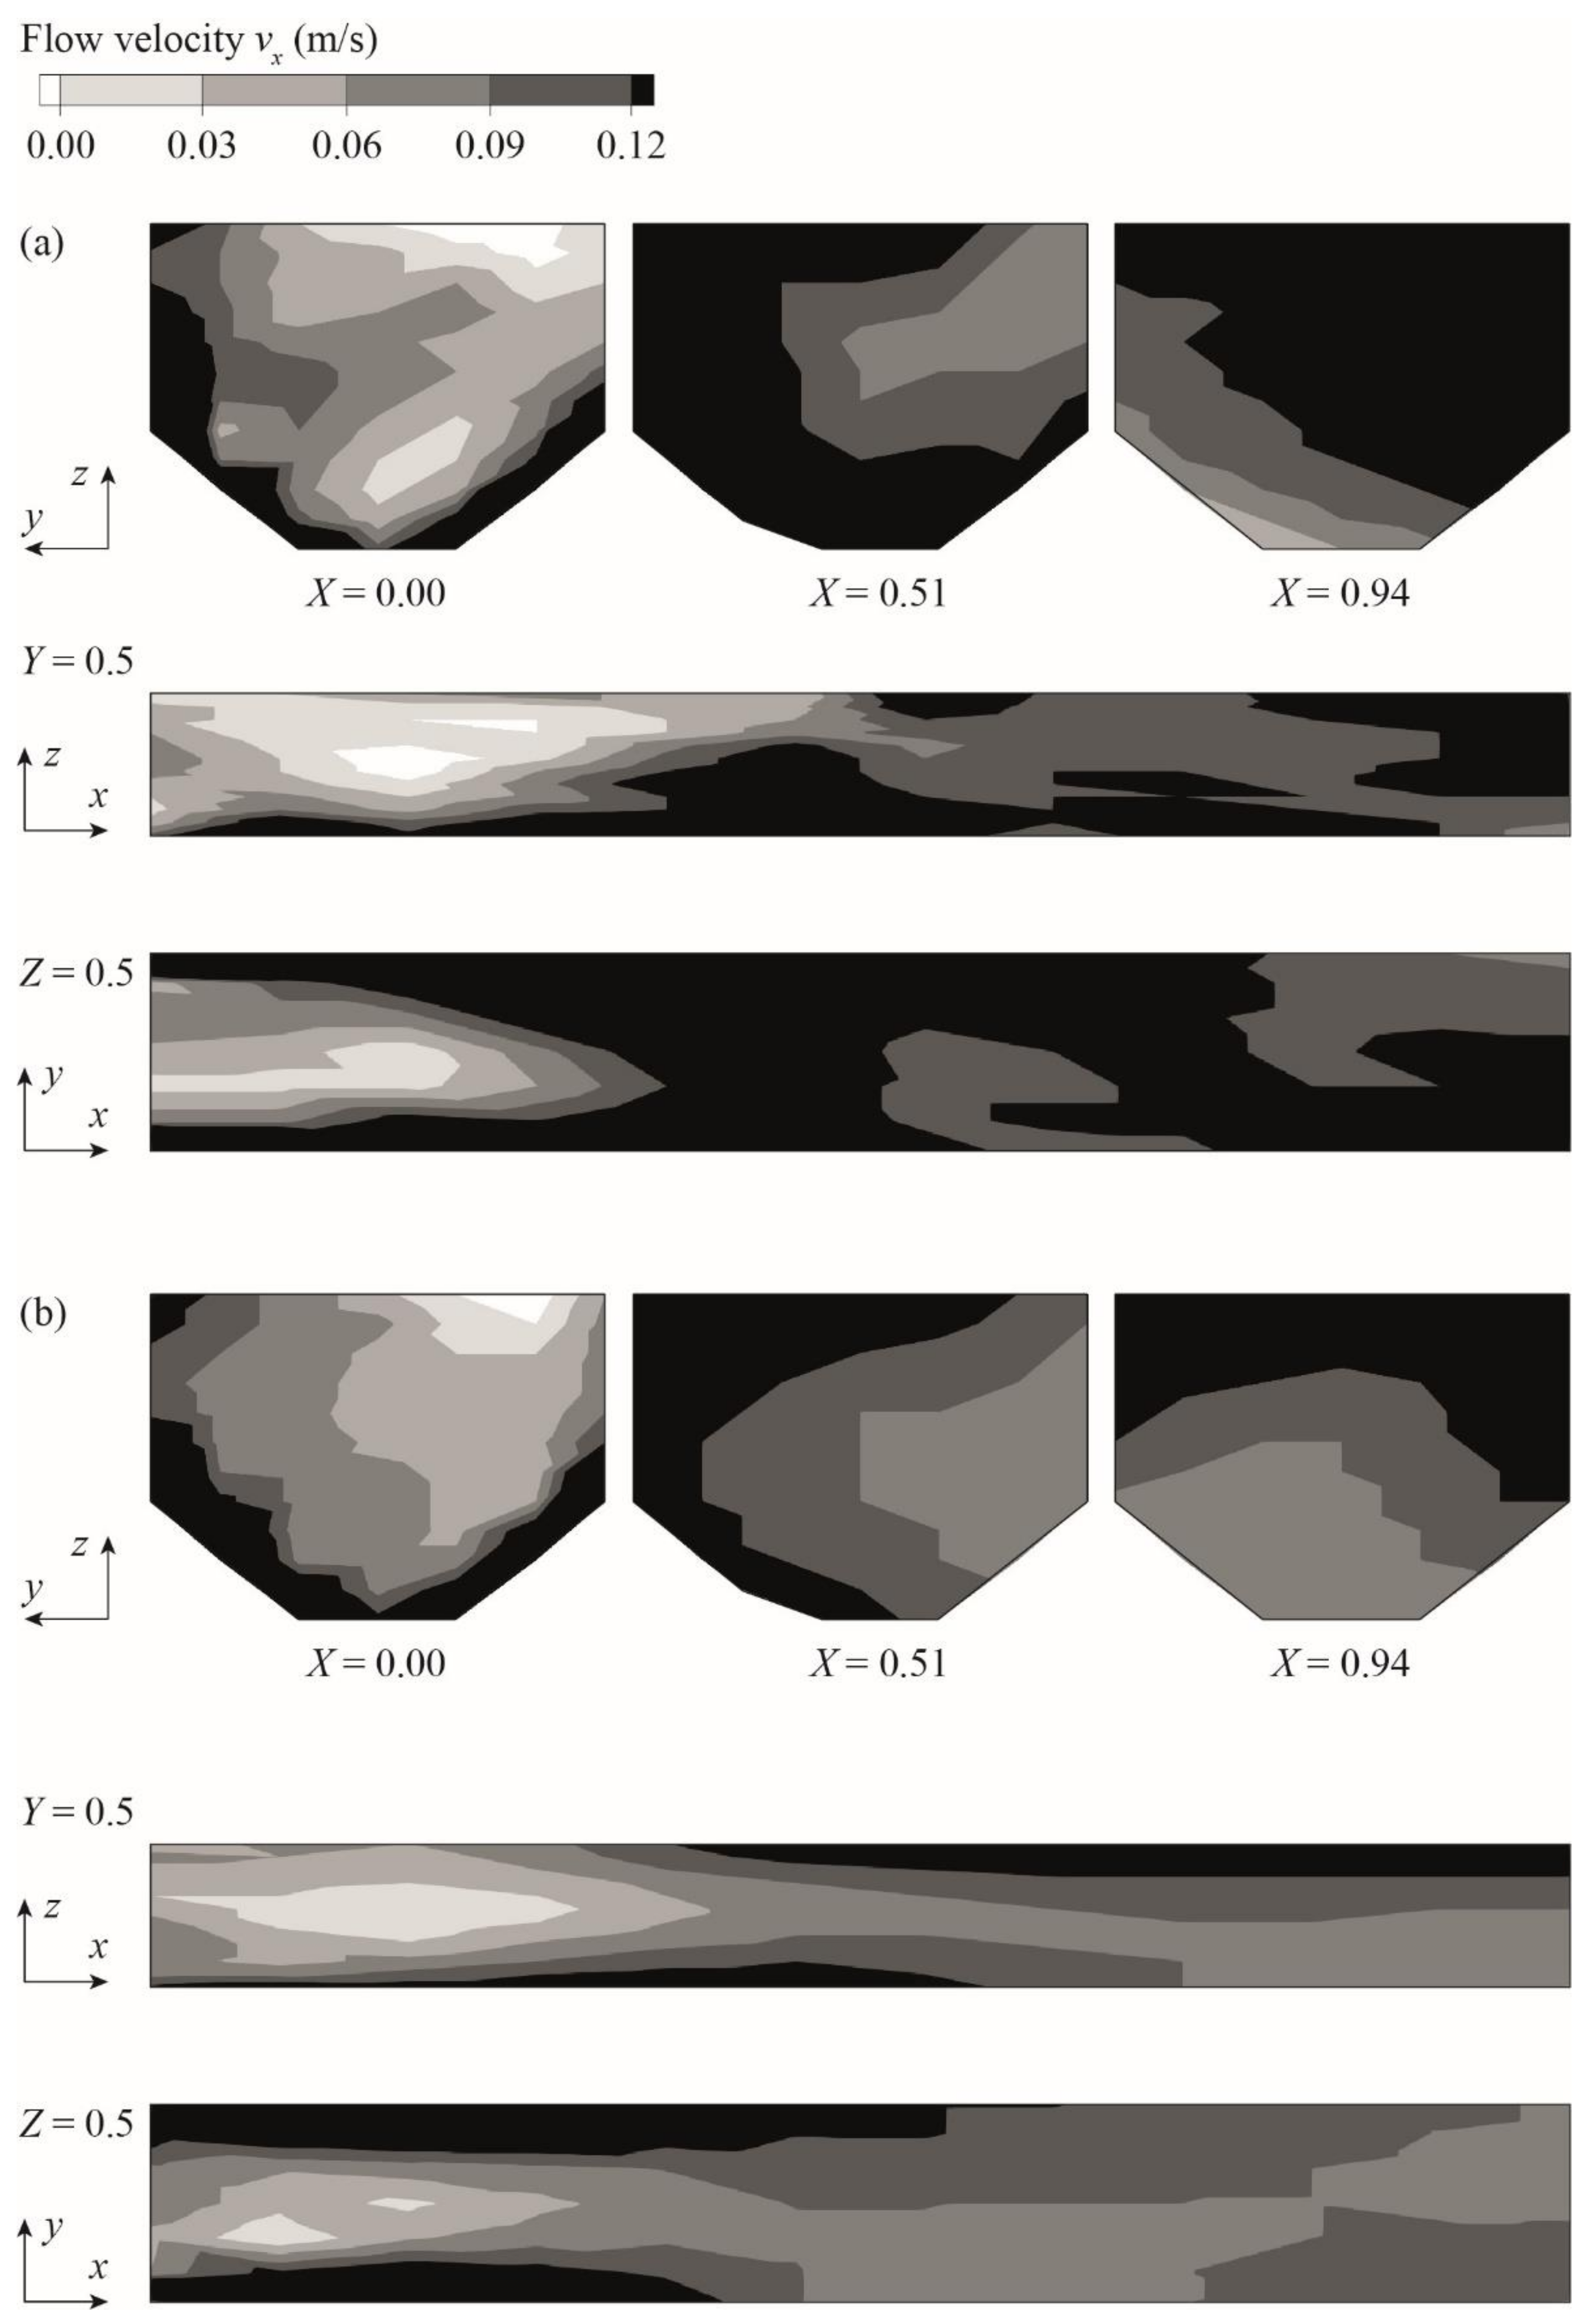
For the validation of the flow field, the focus was on the longitudinal flow velocity component vx, which is the driving component in the desander basin. Figure 8 shows contour plots for selected sections (cross sectional, longitudinal, horizontal) of measured and simulated vx. In view of the involved uncertainties in the experimental measurements in the order of 10 to 15% (see [10]), the agreement was judged satisfactory. The model reproduced the homogenization of the flow in the transverse direction with a more even distribution of streamwise flow velocities with increasing distance from the inlet (see cross sections in Figure 8). Additionally, in the longitudinal plots the general axial velocity decay in the streamwise direction was visible both in the experiments and the simulations. The flow acceleration in the gap between the tranquilizing racks and the side walls as well as the deceleration in the central flow column just after the rack were well reproduced by the model. While the elevated flow at the surface at the basin end was also given by both approaches, the bottom jet passing below the tranquilizing racks was more pronounced and extended longer in the experimental data. This also holds for the streamwise velocity components close to the basin sidewalls, which were similar in flow pattern but more pronounced in the experiments. Furthermore, the evaluation of the mean cross sectional longitudinal flow velocity [23] shows good agreement with the simulation results.
The basin flow field is significantly influenced by the tranquilizing rack structure. This finds its expression in local acceleration and deceleration of the flow, whose effect persists in large parts of the basin, resulting in large-scale flow features. The simulation of the prototype with a grid resolution according to the model validation and the application of the RNG turbulence model showed that the model is capable of reproducing the complex flow features. Moreover, the developed tranquilizing racks modeling concept was deemed to be appropriate.
3.1.2. Sediment Transport
At the Saas Balen desanding facility, SSC and PSD were measured at the channel inlet and the outlet weir. For sediment transport simulations, the steady-state solution of the flow simulation was used as the initial condition, and suspended sediment was added, homogeneously distributed over the whole flow area at the upstream boundary, i.e., at the facility inlet, with SSC and discretized PSD curves according to the measurements. Default values for the sediment entrainment coefficient and bed-load transport parameter were used, because even an up to tenfold increase in both parameters (i.e., significantly increased entrainment and bed-load transport) showed no influence on the results. This indicates that bed-load transport is of minor importance in comparison to suspended sediment transport for the present situation.
For the evaluation of the sediment transport model, SSC and PSD at the outlet weir were compared regarding measurement and simulation for recordings at t1, t2 and t3 (Table 2). The simulation results show that model performance with respect to the concentration-related trapping efficiency ηc (Equation (1)) increases with increasing median diameter of the suspended sediment load. For low SSC input at t1, the simulated trapping efficiency was more than 50% below the measurement data, while for t3 with a pronouncedly coarser PSD the deviation was only 10%. It was noted that the model underestimated the trapping efficiencies for all three times of measurements, which is conservative in terms of required basin length. Evaluating the mean outlet PSD of the three recordings, the simulation results are in good agreement with the measurements, indicating that the particle size refinement in the basin is well reproduced by the model (Figure 9).
Possible reasons for the divergent trapping efficiencies are: (i) The implemented particle settling model approach was not strictly valid for particles in the silt and clay size range, since cohesive effects were not considered [17]. The PSD at t1 in particular shows a high share of cohesive particles. For the subsequent parameter study, only non-cohesive particles with diameter larger than 76 µm were considered (see Figure 4). (ii) In situ, the tranquilizing racks locally hinder the sediment-laden flow. Hereby, particles can collide with rack bars, depending on particle inertia. This results in deceleration of particle speed or deflection of the particle trajectory. As a consequence, particles may deposit earlier, thus trapping efficiency increases. However, the interaction of particles and rack bars was not considered in the model, which may lead to a general difference in trapping efficiency. Moreover, PSD and SSC measurement uncertainties must also be considered, which are not further discussed in the present paper but are discussed by the authors in [10,11].
3.2. Correlation of Desanding Facility Configuration and Trapping Efficiency
From the systematic numerical simulations of the parameter study, the evaluated quantities were used to correlate facility configuration and trapping efficiency. The major evaluated quantities of the relevant facility configurations, which are considered and discussed in the paper, are listed in the Appendix B, Table A2.
3.2.1. Basin Length
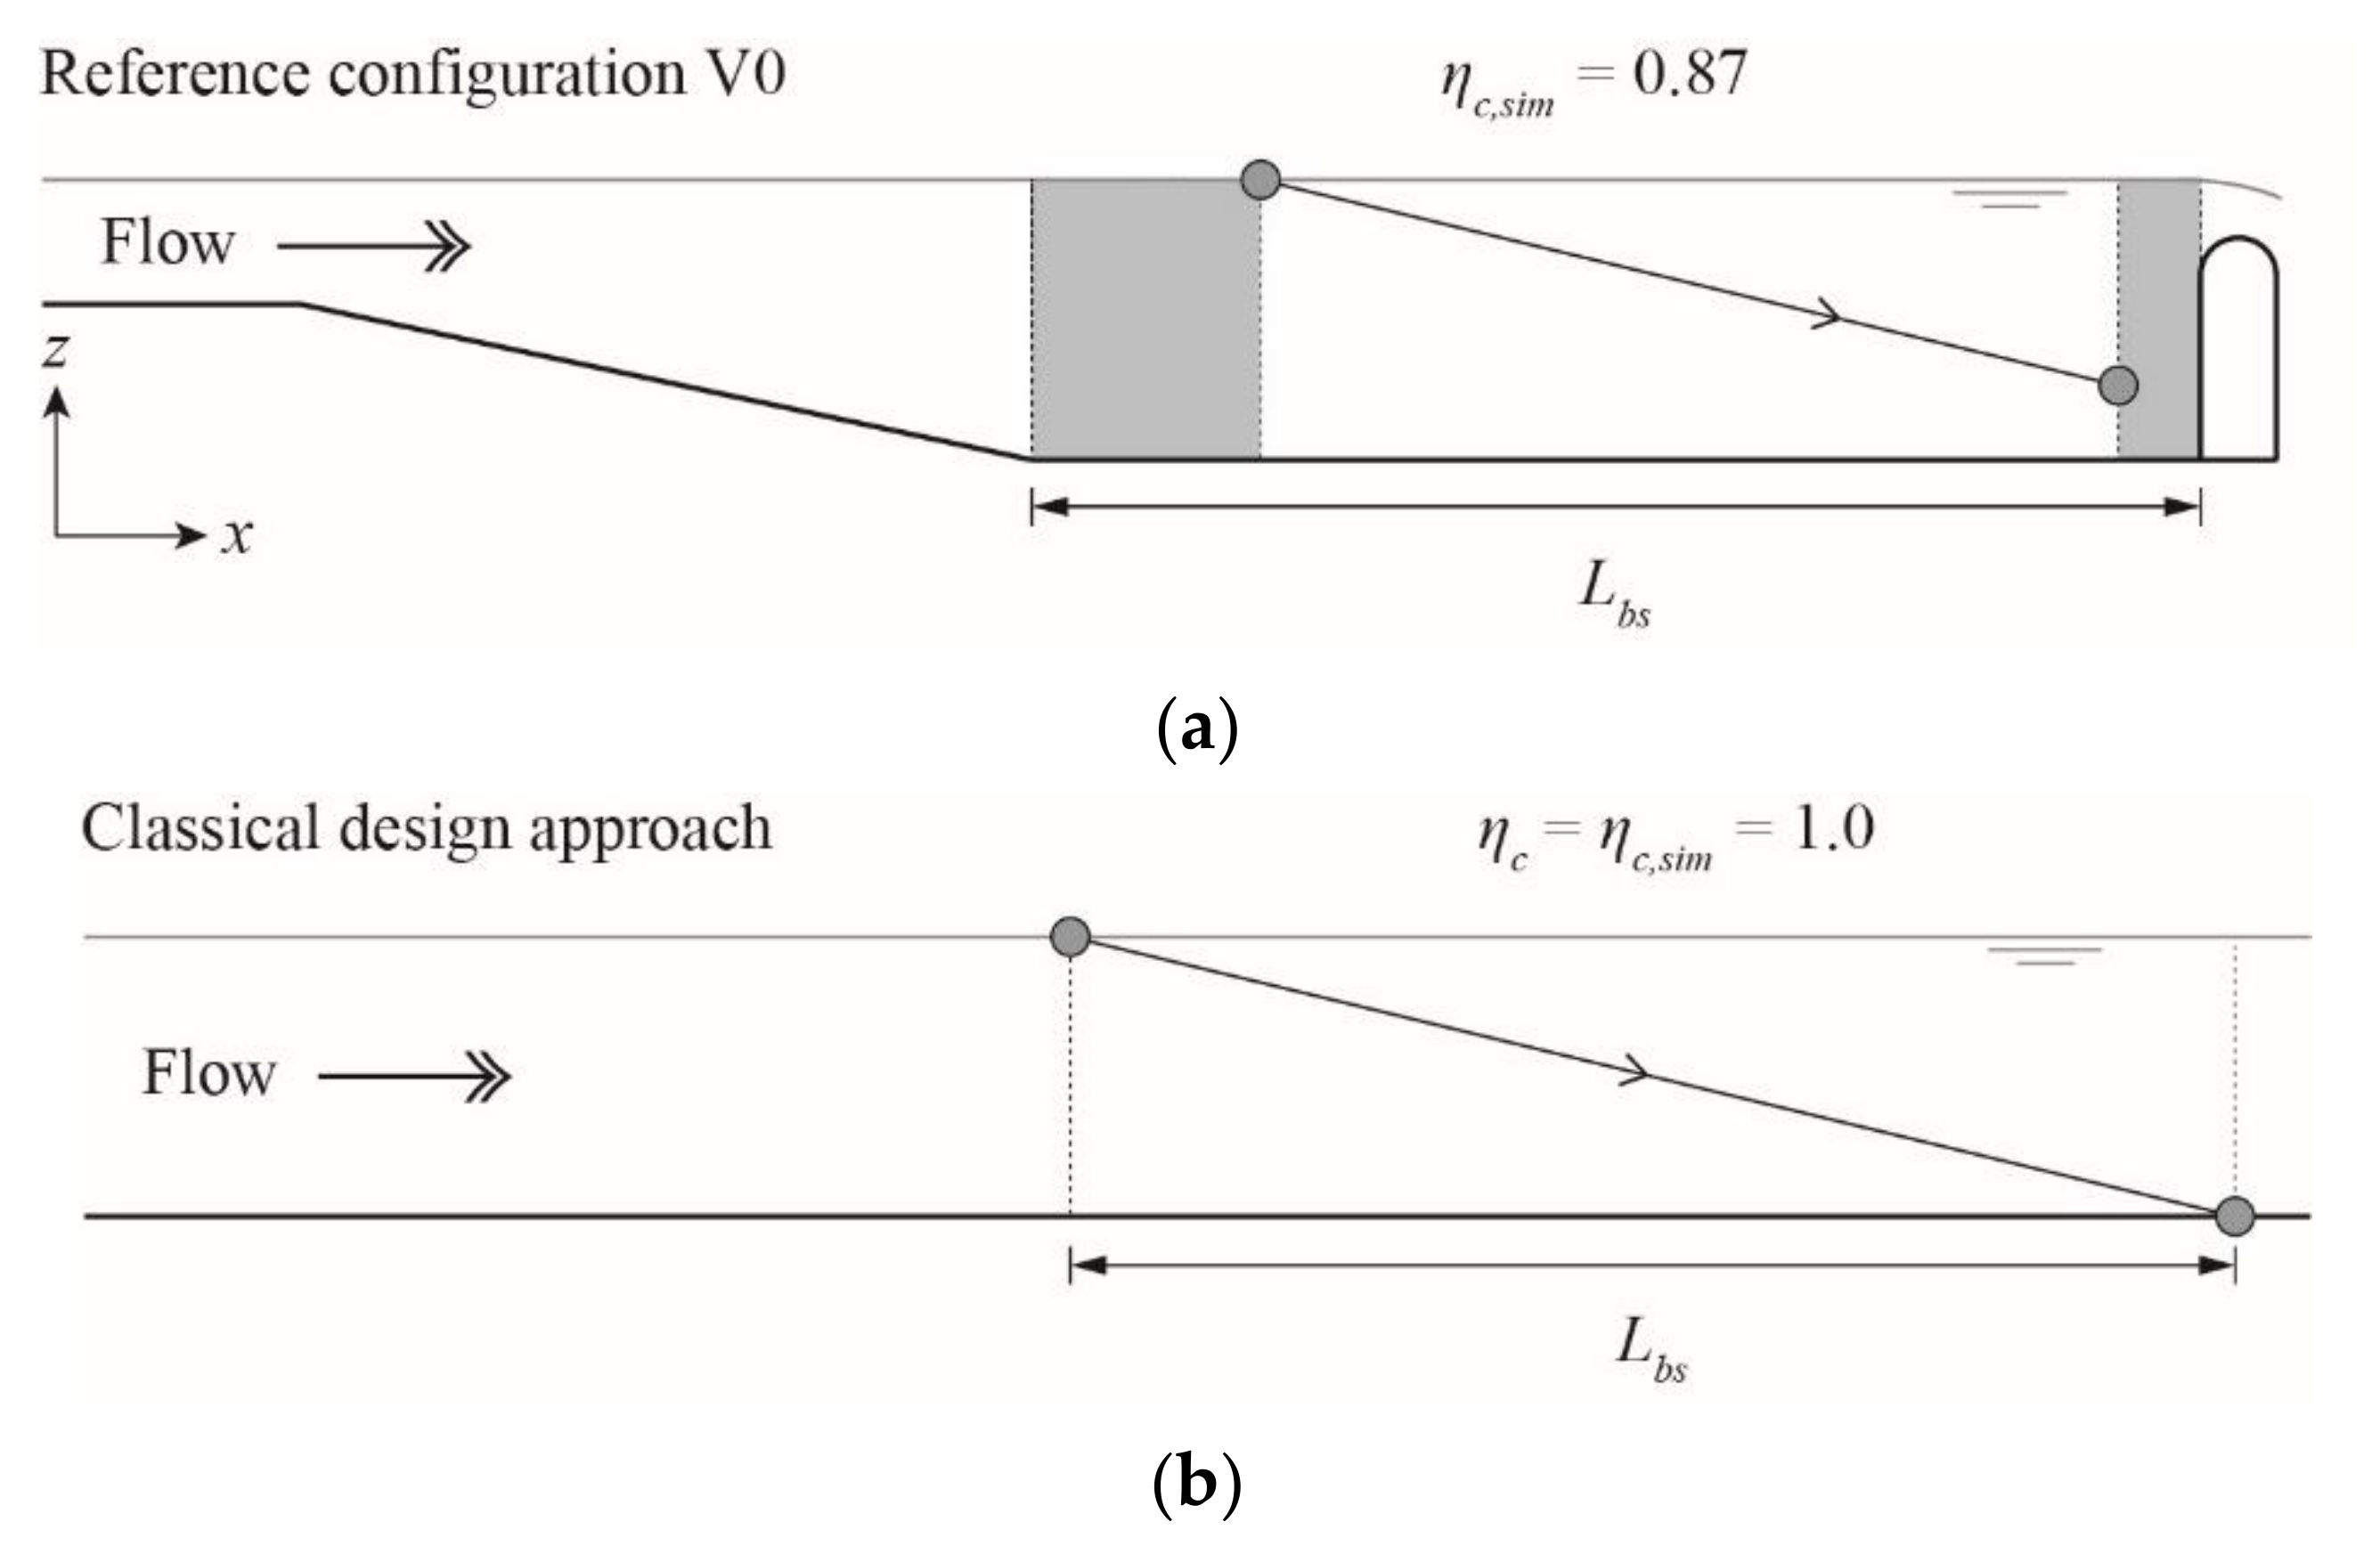
The simulation result of the reference configuration is shown in Figure 7, where flow is illustrated by streamlines along the basin middle axis, revealing a significant flow recirculation downstream of the transition zone and an upwards deflection of the flow several meters upstream of the weir. The reference configuration with Lbs = 32 m resulted in a trapping efficiency for the critical particle diameter of ηc,sim = 0.87 (Figure 10a). For similar flow conditions in the main part of the basin but in absence of a transition zone and end weir, a basin length of Lbs = 32 m was sufficient to achieve complete settling of particles with diameter dcr = 330 µm according to the classical design approach (Figure 10b). This has been reproduced by numerical simulations of a configuration with a geometry according to the classical design approach (ηc,sim = 1 for Lbs = 32 m) to verify the numerical model robustness.
As expected, the parameter study (configurations V7.1 to V7.5, Table A2) shows that the variation of basin length Lbs markedly affects the trapping efficiency, i.e., trapping efficiency increases with increasing basin length. For basins shorter than the reference configuration (V7.1 to V7.5, Table A1, with Lbs = 8 m and 16 m, respectively), i.e., for relative basic basin length χ = Lbs/Lbs,V0 < 1, no clear delineation of the recirculation zone is possible, because the recirculating flow extends along the entire basin to the weir, which leads to lower trapping efficiencies than for V0, resulting in relative efficiencies (Equation (6)) below unity, i.e., ηc,rel < 1.
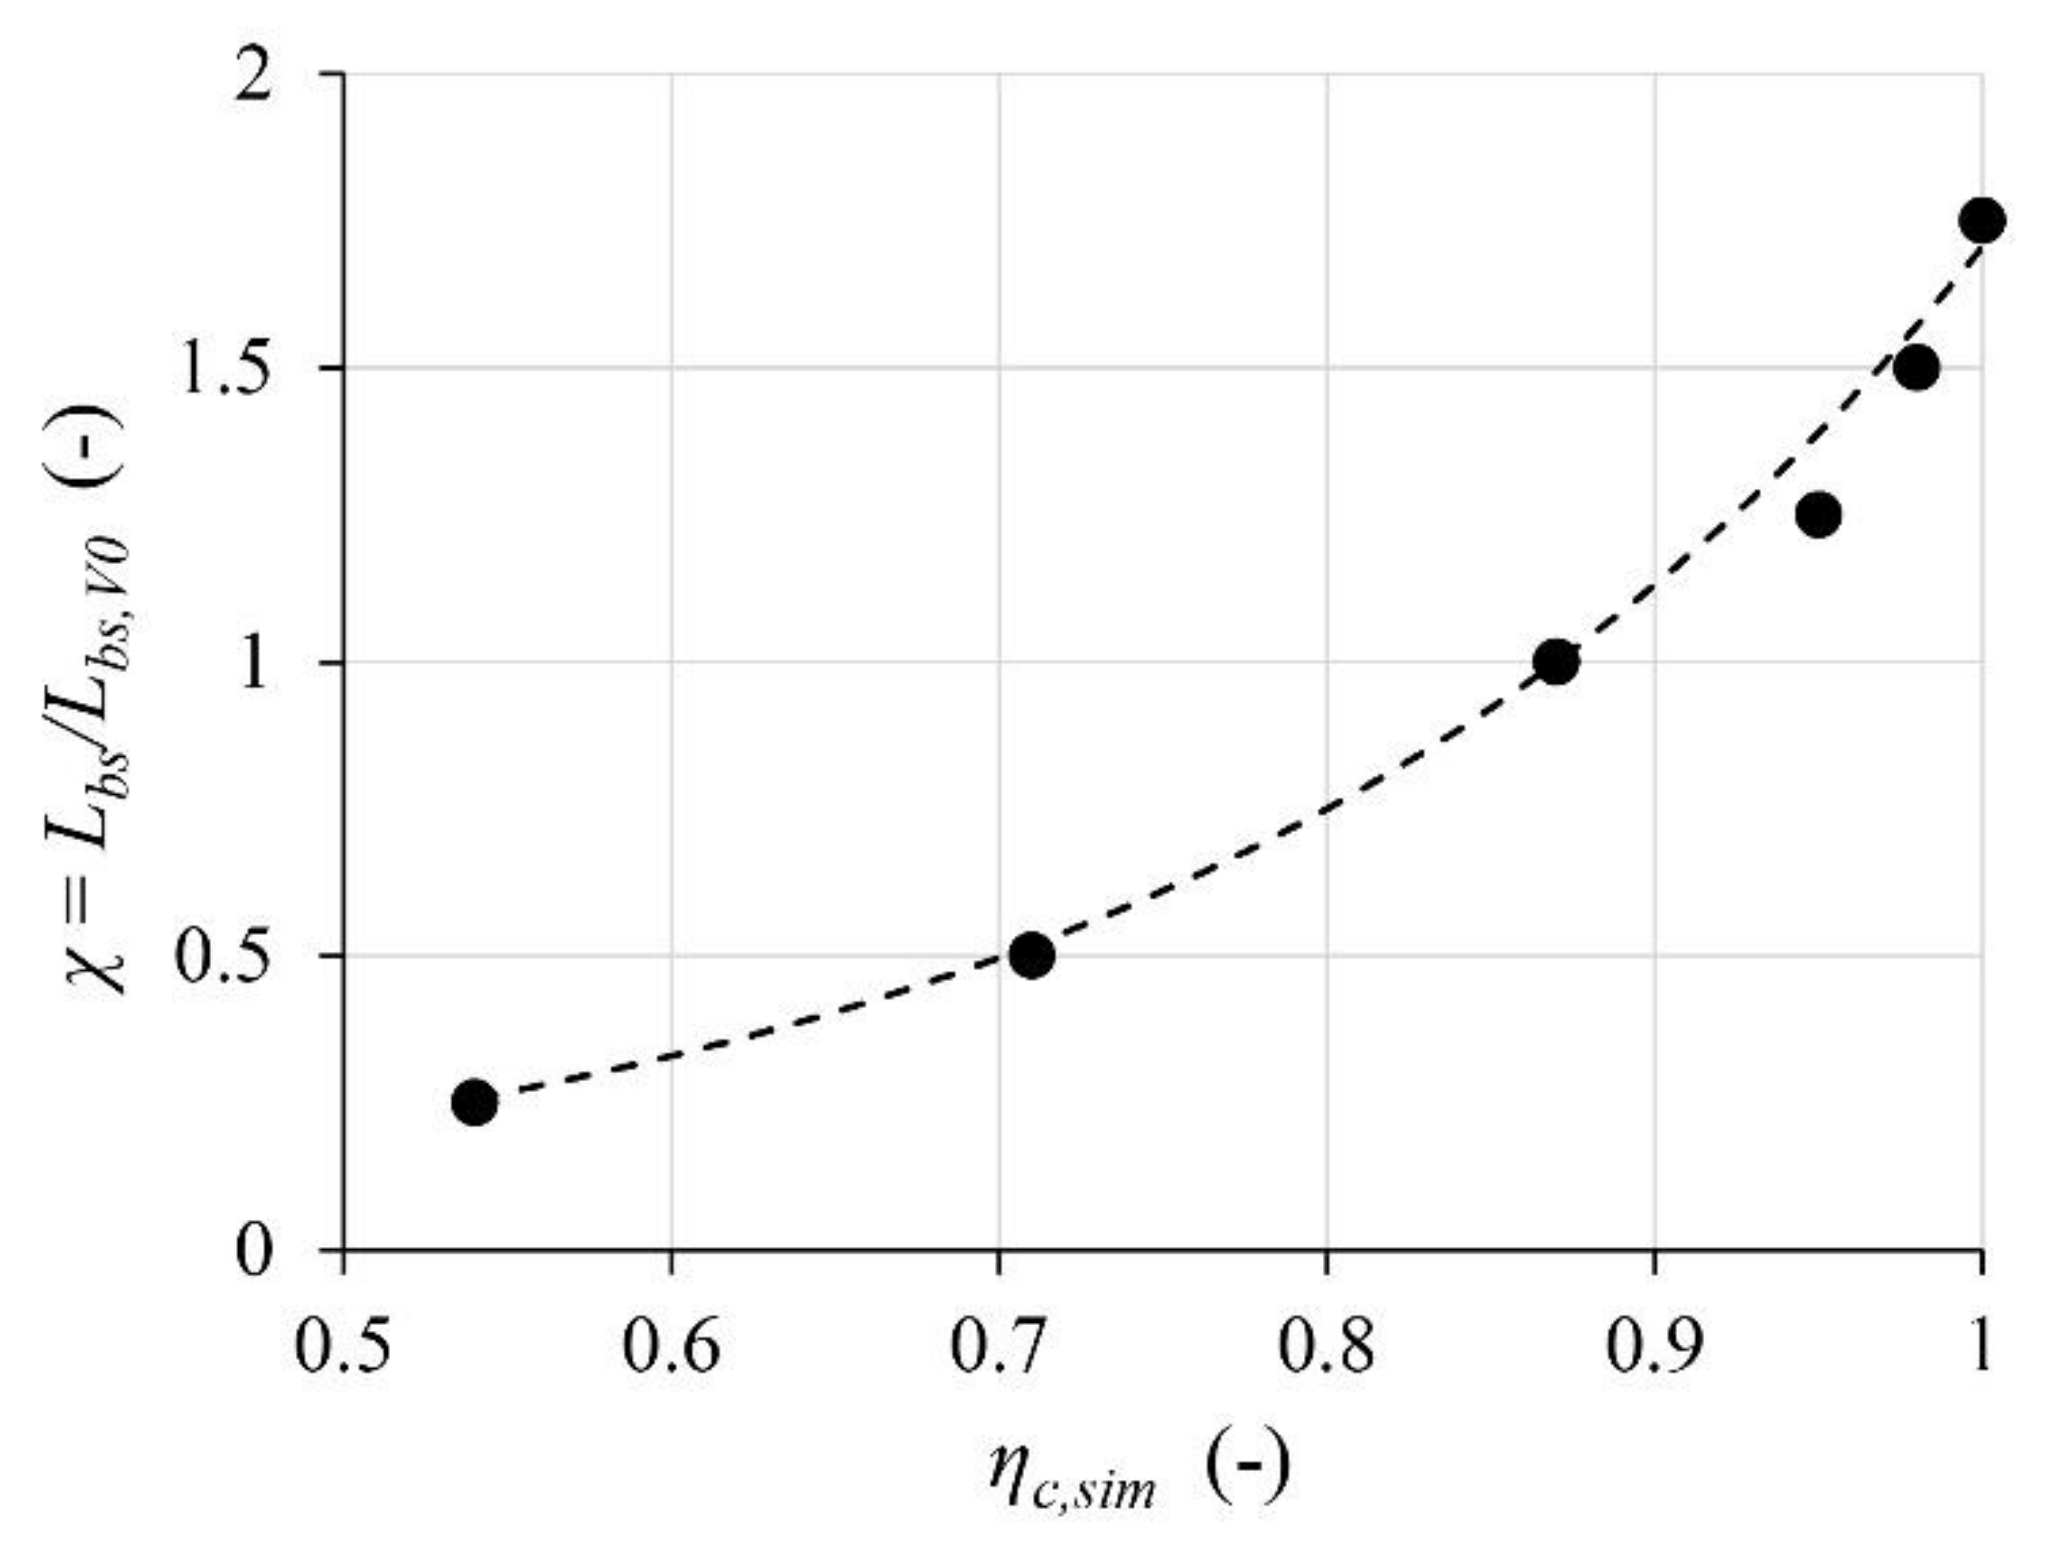
For basins with Lbs ≥ 32 m, the mean basin bed shear velocity levels were at about 1.0 cm/s. This is because the bed shear velocity in the upstream part of the basin was strongly affected by the flow conditions in the transition zone, whose effect diminishes for longer basins. This agrees with the fact that xr and xup became independent of Lbs and remained constant at 13.1 m and 6 m, respectively. For Lbs = 40 m (25% longer than V0, i.e., χ = 1.25), almost all particles equal to or larger than the critical diameter were trapped, i.e., ηc,sim = 0.95. Complete trapping of the critical diameter dcr = 330 µm was achieved for Lbs = 56 m (75% longer than V0, i.e., χ = 1.75). Particles remained in suspension for such a long distance because the recirculation triggered by the transition zone led to a compression of streamlines in the upper part of the water column, and thus uniform flow can hardly be established in the basin (Figure 7). The weir at the end of the basin also affected basin flow but with minor effect. Thus, with an increase of 25% in basin length, the trapping efficiency increased from 0.87 to 0.95, but to achieve 1.0 an additional 75% of basin length relative to the basic length was necessary (Figure 11).
Based on the simulated trapping efficiencies ηc,sim for configurations of varying basin length (V0 and V7.1 to V7.5, Table A2), the relative basic basin length χ = Lbs/Lbs,V0 for expected prototype trapping efficiency ηc,d can be expressed by the basin length factor (R2 = 0.99)
Based on the above considerations, the selection of expected prototype trapping efficiency may rely on economic aspects, e.g., maintenance costs due to turbine abrasion versus increasing investment costs for longer basins (e.g., desanding facility built in cavern) and construction site constraints.
3.2.2. Inlet Channel and Approach Flow Conditions
Froude Number: In case of supercritical approach flow as observed, e.g., below bottom intakes in steeply sloped rivers (parameter study configurations V5.3 and V5.4, with Fo = 2.0 and 3.5, respectively), a hydraulic jump formed in the transition zone region that led to a recirculation zone at the water surface and a near-bed jet, both extending nearly to the middle of the basin. The mean basin turbulent kinetic energy km was about doubled, and the mean basin bed shear velocity u*m about quadrupled compared to V0 (Fo = 0.35), resulting in a reduction in trapping efficiency ηc,sim of about 12% for the investigated configurations, and thus
Because of the dominance of the hydraulic jump, the effect of channel course geometry (see next paragraph) on trapping efficiency is considered to be negligible for the supercritical approach flow.
Channel course: At excessive approach flow asymmetry in terms of small inlet channel radii r and inlet channel conjunction angles γ, the resulting trapping efficiency ηc,sim was 2 to 6% lower compared to V0 (Figure 12). In contrast, a slightly curved (r > 10 m) or slightly angled (130° < γ < 180°) inlet channel favored the trapping efficiency according to the simulation results. This could be due to the weakened flow momentum in basin direction, which is accompanied by decreased flow recirculation at the vertical expansion. With increasing r or γ, the volumetric fraction of recirculating flow Λ also increased linearly. The combination of both reveals that the more asymmetric the approach flow, the shorter the overall basin flow recirculation zone. Moreover, the mean basin bed shear velocity u∗m increased about linearly at increasing approach flow asymmetry. Furthermore, for particle sizes smaller than the critical diameter, the trapping efficiencies were markedly more reduced, indicating a particle-size-specific response to the flow field. For curved (R2 = 0.86) or angled (R2 = 0.98) inlet channel (units are omitted in all correlations hereafter), the parameter study yielded:
3.2.3. Transition Zone Geometry and Recirculating Flow
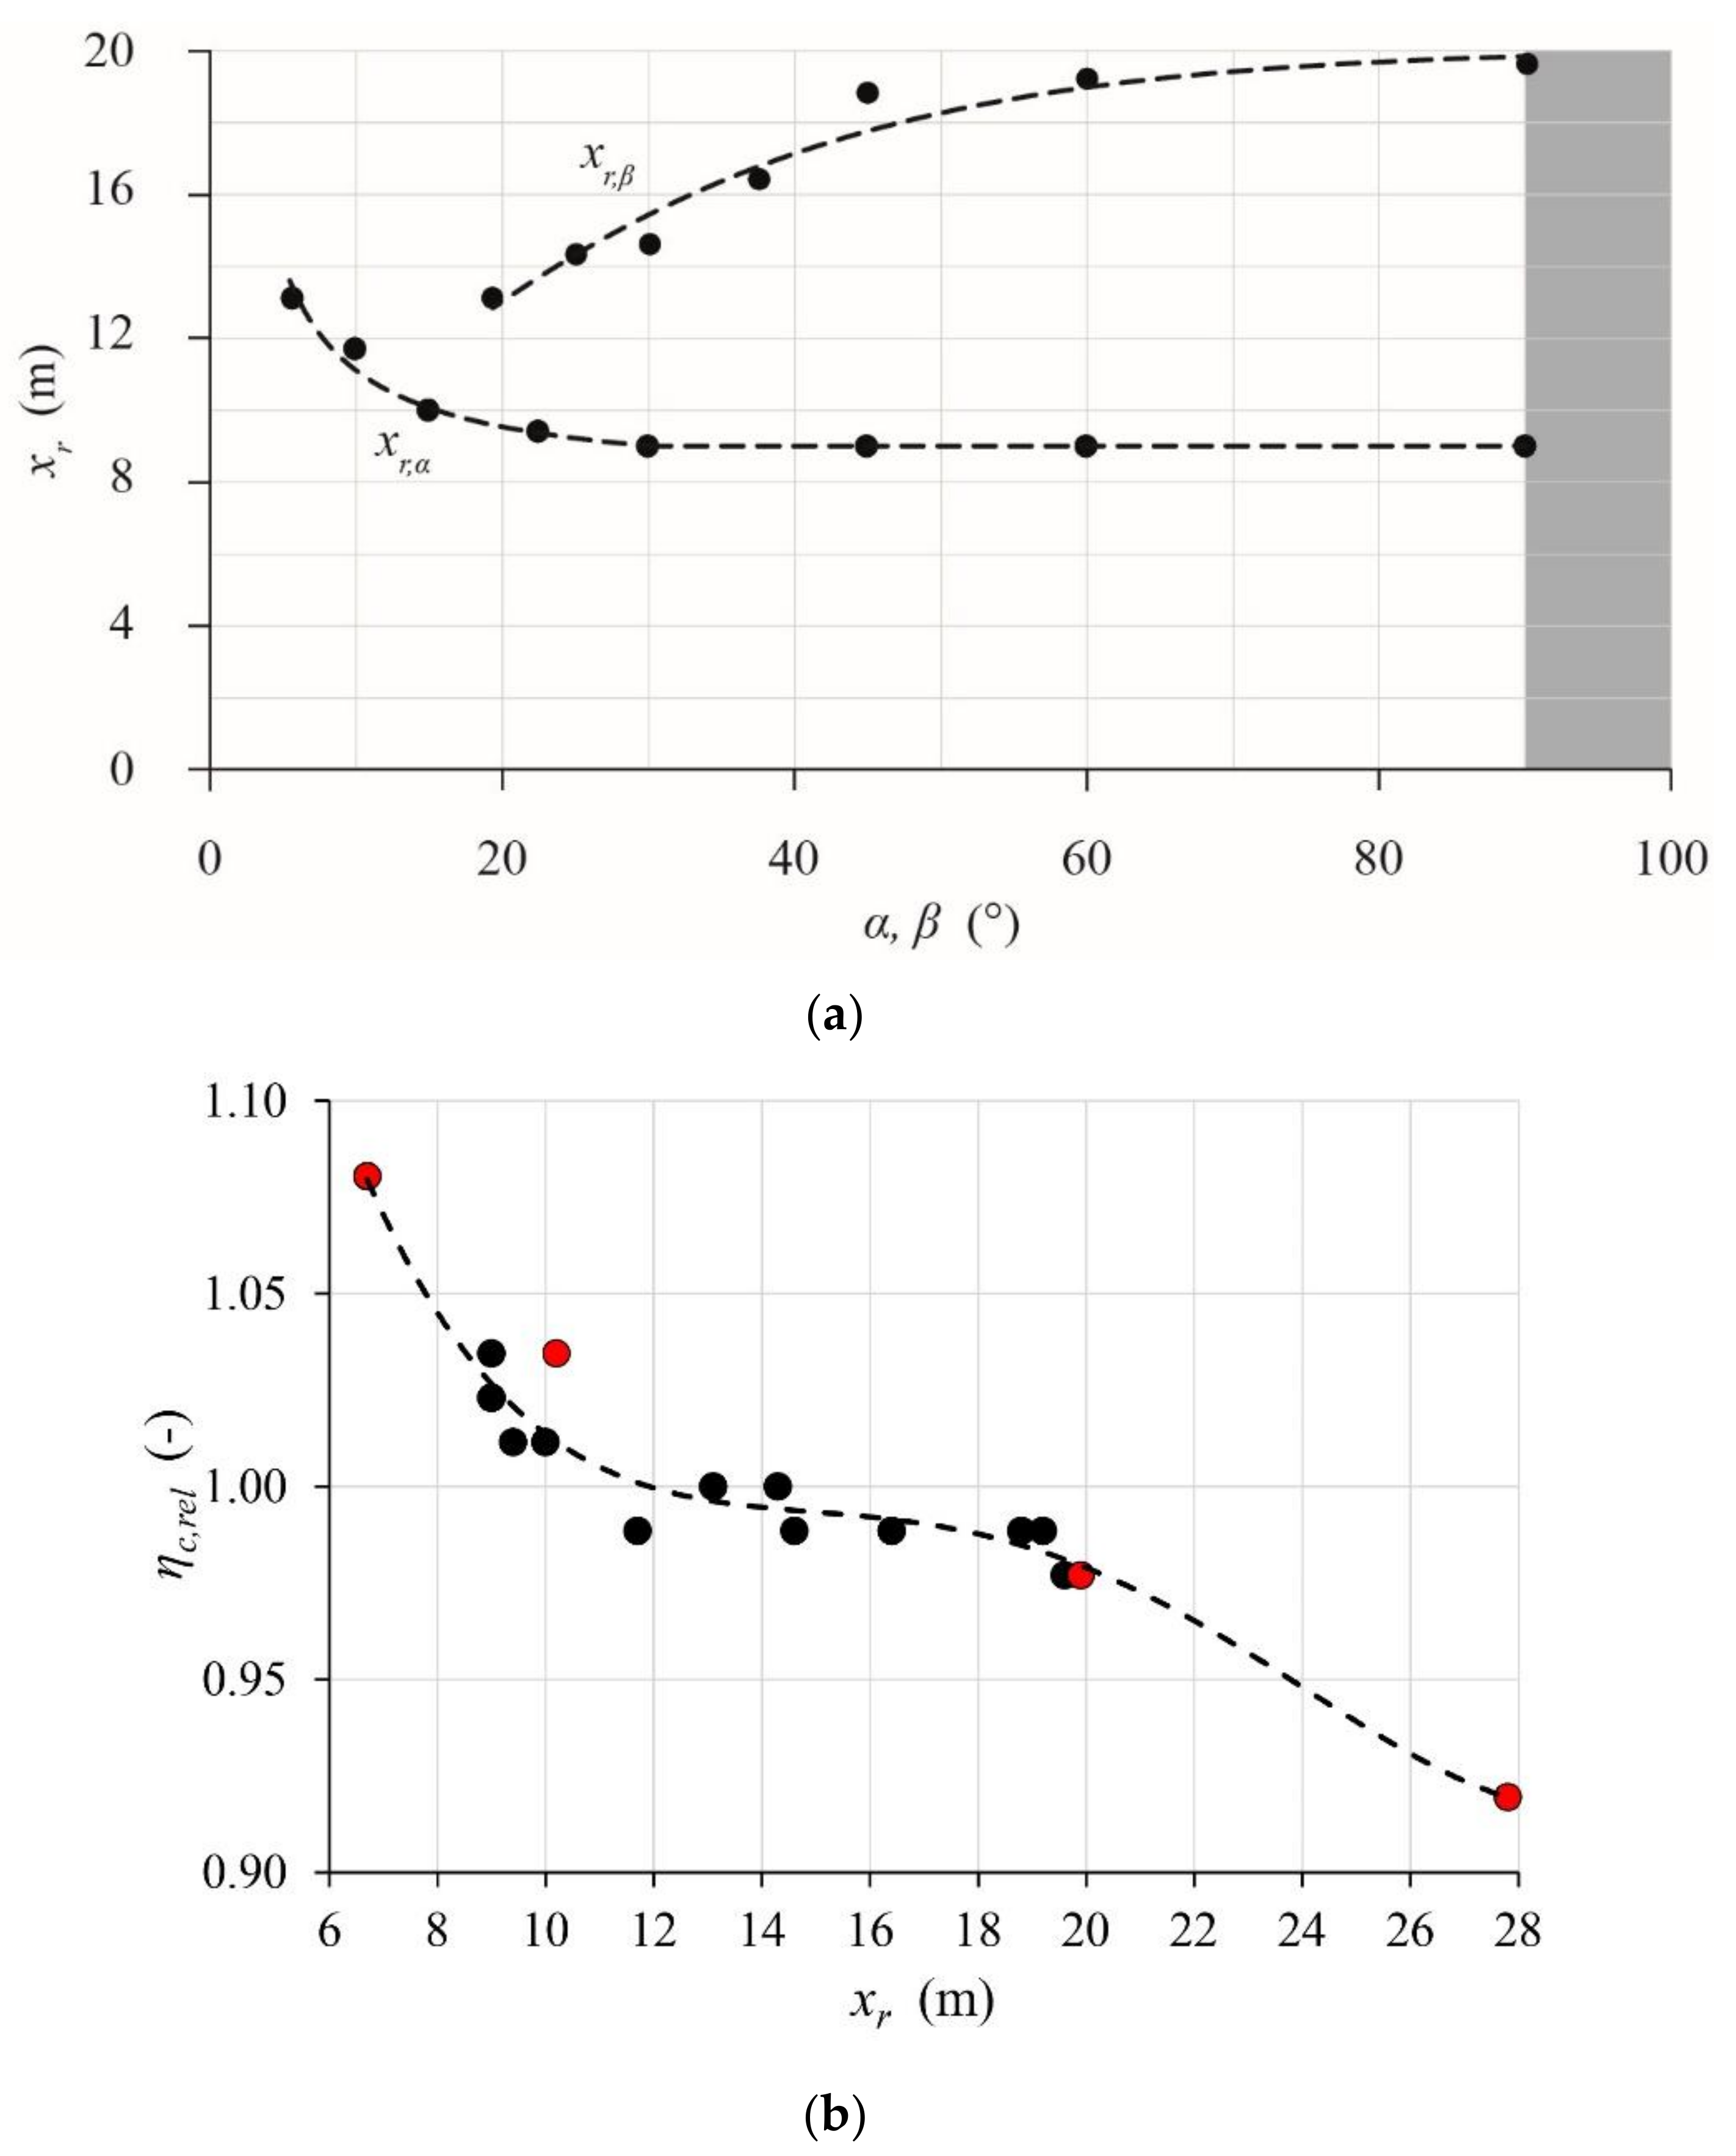
Horizontal expansion angle: The overall effect of the transition zone horizontal expansion angle α on the basin flow field and trapping efficiency ηc,sim was minor. Values of turbulent kinetic energy km and recirculation zone length xr were virtually constant for α = 90, 60, 45 and 30°, while they increased for α = 22.5, 15, 10 and 5.7°. Values of u∗m were almost constant across the whole range of investigated angles (configurations V2.1 to V2.7, Table A2). Figure 13a shows the correlation between α and xr. The increasing values can be explained by the location of recirculating flow, which was shifted towards the basin with decreasing α. In contrast, for large α values lateral flow recirculation mainly occurred within the transition zone. For the recirculation zone length xr the parameter study yielded (R2 = 0.96)
Vertical expansion angle: An increase in the vertical expansion angle β from 19.3° (configuration V0) to 90° (configuration V3.6) led to a consistent increase in km, u∗m and xr of up to 50%. As shown in Figure 13a, the correlation between β and xr can be approximated by the hyperbolic tangent regression function (R2 = 0.95)
Transition zone length: The systematic variation of the transition zone length Ltz (configurations V4.1 to V4.4) defines values of the horizontal and vertical expansion angles (cf. Table A1). Thus, the effect of Ltz on the recirculation zone length xr is in line with the above findings, but the resulting range of relative trapping efficiencies ηc,rel was slightly extended (Figure 13b). The relative trapping efficiency ηc,rel increased with decreasing xr values.
Varying the transition zone geometries defined by α and β affects the extent of xr, which in turn results in different trapping efficiency ηc,sim. As shown in Figure 13b the correlation between xr and ηc,rel can be approximated by a polynomial function. Based on the parameter study (R2 = 0.95) it follows
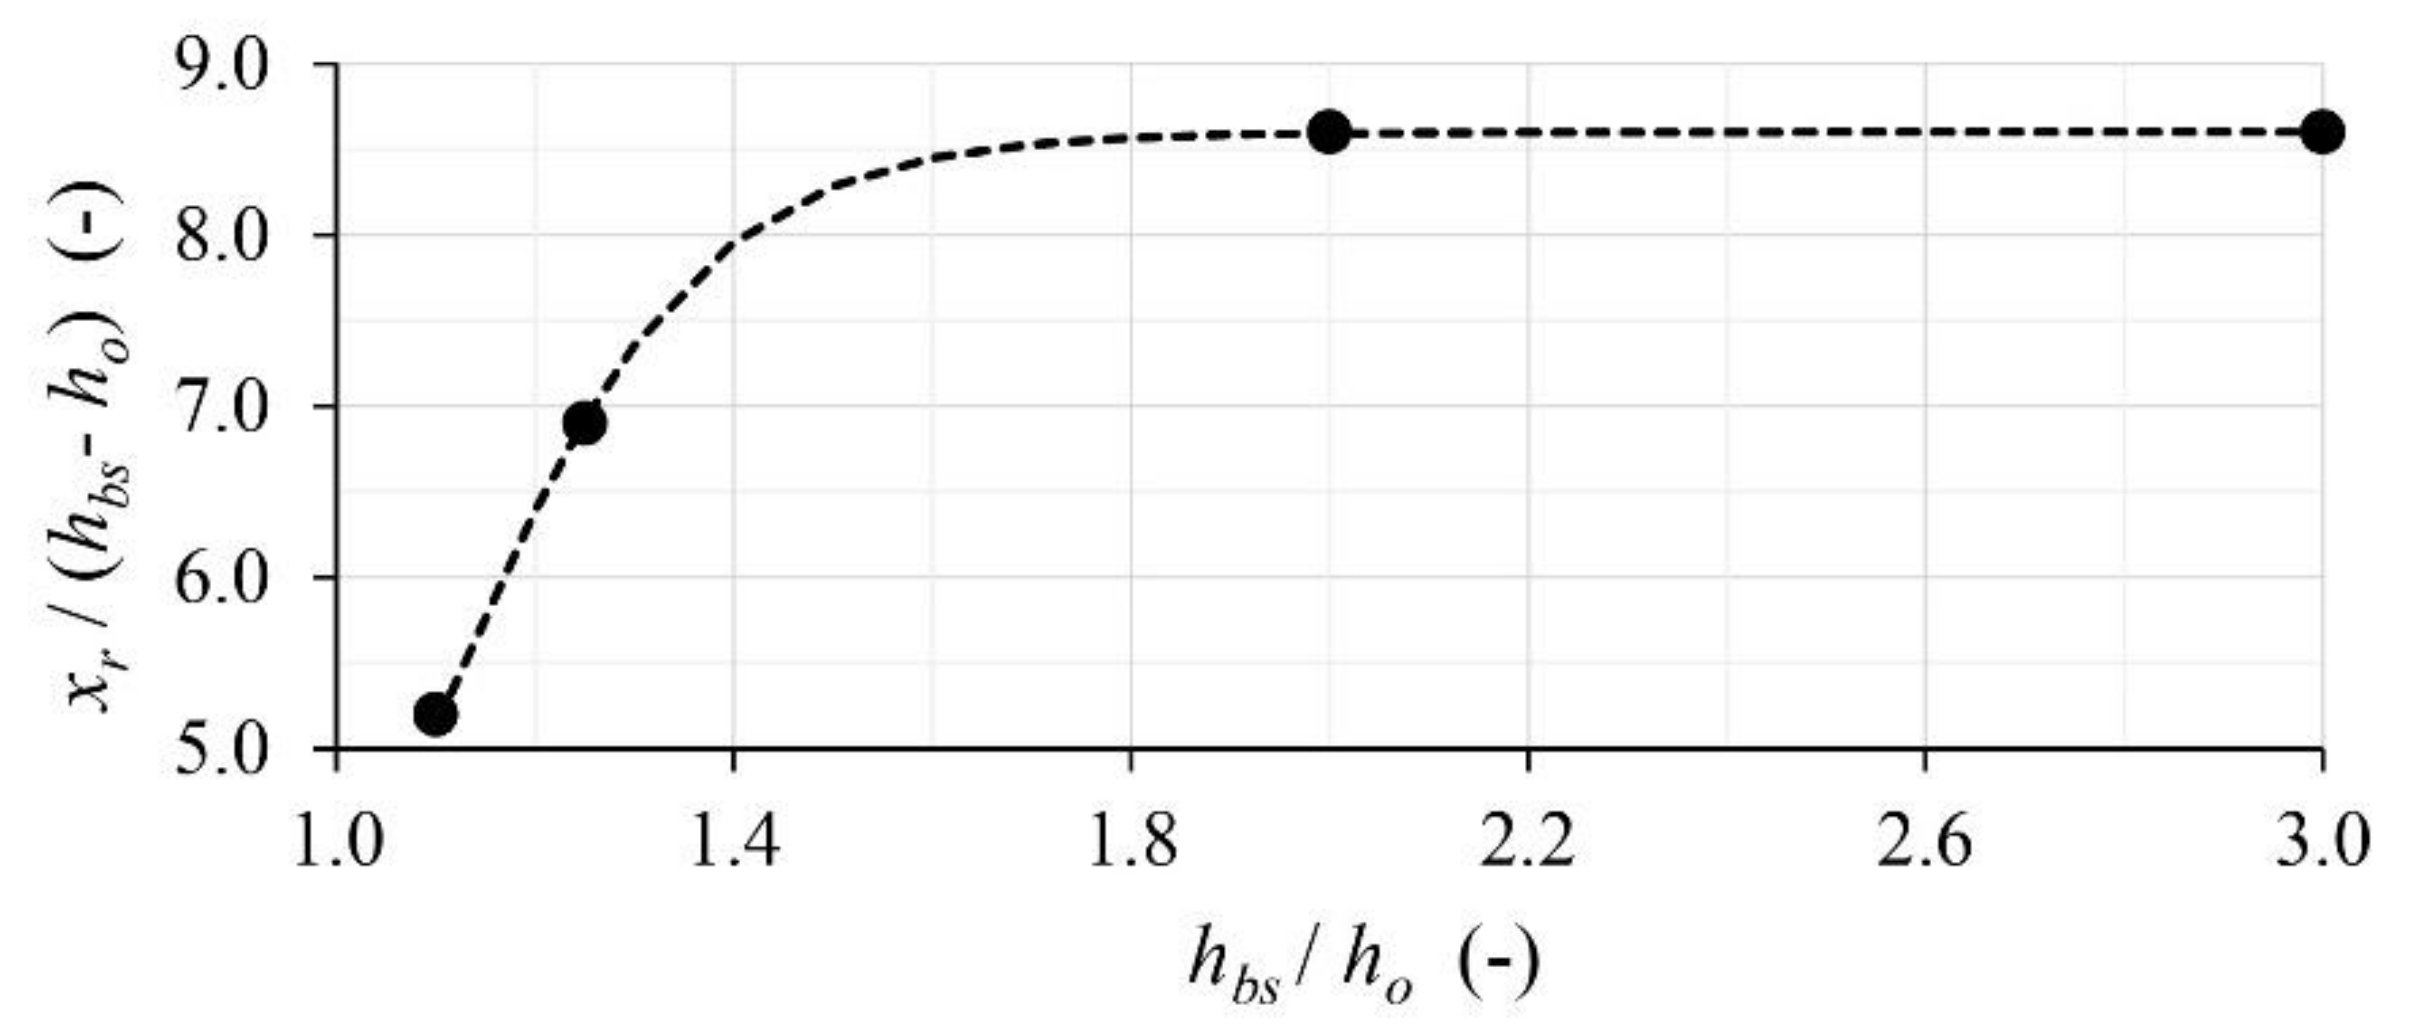
Offset in bottom level of inlet channel and basin: Complementary, to account for the offset in bottom level of inlet channel and basin, the approach of Durst and Tropea [29] for recirculating flow over a backwards-facing step, i.e., for β = 90°, may be adapted. Their findings allow for the estimation of the recirculation zone length xr based on a vertical expansion ratio and step height (Figure 1). For a fully turbulent approach flow, i.e., an approach flow with a Reynolds number Ro > 2 × 10⁴, they found that the expansion ratio is independent of Ro. At prototype desanding facilities, Ro is usually in the order of 105 to 106.
3.2.4. Tranquilizing Racks
Tranquilizing racks (configurations with suffix “r” in Table A2) significantly influence basin hydraulics. Compared to the corresponding configurations without racks, the mean basin turbulent kinetic energy km decreased by 53 to 83%, and u∗m decreased by 5 to 60%. Moreover, under asymmetric approach flow conditions a slight reduction in the recirculating flow zone could be identified (configurations V1.1_r and V8.3_r). The effect on basin hydraulics was also expressed by an increase in trapping efficiency ηc,sim by up to 8% relative to the basic configuration. The increase in trapping efficiency was more pronounced at configurations with asymmetric approach flow conditions, where the flow became aligned and more uniform due to the tranquilizing racks.
The investigated parameter variations are grouped according to approach flow conditions: symmetric (frontal), subcritical approach flow (configurations V0_r, V2.1_r, V2.5_r, and V3.1_r), asymmetric (curved or angled) subcritical approach flow (V1.1_r and V8.3_r) and symmetric (uniform) supercritical approach flow (V5.4_r). For each group, the mean tranquilizing rack effect on the trapping efficiency relative to the configurations without rack was
3.2.5. Weir
The weir at the basin end leads to streamline deflection and concentration (Figure 7). Upstream of the weir, there are regions with upward directed flow that are observed over almost the whole flow depth and basin width.
The extent of weir approach flow in terms of distance xup can hardly be estimated for configurations, that lead to partially swirled and helicoidal basin flow. In particular, this holds for configurations with asymmetric approach flow conditions. Thus, to evaluate the effect of the end weir on the trapping efficiency, the following configurations allowing for a distinct identification of xup were selected: V0, V2, V3, V4 and V7.3 to V7.5.
For the selected configurations xup ≈ 3 to 6 m (Table A2), desanding facility geometries with higher xr values show lower xup values and vice versa. In this state, it was found by supplementary simulations that xup (i) showed almost no variation with basin flow velocity vx and (ii) correlated with the ratio of weir overflow depth hwo to weir height hw. The corresponding correlation reads
3.2.6. Special Configurations
Adapted basin geometry and incorporation of additional installations in the transition zone or the basin can have a significant effect on the flow field and the facility performance. For instance, the installation of vertical wall segments at the basin side walls combined with a trapezoidal basin bed (configuration V6.10, Figure 5d) mainly results in increased trapping of particles smaller than the critical diameter. Horizontal deflectors in the transition zone (configuration V6.13, Figure 5e) suppress the development of the typical recirculation zone. Thus, virtually complete trapping (ηc,sim ≈ 1.0) for particles with critical diameter can be achieved, and recirculating flow is reduced or vanishes, i.e., xr becomes zero (Table A2).
The combination of flow deflectors with tranquilizing racks (configuration V6.14, Figure 5f) results in an even better desanding performance, particularly for particles smaller than the critical diameter. With additional tranquilizing racks, the smallest values of mean basin turbulent kinetic energy km were achieved among all investigated geometries.
4. Design Guideline
4.1. General Recommendations
The design of the inlet channel should ensure uniform, subcritical approach flow to the transition zone and avoid sediment aggradation in the channel. For certain boundary conditions such as bottom intakes in steeply sloped rivers, the flow in the approach channel is supercritical. The vertical expansion angle in the transition zone should be as mild as possible (e.g., 1:5 (V:H)) to minimize flow recirculation. In contrast, the horizontal expansion can be realized as a sudden sharp-edged widening, which results in a simpler geometry, leading to reduced construction costs.
Using installations such as tranquilizing racks or flow deflectors is strongly recommended to improve trapping efficiency, especially in situations with asymmetric and/or supercritical approach flow, provided floating debris can be trapped at the water intake to avoid blocking at the rack or deflector structures. Depending on the clear spacing, the latter are likely less prone to blockage. Both types of installations allow for trapping efficiency enhancement of already existing facilities with little effort.
4.2. Enhanced Design Concept
The starting point of the new design concept has been the classical design approach of Camp [3] that defines the basic basin length as used for the reference configuration (Section 2.3.1). In the context of the parameter study, adjustment terms were elaborated, which may reduce or increase the basic basin length to achieve an optimal design with specified trapping efficiency and thus the desired desanding facility performance. In doing so, the effect of approach flow conditions, transition zone geometry, tranquilizing racks and weir at the basin end were considered separately. As special configurations with adapted basin geometry or incorporation of additional installations are very site-specific, they are not considered in the present design concept. The range of parameters used in the enhanced design concept are listed in Appendix C, Table A3.
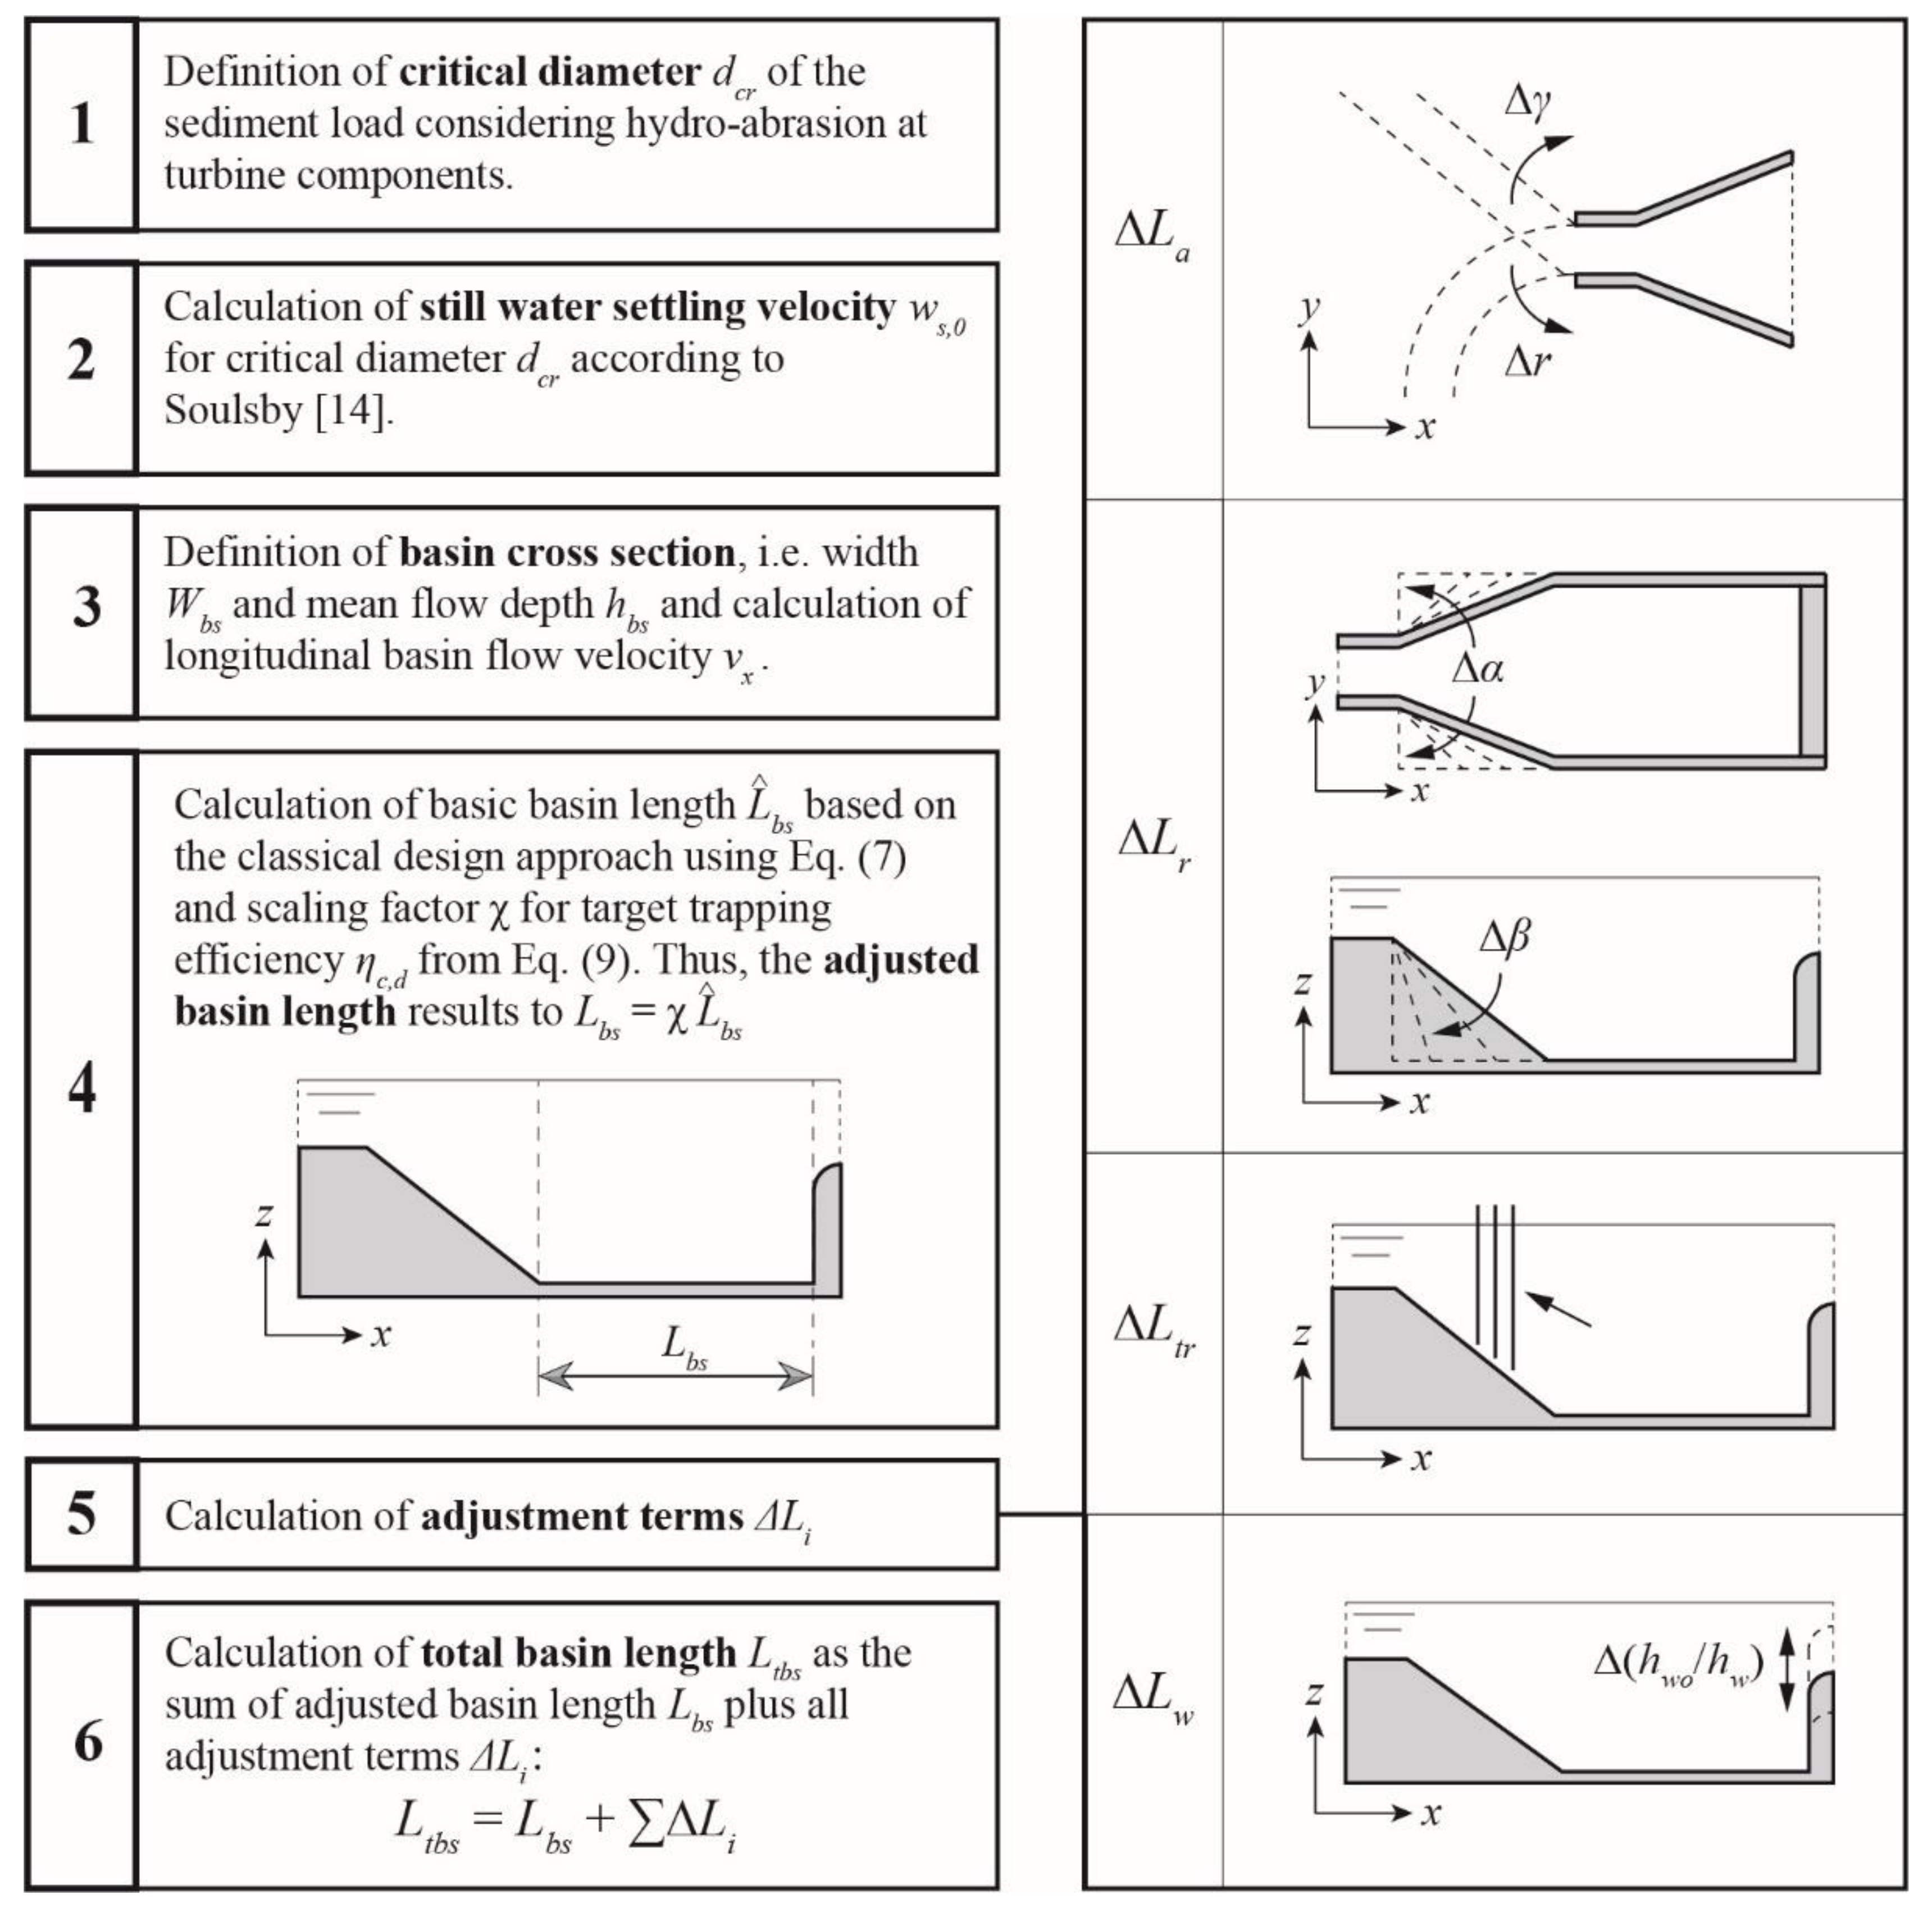
The six main steps of the enhanced design concept are (Figure 15):
- Definition of critical diameter dcr of the sediment load: The definition of the critical diameter may be based either on concentration-related or mass-related approaches. The smaller the critical grain size, the lower the sediment input into the power waterway and the lower hydro-abrasion at turbine components. However, the lower the critical grain size, the more sediment settles in the basin, potentially increasing flushing water volumes lost for power production. The latter largely depends on the flushing system (e.g., continuous vs. discontinuous). The application of the mass-related approach is only possible when a particle size distribution curve of suspended sediment is available. Typical design values of the critical particle diameter are 0.25 to 0.30 mm for water intakes, from which water is conveyed via a desanding facility directly to turbines, i.e., without passing reservoirs or headwater storage basins that would act as settling ponds.
- Calculation of still-water settling velocity for critical diameter dcr using Equation (2). (Note: The present study and concept are based on the approach of Soulsby [17]; using other approaches is inconsistent and may lead to incorrect results).
- Definition of basin cross section and calculation of longitudinal basin flow velocity: The definition of the basin cross section follows the common recommendation Wbs ≈ 0.8 hbs. Here, hbs is the overall basin mean flow depth, which is typically taken in the middle of the basin in streamwise direction for a sloping basin invert. Often, the cross section is rectangular in the upper part, followed by a constriction in the lower part with slopes of 4:5 (V:H) to facilitate sediment flushing. For the rectangular cross section, the longitudinal mean basin flow velocity vx = Qd/(Wbshbs) can be calculated, where Qd is the basin design discharge. For non-rectangular cross section, the mean wetted basin flow area Amean,bs is considered to result in vx = Qd/Amean,bs.
- Calculation of adjusted basin length : First, the basic basin length has to be computed based on the classical design approach using Equation (5). Second, select a target trapping efficiency ηc,d, which may be estimated considering economic aspects and site-specific construction constraints. The larger the target trapping efficiency, the longer the basin, but the lower the sediment input into the power waterway and hydro-abrasive wear at hydraulic machinery. To quantify the latter, turbine erosion models should be applied [30,31,32], allowing for a quantitative cost–benefit assessment of the whole system from desanding facility to hydraulic machines. A design trapping efficiency of ηc,d = 95% is considered meaningful in most cases, resulting in 35% to 40% longer basins compared to the classical approach. Consequently, the scaling factor χ = Lbs/Lbs,V0 (Figure 11) for the target trapping efficiency ηc,d can be determined using Equation (7), and the adjusted basin length results in .
- Calculation of adjustment terms according to Section 3.2:
- Inlet channel geometry and approach flow conditions: with relative trapping efficiency for supercritical approach flow according to Equation (8) and for subcritical approach according to Equation (9);
- Transition zone geometry: with relative trapping efficiency according to Equation (12), where the recirculation zone length xr is the maximum value out of Equation (10) (horizontal expansion α), Equation (11) (vertical expansion β) and the complementary Equation (13) (offset in bottom level);
- Tranquilizing racks: with mean increase in relative trapping efficiency according to Equation (14) for subcritical frontal, subcritical curved or angled, or supercritical approach flow;
- Weir: with extent of weir approach flow in terms of distance xup according to Equation (15).
- Calculation of total basin length , i.e., the sum of adjusted basic basin length plus all adjustment terms .
4.3. Application Example
The above design procedure will be exemplified by the Saas Balen desanding facility featuring tranquilizing racks and a rectangular cross section of the basin. The facility was originally designed according to the classical design approach with an actual basin length Lbs = 35 m, Wbs = 5.8 m, α = 11.3°, β = 18.7° and γ = 158°. The field measurements at the Saas Balen facility yielded hbs = 3.28 m, ho = 1.54 m, hw = 3.92 m, hwo = 0.40 m, Fo = 0.15 and basin design discharge Qd = 2.24 m3/s. The mean basin flow velocity is vx = Qd/(Wbshbs) ≈ 0.12 m/s. Further, the trapping efficiency was found to be ηc = 0.74 for particles of dcr ≈ 200 μm. Now follow the six main steps of the enhanced design concept:
- The critical diameter is an unknown a priori and has to be reckoned back based on the classical design approach. Solving Equation (5) resulted in the still-water vertical settling velocity ws,0 for the given basin length. Consequently, Equation (2) could be solved which resulted in the design particle diameter, representing the critical diameter of the target particle size yielded dcr = 203 μm ≈ 200 μm for water at 5 °C.
- The settling velocity for the critical diameter was obtained in step 1.
- The basin cross section and longitudinal basin flow velocity are given and were determined by field measurements.
- In this example, the basic basin length was equal to the current prototype basin length, corresponding to an arithmetical trapping efficiency of the critical particle size of 87% (see Section 3.2.1, Figure 11). Assuming that maintenance costs due to turbine abrasion are too high for the current facility layout and should be reduced by extending the desander basin in the streamwise direction, to achieve a target trapping efficiency of 95%, the target basic basin length became = 1.39 ∙ 35 m = 48.65 m.
- Adjustment terms:
- Inlet channel geometry and approach flow conditions: for subcritical flow and γ = 158°, ΔLa = (1 − 1.031) ∙ 35 m = −1.09 m;
- Transition zone geometry: with = 10.7 m from Equation (10), = 12.7 m from Equation (11) and = 15.0 m from Equation (13) for an expansion ratio 2.13 and a step height 1.74 m, the critical relative trapping efficiency due to recirculating flow became from Equation (12), so that ΔLr = (1 − 0.992) ∙ 35 m = 0.27 m;
- Tranquilizing racks: for a subcritical, asymmetric (angled) approach flow from Equation (14) ΔLtr = (1 − 1.09) ∙ 35 m = –3.15 m;
- Weir: for 0.10 from Equation (15) ΔLw = = 6.30 m.
- The total basin length required to achieve 95% trapping of particles dcr = 200 μm resulted from Ltbs = 48.65 m − 1.09 m + 0.27 m − 3.15 m + 6.30 m ≈ 51 m.
The calculated required total basin length to achieve a 95% trapping efficiency was 16 m (+46%) longer than for the prototype facility for target design particles dcr = 200 μm.
5. Conclusions
The performance of prototype desanding facilities, which were designed according to the classical approach of Camp [3] and current design recommendations, is often below expectations, and related hydropower infrastructure is affected by added maintenance costs. The lack of performance may be attributed to too-short basins with large non-uniform flow regions.
In the present paper, the flow in desanding facilities with both a classical layout and with geometry variations was systematically studied by means of an extensive parameter study using CFD simulations. The results allowed us to quantify the effect of specific design parameters in terms of trapping efficiency and to deduce corresponding length adjustment terms. Consequently, an enhanced design concept for desanding facilities to optimize trapping efficiency is presented. As a main advantage over the classical design approach, the new procedure takes approach flow conditions, a flow transition to the settling basin and the effect of the weir at the basin end as well as that of tranquilizing racks in the transition zone into account. The proposed procedure enables a reliable estimate of the required basin length to achieve an optimal design with specified trapping efficiency for the selected critical particle diameter and thus the desired desanding facility performance.
The numerical simulations show that strongly bent or angled inlet channels result in a pronounced non-uniform approach flow and may cause distinct trapping efficiency to decrease. The same holds for a supercritical approach flow. Local recirculation zones result from both horizontal and vertical expansions of the transition zone lead, of which the latter has a smaller effect on trapping efficiency. A moderate approach flow non-uniformity has also only a minor effect on trapping efficiency. In particular, it should be noted that the extent of the end weir approach flow must be considered as an additional and rather rigid part of the basin length. On the other hand, tranquilizing racks generally improves trapping efficiency. This improvement is greater for supercritical or strongly non-uniform approach flow conditions than for subcritical and uniform approach flows. Moreover, for existing facilities, additionally incorporating flow deflectors and the like may increase facility performance. This is particularly relevant for existing facilities, where an adjustment of basin length is not possible or very costly.
With the proposed design procedure, trapping efficiencies of desanding facilities, both for already-built and green-field projects, can be improved by considering the whole facility as an integral system. This makes the procedure attractive to planning engineers and facility operators, particularly against the backdrop of a reduction in the turbine wear of affiliated hydropower plants.
Author Contributions
For this research article, the specifying of the individual contributions of the authors is as follows: main investigation, C.P.; concept of study, C.P., D.F.V. and R.M.B.; writing—original draft preparation, C.P. and D.F.V.; writing—review and editing, D.F.V. and R.M.B.; supervision, D.F.V. and R.M.B. All authors have read and agreed to the published version of the manuscript.
Funding
The project was financially supported by the Swiss National Science Foundation (SNSF) within the National Research Programme NRP 70 “Energy Turnaround”, Project No. 153861.
Institutional Review Board Statement
Not applicable.
Acknowledgments
This study was conducted as part of the Swiss Competence Center for Energy Research—Supply of Electricity (SCCER-SoE). The project was technically supported by EnAlpin AG, Gommerkraftwerke AG and the Swiss Federal Railways.
Conflicts of Interest
The authors declare no conflict of interest.
Appendix A

Table A1.
Relevant desanding facility configurations of parameter study.
| Variation | r | γ | Ltz | α | β | Lbs | Fo |
|---|---|---|---|---|---|---|---|
| (m) | (°) | (m) | (°) | (°) | (m) | (–) | |
| V0 | ∞ | 180 | 10 | 5.7 | 19.3 | 32 | 0.35 |
| V1.1 | 2 | – | 10 | 5.7 | 19.3 | 32 | 0.35 |
| V1.2 | 10 | – | 10 | 5.7 | 19.3 | 32 | 0.35 |
| V1.3 | 20 | – | 10 | 5.7 | 19.3 | 32 | 0.35 |
| V1.4 | 5 | – | 10 | 5.7 | 19.3 | 32 | 0.35 |
| V2.1 | ∞ | 180 | 10 | 90 | 19.3 | 32 | 0.35 |
| V2.2 | ∞ | 180 | 10 | 60 | 19.3 | 32 | 0.35 |
| V2.3 | ∞ | 180 | 10 | 45 | 19.3 | 32 | 0.35 |
| V2.4 | ∞ | 180 | 10 | 30 | 19.3 | 32 | 0.35 |
| V2.5 | ∞ | 180 | 10 | 15 | 19.3 | 32 | 0.35 |
| V2.6 | ∞ | 180 | 10 | 10 | 19.3 | 32 | 0.35 |
| V2.7 | ∞ | 180 | 10 | 22.5 | 19.3 | 32 | 0.35 |
| V3.1 | ∞ | 180 | 10 | 5.7 | 90 | 32 | 0.35 |
| V3.2 | ∞ | 180 | 10 | 5.7 | 60 | 32 | 0.35 |
| V3.3 | ∞ | 180 | 10 | 5.7 | 45 | 32 | 0.35 |
| V3.4 | ∞ | 180 | 10 | 5.7 | 30 | 32 | 0.35 |
| V3.5 | ∞ | 180 | 10 | 5.7 | 25 | 32 | 0.35 |
| V3.6 | ∞ | 180 | 10 | 5.7 | 37.5 | 32 | 0.35 |
| V4.1 | ∞ | 180 | 0 | 90 | 90 | 32 | 0.35 |
| V4.2 | ∞ | 180 | 5 | 11.3 | 35 | 32 | 0.35 |
| V4.3 | ∞ | 180 | 15 | 3.8 | 13.1 | 32 | 0.35 |
| V4.4 | ∞ | 180 | 20 | 2.9 | 9.9 | 32 | 0.35 |
| V5.3 | ∞ | 180 | 10 | 5.7 | 19.3 | 32 | 2.0 |
| V5.4 | ∞ | 180 | 10 | 5.7 | 19.3 | 32 | 3.5 |
| V6.3 | based on V0, but with continuously expanding basin area | ||||||
| V6.5 | based on V0, but with impact wall at end of transition zone (TZ) | ||||||
| V6.9 | based on V0, but with longitudinal vertical walls in TZ | ||||||
| V6.10 | based on V0, but with both-sided vertical inclined plates in basin | ||||||
| V6.13 | based on V0, but with horizontal flow deflection plates at beginning of TZ | ||||||
| V6.14 | based on V0, but with horizontal flow deflection plates and tranquillizing racks in TZ | ||||||
| V7.1 | ∞ | 180 | 10 | 5.7 | 19.3 | 8 | 0.35 |
| V7.2 | ∞ | 180 | 10 | 5.7 | 19.3 | 16 | 0.35 |
| V7.3 | ∞ | 180 | 10 | 5.7 | 19.3 | 40 | 0.35 |
| V7.4 | ∞ | 180 | 10 | 5.7 | 19.3 | 48 | 0.35 |
| V7.5 | ∞ | 180 | 10 | 5.7 | 19.3 | 56 | 0.35 |
| V8.1 | ∞ | 160 | 10 | 5.7 | 19.3 | 32 | 0.35 |
| V8.2 | ∞ | 140 | 10 | 5.7 | 19.3 | 32 | 0.35 |
| V8.3 | ∞ | 120 | 10 | 5.7 | 19.3 | 32 | 0.35 |
| V8.4 | ∞ | 170 | 10 | 5.7 | 19.3 | 32 | 0.35 |
| V8.5 | ∞ | 150 | 10 | 5.7 | 19.3 | 32 | 0.35 |
| V8.6 | ∞ | 130 | 10 | 5.7 | 19.3 | 32 | 0.35 |
Appendix B
Table A2.
Evaluated quantities from numerical simulation of desanding facility configurations.
| Variation | kt,m | u*m | xr | xup | ηc,sim | ηc,sim/ηc,V0 |
|---|---|---|---|---|---|---|
| (cm2/s2) | (cm/s) | (m) | (m) | (–) | (–) | |
| V0 | 249 | 1.0 | 13.1 | 6 | 0.87 | 1.00 |
| V0_r | 62 | 0.5 | 25.2 | n/a | 0.92 | 1.06 |
| V1.1 | 198 | 3.1 | 10.9 | n/a | 0.85 | 0.98 |
| V1.1_r | 66 | 2.6 | 9.8 | n/a | 0.94 | 1.08 |
| V1.2 | 185 | 1.8 | 14.4 | n/a | 0.91 | 1.05 |
| V1.3 | 211 | 1.2 | 15.3 | n/a | 0.90 | 1.03 |
| V1.4 | 203 | 3.0 | 11.4 | n/a | 0.85 | 0.98 |
| V2.1 | 232 | 0.9 | 9.0 | 6 | 0.89 | 1.02 |
| V2.1_r | 83 | 0.5 | 21.3 | n/a | 0.94 | 1.08 |
| V2.2 | 233 | 0.9 | 9.0 | 6 | 0.89 | 1.02 |
| V2.3 | 233 | 0.9 | 9.0 | 6 | 0.90 | 1.03 |
| V2.4 | 234 | 0.9 | 9.0 | 6 | 0.89 | 1.02 |
| V2.5 | 247 | 1.0 | 10.0 | 6 | 0.88 | 1.01 |
| V2.5_r | 63 | 0.4 | 23.2 | n/a | 0.93 | 1.07 |
| V2.6 | 248 | 1.0 | 11.7 | 6 | 0.86 | 0.99 |
| V2.7 | 238 | 1.0 | 9.4 | 6 | 0.88 | 1.01 |
| V3.1 | 365 | 1.5 | 19.6 | 5 | 0.85 | 0.98 |
| V3.1_r | 83 | 0.7 | 32.0 | n/a | 0.91 | 1.05 |
| V3.2 | 354 | 1.3 | 19.2 | 5 | 0.86 | 0.99 |
| V3.3 | 345 | 1.3 | 18.8 | 5 | 0.86 | 0.99 |
| V3.4 | 302 | 1.1 | 14.6 | 6 | 0.86 | 0.99 |
| V3.5 | 277 | 1.1 | 14.3 | 6 | 0.87 | 1.00 |
| V3.6 | 340 | 1.2 | 16.4 | 6 | 0.86 | 0.99 |
| V4.1 | 400 | 1.6 | 27.8 | 3 | 0.80 | 0.92 |
| V4.2 | 336 | 1.2 | 19.9 | 5 | 0.85 | 0.98 |
| V4.3 | 198 | 0.9 | 10.2 | 6 | 0.9 | 1.03 |
| V4.4 | 149 | 0.8 | 6.7 | 6 | 0.94 | 1.08 |
| V5.3 | 437 | 3.9 | 15.0* | n/a | 0.77 | 0.89 |
| V5.4 | 528 | 4.0 | 15.1* | n/a | 0.76 | 0.87 |
| V5.4_r | 246 | 3.8 | 21.3* | n/a | 0.91 | 1.05 |
| V6.3 | 175 | 0.4 | 0.0 | n/a | 0.89 | 1.02 |
| V6.5 | 90 | 1.9 | 7.4 | n/a | 0.91 | 1.05 |
| V6.9 | 276 | 1.4 | 26.7 | n/a | 0.93 | 1.07 |
| V6.10 | 246 | n/a | 6.5 | n/a | 0.90 | 1.03 |
| V6.13 | 64 | 1.9 | 0.0 | n/a | 0.98 | 1.13 |
| V6.14 | 14 | 0.8 | 0.0 | n/a | 0.98 | 1.13 |
| V7.1 | 284 | 1.7 | 8.0 | n/a | 0.54 | 0.62 |
| V7.2 | 356 | 1.2 | 16.0 | n/a | 0.71 | 0.82 |
| V7.3 | 181 | 1.0 | 13.1 | 6 | 0.95 | 1.09 |
| V7.4 | 174 | 1.0 | 13.1 | 6 | 0.98 | 1.13 |
| V7.5 | 165 | 1.0 | 13.1 | 6 | ≈1.0 | 1.15 |
| V8.1 | 222 | 1.2 | 14.3 | n/a | 0.90 | 1.03 |
| V8.2 | 226 | 1.7 | 12.3 | n/a | 0.89 | 1.02 |
| V8.3 | 277 | 3.2 | 11.6 | n/a | 0.82 | 0.94 |
| V8.3_r | 100 | 2.9 | 10.6 | n/a | 0.89 | 1.02 |
| V8.4 | 269 | 0.9 | 10.6 | n/a | 0.88 | 1.01 |
| V8.5 | 208 | 1.8 | 12.9 | n/a | 0.89 | 1.02 |
| V8.6 | 253 | 2.9 | 11.9 | n/a | 0.86 | 0.99 |
n/a = not applicable * at water surface _r = with tranquilizing racks
Appendix C
Table A3.
Range of parameters used in enhanced design concept.
| Parameter | Description | Investigated Values | Units | |
|---|---|---|---|---|
| Lower | Upper | |||
| Lbs | Basin length | 8 | 56 | m |
| Fo | Inlet channel Froude number | 0.35 | 3.5 | – |
| r | Inlet channel radius | 2 | 20 | m |
| γ | Inlet channel conjunction angle | 120 | 180 | ° (angle) |
| α | Transition zone horizontal expansion angle | 5.7 | 90 | ° (angle) |
| β | Transition zone vertical expansion angle | 19.3 | 90 | ° (angle) |
| dcr | Critical particle diameter | 0.06 | 2 | mm |
| hwo/hw | Relative weir overflow depth | 0.14 | 0.67 | – |
References
- Felix, D.; Albayrak, I.; Abgottspon, A.; Boes, R.M. Hydro-abrasive erosion of hydraulic turbines caused by sediment—A century of research and development. In Proceedings of the 28th IAHR Symposium on Hydraulic Machinery and Systems, Grenoble, France, 4–8 July 2016. [Google Scholar]
- Beniston, M.; Farinotti, D.; Stoffel, M.; Andreassen, L.M.; Coppola, E.; Eckert, N.; Fantini, A.; Giacona, F.; Hauck, C.; Huss, M.; et al. The European mountain cryosphere: A review of its current state, trends, and future challenges. Cryosphere 2018, 12, 759–794. [Google Scholar] [CrossRef] [Green Version]
- Camp, T.R. A study of the rational design of settling tanks. Sew. Work. J. 1936, 8, 742–758. [Google Scholar]
- Garde, R.J.; Ranga Raju, K.G.; Sujudi, A.W.R. Design of settling basins. J. Hydraul. Res. 1990, 28, 81–91. [Google Scholar] [CrossRef]
- Ortmanns, C.; Minor, H.E. Flow and turbulence conditions on the design of desilting chambers. Dam Eng. 2007, 17, 257–270. [Google Scholar]
- Velikanov, M.A. Theory of probability applied to analysis of sedimentation of silt in turbulent streams. Trans. Sci. Res. Inst. Hydrotech. 1936, 18, 55–56. [Google Scholar]
- Simanjuntak, T.; Boeriu, P.; Dano Roelvink, J. Consideration on the Sedimentation Process in a Settling Basin. J. Hydrol. Hydromech. 2009, 57, 16–25. [Google Scholar] [CrossRef] [Green Version]
- Qamar, M.Z.; Verma, M.K.; Meshram, A.P. Importance of Desilting Basins in Run-of-River Hydro Projects in Himalayan Region. Int. J. Emerg. Technol. Adv. Eng. 2014, 4, 407–412. [Google Scholar]
- Lysne, D.K.; Glover, B.; Støle, H.; Tesaker, E. Hydraulic Design; Norwegian University of Science and Technology, Department of Hydraulic and Environmental Engineering: Trondheim, Norway, 2003. [Google Scholar]
- Paschmann, C.; Fernandes, J.N.; Vetsch, D.F.; Boes, R.M. Assessment of flow field and sediment flux at alpine desanding facilities. Int. J. River Basin Manag. 2017, 15, 287–295. [Google Scholar] [CrossRef] [Green Version]
- Paschmann, C.; Fernandes, J.N.; Vetsch, D.F.; Boes, R.M. Experimental setup for flow and sediment flux characterization at desanding facilities. Flow Meas. Instrum. 2017, 54, 197–204. [Google Scholar] [CrossRef] [Green Version]
- Paschmann, C.; Albayrak, I.; Vetsch, D.F.; Boes, R.M. Preliminary Study on the Review and Evaluation of CFD Software for the Modeling of Flow, Sediment Deposit and Transport Processes in Desilting Facilities of Alpine Hydropower Plants; Swiss Federal Office of Energy: Bern, Switzerland, 2015; Available online: https://www.aramis.admin.ch/Texte/?ProjectID=34181 (accessed on 9 November 2021). (In German)
- Ferreira, A.D.; Sousa, A.C.M. The RNG Turbulence Closure: Application and Revisited Performance Assessment. WSEAS Trans. Syst. 2002, 1, 165–170. [Google Scholar]
- Spasojevic, M.; Holly, F.M. Two- and Three-Dimensional Numerical Simulation of Mobile-Bed Hydrodynamics and Sedimentation. In Sedimentation Engineering; Gracia, M., Ed.; ASCE Manuals and Reports on Engineering Practice No. 110; ASCE: Reston, VI, USA, 2008; pp. 683–761. [Google Scholar]
- Olsen, N.R.B.; Skoglund, M. Three-dimensional numerical modeling of water and sediment flow in a sand trap. J. Hydraul. Res. 1994, 32, 833–844. [Google Scholar] [CrossRef]
- Ruether, N.; Singh, J.M.; Olsen, N.R.B.; Atkinson, E. 3-D computation of sediment transport at water intakes. Proc. Inst. Civ. Eng.-Water Manag. 2005, 158, 1–7. [Google Scholar] [CrossRef]
- Soulsby, R.L. Dynamics of Marine Sands—A Manual for Practical Applications; Telford: London, UK, 1997. [Google Scholar]
- Richardson, J.F.; Zaki, W.N. Sedimentation and Fluidsation: Part I. Chem. Eng. Res. Des. 1954, 32, 35–53. [Google Scholar] [CrossRef]
- Mastbergen, D.R.; Van Den Berg, J.H. Breaching in fine sands and the generation of sustained turbidity currents in submarine canyons. Sedimentology 2003, 50, 625–637. [Google Scholar] [CrossRef]
- Rodi, W. Turbulence Models and Their Application in Hydraulics, 3rd ed.; Routledge: London, UK, 2000. [Google Scholar]
- Rijn, L.C.v. Sediment Transport, Part I: Bed Load Transport. J. Hydraul. Eng. 1984, 110, 1431–1456. [Google Scholar] [CrossRef] [Green Version]
- Flow Science Inc. Manual: FLOW-3D Version 11.2. 2017. Available online: https://www.flow3d.com (accessed on 9 November 2021).
- Paschmann, C. Design Optimization of Desanding Facilities for Hydropower Schemes; Boes, R.M., Ed.; Versuchsanstalt für Wasserbau, Hydrologie und Glaziologie (VAW), ETH Zürich: Zürich, Switzerland, 2018; Volume 247. [Google Scholar]
- Tsikata, J.M.; Tachie, M.F.; Katopodis, C. Open-channel turbulent flow through bar racks. J. Hydraul. Res. 2014, 52, 630–643. [Google Scholar] [CrossRef]
- Vischer, D.; Huber, A. Wasserbau—Hydrologische Grundlagen, Elemente des Wasserbaus, Nutz- und Schutzbauten an Binnengewässern; Springer: Berlin, Germany, 2002. [Google Scholar]
- Mosonyi, E. Water Power Development; Publishing House of the Hungarian Academy of Sciences: Budapest, Hungary, 1956. [Google Scholar]
- Wu, W.; Wang, S.S.Y. Formulas for Sediment Porosity and Settling Velocity. J. Hydraul. Eng. 2006, 132, 858–862. [Google Scholar] [CrossRef]
- Zanke, U.C.E. Grundlagen der Sedimentbewegung; Springer: Berlin, Germany, 1982. [Google Scholar]
- Durst, F.; Tropea, C. Flows over Two-Dimensional Backward—Facing Steps. In Structure of Complex Turbulent Shear Flow: Symposium, Marseille, France August 31–September 3, 1982; Dumas, R., Fulachier, L., Eds.; Springer: Berlin/Heidelberg, Germany, 1983; pp. 41–52. [Google Scholar]
- IEC—Intl. Electrotechnical Commission Technical Committee 4: Hydraulic turbines. Hydraulic Machines—Guide for Dealing with Hydro-Abrasive Erosion in Kaplan, Francis, and Pelton Turbines; IEC: Geneva, Switzerland, 2013; Volume IEC 62364. [Google Scholar]
- Felix, D. Experimental Investigation on Suspended Sediment, Hydro-Abrasive Erosion and Efficiency Reductions of Coated Pelton Turbines; Boes, R.M., Ed.; Versuchsanstalt für Wasserbau, Hydrologie und Glaziologie (VAW), ETH Zürich: Zürich, Switzerland, 2017; Volume 238. [Google Scholar]
- Felix, D.; Abgottspon, A.; Albayrak, I.; Boes, R.M. Hydro-abrasive erosion on coated Pelton runners: Partial calibration of the IEC model based on measurements in HPP Fieschertal. Proc. IOP Conf. Ser. Earth Environ. Sci. 2016, 49, 122009. [Google Scholar] [CrossRef] [Green Version]
Figure 1.
Schematic of a typical desanding facility with inlet channel after the intake, transition zone, basin and outlet with end weir: plan view of facility with (a) curved and (b) angled inlet channel, (c) longitudinal section; main flow direction from left to right.
Figure 1.
Schematic of a typical desanding facility with inlet channel after the intake, transition zone, basin and outlet with end weir: plan view of facility with (a) curved and (b) angled inlet channel, (c) longitudinal section; main flow direction from left to right.

Figure 2.
Details of tranquilizing racks at prototype facilities with view in flow direction, i.e., the open part of the rack profiles are opposed to the flow.
Figure 2.
Details of tranquilizing racks at prototype facilities with view in flow direction, i.e., the open part of the rack profiles are opposed to the flow.

Figure 3.
Modeling of tranquilizing racks with plan view (upper) and frontal view (lower part): fully blocked baffles (P = 0) in combination with permeable parts incorporating head loss (P = 1, ζ > 0) are used for efficient simulation.
Figure 3.
Modeling of tranquilizing racks with plan view (upper) and frontal view (lower part): fully blocked baffles (P = 0) in combination with permeable parts incorporating head loss (P = 1, ζ > 0) are used for efficient simulation.

Figure 4.
(a) PSD with particles in the non-cohesive fine and medium sand size range used for the numerical simulations and (b) discretization of the PSD by four grain size classes and corresponding still-water settling velocities ws,0 for ρs = 2650 kg m−3 and water at 8 °C.
Figure 4.
(a) PSD with particles in the non-cohesive fine and medium sand size range used for the numerical simulations and (b) discretization of the PSD by four grain size classes and corresponding still-water settling velocities ws,0 for ρs = 2650 kg m−3 and water at 8 °C.

Figure 5.
Special configurations with arrows indicating applied modification: (a) continuously expanding basin area (configuration V6.3), (b) impact wall (configuration V6.5), (c) longitudinal vertical flow guiding walls (configuration V6.9), (d) both-sided vertical inclined plates (configuration V6.10), (e) horizontal flow deflection plates (configuration V6.13) and (f) horizontal flow deflection plates and racks (configuration V6.14); main flow direction is from left to right (in x-direction).

Figure 6.
Longitudinal profile of recirculation zone length xr; the line representing vx = 0 m/s is the dividing streamline that intersects with the bed at the reattachment point; main flow direction is from left to right.
Figure 6.
Longitudinal profile of recirculation zone length xr; the line representing vx = 0 m/s is the dividing streamline that intersects with the bed at the reattachment point; main flow direction is from left to right.

Figure 7.
Longitudinal profile of simulated flow in basin for reference configuration V0 illustrated by streamlines along basin middle axis (x-z plane); main flow direction from left to right (in x-direction).
Figure 7.
Longitudinal profile of simulated flow in basin for reference configuration V0 illustrated by streamlines along basin middle axis (x-z plane); main flow direction from left to right (in x-direction).

Figure 8.
Contour plots of (a) measured and (b) simulated streamwise flow velocity component vx for the Saas Balen facility. The indicated non-dimensional locations X, Y and Z are normalized by basin length, width and depth, respectively; main flow is in x-direction.
Figure 8.
Contour plots of (a) measured and (b) simulated streamwise flow velocity component vx for the Saas Balen facility. The indicated non-dimensional locations X, Y and Z are normalized by basin length, width and depth, respectively; main flow is in x-direction.

Figure 9.
Mean PSD of suspended sediment in inlet channel measured at prototype and mean outlet PSD curves from measurements and numerical simulations.
Figure 9.
Mean PSD of suspended sediment in inlet channel measured at prototype and mean outlet PSD curves from measurements and numerical simulations.

Figure 10.
Longitudinal trajectory of surface particle with diameter dcr = 330 µm under similar flow conditions in main part of basin: (a) desanding facility according to reference configuration V0 and basin length Lbs = 32 m resulted in trapping efficiency ηc,sim = 0.87, while (b) complete settling of particles was achieved for configuration according to classical design approach.

Figure 11.
Relation (Equation (7)) between trapping efficiency ηc,sim, and relative basin length χ = Lbs/Lbs,V0 resulting from the parameter study.
Figure 11.
Relation (Equation (7)) between trapping efficiency ηc,sim, and relative basin length χ = Lbs/Lbs,V0 resulting from the parameter study.

Figure 12.
Correlations (Equation (9)) between relative trapping efficiency ηc,rel and (a) inlet channel radius r and (b) inlet channel conjunction angle γ resulting from parameter study.
Figure 12.
Correlations (Equation (9)) between relative trapping efficiency ηc,rel and (a) inlet channel radius r and (b) inlet channel conjunction angle γ resulting from parameter study.

Figure 13.
Correlations between recirculation zone length xr and (a) horizontal expansion angle α (Equation (10)) and transition zone vertical expansion angle β (Equation (11)), respectively and (b) relative trapping efficiency ηc,rel (Equation (12)), red markers indicate results from configurations V4.1 to V4.4.

Figure 14.
Correlation (Equation (13)) between vertical expansion ratio and recirculation zone length xr to step height for an approach flow with a Reynolds number Ro > 2 × 10⁴, adapted according to [29]. Experimental results indicate that = 8.6 remained constant for > 2.
Figure 14.
Correlation (Equation (13)) between vertical expansion ratio and recirculation zone length xr to step height for an approach flow with a Reynolds number Ro > 2 × 10⁴, adapted according to [29]. Experimental results indicate that = 8.6 remained constant for > 2.

Figure 15.
Six main steps of the enhanced design concept.

Table 1.
Range of investigated parameters.
| Parameter | Description | Investigated Values |
|---|---|---|
| Lbs (m) | Basin length | 8, 16, 32, 40, 48, 56 |
| Fo (–) | Inlet channel Froude number | 0.35, 2.0, 3.5 |
| r (m) | Inlet channel radius | 2, 5, 10, 20 |
| γ (°) | Inlet channel conjunction angle | 180, 170, 160, 150, 140, 130, 120 |
| α (°) | Transition zone horizontal expansion angle | 5.7, 10, 15, 22.5, 30, 45, 60, 90 |
| β (°) | Transition zone vertical expansion angle | 19.3, 25, 30, 37.5, 45, 60, 90 |
| Ltz (m) | Transition zone length | 0, 5, 10, 15, 20 |
Table 2.
Comparison of prototype measurements (p) and simulation results (s) at three different times t1, t2 and t3: suspended sediment concentration at inlet channel (Cin) and at the outlet weir (Cout), diameter d50 at inlet and resulting trapping efficiencies (ηc).
Table 2.
Comparison of prototype measurements (p) and simulation results (s) at three different times t1, t2 and t3: suspended sediment concentration at inlet channel (Cin) and at the outlet weir (Cout), diameter d50 at inlet and resulting trapping efficiencies (ηc).
| Data Set | Cin (g/L) | d50,in (µm) | Cout,p v(g/L) | ηc,p (–) | Cout,s (g/L) | ηc,s (–) |
|---|---|---|---|---|---|---|
| t1 | 0.34 | 22 | 0.08 | 0.76 | 0.27 | 0.32 |
| t2 | 2.26 | 67 | 0.67 | 0.70 | 1.17 | 0.59 |
| t3 | 1.10 | 121 | 0.25 | 0.77 | 0.45 | 0.70 |
Publisher’s Note: MDPI stays neutral with regard to jurisdictional claims in published maps and institutional affiliations. |
© 2022 by the authors. Licensee MDPI, Basel, Switzerland. This article is an open access article distributed under the terms and conditions of the Creative Commons Attribution (CC BY) license (https://creativecommons.org/licenses/by/4.0/).
Share and Cite
MDPI and ACS Style
Paschmann, C.; Vetsch, D.F.; Boes, R.M. Design of Desanding Facilities for Hydropower Schemes Based on Trapping Efficiency. Water 2022, 14, 520. https://doi.org/10.3390/w14040520
AMA Style
Paschmann C, Vetsch DF, Boes RM. Design of Desanding Facilities for Hydropower Schemes Based on Trapping Efficiency. Water. 2022; 14(4):520. https://doi.org/10.3390/w14040520
Chicago/Turabian StylePaschmann, Christopher, David F. Vetsch, and Robert M. Boes. 2022. "Design of Desanding Facilities for Hydropower Schemes Based on Trapping Efficiency" Water 14, no. 4: 520. https://doi.org/10.3390/w14040520
Note that from the first issue of 2016, this journal uses article numbers instead of page numbers. See further details here.