
Effect of Seawater Intrusion on the Formation of Chlorinated and Brominated Trihalomethanes in Coastal Groundwater
1
School of Environmental Science and Engineering, Indian Institute of Technology Kharagpur, Kharagpur 721302, West Bengal, India
2
Civil Engineering Department, Indian Institute of Technology Kharagpur, Kharagpur 721302, West Bengal, India
*
Author to whom correspondence should be addressed.
Water 2022, 14(21), 3579; https://doi.org/10.3390/w14213579
Submission received: 28 September 2022
/
Revised: 22 October 2022
/
Accepted: 2 November 2022
/
Published: 7 November 2022
(This article belongs to the Section Water Quality and Contamination)
Abstract
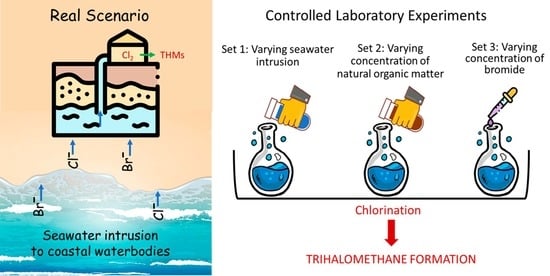
:Around the world, coastal groundwater is increasingly subject to seawater intrusion (SWI). The quality and characteristics of such waters differ from those of surface and groundwater. In the current study, trihalomethane (THM) formation under varying levels of SWI, natural organic matter (NOM), and chloride-to-bromide (Cl/Br) ratio was evaluated. Different levels of SWI were simulated by mixing deionized water with real seawater (RSW) collected from the Indian Ocean or synthetic seawater (SSW) by varying seawater volumes from 0% to 3%. Humic acid (0 to 5 mg/L) was added to represent NOM at concentrations mimicking natural levels of dissolved organic carbon. The chlorine demand of the simulated water samples was significantly correlated to SWI levels and NOM concentrations. THM concentration in SSW increased from 12.64 µg/L to 105.34 µg/L after 24 h and to 115.8 µg/L after 48 h for an increase from 0% to 3% volume of seawater. For water samples simulated with RSW, maximum THMs after 24 h were 119.2 µg/L, and after 48 h were 126.4 µg/L. An increase in NOM concentration in seawater-intruded water samples resulted in increasing THMs, especially tribromomethane. However, the increment in THMs at higher NOM concentration was lower compared to that at low NOM concentration. Chlorine demand was positively correlated only to tribromomethane. An increase in bromide concentration resulted in lower Cl/Br ratio and a concomitant increase in brominated THMs. The bromine substitution factor corresponding to increasing SWI of 0.25–3% decreased from 2.67 to 1.81 over a reaction time of 24 to 48 h, indicating a shift from TBM dominance to chlorinated THMs.
1. Introduction
Seawater intrusion (SWI) into groundwater along the coastline has become more frequent in recent years as freshwater withdrawals are increasing [1,2]. It is expected to increase in the future as an outcome of climate change [3,4]. Such water often contains high levels of halides such as chloride, bromide, and iodide. Therefore, treatment of these waters requires special attention. Apart from conventional treatment units such as aeration, coagulation–flocculation, and sand filtration, improved techniques such as advanced oxidation processes and reverse-osmosis desalination can be utilized to lessen salinity and contamination [5,6]. Disinfection is an essential step in water treatment and supply systems to eliminate and safeguard from pathogens. It can be carried out through chemical or physical methods, usually at the end of the treatment train. Chlorine in liquid, solid, or gaseous state is a universal disinfectant in water treatment. Apart from this, ozone, potassium permanganate, and hydrogen peroxide are a few of the chemical disinfectants and ultraviolet radiation and membrane filtration are physical disinfection measures used in water treatment [5]. Chemical disinfectants form by-products in water as a result of their reaction with organic and inorganic water constituents. Trihalomethanes (THMs) are a prominent group of chlorine disinfection by-products (DBP). Since SWI affects the characteristics of coastal groundwater, the THM formation in these waters may differ from that in regular (inland) surface and groundwater. Based on regulations, the THMs of concern are trichloromethane (TCM), bromodichloromethane (BDCM), dibromochloromethane (DBCM), and tribromomethane (TBM).
In water treatment practice, when chlorine is added to water, it hydrolyses into hypochlorous acid (HOCl) and further to hypochlorite ion (OCl−).
Cl2 + H2O ↔ HOCl + H+ + Cl−
HOCl ↔ H+ + OCl− pKa = 7.54 at 25 °C [7].
The distribution of aqueous chlorine compounds depends on pH and temperature [7]. Both HOCl and OCl− can react with natural organic matter (NOM) as well as with other constituents of water to produce disinfection by-products, including THMs. Under water treatment conditions, chlorine reacts faster with other anionic inorganic compounds than with organic ones [8]. Therefore, in the presence of bromide in water, HOCl or OCl− oxidize bromide to hypobromous acid (HOBr) and hypobromite (OBr−) [9].
HOCl + Br− ↔ HOBr + Cl−
HOBr ↔ H+ + OBr− pKa = 8.7 at 25 °C [10].
Since HOBr is a weaker acid than HOCl, it can react with NOM as well and form various brominated disinfection by-products (DBPs) such as BDCM, DBCM, and TBM [11].
Water under the influence of seawater contains chloride and bromide at concentrations many times higher than inland surface and groundwater [12,13]. High concentrations of brominated THMs (Br-THMs) have been reported with an increase in SWI [10,14,15,16]. Szczuka et al. [15] observed 2.9–1470 mg/L chloride and 27–10,600 µg/L bromide concentrations in North Carolina groundwater. The total DBPs formed in these samples ranged from 38 µg/L to 340 µg/L, which included 20–270 µg/L of THMs.
Only four studies were found in the published literature that either simulated SWI by adding real seawater (RSW) to a mixture of groundwater and deionized water by maintaining a constant dissolved organic carbon concentration (DOC) or collected such waters that were already affected by SWI. In general, the main precursor of THMs is NOM (expressed as DOC) [17,18,19]. However, the importance of chloride and bromide concentrations in THM formation is not known as clearly as NOM. Thus, the effect of NOM, Cl−, and Br- on THM formation in water under SWI has not been addressed adequately. Therefore, in the current study, a methodology was developed to evaluate these research gaps. A summary of experimental procedures from the four studies that addressed THM formation in SW-intruded water is provided in Table 1 and compared to the present study.
Prior to this study, there was insufficient information to conclude whether chloride or bromide are better correlated to the formation of DBPs in seawater-intruded waters. Further, other factors such as pH, temperature, NOM concentrations, and chloride-to-bromide (Cl/Br) ratio were scarcely discussed in the literature about SW-intruded groundwater. Therefore, the current study aimed to evaluate the formation of THMs in SW-intruded waters with the following specific objectives: (i) to examine the impact of varying degrees of SWI on the formation and speciation of THMs, (ii) to understand the chlorine demand of SW-intruded water, and (iii) to study the effect of bromide concentration, Cl/Br ratio, and NOM concentration on THM formation of SW-intruded water.
2. Materials and Methods
The glassware used was washed thoroughly using phosphate-free detergent. It was made chlorine demand-free by rinsing in chlorinated water followed by acid washing. Experiments were conducted in triplicate using 100 mL amber glass bottles with screw caps and Teflon septa. All chemicals used were reagent-grade or above. Deionized water was produced daily by an ultra-pure water purifying unit (Thermo Fisher Scientific, Waltham, MA, USA).
2.1. Analytical Methods
Free chlorine was measured using a pocket colorimeter (DR300, Hach, Loveland, CO, USA) as per Standard Method 4500-Cl (G) [20]. Anion measurement was performed by ion chromatography (ICS-2100, Thermo Fisher Scientific, Waltham, MA, USA). Dissolved organic carbon (DOC) was measured using a total organic carbon analyser (Aurora 1030, OI Analytical, College Station, TX, USA). THMs were measured by a gas chromatograph (Trace 1300, Thermo Fisher Scientific, Waltham, MA, USA) equipped with an electron capture detector (ECD-Ni63) after concentrating with purge and trap (Lumin, Teledyne Tekmar, Mason, OH, USA) following the USEPA method 501.1 with minor modifications [21].
2.2. Experiments
A grab sample of seawater was collected from the Indian Ocean at least 1 km away from the Indian seashore and was used as RSW. Since RSW contains various organic and inorganic constituents that vary from place to place, synthetic seawater (SSW) was also prepared as per ASTM D1141-98 for uniform experimental conditions (Table S1) [22]. The experiments were divided in to three sets as follows.
- Set 1: Varying extent of seawater intrusion
Experiments were conducted with both SSW and RSW. Deionized water (100 mL) was mixed with SSW or RSW separately at 0%, 0.25%, 0.5%, 1%, 2%, and 3% seawater by volume. The levels of SWI were selected as per previous studies [10,15]. A stock HA solution (Sigma Aldrich) was prepared in NaOH-amended deionized water (pH > 9) and was further diluted for test doses. Humic acid at 2.5 mg/L was added to each bottle as NOM.
- Set 2: Varying natural organic matter concentrations
In this set, various concentrations of HA (0–5 mg/L) were added to 100 mL deionized water, which resulted in DOC concentration of 0.5–2.5 mg/L (Figure S1). The volume of SSW added to these experiments was kept constant at 1%.
- Set 3: Varying bromide concentrations
These experiments were conducted to understand the effect of bromide concentration and Cl/Br ratio on THM formation. For that, the bromide concentration in SSW was varied by adding extra potassium bromide (KBr; Sigma Aldrich, Bengaluru, India), while keeping the rest of the composition unchanged.
Chlorine demand for each sample was determined prior to setting up the samples following the uniform formation condition (UFC) method. The UFC method has been used for assessing chlorine demand and DBP yield for a long time [23,24]. It represents the initial chlorine dosage required to yield 1 ± 0.4 mg/L of free chlorine after 24 h of incubation at 25 °C and pH = 8. Chlorination of samples was performed using a 1000 mg/L stock solution diluted from 4–6% sodium hypochlorite (NaOCl; Merck Life Science, Bengaluru, India) solution. The NaOCl solution was standardized daily by following the Standard Method 4500—Cl (B) [20]. pH adjustment was achieved by using either 1 M hydrochloric acid or 1 M sodium hydroxide solution.
THM formation was determined by chlorinating each sample as per UFC and by incubating it for up to 48 h at 25 °C. The initial pH of the samples was adjusted to around 8 ± 0.5. The first batch of samples was withdrawn after 24 h and the second batch after 48 h. They were moved to 4 °C after adding an appropriate amount of dechlorinating agent (sodium sulphite) to quench the free chlorine residual and prevent further THM production. Individual analytical-grade standards of TCM, BDCM, DBCM, and TBM (purity >99.9%; Sigma Aldrich, Bengaluru, India) were mixed in methanol (Merck Life Science, Bengaluru, India) to prepare 1000 mg/L stock standard. Aqueous standards were prepared daily by diluting stock solution to ppb levels in THM free water.
2.3. Bromine Substitution Factor
The effect of bromide on the speciation of THMs was analysed by calculating the bromine substitution factor (BSF) at various SWI levels. The BSF of THMs represents the molar ratio of the concentration of Br-THMs to the total THM (TTHM) concentration (Equation (1)) [25].
The BSF values can vary between 0 and 3 based on the predominant THM species. A BSF value equal to 0 represents a water sample that has only TCM in it, and if the BSF value is equal to 3, it implies that the sample has only TBM. Similarly, BSF values of 1 and 2 show that the predominant compounds are BDCM and DBCM, respectively. Calculating the BSF value for a water sample is important as Br-THMs are known to cause a higher cancer risk compared to their chlorinated counterparts [26].
3. Results
3.1. Effect of Seawater Intrusion on Raw Water Characteristics
Changes in raw (untreated) water characteristics with varying levels of SWI are shown in Table 2. For different concentrations of seawater addition, the Cl/Br ratio was almost constant. The lower Cl/Br ratio for RSW compared to that of reference seawater was because of the comparatively high bromide concentration. The pH of the simulated water samples increased with the increase in SWI. However, even at 3% SWI, the pH was within the limits of Indian Standards for drinking water, but the chloride concentration exceeded the permissible limit of 1000 mg/L at 3% RSW (Table 1) [27]. A linear increase in chloride and bromide concentrations was observed with increasing seawater addition. Figure S2 shows the relationships between SWI and chloride or bromide concentrations for both SSW and RSW with their corresponding R2 values.
3.2. Chlorine Demand
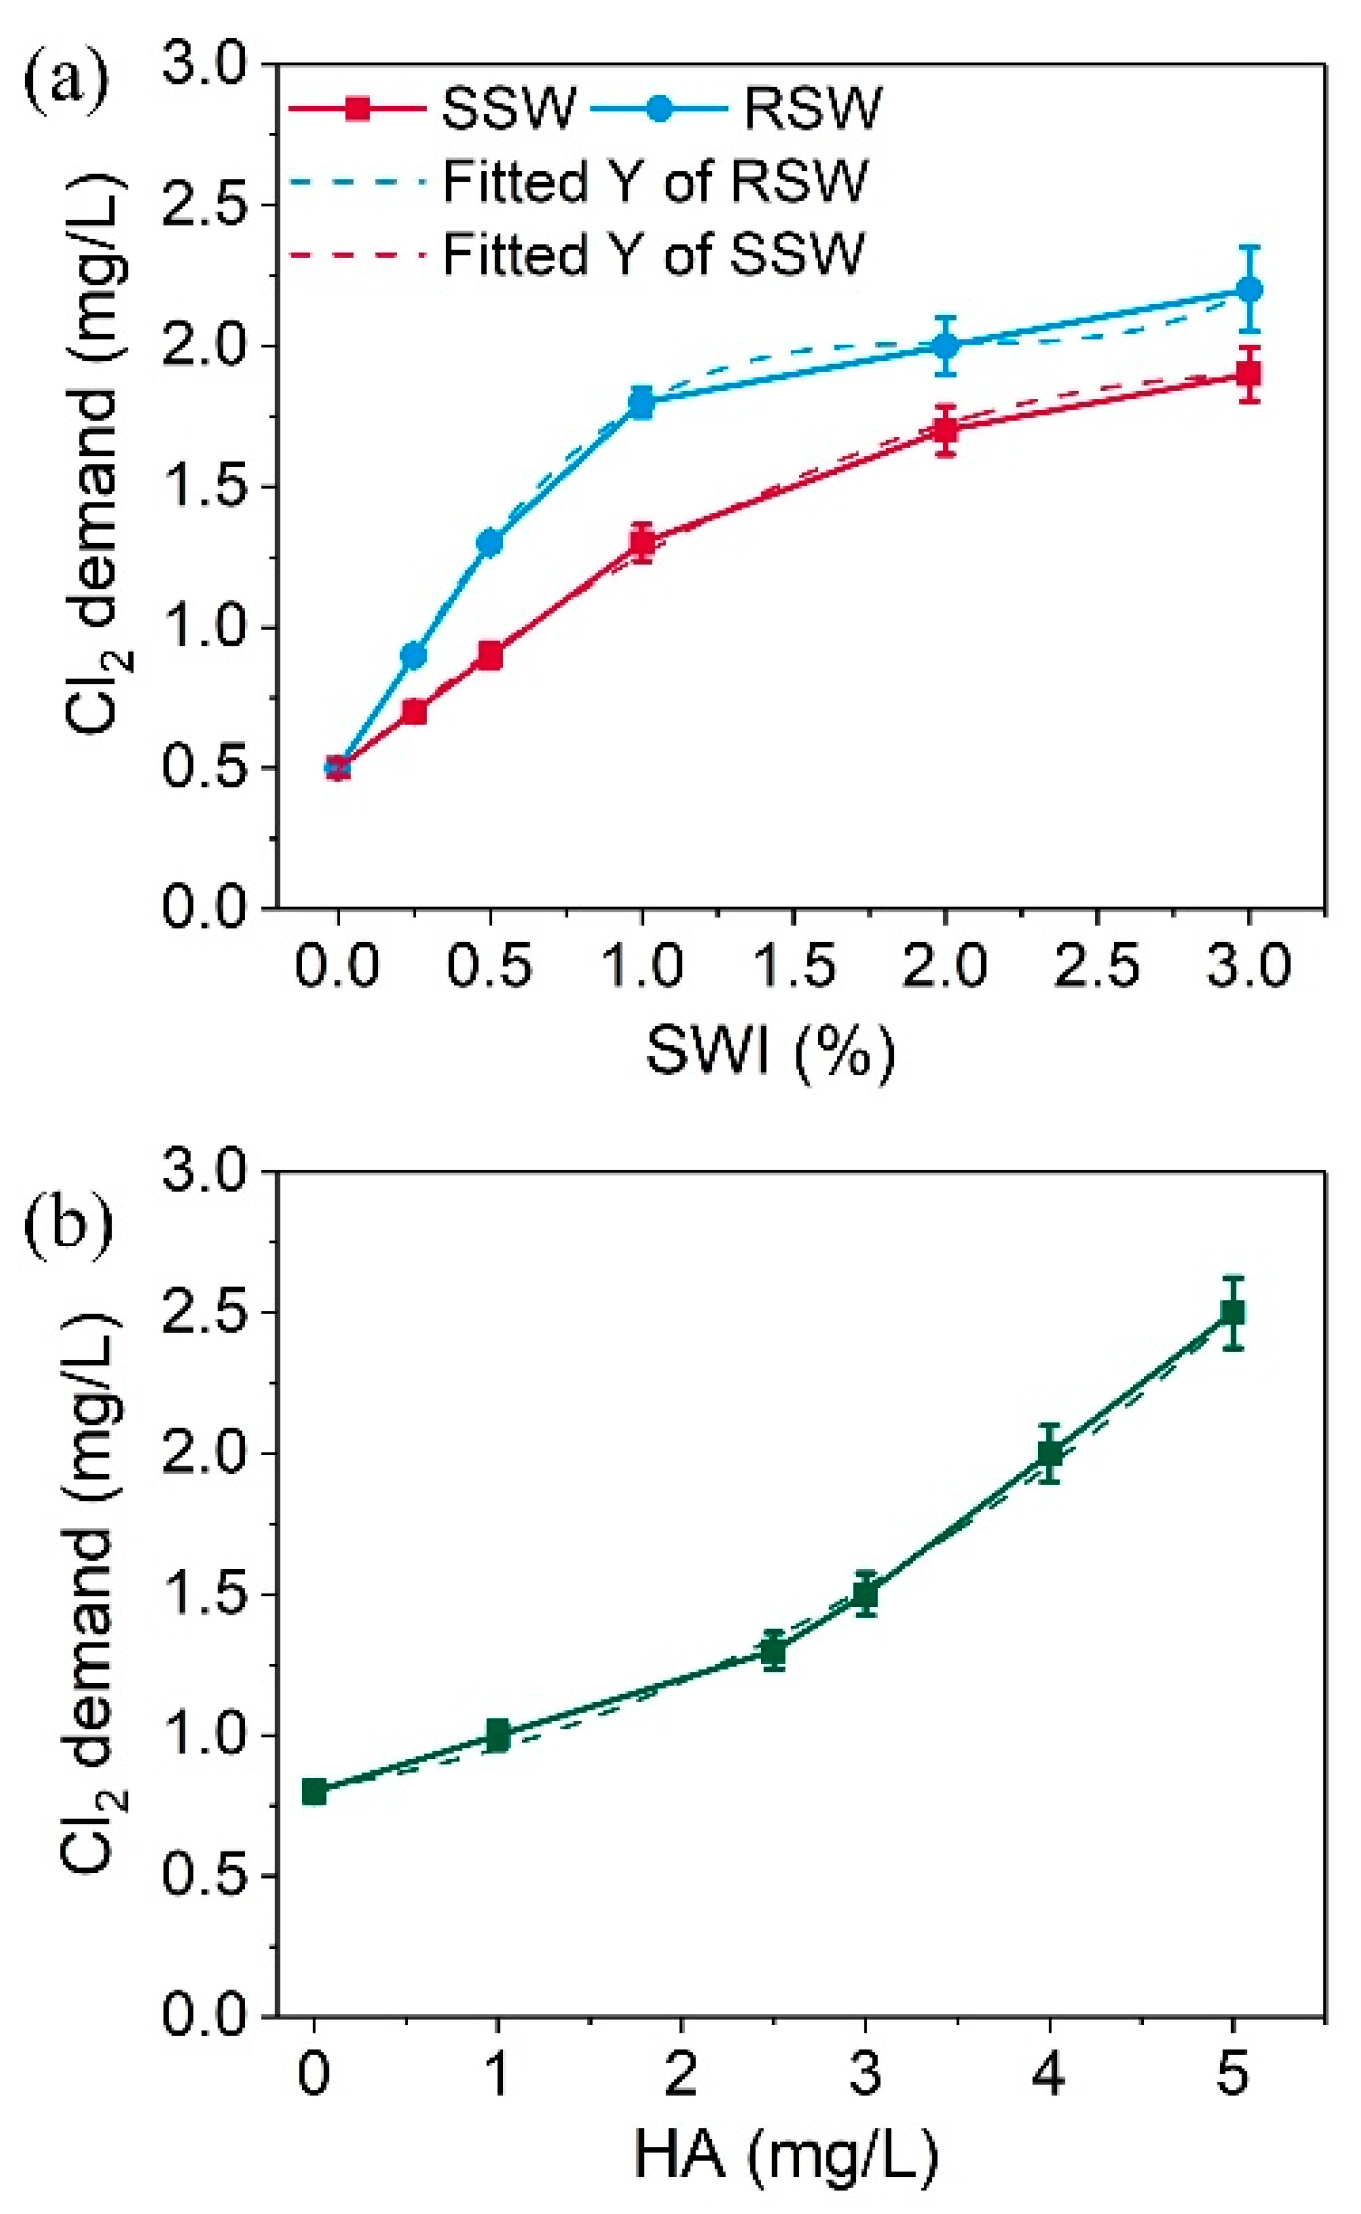
Samples mixed with RSW had higher chlorine demand than the samples mixed with SSW (Figure 1a). Samples mixed with RSW had higher chlorine demand than the samples mixed with SSW (Figure 2a). This can be attributed to the presence of additional chlorine-demanding compounds that may be present in RSW. Further, the curve fitting for RSW resulted in a third-order polynomial equation (R2 = 0.994) (Equation (2)) and the same for SSW resulted in a second-order polynomial equation (R2 = 0.997) (Equation (3)).
Chlorine demand increased with increasing NOM concentration and was fit to a second-order polynomial equation (Figure 1b) (Equation (4)).
A multiple linear regression model was fitted considering HA concentration and levels of SWI as independent parameters and chlorine demand as the dependent parameter. The model results show positive significant relations between the three parameters as the p values at the 95% confidence level for SWI and HA were 0.002 and 0.001, respectively, with a model R2 of 0.84. The regression equation of chlorine demand was as follows:
Model coefficients and ANOVA are shown in Table S2. The contour plot and normality plot of the regression model between the three parameters are shown in Figure S3. The results of curve fitting and regression modelling show that chlorine demand is equally associated with both HA concentration and SWI parameters.
3.3. Trihalomethane Formation and Speciation
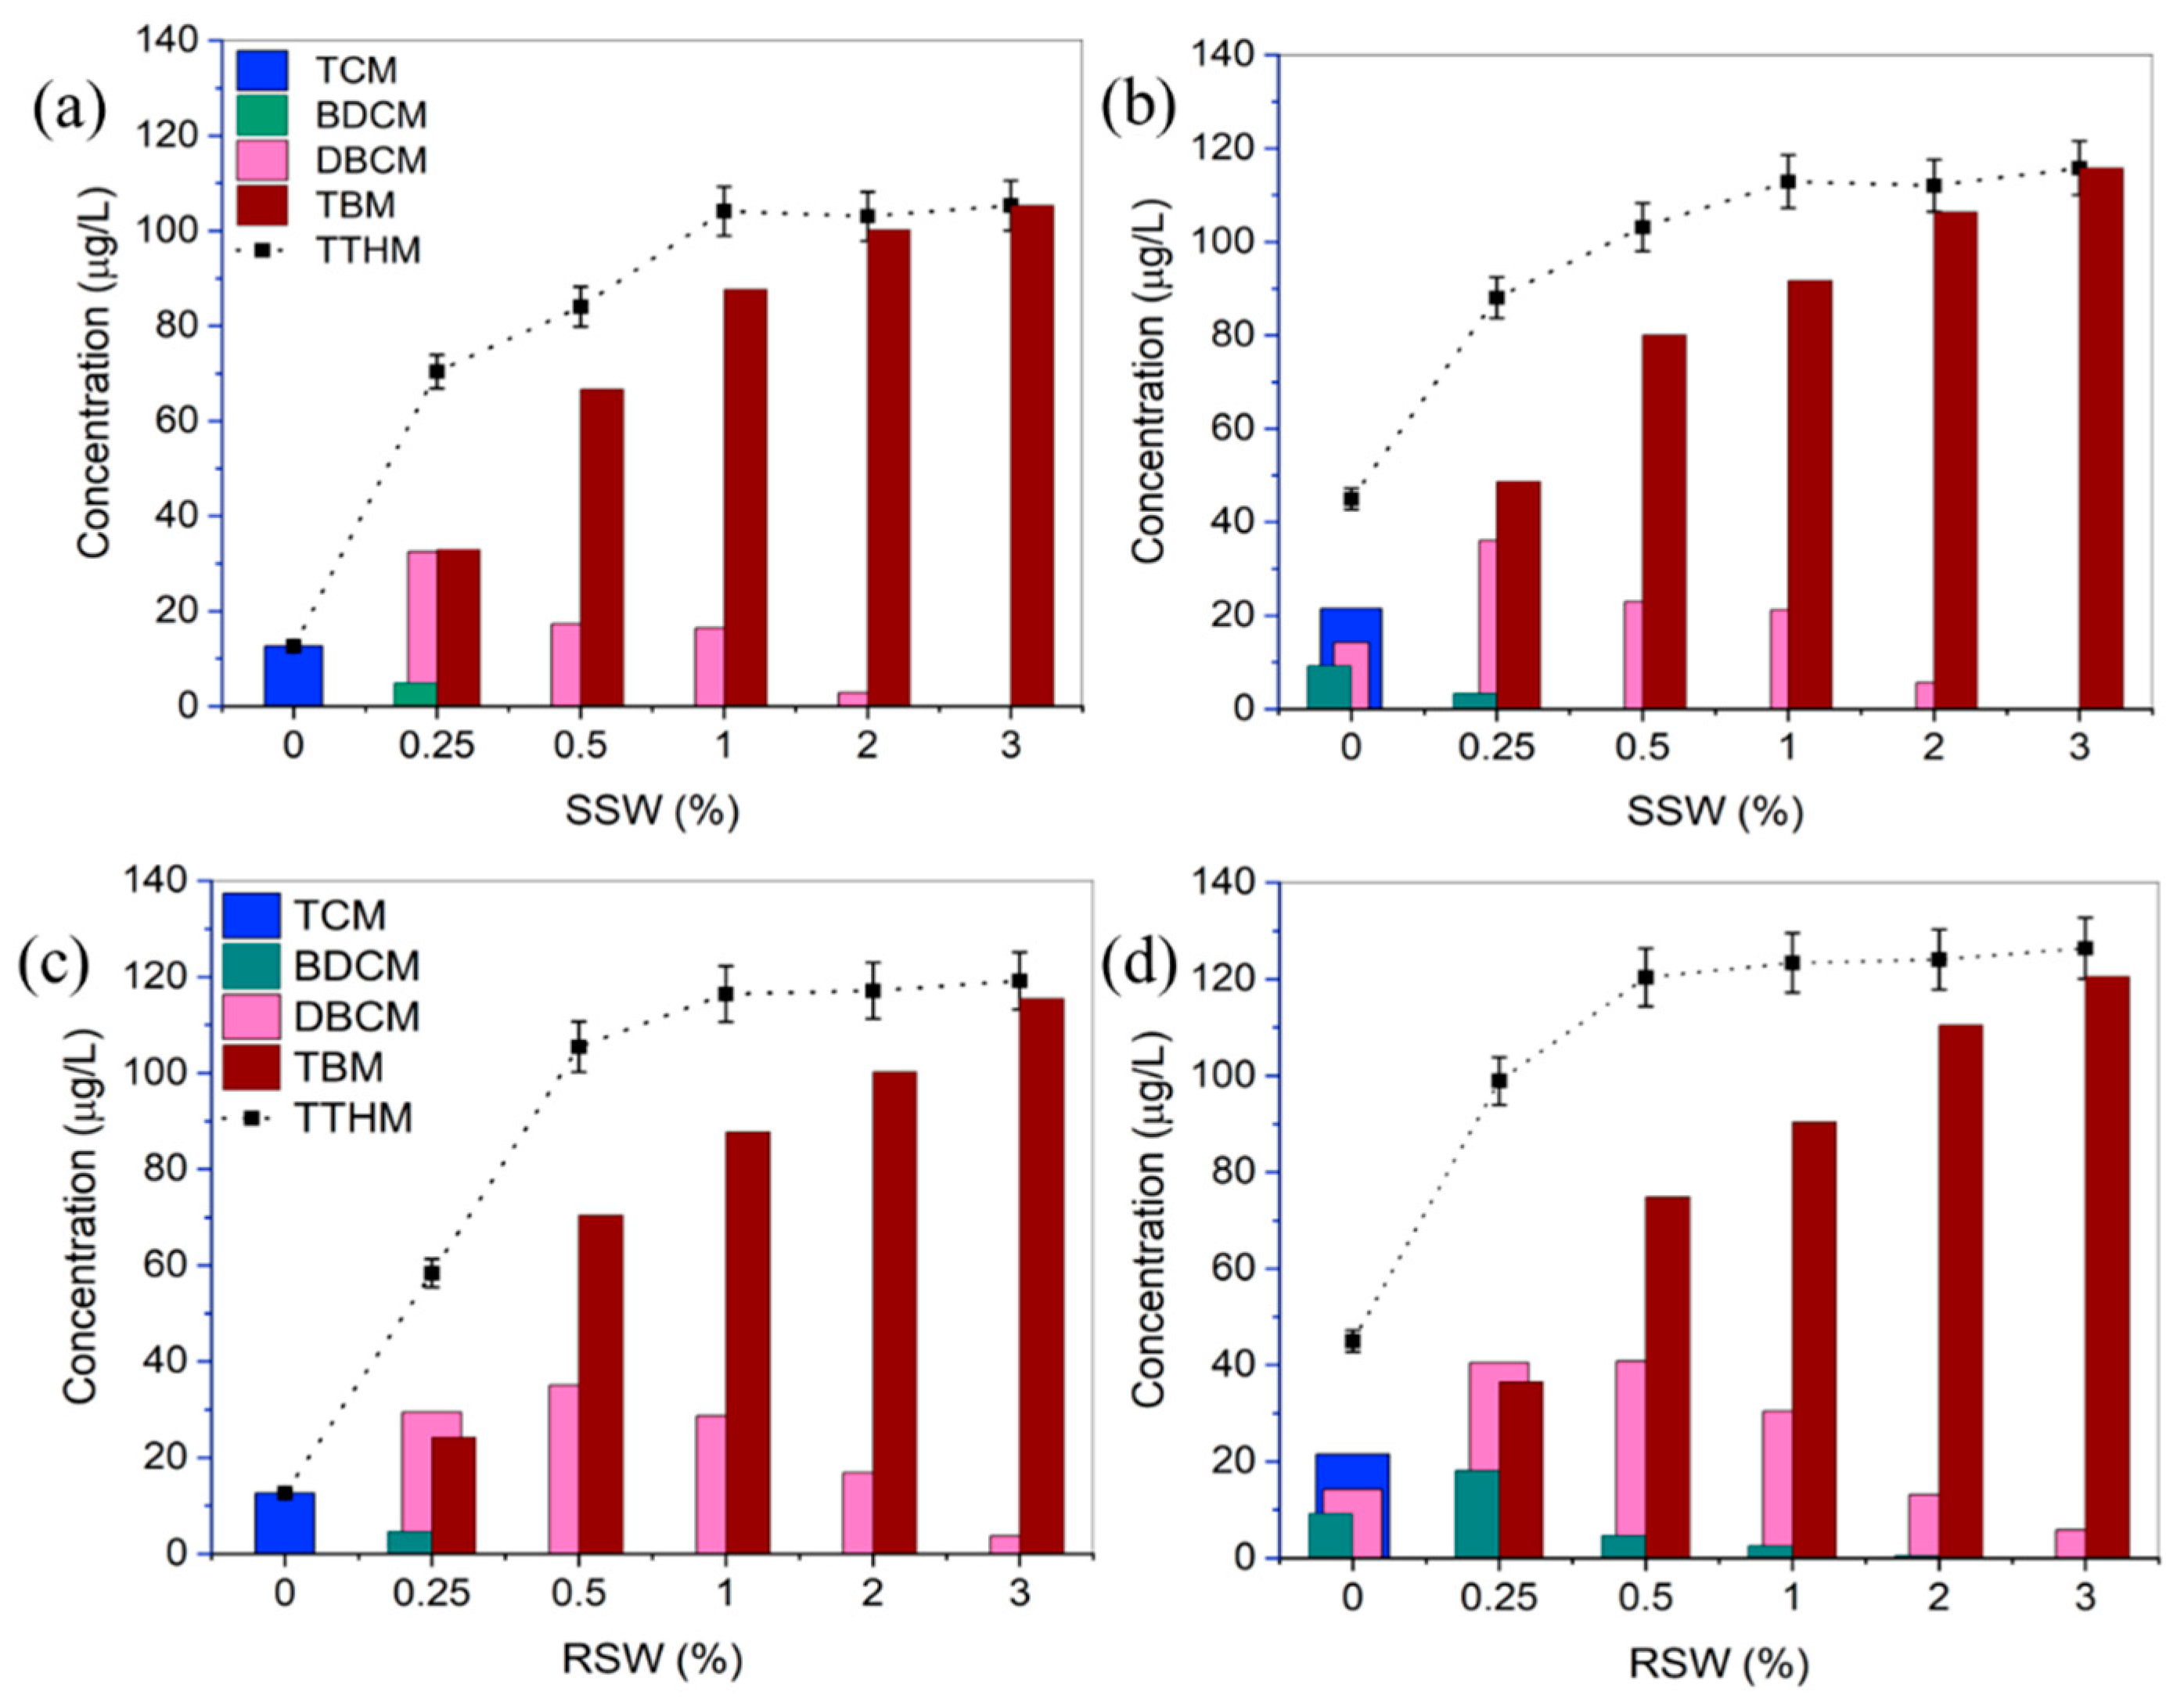
Figure 2a–d shows THM formation and speciation at different levels of SWI. The TTHM concentrations increased from 12.64 µg/L to 105.34 µg/L after 24 h and to 115.8 µg/L after 48 h as SSW intrusion increased from 0% to 3%. A similar increase in RSW intrusion resulted in an increase in TTHM to 119.2 µg/L and to 126.4 µg/L after 24 h and 48 h, respectively. The increase in TTHM formation was proportional to SWI levels up to 0.5% for RSW and 1% for SSW. At higher levels of SWI, there was no increase in TTHM concentration.
In the case of no intrusion, only TCM was formed and no TBM was formed, as there was no bromide in SSW. Thereafter, a shift towards Br-THMs was observed with increasing SW. TBM was the only compound formed at 3% SSW addition and the highest at 0.25% intrusion and higher levels of SWI. As the concentration of Br in the samples increased, the order of formation was BDCM followed by DBCM and then TBM. The increase in Br concentration resulted in the formation and disappearance of the less Br-substituted THMs such as BDCM and DBCM and favoured the formation of TBM.
3.4. Effect of Natural Organic Matter
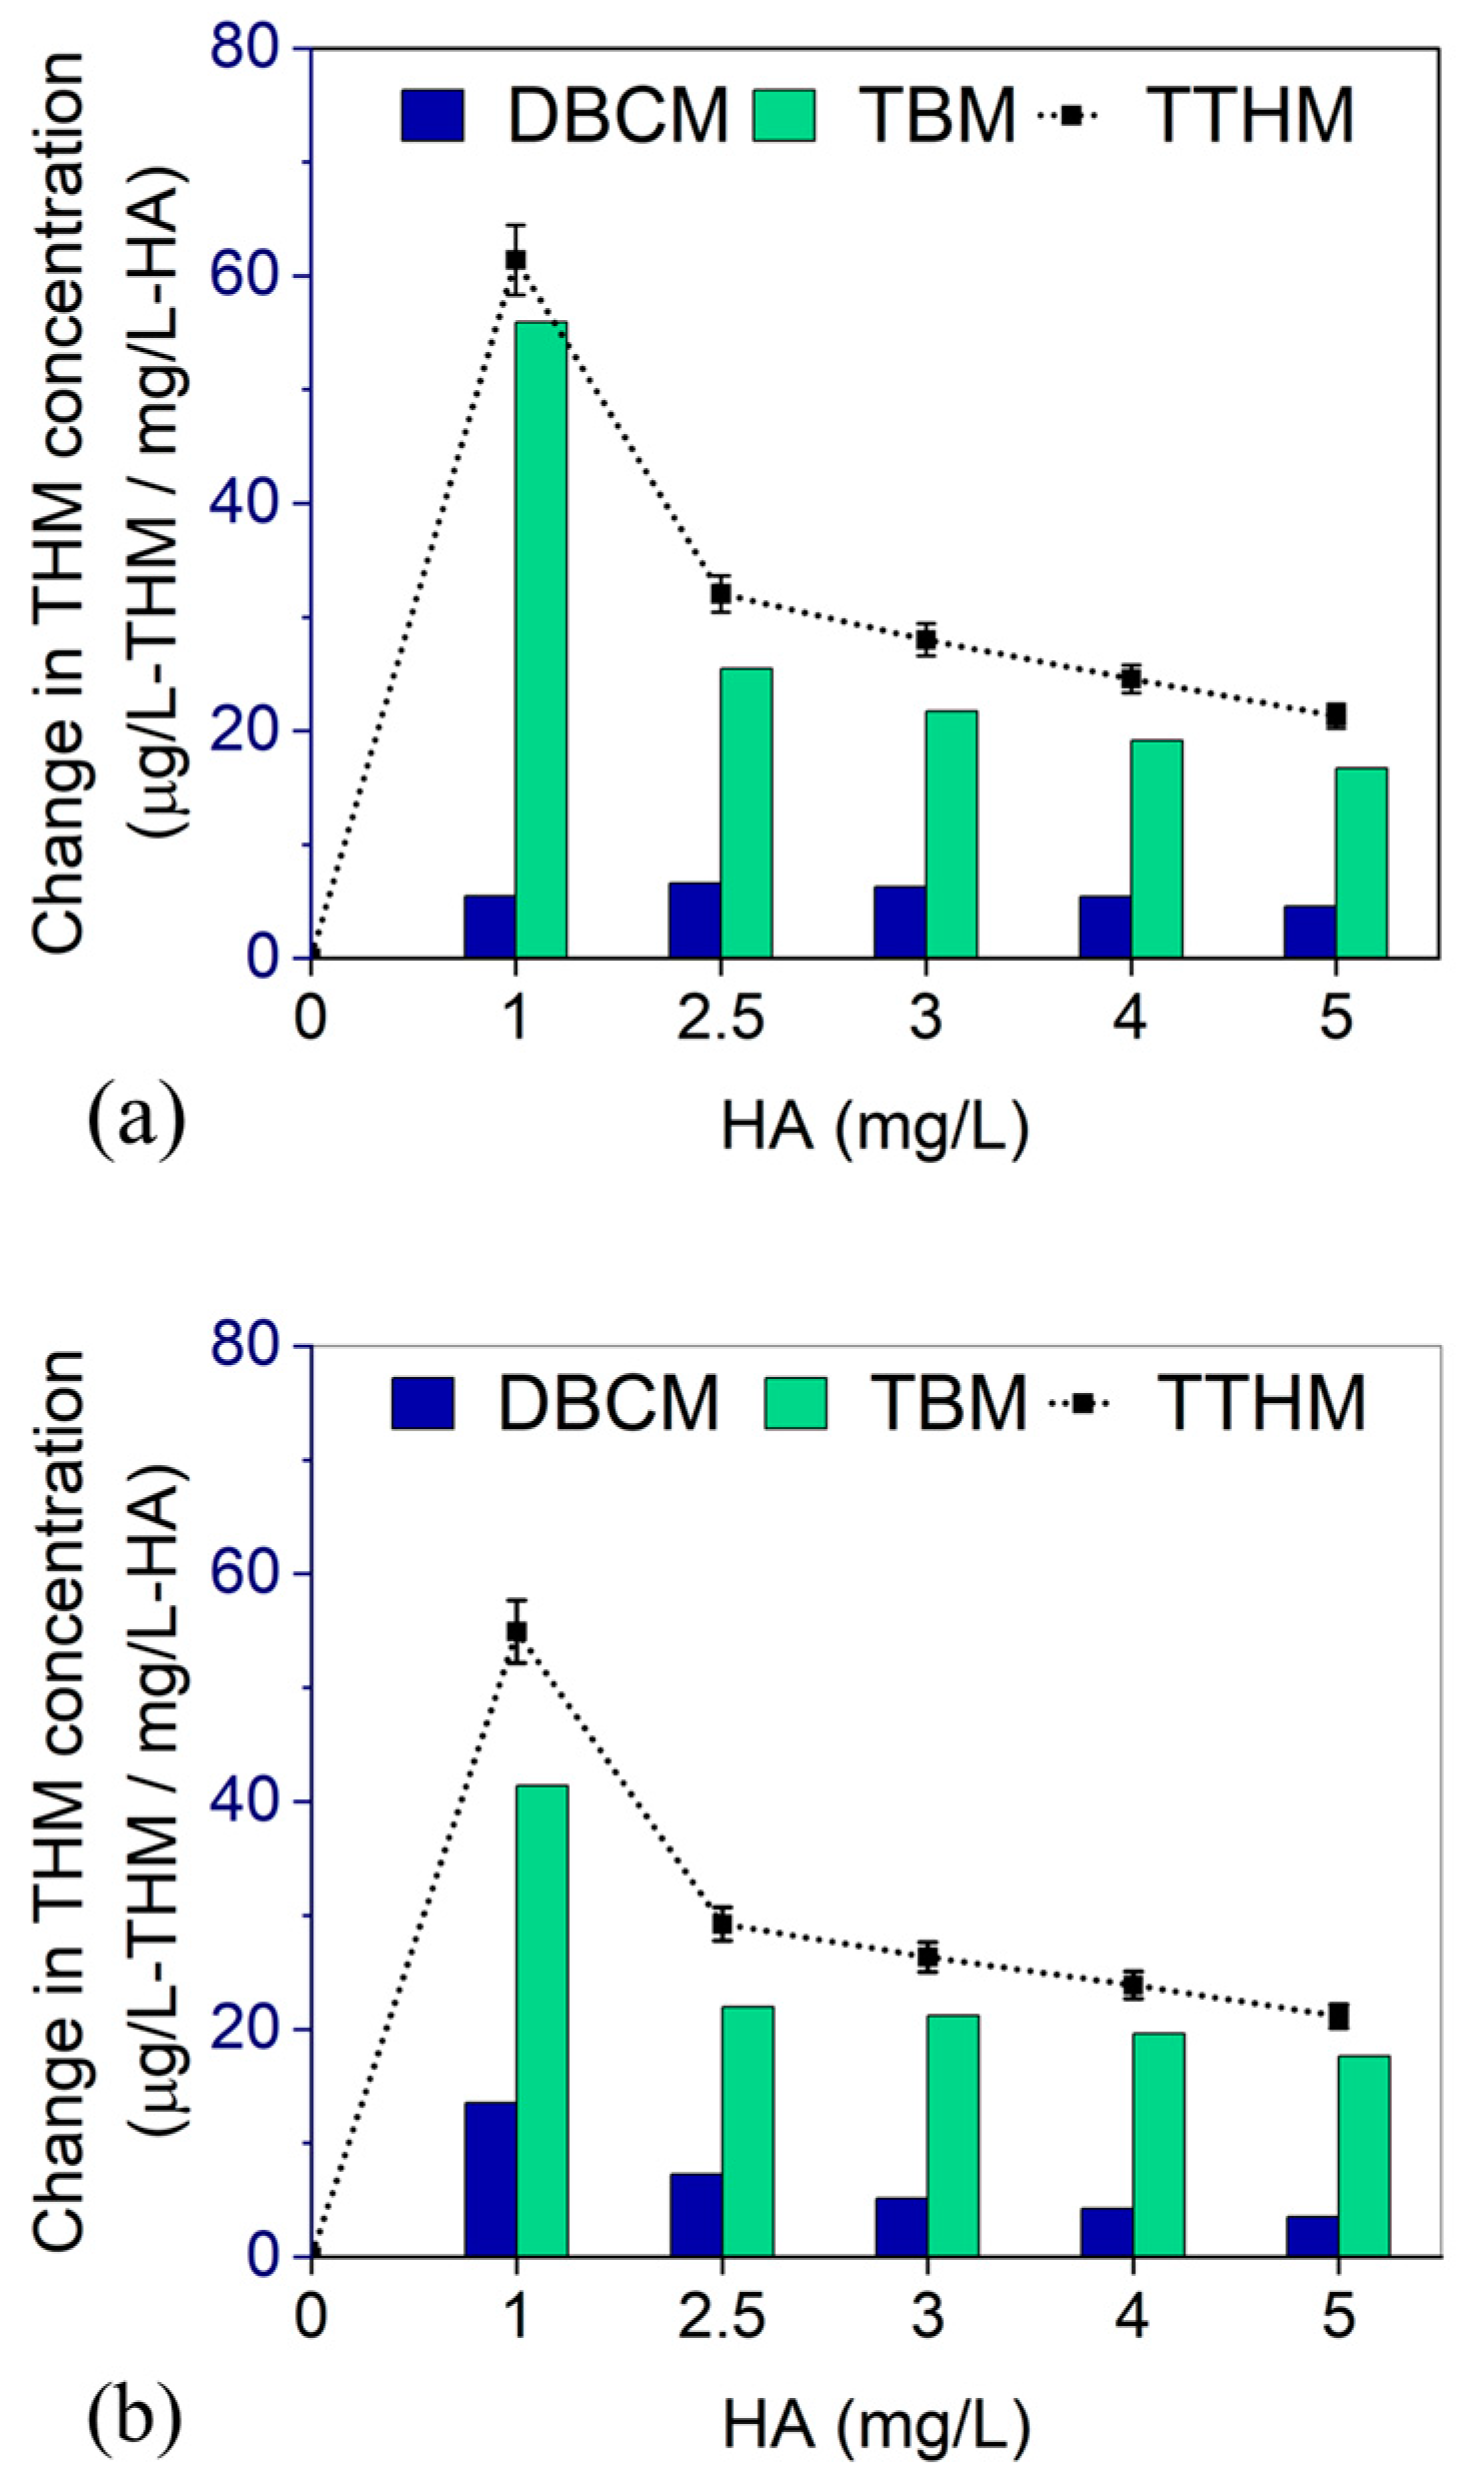
The effect of NOM on THM formation in the seawater-intruded water was evaluated in the second set of experiments. Increasing HA concentrations from 0 to 5 mg/L resulted in a higher formation of THMs at each increment of NOM (Figure 3). Since water contained 1% of SW, only DBCM and TBM were formed. DBCM was not formed after 24 h at zero HA concentration and only 3.01 µg/L was formed after 48 h. This can be attributed to the background NOM concentration of the reaction mixture (0.1–0.5 mg/L). In comparison with THM formation in the first set of experiments, i.e., increasing SWI at constant HA, the TTHM concentrations in the second set of experiments was low. For an increase from 0% to 5% HA, the TTHMs changed from 23.99 µg/L to 130.51 (5.4 times) after 24 h and to 145.5 µg/L (6.0 times) after 48 h. These results indicate that SWI had a higher impact on THM speciation compared to NOM concentration.
3.5. Effect of Chlorine Demand, Chloride, and Bromide Concentrations
Out of the four THMs, only TBM was positively correlated with chlorine demand (Figure S4). TBM concentration showed a statistically significant linear relationship with the chlorine demand of seawater-intruded waters (R2 = 0.73, p = 0.0005). The correlation of TCM, BDCM, and DBCM with chlorine demand were statistically insignificant, with p values of 0.17, 0.30, and 0.58, respectively.
Initial chloride concentration was poorly correlated with TCM (p = 0.22), BDCM (p = 0.10), DBCM (p = 0.13), and TBM (p = 0.13) at the 95% confidence level. Conversely, bromide concentrations were highly positively correlated to THMs, except in the case of BDCM after 24 h and TCM after 48 h (Figure 4a,b). After 24 h reaction, DBCM was found to be highly correlated to initial bromide concentration, followed by TCM as well as TBM. After 48 h, it was DBCM > BDCM > TBM.
Since bromide concentration had highest correlation to different THMs, the association of Cl/Br ratio to THMs followed an almost reverse trend of bromide to THM correlation (Figure 4c,d). The change of THM species with Cl/Br ratio and associated correlation parameters are given in Table 3. TCM showed a positive linear correlation with increasing Cl/Br ratio for both 24 h and 48 h. After 48 h, TBM and BDCM were inversely correlated with Cl/Br ratio at a higher slope. However, the correlation of DBCM was statistically insignificant (p = 0.06).
There was no correlation between chloride and TTHM (p = 0.10) (Figure S5a). Szczuka et al. [15] and Young et al. [16] reported no association between bromide concentration and THMFP. However, the current study, as well as that of Ged and Boyer [14], observed a strong relationship between bromide and TTHM (Figure S5b). TTHM increased with increasing bromide concentration (p = 0.002, R2 = 0.96) and decreased with increasing Cl/Br ratio (p = 0.020, R2 = 0.87) (Figure S5c). The decrease in TTHM at a higher Cl/Br ratio needs to be investigated further, with special attention to the formation of other DBP classes such as haloacetic acids and haloacetonitriles.
3.6. Bromine Substitution Factor
The BSF values of water under the influence of SSW increased from 0 to 2.3 for an increase in SWI from 0% to 0.25% and reached a maximum at 3% intrusion (Figure 4e). Similar trends were observed for reaction periods of 24 h and 48 h, except that the initial BSF observed after 48 h was 0.63. From 0.25% to 2% SSW intrusion, the BSF values were in the range of 2.7 ± 0.27, marking a shift towards DBCM and TBM. These values were similar for 48 h, indicating that the reaction period had less impact on the speciation of THMs in the case of SSW intrusion. In the case of RSW intrusion, the BSF did not reach a maximum even at 3% intrusion (Figure 4f). Even though for the reaction period of 24 h, the BSF value increased from 0 to 2.2 for an increase in RSW from 0% to 0.25%, the 48 h reaction period did not see such a linear change. It increased from 0.63 to 1.4 for the same increase in RSW intrusion. The maximum BSF observed was 1.9 for 3% RSW intrusion after 48 h. Unlike SSW, the average BSF of RSW for SWI of 0.25–3% decreased from 2.67 ± 0.26 to 1.81 ± 0.23 for a reaction time of 24 to 48 h. These values correspond to the predominance of DBCM and TBM at 24 h and BDCM and DBCM at 48 h. This observation is in accordance with previous studies [28]. One of the differences between RSW-intruded samples compared to the SSW intruded one was lower Cl/Br ratio. Therefore, these results indicate that at lower Cl/Br ratio, reaction time has higher impact on bromination compared to higher Cl/Br ratio. In this case, a shift towards chlorinated THMs with time was also observed.
4. Discussion
Chlorine demand is known to follow first-, second-, or third-order reactions depending on the constituents of water media [8]. Inorganic compounds react faster with HOCl than organic compounds. Further, chlorine is highly selective in its reaction with organic compounds, and its reactivity is limited to certain analogues such as amines and aromatic carbon compounds. The increase in chlorine demand with the increase in HA concentration can be attributed to this property of chlorine. Compared to SSW, RSW had more organic matter in the samples, and as expected, the chlorine demand was higher.
THM formation in the present study is consistent with two other studies [10,14]. In both studies, THM formation increased with the increase in SWI with a definite shift towards Br-THMs. As SWI increased from 0% to 2%, Ged and Boyer [14] observed a 2.6-fold increase in THM formation. In our study, THM formation increased 8.3 times with an increase in SWI from 0% to 2%. However, the methodology of Ged and Boyer [14] followed a simulation of SWI by mixing RSW from the Gulf of Mexico and groundwater, rather than the method followed in the present study, where deionized water was mixed with seawater and HA. The higher amount of THM formation in the current study compared to other studies reported in the literature may be due to readily available NOM in the form of HA. HA is one of the major NOM groups for THM formation [29,30].
Previous studies reported that the abundance of bromide favours formation of Br-THMs [29]. Like the present study, Chowdhury [10], reported that the fractions of TCM, BDCM, DBCM, and TBM in water with no intrusion (0%) changed from 76.3%, 15.1%, 6.9%, and 1.6% to 0.5%, 1%, 9.8%, and 88.7% for SWI of 2%. Additionally, the initial increase in BDCM and DBCM with increasing SWI and a decrease in the further addition of seawater was similar to the present study. The effect of NOM on THM formation in seawater-intruded waters has not been examined before. However, in inland surface waters, NOM is often used as a tool for predicting THM formation potential (THMFP) [31,32]. The faster reaction of chlorine with humic substances, lignin, and plant derived NOMs compared to polysaccharides and cellulose resulted in greater THMFP in surface waters. This is because of the active functional groups and high electron density of their aromatic rings [29]. Around 30–84% of raw water NOM was HA-like substances [29]. Since THM formation increases with increasing NOM, the presence of higher humic substances and plant derivatives in surface water compared to groundwater increases the potential of surface water for THM formation. Although equal concentrations of NOM indicate similar THMFP, salinity of water may result in more Br-THMs compared to normal surface water. Therefore, salty lakes or rivers are at maximum potential for higher THM formation and for an increase in Br-THMs compared to seawater-intruded groundwater.
Several studies have shown that competitive ions such as bromide or iodide had a larger impact on THM speciation than NOM [33,34]. THM formation was predominantly Br-THMs in an experiment using soil organic content [29]. The sample soil organic content was collected near a coast that was under the influence of seawater that contained a bromide concentration of about 65 mg/L. The order of THM speciation in this study was TBM > DBCM > BDCM > TCM. The present study also indicates that Br- concentration rather than NOM determines THM speciation. These results show that the speciation in seawater-intruded waters shift from one compound to other and that the THMs are converted from one form to another depending on the availability of bromide ions. Evidently, bromide concentration is the limiting agent rather than chloride concentration in THM speciation for waters affected by SWI.
Results of the present study will be useful for coastal water treatment and supply systems and researchers for developing and implementing measures to diminish health impacts that may arise from chlorination of water that is under SWI. Besides THMs, other DBPs such as haloacetic acids and haloacetonitriles also are by-products of chlorination. Therefore, the formation of these compounds is also expected in seawater-intruded waters. The present study indicates possible trends in the formation and speciation of other DBPs, i.e., elevated concentrations of brominated compounds. Around 300 possible chlorination by-products are identified, including THMs and five haloacetic acids that are regulated in drinking water [35]. However, since the current study was carried out at constant pH and temperature, the effect of these two parameters on DBP formation and speciation in water under this specific condition is not clear. Among the four similar studies (Table 1), Chowdhury [10] explored the impact of change in pH and temperature on THM formation. They found that the increase in both parameters (pH 6.5–9 and temperature 15–30 °C) resulted in increasing THM concentration. However, the speciation remained the same at all stages, i.e., TBM followed by DBCM, BDCM, and TCM.
The pattern of SWI and the resultant chloride and bromide concentration considered in the current study may not occur exactly as it is in real life, as anion transport through soil and the vadose zone depends on many physical and chemical factors, mainly the coastal aquifer processes [36]. Further, the effects of other ions present in seawater, especially of iodide, need to be addressed. This is because like bromide, iodide can also compete with reactive chlorine and form iodinated DBPs [10]. The higher reactivity of bromine compared to chlorine during disinfection is well known [37]. Alternative disinfectants to chlorine are needed considering the outcomes of chlorination of coastal water. However, due to the higher availability of bromide ions in coastal waters, the formation of inorganic DBPs such as chlorate and bromate can also be expected from other oxidative disinfection measures such as ozonation and ultraviolet radiation [37]. Therefore, remedial measures should focus on the removal of precursors and bromide from coastal water to reduce the formation of DBPs. Catalytic ozonation was reported to remove NOM and DBPs from drinking water to a great extent [5]. Similarly, low THM concentration was reported in a 3 m deep vadose zone gallery, which was a managed aquifer that was recharged with desalinated and chlorinated seawater [35]. This clearly suggests that desalination is effective in controlling DBP formation in coastal water resources.
5. Conclusions
SWI results in a linear increase in chloride and bromide concentrations in water. As Br and NOM are precursors for the formation of THMs, chlorine demand was found to increase linearly with an increase in both SWI and NOM concentrations. Increase in SWI from 0% to 3% resulted in about 8 to 10 times higher TTHM concentrations after 48 h of reaction time. TCM was the only compound at 0% intrusion after 24 h. However, with increasing seawater, a shift towards Br-THMs was observed as BDCM, DBCM, and TBM increased for SWI of 0.25% and higher. Further, only TBM was formed at 3% SSW intrusion, and it was the dominant THM at 0.25% intrusion and higher.
TTHM concentration increased with increasing NOM concentration. However, the increment in THM formation was seen to decrease at higher NOM levels. DBCM concentration increased to a lesser extent than TBM over an HA concentration range of 0–5 mg/L. For a 0–5% increase in HA, the TTHM was in the range of 23.99–130.51 µg/L after 24 h and increased to 145.5 µg/L after 48 h, indicating that the SWI had higher impact on TTHM formation and speciation than NOM concentration.
Chlorine demand was highly correlated with TBM. Bromide concentration had a positive influence on the speciation of THMs, especially towards the Br-THMs. The Br-THMs, i.e., TBM, DBCM, and BDCM decreased with the increase in Cl/Br ratio. The BSF decreased over the reaction period of 48 h, indicating the shift in speciation over time. TCM concentration increased with the increase in Cl/Br ratio. The change in concentration (increase or decrease) of various THMs with Cl/Br ratio was TBM > DBCM > TCM > BDCM. It is well known that Br-THMs are more toxic than chlorinated DBPs. Therefore, the impact of SWI on THM formation needs to be considered in coastal water supply systems.
Supplementary Materials
The following supporting information can be downloaded at: https://www.mdpi.com/article/10.3390/w14213579/s1, Figure S1: Dissolved organic carbon (DOC) for 1–5 mg/L of humic acid concentration; Figure S2: (a) Chloride and (b) bromide concentration at various seawater intrusion rates. SSW: synthetic seawater; RSW: real seawater; Figure S3: (a) Contour plot of chlorine demand with SWI levels and HA concentration and (b) normal probability plot (response is chlorine demand); Figure S4: Effect of chlorine demand on speciation of THMs; Figure S5: Change in total THMs (TTHMs) with increasing (a) chloride, (b) bromide, and (c) chloride-to-bromide ratio; Table S1: Chemical composition of synthetic seawater as per ASTM D1141-98; Table S2: Regression analysis results with regression model equation, coefficients, and ANOVA for chlorine demand, HA concentration, and SWI levels.
Author Contributions
Conceptualization, N.P.; methodology, N.P. and S.G.; formal analysis, N.P. and S.G.; writing—original draft preparation, N.P.; writing—review and editing, S.G.; visualization, N.P.; supervision, S.G. All authors have read and agreed to the published version of the manuscript.
Funding
This research received no external funding.
Institutional Review Board Statement
Not applicable.
Data Availability Statement
Data are contained within the article or supplementary material.
Acknowledgments
We thank Kola Rajesh for his assistance in sample analysis and instrumentation.
Conflicts of Interest
The authors declare no conflict of interest.
References
- Hussain, M.S.; Abd-Elhamid, H.F.; Javadi, A.A.; Sherif, M.M. Management of Seawater Intrusion in Coastal Aquifers: A Review. Water 2019, 11, 2467. [Google Scholar] [CrossRef] [Green Version]
- Alfarrah, N.; Walraevens, K. Groundwater Overexploitation and Seawater Intrusion in Coastal Areas of Arid and Semi-Arid Regions. Water 2018, 10, 143. [Google Scholar] [CrossRef] [Green Version]
- Mastrocicco, M.; Busico, G.; Colombani, N.; Vigliotti, M.; Ruberti, D. Modelling Actual and Future Seawater Intrusion in the Variconi Coastal Wetland (Italy) Due to Climate and Landscape Changes. Water 2019, 11, 1502. [Google Scholar] [CrossRef] [Green Version]
- Luoma, S.; Okkonen, J. Impacts of Future Climate Change and Baltic Sea Level Rise on Groundwater Recharge, Groundwater Levels, and Surface Leakage in the Hanko Aquifer in Southern Finland. Water 2014, 6, 3671–3700. [Google Scholar] [CrossRef] [Green Version]
- Beltrán, F.J.; Rey, A.; Gimeno, O. The Role of Catalytic Ozonation Processes on the Elimination of DBPs and Their Precursors in Drinking Water Treatment. Catalysts 2021, 11, 521. [Google Scholar] [CrossRef]
- Stein, S.; Sivan, O.; Yechieli, Y.; Kasher, R.; Nir, O. An Advantage for Desalination of Coastal Saline Groundwater over Seawater in View of Boron Removal Requirements. Environ. Sci. Water Res. Technol. 2021, 7, 2241–2254. [Google Scholar] [CrossRef]
- Goel, S. Water and Wastewater Engineering, 1st ed.; Cambridge University Press: Cambridge, UK; New York, NY, USA, 2019; ISBN 978-1-316-63903-0. [Google Scholar]
- Deborde, M.; von Gunten, U. Reactions of Chlorine with Inorganic and Organic Compounds during Water Treatment—Kinetics and Mechanisms: A Critical Review. Water Res. 2008, 42, 13–51. [Google Scholar] [CrossRef]
- Wong, G.T.F.; Davidson, J.A. The Fate of Chlorine in Sea-Water. Water Res. 1977, 11, 971–978. [Google Scholar] [CrossRef]
- Chowdhury, S. Effects of Seawater Intrusion on the Formation of Disinfection Byproducts in Drinking Water. Sci. Total Environ. 2022, 827, 154398. [Google Scholar] [CrossRef]
- Parveen, N.; Chowdhury, S.; Goel, S. Environmental Impacts of the Widespread Use of Chlorine-Based Disinfectants during the COVID-19 Pandemic. Environ. Sci. Pollut. Res. 2022, 1–19. [Google Scholar] [CrossRef]
- Ayyandurai, R.; Venkateswaran, S.; Karunanidhi, D. Hydrogeochemical Assessment of Groundwater Quality and Suitability for Irrigation in the Coastal Part of Cuddalore District, Tamil Nadu, India. Mar. Pollut. Bull. 2022, 174, 113258. [Google Scholar] [CrossRef] [PubMed]
- Kamaraj, J.; Sekar, S.; Roy, P.D.; Senapathi, V.; Chung, S.Y.; Perumal, M.; Nath, A.V. Groundwater Pollution Index (GPI) and GIS-Based Appraisal of Groundwater Quality for Drinking and Irrigation in Coastal Aquifers of Tiruchendur, South India. Environ. Sci. Pollut. Res. 2021, 28, 29056–29074. [Google Scholar] [CrossRef] [PubMed]
- Ged, E.C.; Boyer, T.H. Effect of Seawater Intrusion on Formation of Bromine-Containing Trihalomethanes and Haloacetic Acids during Chlorination. Desalination 2014, 345, 85–93. [Google Scholar] [CrossRef]
- Szczuka, A.; Parker, K.M.; Harvey, C.; Hayes, E.; Vengosh, A.; Mitch, W.A. Regulated and Unregulated Halogenated Disinfection Byproduct Formation from Chlorination of Saline Groundwater. Water Res. 2017, 122, 633–644. [Google Scholar] [CrossRef] [PubMed]
- Young, R.T.; Deem, S.; Leslie, J.C.; Salo-Zieman, V.; He, H.; Dodd, M.C. Drivers of Disinfection Byproduct Formation and Speciation in Small, Chlorinated Coastal Groundwater Systems: Relative Roles of Bromide and Organic Matter, and the Need for Improved Source Water Characterization and Monitoring. Environ. Sci. Water Res. Technol. 2020, 6, 3361–3379. [Google Scholar] [CrossRef]
- Wu, Y.; Zhu, G.; Lu, X. Characteristics of DOM and Removal of DBPs Precursors across O3-BAC Integrated Treatment for the Micro-Polluted Raw Water of the Huangpu River. Water 2013, 5, 1472–1486. [Google Scholar] [CrossRef] [Green Version]
- Dubowski, Y.; Greenberg-Eitan, R.; Rebhun, M. Removal of Trihalomethane Precursors by Nanofiltration in Low-SUVA Drinking Water. Water 2018, 10, 1370. [Google Scholar] [CrossRef] [Green Version]
- Xue, C.; Yu, Y.; Huang, X. Comparison of Organic Matter Properties and Disinfection By-Product Formation between the Typical Groundwater and Surface Water. Water 2022, 14, 1418. [Google Scholar] [CrossRef]
- APHA; WEF; AWWA. Standard Methods for the Examination of Water and Wastewater, 23rd ed.; American Public Health Association: Washington, DC, USA, 2017. [Google Scholar]
- USEPA. EPA Method 501.1, The Analysis of Trihalomethanes in Drinking Water by He Purge and Trap Method; Genium Publishing Corporation: Schenectady, NY, USA, 1979.
- ASTM Standard Practice for Preparation of Substitute Ocean Water. 2021. Available online: https://www.astm.org/d1141-98r21.html (accessed on 25 September 2022).
- Boyer, T.H.; Singer, P.C. Bench-Scale Testing of a Magnetic Ion Exchange Resin for Removal of Disinfection by-Product Precursors. Water Res. 2005, 39, 1265–1276. [Google Scholar] [CrossRef]
- Summers, R.S.; Hooper, S.M.; Shukairy, H.M.; Solarik, G.; Owen, D. Assessing DBP Yield: Uniform Formation Conditions. J. —Am. Water Work. Assoc. 1996, 88, 80–93. [Google Scholar] [CrossRef]
- Parveen, N.; Ranjan, V.P.; Chowdhury, S.; Goel, S. Occurrence and Potential Health Risks Due to Trihalomethanes and Microplastics in Bottled Water. Environ. Eng. Sci. 2022, 39, 523–534. [Google Scholar] [CrossRef]
- Font-Ribera, L.; Kogevinas, M.; Schmalz, C.; Zwiener, C.; Marco, E.; Grimalt, J.O.; Liu, J.; Zhang, X.; Mitch, W.; Critelli, R.; et al. Environmental and Personal Determinants of the Uptake of Disinfection By-Products during Swimming. Environ. Res. 2016, 149, 206–215. [Google Scholar] [CrossRef] [PubMed]
- BIS. Indian Standard 10500 Drinking Water—Specifications (Second Revision); Bureau of Indian Standards: New Delhi, India, 2012; p. 16.
- Stefán, D.; Balogh, J.; Záray, G.; Vargha, M. Comparison of Disinfection By-Product Formation and Distribution during Breakpoint Chlorination and Chlorine-Based Disinfection in Drinking Water. Water 2022, 14, 1372. [Google Scholar] [CrossRef]
- Padhi, R.K. Carbonaceous DBP (THMs and HAAs) Formation during Cl2 and ClO2 Treatment of Aqueous Soluble Fractions of Soil Derived Natural Organic Matter. Environ. Sci. Water Res. Technol. 2022, 8, 597–606. [Google Scholar] [CrossRef]
- Sharma, N.; Mohapatra, S.; Padhye, L.P.; Mukherji, S. Role of Precursors in the Formation of Trihalomethanes during Chlorination of Drinking Water and Wastewater Effluents from a Metropolitan Region in Western India. J. Water Process Eng. 2021, 40, 101928. [Google Scholar] [CrossRef]
- Golea, D.M.; Upton, A.; Jarvis, P.; Moore, G.; Sutherland, S.; Parsons, S.A.; Judd, S.J. THM and HAA Formation from NOM in Raw and Treated Surface Waters. Water Res. 2017, 112, 226–235. [Google Scholar] [CrossRef] [PubMed] [Green Version]
- Hyung Kim, M.; Yu, M.J. Characterization of NOM in the Han River and Evaluation of Treatability Using UF–NF Membrane. Environ. Res. 2005, 97, 116–123. [Google Scholar] [CrossRef]
- Ding, G.; Zhang, X.; Yang, M.; Pan, Y. Formation of New Brominated Disinfection Byproducts during Chlorination of Saline Sewage Effluents. Water Res. 2013, 47, 2710–2718. [Google Scholar] [CrossRef]
- Dong, H.; Qiang, Z.; Richardson, S.D. Formation of Iodinated Disinfection Byproducts (I-DBPs) in Drinking Water: Emerging Concerns and Current Issues. Acc. Chem. Res. 2019, 52, 896–905. [Google Scholar] [CrossRef]
- Bernstein, A.; Studny, R.; Shyntychea, V.; Kurtzman, D.; Ganot, Y.; Katz, Y.; Asfaw, B.A.; Sakaguchi-Söder, K.; Schüth, C.; Siebner, H. Low Trihalomethane Formation during Managed Aquifer Recharge with Chlorinated Desalinated Water. Water 2020, 12, 711. [Google Scholar] [CrossRef]
- Goyetche, T.; Luquot, L.; Carrera, J.; Martínez-Pérez, L.; Folch, A. Identification and Quantification of Chemical Reactions in a Coastal Aquifer to Assess Submarine Groundwater Discharge Composition. Sci. Total Environ. 2022, 838, 155978. [Google Scholar] [CrossRef] [PubMed]
- Heeb, M.B.; Criquet, J.; Zimmermann-Steffens, S.G.; von Gunten, U. Oxidative Treatment of Bromide-Containing Waters: Formation of Bromine and Its Reactions with Inorganic and Organic Compounds—A Critical Review. Water Res. 2014, 48, 15–42. [Google Scholar] [CrossRef] [PubMed]
Figure 1.
Chlorine demand at various levels of (a) seawater intrusion (SWI) with constant humic acid (HA = 2.5 mg/L) concentration and (b) HA concentration with constant SWI (SWI = 1%).
Figure 1.
Chlorine demand at various levels of (a) seawater intrusion (SWI) with constant humic acid (HA = 2.5 mg/L) concentration and (b) HA concentration with constant SWI (SWI = 1%).

Figure 2.
THM formation at varying seawater intrusion levels. SSW: synthetic seawater (a) after 24 h and (b) after 48 h; RSW: real seawater (c) after 24 h and (d) after 48 h.
Figure 2.
THM formation at varying seawater intrusion levels. SSW: synthetic seawater (a) after 24 h and (b) after 48 h; RSW: real seawater (c) after 24 h and (d) after 48 h.

Figure 3.
Change in THM formation per mg/L of humic acid (HA) added after (a) 24 h and (b) 48 h (SWI = 1%).
Figure 3.
Change in THM formation per mg/L of humic acid (HA) added after (a) 24 h and (b) 48 h (SWI = 1%).

Figure 4.
Effect of initial bromide concentration on THM speciation after (a) 24 h and (b) 48 h; initial chloride-to-bromide (Cl/Br) ratio on speciation of THMs after (c) 24 h and (d) 48 h; bromine substitution factor for varying seawater intrusion for (e) synthetic seawater (SSW) and (f) real seawater (RSW).


Table 1.
Experimental procedures in previous studies that evaluated the effect of SWI on THM formation in comparison with the current study.
Table 1.
Experimental procedures in previous studies that evaluated the effect of SWI on THM formation in comparison with the current study.
| Reference | General Experimental Procedure | Type of Seawater Used | Chlorine Dosage | Was the Effect of NOM on THM Formation Evaluated |
|---|---|---|---|---|
| [14] | Samples: One groundwater and one seawater sample from Florida, USA. SWI simulation: Groundwater sample diluted to achieve a constant DOC of approximately 1.4 mg/L. Seawater added to the diluted groundwater at 0–2% by volume. | Real seawater | As per UFC 1 | No |
| [15] | Sample: 24 SWI-affected groundwater samples from North Carolina, USA. Chlorinated in laboratory. No SWI simulation. | - | To yield a free residual chlorine of 1 mg/L after 24 h without pH adjustment. | No |
| [16] | Samples: Different coastal groundwater systems of Washington, USA. Filtered, buffered at pH 7, and chlorinated. No SWI simulation. | - | To yield a free residual chlorine of 3–5 mg/L after 7 days incubation at 25 °C. | Relative role of bromide to DOC was analysed without controlled NOM experiments |
| [10] | Sample: Groundwater and seawater samples from Dhahran, Saudi Arabia. SWI simulation: Groundwater diluted to yield a DOC similar to finished water. SWI simulation by mixing diluted groundwater and 0–2% seawater by volume. | Real seawater | 2 mg/L of chlorine for a reaction period of 8 h | No |
| Current study | Three sets of experiments for varying degrees of SWI, NOM, and Br concentrations (Section 2.2) | Real seawater and synthetic seawater | As per UFC, samples were analysed after 24 h and 48 h | Yes. Different concentrations of NOM, chloride, and bromide were added to the reaction mixtures to evaluate the effects on THM formation |
Note: 1 Uniform formation condition, see Section 2.2 for details.
Table 2.
Raw water characteristics of seawater and of water samples simulating seawater intrusion.
| Type of Seawater | Seawater Intrusion (% Volume) | pH | DOC (mg/L) | Chloride (mg/L) | Chloride (mM) | Bromide (mg/L) | Bromide (mM) | Cl/Br Ratio (Mass Basis) | Cl/Br Ratio (Molar Basis) |
|---|---|---|---|---|---|---|---|---|---|
| SSW | 0% | 7.1 | 1.4 | 2.42 | 0.068 | 0 | 0 | - | - |
| 0.25% | 7.45 | 1.5 | 55.35 | 1.56 | 0.19 | 0.002 | 290.1 | 653.8 | |
| 0.5% | 7.52 | 1.6 | 118.2 | 3.33 | 0.40 | 0.005 | 290.1 | 653.9 | |
| 1% | 7.59 | 1.6 | 220.1 | 6.20 | 0.75 | 0.010 | 291.0 | 656.0 | |
| 2% | 7.74 | 1.7 | 400.7 | 11.30 | 1.39 | 0.017 | 288.7 | 650.6 | |
| 3% | 7.98 | 1.7 | 635.9 | 17.93 | 2.19 | 0.027 | 290.9 | 655.7 | |
| RSW | 0% | 7.1 | 1.4 | 2.42 | 0.068 | 0 | 0 | - | - |
| 0.25% | 7.65 | 1.6 | 87.1 | 2.45 | 0.52 | 0.006 | 164.6 | 371.1 | |
| 0.5% | 7.80 | 1.6 | 175.1 | 4.94 | 1.05 | 0.013 | 162.7 | 373.2 | |
| 1% | 7.95 | 1.8 | 352.4 | 9.93 | 2.12 | 0.026 | 158.1 | 373.2 | |
| 2% | 8.11 | 1.8 | 698.4 | 19.70 | 4.20 | 0.052 | 151.8 | 373.9 | |
| 3% | 8.20 | 1.9 | 1045.2 | 29.48 | 6.32 | 0.079 | 142.0 | 372.3 | |
| RSW | - | 33,925.8 | 956.9 | 204.2 | 2.55 | 166.13 | 374.5 | ||
| Reference seawater 1 | - | 19,862 | 560.23 | 69.05 | 0.864 | 287.64 | 648.3 |
Note: 1 Reference seawater [15].
Table 3.
Change in speciation and concentration of each THM with changing Cl/Br ratio.
| THM | Direction of Change | Reaction Period = 24h | Reaction Period = 48h | ||
|---|---|---|---|---|---|
| Change in THM Concentration Per Unit Change in Cl/Br Ratio (µM of THM Per Cl/Br) | p Value/R2 | Change in THM Concentration Per Unit Change in Cl/Br Ratio (µM of THM Per Cl/Br) | p Value/R2 | ||
| TCM | Increase | 2.44 × 10⁻⁴ | 0.01/0.91 | 4.13 × 10⁻⁴ | 0.02/0.84 |
| BDCM | Decrease | 2.02 × 10⁻⁴ | 0.006/0.94 | 1.08 × 10⁻⁴ | 0.007/0.93 |
| DBCM | Decrease | 5.50 × 10⁻⁴ | 0.029/0.84 | insignificant | p > 0.05 |
| TBM | Decrease | 9.27 × 10⁻⁴ | 0.003/0.96 | 1 × 10⁻³ | 0.004/0.96 |
Publisher’s Note: MDPI stays neutral with regard to jurisdictional claims in published maps and institutional affiliations. |
© 2022 by the authors. Licensee MDPI, Basel, Switzerland. This article is an open access article distributed under the terms and conditions of the Creative Commons Attribution (CC BY) license (https://creativecommons.org/licenses/by/4.0/).
Share and Cite
MDPI and ACS Style
Parveen, N.; Goel, S. Effect of Seawater Intrusion on the Formation of Chlorinated and Brominated Trihalomethanes in Coastal Groundwater. Water 2022, 14, 3579. https://doi.org/10.3390/w14213579
AMA Style
Parveen N, Goel S. Effect of Seawater Intrusion on the Formation of Chlorinated and Brominated Trihalomethanes in Coastal Groundwater. Water. 2022; 14(21):3579. https://doi.org/10.3390/w14213579
Chicago/Turabian StyleParveen, Naseeba, and Sudha Goel. 2022. "Effect of Seawater Intrusion on the Formation of Chlorinated and Brominated Trihalomethanes in Coastal Groundwater" Water 14, no. 21: 3579. https://doi.org/10.3390/w14213579
Note that from the first issue of 2016, this journal uses article numbers instead of page numbers. See further details here.