Article

Treatment and Recycle of Greenhouse Nutrient Feed Water Applying Hydrochar and Activated Carbon Followed by Reverse Osmosis

by
Abu-Taher Jamal-Uddin
1,
Takashi Matsuura
2,
Fadi Al-Daoud
3 and
Richard G. Zytner
1,*
1
School of Engineering, University of Guelph, Guelph, ON N1G 2W1, Canada
2
Faculty of Engineering, University of Ottawa, Ottawa, ON K1N 6N5, Canada
3
Ontario Ministry of Agriculture, Food and Rural Affairs, Harrow, ON N0R 1G0, Canada
*
Author to whom correspondence should be addressed.
Water 2022, 14(21), 3573; https://doi.org/10.3390/w14213573
Submission received: 17 October 2022 / Revised: 31 October 2022 / Accepted: 3 November 2022 / Published: 7 November 2022
(This article belongs to the Special Issue Water Quality for Sustainable Development)

Abstract

:

Highlights

What are the main findings?
  • Treatment by self-produced hydrochar (HC) and activated carbon (AC) from tomato plant biomass resolved the issue of toxicity by GNF.
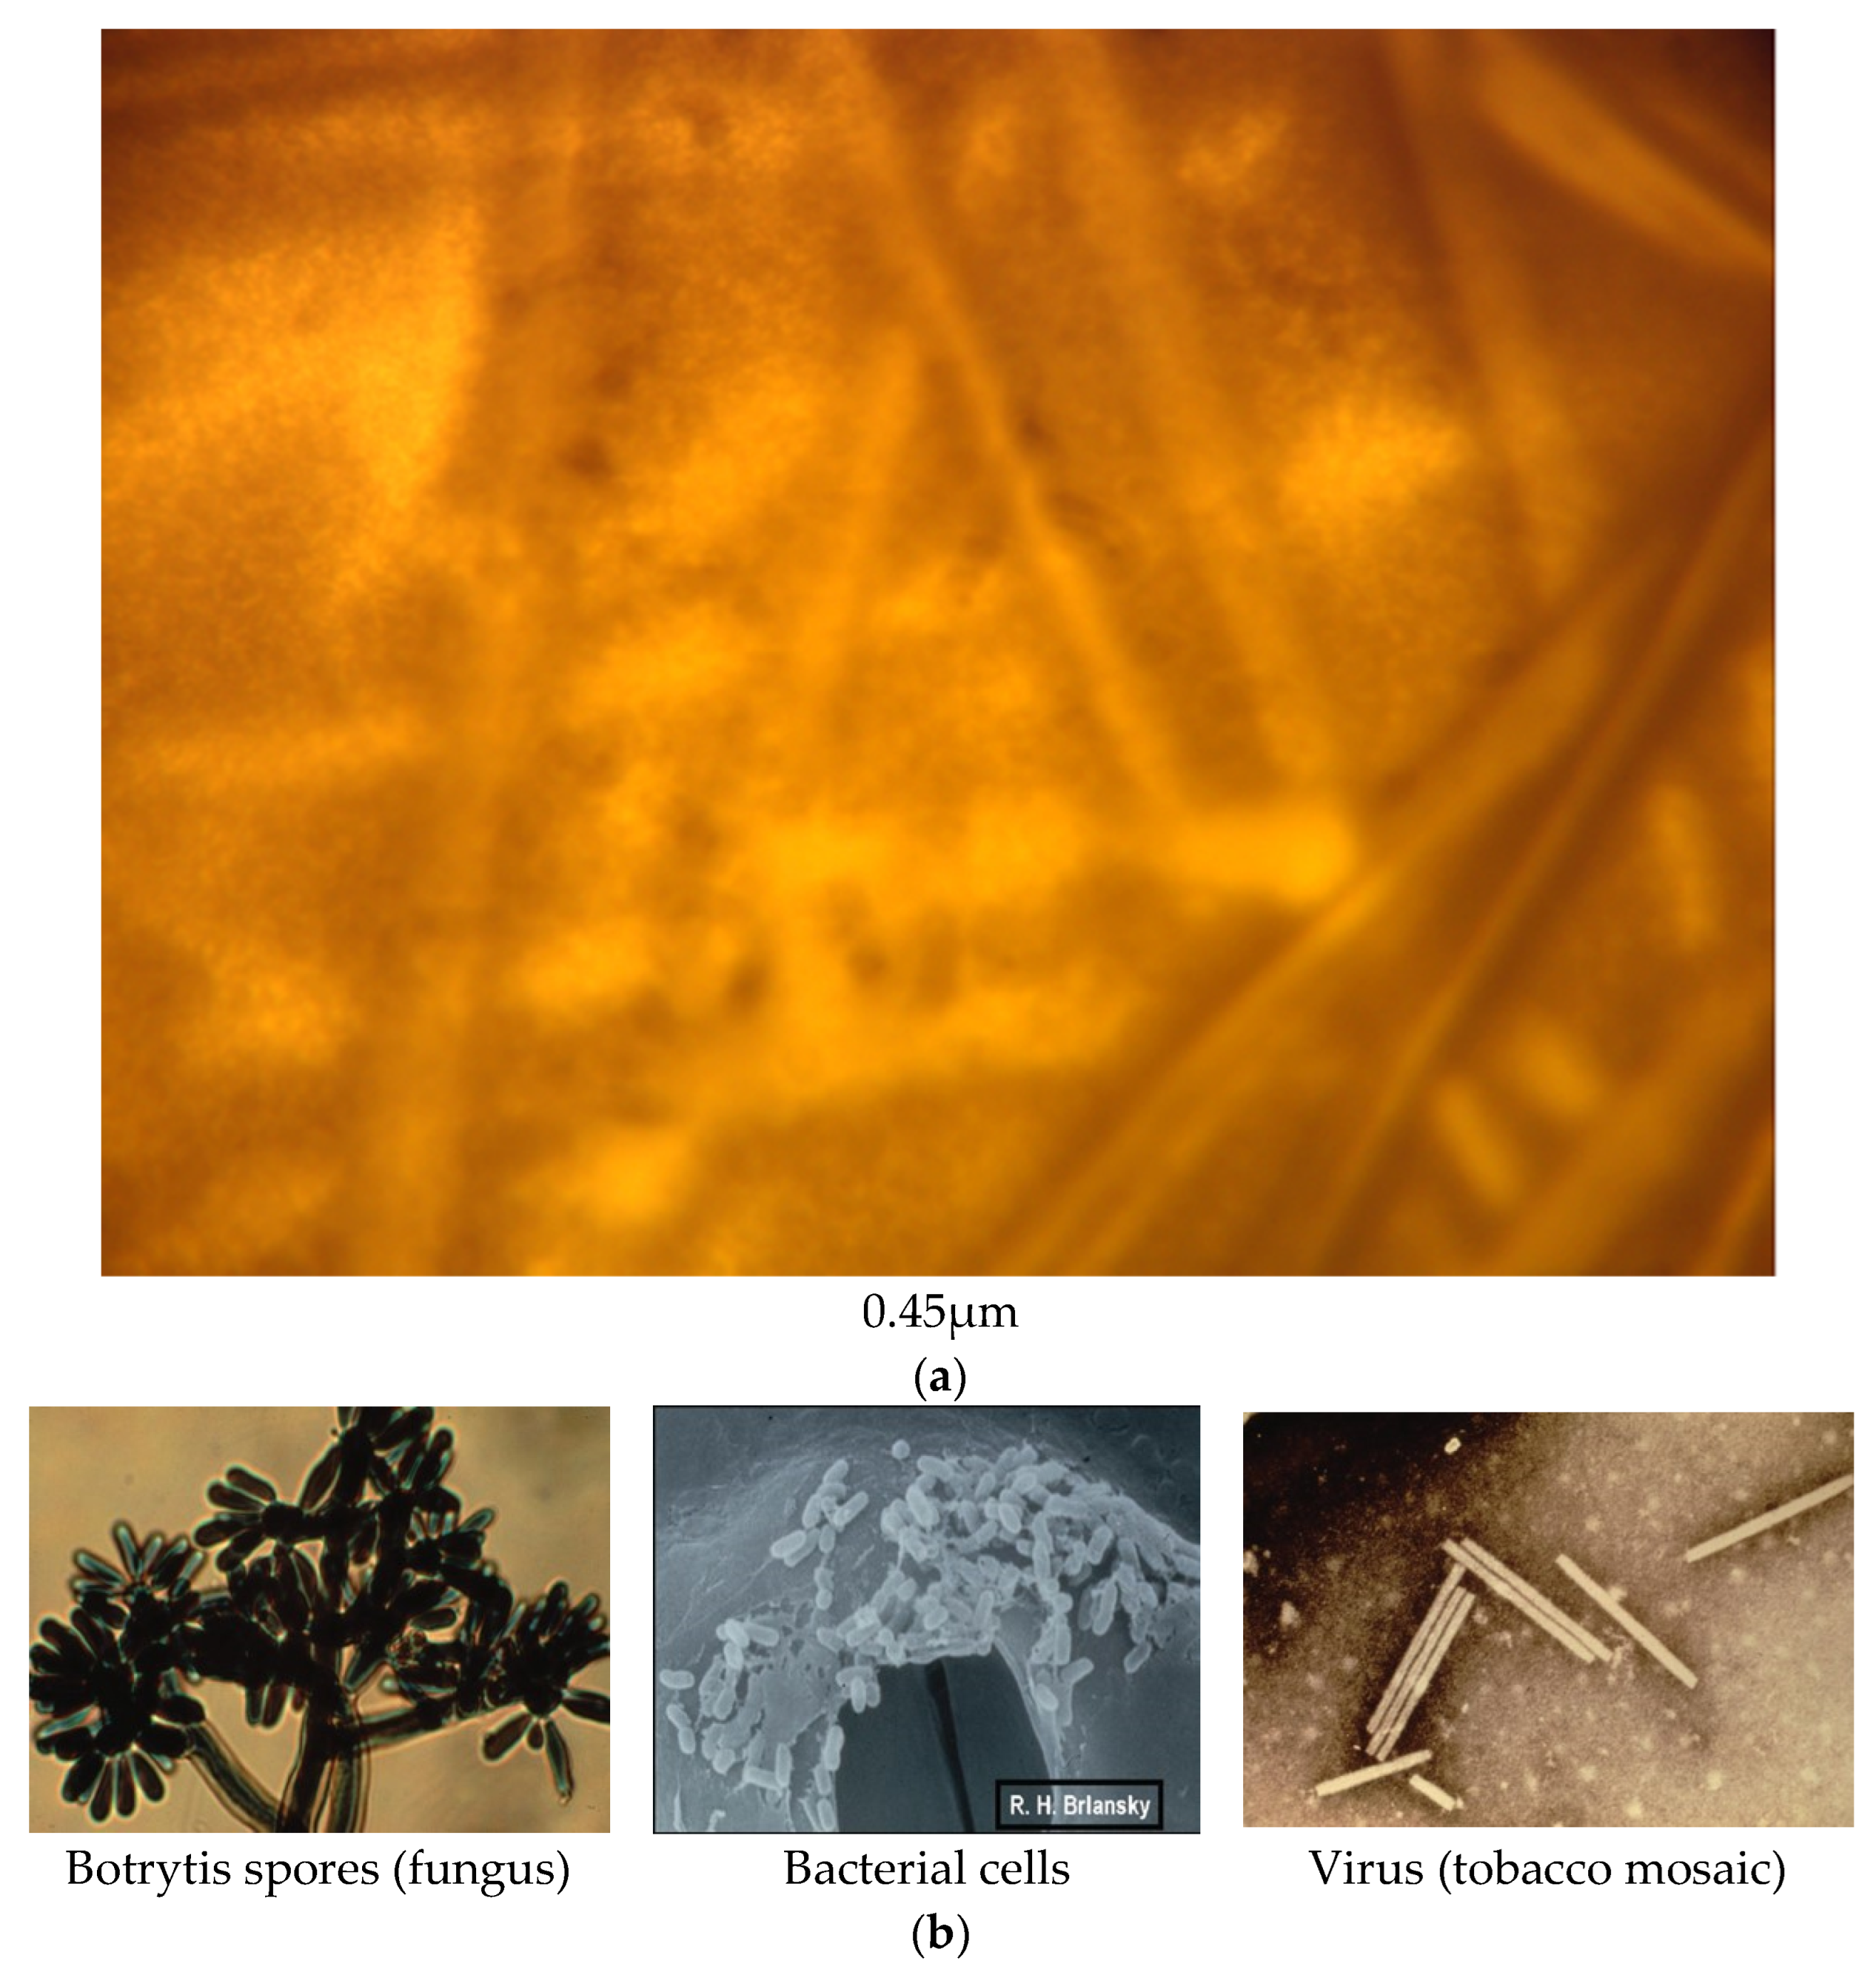
  • Other than phytotoxicity from excess ions, no impacts of the pathogens were observed from GNF.
What is the implication of the main finding?
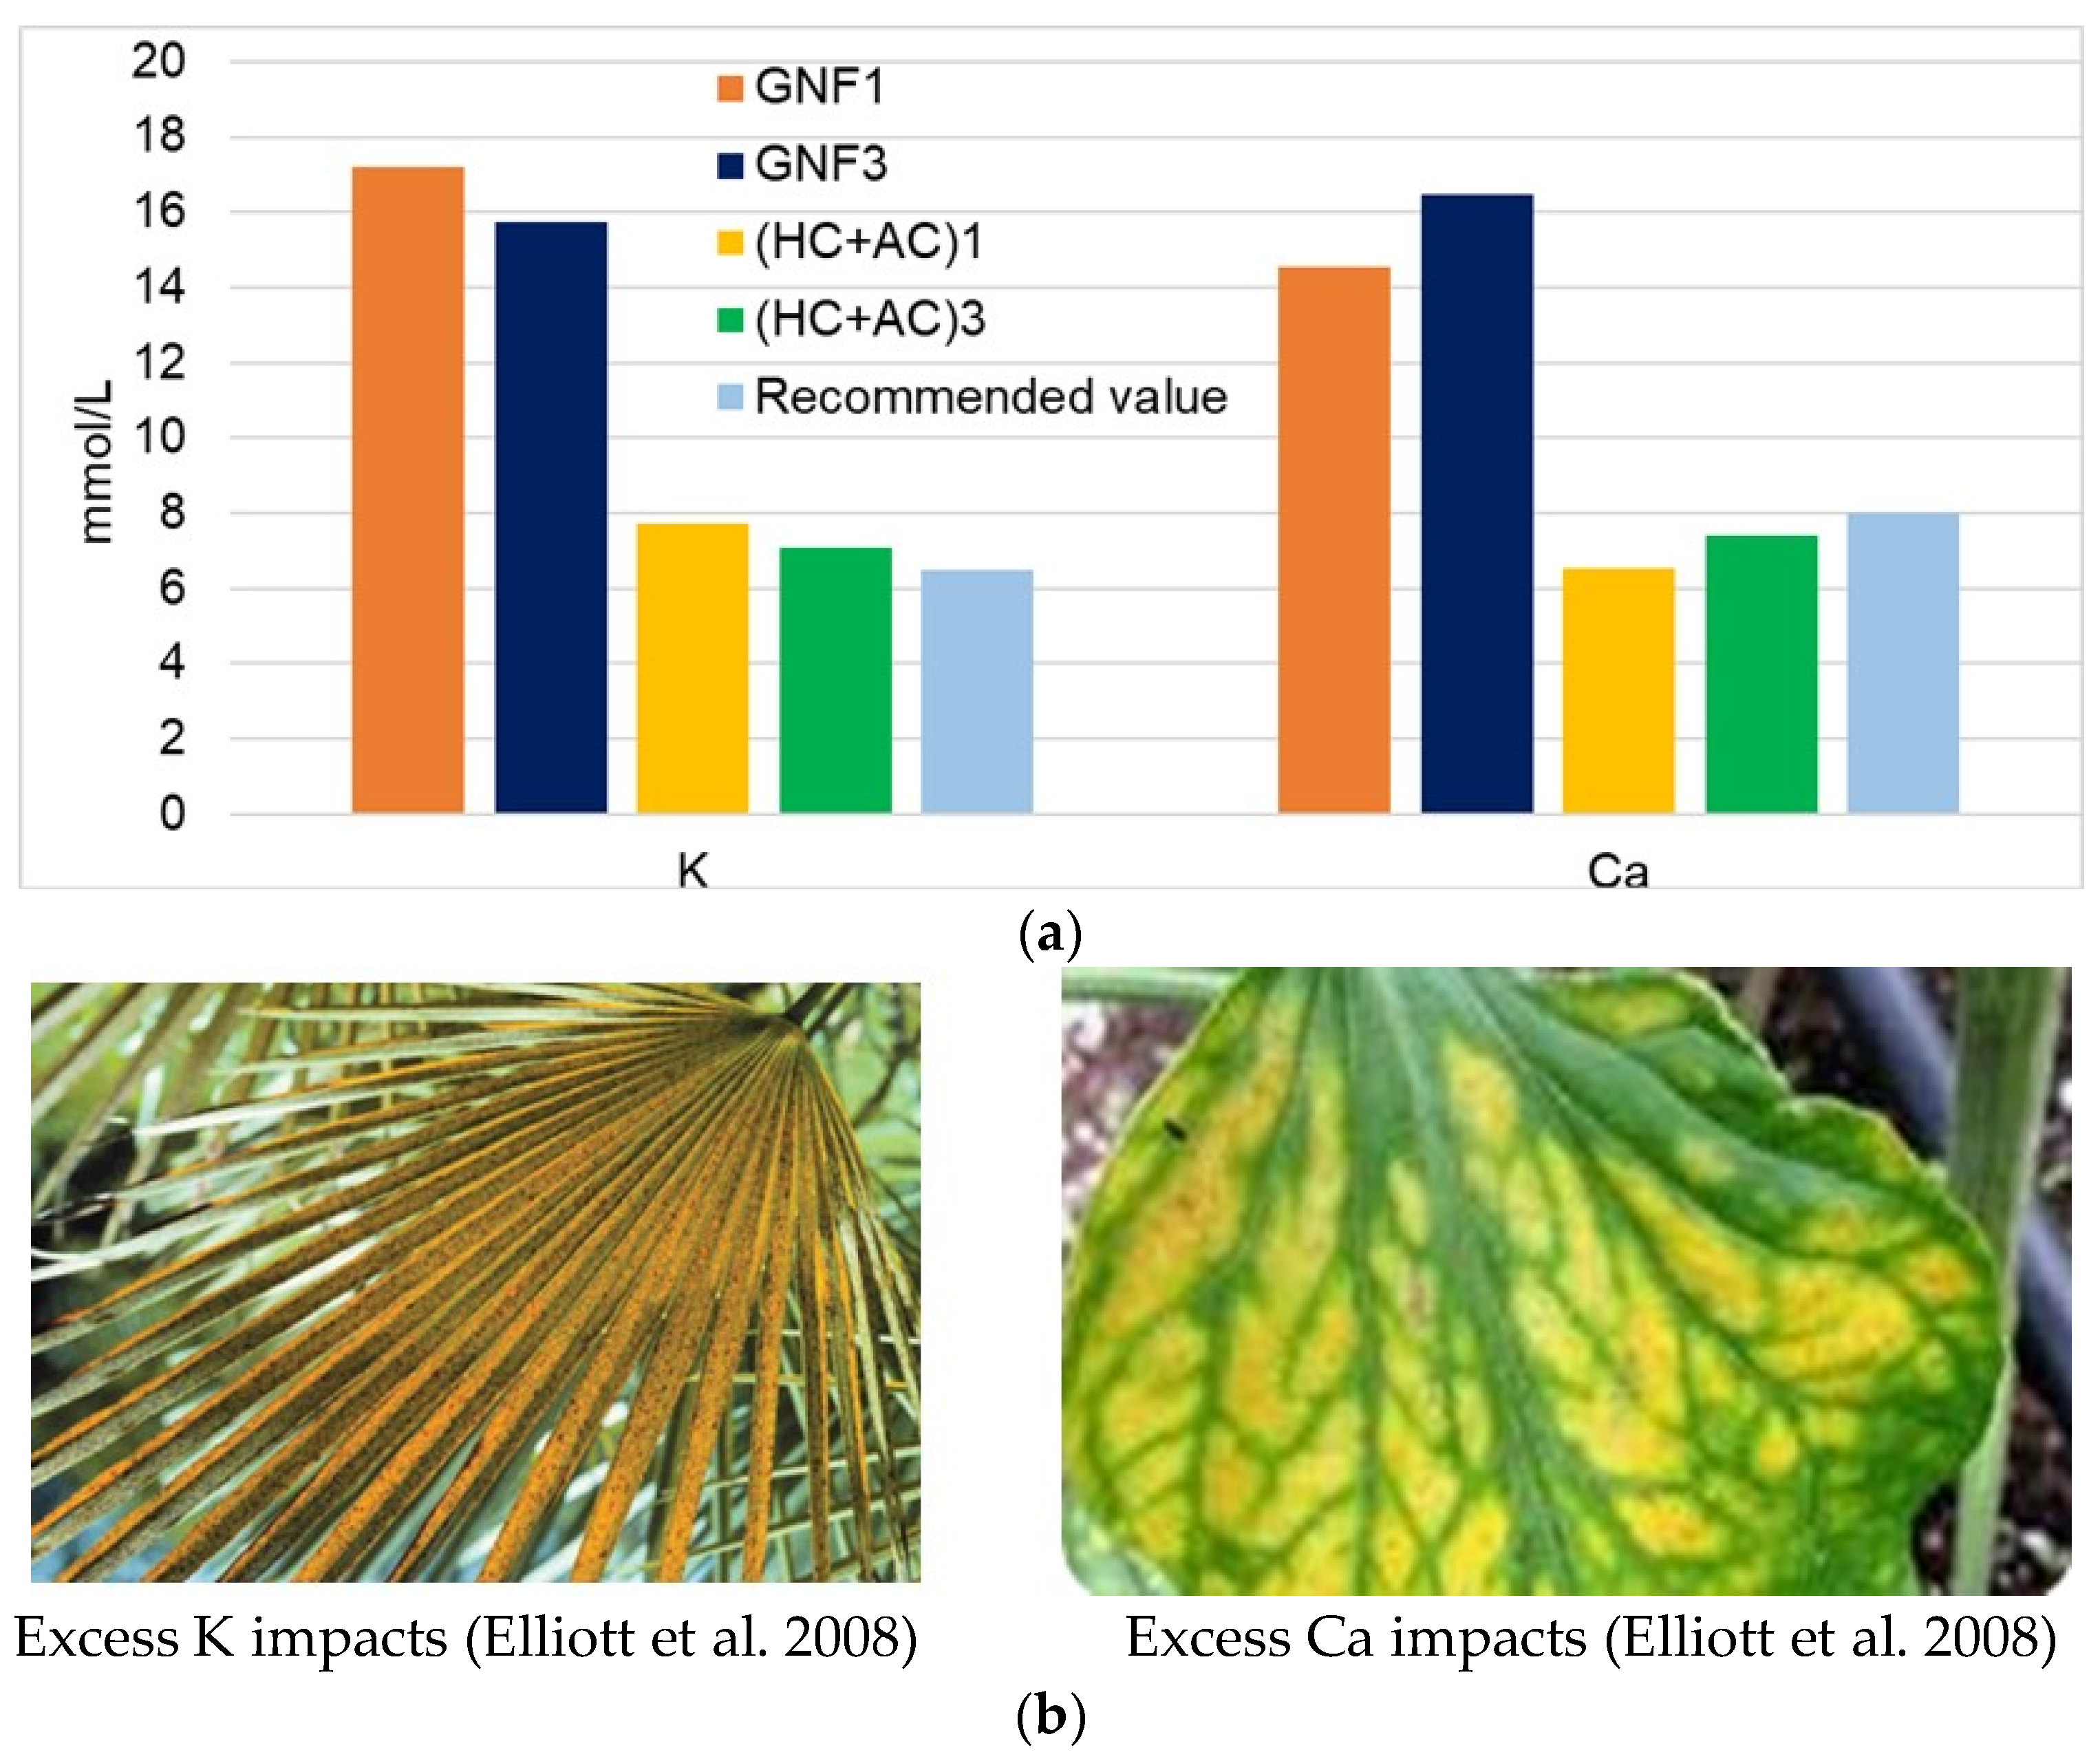
  • Higher than the limit concentrations of phytotoxic metal ions in GNF cause impaired plant growth.
  • Imbalances of micronutrients in GNFs requires continuous analyses and adjustment.

Abstract

Leached greenhouse nutrient feed (GNF) water is a great challenge for greenhouse (GH) producers. Unbalanced higher micronutrient metal’s phytotoxicity impact GH plant growth, and the high phosphorous levels can cause lake eutrophication if not treated. The analytical results of three GNFs revealed no microbial contamination in any of the GNFs, but the potassium, calcium, magnesium levels, and pH range were above the target level for root zone conditions. Both higher and lower limit concentrations are phytotoxic, causing poor or non-developed roots, leaves, and stems. Sodium was also not in the balanced range. Phosphate and nitrate nutrients were above the measurable range, showing that it would be a threat to lake eutrophication if disposed of. Due to uptake by plants at varied rates, nutrient ion imbalance in GNF is usual, but proper control or treatment is essential as GNF is not a waste but a resource providing fertilization to plants. Potential treatment options investigated include coagulation filtration, sorption with hydrochar (HC), and activated carbon (AC), followed by reverse osmosis (RO) membrane filtration. The HC and AC were produced from waste tomato plants biomass (TPB) of the same GHs to enhance the recycle–reuse of wastes. Neither metals nor nutrient concentrations were reduced to the desired levels by coagulation treatments. The HC and AC treatment provided the recycle–reuse possibility of GNF. RO membrane filtration provided about 97–99% reduction of metals and 99% reduction of nutrients, allowing GNF preparation by adding new fertilizer to the RO permeate. In such a case, the RO reject needs to be reused as feed for TPB carbonization. Different options for GHs to manage TPB and GNF are provided. As RO is an energy-expensive process, an assessment of technical know-how to provide an energy economic process is demonstrated.

1. Introduction

Plants grown in greenhouses (GH) gain food nutrients either through moist soil or the circulation of a nutrient-balanced solution (i.e., fertilizer solution), the mostly used method in a hydroponic system. After repeated circulation, part of this GH nutrient feed (GNF) water is leached for treatment due to imbalances of the micronutrient concentrations from the uptake of required nutrients by plants. Some of the unbalanced ions are toxic to plants, calling for treatment to ensure recycle–reuse. To avoid confusion, it should be mentioned here that the leach GNF is not a wastewater, it is a nutrient resource that needs to be recycled by adjusting or rectifying unbalanced nutrients to enhance the GH economy. Should the GNF quality sufficiently degrade to prevent recycling, the GH can dispose of it by selling to an agricultural agent for application in land crops.
The challenge for the GH owner is confirming to the regulating authority that nutrients are not carried out to the receiving water (Lake Erie) by runoff, as land disposal is regulated to protect Lake Erie from eutrophication. Almost 95% of the GHs in Ontario are located at the southern part of the province, and watershed runoff is discharged into Lake Erie. In 2015, the highest algae bloom in 100 years was observed due to nutrient runoff from both the USA and Canada. This bloom seriously impacted aquatic health, becoming a vital binational environmental concern [1].
Alternative ways of GNF disposal are municipal sewer or handover to a hauler, where, in both cases, GH have to pay huge surcharges on a $/m3 discharge basis, including transportation costs. Otherwise, leached GNF is to be stored in a prescribed storage tank, which also incurs huge cost and space for tank building. As a solution to these issues and to provide maximum benefits to this GH economic sector, along with an option for the protection of Great Lake water, the present research was formulated. Overall, the work supports provincial and federal requirements to protect the GH sector, as well as to address the eutrophication issue.
Statistics in 2020 on GH vegetable industries revealed Canada’s GHs export of about CAD 1.2 billion, where Ontario’s share was about 200 million, and tomato covers the highest part at 20%. Achieving these levels requires efficient water use, which is critical in GH production, especially in some arid climates where the cost of irrigation water exceeds the cost of fuel [2]. The recycling and reuse of leached GNF in GH irrigation settings allow growers to reduce freshwater and fertilizer needs. Irrigation wastewater reuse has become a well-recognized effective way of plant nutrient reclamation and water conservation pathway [3,4].
Quality water is one of the most important factors to produce healthy GH crops. Impaired water could cause slow growth or even gradual death of a plant. The presence of highly soluble salts and alkalinity interferes with nutrient uptake causing nutrient deficiency and ultimately reduces plant growth. The threshold limits for water elemental components such as potassium (K), calcium (Ca), magnesium (Mg), sodium (Na), chlorine (Cl), and HCO3 (bicarbonate) are important, as they are essential for plant uptake but also harmful as well if proper concentration limits are not maintained. The high salt concentrations directly injure plant roots, leaves, and stems. For example, potassium concentrations above 234 mg/L caused significant injury to the root of apple seedlings [5]. Salts also can accumulate in plant leaf causing burning of leaf edges, and the pH impact of high alkalinity interferes with the plant nutrient uptake [2]. At a pH above 6.0, it is difficult for plant roots to intake phosphates, Fe, Mn, Zn (Zinc), Cu (copper), and Boron, resulting in deficiency symptoms of yellowing [6].
The recommended pH limit for tomato, bean, and rose is 5.50. A pH higher or lower than this value abnormally lowers plant yields. This impact of pH is sometimes assumed to be pathogenic. Necrotic spotting, streaking, or blotches are characterized as a Mn deficiency but confused with a viral impact. Iron (Fe) or Ca deficiency may also cause yellowing [7]. Disordered growth of young leaves, upward cupping of leaves, and “witches’ broom” caused by boron deficiency may be confused with fungal or viral diseases [7]. Excess Cu and boron toxicity caused necrotic leaf spots are confused as fungal impact or sometimes assumed as pesticide damage. Higher than the limit concentration of micronutrients metals (fertilizer) may cause wilt in young plants, which is blamed on a damping-off problem from fungal impact [7]. Acceptable levels for Na and Cl in the case of tomato plants are 0.7 and 0.9 mmol/L, respectively. This limit should not be exceeded. Sodium can quickly become toxic, as its uptake by plant is very low and accumulates in the rootzone area. Chlorine reduces the uptake of NO3/PO4. When a plant needs to take water, the osmatic pressure of soluble nutrient in water prevents the uptake. Accordingly, the limit of electroconductivity must be maintained for proper growth. For a tomato plant, the limit is 1.6 mS/cm in closed hydroponic circulation and 3.7 mS/cm in the root zone [8].
Plant pathogenic impact is another issue in GH production, and it requires investigation [9]. A literature search revealed that, dissimilar to viruses, some bacteria and fungi such as Ectomycorrhizae are beneficial to plant growth [10]. Major groups of reported plant pathogens are (1) fungal, (2) bacterial, and (3) viral. Member of the first group cause damping off, root and stem rots, cucumber death, and blights of grasses and fruits. They spread from plant to plant by the movement and growth of mycelium, and spores, survive over winter and spread with the movement of diseased plants, soil, and with worker’s shoes [11]. These are soilborne pathogens that are not spread through water circulation. They enter the plant through a natural opening such as stomata, wounds, and plant cuticles [12]. The group (2) pathogen is also a soilborne pathogen. It infects via wounds, root tips, or cracks of plants; colonizes the root cortex; invades the xylem vessels; and reaches the stem and aerial parts of the plant through the vascular system [13,14]. This pathogen can easily be spread by footwear, movement of infected plant (rosaceous) materials, and insects [13]. Group (3) members include diversifications and are destructive to tomato, peppers, lettuce, and other crops [15,16]. Impacted plants are dicots, monocots, a wide range of ornamentals, vegetables, and field crops [17,18,19]. Interestingly, they are transmitted mostly via flies, whitefly vector, grafting, and thrips vector not through water. Additionally, no direct treatment is available for virally infected plants, only to remove the infected plant. Insecticides may be effective in stopping transmission vectors but cannot kill any viruses. The above interpretations lead to the conclusion that, in leached GNF, plant-harmful pathogens may be expected, as water is not the main plant pathogen carrier.
For treatment and recycling of GNF, conventional wastewater and industrial wastewater treatment strategies and methods are not applicable due to restrictions for some treatments when considering plant safety. Treatment by adding hydrogen peroxide, chlorine, chlorine dioxide, and copper ions is shown to cause phytotoxic effects on the circulating nutrient water [20]. Ozone or other oxidizing agents, if present, must be removed from the circulation water to avoid phytotoxic effects in the root zone [21]. Chlorine or other disinfectant has a phytotoxicity effect on the root zone at higher concentrations. Thus, the World Health Organization (WHO) Guidelines suggests a multi-barrier treatment approach for the safe use of irrigation wastewater or GNF in an agricultural setting, so that the reuse of water can allow GH growers to reduce the amount of water and fertilizer [3].
The WHO Guidelines suggested treatments are (i) sedimentation, (ii) flocculation, filtration, and (iii) natural die-off of microbials (if any). Based on the site-specific concerns, GH operations revealed variable water qualities, quantities, and vulnerabilities, requiring site specific treatments and managements [22]. Physical treatment may include filtration, coagulation, and wet pond. The amorphous phase sorption technique in enhanced coagulation could be a promoter in these treatment methods [23,24]. Conventional treatment of wastewater and firm-level irrigation water with slow and rapid rated sand filters were discussed [25]. Different kinds of filters and soil texture to separate different kinds of contaminants have been proposed [26]. Media sorption removal was also reported [27]. Activated carbon sorption was successfully applied in removing contaminants from fruit processing wastewater [24]. Non-activated carbon such as hydrochar is also recommended [3,28]. The above media filtrations reduce a certain % (20–60) of contaminants from the contaminated water. If a tighter membrane, such as RO filtration is used it can reduce about 99% of contaminants including monobasic metals.
Commercially available membranes include ultrafiltration (UF),> microfiltration (MF),> nanofiltration (NF)> and RO, arranged chronologically in decreased pore sizes [29]. RO is widely applied as the leading technology for critical water purification [30]. Production of boiler feed water from wastewater [31], tertiary treatment of wastewater into potable water [32], separation of fermentation broths [33], concentration of fruit juices [34], removal of Boron and Silica [35], reclamation of wastewater [36], and recycle–reuse of fruits processing wastewater removing 99% contaminants [24] are a few among numerous applications of RO. Even UF and MF membranes are reported in fungi and bacteria removal [37,38]. However, UF and MF are not capable of reducing highly concentrated phytotoxic metal ions. NF can reduce about 50–70%, while RO can reduce about 99% of soluble metals [23]. For recycle of GNF, the partial reduction of micronutrients are required depending on the GNF characteristics. Thus, if a tight membrane such as RO is used, additional fertilizer (nutrients) is required to increase the nutrient level in the permeate. Reject from the RO can be considered.
Based on the review, treatment requirements, and WHO guidelines, the objectives of the research were set to assess different non-chemical multibarrier treatments (a) coagulation filtration (b) hydrochar (HC) and activated carbon (AC) sorption, and (c) RO filtration, along with characterization of GNF collected from GHs. Sorption is the main-stream treatment and sorption agents. The applied HC and AC were produced from GH tomato plant biomass (TPB). RO and a best performing commercial AC were used for performance comparison with the performance of produced HC and AC. The establish treatment approach was evaluated by studying the quality of the leached GNF and measuring the concentrations of the targeted micronutrients. Specifically, could the GNF be safely recycled without impacting the crop plants. Doing so addresses the resource recovery and reuse of waste materials contributing to environmental sustainability.

2. Methods and Materials

2.1. Methods

Optimum coagulant dosage was determined by running individual coagulation in jar tests using the GNF water to be treated. Lowest solubility conditions (pH) of respective coagulants (Al, Ferric chloride) were determined using the gibbsite solid/amorphous solubility diagram. However, Ferric chloride provided an adverse result with GNF treatment, and is not included in results. The details of the treatment by Ferric chloride, alum and PACL coagulations are given in an earlier study Jamal-Uddin [24].
For activated carbon (AC) sorption, tests were completed to obtain the maximum amount of sorption per mass of AC. The optimum dosage of AC and time were determined from analytical results of treated (sorbed) water. The details of the treatment by sorption using AC were given in [24].
RO filtration experiments were conducted using the setup and the procedures described in [24]. For the membrane, Polysulfone-based Filmtec polyamide thin film composite (PA-TFC) extra-low energy (XLE) RO membrane was selected, Model BW30XLE (DOW, Midland, MI) with the nominal flux of 823–1023/8.6 LMH/bar, and MWCO of 100 Da. Operating pressure was maintained at about 125 psi at all times.

2.2. Analyses

For the measurement of pH, electrical conductivity, temperature and TDS, Hitachi Multi Parameter Meter (HACH HQ 40 d Multi–cat. No 58258-00; London, ON) was used. Turbidity was measured with a OAKTON Turbidimeter T-100 (Environmental Express, Charleston, SC, USA). Total nitrogen was measured following the TNT 826 method and using spectrophotometer DR 5000. Simplified Total Kjeldahl Nitrogen (TKN) was measured following the procedure TNT 880 and using spectrophotometer DR5000 by HACH. Chlorine as hypochlorous acid or hypochlorite ion (free chlorine or free available chlorine) was measured either by spectrophotometer at wavelength 530 nm or by colorimeter at 520 nm using DPD (N,N-diethyl-p-phenylenediamine) as an indicator.
Metal concentrations were measured using DIONEX ICS 2000 Ion Chromatography (Thermo Fisher, Mississauga, ON, Canada) using standard methods.
Pathogens were measured using filtration and agar plating/broth culturing methods to detect the presence of pathogens in GNF. Pathogens were collected on the surface of 0.45-µm and 0.2-µm Millipore filters by filtration, followed by agar plate culture and the subsequent microscopic imaging. The GNFs filter paper was evaluated by optical density (OP) count after 24 h, 48 h, and 72 h of incubations. Microbes of slow or non-responding to culture were confirmed by digitally imaging under a high-resolution microscope. Plate count provided the quantified data, a quantitative tool along with the back-calculation incorporating the dilution factors. For immediate assessment of pathogens Compound Binocular Biological Microscope Model–M827TL (OMAX, Kent, WA, USA) was used.

2.3. Materials

Clear GNF, leached GNF, and GH supply source water (well) were collected with the aid of Ontario Ministry of Agriculture and Rural Affairs (OMAFRA) staff from two local greenhouses (GH1 and GH2) and analyzed and treated immediately upon arrival. It should be noted that the AC and HC used in the present study were produced from the waste tomato plant biomass (TPB) of the GHs from where leached GNFs were collected. Triplicate data were generated in all the cases, and an average result is reported. Both the GHs grow mainly tomatoes, with well water (WW) being the source water. The wastewater conventional sedimentation-filtration followed by nutrients additions is used in clear leach preparation. Leached dirty water from GH2 were collected and analyzed and compared with clear leach of GH1 as no leached dirty GNF was available from GH1. The suppliers of FeCl3 (ferric chloride), Al2(SO4)3 14H2O (Alum), and PACl used as coagulants were given in [24]. Millipore filter papers and analytical chemicals were procured from HACH.

3. Results and Discussions

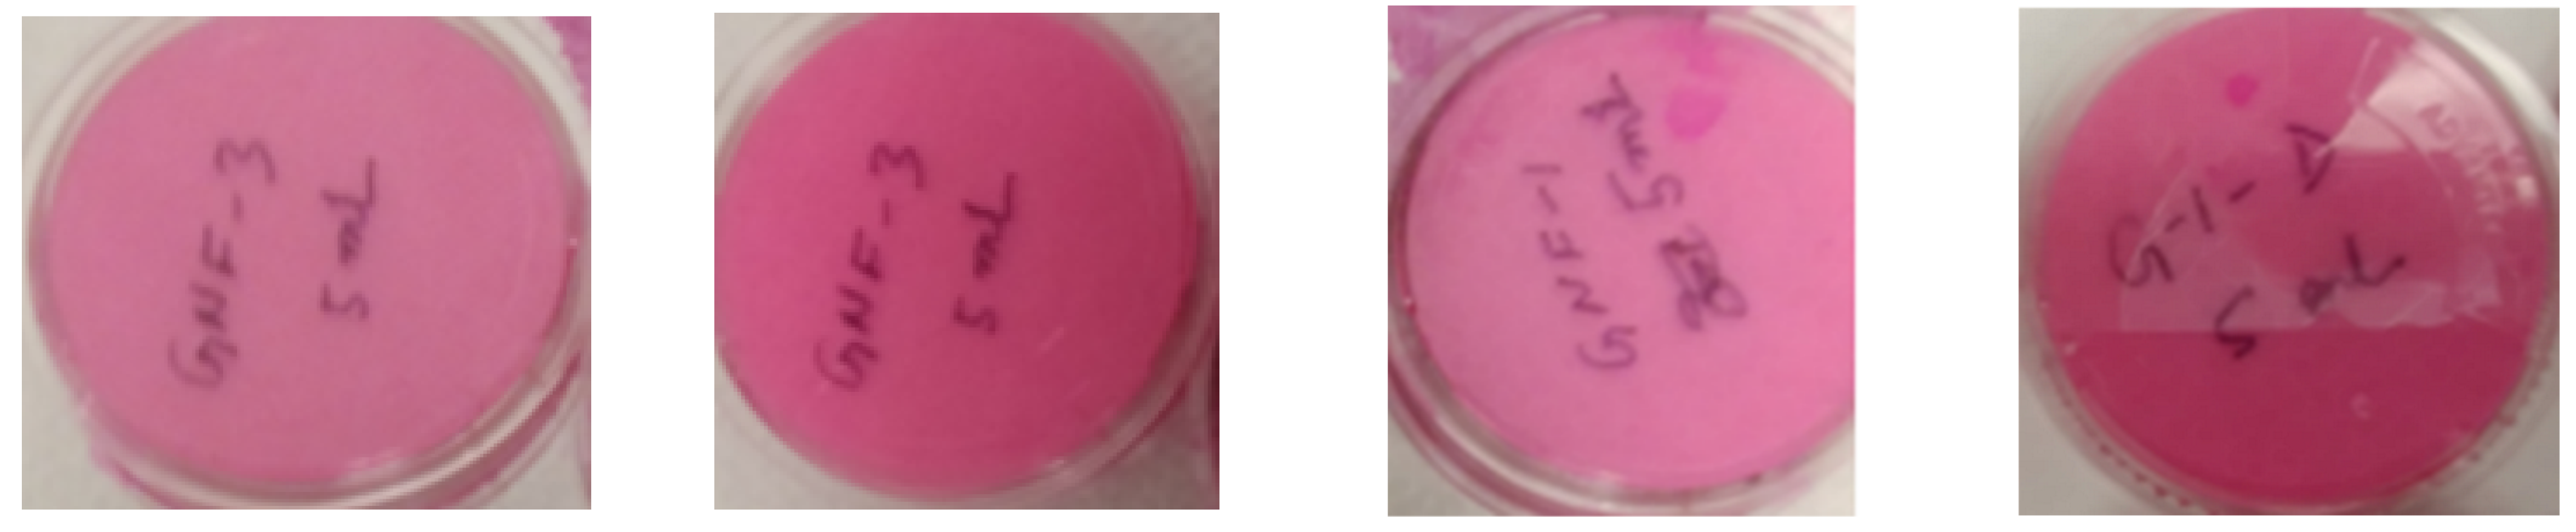
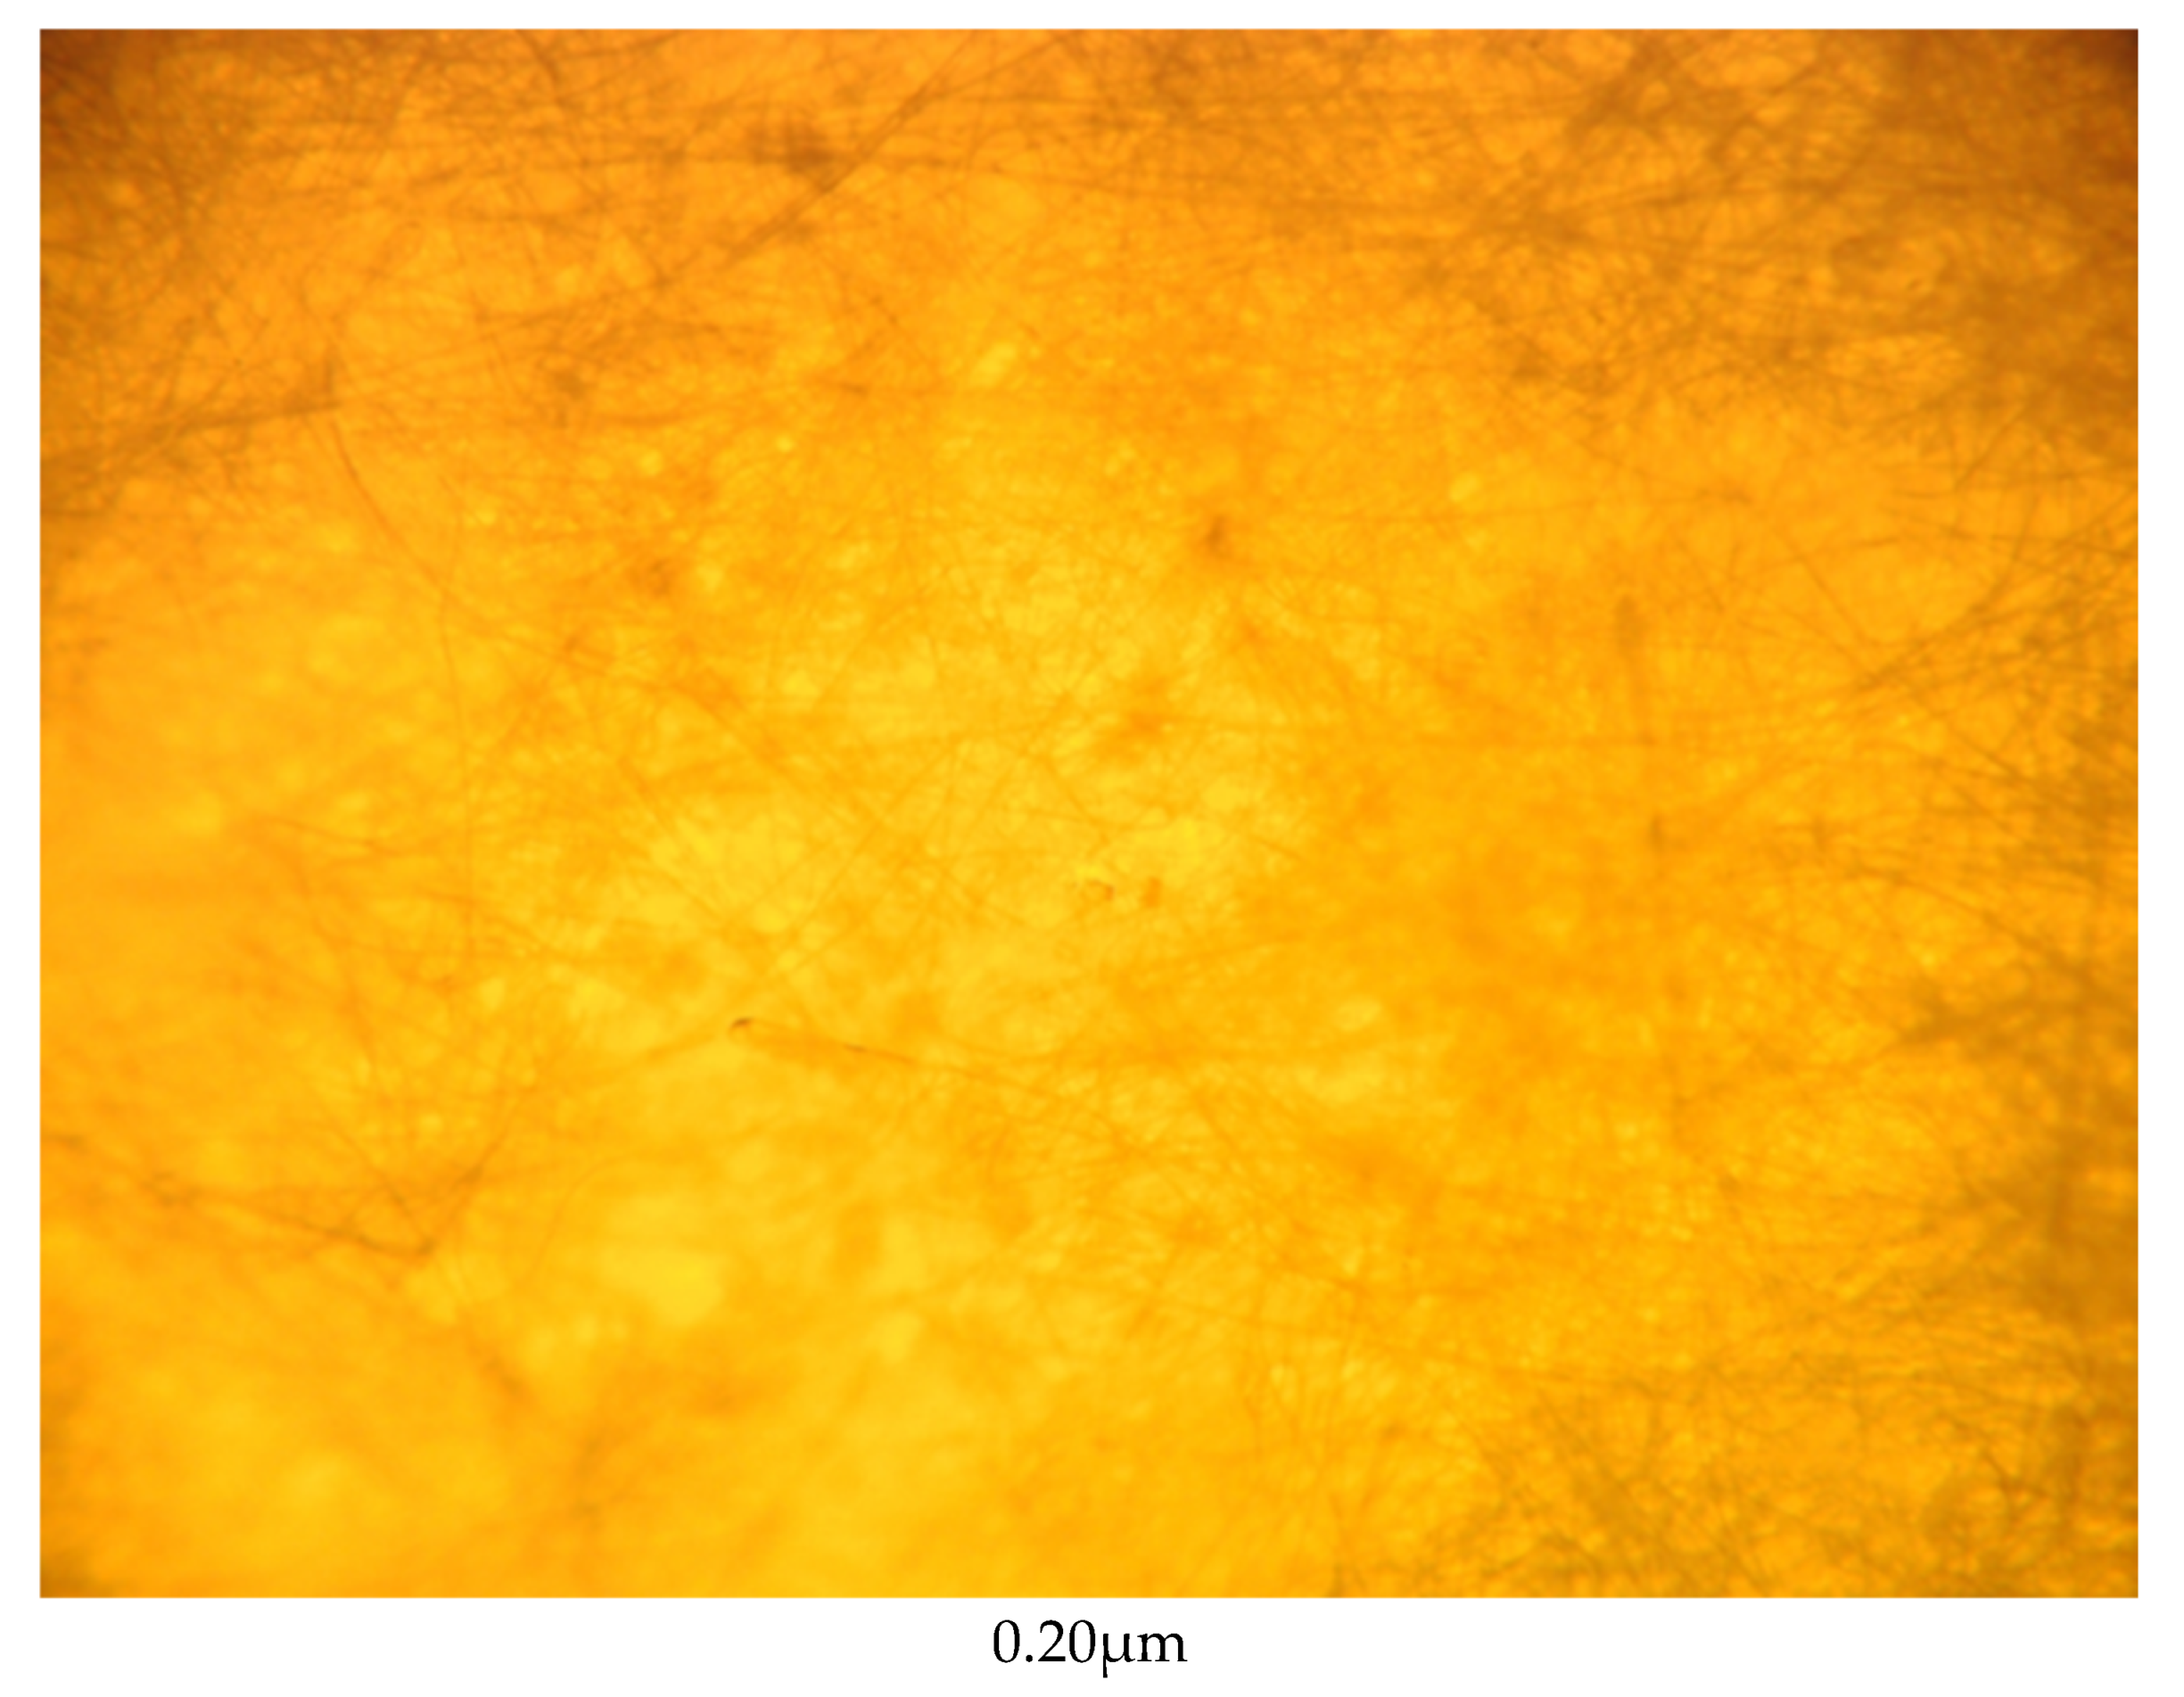
3.1. Microbial Plant Pathogens Analysis

It is known that viable ‘nonculturable” organisms such as lower-level plant pathogenic fungi, and oomycetes cannot be detected by the culture method, since they are less specific due to their slow response to culture. Otherwise, almost all the bacterial and fungal pathogens including major part of viruses should be captured by 0.2 µm filtration. Table 1 shows the sizes of pathogen groups, and K+ (potassium) in comparison with the pore size of the filter. To make the comparison easier, commonly used units were converted to SI units. Table 1 demonstrates that only a part of the viruses may pass through 0.20 µ (200 nm) filters. For easy understanding, if we look to the size of viruses (20–400 nm) in Table 1, it reveals that a 200 nm (0.20 µ) filter can remove part of viruses having size above 200 nm. Any virus size < 200 nm may pass through the 200 nm filter paper. Figure 1. shows 4 plates out of triplicated 27 plates from the three GNFs. It reveals no bacterial presence, and no response to culture was detected even after an extended incubation of 72 h.
To confirm no pathogen response, digital imaging of the surface of the filter was conducted for the raw GNFs. Figure 2a shows microscopic images of the surfaces of 0.20 µm and 0.45 µm filter papers after 48 h of incubation by the magnification of 40×. The images in Figure 2a show a very clear surface without any trace of foreign microbial particles or pathogens except the self-fiber networks. Images of some irregular spots, showing the fiber junctions, are found in Figure 2a (bottom). The observed microscopic shapes of three groups of pathogens (fungal, bacterial, and viral) were compared to typical literature view of the three groups as given in Figure 2b [39]. No match was seen, confirming that the tested pathogens were not present in the filter paper of present study. Since there were no microbes in the raw and leached GNF water, the pathogenic assessment of the treated GNF water was considered unnecessary.

3.2. Analyses of Leached GNFs including Source Well Water) and Treated GNFs

GNF1 (clear leach) from GH1 was analyzed for pH, conductivity, TDS, and turbidity as an initial step, followed by other required assessments. The GH1 is a tomato greenhouse where well water is used as source water, and after conventional sedimentation-filtration followed by nutrients addition, the water is circulated. GH1 has been facing difficulties in using the well water as the source to prepare clear leach GNF and was looking for the root causes of problems with the water. So, both the source well water and clear leach were assessed. No leached dirty water was collected from GH1.
Treatments of GNF1 were conducted using different coagulants and RO filtration to evaluate their impacts on the quality improvement. Table 2, and b show the results.
The pH of clear GHF1 was 7.05, which was higher than the circulation water pH limit for tomato root zone of 5.5 as suggested in DeKreij et al. [8]. Other limits related to tomato plant are summarized in Table 3. Thus, the GNF1 would be harmful for the tomato plant root zone. Conductivity appears to be in the acceptable range for circulation. Potassium and nitrogen elements are widely applied as fertilizer for plant growth and production. Potassium does not take part in the plant uptake process directly, but it plays a vital role in nitrogen metabolism helping with nitrogen uptake by the plants. Both the deficiency and excess of potassium was found to be a great concern in plant growth and root development. A recent study revealed that both lower than limit and above 460 mg/L (12 mmol/L) of potassium in the circulation water impacts plant growths, including the significant decrease in the growth of the root, leaf, and stem (Xu et al. [5]).
The decrease of nitrate ion flow was also observed, resulting in a lower net photosynthetic rate and photochemical efficiency, which impacted plant productions in a GH setting [5]. The optimum potassium concentration was reported to be 234 mg/L (6 mmol/L) for apple seedlings [5]. Studies on the quality of water and nutrient solution for hydroponic soilless culture of GH suggested different potassium limits for the root zone of the different plants such as tomato 6.5, pepper 5.75, cucumber 6.5, bean 7.0, and rose 2.2 mmol/L, respectively [8]. The potassium concentration in the GNF1 was 670 mg/L which is above the ideal concentration. The calcium concentration in GNF1 was 14.55 mmol/L, which is above the suggested calcium limit of 2.75 mmol/L for a closed system and <8.0 mmol/L for root zone of tomato plant [8]. Therefore, the GNF1 may cause yellowing of tomato plant if it is not treated. Based on the high concentrations of all the phytotoxic metal in the feed WW, simple sedimentation-media filtration would be insufficient to resolve the present issues of reducing metals. Furthermore, with the addition of nutrients, GH1 has to comply with tomato plant root zone limits given in Table 3. Accordingly, GH1 requires a RO filtration of source WW before use or needs to look for new source having better quality water.
Table 2b gives the concentration of potassium in GNF1 at 670 mg/L (17.18 mmol/L), which was above the suggested 6.5 mmol/L in Table 3. Cartridge filtration (CF) reduced the potassium to 11.38 mmol/L, which was also above the limits, 6.50 and 8 mmol/L for a closed system and for root zone scenario, respectively [8]. Conventional coagulation-filtrations did not reduce potassium or calcium concentrations either, even at the optimized dosages of 40 mg/L and 150 mg/L for alum and PACl treatments, respectively. Hence the simple filtration used was not effective. Although it may reduce turbidity, it seems turbidity is not an issue. High concentrations of dissolved metals that are injurious to plant growth was the issue.
Encouraging results were obtained by RO. The potassium concentration was reduced to 20 mg/L (0.51 mmol/L), which was a reduction of about 97%. The Ca concentration after RO treatment was 0.05 mmol/L, which was a reduction of about 99.4%. As well, RO treatment resulted in the 98.4 and 100% reduction of sodium and magnesium, respectively. Thus, RO treatment can be a suitable solution in resolving all the metallic concentration issues in the source water.
Turbidity was reduced from 2.2 NTU in the raw GNF to 0.24 and 0.07 NTU after alum and PACl coagulation was applied as noted in Table 2. Conductivity increased slightly via coagulation due to the dissolution of added ions from coagulants. On the other hand, RO treatment substantially reduced the conductivity from 1262 µS/cm to 24 µS/cm, and turbidity from 2.2 NTU to nil, respectively, providing a wide scope for readjustment of nutrients concentration for optimal circulation reuse operations. Alternatively, source water having better quality may also be an option for GH1 at this stage to provide well-adjusted targeted concentrations.
The GNF2 collected from GH2 is a leached one after several circulation operations. The analysis shows that it was actually unbalanced with meal ions after plant uptake. Analytical results of leached GNF2 and coagulation products with adjusted pH are tabulated in Table 4a,b. The original pH was 3.77, lower than the suggested value of 5.5. Hence, the pH was adjusted to near 6 to attain optimum effectivity in coagulation experiments. Conductivity of GNF 2 was 2430 µS/cm, about two times higher than untreated GNF1, but below the limit of 3.7 mS/cm suggested for root zone of tomato plant. After pH adjustment, it was 2038 µS/cm. As expected, the TDS follows the trend of conductivity. Similar to GNF1, potassium (15.36 mmol/L) and calcium (12.75 mmol/L) concentrations were above the limits of 8 mmol/L and <8 mmol/L, respectively in GNF2, which may cause yellowing by calcium and spotted brownish leaf due to lower net photosynthetic rate and photochemical efficiency impacts from high potassium concentration.
Similar to the earlier observations for GNF1, coagulation did not reduce conductivity of GNF2, but RO was very effective in reducing the conductivity (Table 4). After pH adjustment, the turbidity of GNF2 was reduced from 2.28 NTU to 0.42 NTU and 0.15 NTU by alum and PACl coagulations, respectively. The high conductivity values of GNF2 indicate the presence of excess nutrients ions in the solution in comparison to GNF1, but they are still below the allowable limit. It should be noted that coagulation did not show any positive effect on the reduction of metal ions in the earlier experiments with GNF1. As such, the metal analysis of coagulation treated GNF2 may not be important at this stage.
The potassium concentration of GNF2 was 15.36 mmol/L, which is slightly lower than raw GNF1 but still above the suggested limit of 8.00 mmol/L. Similar was the case for calcium with 255 mg/L (12.75 mmol/L) of GNF2, which was also lower than GNF1, but above the limit <8 mmol/L. Reduction by RO treatment was 96.50%, 95.80%, 94.50%, and 97.70% for sodium, potassium, magnesium, and calcium, respectively, which were slightly lower than in those of GNF1. The reason of this difference was the lower pH (3.77) of GNF2, which caused acidic injuries to the membrane. However, after pH adjustment the results from fresh RO membrane demonstrated higher metal ion separation than before pH adjustment. It should be noted that RO experiments should not be conducted at a pH lower than 4.50. From the analysis, freshly prepared GNF1 metal concentrations (K, Mg) were higher than leached GNF2, which was imbalanced after several circulation revealing lower quality of GNF1 and source well water.
To cross-check the results in GNF2, the second batch of GNF collected from second greenhouse was marked as GNF3 and subjected to the analysis. Table 5 shows the results. Similar to GNF1 and GNF2, coagulation did not reduce the conductivity of raw GNF3 (2.49 mS/cm), but RO reduced substantially to 0.17 mS/cm (Table 5). The pH of GNF3 (4.34) was slightly higher than the GNF2 (3.77) but still below the root zone limit of 5.50 for tomato plant. The turbidity (0.28 NTU) of GNF3 before the pH adjustment was lower than both GNF1 and GNF2, which was reduced further to 0.12 and 0.002 NTU by alum and RO treatments, respectively. The main cause was the PACL dose being higher for the treatment of GNF3 than the other GNFs, which increased slightly. Turbidity (0.28 NTU) was still very low, so turbidity is not a concern.
The potassium (15.74 mmol/L), calcium (16.45 mmol/L), and magnesium (7.49 mmol/L) concentrations were all above the allowable limits of 8.00 mmol/L, <8.00 mmol/L, and 4.50 mmol/L for potassium, calcium, and magnesium, respectively, for tomato plant root zone (Table 3). Although the potassium concentration was similar to GNF2, the calcium concentration was higher than GNF2. An added issue was that magnesium concentration in raw GHF3 (Table 5b) was much higher than raw GNF2. However, the reduction of metal concentrations by RO filtration was as high as 97.14%, 97.23%, 98.35%, and 98.18% for sodium, potassium, magnesium, and calcium, respectively, which are higher than the case of GNF2 at a normal pH.
The results reconfirmed that both GH2 and GNF3 water qualities (pH, K, Ca, and Mg) are phytotoxic and injurious to the tomato plant root zone. These impacts on plant growth, if not investigated and confirmed, could be blamed on pathogens

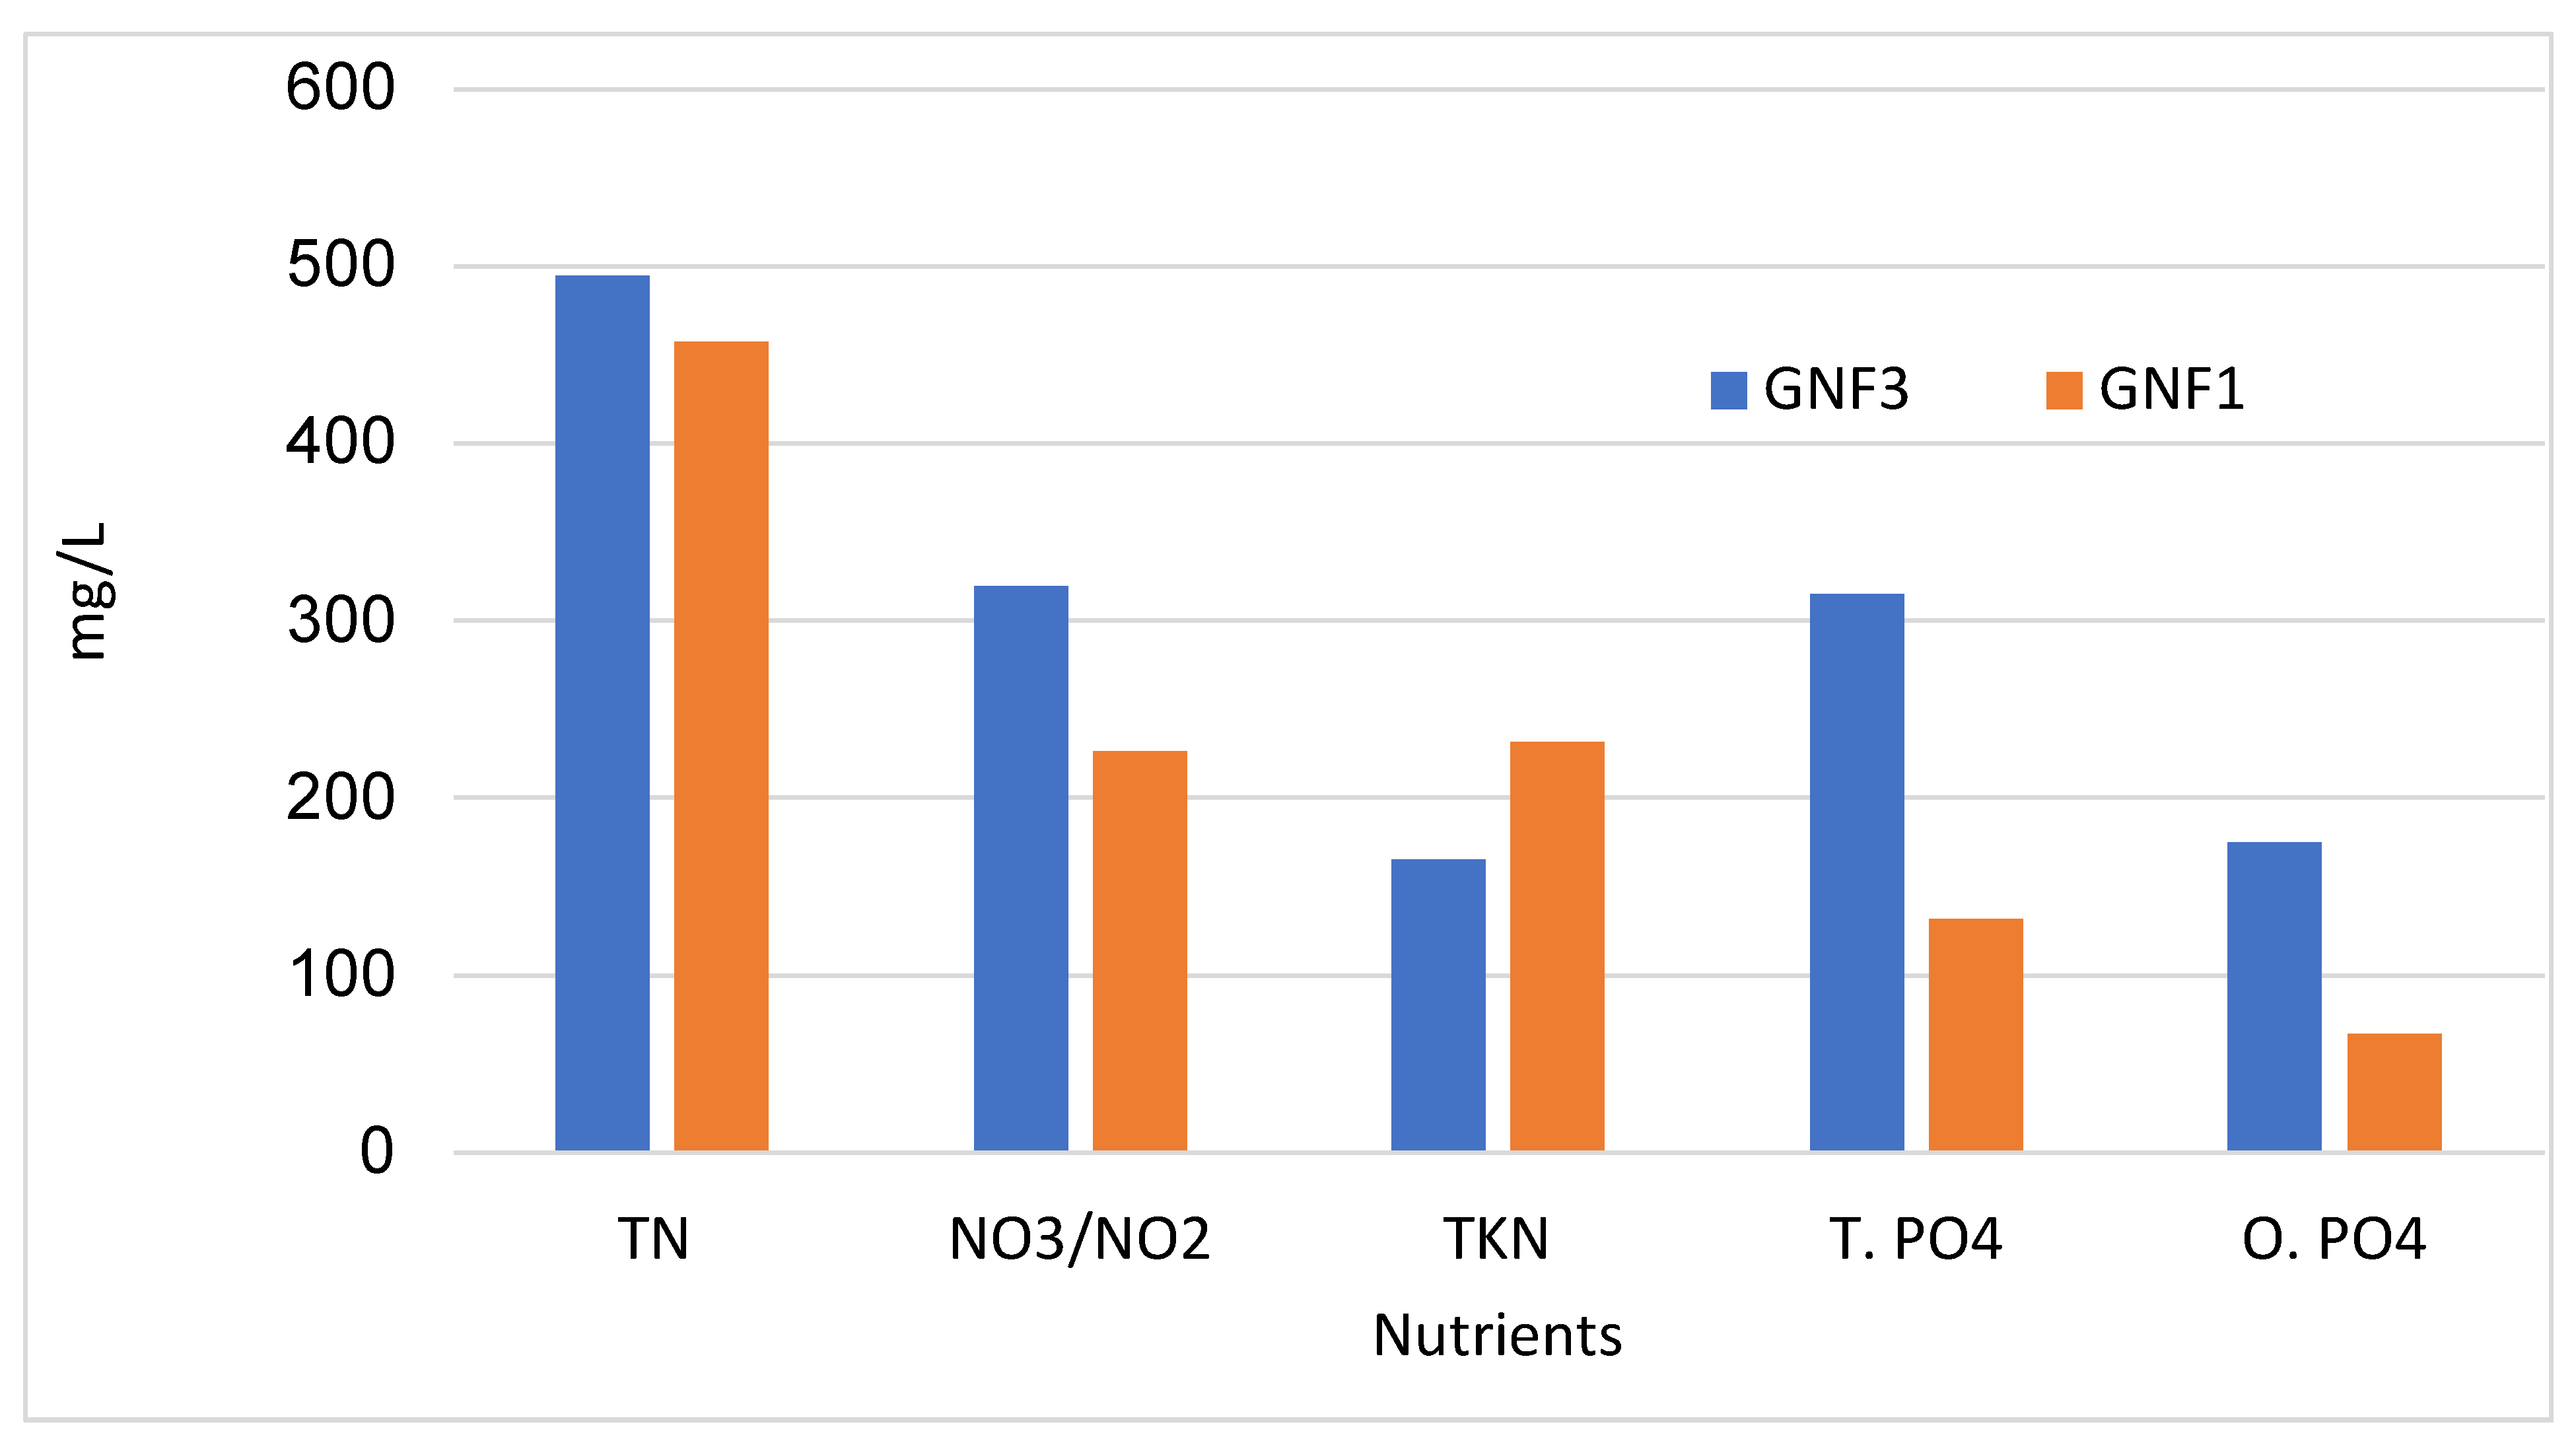
3.3. Evaluation of Nutrient Concentrations in all the GNFs

Nutrient levels in GNFs need to be assessed prior to disposal as the impact on lake system eutrophication is dependent on the nutrient (N, P) level of disposed water. Table 6 summarizes all the data obtained by the analysis of untreated GNF1, GNF2, and GNF3 along with those for chlorine and aluminum. Table 3 also includes well water (GH2) analysis and the Provincial Water Quality Objectives (PWQO) which shows the allowable limits for nitrogen and phosphorous nutrients in the Province of Ontario.
The well water in Table 6 is classified as Class 2 category water according to OMAFRA [40]. Table 7 shows the quality of Class 1 water. Based on Ontario regulations disposal limits for GNF nitrogen and phosphorous, Table 7 [41], as well as the PWQO limits in Table 6, make it clear that none of the GNFs are qualified for the safe disposal. RO treatment or land level nutrient management is essential at this stage to prevent eutrophication and to comply with regulations and water quality objectives PWQO and O. Reg. [41].
To establish a comparative scenario and to assess the addition of nutrients (fertilizer) by GHs in the source water and to prepare clear leach (water without any circulation), both WW and leached water were analyzed and compared. Table 8 shows the results for WW, clear leach, and the RO filtrate (permeate). The pH of WW was 7.75 which was reduced to 3.82 at GH2 when the clear leach was prepared to feed the system. Similarly, conductivity was changed from 565 µS/cm to 2038 µS/cm after addition of nutrient salts and fertilizer. Due to pretreatment, turbidity was reduced from 11.43 NTU of WW to 0.18 NTU in the clear leach. Hence, turbidity does not cause any concern. Individual metal and nutrient reductions by RO filtration were already interpreted in respective sections.
The GNFs specifications are different for different greenhouses based on their nutrient addition requirements and source water quality. To assess the disposal management, the results of the nutrient analysis given in Table 6 will further be discussed in the following sections.

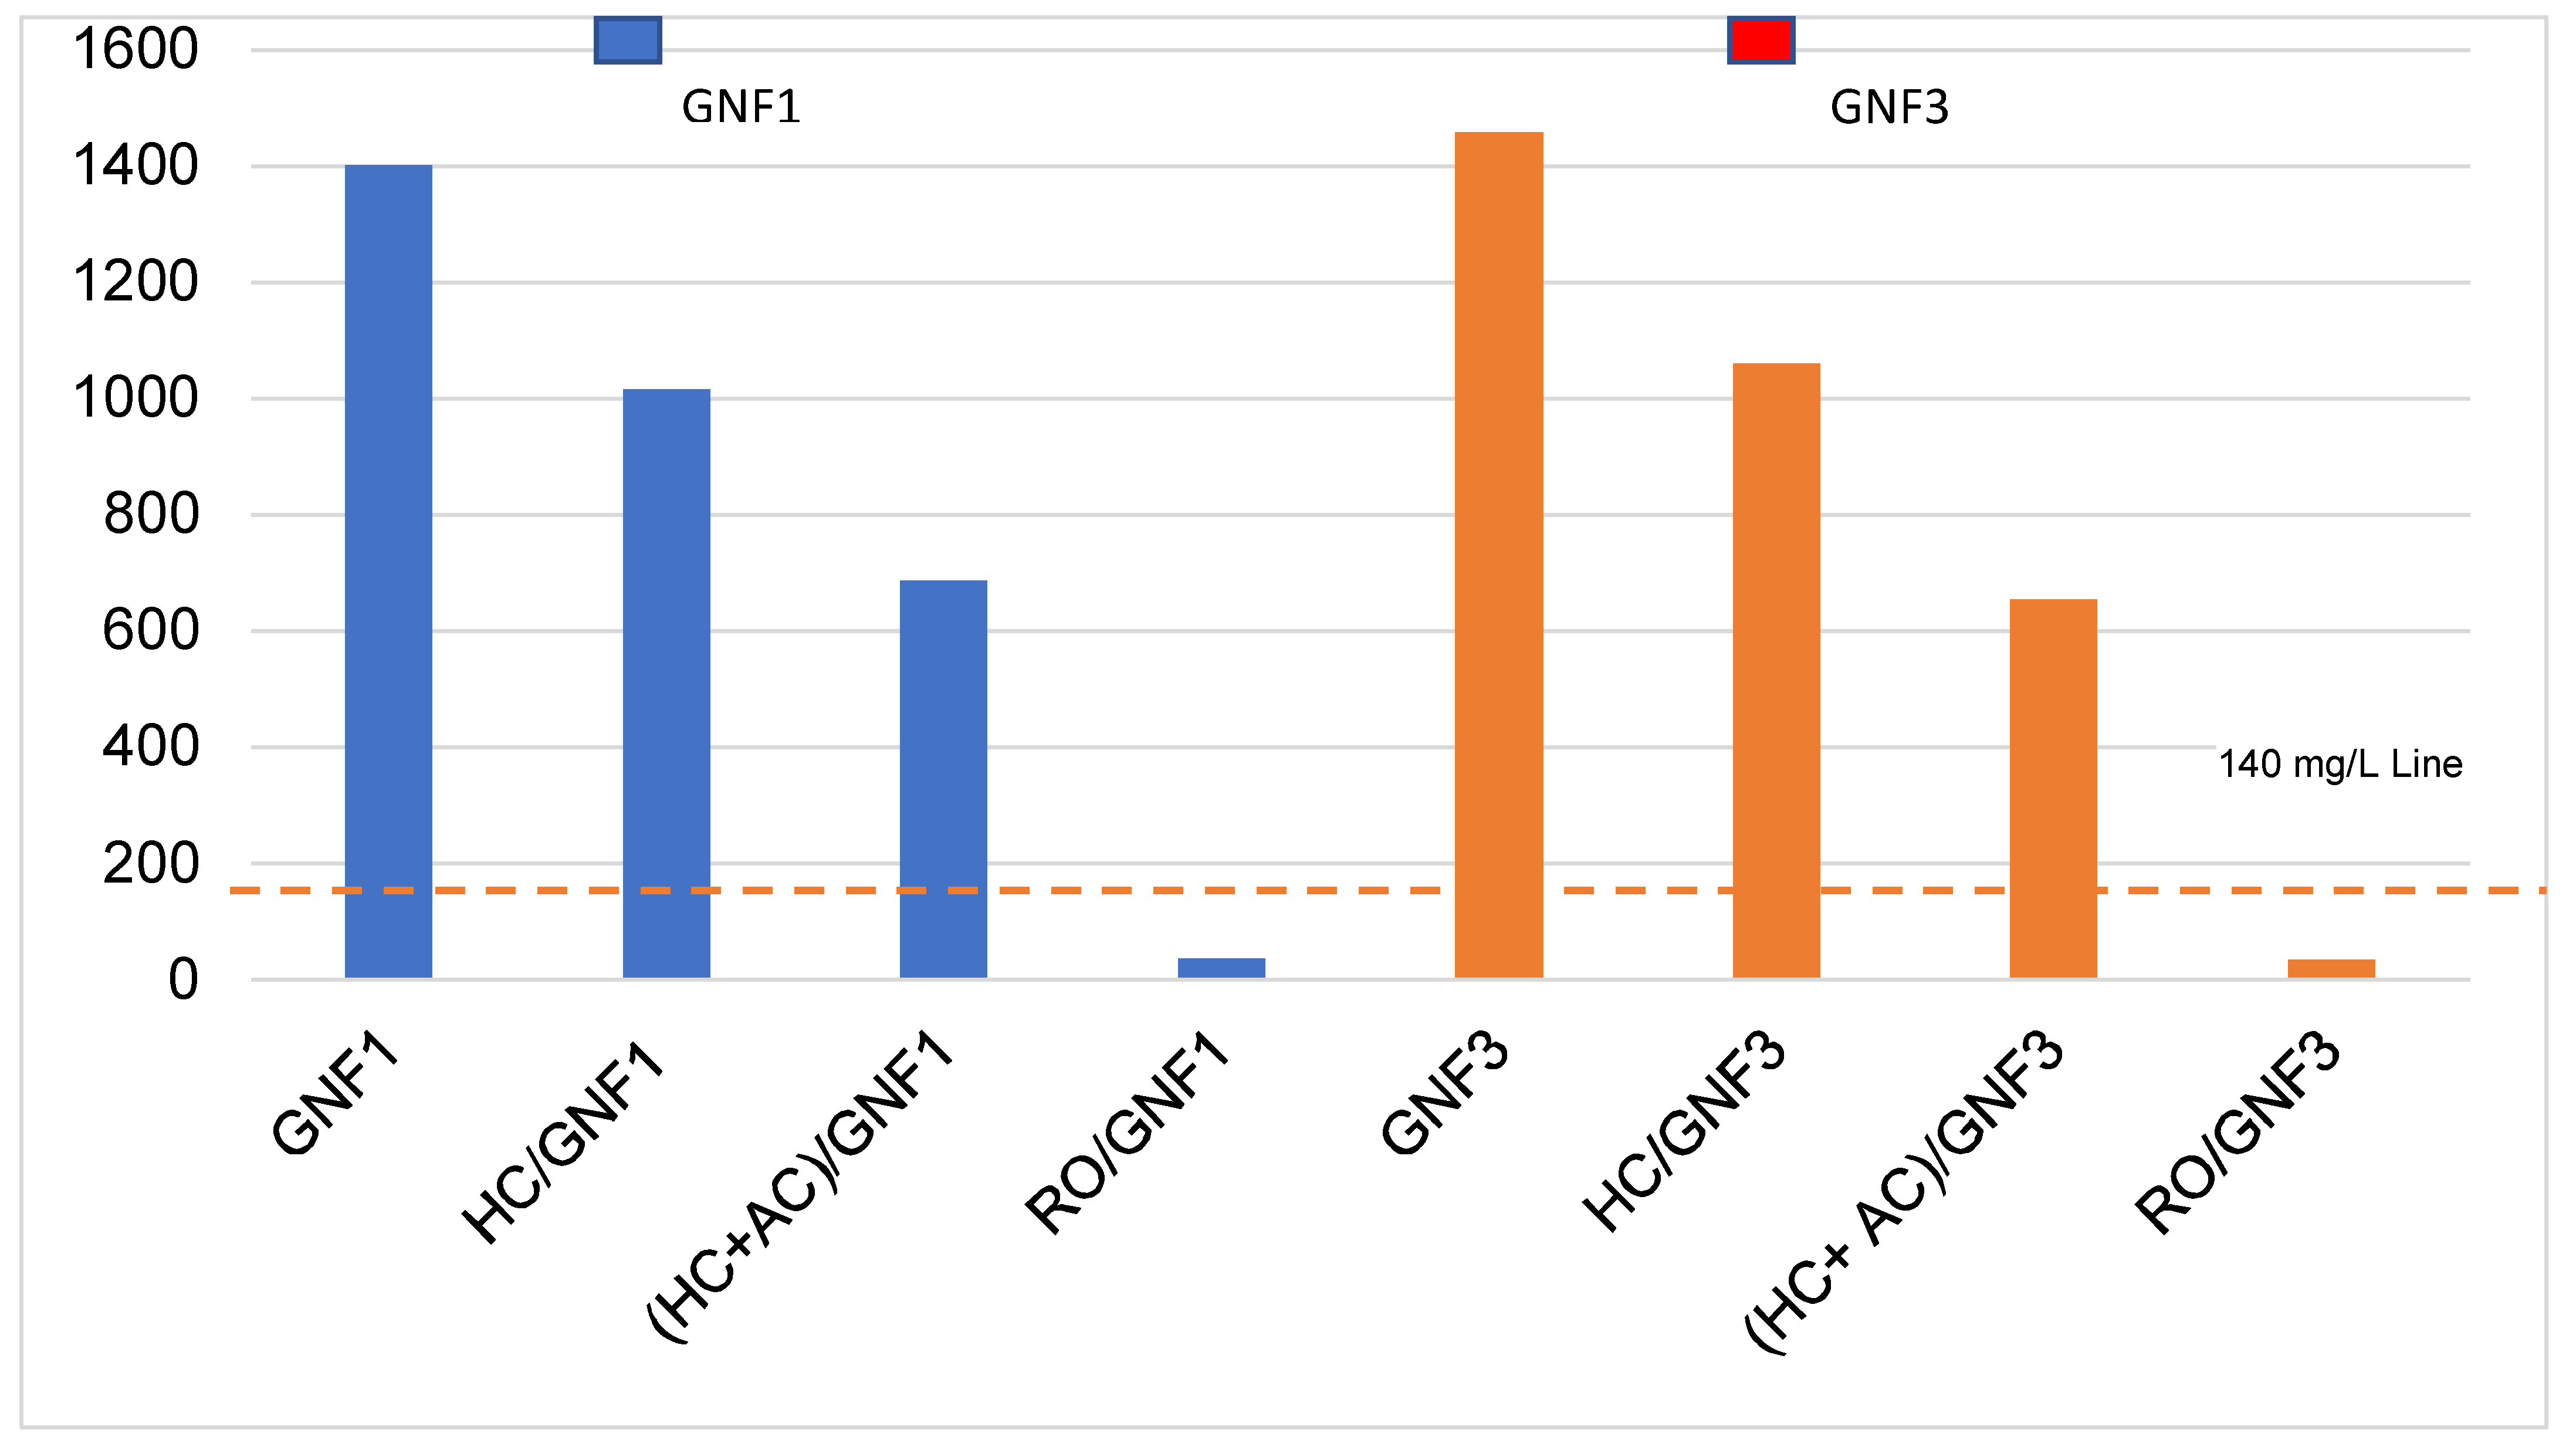
3.4. Treatments of GNFs by Produced Activated Carbon and Hydrochar

To assess the reduction of micronutrients (metals) and nutrient phosphate (PO43−) concentrations, GNF1 and GNF3 were selected and treated by AC and HC produced earlier. Phosphate or orthophosphate is the chemically and biologically reactive component and mostly treated by AC and HC. Two prepared ACs, AC1 and AC2, produced at 700–730 °C for heating durations of 1h (AC1) and 30 min (AC2), respectively, as well as three HCs produced at 260 °C (HC1), and at 225 °C (HC3) were used in this trial. Figure 3a shows the range of K and Ca reduction from GNF1 and GNF3, and Figure 3b shows impacts of excess K and Ca on plant growth. Table 9 shows the results of nutrient (PO4) removal.
The results of excess micronutrient concentrations reduction by HC and AC revealed that both treatments together may be able to allow circulation, by maintaining the recommended value (RV) given in Figure 3a. The data reveals that after two treatments, the higher concentrations of K and Ca are reduced to be close to the recommended value, allowing for recirculation of the treated GNF.
It may be mentioned here that the phosphate content in both GNFs increased after raw AC and HC treatments, which was attributed to possible residuals of some free phosphorus compounds on the surface of the adsorbents. It was free washed, dried, and reused to obtain the desired results. GNFs were also treated using RO. The results showed a substantial reduction (>98%) of all the nutrients, which could confirm that RO would be the best option if the treatment of GNF should comply with regulations of direct disposal. Considering RO, direct disposal restriction can be achieved easily with economic gain and environmental benefits.
A summary of the nutrients in GNF is shown in Figure 4, revealing higher concentrations in nitrogen components such as TN and NO3/NO2, and orthophosphate is the lowest. Otherwise, orthophosphate is very reactive and interacts with other components involved in environmental transformation and metabolism. For this reason, P is regulated to protect algae blooms in Lake Erie.
Earlier evaluations in the phosphate removal experiment showed that the best performing commercial AC was AC400 (M8) [24]. Table 9 shows the results of raw and treated GNF1 and GNF3 when using the best commercial AC400. Results revealed that removal of total nitrogen (azote) from GNF1 and GNF3 were 59% and 60%, respectively. Removal of total phosphate was 81% and 19% and that the amount of orthophosphate from GNF1 and GNF3 was 80% and 64% respectively. The range of nutrients removal by AC400 from the two GNFs was 19 to 81%, while the removal by RO treatment was ranged from 97% to 99% for all nutrients. Therefore, RO filtration is the best treatment to remove nutrients from GNF. However, if RO is used, additional fertilizer will be required to adjust nutrient concentrations in the permeate to prepare clear GNF along with reject management.
Removals of nutrients from two GNFs by different treatments (AC and AC+HC) are comparatively shown in Figure 5a,b. Figure 5a is the removal of nutrients from GNF1 and 5b is the removal from GNF3. Results reveal that TN, NO3/NO2, TP, and OP (orthophosphate) are lower in GNF1 (Figure 5a) compared to GNF3 (Figure 5b), but TKN is higher in GNF1 and lower in GNF3. This behavior is expected from clear GNF1 and leached GNF3, respectively.
The GNF disposal options were assessed based on different treatments: HC, AC+HC, and RO. Figure 6 shows a summary of removal by each treatment along with a GNF disposal limit. The dotted red line in Figure 6 shows P+N+K total concentration limit of 140 mg/L for yearly disposal of only 1400 m3/ha. If combined nutrients concentration exceeds this value of 140 mg/L, only a disposal of 700 m3/ha is allowed, which is a great challenge for GHs as they are producing above the limit of 1400 m3/ha. None of the treatments except RO can provide nutrient concentration way below those limits as shown in Figure 6. However, if GNF is filtered by RO, it would be wise not to dispose the pure permeate but reuse as GNF after adding fertilizer. (For clarity, it requires to explain the origin of P+N+K. The P is calculated as TP*2.29, N is calculated as (NH3-N + NH4-N + NO3/NO2 + 0.3)* organic nitrogen (i.e., TKN–NH3 + NH4), and K is calculated as TK*1.2.). Please note that disposal PNK is not the same as NPK used to standardize fertilizer.
RO filtration is often considered as an expensive process due to the high-pressure requirement to overcome the osmotic pressure, system loss and liquid head. In contrast to the high salinity of seawater, however, the salinity of GNFs hardly surpasses 2000 mg/L, corresponding to an osmotic pressure of about 1.4 bar (20–22 psi). Therefore, a maximum of 6–8 bar was applied in this research where a bench scale flat sheet system was used. It should be noted that the bench scale unit with flat sheet membrane suffers higher pressure losses compared to the commercial plant with membrane modules. Using a hollow fiber or spiral wound module in place of flat sheet membrane would lower the operating pressure in the actual plant application, making it more cost effective. Moreover, a simple locally available low pressure (6–8 bar) pump can be integrated with an energy recovery device (ERD), which further reduces the energy consumption. Guidelines for the online management of membrane operations for steady performance are also available [24].
Figure 7 illustrates a RO system design for GNF recycle management. An energy model available in the literature would be helpful to calculate energy consumption and to select a required pump size [42]. The presence of any pathogens will be eliminated by using the reject to the hydrothermal process at 220 °C, since pathogens are killed at 95 °C [43,44].
To resolve land disposal issues without treatment, different land-level BMPs such as bio-filters, inorganic filters, constructed wetland, vegetated filter strips, bioretention swales, and bioretention basins were considered to reduce or effectively control the nutrients concentrations in the runoff and comply with discharge limits during crop production using GNF as fertilizer. Simply using a single BMP does not provide an efficiency that meets the discharge standards, suggesting the need for more supportive treatment (or use of multiple BMPs) [40]. To estimate the extent of treatment required to comply with discharge standards while using BMP/s, the most informative SWAT (Soil & Water Assessment tool) model can provide necessary help and GHs may consider using it [45]. About 100% reduction of phosphorous load by SWAT evaluation and applying multiple BMPs was achieved [46]. The successful use of land-level BMP approach seems to be an alternative to RO treatment for disposal management if run-off quality parameters are not within the regulated limits.

4. Application of Findings

GNF waters were analyzed using different techniques to assess target contaminants. A notion prevails that pathogenic impacts are the major cause of impaired plant growth. Microbial tests for all the GMFs revealed no pathogens in any of the GNFs, which may attribute to the fact that plant pathogens are not waster based. Rather they are soil based whether fungal and bacterial, as well as vector based viral spreading, unlike human pathogens.
The chemical analysis of GNFs revealed higher concentrations of some micronutrients metal ions along with higher pH and conductivities. Even in a freshy prepared GNF from one of the GHs, those constituents were higher than the limit inducing phytotoxicity in the initial GNF before any circulation. The reason identified is the abnormal source water specification, suggesting the requirement of alternative source water or pre-treatment prior to addition of fertilizer. Analyses of leached GNF revealed imbalanced metal concentrations for potassium (15.75 mmol/L), calcium (16.45 mmol/L) and magnesium (7.43 mmol/L), which were above the allowable limits for tomato plant root zone of 8.0 mmol/L for Ca ad K, and that for Mg of 4.5 mmol/L, respectively.
The safe recommended pH limit for tomato plant root zone is 5.5 and that for conductivity is 3.7 mS/cm, respectively. The measured pH was 4.34 in GNF3, which is acidic and can impact root zone conditions. All the analyses revealed there exist phytotoxicity from constituents in the GNFs that need to be readjusted prior to any recirculation. The impacts of those phytotoxic water conditions are generally blamed on the possible presence of pathogens. Some examples of excess metal ion impacts are presented earlier in the manuscript.
To adjust micronutrient concentrations, different treatments including conventional coagulation-filtration, HC and AC sorption, and RO filtration were applied. None of the treatment of coagulation filtration, and sorption could solve the issue when used stand alone. However, when performances of HC and AC are combined together, it could reduce the higher concentrations of K, Ca, and Mg to the safe limit as demonstrated in figures, which is encouraging.
The application of RO filtration substantially reduced almost all the nutrients and micronutrients in the range of 98–99% producing very clear water. Complete reduction is not demanded for recirculation, as it consumes additional fertilizer to adjust the NPK concentrations to prepare a fresh GNF. However, this is used as an option if a GH requires such treatment they may use RO filtration. In addition, when a GH is required to reduce some of their GNF water by land disposal to comply with regulations, RO filtration provides substantial reduction of lake eutrophication nutrients (N, P). It must be stressed that it is not economical to dispose RO filtrate. Other constituents of GNF such as nitrogen, phosphorous, chloride, and aluminum were within the limits of root zone for tomato plant. It was suggested that analysis and desired fertilizer adjustment should be conducted continuously to ensure steady plant growth in GHs.
The results were encouraging for the use of self-produced treatment agents such as HC and AC from waste biomass of tomato plant into treatment GNF and allow recirculation. The research reveals that this is a comprehensive solution option as both the solid biomass and the liquid GNF can be recycled in an environmentally sustainable manner.

Novelty

“The Resource Recovery and Reuse (RRR)” is a global program approach for the safe reuse of agro-industrial wastes. The approach presented was designed to recover resources from two wastes representative from greenhouses (GHs) in Southern Ontario. Nutrient discharges in the project area (Southern Ontario) are strictly regulated to control Lake Erie algae bloom, a binational concern with the highest priority. In this respect, greenhouse (GH) producers in the study area have dual problems of waste biomass and GH nutrient feed water (GNF) management; as land disposals are regulated and are not allowed without proper treatment. GNF is a liquid fertilizer containing plant-required nutrients that need to be recovered. The disposal of waste biomass spreads plant pathogens, while burning causes greenhouse gas emissions. To address both the issues, complete recycle and reuse of (1) tomato plant biomass (TPB) and (2) GNF were the main focus of the research. The TPB was converted into hydrocar (HC) and activated carbon (AC), which were used as treatment agents in the treatment and recycle of GNF without discharge. This approach supported Ontario’s initiatives on nutrient management in the area. Thus, the value of this research for GH business development and environmental sustainability is fairly significant.

5. Conclusions

Higher concentrations of potassium, calcium, and magnesium micronutrients were observed, along with high pH in the leached GNF, which induced phytotoxicity to plants. To resolve the issue obtaining recyclability of GNF following the limits for circulation, different treatments, including conventional coagulation–filtration, hydrochar, and activated carbon sorption, and RO filtration were applied. The hydrochar and activated carbon reduced metal concentrations as required, providing recyclability to the GNF. RO filtration provided substantial reduction of eutrophication nutrients (N and P) to comply with direct disposal limits but advised to reuse the pure permeate water in preparation of clear GNF by adding new fertilizer. It is suggested that analysis and desired fertilizers adjustment should be conducted continuously to ensure steady plant growth in GHs. No pathogens were detected in any of the evaluated GNF waters.

Author Contributions

Conceptualization, A.-T.J.-U. and R.G.Z.; methodology, A.-T.J.-U., T.M. and F.A.-D.; validation, A.-T.J.-U., T.M. and R.G.Z.; formal analysis, A.-T.J.-U., T.M. and R.G.Z.; investigation, A.-T.J.-U. and F.A.-D.; resources, R.G.Z.; data curation, A.-T.J.-U.; writing—original draft preparation, A.-T.J.-U.; writing—review and editing, T.M., F.A.-D. and R.G.Z.; visualization, A.-T.J.-U., F.A.-D. and R.G.Z.; supervision, R.G.Z.; project administration, R.G.Z.; funding acquisition, R.G.Z. All authors have read and agreed to the published version of the manuscript.

Funding

No external funding was received. The research was funded by a University of Guelph general purpose research account. The Ontario Ministry of Agriculture, Food and Rural Affairs supported the research by providing a representative to arrange collection of the GNF and biomass samples from greenhouses.

Institutional Review Board Statement

Not applicable to the research completed.

Informed Consent Statement

Not applicable to the research completed.

Data Availability Statement

Data will be available in the published Ph.D. dissertation through the University of Guelph Library.

Acknowledgments

Additional support was provided by Joanne Rykes, a lab technician from the School of Engineering who helped in the metal analysis and culture tests, and Sindhu, who assisted with the microscopic analysis.

Conflicts of Interest

The authors declare no conflict of interest.

Abbreviations and Terms

ACActivated carbon
CFCartridge filter
Clear leachFreshly prepared GNF
GHGreenhouse
GH11st GH
GH22nd GH
GNFGreenhouse nutrient feed
GNF1Clear leach from GH1
GNF2Leached dirty GNF from GH2
GNF3Leached dirty GNF from GH2
HCHydrochar
HTCHydrothermal carbonization
Leached GNFCirculated nutrients unbalanced dirty GNF
LMHLiters per square meter hour
MicronutrientsMetallic nutrients (salts)
OMAFRAOntario Ministry of Agriculture, Food and Rural Affairs
PACLPoly aluminum chloride
PWQAProvincial Water Quality Objectives
ROReverse osmosis
TGNFTreated GNF
TPBTomato plant biomass
WWWell water

References

  1. Bunch, K. Binational Plans Call for 40 Percent Reduction to Algal-Fueling Nutrients. 2018. Available online: https://www.ijc.org/en/binational-plans-call-40-percent-reduction-algal-fueling-nutrients (accessed on 15 May 2022).
  2. Grimm, A. Irrigation water quality challenges. GREENHOUSE CANADA. 2008. Available online: https://www.greenhousecanada.com/irrigation-water-quality-challenges-887 (accessed on 15 May 2022).
  3. WHO (World Health Organization). Guidelines for the Safe Use of Wastewater, Excreta and Greywater. V2: Wastewater Use in Agriculture. Geneva: World Health Organization (WHO); Food and Agriculture Organization of the United Nations (FAO): Rome, Italy; United Nations Environment Program (UNEP): Nairobi, Kenya, 2006; Available online: https://www.who.int/publications/i/item/9241546832 (accessed on 15 May 2022).
  4. Jiménez, B.; Mara, D.; Carr, R.; Brissaud, F. Wastewater treatment for pathogen removal and nutrient conservation: Suitable systems for use in developing countries. In Wastewater Irrigation and Health. Assessing and Mitigating Risk in Low-Income Countries; Drechsel, P., Scott, C.A., Raschid-Sally, L., Redwood, M., Bahri, A., Eds.; IWMI: Colombo, Sri Lanka, 2010. [Google Scholar]
  5. Xu, X.; Du, F.; Wang, J.; Sha, Q.; Chen, G.; Tian, Z.; Zhu, S.; Ge, S.; Jiang, Y. Effects of Potassium Levels on Plant Growth, Accumulation and Distribution of Carbon, and Nitrate Metabolism in Apple Dwarf Rootstock Seedlings. Front. Plant Sci. 2020, 11, 904. [Google Scholar] [CrossRef] [PubMed]
  6. van Os, E.; Blok Voogt, W.; Waked, L. Water Quality and Salinity Aspects in Hydroponic Cultivation; WUR Glastuinbouw: Wageningen, The Netherlands, 2016; Available online: https://edepot.wur.nl/403810 (accessed on 15 May 2022).
  7. Elliott, M.; Pernezny, K.; Palmateer, A.; Havranek, N. Guidelines to Identification and Management of Plant Disease Problems: Part I. and 2 Eliminating Insect Damage and Abiotic Disorders; EDIS: Gainesville, FL, USA, 2008; p. 248. Available online: https://edis.ifas.ufl.edu/pdf%5Carchived%5CMG%5CMG441%5CMG441-5806128.pdf (accessed on 16 May 2022).
  8. De Kreij, C.; Voogt, W.; Baas, R. Nutrient Solutions and Water Quality for Soilless Cultures; Applied Plant Research, Division Glasshouse: Naaldwijk, Holland, 2003. [Google Scholar]
  9. Richard, S.; Zheng, Y.; Dixon, M. Greenhouse Canada—To Recycle or Not to Recycle? 2008. Available online: https://www.greenhousecanada.com/to-recycle-or-not-to-recycle-926 (accessed on 16 May 2022).
  10. Makoto, K.; Kim, Y.; Koike, T. Buried charcoal layer and ectomycorrhizae cooperatively promote the growth of Larix gmelinii seedlings. Plant Soil 2010, 327, 143–152. [Google Scholar] [CrossRef]
  11. Sanogo, S.; Moorman, G. Transmission and Control of Pythium aphanidermatum in an Ebb-and-Flow Subirrigation System. Plant Dis. 1993, 77, 287. [Google Scholar] [CrossRef]
  12. Scarlett, K.; Tesoriero, L.; Daniel, R.; Guest, D. Detection and Quantification of Fusarium Oxysporum f. Sp. Cucumerinum in Environmental Samples using a Specific Quantitative PCR Assay. Eur. J. Plant Pathol. 2013, 137, 315–324. [Google Scholar] [CrossRef]
  13. Salm, H.; Gelder, K. Real-time PCR for detection and quantification of Erwinia amylovora, the causal agent of fireblight. Plant Pathol. 2004, 53, 602–610. [Google Scholar] [CrossRef]
  14. Weller, S.A.; Elphinstone, J.G.; Smith, N.C.; Boonham, N.; Stead, D.E. Detection of Ralstonia solanacearum Strains with a Quantitative, Multiplex, Real-Time, Fluorogenic PCR (TaqMan) Assay. Appl. Environ. Microbiol. 2000, 66, 2853–2858. [Google Scholar] [CrossRef] [Green Version]
  15. Scholthof, K.-B.G.; Adkins, S.; Czosnek, H.; Palukaitis, P.; Jacquot, E.; Hohn, T.; Hohn, B.; Saunders, K.; Candresse, T.; Ahlquist, P.; et al. Top 10 plant viruses in molecular plant pathology. Mol. Plant Pathol. 2011, 12, 938–954. [Google Scholar] [CrossRef]
  16. Hamad, S.; Al-ani, R.; Adhab, M.; Diwan, S. Tomato Yellow Leaf Curl Virus, Identification, Virus Vector Relationship, Strains Characterization and a Suggestion for Its Control with Plant Extracts in Iraq. Afr. J. Agric. Res. 2011, 6, 5149–5155. [Google Scholar] [CrossRef]
  17. Gu, Q.; Sheng, L.; Zhang, T.; Lu, Y.; Zhang, Z.; Zheng, K.; Hu, H.; Zhou, H. Early detection of tomato spotted wilt virus infection in tobacco using the hyperspectral imaging technique and machine learning algorithms. Comput. Electron. Agric. 2019, 167, 105066. [Google Scholar] [CrossRef]
  18. Kulshrestha, S.; Sharma, A.; Seth, C. Molecular biology of Tomato spotted wilt virus: An update. J. Appl. Hortic. 2013, 15, 71–80. [Google Scholar] [CrossRef]
  19. Roberts, C.A.; Dietzgen, R.G.; Heelan, L.A.; Maclean, D.J. Real-time RT-PCR fluorescent detection of tomato spotted wilt virus. J. Virol. Methods 2000, 88, 1–8. [Google Scholar] [CrossRef]
  20. OMAFRA. 2020. Available online: http://www.omafra.gov.on.ca/english/nm/regs/gnfpro/gnfreg.htm (accessed on 12 April 2020).
  21. Graham, T. New Perspectives on the Maintenance of Aqueous Ozone Residuals in Greenhouse and Nursery Irrigation Solutions. Ph.D. Thesis, University of Guelph, Guelph, ON, Canada, 2012. [Google Scholar]
  22. Ristvey, A.G.; Belayneh, B.E.; Lea-Cox, J.D. A Comparison of Irrigation-Water Containment Methods and Management Strategies Between Two Ornamental Production Systems to Minimize Water Security Threats. Water 2019, 11, 2558. [Google Scholar] [CrossRef] [Green Version]
  23. Jamal-Uddin, A.; Zytner, P.; Zytner, R. Hybrid treatment system to remove micromolecular SMPs from fruit wastewater treated with an MBR. Can. J. Civ. Eng. 2022, 49, 548–557. [Google Scholar] [CrossRef]
  24. Jamal-Uddin, A. Treatments and Recycle of Food Processor Wastewater Effluent. Master’s Theses, University of Guelph, Guelph, ON, Canada, 2019. [Google Scholar]
  25. Metcalf & Eddy. Wastewater Engineering Treatment and Resource Recovery, 5th ed.; Mc Graw Hill education: New York, NY, USA, 2014. [Google Scholar]
  26. USEPA. Guidelines for Water Reuse; Environmental Protection Agency (USEPA): Washington, DC, USA, 2012. Available online: https://www.epa.gov/sites/default/files/2019-08/documents/2012-guidelines-water-reuse.pdf (accessed on 20 April 2020).
  27. Stevik, T.K.; Aa, K.; Ausland, G.; Hanssen, J.F. Retention and removal of pathogenic bacteria in wastewater percolating through porous media: A review. Water Res. 2004, 38, 1355–1367. [Google Scholar] [CrossRef] [PubMed]
  28. Keraita, B.; Drechsel, P.; Klutse, A.; Cofie, O. On-Farm Treatment Options for Wastewater, Greywater and Fecal Sludge with Special Reference to West Africa; IWMI: Colombo, Sri Lanka, 2014; Volume 1, p. 32. Available online: https://hdl.handle.net/10568/35209 (accessed on 20 April 2020).
  29. Peters, T. Review: Membrane technology for water treatment. Chem. Eng. Technol. 2010, 33, 1233–1240. [Google Scholar] [CrossRef]
  30. Huyben, D.C. Evaluation of Membrane Filtration and UV Irradiation for The Control of Flavobacterium Psychrophilum in Recirculation Aquaculture Systems. Master’s Theses, University of Guelph, Guelph, ON, Canada, 2012. [Google Scholar]
  31. Suárez, A.; Fidalgo, T.; Riera, F.A. Recovery of dairy industry wastewaters by reverse osmosis. Production of boiler water. Sep. Purif. Technol. 2014, 133, 204–211. [Google Scholar] [CrossRef]
  32. De Jager, D.; Sheldon, M.S.; Edwards, W. Colour removal from textile wastewater using a pilot-scale dual-stage MBR and subsequent RO system. Sep. Purif. Technol. 2014, 135, 135–144. [Google Scholar] [CrossRef]
  33. Tomczak, W.; Gryta, M. The Application of Cellulose Acetate Membranes for Separation of Fermentation Broths by the Reverse Osmosis: A Feasibility Study. Int. J. Mol. Sci. 2022, 23, 11738. [Google Scholar] [CrossRef]
  34. Gunathilake, K.D.P.P.; Yu, L.J.; Rupasinghe, H.P.V. Reverse Osmosis as A Potential Technique to Improve Antioxidant Properties of Fruit Juices Used for Functional Beverages. Food Chem. 2014, 148, 335–341. [Google Scholar] [CrossRef]
  35. Öner, Ş.G.; Kabay, N.; Güler, E.; Kitiş, M.; Yüksel, M. A comparative study for the removal of boron and silica from geothermal water by crossflow flat sheet reverse osmosis method. Desalination 2011, 283, 10–15. [Google Scholar] [CrossRef]
  36. Sahar, E.; David, I.; Gelman, Y.; Chikurel, H.; Aharoni, A.; Messalem, R.; Brenner, A. The use of RO to remove emerging micropollutants following CAS/UF or MBR treatment of municipal wastewater. Desalination 2011, 273, 142–147. [Google Scholar] [CrossRef]
  37. Guo, X.; Zhang, Z.; Fang, L.; Su, L. Study on ultrafiltration for surface water by a polyvinylchloride hollow fiber membrane. Desalination 2009, 238, 183–191. [Google Scholar] [CrossRef]
  38. Liu, M.; Lau, A.K.; Lo, K. Ultrafiltration tests for the reutilization of greenhouse wastewater. J. Environ. Sci. Health Part B 1999, 34, 1101–1110. [Google Scholar] [CrossRef]
  39. Pernezny, K.; Elliott, M.; Palmateer, A.; Havranek, N. Guidelines for Identification and Management of Plant Disease Problems: Part II. Diagnosing Plant Diseases Caused by Fungi, Bacteria and Viruses; Florida EDIS: Charleston, WV, USA, 2008; p. 249. Available online: https://edis.ifas.ufl.edu/pdf%5Carchived%5CMG%5CMG442%5CMG442-15333041.pdf (accessed on 16 May 2022).
  40. OMAFRA. Self-Assessment and Best Management Practices for Water and Fertilizer Use in Greenhouse Vegetable Production. 2019. Available online: http://www.omafra.gov.on.ca/english/environment/bmp/greenhouse.pdf (accessed on 12 April 2020).
  41. O. Reg. 300/14. Greenhouse Nutrient Feedwater Regulation, under Nutrient Management Act. 2014. Available online: http://www.omafra.gov.on.ca/english/nm/regs/gnfpro/gnfreg.htm (accessed on 21 February 2020).
  42. Jamal-Uuddin, A.; Hassan, A.M.; Al-Reweli, A.; Al-Rubaian, A.; Hauge, L. An Efficient Energy Recovery Prospect In SWRO Process. In Proceedings of the 6th Saudi Engineering Conference, Dhahran, Saudi Arabia, 14–17 December 2002. [Google Scholar]
  43. Schnitzler, W.H. Pest and disease management of soilless culture. Acta Hortic. 2004, 648, 191–203. [Google Scholar] [CrossRef]
  44. McPherson, G.M.; Harriman, M.R.; Pattisson, D. The potential for spread of root diseases in recirculating hydroponic systems and their control with disinfection. Meded. Fac. Landbouwkd. Toegep. Biol. Wet. Univ. Gent 1995, 60, 371–379. Available online: https://agris.fao.org/agris-search/search.do?recordID=BE9600917 (accessed on 12 March 2020).
  45. Neitsch, S.L.; Arnold, J.G.; Kiniry, J.R.; Williams, J.R. Soil and Water Assessment Tool, Theoretical Documentation Version 2009. Texas Water Resources Institute Technical Report No. 406. 2011. Available online: https://swat.tamu.edu/media/99192/swat2009-theory.pdf (accessed on 12 January 2020).
  46. Dagnew, A.; Scavia, D.; Wang, Y.; Muenich, R.; Kalcic, M. Modeling phosphorus reduction strategies from the international St. Clair-Detroit River system watershed. J. Great Lakes Res. 2019, 45, 742–751. [Google Scholar] [CrossRef]
Figure 1. Cultured plates from filtration (0.2 µm) and media culture experiments (48 h).
Water 14 03573 g001
Figure 2. (a) Digital microscopic imaging (40×) of filters after GNF filtration. (b) Microscopic images of the three pathogens.
Water 14 03573 g002aWater 14 03573 g002b
Figure 3. (a) Higher concentrations of Ca and K reduced to a safe recyclable level by HC+AC treatments. (b) Excess K and Ca impacts on plant growth.
Water 14 03573 g003
Figure 4. Summary of the nutrients in GNFs.
Water 14 03573 g004
Figure 5. (a) Nutrients in GNF1 and removal by AC and AC+HC. (b) Nutrients in GNF3 and removal by AC and AC+HC.
Water 14 03573 g005
Figure 6. GNF disposal assessment after different treatments.
Water 14 03573 g006
Figure 7. Simplified schematic diagram of an energy economic RO design.
Water 14 03573 g007
Table 1. Size range comparison of bacteria, virus, fungi, and K+ with RO pores.
BacteriaVirusFungiMicron FilterK Ion (K+)RO Pore Size
200–1000 nm20–400 nm2000–10,000 nm200 nm0.15 nm0.1–1.5 nm
2–10 µ0.20 µ152 pm1–15 Å
174–871 Da17–348 Da1741–8707 Da174 Da0.13 Da0.09–1.3 Da
Table 2. (a) Results of GNF1 and treated GNF1 water from GH1. (b) Metals analysis results in GNF1 and treated GNF1.
(a)
GNF1Alum coagulationPACL treatmentRO filtration
pH7.056.636.556.8
Conductivity (µS/cm)12621300144024
TDS (mg/L)77078879813
Turbidity (NTU)2.20.240.07Nil
(b)
Samples TypeSodium-mg/L (mmol/L)Potassium–mg/L (mmol/L)Magnesium–mg/L (mmol/L)Calcium–mg/L (mmol/L)
Raw GNF1 water61 (2.65)670 (17.18)81 (3.33)291 (14.55)
CF (11 µ)25 (1.09444 (11.38)45 (1.85)107 (5.35)
RO filtrate1 (0.04)20 (0.5)<1 (0.00)1 (0.05)
Alum treatment
35 mg/L dosage21 (0.91)458 (11.74)47 (1.93)109 (5.45)
40 mg/L dosage21 (0.91)456 (11.69)46 (1.89)106 (5.30)
50 mg/L dosage22 (0.96)775 (19.87)32 (1.32)57 (2.85)
PACL treatments
150 mg/L dosage22 (0.96)475 (12.18)48 (1.98)108 (5.40)
100 mg/L dose23 (1.00)644 (16.51)47 (1.93)121 (6.05)
CF, cartridge filtration.
Table 3. Tomato plant suggested limits for common nutrients, including conversion factors.
ComponentsTarget for Closed SystemTarget for Open SystemRoot Zone Target ValuesUnit Conversion Factors
mmol/L–mg/L
EC mS/cm1.602.603.70
pH 5.5
K+6.509.508.00139.1
Ca++2.755.40<8.00120.1
Na+ <8.00123.0
Mg+1.002.404.50124.3
NO310.7516.0023.00162.0
Cl <12.00135.5
HCO3 <1.000161.0
H2PO41.251.501.00191.0
PO4−3 126.3
Table 4. (a) Analysis of leached and treated GNF2 from GH2. (b) Metals analysis of leached and treated GNF2 from GH2.
(a)
Leached GNF2Alum Coagulation
(57 mg/L Dosage)
PACL Treatment
(100 mg/L Dosage)
RO Filtrate **
Adjusted pH Adjusted pH Adjusted pH
pH *3.776.344.515.903.823.793.495.65
Conductivity (µS/cm)24302038236019132450201243971.90
TDS (mg/L)13341260128110481324115122535.70
Turbidity (NTU)1.402.280.170.420.100.150.100.12
(b)
Samples TypeSodium mg/L (mmol/L)Potassium mg/L (mmol/L)Magnesium mg/L (mmol/L)Calcium mg/L (mmol/L)
Leached GNF285 (3.70)599 (15.36)72 (2.96)255 (12.75)
RO filtrate3 (0.13)25 (0.64)4 (0.16)6 (0.30)
Notes: * pH of leached GNF2 was low, so coagulation at adjusted pH was conducted for the optimum results. PACL is not pH-dependent. ** RO operating conditions: pressure 125 psi, flow 0.6 gpm.
Table 5. (a) Baseline analytical results of leached and pretreated GNF3 from GH2. (b) Metal analysis results of GNF3.
(a)
GNF3Alum Dose (59 mg/L)PACL Dose (200 µL/L)RO Filtrate
pH4.346.003.683.88
Conductivity (µS/cm249026702770170
TDS (mg/L)14671495154489
Turbidity (NTU)0.280.120.420.002
(b)
Samples TypeSodium mg/L (mmol/L)Potassium mg/L (mmol/L)Magnesium mg/L (mmol/L)Calcium mg/L (mmol/L)
GNF370 (3.04)614 (15.74)182 (7.49)329 (16.45)
RO filtration2 (0.09)17 (0.44)3 (0.12)6 (0.30)
Alum treatments
52 mg/L dosage101 (4.39)623 (15.97)185 (7.61)336 (16.80)
60 mg/L dosage102 (4.43)633 (16.23)183 (7.53)341 (17.05)
PACL treatments
200 mg/L dosage71 (3.09)619 (15.87)187 (7.70)338 16.90)
150 mg/L dosage73 (3.17)627 (16.08)189 (7.78)342 (17.10)
Notes: Leached water pH was adjusted to 6.0 prior to alum coagulation.
Table 6. Nutrient analysis results for all the GNFs and well water from GH1.
Nutrients–mg/LGNF1GNF2GNF3WWPWQO
NO3, & NO2-N (mmol/L)226.00 (3.65)184.00 (2.97)319.50 (5.15)0.50 (0.01)20 µg/L
(Unionized
NH3)
TKN231.50175.00165.00151.00
TN (mmol/L)457.50 (32.68)358.50(25.61)494.50(35.32)151.50(10.61)
Phosphate total PO4−3 (mmol/L)132.00 (4.17)154.2 (4.87)315.00 (9.95)41.9 (1.32)20 µg/L
Phosphate reactive (mmol/L)67.00(2.12)70.50(2.23)175.00(5.53)0.50(0.02)
Free chlorine0.100.200.020.00
Chlorine total0.230.220.100.02
AluminumUMRNegative0.051Negative
pH7.053.774.347.75
Notes: UMR is under measuring range.
Table 7. GNF hydroponic source water and disposal quality.
Class 1 Source Water for Hydroponic (OMAFRA)Leached GNF Safe Land Disposal
(O. Reg. 300/14)
Electric conductivity (EC)<500 µS/cmNH3/NH40.10 mg/L
Na (mg/L)<30Nitrite, Nitrate0.04 mg/L
Cl (mg/L)<50TKN0.05 mg/L
SO4 (mg/L)<100Phosphorous0.10 mg/L
Table 8. Raw and treated well water results compared with treated and leached GNF2.
Raw Well WaterRO FiltrateLeached GNF2RO Filtrate
pH7.755.003.82 (adj. to 6.4)5.23
Conductivity (µS/cm)56537203859
TDS (mg/L)29718.34120137
Turbidity (NTU)11.430.060.180.10
Na–mg/L (mmol/L)49 (2.13)2 (0.05)54 (2.22)2 (0.05)
K–mg/L (mmol/L)3 (0.13)0.00583 (23.99)22 (0.55)
Mg–mg/L (mmol/L)25 (1.09)4 (0.10)87 (3.58)4 (0.10)
Ca–mg/L (mmol/L)96 (4.17)5 (0.13)291 (11.98)5 (0.13)
Note: Adj. is adjusted.
Table 9. (a) Reactive phosphate (PO43−) mg/L in GNF and treated GNF using HCs and ACs. (b) Results of nutrients removal by AC400 and RO from GNF1 and GNF3.
(a)
Raw GNFTreated GNF
PO43− (mg/L)ROAC1AC2HC1HC2HC3
GNF10.610.00963.31.141.150.78
GNF31.850.02212.50.801.952.043.46
Removal from GNF199%
Removal from GNF398%
(b)
Untreated GNF Water (mg/L)AC400 treated water (mg/L)
GNF1GNF3GNF1GNF3
Total nitrogen (TN)457.00494.50188.00199.80
NO3 and NO2-N226.00319.50188.00188.20
TKN231.00165.00011.48
Reactive-ortho PO467.0070.5013.6063.20
Total phosphate (TP)132.00154.2025.20125.40
Total nitrogen (TN)% removal5960
NO3 & NO2−% removal1741
TKN% removal-93
Ortho PO4% removal8064
Total phosphate (TP)% removal8119
TKN, TN, Ortho PO4 and TP removal% by RO98–9997–99
Publisher’s Note: MDPI stays neutral with regard to jurisdictional claims in published maps and institutional affiliations.

