

Trace Element Compositions and Water Quality Assessment in the Angara River Source (Baikal Region, Russia)

Vinogradov Institute of Geochemistry SB RAS, 1A Favorsky St., Irkutsk 664033, Russia
*
Author to whom correspondence should be addressed.
Water 2022, 14(21), 3564; https://doi.org/10.3390/w14213564
Submission received: 11 October 2022
/
Revised: 1 November 2022
/
Accepted: 4 November 2022
/
Published: 6 November 2022
(This article belongs to the Special Issue Water Quality Modeling and Monitoring)
Abstract
:The relevance of studying the spatial-temporal dynamics in the trace element composition of the water at the Angara River source is associated not only with determining the degree of anthropogenic load on the local area of the water body but also with the use of the water chemical composition of the Angara River source as an integral indicator of the hydrochemical state of the entire Lake Baikal. The current work is based on monthly monitoring studies conducted from March 2021 to February 2022 along the left shore, middle part, and right shore of the Angara River source. In water samples, the concentrations of Al, Cr, Mn, Fe, Co, Ni, Cu, Zn, As, Cd, Sn, Cs, Tl, Pb, Th, and U were measured by inductively coupled plasma mass spectrometry. The results indicated that the concentrations of the trace elements lie within mean + 1SD: Cd in 97% of samples; U in 94% of samples; Tl in 92%; Al, Cr, Co, Ni, Cu, Zn, Sn, Pb, and Cs in over 80%; Fe in 78% of samples; and Mn and Th in over 60% of samples. Such results show a high degree of consistency in the water trace element composition at the source of the Angara River. The major factors responsible for the water hydrochemistry at the Angara River source include the runoff of Lake Baikal, the anthropogenic effect of Listvyanka and Port Baikal settlements, and water transport activity. The concentrations of all trace elements in the water of the Angara River source are substantially below the standards for drinking water. At the same time, the single-factor pollution index revealed water samples with considerable contamination by Fe, Zn, Sn, Al, Cs, Mn, Cu, Tl, Cd, Pb, and Th and very high contamination by Cr, Fe, Co, Cs, Tl, Pb, and Th. The pollution load index has classified most of the water samples as having baseline levels of pollutants. Three samples taken from the left shore, four from the middle part, and seven from the right shore were classified as polluted. This means that the ongoing anthropogenic impact may worsen the water quality and have a negative impact on living organisms. The obtained results make a clear case for strengthening environmental protection measures to minimize the anthropogenic effect on the ecosystems of Lake Baikal and Angara River.
1. Introduction
Water shortages, whether due to water scarcity in certain areas of the world or pollution of available water resources, are a serious issue for the world’s population. Some of the more common pollutants in the natural environment are trace elements that enter water bodies with industrial and municipal wastes, surface runoff from urban areas, precipitation, etc. [1,2]. The potential threat of trace elements in the aquatic ecosystems associated with bioaccumulation abilities and their potentially toxic impact on living organisms have been widely discussed [3,4,5]. The quality parameters of surface water used for drinking and fishery have a direct effect on human health [6,7].
In contrast to the water stress in many parts of the world, the territory of the Irkutsk region (Russia) is famous for its abundant freshwater resources [8]. In the Irkutsk region, there is the largest water system on the planet, which includes Lake Baikal, the UNESCO World Heritage Site, and the Angara River, the only surface runoff of the lake. As regards the concentrations of 58 trace elements, Lake Baikal is classified as one of the purest water reservoirs of the biosphere [9]. As it receives the runoff of Lake Baikal, the Angara River inherits its hydrochemical characteristics. Long-term monitoring indicates similar mineralization values in the Angara River source (95.6 mg L−1) [10] and Lake Baikal (~96 mg L−1) [11]. In the river, as in the lake, water belongs to the bicarbonate class of the calcium group. Several studies of major ions (HCO3−, SO42−, Cl−, Ca2+, Mg2+, Na+, and K+) [12] and total mercury concentrations [13] in the water at the source of the Angara River revealed that the hydrochemical composition at the Angara source characterizes the average water composition of the lake.
The Angara River is the major source of household and drinking water for large cities and smaller settlements of the Irkutsk region. At the same time, we are facing a problem of the qualitative transformation of river water resources due to anthropogenic load. Generally, pollutants are introduced with waste and household water, atmospheric transfer from industrial sources, and surface runoff [14,15]. One of the primary measures used for the maintenance of surface water quality is monitoring, which is of considerable interest from the viewpoint of long-term trends in the variation of surface water quality and pollution control [16,17]. Systematic studies of the water at the source of the Angara River as an indicator of the hydrochemical composition of the entire Lake Baikal can minimize or even prevent negative environmental impacts in the Baikal–Angara water system. The present study, therefore, focuses on (a) spatial-temporal dynamics in the concentrations of trace elements (Al, Cr, Mn, Fe, Co, Ni, Cu, Zn, As, Cd, Sn, Cs, Tl, Pb, Th, and U); (b) natural and anthropogenic factors, affecting the trace element water composition; and (c) assessment of the water quality at the Angara River source. By the decree of the Irkutsk region government [18], the source of the Angara River is recognized as a natural monument. Therefore, it can be expected that this study will contribute to the preservation of the freshwater Baikal–Angara ecosystem as both a key source of drinking water, and a unique Natural Heritage Site.
2. Materials and Methods
2.1. Study Site
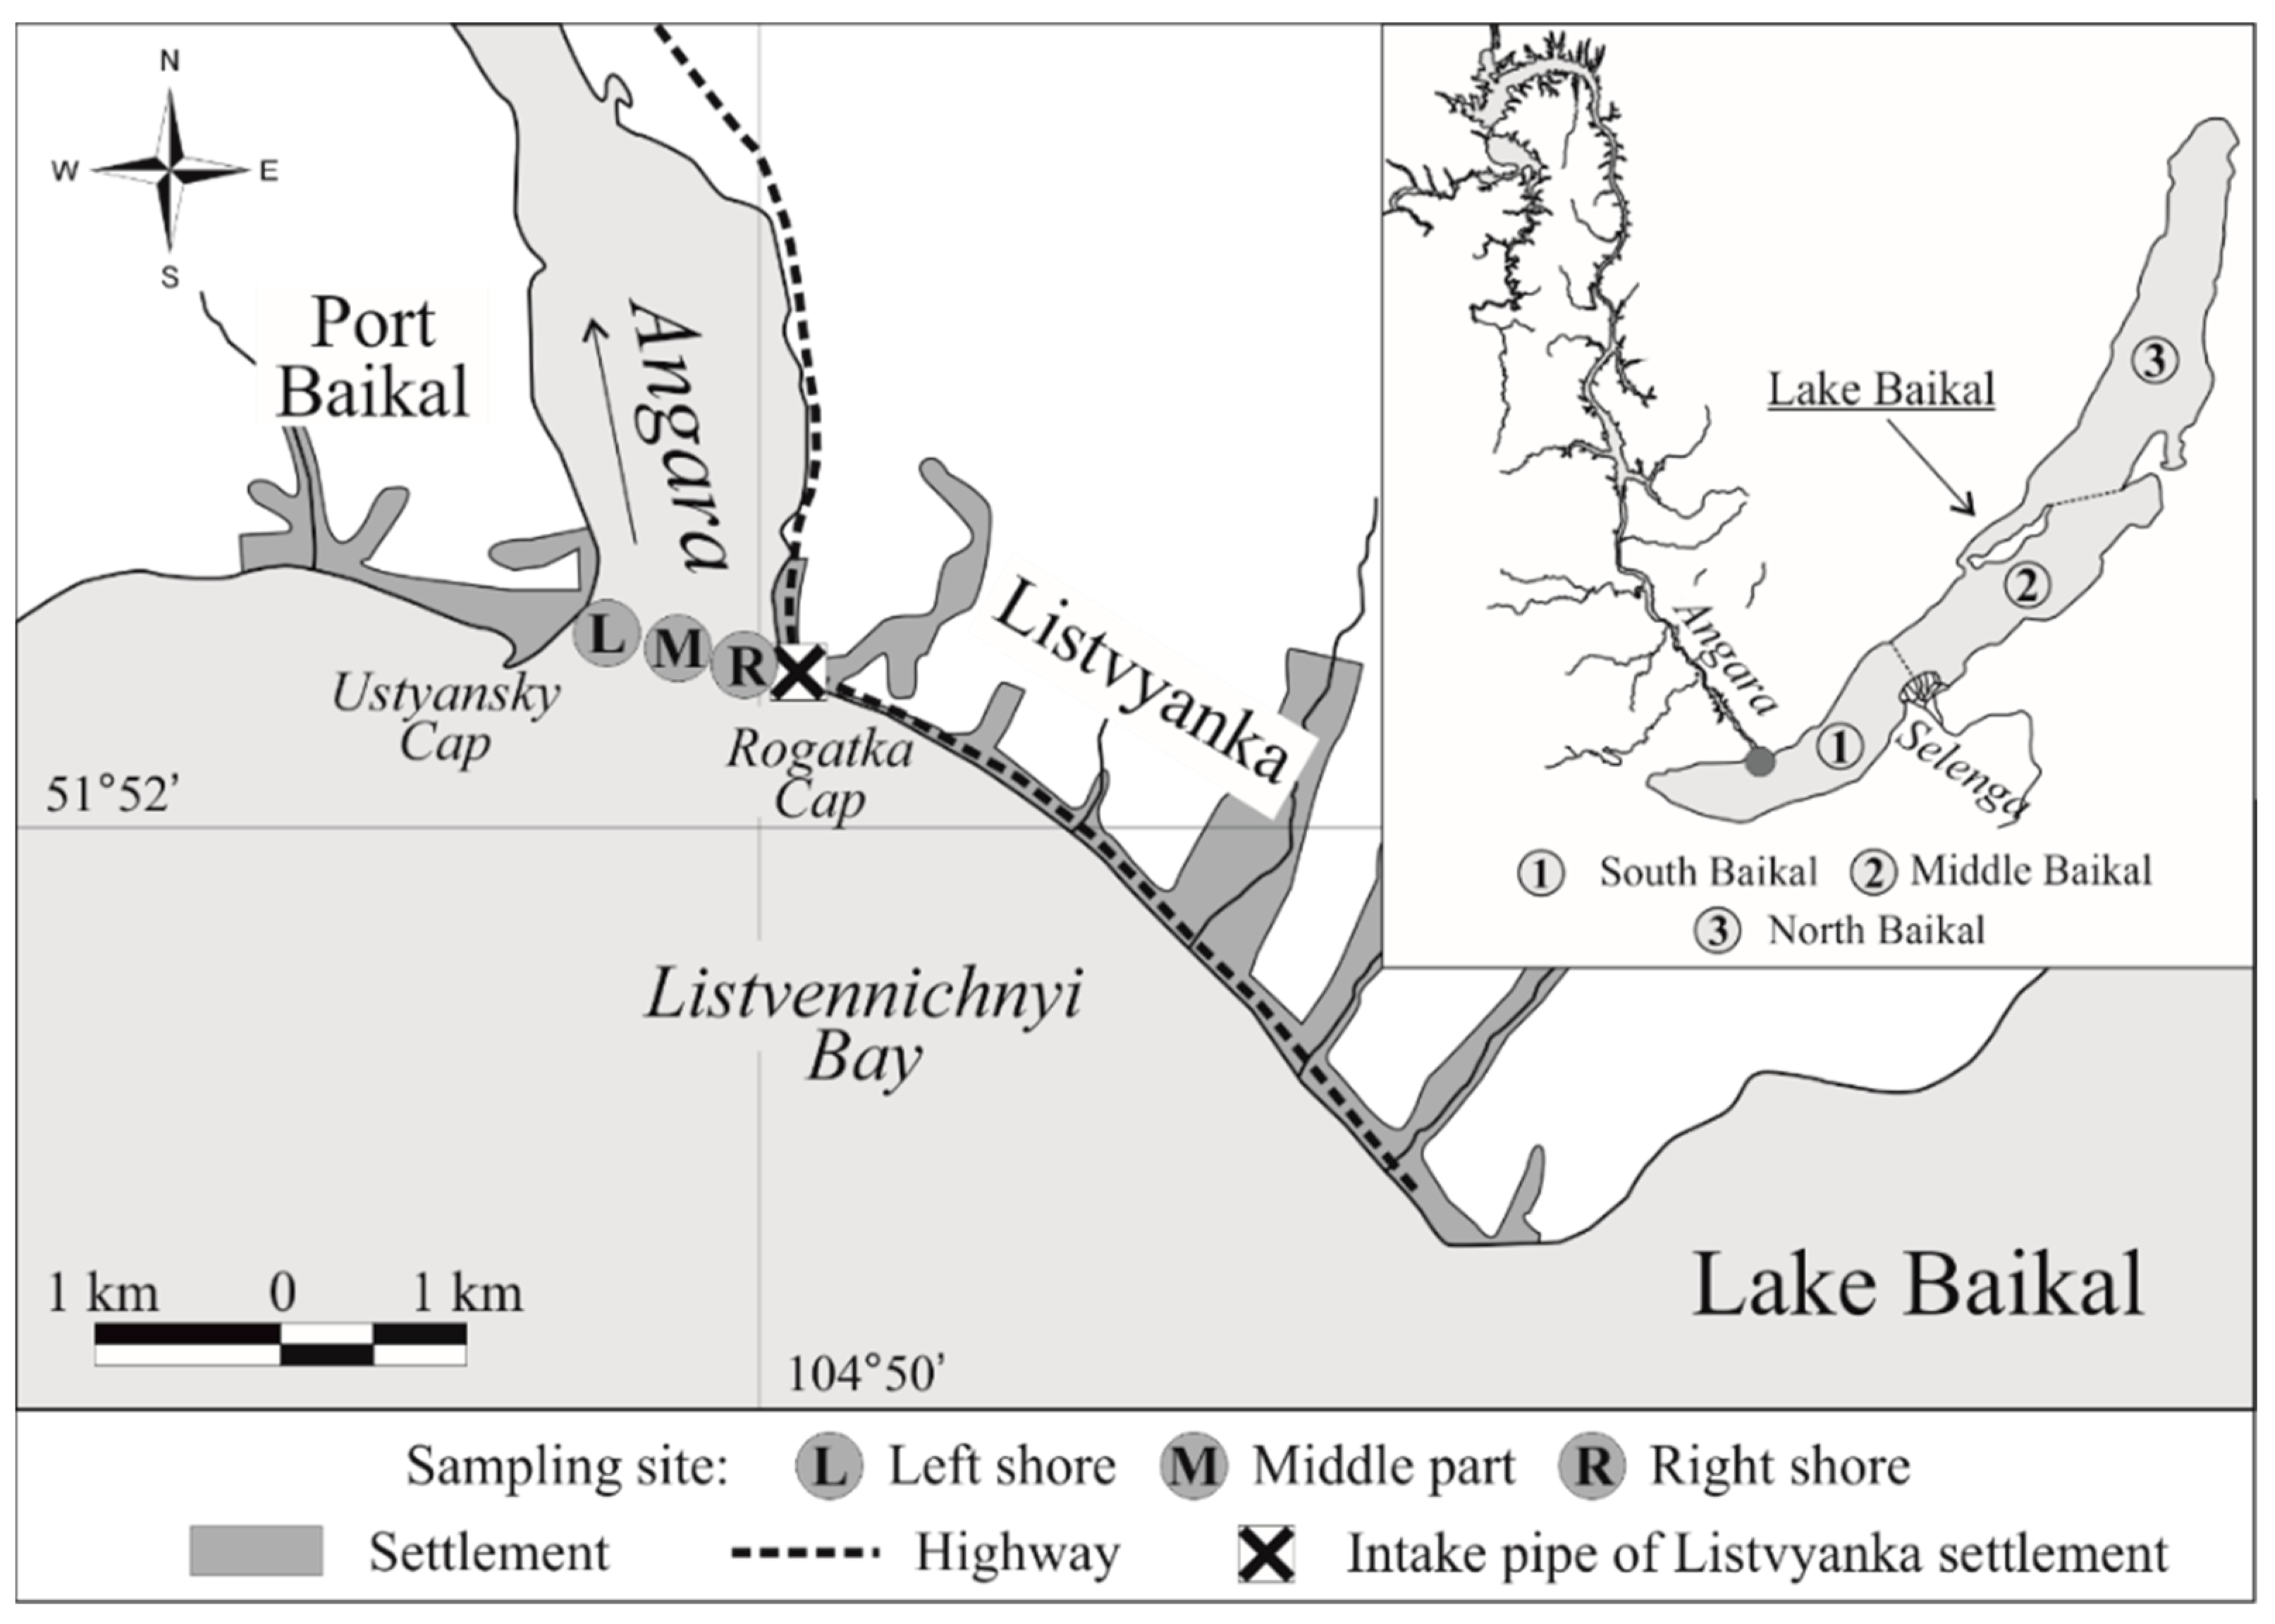
The study was focused on the source of the Angara River (Figure 1), whose water balance is formed mainly due to the water from Lake Baikal and, to a lesser extent, the water of the Angara River tributaries. The data on the temperature stratification of waters from various depths of Lake Baikal [19] reveal that the Angara River source mainly receives waters from a depth of about 10 m. Before the spring and autumn homothermy, the depth from which water enters the river increases to 50 m. The Angara River basin occupies a catchment area of over 1,039,000 km2. The source of the Angara River is located within Listvennichnyi Bay on the western shore of southern Lake Baikal, between the capes of Rogatka (Listvyanka settlement) and Ustyansky (Port Baikal settlement) (Figure 1). The average water discharge at the source of Angara River amounts to about 2000 m3 s−1, with the highest point from September–October (up to 4600 m3 s−1) and the minimum point from March–April (about 1000 m3 s−1) [20]. Water level fluctuations in the river’s source are related to the water levels of Lake Baikal and of the Irkutsk reservoir, located 60 km downstream from the source of the river and regulated by the Irkutsk hydroelectric power plant. The climate of the area is sharp continental, with long, severe winters and warm summers. A characteristic feature of the Angara River is the ice-free source even at very low winter air temperatures. This can be explained by the arrival of warmer (compared with the surface layer) subglacial water of Lake Baikal and high current velocity (1–2 m s−1).
2.2. Sampling Method
Water samples were taken at the source of the Angara River monthly from March 2021 to February 2022. The samples were collected on the 20th and 21st of each month. The monitoring sections were marked as points of the left shore (104°48′46.58″ E 51°52′15.11″ N), middle part (104°49′14.50″ E 51°52′11.92″ N), and right shore (104°49′39.47″ E 51°52′8.61″ N). At each sampling site, three parallel water samples were collected. Replicate samples from the same site were taken within a radius of about 10 m and then were mixed. The mixed water samples were filtered through 0.45 μm Millipore membrane filters and placed into polyethylene bottles, and they were immediately acidified by the addition of HNO3 (Merck ultrapure, Darmstadt, Germany). Prior to the laboratory analysis, the water samples were stored in a refrigerator.
2.3. Analysis Method
The chemical analysis of water samples was performed at the Center for Collective Use «Isotope-Geochemical Research» located at the IGC SB RAS (Irkutsk, Russia). In the present study, the concentrations of trace elements were analyzed by inductively coupled plasma mass spectrometry (ICP-MS) via a high-resolution double-focusing mass spectrometer ELEMENT-2 (Thermo Finnigan, Bremen, Germany). Multi-element standard samples such as ICP Multi Element Standard Solution-Sol X CertiPUR for Surface Water Testing, Sol XII CertiPUR (Merck, Kenilworth, NJ, USA) and Combined Quality Control Standard IQC-026 (NIST, Gaithersburg, MA, USA) were used to ensure the reliability of the analytical measurements. The following metals were tested in water samples: 27Al, 52Cr, 55Mn, 56Fe, 59Co, 63Cu, 60Ni, 66Zn, 75As, 112Cd, 119Sn, 133Cs, 205Tl, 208Pb, 232Th, and 238U. The limits of detection (DL) for elements were as follows: 0.81 µg L−1 for Al; 0.05 µg L−1 for Cr; 0.37 µg L−1 for Mn; 0.75 µg L−1 for Fe; 0.005 µg L−1 for Co; 0.03 µg L−1 for Cu; 0.05 µg L−1 for Ni; 0.64 µg L−1 for Zn; 0.12 µg L−1 for As; 0.002 µg L−1 for Cd; 0.010 µg L−1 for Sn; 0.0003 µg L−1 for Cs; 0.013 µg L−1 for Pb; 0.0003 µg L−1 for Th; and 0.001 µg L−1 for U.
2.4. Pollution Indices
The following commonly accepted pollution indices were used to calculate the water contamination by trace elements:
1. The single-factor pollution index (CF) was to determine only one element in a sample [21]:
where Ci is the concentration of the analyzed element, and C0 is the concentration of metal in the control material. The CF value is divided into categories: CF < 1 = low contamination, 1 ≤ CF ≤ 3 = moderate contamination, 3 ≤ CF ≤ 6 = considerable contamination, and CF 6 ≥ = very high contamination.
2. The Nemerow pollution index (NPI), used to assess the water quality, combines the average and maximum values of the single-factor pollution index [22]:
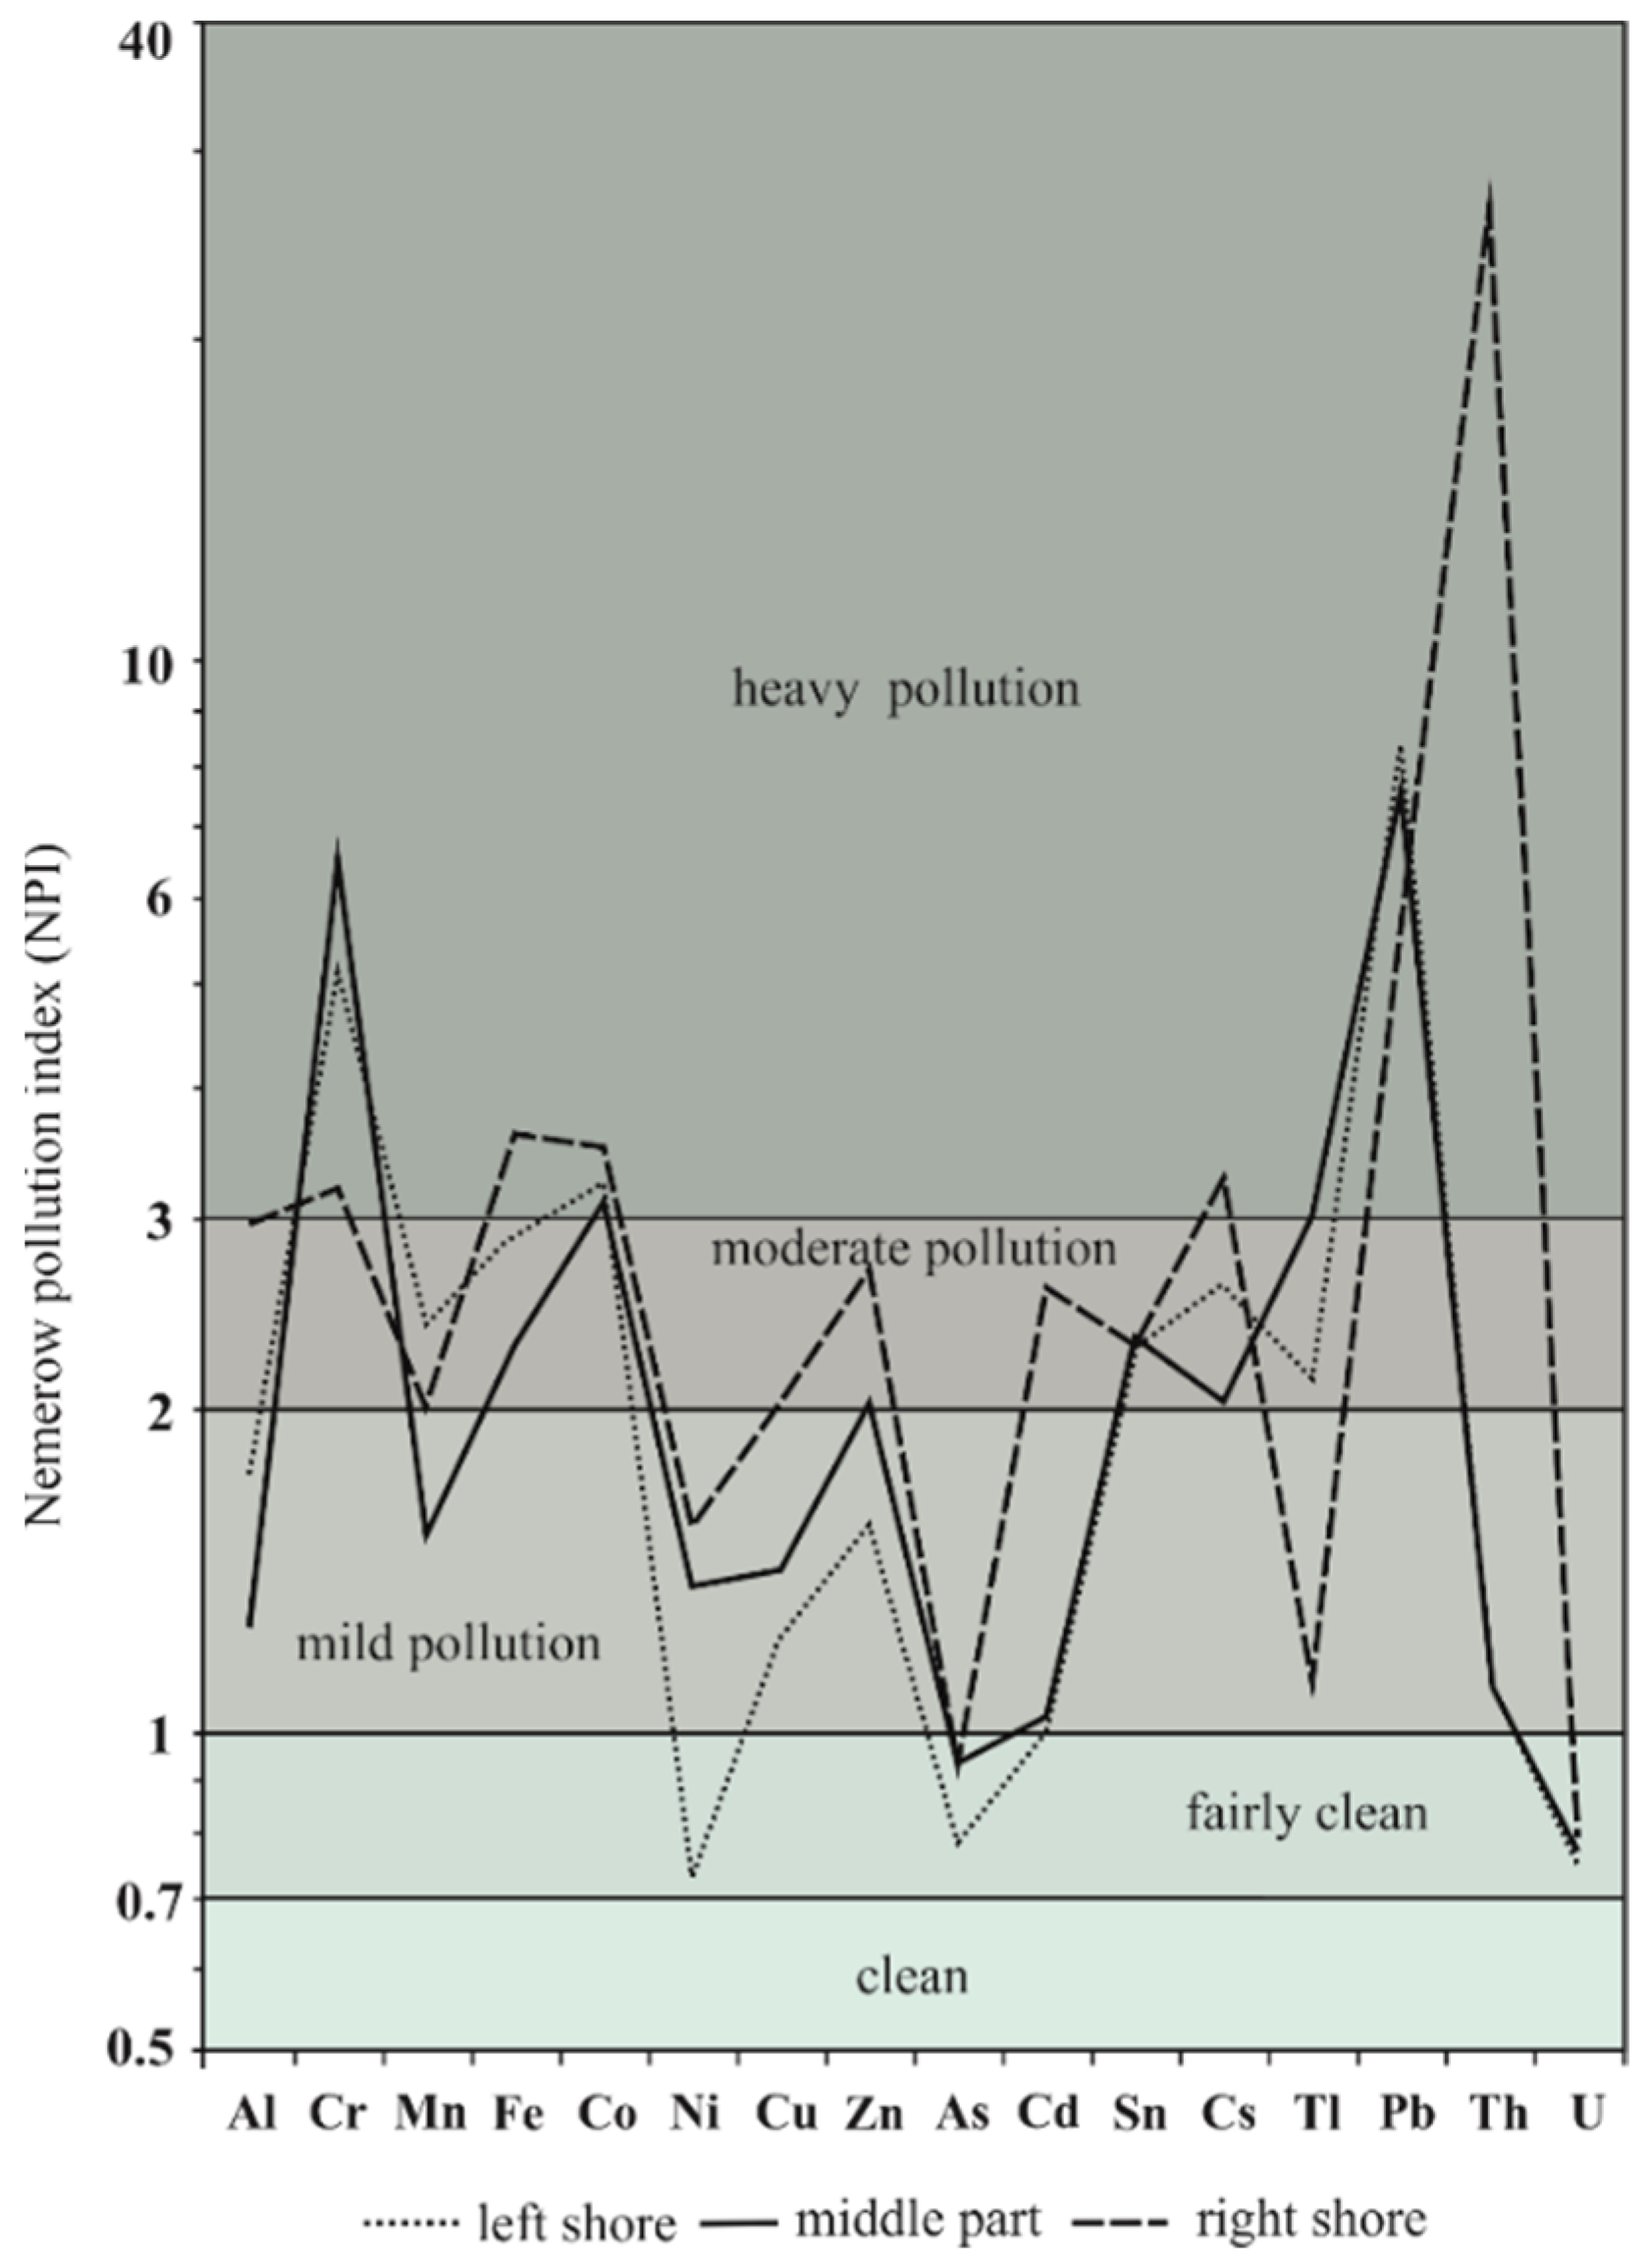
where PImax is the maximum CF value of an element, and PIa is the average CF value of an element. The NPI shows the degree of water pollution: NPI < 0.7 = clean; 0.7 < NPI < 1.0 = fairly clean; 1 < NPI < 2 = mild pollution; 2 < NPI < 3 = moderate pollution; NPI > 3 = heavy pollution.
3. The pollution load index (PLI) was to calculate the total contamination in each sample [23]:
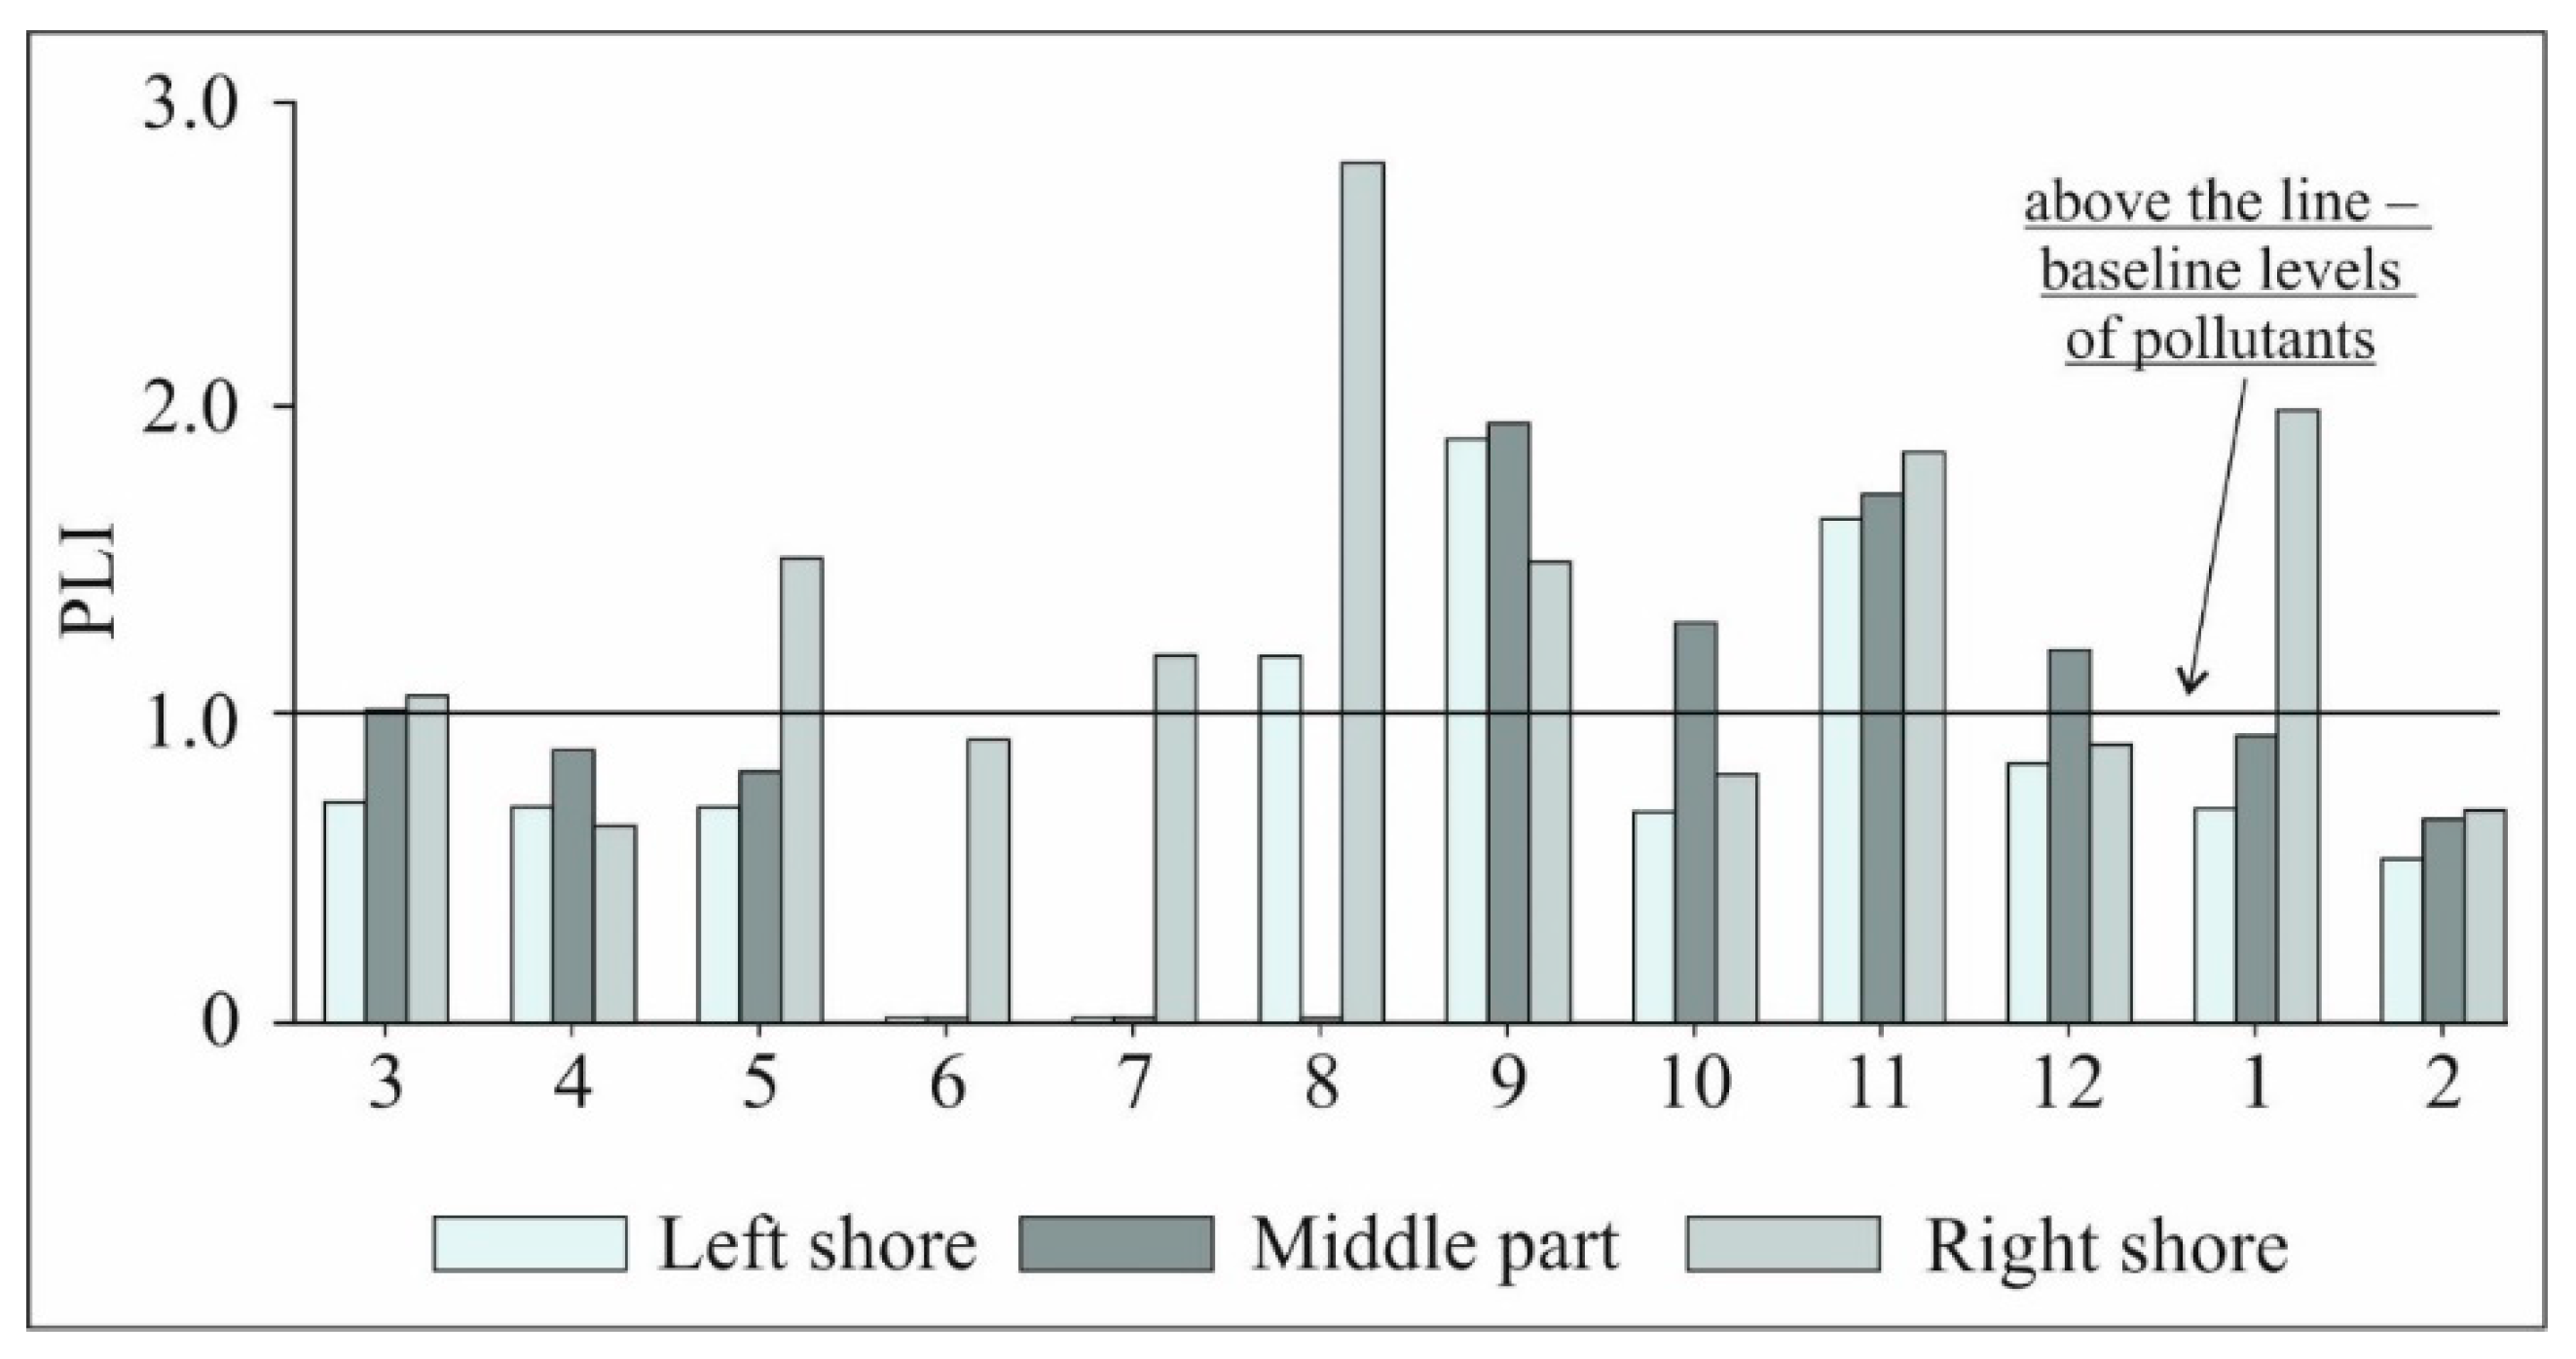
where CF is an individual element pollution index (CF—see Equation (1)). PLI is divided into categories: PLI < 0 = non-polluted, 0 < PLI ≤ 1 = baseline levels, 1 < PLI ≤ 10 = polluted, and 10 < PLI ≤ 100 = highly polluted.
3. Results and Discussion
3.1. Spatial-Temporal Characteristics of Water Trace Element Composition
Trace element concentrations and their statistical characteristics in the water of the Angara River source are given in Table 1 and Table S1. The average trace element concentrations in the water of the Angara River source followed the sequence Fe > Zn > Mn > Al > Cu > U > As > Ni > Pb > Cr > Cd > Co > Sn > Cs > Tl > Th. The element concentrations analyzed in 2021–2022 were comparable to their levels obtained during the three-year monthly monitoring in 2006–2008 [24]. Major differences in maximum element concentrations were found only for Fe, Sn, and Tl, with these parameters being higher in 2006–2008. This difference can be explained by the parameters of the sampling procedures. As opposed to the present study, in 2006–2008, the samples were taken only from the water intake pipe of Listvyanka settlement, located on the river’s right shore.
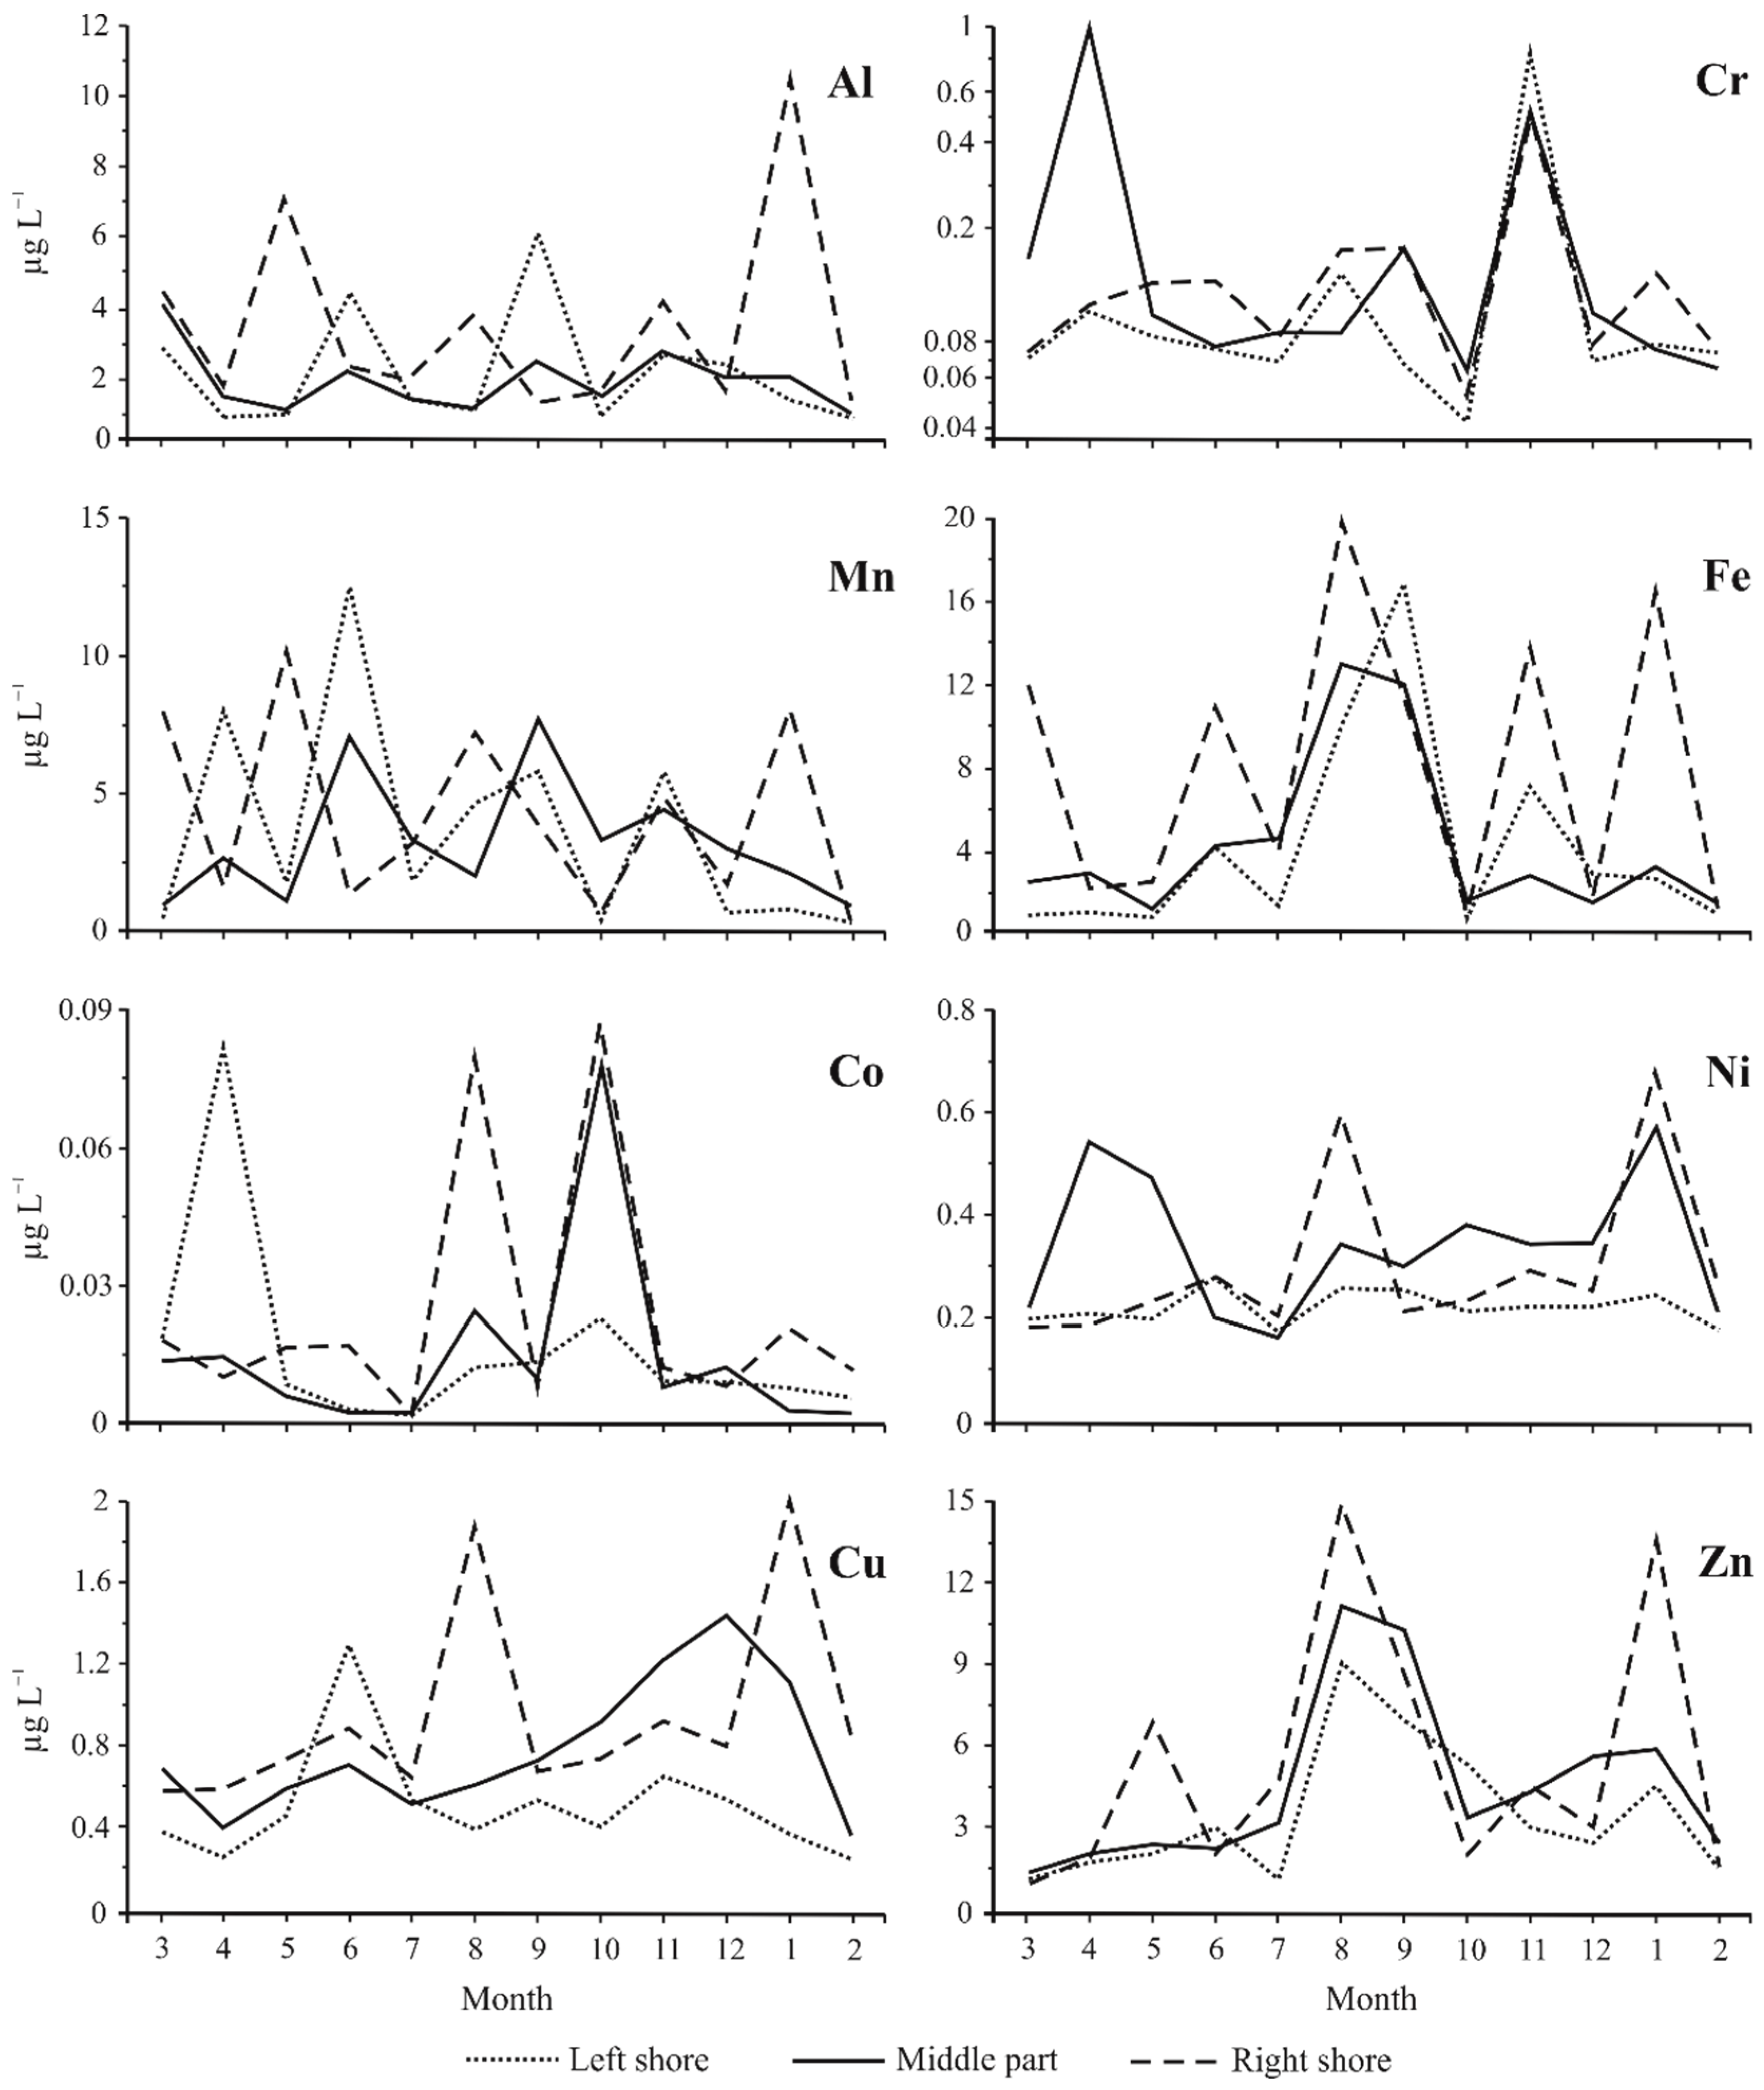
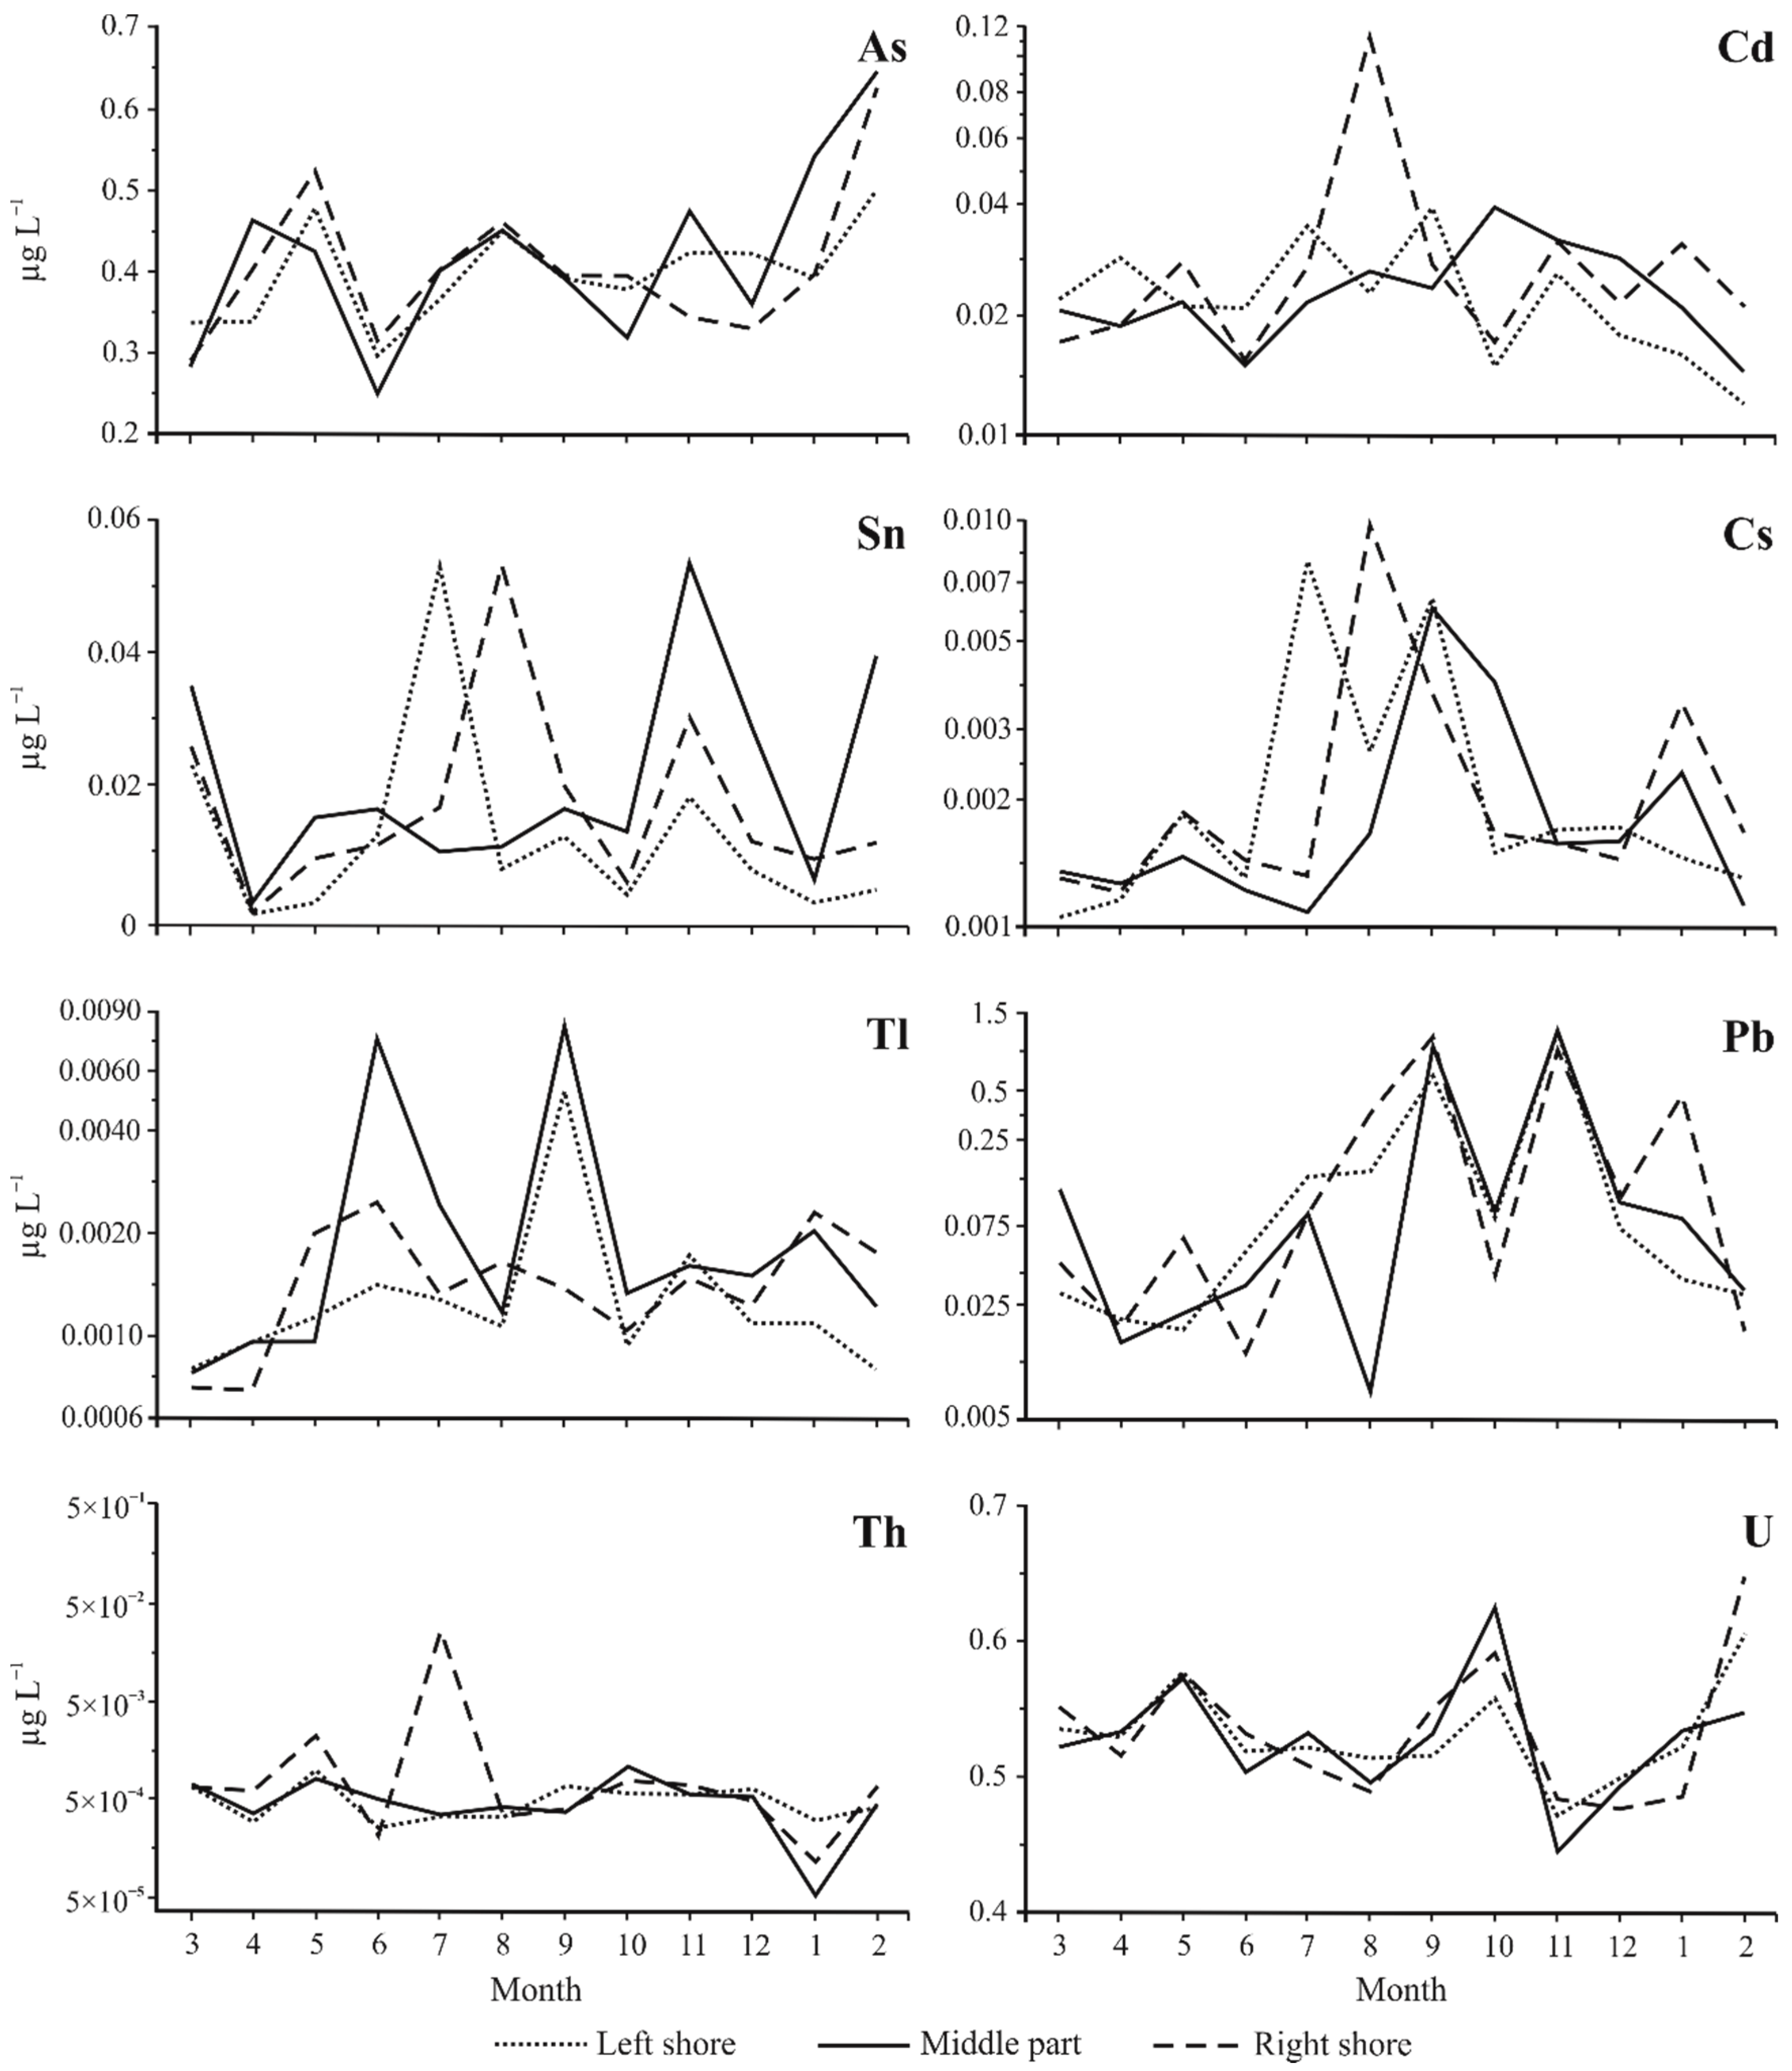
At the source of the Angara River, trace element concentrations showed both spatial and temporal variations (Figure 2). During all sampling campaigns, increases in the concentrations of trace elements were not confined to the right or left shore or to the middle part of the river. However, the comparison of results obtained within each month showed that, out of twelve water samples collected on the right shore (Listvyanka settlement), seven samples had maximum concentrations of Al and Co; six samples were characterized by higher levels of Fe and Cr; five samples showed maximum concentrations of Cu, Zn, Pb, Th, and U; four samples had higher levels of Mn, Ni, As, Cd, Cs, and Tl; and three samples had maximum Sn concentrations. In the middle part of the river’s source, out of 12 samples, the maximum concentrations of trace elements were recorded as follows: Ni and Sn in 7 samples; Cu, Cr, Mn, Zn, and Tl in 5 samples; Fe and As in 4 samples; Th and U in 3 samples; Cd and Pb in 2 samples; Co in 1 sample. Along the left shore (Port Baikal settlement), 5 out of 12 samples showed maximum concentrations of Cd; 3 samples demonstrated the highest abundances of Al, Mn, Cs, and Th; 2 samples were marked by the maximum contents of Fe, Co, Zn, As, Pb, and U; and 1 sample had the maximum Cr, Cu, Sn, and Tl concentrations.
In the samples collected in 2021–2022, Th, Pb, Mn, and Sn exhibited greater variations between minimum and maximum concentrations. For the entire monitoring period, the concentrations of the following trace elements were found to lie within mean ± 1SD: Cd in 97% of samples; U in 94%; Tl in 92%; Al, Cr, Co, Ni, Cu, Zn, As, Sn, Pb, and Cs in over 80%; Fe in 70%; and Mn and Th in 60% of samples. Such characteristics indicate a low variability of water trace element composition in the source of the Angara River. In some samples, trace element concentrations were found to exceed the mean + 2SD and the mean + 3SD. They included Al concentrations analyzed in water samples from the right shore collected in January 2022; Cr concentrations determined in samples collected on the left shore in November 2021 and in the middle part in April 2021; Ni concentrations in samples collected along the right shore in January 2022; Cu, Cd, and Cs contents in samples from right shore taken in August 2021; Tl concentrations in samples from the middle part taken in July and September 2021; and Th concentrations in the samples collected in July 2021.
3.2. Natural and Anthropogenic Factors Influencing Water Hydrochemical Characteristics
3.2.1. Lake Baikal
Comparative analysis of the water chemical composition of Angara River source and of Lake Baikal showed them belonging to the unified Baikal–Angara freshwater system. The data obtained from hydrochemical studies of the Middle Baikal [25] and the entire lake [9] were found to be in good agreement, with the exceptions of Zn and Th, whose concentrations analyzed in [25] were lower than their abundances determined in [9]. The comparison of the water trace element composition of Lake Baikal and the Angara River source showed that the Zn concentration was in good agreement with its abundance in the water of the entire lake [9], while the Th contents were in line with its values for the central Baikal [25]. In the water of the river’s source, the concentrations of As and U were similar to those in the lake’s water, while the Al, Cr, Mn, Fe, Co, Ni, Cu, Cd, Sn, Cs, Tl, and Pb contents were higher (Table 1). Such a pattern in the distribution of trace elements can be partly explained by a feature of hydrochemical composition in the southern Baikal, whose runoff greatly affects the water chemistry of the Angara River source. The study by [9] gives the statistical characteristics (minimum, maximum, mean, etc.). There is no possibility to present the concentrations of trace elements in the southern part of the lake. At the same time, it is known [19] that the major ion concentrations in the water at the source of the Angara River are greatly influenced by the Selenga River, a tributary of Lake Baikal. Owing to its powerful current, the water of the Selenga River is distributed along the western shore and then brought into the Angara River. The water of the Selenga River and its tributaries are rich in Fe, Al, Zn, Pb, U, and As; suspended sediments of the Selenga River and its tributaries are enriched with As, Cd, Mo, Pb, Zn, Mn, and Co due to both natural and anthropogenic influence [27].
3.2.2. Seasonal Variations in Trace Elements
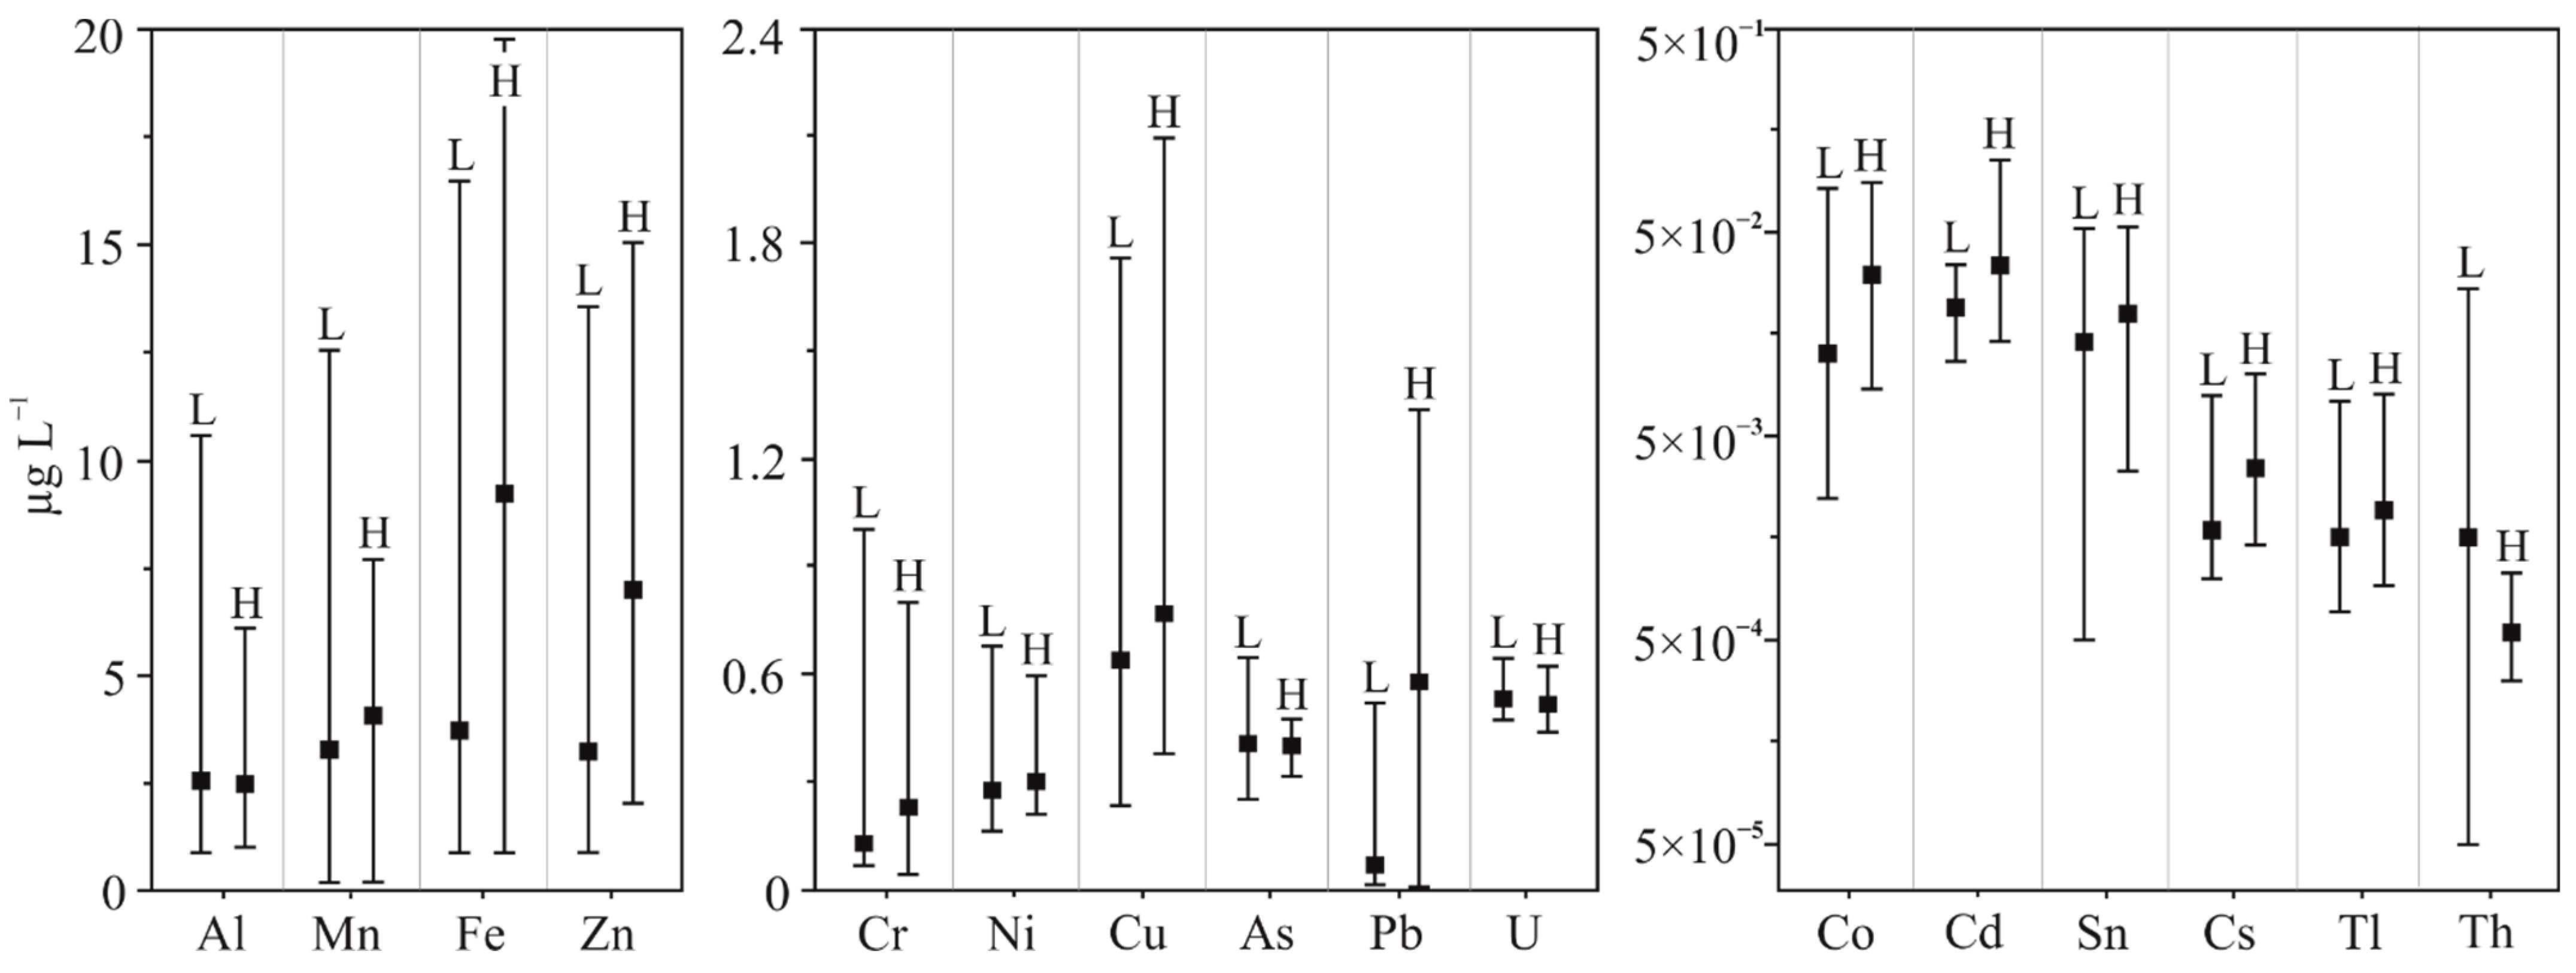
Concentrations of trace elements in river water have seasonal variations, which are due to natural environmental factors affecting the water regime of rivers [28,29]. Prior to the creation of the Irkutsk reservoir, the water regime at the source of the Angara River was mainly affected by Lake Baikal. The period from June to November was the full-water season, and the period from December to May was regarded as a limited season [30]. After water flow regulation, the water-level regime of the river’s source is largely affected by the Irkutsk hydro-electric power station and varies insignificantly depending on the season. During the research period between March and July, the water level amounted to 362–397 cm above the gauge zero (423.62 m). A higher water level was observed between August and November (445–460 cm above the gauge zero). Between December and February, the level decreased to 410 cm above the gauge. Variations in the water trace element composition at the source of the Angara River within the highest and lowest water stages are shown in Figure 3.
At the source of the Angara River, elements demonstrating chaotic distribution within all sampling months include Mn (Figure 2). Despite a significant water flow regulation, the distribution of others trace elements is characterized by some peculiar features. On the plot of trace element distribution in the water of the Angara River source within a year (Figure 2), July was found to be marked by lower concentrations of Al, Cr, Mn, Fe, Co, Ni, Cu, Zn, Sn, Cs, Tl, Th, and U. The exceptions were Th along the right shore and Sn and Cs along the left shore of the river. Within the area under study, July had the maximum precipitation amounts. A higher precipitation volume is known to reduce the total metal concentrations in water [31,32]. Within the lowest water stage, April was marked by low concentrations of Al, Cr, Fe, Co, Ni, Cu, Zn, Cd, Sn, Cs, Tl, Pb, and Th (Figure 2). The exceptions were Cr and Ni in the middle of the river and Co and Cd along the left shore. On Lake Baikal, March–April is a period of active snow melting, which also affects the concentrations of trace elements in the water.
During the highest and lowest water stages, the average Al, As, and U concentrations were similar (Figure 3). Only Th levels were markedly higher in the lowest water stage. Average Mn, Fe, Zn, Cr, Ni, Cu, Pb, Cu, Cd, Sn, Cs, and Tl concentrations were higher during the highest water stage. This can be partly explained by the entry of trace elements of both natural and anthropogenic origin into the aquatic environment as a result of shore abrasion. Furthermore, the concentrations of trace elements in the middle part mainly reflect their intake from the catchment of Lake Baikal. Higher concentrations of trace elements at coastal stations, which are known to be associated with the terrestrial pollution of adjacent areas [33], may indicate their arrival from anthropogenic areas located at Listvyanka and Port Baikal settlements.
3.2.3. Anthropogenic Sources of Trace Elements
The anthropogenic source of trace elements into the aquatic environment of the Angara River source is the Listvyanka settlement, with a population of about 2000 people. Though the population of the settlement is rather small, the immediate proximity of the settlement to Lake Baikal attracts a huge number of tourists, leading to the faster development of the coastal zone. The growth of impervious surfaces, particularly paved roads, roofs, and walls of houses, leads to the accumulation of pollutants that enter reservoirs with surface runoff [34]. The entry of elements of anthropogenic origin is also related to the highway and its heavy traffic. Road-deposited sediments highly contaminated with Zn, Cu, Pb, Ni, Cr, and Cd [35] can pollute waters during precipitation events [36]. The anthropogenic effect of the Listvyanka settlement can also result from sewage treatment plants that do not meet the environmental requirements.
Signs of negative changes in the water of the Listvenichnyi Bay of Lake Baikal, due to the anthropogenic load in the Listvyanka settlement, have been recorded in various studies. A study of surface water in the bay and groundwater in the vicinity of the Listvyanka settlement revealed that the subaqueous discharge of polluted groundwater leads to higher Mn, Zn, and Pb concentrations in the near-bottom water of the coastal zone of Lake Baikal [37]. In contrast to the deep water of the bay, elevated Mn, Cu, Co, Al, Fe, and Zn concentrations, caused by the dissolution of rocks and soils during snowmelt and mechanical shore abrasion, were found in the lake’s subglacial water [38]. Higher Mn, Pb, Zn, and Cu concentrations that exceed the maximum permissible concentrations and/or regional background values were determined in samples of meltwater of snow collected in the settlement [39]. The atmospheric air pollution of the Listvyanka settlement was found to relate to small boiler houses, furnace heating of residential buildings, and vehicle emissions [40]. Therefore, the surface runoff (rain and meltwater), atmospheric transport from the settlement, and subaqueous discharge of groundwater are responsible for higher concentrations of elements in water of the Angara River source, particularly on its right shore.
The anthropogenic impact on the aqueous environment of the site under study is also related to the water transport. Here, on the left shore, there is a shipyard built in the 1890s but currently abandoned as well as the cargo and passenger port, whose ships and ferry run between the left (Port Baikal) and right (Listvyanka) shores all year round. Currently, water transport for personal use is becoming more popular. Antifouling paints, metals, and steel alloys as well as petroleum products increase the risk of water pollution. A study revealed the presence of Cr, Cu, Mn, Ni, Pb, Sn, and Zn in the antifouling paint [41]. Ni concentrations result from HFO combustion in engines [42]; Ni is also the main element in crude oil [43]. In addition to Ni, crude oil contains Cr and Zn [44]. Petrol combustion is a major source of Pb and As air contamination [45]. The accumulation of trace elements in water and bottom sediments often takes place in ports, where ships and cargo are loaded and unloaded, as well as in places of intensive water transport. The repair of ships is thought to be a primary contributor of heavy metals in the water of Laoshan Bay, China [46]. High concentrations of Cr, Cu, As, and Cd in the bottom sediments of Cartagena Bay (Caribbean Sea) [47] and elevated abundances of Zn, Cu, As, and Pb in sediments of the eastern Adriatic coast [48] are mainly associated with shipyard and harbor activities. On the southwest coast of Tamil Nadu, India, the source of Pb and Zn in bottom sediments is leaded petrol and anti-biofouling paints [49]. It was found that shipping activity may resuspend polluted bottom sediments, thus leading to the remobilization of pollutants into the water [50]. In the current study, we did not analyze trace elements in bottom sediments from the coastal part of Listvenichnyi Bay, Lake Baikal, and the Angara River source. However, the shipyard and shipping activities being here for over 150 years suggests the accumulation of significant amounts of pollutants, which may negatively influence the aqueous environment of the river’s source. Furthermore, abandoned ships at the former shipyard cause concerns about the potentially negative effects on the lake’s water and its shore zones.
3.3. Correlation Analysis
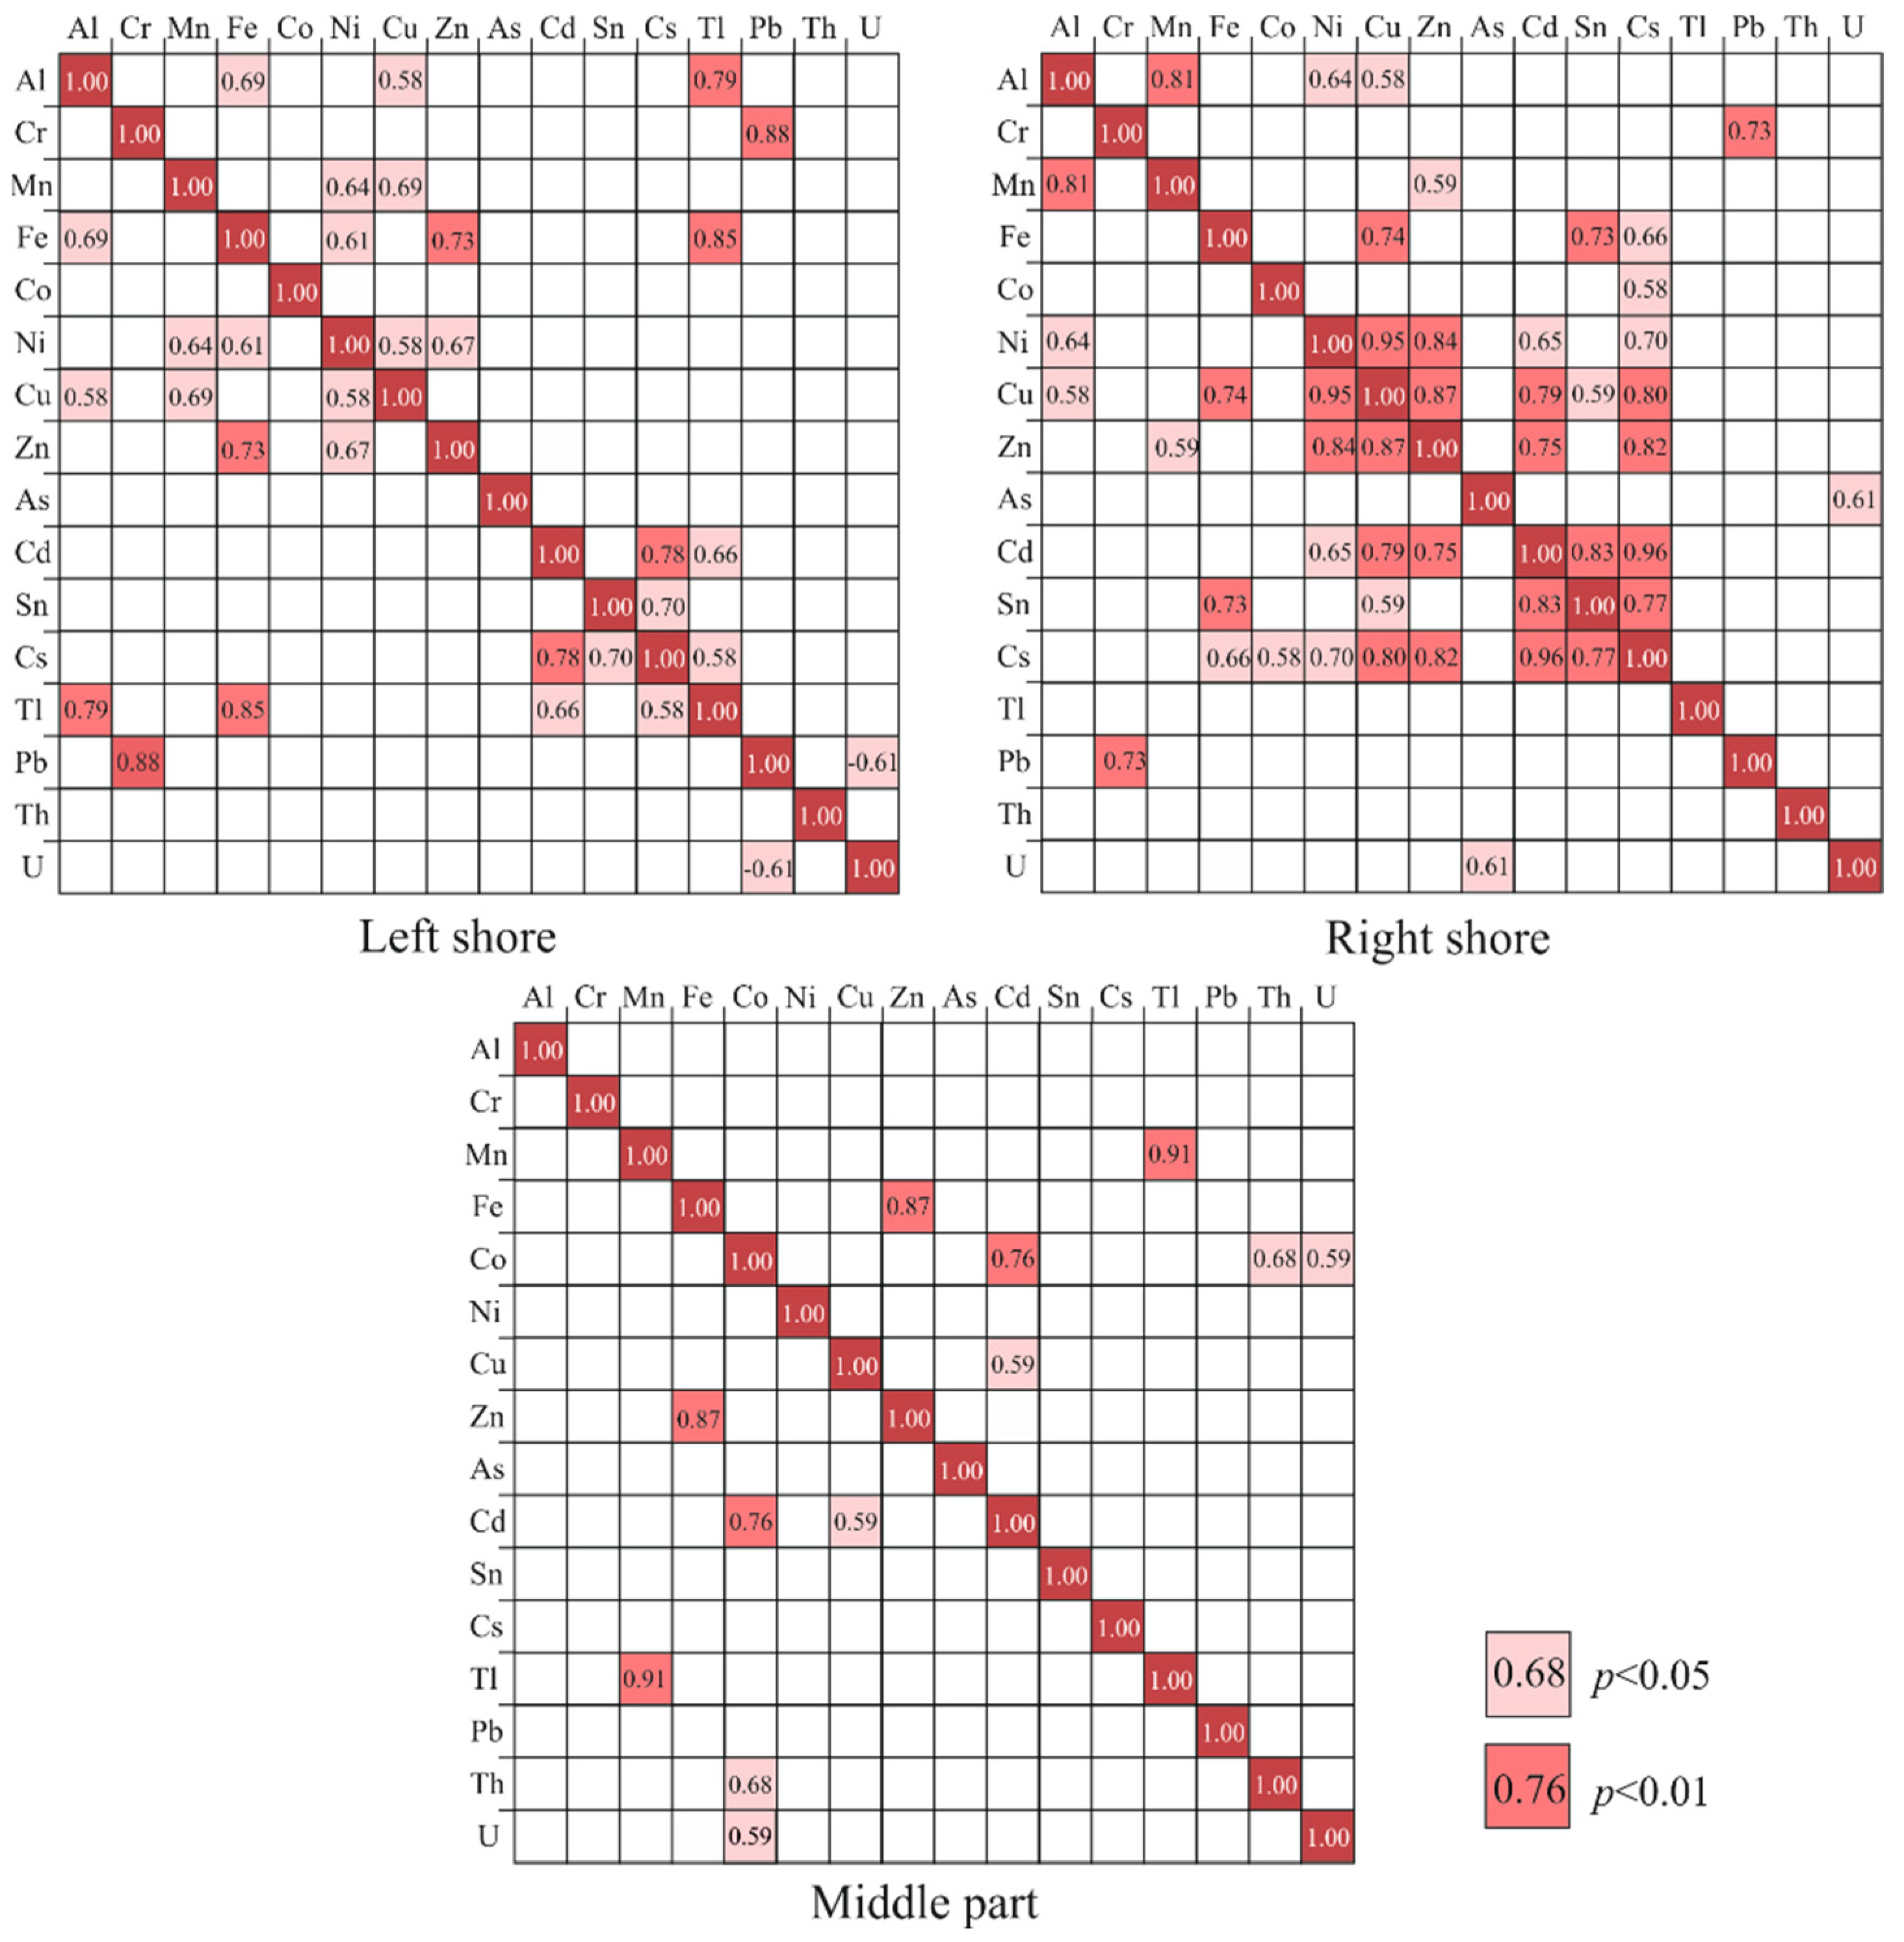
The Pearson correlation method is the most widely used method to identify cross-correlations reflecting similar sources of pollutants [51]. For the matrix under study, parameters showing r > 0.71 are considered to be strongly correlated, whereas r > 0.58–0.71 represents a moderate correlation at a significance level (p) of p < 0.01 and p < 0.05. The data of trace element concentrations in water of the Angara River source reveal a number of significantly positive correlations (Figure 4). In water samples taken from the left shore, the pairs of elements showing strong relationships (p < 0.01) included Al–Tl (r = 0.79), Cr–Pb (r = 0.88), Fe–Zn (r = 0.73), Fe–Tl (r = 0.85), and Cd–Cs (r = 0.78), while in samples collected from the middle part of the river, these elements comprised Mn–Tl (r = 0.91), Fe–Zn (r = 0.87), and Cd–Co (r = 0.76). Much stronger correlations were found in water samples taken from the right shore: Al–Mn (r = 0.81), Cr–Pb (r = 0.73), Fe–Cu (r = 0.74), Fe–Sb (r = 0.73), Ni–Cu (r = 0.95), Ni–Zn (r = 0.84), Cu–Zn (r = 0.87), Cu–Cd (r = 0.79), Cu–Cs (r = 0.80), Zn–Cd (r = 0.75), Zn–Cs (r = 0.82), Cd–Sn (r = 0.83), Cd–Cs (r = 0.96), and Sn–Cs (r = 0.77). Correlations between elements in most cases were not similar between the left and right banks or with the middle part of the river, which means that the sources of the elements were different at different sampling locations. A positive correlation between Pb and Cr along the right and left shores showed that these elements can enter the water environment with fuel combustion products. Larger numbers of pairs of trace elements with high correlation coefficients along the left and, in particular, the right shores of the river indicated anthropogenic sources here—the areas of Listvyanka and Port Baikal settlements (Figure 1). Conversely, smaller numbers of correlations between trace elements in the middle part of the river’s source suggested the effect of the Lake Baikal water mass. Neutralization of pollution coming from anthropogenic areas of the coastal zone resulted from higher discharge in the middle of the river in comparison with a shore location.
The correlation coefficients calculated between the concentrations of each of the trace elements in the water of the right shore, middle part, and left shore at the source of the Angara River were weak for Al, Ni, Cu, Cd, Sn, Cs, and Th, therefore suggesting different sources of trace elements depending on the location. High correlation was found between the left shore and the right shore for Cr (r = 0.96, p < 0.01), between the middle part and the right shore for Co (r = 0.82, p < 0.01), and between the middle part and the left shore for Tl (r = 0.75, p < 0.01) and Mn (r = 0.69, p < 0.05). For Fe concentrations, a stronger relationship is observed between the left shore and the middle of the river (r = 0.87, p < 0.01), and a weaker relationship is found between the middle part and the right shore (r = 0.63, p < 0.05). Within the entire study period, a strong relationship between water trace element concentrations at the source of the river is suggested by correlation coefficients obtained for Zn (r = 0.73 between left and right shores, r = 0.88 between middle part and left shore, r = 0.78 between middle part and right shore, p < 0.01) and Pb (r = 0.84 between left and right shores, r = 0.90 between middle part and left shore, r = 0.96 between the middle part and the right shore, p < 0.01). The correlation coefficients between As concentrations at stations located on left and right shores, middle part and right shore, and middle part and left shore are equal to 0.78 (p > 0.01), 0.74 (p < 0.01), and 0.69 (p < 0.05), respectively. The correlation coefficients between U concentrations at stations located on left and right shores, middle part and left shore, and middle part and right shore are equal to 0.89 (p > 0.01), 0.74 (p < 0.01), and 0.66 (p < 0.05), respectively. Concentrations of As, U, and Zn were similar in the water of the source of the Angara River and that of Lake Baikal (Table 1). In light of this, the identified relationships in the distribution of these elements are most likely related to their common source, i.e., the water mass of the lake. Other sources of these trace elements are less important. The close correlation of Pb concentrations, which are higher compared to Lake Baikal (Table 1), with Cr on the left and right shores (Figure 4) may reflect the anthropogenic component in the formation of the water trace element composition at the source of the Angara River.
3.4. Pollution Assessment on Surface Water
Currently, in Russia, the requirements for the quality of drinking water are based on the maximum permissible concentrations (MPC) of trace elements [26]. Concentrations of all the elements under consideration in the water of both the Angara River source and Lake Baikal are tens, hundreds, or even thousands of times lower than these standards (Table 1). However, these indicators are inappropriate to determine the anthropogenic impact on Lake Baikal, a unique, large, and clean fresh water reservoir. The water quality standards do not take into account specific features in mechanisms of water quality formation, local landscape characteristics, and the behavior of elements of anthropogenic origin in various conditions [52]. Therefore, the choice of the criterion to be used as a control material in calculations is of vital importance. For the Angara River, the generalized hydrochemical characteristics of Lake Baikal, whose indicators are chemical characteristics in the water of the Angara source [12,13], should undoubtedly be used as a control material. Moreover, it is more useful to use the median concentration, which, unlike the mean concentrations, is not sensitive to the outlier measured values.
The pollution indices (CF) calculated for the water of the Angara River source are shown in Table 2. The values of these indices indicate that water samples were mildly or moderately contaminated as follows: all samples by Ni, As, and U; 35 samples by Cd; 34 samples by Mn, Cu, and Th; 33 samples by Al and Th; 32 samples by Cr, Co, Cs, and Sn; 31 samples by Zn; 28 samples by Pb; and 26 samples by Fe. Water samples were highly contaminated as follows: 9 samples by Fe; 5 samples by Zn; 4 samples by Sn; 3 samples by Al and Cs; 2 samples by Mn, Cu, and Tl; and 1 sample by Cd, Pb, and Th. The obtained results revealed very high contamination of the following water samples: taken from the middle part of the river, left and right shores in November 2021, and the middle part of the river in April 2021 by Cr; the right shore in August 2021 by Fe; the right shore in August 2021 and October 2021, left shore in April 2021, and middle part of the river in October 2021 by Co; the right shore in August 2021 by Cs; the middle part in September 2021 by Tl; the middle of the river and left and right shores in September 2021 and November 2021 by Pb; the right shore in January 2022 by Pb; and the right shore in July 2021 by Th.
The NPI index (Figure 5), calculated for the majority of trace elements, classified the water of the Angara River source as clean, fairly clean, or mildly polluted. Moderate pollution was established in the water samples taken along the left shore for concentrations of Mn, Fe, Sn, Cs, and Tl as well as in the samples collected from the middle part for the concentrations of Fe, Zn, Sn, and Cs and from the right shore for concentrations of Al, Zn, and Sn. Heavily polluted water samples were found on the left shore of the river source with high concentrations of Cr, Co, and Pb; in the middle part of the river with high concentrations of Cr, Co, Tl, and Pb; and on the right shore with high concentrations of Cr, Fe, Co, Cs, Pb, and Th. The water in the source of the Angara River was highly polluted, primarily by Pb and Cr, which is likely due to the ferry that runs between the Port Baikal and the Listvyanka settlements.
According to the PLI classification (Figure 6), the majority of water samples can be regarded as having baseline levels of pollutants. The samples from the left shore in August 2021 (1.2), September 2021 (1.9), and November 2021 (1.6); from the middle part in September 2021 (1.9), October 2021 (1.3), November 2021 (1.7), and December 2021 (1.2); and from the right shore in March 2021 (1.1), May 2021 (1.5), July 2021 (1.2), August 2021 (2.8), September 2021 (1.5), November 2021 (1.8), and January 2022 (2.0) can be classified as polluted.
4. Conclusions
The data on concentrations of Al, Cr, Mn, Fe, Co, Ni, Cu, Zn, As, Cd, Sn, Cs, Tl, Pb, Th, and U in the water of the Angara River source showed the consistency of its trace element composition over time. At the same time, local increases in the concentrations of trace elements were established at the mouth of the river in different sampling periods. The study revealed that average concentrations of elements such as Al, Cr, Mn, Fe, Co Cu, Cd, Sn, Cs, Tl, and Pb were higher at the river’s source than those in Lake Baikal. This is likely due to the waters of the Selenga River affecting the water balance in the southern part of the lake. At the same time, it means that more detailed research aimed at studying the trace element composition in southern Lake Baikal is required. The influence of the anthropogenic load in the Listvyanka settlement and water transport activity was mainly observed along the shore of the Angara River source (Listvyanka and Port Baikal settlements).
The concentrations of all trace elements are substantially below the drinking-water quality standards. Therefore, in terms of trace element contents, the water from the Angara River source may be used for drinking without danger to human health. At the same time, the pollution indices showed that the water samples from the source of the Angara River are contaminated with trace elements. This underlines the necessity of taking environmental protection measures aimed at preventing irreversible changes in the reservoir, which is a source of drinking water and a habitat for aquatic organisms, primarily endemic species of Lake Baikal. The results of the study allow for the assessment of and timely response to negative changes in the ecosystems of Lake Baikal and the Angara River.
Supplementary Materials
The following supporting information can be downloaded at: https://www.mdpi.com/article/10.3390/w14213564/s1, Table S1: Trace element concentrations (µg L−1) in the water of Angara River source.
Author Contributions
Conceptualization and methodology, V.I.P. and M.V.P.; investigation and data collection, M.V.P. and P.G.D.; writing—original draft preparation, V.I.P.; writing—review and editing, V.I.P., M.V.P. and P.G.D. All authors have read and agreed to the published version of the manuscript.
Funding
The work was supported by the Ministry of Science and Higher Education of the Russian Federation, the grant No. 075-15-2020-787 (the project “Fundamentals, methods and technologies for digital monitoring and forecasting of the environmental situation on the Baikal natural territory”).
Data Availability Statement
The data presented in this study are available on request from the first author.
Acknowledgments
The author is grateful to Khomutova M. Yu. for editing the English version of the text.
Conflicts of Interest
The authors declare no conflict of interest with the work submitted.
References
- Hussain, J.; Dubey, A.; Hussain, I.; Arif, M.; Shankar, A. Surface water quality assessment with reference to trace metals in River Mahanadi and its tributaries, India. Appl. Water Sci. 2020, 10, 193. [Google Scholar] [CrossRef]
- Sacdal, R.; Montano, M.P.; Espino, M.P. Heavy metals in surface waters of Laguna de Bay, Philippines: Current levels and trends. Limnology 2022, 23, 253–264. [Google Scholar] [CrossRef]
- Ciesielski, T.M.; Pastukhov, M.V.; Leeves, S.A.; Farkas, J.; Lierhagen, S.; Poletaeva, V.I.; Jenssen, B.M. Differential bioaccumulation of potentially toxic elements in benthic and pelagic food chains in Lake Baikal. Environ. Sci. Pollut. Res. 2016, 23, 15593–15604. [Google Scholar] [CrossRef] [PubMed]
- Ngo, H.T.T.; Tran, L.A.T.; Nguyen, D.Q.; Nguyen, T.T.H.; Le, T.T.; Gao, Y. Metal Pollution and Bioaccumulation in the Nhue-Day River Basin, Vietnam: Potential Ecological and Human Health Risks. Int. J. Environ. Res. Public Health 2021, 18, 13425. [Google Scholar] [CrossRef] [PubMed]
- Rahman, M.S.; Akther, S.; Ahmed, A.S.; Saha, N.; Rahman, L.S.; Ahmed, M.K.; Arai, T.; Idris, A.M. Distribution and source apportionment of toxic and trace elements in some benthic and pelagic coastal fish species in Karnaphuli River Estuary, Bangladesh: Risk to human health. Mar. Pollut. Bull. 2022, 183, 114044. [Google Scholar] [CrossRef]
- Rolón, E.; Avigliano, E.; Rosso, J.J.; Tripodi, P.; Bavio, M.; Bidone, C.; Volpedo, A.V. Metals and metalloids in a first order stream of the Atlantic rainforest: Abiotic matrices, bioaccumulation in fishes and human health risk assessment. J. Trace Elem. Med. Biol. 2021, 68, 126866. [Google Scholar] [CrossRef]
- Kumari, P.; Maiti, S.K. Metal(loid) contamination in water, sediment, epilithic periphyton and fish in three interconnected ecosystems and health risk assessment through intake of fish cooked in Indian style. Environ. Sci. Pollut. Res. 2020, 27, 41914–41927. [Google Scholar] [CrossRef]
- Lomonosov, I.S.; Yanovsky, L.M.; Brukhanova, N. Major water quality indicators in Pribaikalye and their influence on man (Report 1). Sib. Med. J. 2009, 86, 110–113. (In Russian) [Google Scholar]
- Vetrov, V.A.; Kuznetsova, A.I.; Sklyarova, O.A. Baseline levels of chemical elements in the water of Lake Baikal. Geogr. Nat. Resour. 2013, 34, 228–238. [Google Scholar] [CrossRef]
- Grebenshchikova, V.I.; Kuzmin, M.I.; Doroshkov, A.A.; Proydakova, O.A.; Tsydypova, S.B. The cyclicity in the changes in the chemical composition of the water source of the Angara River (Baikal Stock) in 2017–2018 in comparison with the last 20 years of data. Environ. Monit. Assess. 2019, 191, 728. [Google Scholar] [CrossRef]
- Khodzher, T.V.; Domysheva, V.M.; Sorokovikova, L.M.; Sakirko, M.V.; Tomberg, I.V. Current chemical composition of Lake Baikal water. Inland Waters 2017, 7, 250–258. [Google Scholar] [CrossRef]
- Koval, P.V.; Udodov, Y.N.; Andrulaitis, L.D.; Gapon, A.E.; Sklyarova, O.A.; Chernigova, S.E. Hydrochemical characteristics of Lake Baikal surface runoff (1997–2003). Dokl. Earth Sci. 2005, 401, 663–667. [Google Scholar]
- Koval, P.V.; Udodov, Y.N.; Andrulaitis, L.D.; San’kov, V.A.; Gapon, A.E. Mercury in the source of the angara river: Fiver-year concentration trend and possible reasons of its variations. Dokl. Earth Sci. 2003, 389, 282–285. [Google Scholar]
- Poletaeva, V.I.; Pastukhov, M.V.; Tirskikh, E.N. Dynamics of Trace Element Composition of Bratsk Reservoir Water in Different Periods of Anthropogenic Impact (Baikal Region, Russia). Arch. Environ. Contam. Toxicol. 2021, 80, 531–545. [Google Scholar] [CrossRef] [PubMed]
- Poletaeva, V.I.; Tirskikh, E.N.; Pastukhov, M.V. Hydrochemistry of sediment pore water in the Bratsk reservoir (Baikal region, Russia). Sci. Rep. 2021, 11, 11124. [Google Scholar] [CrossRef] [PubMed]
- Singh, N.; Sharma, N.; Katnoria, J.K. Monitoring of Water Pollution and Its Consequences: An Overview. Int. J. Environ. Chem. Ecol. Geol. Geophys. Eng. 2014, 8, 133–141. [Google Scholar]
- Zait, R.; Sluser, B.; Fighir, D.; Plavan, O.; Teodosiu, C. Priority Pollutants Monitoring and Water Quality Assessment in the Siret River Basin, Romania. Water 2022, 14, 129. [Google Scholar] [CrossRef]
- Decree of the Government of the Irkutsk Region Dated as 20.10.2017 No. 681-пп. Available online: http://publication.pravo.gov.ru/Document/View/3800201710270001?index=0&rangeSize=1&ysclid=l9xlrvg21o798477361 (accessed on 10 October 2022).
- Glazunov, I.V. Hydrochemical regime and chemical flow of the Angara River. In Hydrochemical Studies of Lake Baikal; Galaziy, G.I., Ed.; Publishing House of the USSR Academy of Sciences: Moscow, Russia, 1963; pp. 57–95. (In Russian) [Google Scholar]
- Galaziy, G.I. Baikal in Questions and Answers; East-Siberian Book Publishing House: Irkutsk, Russia, 1987; 383p. (In Russian) [Google Scholar]
- Hakanson, L. Ecological risk index for aquatic pollution control—A sedimentological approach. Water Resour. 1980, 14, 975–1001. [Google Scholar] [CrossRef]
- Li, L.; Wu, J.; Lu, J.; Li, K.; Zhang, X.; Min, X.; Gao, C.; Xu, J. Water quality evaluation and ecological-health risk assessment on trace elements in surface water of the northeastern Qinghai-Tibet Plateau. Ecotoxicol. Environ. Saf. 2022, 241, 113775. [Google Scholar] [CrossRef]
- Tomlinson, D.L.; Wilson, J.G.; Harris, C.R.; Jeffrey, D.W. Problem in the assessment of heavy metals level in estuaries and the formation of a pollution index. Helgol. Meeresunters. 1980, 33, 566–575. [Google Scholar] [CrossRef] [Green Version]
- Alieva, V.I.; Grebenshchikova, V.I.; Zagorulʹko, N.A. Long-term monitoring and modern methods for studying the microelement composition of the waters of the Angara River. Eng. Ecol. 2011, 3, 24–34. (In Russian) [Google Scholar]
- Sklyarova, O.A. Distribution of trace elements in the water column of middle Baikal. Geogr. Nat. Resour. 2011, 32, 34–39. [Google Scholar] [CrossRef]
- SanPiN 2.1.4.1074-01. Drinking Water. Hygienic Requirements for Water Quality of Centralized Drinking Water Supply Systems. Quality Control. Hygienic Requirements for Provision of Safety of Hot Water Supply Systems. Available online: https://eng-eco.ru/upload/iblock/f62/f62518fef27847ef31fcc40c3543b2a5.pdf?ysclid=la3vlohsvo290255052 (accessed on 10 October 2022).
- Kasimov, N.S.; Lychagin, M.Y.; Chalov, S.R.; Shinkareva, G.L.; Pashkina, M.P.; Romanchenko, A.O.; Promakhova, E.V. Catchment based analysis of matter flows in the Selenga-Baikal system. Mosc. Univ. Bull. Ser. 5 Geogr. 2016, 3, 67–80. (In Russian) [Google Scholar]
- Giri, S.; Singh, A.K. Assessment of Surface Water Quality Using Heavy Metal Pollution Index in Subarnarekha River, India. Water Qual. Expo. Health 2014, 5, 173–182. [Google Scholar] [CrossRef]
- Varol, M. Arsenic and trace metals in a large reservoir: Seasonal and spatial variations, source identification and risk assessment for both residential and recreational users. Chemosphere 2019, 228, 1–8. [Google Scholar] [CrossRef] [PubMed]
- Simonov, V.G. (Ed.) Resources of Surface Waters of the USSR; Angara-Yenisei Region; Gidrometeoizdat: Leningrad, Russia, 1972; 594p. [Google Scholar]
- Varol, M. Dissolved heavy metal concentrations of the Kralkızı, Dicle and Batman dam reservoirs in the Tigris River basin, Turkey. Chemosphere 2013, 93, 954–962. [Google Scholar] [CrossRef]
- Kalaivani, T.R.; Dheenadayalan, M.S. Seasonal fluctuation of Heavy Metal Pollution in Surface water. Int. Res. J. Environ. Sci. 2013, 2, 66–73. [Google Scholar]
- An, Q.; Wu, Y.; Wang, J.; Li, Z. Assessment of dissolved heavy metal in the Yangtze River estuary and its adjacent sea, China. Environ. Monit. Assess. 2010, 164, 173–187. [Google Scholar] [CrossRef]
- Jeong, H.; Choi, J.Y.; Lim, J.; Shim, W.J.; Kim, Y.O.; Ra, K. Characterization of the contribution of road deposited sediments to the contamination of the close marine environment with trace metals: Case of the port city of Busan (South Korea). Mar. Pollut. Bull. 2020, 161, 111717. [Google Scholar] [CrossRef]
- Gunawardana, C.; Goonetilleke, A.; Egodawatta, P.; Dawes, L.; Kokot, S. Source characterisation of road dust based on chemical and mineralogical composition. Chemosphere 2012, 87, 163–170. [Google Scholar] [CrossRef] [Green Version]
- Wang, Q.; Zhang, Q.; Wu, Y.; Wang, X.C. Physicochemical conditions and properties of particles in urban runoff and rivers: Implications for runoff pollution. Chemosphere 2017, 173, 318–325. [Google Scholar] [CrossRef] [PubMed]
- Suturin, A.N.; Chebykin, E.P.; Malnik, V.V.; Khanaev, I.V.; Minaev, A.V.; Minaev, V.V. The role of anthropogenic factors in the development of ecological stress in Lake Baikal littoral (the Listvyanka settlement lakescape). Geogr. I Prir. Resur. 2016, 6, 43–54. (In Russian) [Google Scholar]
- Vorobyeva, I.B.; Naprasnikova, E.V.; Vlasova, N.V. Ecological and geochemical features of snow, ice and under-ice water in the southern part of Lake Baikal. Geoekologiya Inzheneraya Geol. Gidrogeol. Geokriol. 2009, 1, 54–60. (In Russian) [Google Scholar]
- Yanchuk, M.S.; Vorobyova, I.B.; Vlasova, N.V. Geoecological assessment of snow and ice on the southern coast of the Baikal Lake. Proc. Voronezh State Univ. Ser. Geogr. Geoecol. 2021, 3, 59–68. [Google Scholar] [CrossRef]
- Belozertseva, I.A.; Vorobyeva, I.B.; Vlasova, N.V.; Lopatina, D.N.; Yanchuk, M.S. Snow pollution in Lake Baikal water area in nearby land areas. Water Resour. 2017, 44, 471–484. [Google Scholar] [CrossRef]
- Soroldoni, S.; Castro, Í.B.; Abreu, F.; Duarte, F.A.; Choueri, R.B.; Möller, O.O., Jr.; Fillmann, G.; Pinho, G.L.L. Antifouling paint particles: Sources, occurrence, composition and dynamics. Water Res. 2018, 137, 47–56. [Google Scholar] [CrossRef] [PubMed]
- Sippula, O.; Hokkinen, J.; Puustinen, H.; Yli-Pirilä, P.; Jokiniemi, J. Comparison of particle emissions from small heavy fuel oil and wood-fired boilers. Atmos. Environ. 2009, 43, 4855–4864. [Google Scholar] [CrossRef]
- Jang, H.N.; Seo, Y.C.; Lee, J.H.; Hwang, K.W.; Yoo, J.I.; Sok, C.H.; Kim, S.H. Formation of fine particles enriched by V and Ni from heavy oil combustion: Anthropogenic sources and drop-tube furnace experiments. Atmos. Environ. 2007, 41, 1053–1063. [Google Scholar] [CrossRef]
- Pikovsky, Y.I. Natural and Technogenic Flows of Hydrocarbons in the Environment; MSU Publishing House: Moscow, Russia, 1993; 207p. (In Russian) [Google Scholar]
- Hutton, M.; Symon, C. The quantities of cadmium, lead, mercury and arsenic entering the U.K. environment from human activities. Sci. Total Environ. 1986, 57, 129–150. [Google Scholar] [CrossRef]
- Wang, X.; Liu, L.; Zhao, L.; Xu, H.; Zhang, X. Assessment of dissolved heavy metals in the Laoshan Bay, China. Mar. Pollut. Bull. 2019, 149, 110608. [Google Scholar] [CrossRef]
- Caballero-Gallardo, K.; Alcala-Orozco, M.; Barraza-Quiroz, D.; De la Rosa, J.; Olivero-Verbel, J. Environmental risks associated with trace elements in sediments from Cartagena Bay, an industrialized site at the Caribbean. Chemosphere 2020, 242, 125173. [Google Scholar] [CrossRef]
- Obhođaš, J.; Valković, V. Contamination of the coastal sea sediments by heavy metals. Appl. Radiat. Isot. 2010, 68, 807–811. [Google Scholar] [CrossRef] [PubMed]
- Godson, P.S.; Magesh, N.S.; Peter, T.S.; Chandrasekar, N.; Krishnakumar, S.; Vincent, S.G.T. A baseline study on the concentration of trace elements in the surface sediments off Southwest coast of Tamil Nadu, India. Mar. Pollut. Bull. 2018, 126, 381–388. [Google Scholar] [CrossRef] [PubMed]
- Prygiel, E.; Billon, G.; François, A.; Dumoulin, D.; Chaumot, A.; Geffard, O.; Criquet, J.; Prygiel, J. Active biomonitoring for assessing effects of metal polluted sediment resuspension on gammarid amphipods during fluvial traffic. Environ. Pollut. 2016, 218, 129–139. [Google Scholar] [CrossRef] [PubMed]
- Tian, Y.; Wen, Z.; Cheng, M.; Xu, M. Evaluating the water quality characteristics and tracing the pollutant sources in the Yellow River Basin, China. Sci. Total Environ. 2022, 846, 157389. [Google Scholar] [CrossRef] [PubMed]
- Moiseyenko, T.I.; Gashev, S.N.; Shalabodov, A.D. Water quality and ecosystem stability: Theoretical and practical aspects of research. Tyumen State Univ. Her. 2012, 12, 4–13. [Google Scholar]
Figure 1.
Study area and sampling points in the water of Angara River source.

Figure 2.
Trace element concentrations (µg L−1) in water of the Angara River source (3—March 2021, 4—April, 5—May, 6—June, 7—July, 8—August, 9—September, 10—October, 11—November, 12—December; 1—January, 2—February 2022).
Figure 2.
Trace element concentrations (µg L−1) in water of the Angara River source (3—March 2021, 4—April, 5—May, 6—June, 7—July, 8—August, 9—September, 10—October, 11—November, 12—December; 1—January, 2—February 2022).


Figure 3.
Statistical distribution of trace element concentrations in the water of Angara River source (L, concentrations of trace elements in the lowest water stage; H, concentrations of trace elements in the highest water stage. Black squares represent mean values; whiskers represent maximum and minimum values).

Figure 4.
Statistically significant correlations between concentrations of trace elements in the water of the Angara River source.
Figure 4.
Statistically significant correlations between concentrations of trace elements in the water of the Angara River source.

Figure 5.
Nemerow pollution index (NPI) in water of the Angara River source.

Figure 6.
Pollution load index (PLI) in water of Angara River source (3—March 2021, 4—April, 5—May, 6—June, 7—July, 8—August, 9—September, 10—October, 11—November, 12—December; 1—January, 2—February 2022).
Figure 6.
Pollution load index (PLI) in water of Angara River source (3—March 2021, 4—April, 5—May, 6—June, 7—July, 8—August, 9—September, 10—October, 11—November, 12—December; 1—January, 2—February 2022).


Table 1.
Trace element concentrations (µg L−1) in the water of Angara River source.
| Al | Cr | Mn | Fe | Co | Ni | Cu | Zn | References | ||
|---|---|---|---|---|---|---|---|---|---|---|
| Source of the Angara River | Left shore | 2.19 ± 1.63 * | 0.15 ± 0.22 | 3.49 ± 3.93 | 4.22 ± 4.93 | 0.020 ± 0.023 | 0.22 ± 0.03 | 0.49 ± 0.28 | 3.47 ± 2.52 | Present study |
| 0.90–6.09 | <DL–0.80 | 0.16–12.57 | 0.88–16.90 | <DL–0.082 | 0.17–0.28 | 0.23–1.29 | 1.07–9.09 | |||
| Middle part | 1.99 ± 0.91 | 0.21 ± 0.28 | 3.10 ± 2.28 | 1.18 ± 13.05 | 0.022 ± 0.024 | 0.34 ± 0.13 | 0.77 ± 0.34 | 4.51 ± 3.22 | ||
| 1.05–4.22 | 0.06–1.00 | 0.71–7.69 | 4.25–4.03 | 0.007–0.079 | 0.16–0.57 | 0.34–1.43 | 1.32–11.14 | |||
| Right shore | 3.72 ± 2.89 | 0.15 ± 0.12 | 4.54 ± 3.35 | 8.79 ± 6.63 | 0.028 ± 0.029 | 0.30 ± 0.17 | 0.83 ± 0.58 | 5.75 ± 4.83 | ||
| 1.34–10.58 | 0.05–0.49 | 0.50–10.21 | 1.14–19.84 | <DL–0.087 | 0.18–0.68 | 0.29–2.10 | 0.90–15.05 | |||
| Median | 1.86 | 0.08 | 2.72 | 2.96 | 0.013 | 0.24 | 0.56 | 3.02 | ||
| Source of the Angara River | <DL–24.23 * 3.89 | 0.05–0.61 0.12 | <DL–18.8 2.93 | <DL–117.0 18.8 | <DL–0.047 0.011 | 0.09–0.78 0.25 | 0.13–2.52 0.62 | <DL–11.13 2.11 | [24] | |
| Middle Baikal | 0.34–1.15 | 0.07 | 0.06–0.33 | 0.26–1.12 | 0.003 | 0.14 | 0.16–0.25 | 0.24–0.56 | [25] | |
| Lake Baikal | 0.1–1.0 0.38 | 0.03–0.09 0.07 | 0.01–0.53 0.13 | 0.1–1.6 0.38 | 0.002–0.005 0.003 | 0.1–0.5 0.2 | 0.2–1.0 0.21 | 0.4–4.3 3.2 | [9] | |
| MPC | 500 | 50 | 100 | 300 | 100 | 100 | 1000 | 5000 | [26] | |
| As | Cd | Sn | Cs | Tl | Pb | Th | U | References | ||
| Source of the Angara River | Left shore | 0.40 ± 0.06 | 0.023 ± 0.008 | 0.024 ± 0.017 | 0.0025 ± 0.0022 | 0.0015 ± 0.0012 | 0.22 ± 0.40 | 0.0007 ± 0.0002 | 0.53 ± 0.04 | Present study |
| 0.30–0.50 | 0.012–0.039 | <DL–0.053 | 0.0010–0.0079 | 0.0008–0.0052 | 0.02–1.34 | <DL–0.0010 | 0.47–0.60 | |||
| Middle part | 0.42 ± 0.11 | 0.024 ± 0.007 | 0.024 ± 0.007 | 0.0020 ± 0.0015 | 0.0025 ± 0.0025 | 0.26 ± 0.42 | 0.0009 ± 0.0002 | 0.53 ± 0.04 | ||
| 0.25–0.65 | 0.014–0.039 | <DL–0.054 | 0.0010–0.0060 | 0.0008–0.0081 | <DL–1.15 | <DL–0.0011 | 0.44–0.63 | |||
| Right shore | 0.39 ± 0.07 | 0.032 ± 0.028 | 0.024 ± 0.015 | 0.0026 ± 0.0026 | 0.0015 ± 0.0006 | 0.34 ± 0.42 | 0.0052 ± 0.0104 | 0.52 ± 0.04 | ||
| 0.29–0.52 | 0.015–0.113 | <DL–0.053 | 0.0012–0.0100 | 0.0007–0.0025 | <DL–1.13 | <DL–0.0265 | 0.48–0.59 | |||
| Median | 0.40 | 0.022 | 0.012 | 0.0016 | 0.0013 | 0.08 | 0.0005 | 0.53 | ||
| Source of the Angara River | <DL–0.98 0.46 | <DL–0.024 0.011 | <DL–0.160 0.028 | 0.0009–0.0036 0.0016 | <DL–0.182 0.0370 | <DL–0.29 0.05 | <DL–0.065 0.0014 | 0.09–0.76 0.58 | [24] | |
| Middle Baikal | 0.40–0.41 | 0.008 | <0.011 | 0.0017 | 0.0004 | 0.010–0.036 | 0.0006 | 0.52 | [25] | |
| Lake Baikal | 0.3–0.5 0.40 | 0.001–0.010 0.008 | <0.01–0.04 <0.01 | 0.002–0.008 0.0013 | 0.0005–0.0010 ≤0.0005 | <0.02 | 0.002–0.020 0.004 | 0.4–0.7 0.55 | [9] | |
| MPC | 50 | 1 | – | – | 0.1 | 30 | – | – | [26] | |
Note(s): * Numerator—minimum concentration–maximum concentration; denominator—average concentration.
Table 2.
Pollution indices CF in the water of Angara River source (March 2021–February 2022).
| Element | Left Shore | Middle Part | Right Shore |
|---|---|---|---|
| Al | 0.5–3.3 * | 0.6–2.3 | 0.6–5.7 |
| Cr | 0.5–10.0 | 0.8–12.6 | 0.6–6.1 |
| Mn | 0.1–4.6 | 0.3–2.8 | 0.0–3.8 |
| Fe | 0.3–5.7 | 0.4–4.4 | 0.4–6.7 |
| Co | 0.5–6.3 | 0.1–6.1 | 0.1–6.7 |
| Ni | 0.7–1.2 | 0.7–2.4 | 0.8–2.8 |
| Cu | 0.4–2.3 | 0.6–2.6 | 0.5–3.7 |
| Zn | 0.4–3.0 | 0.4–3.7 | 0.3–5.0 |
| As | 0.7–1.3 | 0.6–1.6 | 0.7–1.6 |
| Cd | 0.5–1.8 | 0.6–1.8 | 0.7–5.1 |
| Sn | 0.0–4.4 | 0.2–4.5 | 0.1–4.4 |
| Cs | 0.6–4.9 | 0.7–3.8 | 0.7–6.3 |
| Tl | 0.6–4.0 | 0.6–6.2 | 0.5–1.9 |
| Pb | 0.2–16.8 | 0.2–14.4 | 0.1–14.1 |
| Th | 0.5–2.0 | 0.1–2.1 | 0.2–53.0 |
| U | 0.9–1.1 | 0.8–1.2 | 0.9–1.2 |
Note(s): * Minimum–maximum value.
Publisher’s Note: MDPI stays neutral with regard to jurisdictional claims in published maps and institutional affiliations. |
© 2022 by the authors. Licensee MDPI, Basel, Switzerland. This article is an open access article distributed under the terms and conditions of the Creative Commons Attribution (CC BY) license (https://creativecommons.org/licenses/by/4.0/).
Share and Cite
MDPI and ACS Style
Poletaeva, V.I.; Pastukhov, M.V.; Dolgikh, P.G. Trace Element Compositions and Water Quality Assessment in the Angara River Source (Baikal Region, Russia). Water 2022, 14, 3564. https://doi.org/10.3390/w14213564
AMA Style
Poletaeva VI, Pastukhov MV, Dolgikh PG. Trace Element Compositions and Water Quality Assessment in the Angara River Source (Baikal Region, Russia). Water. 2022; 14(21):3564. https://doi.org/10.3390/w14213564
Chicago/Turabian StylePoletaeva, Vera I., Mikhail V. Pastukhov, and Pavel G. Dolgikh. 2022. "Trace Element Compositions and Water Quality Assessment in the Angara River Source (Baikal Region, Russia)" Water 14, no. 21: 3564. https://doi.org/10.3390/w14213564
Note that from the first issue of 2016, this journal uses article numbers instead of page numbers. See further details here.