
Effects of Rice Husk Biochar on Nitrogen Leaching from Vegetable Soils by 15N Tracing Approach


1
School of Environmental Science, Nanjing Xiaozhuang University, Nanjing 211171, China
2
National-Regional Joint Engineering Research Center for Soil Pollution Control and Remediation in South China, Guangdong Key Laboratory of Integrated Agro-Environmental Pollution Control and Management, and Institute of Eco-Environmental and Soil Sciences, Guangdong Academy of Sciences, Guangzhou 510650, China
*
Author to whom correspondence should be addressed.
Water 2022, 14(21), 3563; https://doi.org/10.3390/w14213563
Submission received: 9 September 2022
/
Revised: 31 October 2022
/
Accepted: 1 November 2022
/
Published: 5 November 2022
(This article belongs to the Section Soil and Water)
Abstract
:The application of biochar can affect soil properties and retention of fertilizer nitrogen, but its effects and mechanism on the retention capacity of different forms of nitrogen in soils are still uncertain. In this study, an indoor soil column leaching experiment was conducted using vegetable soil samples with 3% rice husk biochar by mass prepared at 450 °C by pyrolysis and 150 mg N/kg 15N-labeled urea. Adding biochar increased the soil pH, thus alleviating soil acidification caused by fertilizer nitrogen application. It also increased the content of soil organic carbon, total nitrogen and available phosphorus while decreasing that of NH4+-N and NOX−-N(NO3−-Nand NO2−-N) in soils. NOX−-N was the predominant form in the leachate of all treatments, accounting for 63.15–87.90% of the total N loss. Compared to the urea-alone application (the N treatment), incorporating biochar and urea (the RBN treatment) significantly reduced total N and NOX−-N loss by 19.99% and 25.95%, respectively, while showing slight effects on NH4+-N loss. The 15N results show that fertilizer N retention in soil increased by 13.67%, while inorganic 15N leaching decreased by 25.97% after the biochar addition, compared to that in the N treatment. The RBN treatment increased fertilizer N losses in other ways (e.g., organic N leaching, ammonia and NOx volatilization) by 21.72%. Effects of biochar application on other N losses need to be further investigated. Biochar application can reduce the leaching of inorganic 15N and improve fertilizer N retention in the soil. Thus, the potential risk of fertilizer N on the quality of water bodies can be reduced.
1. Introduction
The excessive application of fertilizer nitrogen (N) in agricultural activities has caused the leaching of N from soils, leading to potential surface and groundwater pollution [1,2]. Due to the high intensity of N fertilizer application with a low utilization rate in vegetable field soils, a large amount of unused N may enter rivers, lakes and groundwater through surface runoff and soil percolation under rainfall or irrigation conditions, degrading water quality or even causing eutrophication [3,4]. Therefore, how to improve the soil management measures and reduce the loss of N leaching and the risk of environmental pollution are urgent problems in the field of soil ecosystem and environmental protection.
Biochar is a highly aromatic carbonaceous solid material produced through high-temperature pyrolysis of agricultural and forestry biomass (e.g., straw and wood sawdust) under anaerobic or anoxic conditions [5,6]. Due to abundant pore structure and high specific surface area, biochar is a good adsorbent and amendment [7,8]. Biochar provides multifunctional applications, including improving the water and nutrient retention capacity of soils [9,10], fixing organic carbon [11] and reducing greenhouse gas emissions, etc. [12,13]. Biochar produced by straw or wood chips can adsorb NH4+-N and NO3−-N from soils and reduce soil N leaching and the environmental impact of N on water bodies [14,15]. The sugarcane bagasse biochar prepared at different pyrolysis temperatures can adsorb NH4+-N in soils, and the adsorption effect increases with the increase of pyrolysis temperatures [16,17]. Wheat straw biochar can significantly reduce NO3−-N leaching from soils while not affecting the NH4+-N leaching [18]. Brazilian pepper wood and peanut hull biochar application reduced both NH4+-N and NO3−-N leaching in sandy soil [19]. However, some research reports that biochar application resulted in significant increases in the concentration of NH4+-N and NO3−-N and a greater nutrient leaching from the soil [20,21]. Therefore, the effect of biochar application on the fertilizer retention capacity of soils should be studied before large-scale application of a certain type of biochar.
Rice is a staple food in most Asian countries, and about 140 million tons of rice husk is annually produced [22,23]. The application of biochar produced by rice husk in soil agroecosystems allows for the recycling of agricultural waste [24,25]. Many studies have indicated that biochar affected N fertilizer leaching and retention in soil [26]. The amount of fertilizer N retained in soils and leached from soils can be measured using 15N tracing experiments [17,27]. Currently, the effects of biochar on the leaching and retention of N fertilizer from agricultural soils have been rarely studied using 15N tracing experiments. In this study, soil column leaching experiments were adopted to study the effects of biochar on the morphological transformation, leaching and retention of N fertilizer in vegetable field soils with the rice rusk biochar and 15N-labeled urea applied. The results will provide a theoretical basis for assessing the potential effect of biochar on the retention of fertilizer N in soils and inhibition of water body contamination.
2. Materials and Methods
2.1. Soil, Biochar and Nitrogen Fertilizer
The soil for this study was collected from the 0–15 cm topsoil of a vegetable field in a suburban area of Nanjing (31°54′ N 118°52′ E), China, which belongs to a subtropical region. Leafy vegetables and garlic are grown all year round in this field. The soil samples were air-dried, sieved through a 2 mm screen and stored at room temperature.
The biochar was purchased from Qinfeng Zhongcheng Biomass New Material Co., Ltd. (Nanjing, China), and was prepared by pyrolysis of rice husk at 450 °C under anaerobic conditions for 1 h. 15N-labeled urea (10.16 atom% 15N) was purchased from Shanghai Research Institute of Chemical Industry (Shanghai, China).
2.2. Preparation of Soil Columns
Four treatments of soil for leaching were set up by the biochar and 15N-labeled urea thoroughly mixed with the collected vegetable soil at application rates: control (CK), 3% biochar (RB, 67.5 tons/ha), 150 mg N/kg 15N-labeled urea (722.7 kg/ha urea) and 3% biochar and 150 mg N/kg 15N-labeled urea (RBN). Each treatment was performed with three replicates.
The experimental apparatus for soil column leaching is shown in Figure 1. A PVC cylindrical pipe was used to prepare the leaching soil column, with a height × diameter of 30 cm × 6 cm. The bottom of the column was fixed with a punched porous circular plate. Firstly, a nylon net was placed on the perforated circular plate at the bottom of the column and then filled with a thickness of about 2 cm of quartz sand. The quartz sand had been soaked in dilute hydrochloric acid for 24 h and repeatedly washed and dried with distilled water. Then, a qualitative filter paper was added to prevent soil particle migration. Next, 650 g of the soil with the above treatment was uniformly filled, with a height of 20 cm and a unit weight of 1.15 g/cm3. Another nylon net was added to the top of the soil column, and then quartz sand was filled with a thickness of about 2 cm.
2.3. Incubation and Leaching of Soil Columns
Deionized water was added to the soil, and the soil water content was adjusted to 70% of the water-holding capacity of the soil. After one day of equilibrium, infusion equipment was used to simulate rainfall. Deionized water was used to leach the soil at room temperature (5–10 °C) on Days 1, 3, 5, 7, 14, 21, 28, 35 and 42, respectively. Leaching was conducted a total of nine times, and 150 mL of deionized water was used for each leaching. The leachate was collected from the leaky holes at the bottom of each PVC tube with a clean and dried beaker, weighed immediately after each collection and converted to volume. Next, the leachate was put into washed and dried plastic bottles and stored in the refrigerator at −18 °C. Then, the solution was kept to determine the total N, ammonia N and nitrate N contents in the filtrate.
After the soil column leaching experiment, the soil in the PVC tube was removed and uniformly mixed. Part of the soil was refrigerated at 4 °C and the other part was shade-dried.
2.4. Chemical Analysis
Soil pH and biochar pH were determined in a 1:2.5 soil/water (w/v) and 1:10 biochar/water (w/v) mixture by a pH detector (Leici Ltd., Shanghai, China), respectively. Cation exchange capacity (CEC) of soil and biochar was extracted with 0.005 mol L−1 EDTA and 1 mol L−1 ammonium acetate (pH 7) and determined using the semi-micro Kjeldahl procedure. Soil organic carbon (SOC) was measured by wet digestion with H2SO4-K2Cr2O7. Available phosphorus was determined using the Olsen extract [28]. Total nitrogen (TN) of soil was measured using the combustion method with a FlashEA 1112 elemental analyzer (Thermo Finnigan, San Francisco, U.S.A). Inorganic N in soil was extracted for 1 h using 2.0 mol L−1 KCl (1:5 w/v). The concentrations of TN, NH4+-N and NOx−-N in four treatment leachates and KCl extract soil solution were determined by continuous flow analysis (Skalar SAN++,Delft, Netherlands). The NH4+-N and NOx−-N in the N and RBN treatment leachates were separated by micro-diffusion with MgO and Devarda’s alloy and absorption by oxalic acid for determining the isotopic compositions [29], and the isotopic compositions were determined using an isotope ratio mass spectrometer (Europa Scientific Integra, Crewe, UK).
2.5. Calculation and Statistical Analysis
Concentration of organic nitrogen (ON) in leachate was determined by calculating the difference between the concentration of TN and NH4+-N and NOx−-N. The losses of TN, NH4+-N and NOx−-N were their concentration in individual leachate multiplied by leachate volume, respectively. Cumulative inorganic 15N leached (mg) = sum of inorganic N leached (mg N) × atom % 15N excess in individual leachate. 15N retained in soil (mg) = total N content in soil (mg) × atom % 15N excess in soil. The recovery 15N (mg) = cumulative inorganic 15N leached (mg) + 15N retained in soil (mg). The other losses for 15N were calculated by the difference between the total 15N added and the recovery 15N.
Statistical analysis was performed using SPSS Statistics 19.0. All of the results were expressed as mean ± standard errors. The differences between mean values under different treatments were identified using LSD test, and p ≤ 0.05 was considered statistically significant.
3. Results
3.1. Properties of Tested Soils and Biochar Materials
Table 1 shows the properties of soil samples and biochar materials. According to the soil nutrient classification standard of the second soil census of China, the soil organic matter content, total N content and available phosphorus (Ava. P) content were in the middle-upper level, while the soil NH4+-N and NOx−-N contents were in the lower level. The tested biochar showed alkalinity with a pH of 9.85, high total organic carbon and TN content, low CEC and large specific surface area. The previous study indicated that there were functional groups such as -OH, C=O, -COO- and C-O-C in the biochar [30].
3.2. Effects of Different Treatments on Soil Chemical Properties
In Table 2, compared with the CK treatment, the RB treatment increased soil pH by 0.34 and increased the content of total organic carbon, total N and Ava. P content by 114.22%, 17.21% and 45.51%, respectively, while reducing NH4+-N and NOx−-N contents by 11.45% and 13.61%, respectively. The N treatment decreased soil pH by 0.32; the soil had the highest NH4+-N and NOx−-N contents, i.e., 1.77 and 2.46 mg kg−1, respectively; the NOx−-N content was significantly different from other treatments. The RBN treatment increased soil pH, inhibited soil acidification caused by urea fertilizer application and reduced NH4+-N and NOx−-N contents.
3.3. Nitrogen Concentration and Loss in Leachate
3.3.1. NH4+-N Concentration and Loss in Leachate
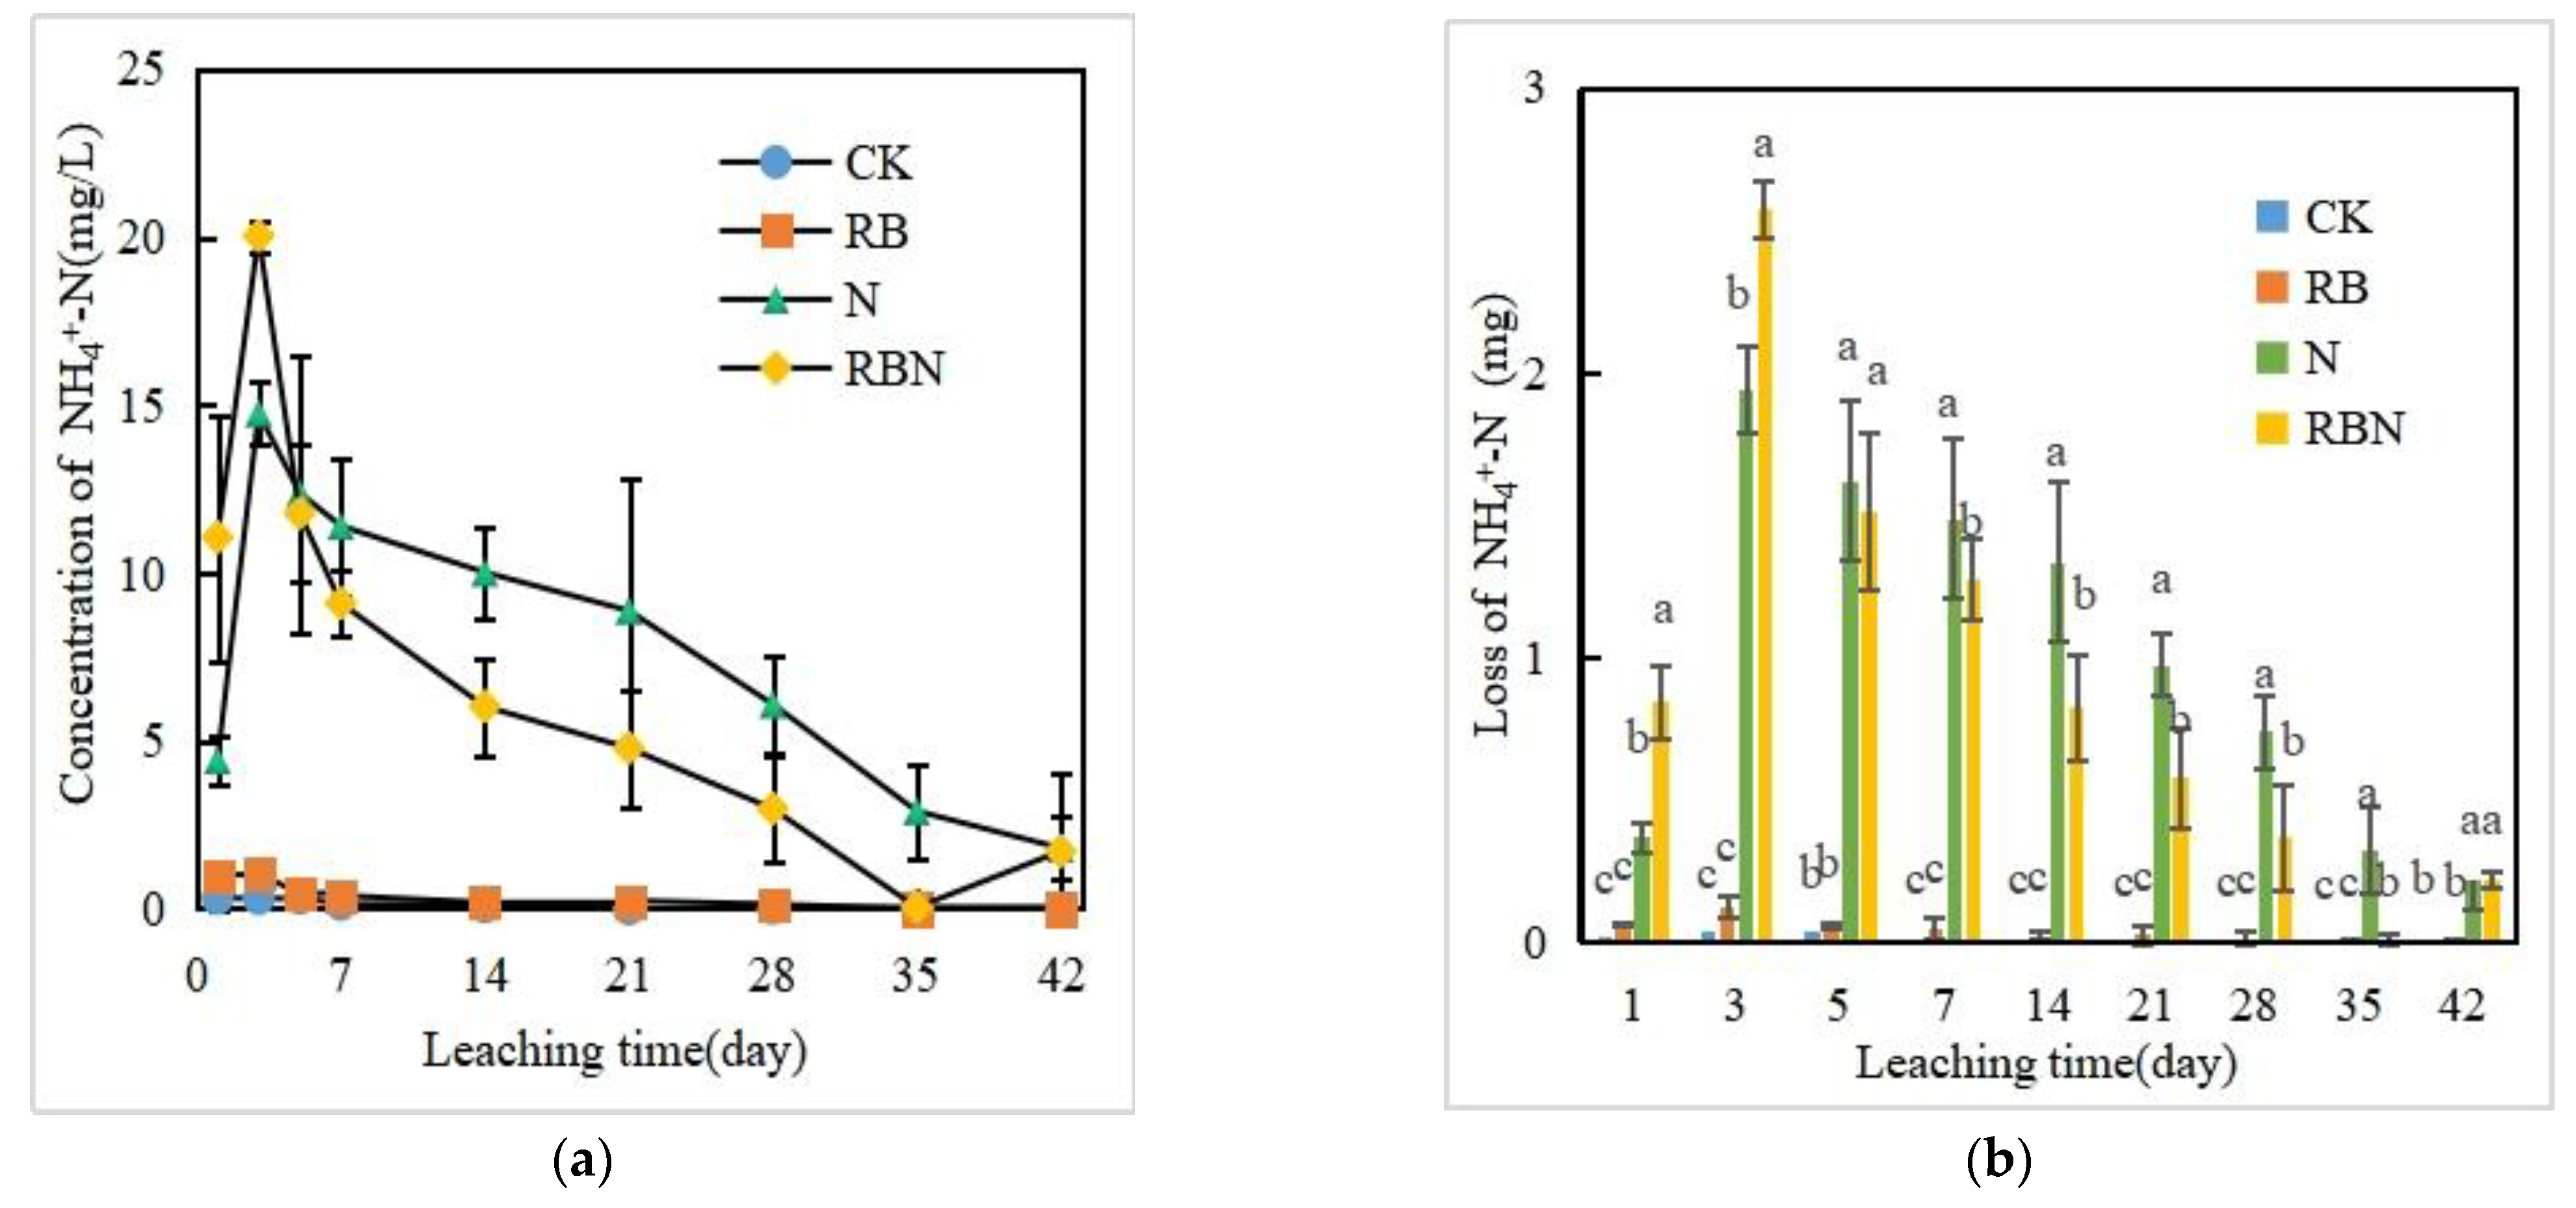
The NH4+-N concentration and the leaching loss in the CK and RB treatments were low and did not vary significantly (Figure 2). The N treatment significantly increased the NH4+-N concentration and the leaching loss. The NH4+-N concentration and the leaching loss in the N treatment reached the maximum in the second leaching (i.e., 14.76 mg/L and 1.94 mg) and then decreased. In the first two times of leaching, the NH4+-N concentrations and the leaching losses were significantly higher in the RBN treatment than in the N treatment, while showing a lower value in the remaining leaching. In the seven times of leaching, there were significant differences in the leaching loss between N and RBN treatments.
3.3.2. NOx−-N Concentration and Loss in Leachate
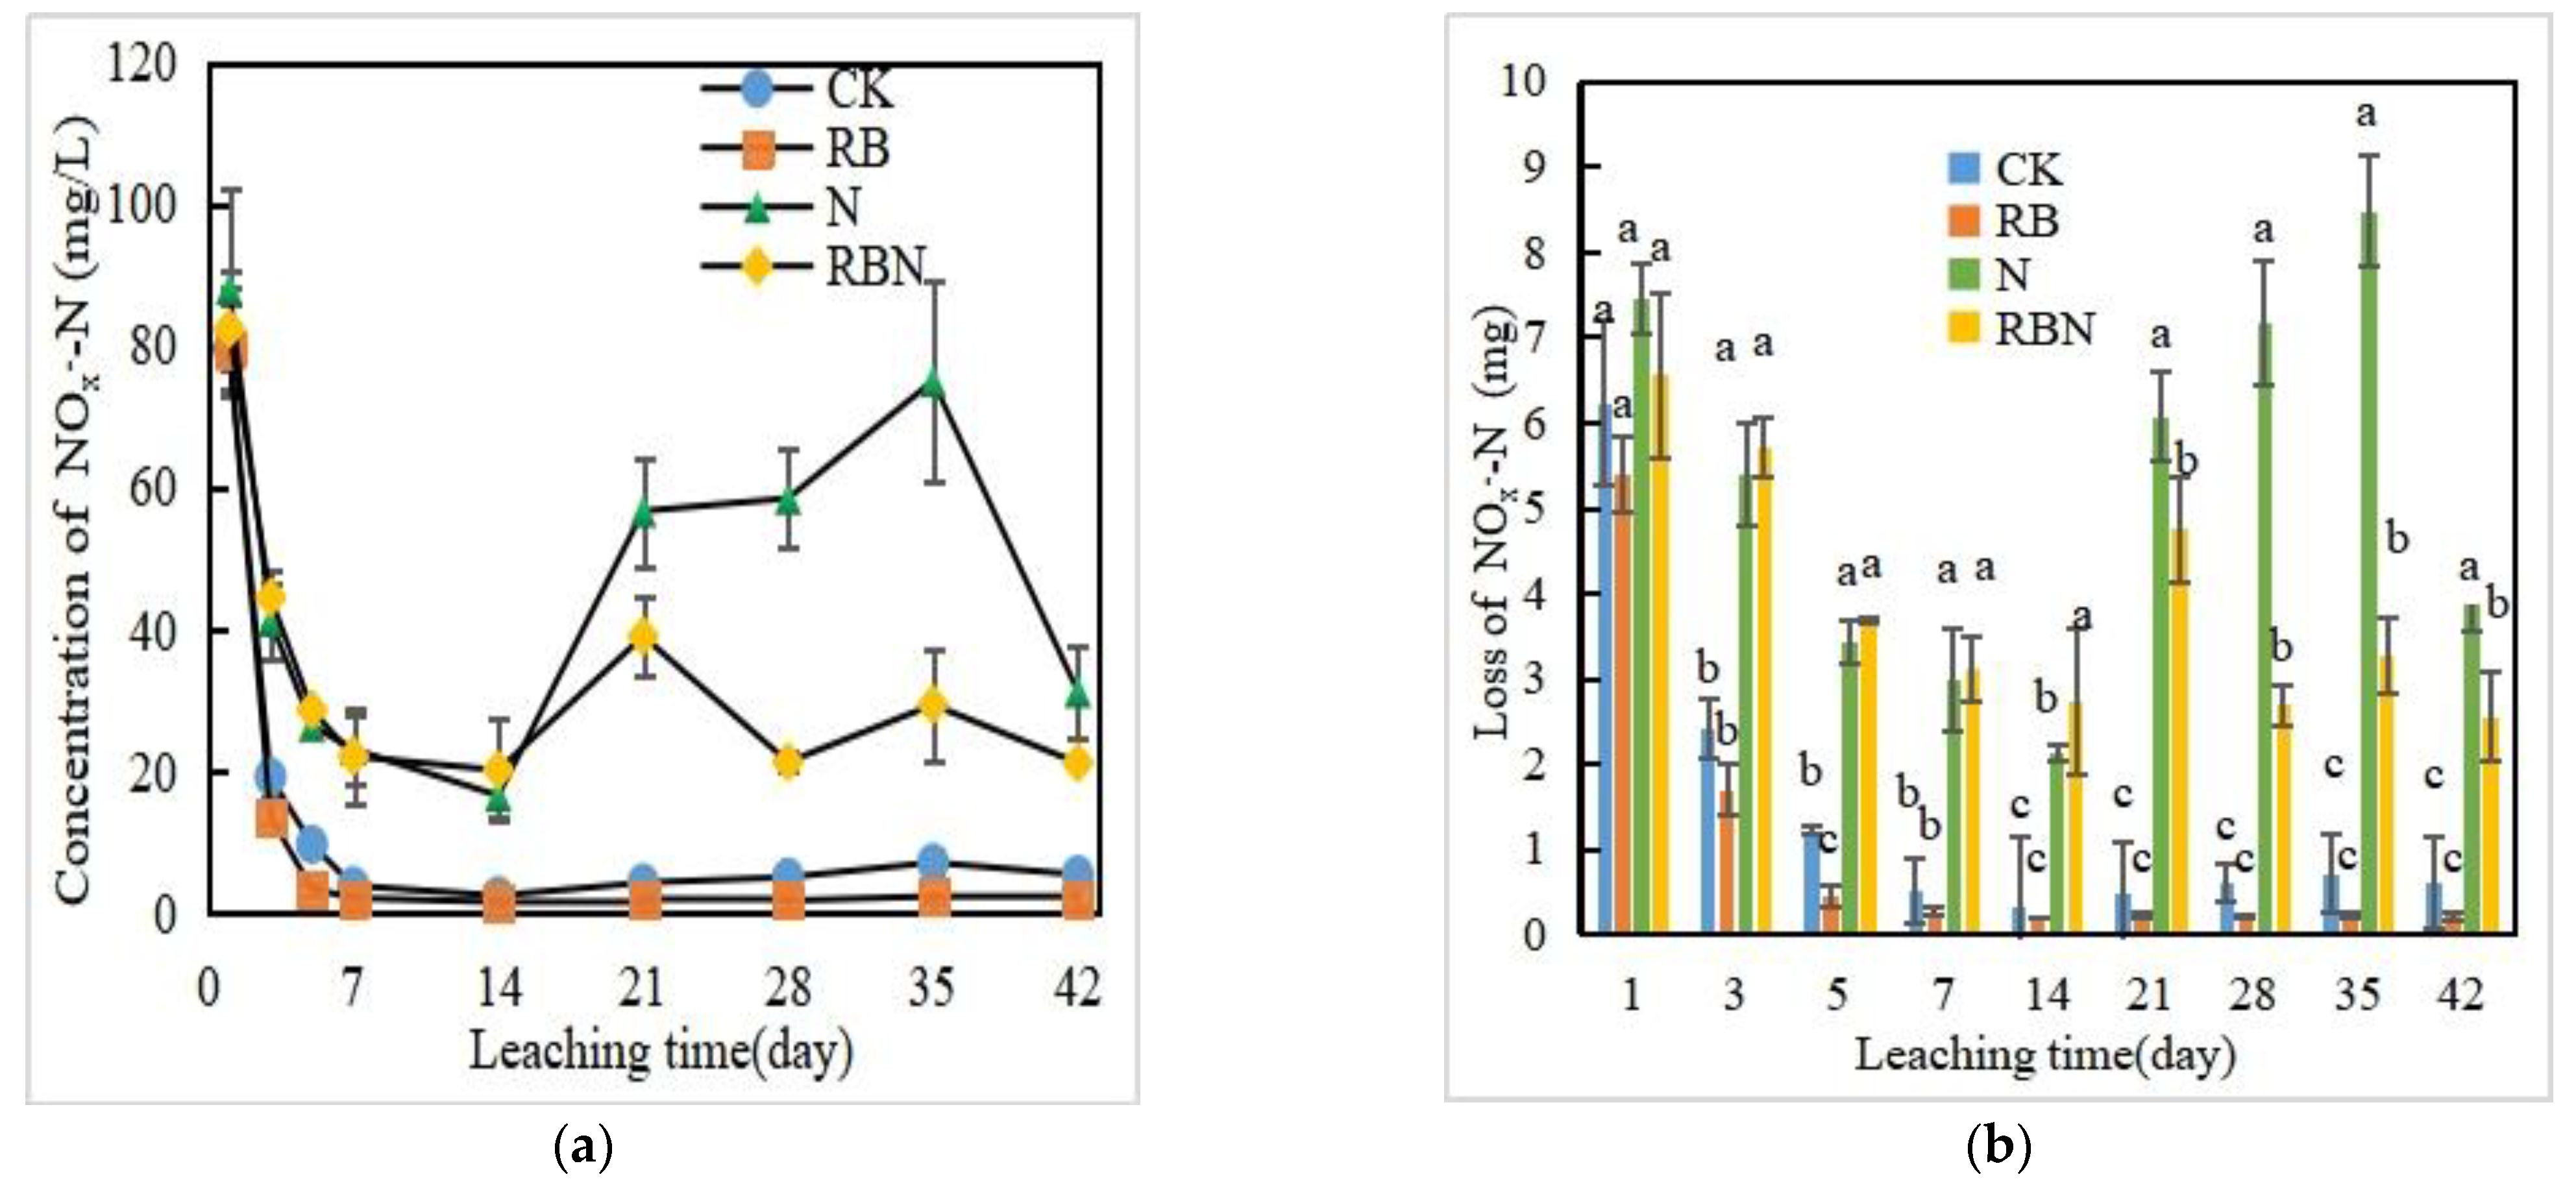
The concentrations of NOx−-N (consisting of NO3−-N and a small amount of NO2−-N) in the leachate of all four treatments were 79.5–88.1 mg/L in the first flushing event (Figure 3). The leaching losses ranged from 5.41 to 7.46 mg, and the N treatment showed the highest loss. In the subsequent leaching, the NOx−-N concentration decreased in the CK and RB treatments and was lower in the leaching after Day 7. The NOx−-N concentration and loss in the leachate of N and RBN treatments showed a trend of first decreasing and then significantly increasing and then decreasing. In the last four times of leaching in the RBN treatment during Days 21–42, the NOx−-N concentrations and the leaching losses were significantly lower than those in the N treatment.
3.3.3. ON Concentration and Loss in Leachate
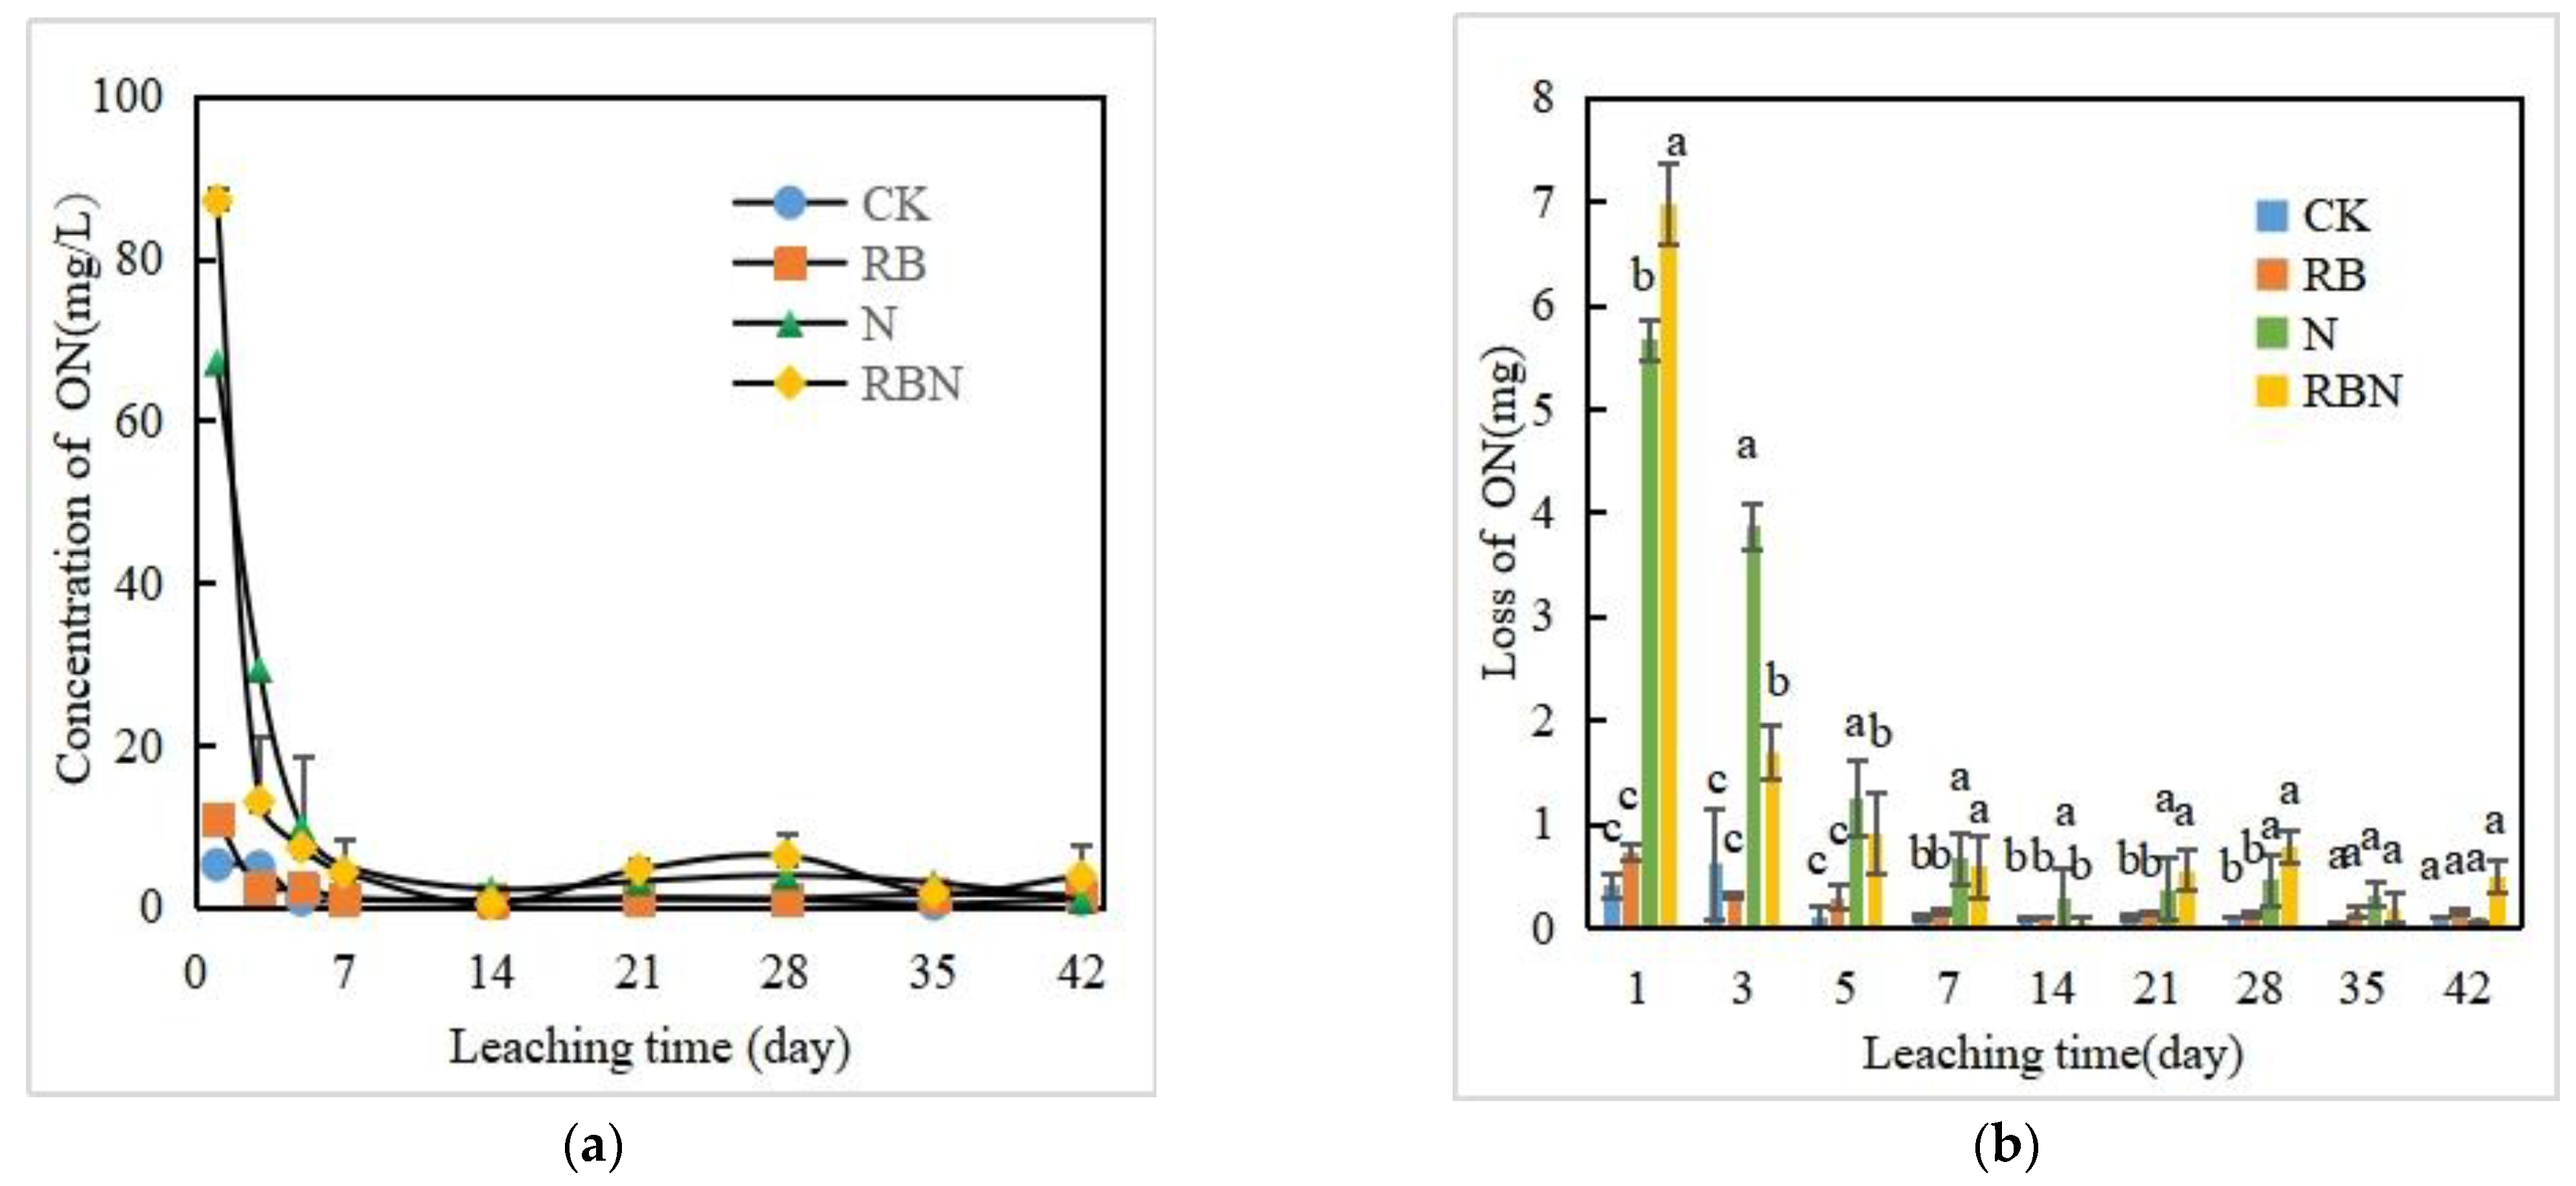
Compared with the CK and RB treatments in the first leaching, the N and RBN treatments showed a significantly higher ON concentration (67.18–87.07 mg/L) and leaching loss (5.67–6.98 mg) (Figure 4). Particularly, the RBN treatment had higher values than the N treatment. In the following leaching, the ON concentration showed a significantly decreasing trend in the N and RBN treatments. After the fourth leaching, the concentrations and leaching losses were lower. In the last two times of leaching, there were no significant differences in the ON leaching loss among the four treatments.
3.3.4. TN Concentration and Loss in Leachate
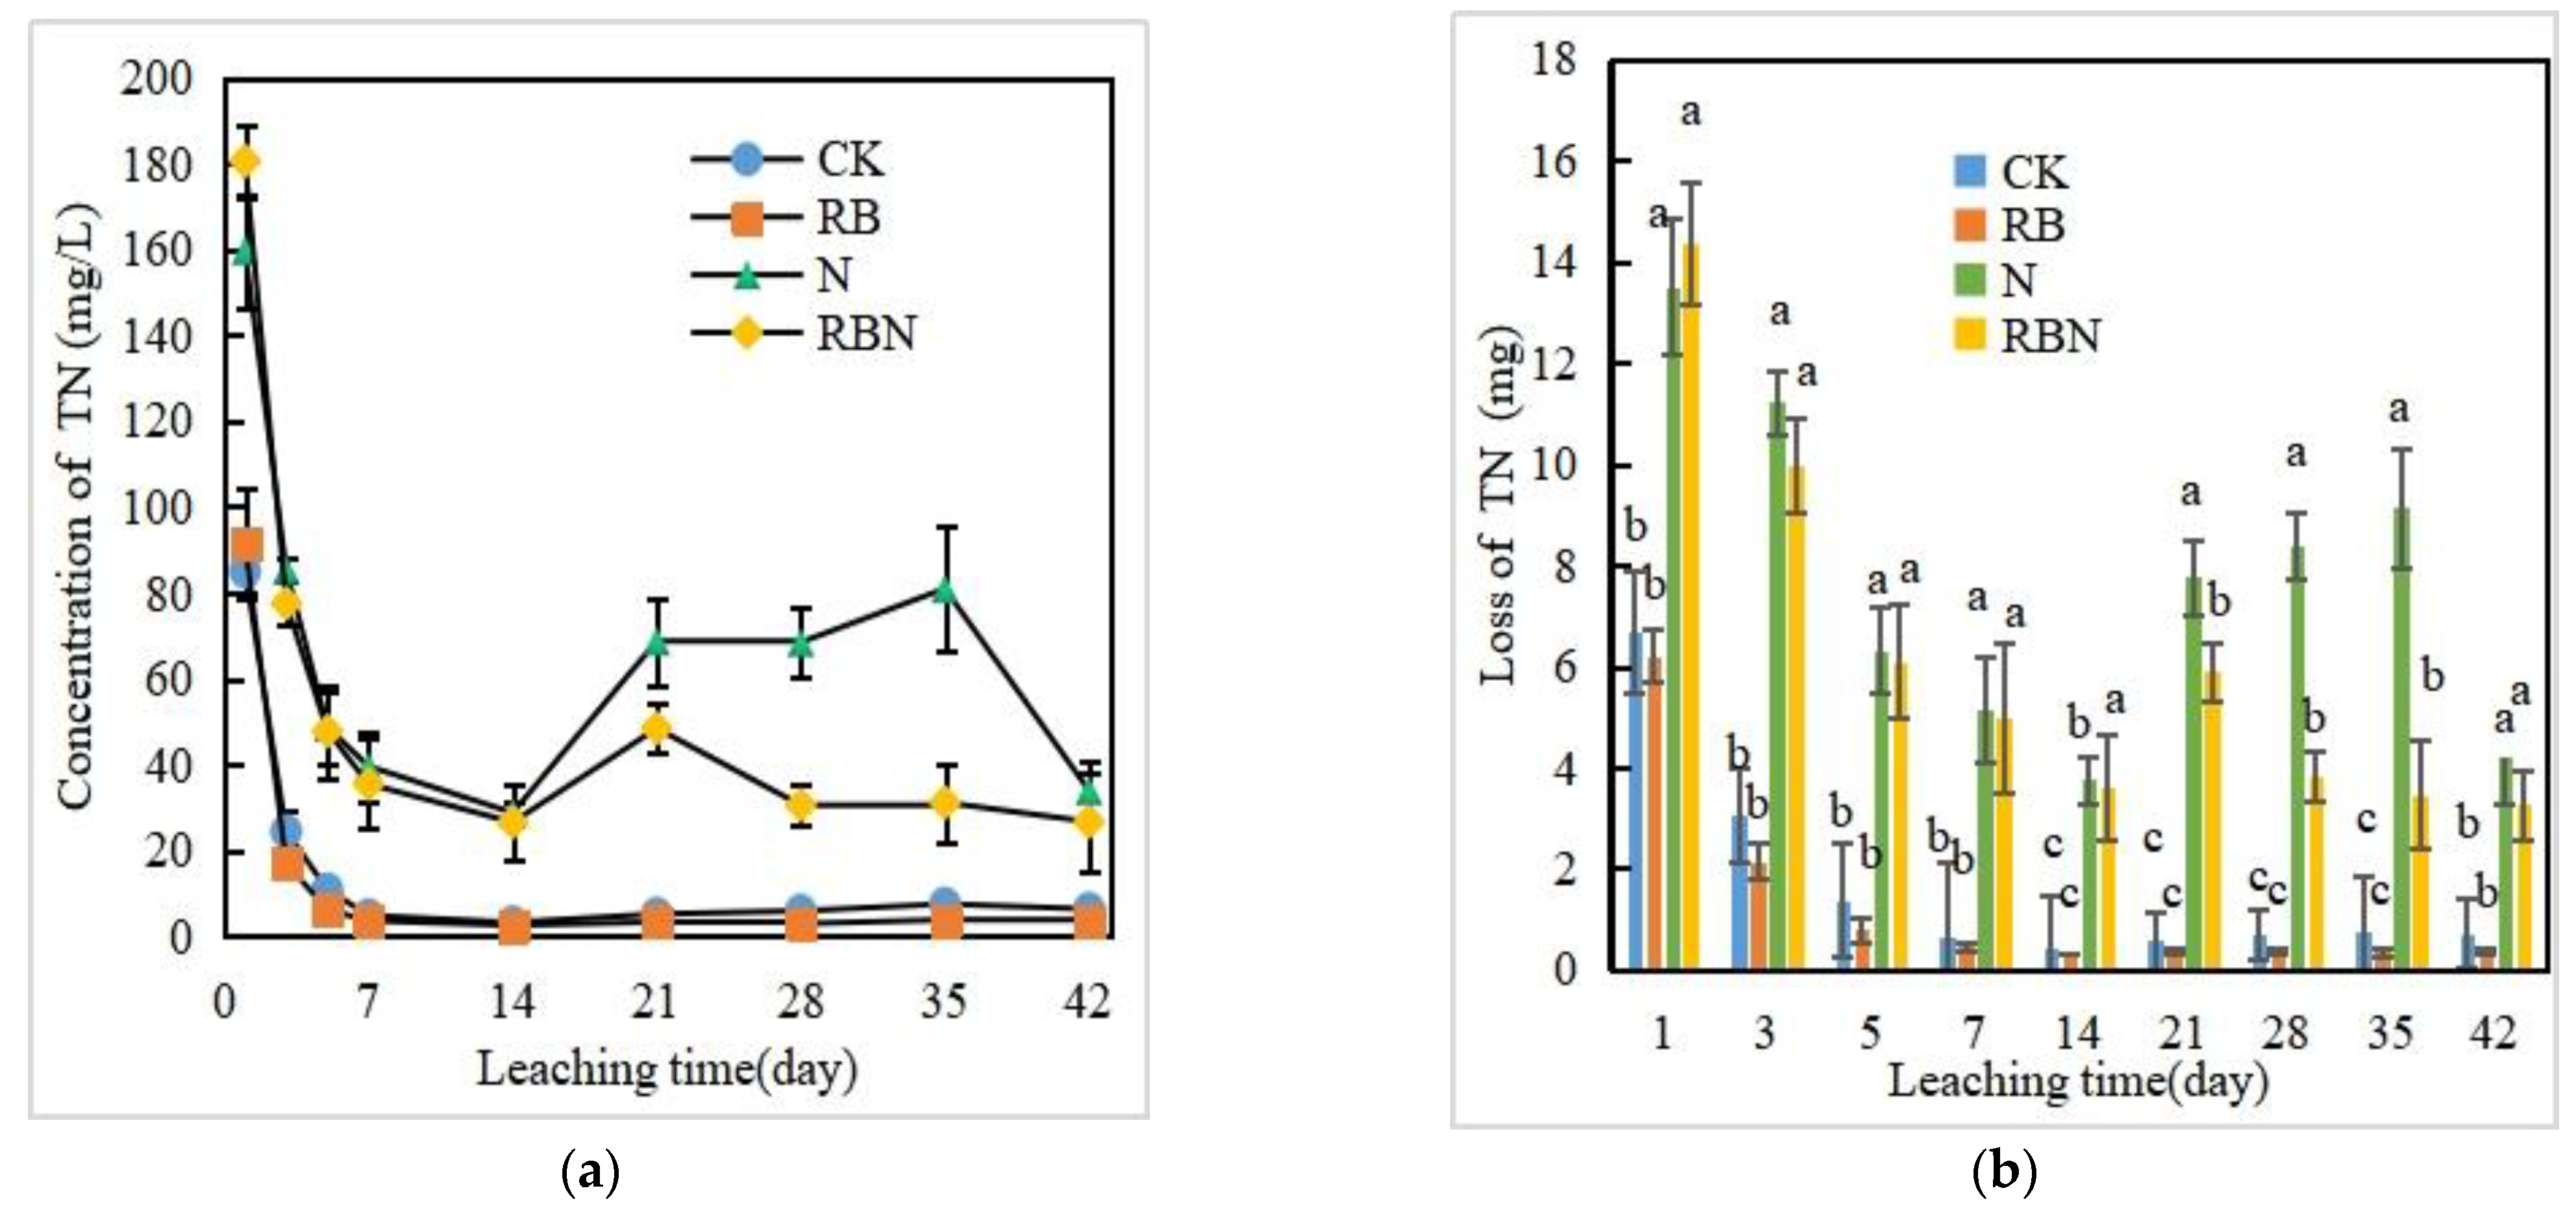
The total N concentration and leaching loss in the leachate of all four treatments reached the maximum value in the first leaching (Figure 5). The total N concentration of the RBN treatment was the largest and the loss was the highest compared to that of other treatments. In the subsequent leaching, the CK and RB treatments showed a decreasing trend in the total N concentration, and the concentrations and leaching losses were small and remained relatively stable. For the N and RBN treatments, the total N concentration and leaching loss showed a decreasing–increasing–decreasing trend. In the four times of leaching after Day 14, the total N concentration and leaching loss of the RBN treatment were lower than those of the N treatment. The total N in the leachate showed a consistent trend with NOx−-N in the concentration and loss, indicating that the total N in the leachate was mainly from the NOx−-N leaching loss.
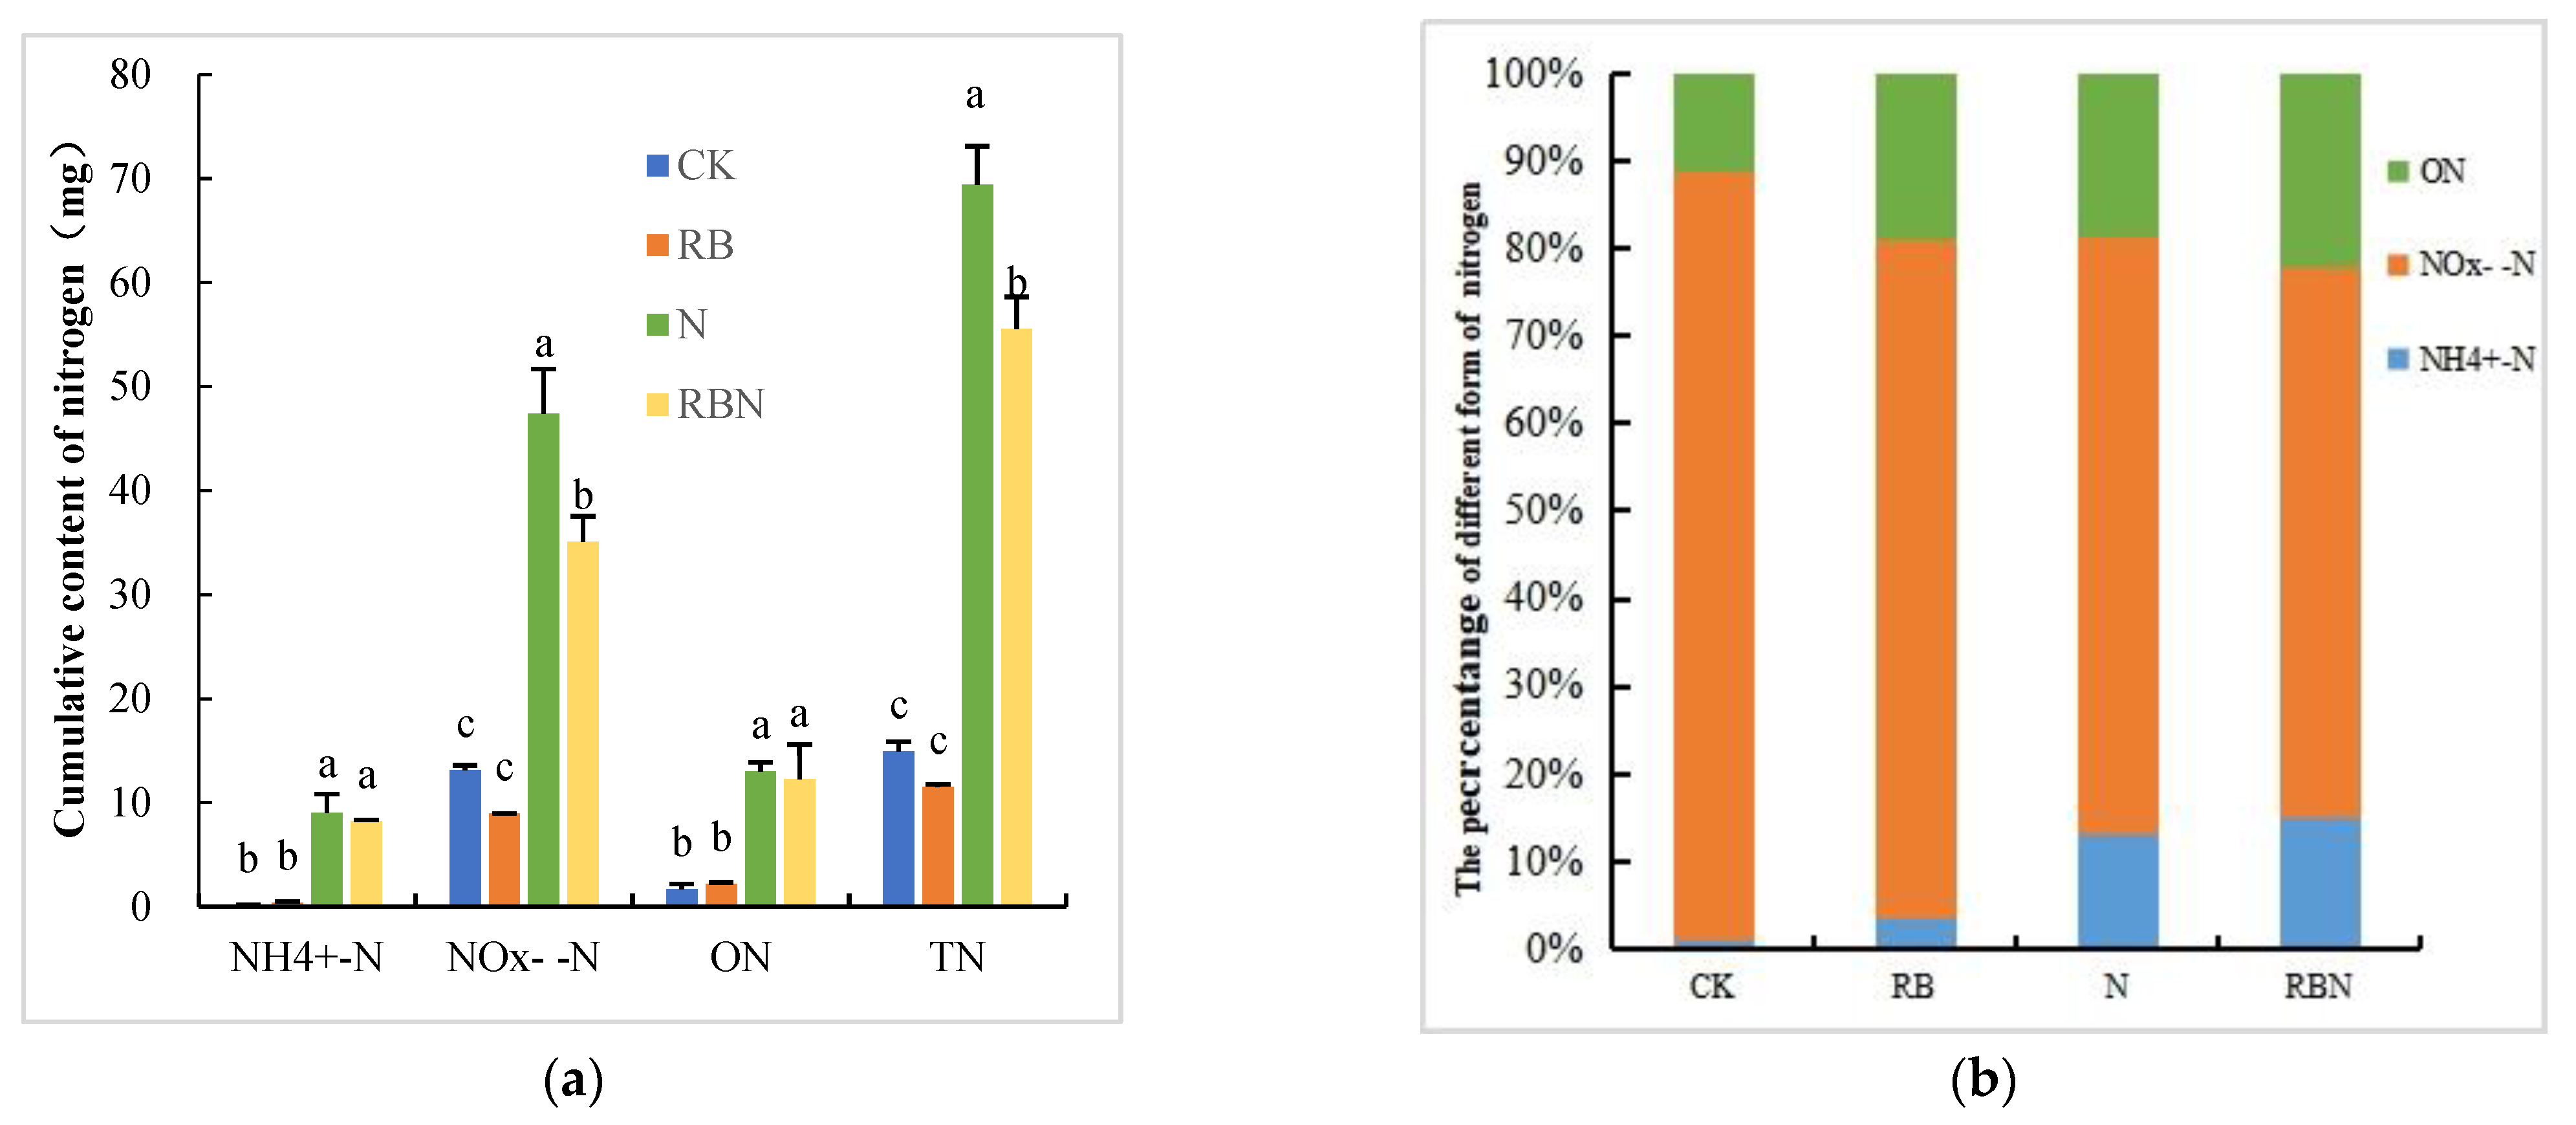
3.4. Cumulative Content of Nitrogen Loss in Leachate
Compared with the CK treatment, the RB treatment increased the cumulative leaching loss of NH4+-N and ON while decreasing the cumulative leaching loss of NOx−-N and total N, without significant differences (Figure 6a). The N treatment significantly increased the cumulative losses of NH4+-N, NOx−-N and total N. The RBN treatment reduced the cumulative losses of NH4+-N, NOx−-N and ON by 8.75%, 25.95% and 5.99%, respectively, and the cumulative leaching loss of total N decreased by 19.99% compared to that of the N treatment. There were significant decreases in the cumulative leaching loss of NOx−-N and total N in the RBN treatment compared to the N treatment.
Based on the percentages of leaching losses of different N forms to the total N leaching loss from the soils in the four treatments (Figure 6b), the leaching losses of soil N in all treatments were from NOx−-N (63.15–87.90%) > ON (11.18–22.03%) > NH4+-N (0.95–14.82%). The RBN treatment had the lowest percentage of NOx−-N loss but the largest percentage of ON loss. The RBN treatment had a slightly larger percentage of NH4+-N leaching losses than that of the N treatment.
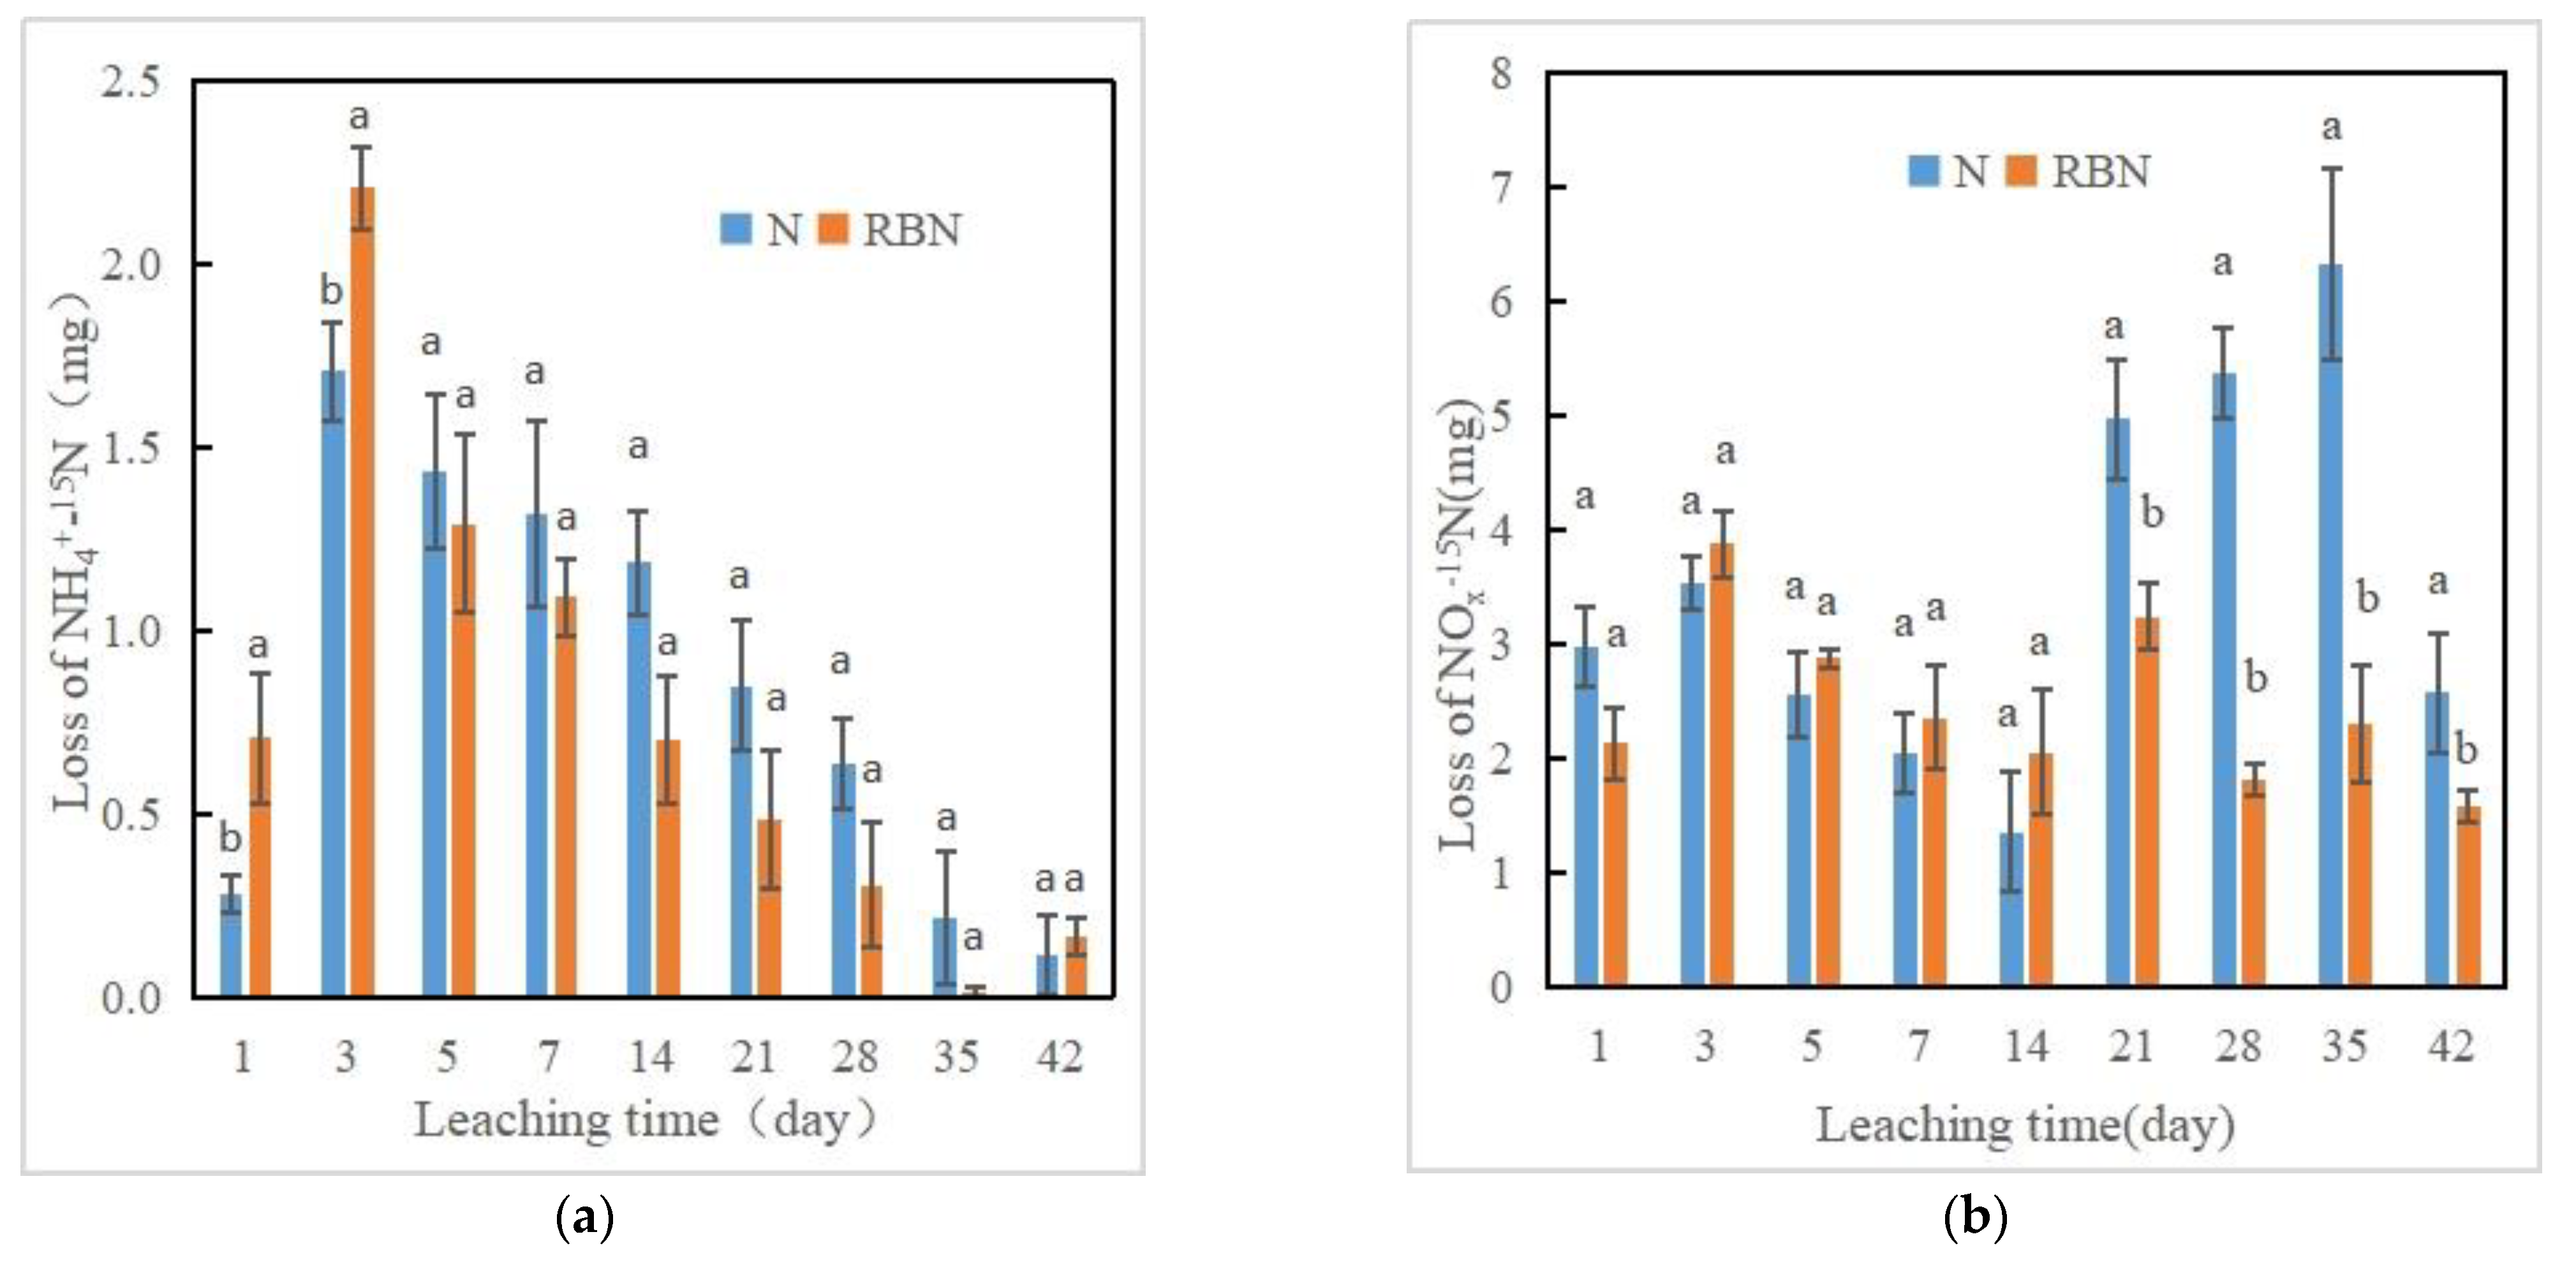
3.5. Losses and Residues of 15N-Labeled Urea Applied to the Soil
In Figure 7a, compared to the N treatment, the RBN treatment enhanced urea fertilizer hydrolysis in the form of the NH4+-N leaching in the first two times of leaching while showing a reduction effect in the subsequent leaching. In the N and RBN treatments, the leaching loss of NH4+-N (Figure 2b) was consistent with the leaching loss of NH4+-15N (Figure 7a). An estimated 85% of NH4+-N leaching resulted from 15N-labeled urea hydrolysis, indicating that NH4+-N leaching was mainly influenced by urea hydrolysis.
In Figure 7b, compared with the N treatment, the RBN treatment had a certain promotion effect on the NOx−-N leaching of urea fertilizer in the first four times of leaching on Days 3, 5, 7 and 14, while having an inhibitory effect in the remaining leaching. This was consistent with the changing trend of NOx−-N content in the leachate (Figure 3b). An estimated 65% of NOx−-N leaching resulted from 15N-labeled urea hydrolysis, indicating that NOx−-N leaching was mainly influenced by urea hydrolysis and nitrification.
Table 3 indicates the loss and residue of 15N-labeled nitrogen in the N and RBN treatments. In the N and RBN treatments, the leaching losses of inorganic 15N (NH4+-15N and NOx−-15N) were 39.54 mg and 29.27 mg, accounting for 40.55% and 30.02% of the 15N-labeled urea application amount, respectively. The inorganic 15N was mainly in the form of NOx−-N, accounting for 76.19~80.40%. The biochar application significantly reduced N fertilizer leaching of inorganic N by 25.97% while increasing other N loss (e.g., ON leaching, ammonia and NOx volatilization) by 21.72% and the residual fertilizer N in the soil by 13.67%.
4. Discussion
4.1. Effects of Biochar on Soil Chemical Properties
This study showed that the RB treatments increased soil pH by 0.34 compared with the CK. The combined biochar-urea application (the RBN treatment) inhibited soil acidification due to the fertilizer-alone application (the N treatment). This was consistent with the results of existing studies [23,31]. The pyrolysis process of biochar was enriched with a large number of base ions, such as K+, Na+, Ca2+ and Mg2+. These ions increased the base saturation of the soil and reduced the proportion of exchangeable H+ and Al3+ in the soil, thus significantly increasing the soil pH [32,33].
Biochar is a solid material rich in carbon and has abundant nutrients such as nitrogen, phosphorus and potassium [34,35].These nutrients can significantly increase soil organic matter, organic N and available phosphorus content after entering the soil. Biochar showed a decreasing effect on the NH4+-N and NOx−-N content of soils (Table 1 and Table 2). This was possibly because the biochar affected soil physicochemical properties, thus affecting soil microbial environment and community structure and influencing the mineralization and nitrification processes of soil N [36,37].
4.2. Effects of Biochar on Soil Nitrogen Transformation and Leaching
In this study, NH4+-N concentrations of leachate in the N and RBN treatments were significantly higher than those in the CK and RB treatments and showed the highest value on Day 3 of the leaching experiment. The NH4+-N leaching was mainly concentrated in the first five times of leaching from Day 1 to Day 14 (Figure 2). This was mainly because urea applied to the soil was first converted to NH4+-N by the urease, resulting in a higher NH4+-N leaching loss in the early leaching period. Compared to the N treatment, the RBN increased the NH4+-N concentration in the leachate and the leaching loss in the first two times of leaching while inhibiting the subsequent leaching (Figure 2). This was attributed to the complex effect of biochar on soil N transformation. Biochar is generally high in CEC and hence can readily adsorb/retain cations, including ammonium [38]. Biochar has a well-developed pore structure and can adsorb and encapsulate nitrogenous organic matter in soils. Thus, this can improve the resistance of organic matter to microbial degradation and inhibit the mineralization of organic matter [39]. Biochar also contains easily decomposable organic carbon components such as water-soluble organic carbon, and its degradation contributes to the mineralization of organic matter [40]. The biochar application either promotes or inhibits the mineralization of organic matter as a result of the combined effect of these two influencing factors [41]. In the present study, the rice husk biochar has a high water-soluble organic carbon content of 4450 mg kg−1 (Table 1). During the early application period, biochar stimulated soil microbial activity, and the promotion effect on organic matter mineralization was higher than the inhibitory effect. This promoted organic matter hydrolysis and oxidation and increased the NH4+-N concentration and leaching loss of the soil solution. Therefore, in the first two times of leaching, the NH4+-N concentrations and leaching losses of the soil solution were higher in the RBN treatment than in the N treatment. In the later leaching, the mineralization of organic matter was inhibited by biochar, and the NH4+-N concentration and leaching loss of the soil solution were significantly lower than those in the N treatment (Table 2 and Figure 2).
Nitrification is the oxidation process of ammonium N to nitrite N and then to nitrate N. It is an important pathway for N transformation in soils. Soil pH and oxygen content are key environmental factors for soil nitrification by affecting the composition of nitrification microbial communities. Increasing pH value is conducive to improving soil’s nitrification rate. Oxygen is the substrate for ammonia oxidation reactions. The balance of air and water in the soil is crucial for nitrification, which depends on the availability of soil oxygen [42,43]. In this study, soil NOx−-N concentrations and leaching losses of the four treatments showed a significant decrease in the first four times of leaching (Figure 3). This was mainly due to the high frequency of leaching (every other day), high soil water content and poor aeration in the first four times of leaching. Then, these factors resulted in slow soil nitrification and reduced NOx−-N concentration in the soil solution. The subsequent leaching was performed every seven days. The soil water content decreased during the leaching interval due to evaporation; soil aeration probably increased, and then nitrification was enhanced. The NH4+-N concentration in the substrate for soil nitrification was lower in the CK and RB treatments (Figure 2b). In these two treatments, soil nitrification was slow, resulting in a lower NOx−-N concentration and leaching loss from the soil. In contrast, the N treatment and the RBN treatment resulted in a higher NH4+-N concentration and stronger nitrification due to urea hydrolysis, thus resulting in a significantly higher NOx−-N concentration and leaching loss (Figure 3). 15N tracing experiments showed NOx−-N leaching was mainly from urea hydrolysis and nitrification (Figure 7b).
Compared with the N treatment, the RBN treatment promoted the NOx−-N concentration and leaching loss in the soil leachate during the four times of leaching between Days 3 and 14 while significantly reducing the concentration and leaching during the subsequent leaching (Figure 3). This variation was related to the complexity of the effects of biochar on soil nitrification [44,45]. Firstly, the biochar application increased soil pH, improved soil air condition and enhanced soil water retention capacity. Thus, this improved the population structure and abundance of ammonia-oxidizing functional microorganisms in the soil, accelerated soil nitrification rate and promoted soil nitrification [46,47]. Secondly, biochar can also reduce the substrate for nitrification by fixing N in the soil through adsorption, thus reducing soil ammonia oxidation [48,49]. In addition, some biochar also releases nitrification inhibitors after degradation such as terpenoids, which inhibit soil ammonia oxidation [50]. The nitrification inhibitors in biochar were important concerning ammonia oxidation and nitrous oxide emission [51]. The variation in the soil nitrification intensity by biochar was an important factor affecting the change in soil NOx−-N concentration and loss in the column leaching experiment. In the preliminary leaching of this study, the active components in biochar, such as water-soluble organic carbon, had an activating effect on soil microorganisms and improved the mineralization of soil N. The biochar application increased soil pH and also facilitated the formation of soil agglomerates and macropores, which improved soil permeability and oxygen content and enhanced nitrification. Thus, this resulted in a higher NOx−-N concentration and leaching loss in the leachate in the RBN treatment than in the N treatment. In the later stages between Days 14 and 42 of leaching, biochar inhibited soil nitrification by fixing soil N through adsorption and releasing terpenoids after degradation. This resulted in a significantly lower NOx−-N concentration and loss in the leachate in the RBN than those in the N treatment (Figure 3).
4.3. Effects of Biochar on the Leaching and Retention of Urea Fertilizer
Urea is a commonly used N fertilizer, which is converted into ammonium and nitrate N by hydrolysis and nitrification after entering the soil. NH4+-N in the soil is not easily leached by water due to the adsorption of soil cations and colloids. Due to its negative charge, NOx−-N is more likely to move downward with irrigation water and becomes the main form of N leaching [14,52]. Biochar affects not only the N fertilizer migration by influencing the hydrolysis and nitrification processes of urea fertilizer but also the leaching and retention of N fertilizer by NH4+-N and NOx−-N adsorption. Biochar has a porous structure with high specific surface area and large CEC. The biochar surface is rich in various functional groups, which can effectively adsorb NH4+-N and NOx−-N ions from the soil. Thus, this can delay the leaching of soil nutrients and promote fertilizer retention [16,53]. In this experiment, urea was mainly leached as NOx−-N, which represented 34.53~46.32% of the loss of urea fertilizer. Biochar had a significant inhibitory effect on NOx−-N leaching. This was mainly related to the inhibitory effect of biochar on the nitrification of soil NH4+-N and the significant adsorption of NOx−-N in the soil by biochar. The amount of urea leaching as NH4+-N was low, accounting for 10.79~11.31% of the loss of urea fertilizer. RBN treatment reduced the urea leaching loss as NH4+-N while showing no significant reduction effects compare to N treatment. This might be attributable to the CEC of rice husk biochar not being high in this study (Table 1). Yao et al. reported that the CEC of biochar is the most important factor influencing ammonium adsorption [19].
The losses of nitrogen fertilizer in the soil also included organic N leaching and gaseous loss via ammonia and NOx volatilization. Compared to the CK and RB treatment, the organic N leaching loss was relatively higher in the N and RBN treatments, reaching 9.55 mg (72.35% of the cumulative ON loss) and 8.67 mg (62.25% of the cumulative ON loss), respectively, in the first two flushings. The reason was that urea was water-soluble organic N and easily leached with water at the first two flushings [54,55]. In this experiment, urea fertilizer was subjected to some losses due to the gaseous loss via ammonia and NOx volatilization. However, it was difficult to investigate and differentiate the effects of biochar on gaseous losses with the soil column experiment. Indoor culture experiments and field experiments are needed to estimate the effect degree of biochar on gaseous losses by N fertilizer in further studies by N15 tracing approach.
5. Conclusions
The soil column leaching study with 15N-labeled urea showed that the rice husk biochar could affect soil chemical properties and increase the capacity of the vegetable soil to retain and reduce N fertilizer leaching. The biochar considerably increased the soil pH and alleviated soil acidification caused by applying chemical fertilizer. The biochar application also significantly increased the content of SOC, total N and available phosphorus. However, it decreased the content of NH4+-N and NOx−-N in the soil. The form of total N loss included NH4+-N, NOx−-N and OM, mainly in NOx−-N, accounting for 63.15~87.90%. Compared to the urea-alone application, the incorporation of biochar and urea significantly reduced the leaching loss of total N and NOx−-N, while showing no significant effects on the leaching loss of ammonium nitrogen. 15N tracing experiments show that the biochar promoted the concentration and content of inorganic 15N in the leachate during the early leaching process and then inhibited it in the later stage. In general, the biochar inhibited the leaching loss of inorganic 15N from the soil and increased fertilizer N retention in the soil, thereby decreasing the risk of N fertilizer leaching into rivers or groundwater. Furthermore, urea fertilizer was also lost in the form of ON and the gaseous loss via NH3 and NOx volatilization. The biochar had a certain effect on these losses, while the degree of influence on these losses needs to be further studied.
Author Contributions
Methodology, S.Z. and R.P.; formal analysis, J.B.; data curation, A.D.; writing—original draft preparation, Y.D.; writing—review and editing, Y.L. and A.D. All authors have read and agreed to the published version of the manuscript.
Funding
This research was funded by the Natural science research project of the Jiangsu Provincial Department of Education, grant number no. 22KJB610019, and the science research project of Nanjing Xiaozhuang University, grant number no. 2019NXY22.
Institutional Review Board Statement
Not applicable.
Informed Consent Statement
Not applicable.
Data Availability Statement
Not applicable.
Acknowledgments
We would like to thank the students at the School of Geography, Nanjing Normal University, for their assistance during the experiment analysis.
Conflicts of Interest
The authors declare no conflict of interest.
References
- Thompson, R.B.; Martinez-Gaitan, C.; Gallardo, M.; Gimenez, C.; Fernandez, M. Identification of irrigation and N management practices that contribute to nitrate leaching loss from an intensive vegetable production system by use of a comprehensive survey. Agric. Water Manag. 2007, 89, 261–274. [Google Scholar] [CrossRef]
- Lin, B.L.; Sakoda, A.; Shibasaki, R.; Suzuki, M. A Modelling Approach to Global Nitrate Leaching Caused by Anthropogenic Fertilisation. Water Res. 2001, 35, 1961–1968. [Google Scholar] [CrossRef]
- Chang, C.; Entz, T. Nitrate Leaching Losses Under Repeated Cattle Feedlot Manure Applications in Southern Alberta. J. Environ. Qual. 1996, 25, 145–153. [Google Scholar] [CrossRef]
- Subramaniam, D.; Mather, P.; Russell, S.; Rajapakse, J. Dynamics of Nitrate-Nitrogen Removal in Experimental Stormwater Biofilters under Intermittent Wetting and Drying. J. Environ. Eng. 2016, 142, 04015090. [Google Scholar] [CrossRef] [Green Version]
- Craig, R.; Leo, M.; Tim, J.; Mark, F.; Alison, S.; Robert, A.; Robert, R. Biochar induced soil microbial community change: Implications for biogeochemical cycling of carbon, nitrogen and phosphorus. Pedobiologia 2011, 54, 309–320. [Google Scholar]
- Bargmann, I.; Martens, R.; Rillig, M.; Kruse, A.; Nutrition, M.K.; Bodenkunde, S.S. Hydrochar amendment promotes microbial immobilization of mineral nitrogen. J. Plant Nutr. Soil Sci. 2014, 177, 59–67. [Google Scholar] [CrossRef]
- Gul, S.; Whalen, J.K.; Thomas, B.W.; Sachdeva, V.; Deng, H. Environment Physico-chemical properties and microbial responses in biochar-amended soils: Mechanisms and future directions. Agric. Ecosyst. Environ. 2015, 206, 46–59. [Google Scholar] [CrossRef]
- Yang, L.; Liao, F.; Huang, M.; Yang, L.; Li, Y. Biochar Improves Sugarcane Seedling Root and Soil Properties Under a Pot Experiment. Sugar Tech. 2015, 17, 36–40. [Google Scholar] [CrossRef]
- Ding, Y.; Liu, Y.X.; Wu, W.X.; Shi, D.Z.; Yang, M.; Zhong, Z. Evaluation of Biochar Effects on Nitrogen Retention and Leaching in Multi-Layered Soil Columns. Water Air Soil Pollut. 2010, 213, 1961–1968. [Google Scholar] [CrossRef]
- Ajayi, A.E.; Horn, R.J. Biochar-Induced Changes in Soil Resilience: Effects of Soil Texture and Biochar Dosage. Pedosphere 2017, 27, 236–247. [Google Scholar] [CrossRef]
- Bolan, N.; Hoang, S.A.; Beiyuan, J.; Gupta, S.; Hou, D.; Karakoti, A.; Joseph, S.; Jung, S.; Kim, K.-H.; Kirkham, M.B.; et al. Multifunctional applications of biochar beyond carbon storage. Int. Mater. Rev. 2021, 67, 150–200. [Google Scholar] [CrossRef]
- Harter, J.; Weigold, P.; El-Hadidi, M.; Huson, D.H.; Kappler, A.; Behrens, T.E. Soil biochar amendment shapes the composition of N2O-reducing microbial communities. Sci. Total Environ. 2016, 562, 379–390. [Google Scholar] [CrossRef] [PubMed]
- Li, Y.; Hu, S.; Chen, J.; Müller, K.; Li, Y.; Fu, W.; Lin, Z.; Wang, H.J. Sediments Effects of biochar application in forest ecosystems on soil properties and greenhouse gas emissions: A review. J. Soils Sediments 2018, 18, 546–563. [Google Scholar] [CrossRef]
- Nguyen, T.; Xu, C.Y.; Tahmasbian, I.; Che, R.; Xu, Z.; Zhou, X.; Wallace, H.M.; Bai, S.H.J.G. Effects of biochar on soil available inorganic nitrogen: A review and meta-analysis. Geoderma 2017, 288, 79–96. [Google Scholar] [CrossRef] [Green Version]
- Laird, D.; Fleming, P.; Wang, B.; Horton, R.; Karlen, D. Biochar impact on nutrient leaching from a Midwestern agricultural soil. Geoderma 2010, 158, 436–442. [Google Scholar] [CrossRef] [Green Version]
- Sika, M.; Hardie, A. Effect of pine wood biochar on ammonium nitrate leaching and availability in a South African sandy soil. Eur. J. Soil Sci. 2014, 65, 113–119. [Google Scholar] [CrossRef]
- Kameyama, K.; Miyamoto, T.; Shiono, T.; Shinogi, Y. Influence of Sugarcane Bagasse-derived Biochar Application on Nitrate Leaching in Calcaric Dark Red Soil. J. Environ. Qual. 2012, 41, 1131–1137. [Google Scholar] [CrossRef]
- Zheng, H.; Wang, Z.; Deng, X.; Herbert, S.; Xing, B. Impacts of adding biochar on nitrogen retention and bioavailability in agricultural soil. Geoderma 2013, 206, 32–39. [Google Scholar] [CrossRef]
- Yao, Y.; Gao, B.; Zhang, M.; Inyang, M.; Zimmerman, A.R. Effect of biochar amendment on sorption and leaching of nitrate, ammonium, and phosphate in a sandy soil. Chemosphere 2012, 89, 1467–1471. [Google Scholar] [CrossRef]
- Major, J.; Rondon, M.; Molina, D.; Riha, S.J.; Lehmann, J. Maize yield and nutrition during 4years after biochar application to a Colombian savanna oxisol. Plant Soil 2010, 333, 117–128. [Google Scholar] [CrossRef]
- Bruun, E.W.; Petersen, C.; Strobel, B.W.; Hauggaard-Nielsen, H. Nitrogen and Carbon Leaching in Repacked Sandy Soil with Added Fine Particulate Biochar. Soil Sci. Soc. Am. J. 2012, 76, 1142–1148. [Google Scholar] [CrossRef]
- Zhao, Y.; Wang, J.; Cai, Z.; Müller, C.; Zhang, J. Short-term effects of nitrapyrin, rice straw and its biochar application on N transformation in soils of humid subtropical China. Acta Agric. Scand. Sect. B—Soil Plant Sci. 2018, 68, 448–456. [Google Scholar] [CrossRef]
- Dvořáčková, H.; Dvořáček, J.; Záhora, J.; Šimečková, J. Biochar Alone Did Not Increase Microbial Activity in Soils from a Temperate Climate That Had Long-Term Acidity Stress. Agriculture 2022, 12, 941. [Google Scholar] [CrossRef]
- Pratiwi, E.; Hillary, A.K.; Fukuda, T.; Shinogi, Y. The effects of rice husk char on ammonium, nitrate and phosphate retention and leaching in loamy soil. Geoderma 2016, 277, 61–68. [Google Scholar] [CrossRef]
- Prakongkep, N.; Gilkes, R.J.; Wiriyakitnateekul, W.; Duangchan, A.; Darunsontaya, T. The Effects of Pyrolysis Conditions on the Chemical and Physical Properties of Rice Husk Biochar. Int. J. Mater. Sci. 2013, 3, 97–103. [Google Scholar]
- Carter, S.; Knowles, T.; Middelink, E.; Haefele, S.; Sohi, S.; Cross, A.; Haszeldine], S. Sustainable gasification–biochar systems? A case-study of rice-husk gasification in Cambodia, Part I: Context, chemical properties, environmental and health and safety issues. Energy Policy 2012, 42, 49–58. [Google Scholar]
- Yoo, G.; Kim, H.; Chen, J.; Kim, Y. Effects of Biochar Addition on Nitrogen Leaching and Soil Structure following Fertilizer Application to Rice Paddy Soil. Soil Sci. Soc. Am. J. 2014, 78, 852. [Google Scholar] [CrossRef]
- Shizhengyuan, L. Degradation of soil Nutrients in southeast China. Pedosphere 2000, 10, 165–170. [Google Scholar]
- Zhu, G.; Song, X.; Ju, X.; Zhang, J.; Muller, C.; Sylvester, B.; Thorman, R.; Bingham, I.; Rees, R. Gross N transformation rates and related N2 O emissions in Chinese and UK agricultural soils. Sci. Total Environ. 2019, 666, 176–186. [Google Scholar] [CrossRef]
- Pan, R.; Bu, J.; Ren, G.; Zhang, Z.; Li, K.; Ding, A. Mechanism of Removal of Hexavalent Chromium from Aqueous Solution by Fe-Modified Biochar and Its Application. Appl. Sci. 2022, 12, 1238. [Google Scholar] [CrossRef]
- Joseph, S.D.; Camps-Arbestain, M.; Lin, Y.; Munroe, P.; Chiaa, C.H. An investigation into the reactions of biochar in soil. Soil Res. 2010, 48, 501–515. [Google Scholar] [CrossRef]
- Xu, X.; Zhao, Y.; Sima, J.; Zhao, L.; Mak, O.; Cao, X. Indispensable role of biochar-inherent mineral constituents in its environmental applications: A review. Bioresour. Technol. 2017, 241, 887–899. [Google Scholar] [CrossRef] [PubMed] [Green Version]
- Shi, R.Y.; Hong, Z.; Li, J.; Jiang, J.; Baquy, A.A.; Xu, R.; Qian, W. Mechanisms for Increasing the pH Buffering Capacity of an Acidic Ultisol by Crop Residue-Derived Biochars. J. Agric. Food Chem. 2017, 65, 8111–8119. [Google Scholar] [CrossRef] [PubMed]
- Bruun, S.; Harmer, S.L.; Bekiaris, G.; Christel, W.; Zuin, L.; Hu, Y.; Jensen, L.S.; Lombi, E. The effect of different pyrolysis temperatures on the speciation and availability in soil of P in biochar produced from the solid fraction of manure. Chemosphere 2017, 169, 377–386. [Google Scholar] [CrossRef]
- Limwikran, T.; Kheoruenromne, I.; Suddhiprakarn, A.; Prakongkep, N.; Gilkes, R.J. Dissolution of K, Ca, and P from biochar grains in tropical soils. Geoderma 2018, 312, 139–150. [Google Scholar] [CrossRef]
- Nan, X.; Tan, G.; Wang, H.; Gai, X. Effect of biochar additions to soil on nitrogen leaching, microbial biomass and bacterial community structure. Eur. J. Soil Biol. 2016, 74, 1–8. [Google Scholar]
- Yu, M.; Meng, J.; Yu, L.; Su, W.; Afzal, M.; Li, Y.; Brookes, P.C.; Redmile-Gordon, M.; Luo, Y.; Xu, J. Changes in nitrogen related functional genes along soil pH, C and nutrient gradients in the charosphere. Sci. Total Environ. 2018, 650, 626–632. [Google Scholar] [CrossRef]
- Naidu, R.; Yong, S.; Sarkar, B.; Mandal, S.; Khan, N. Biochar-induced concomitant decrease in ammonia volatilization and increase in nitrogen use efficiency by wheat. Chemosphere Environ. Toxicol. Risk Assess. 2016, 142, 120–127. [Google Scholar]
- Lu, W.; Ding, W.; Zhang, J.; Li, Y.; Luo, J.; Bolan, N.; Xie, Z. Biochar suppressed the decomposition of organic carbon in a cultivated sandy loam soil: A negative priming effect. Soil Biol. Biochem. 2014, 76, 12–21. [Google Scholar] [CrossRef]
- Jones, D.L.; Murphy, D.V.; Khalid, M.; Ahmad, W.; Edwards-Jones, G.; Deluca, T.H. Short-term biochar-induced increase in soil CO2 release is both biotically and abiotically mediated. Soil Biol. Biochem. 2011, 43, 1723–1731. [Google Scholar] [CrossRef]
- Dodor, D.E.; Amanor, Y.J.; Attor, F.T.; Adjadeh, T.A.; Neina, D.; Miyittah, M. Co-application of biochar and cattle manure counteract positive priming of carbon mineralization in a sandy soil. Environ. Syst. Res. 2018, 7, 5. [Google Scholar] [CrossRef] [Green Version]
- Ye, J.; Zhang, R.; Shaun, N.; Joseph, S.D.; Huang, D.; Torsten, T. A Combination of Biochar–Mineral Complexes and Compost Improves Soil Bacterial Processes, Soil Quality, and Plant Properties. Front. Microbiol. 2016, 7, 372. [Google Scholar] [CrossRef] [PubMed]
- Luo, X.; Wang, A.; Hou, C.; Han, S.; Chen, W. The limited effects of carbonaceous material amendments on nitrite-oxidizing bacteria in an Alfisol. Sci. Total Environ. 2020, 734, 139398. [Google Scholar] [CrossRef]
- Song, Y.; Zhang, X.; Ma, B.; Chang, S.X.; Gong, J. Biochar addition affected the dynamics of ammonia oxidizers and nitrification in microcosms of a coastal alkaline soil. Biol. Fertil. Soils 2014, 50, 321–332. [Google Scholar] [CrossRef]
- Nelissen, R.; Huygens, S.; Ruysschaert, B. Maize biochars accelerate short-term soil nitrogen dynamics in a loamy sand soil. Soil Biol. Biochem. 2012, 55, 20–27. [Google Scholar] [CrossRef]
- Daims, H.; Luecker, S.; Wagner, M. A New Perspective on Microbes Formerly Known as Nitrite-Oxidizing Bacteria. Trends Microbiol. 2016, 24, 699–712. [Google Scholar] [CrossRef]
- Dempster, D.N.; Jones, D.L.; Murphy, D.V. Organic nitrogen mineralisation in soil is unchanged by biochar addition. Soil Biol. Biochem. 2012, 48, 47–50. [Google Scholar] [CrossRef]
- Wang, Z.; Zheng, H.; Luo, Y.; Deng, X.; Xing, B. Characterization and influence of biochars on nitrous oxide emission from agricultural soil. Environ. Pollut. 2013, 174, 289–296. [Google Scholar] [CrossRef]
- Hu, H.W.; Zhang, L.M.; Dai, Y.; Di, H.J.; He, J.Z. pH-dependent distribution of soil ammonia oxidizers across a large geographical scale as revealed by high-throughput pyrosequencing. J. Soils Sediments 2013, 13, 1439–1449. [Google Scholar] [CrossRef]
- He, L.; Shan, J.; Zhao, X.; Wang, S.; Yan, X. Variable responses of nitrification and denitrification in a paddy soil to long-term biochar amendment and short-term biochar addition. Chemosphere 2019, 234, 558–567. [Google Scholar] [CrossRef]
- Thangarajan, R.; Bolan, N.S.; Kunhikrishnan, A.; Wijesekara, H.; Xu, Y.; Tsang, D.; Hou, D. The potential value of biochar in the mitigation of gaseous emission of nitrogen. Sci. Total Environ. 2018, 612, 257–268. [Google Scholar] [CrossRef] [PubMed]
- Pan, D. The Impact of Agricultural Extension on Farmer Nutrient Management Behavior in Chinese Rice Production: A Household-Level Analysis. Sustainability 2014, 6, 6644–6665. [Google Scholar] [CrossRef] [Green Version]
- Singh, B.P.; Hatton, B.J.; Singh, B.; Cowie, A.L.; Kathuria, A. Influence of biochars on nitrous oxide emission and nitrogen leaching from two contrasting soils. J. Environ. Qual. 2010, 39, 1224–1235. [Google Scholar] [CrossRef] [PubMed]
- Sun, H.; Lu, H.; Chu, L.; Shao, H.; Shi, W. Biochar applied with appropriate rates can reduce N leaching, keep N retention and not increase NH3 volatilization in a coastal saline soil. Sci. Total Environ. 2017, 575, 820–825. [Google Scholar] [CrossRef] [PubMed]
- Zhang, H.; Sun, H.; Zhou, S.; Bai, N.; Zheng, X.; Li, S.; Zhang, J.; Lv, W. Effect of Straw and Straw Biochar on the Community Structure and Diversity of Ammonia-oxidizing Bacteria and Archaea in Rice-wheat Rotation Ecosystems. Sci. Rep. 2019, 9, 9367–9678. [Google Scholar] [CrossRef]
Figure 1.
Schematic of PVC column for the soil leaching experiment.

Figure 2.
(a) Concentration of NH4+-N in leachate; (b) loss of NH4+-N in leachate. Different letters in the image (b) indicate significant differences between treatments (p < 0.05).
Figure 2.
(a) Concentration of NH4+-N in leachate; (b) loss of NH4+-N in leachate. Different letters in the image (b) indicate significant differences between treatments (p < 0.05).

Figure 3.
(a) Concentration of NOx−-N in leachate; (b) loss of NOx−-N in leachate. Different letters in the image (b) indicate significant differences between treatments (p < 0.05).
Figure 3.
(a) Concentration of NOx−-N in leachate; (b) loss of NOx−-N in leachate. Different letters in the image (b) indicate significant differences between treatments (p < 0.05).

Figure 4.
(a) Concentration of ON in leachate; (b) loss of ON in leachate. Different letters in the image (b) indicate significant differences between treatments (p < 0.05).
Figure 4.
(a) Concentration of ON in leachate; (b) loss of ON in leachate. Different letters in the image (b) indicate significant differences between treatments (p < 0.05).

Figure 5.
(a) Concentration of TN in leachate; (b) loss of TN in leachate. Different letters in the image (b) indicate significant differences between treatments (p < 0.05).
Figure 5.
(a) Concentration of TN in leachate; (b) loss of TN in leachate. Different letters in the image (b) indicate significant differences between treatments (p < 0.05).

Figure 6.
(a) Cumulative content of nitrogen; (b) the percentage of different forms of nitrogen. Different letters in the image (a) indicate significant differences between treatments (p < 0.05).
Figure 6.
(a) Cumulative content of nitrogen; (b) the percentage of different forms of nitrogen. Different letters in the image (a) indicate significant differences between treatments (p < 0.05).

Figure 7.
(a) Loss of NH4+-15N; (b) loss of NOx−-15N. Different letters in the image indicate significant differences between treatments (p < 0.05).
Figure 7.
(a) Loss of NH4+-15N; (b) loss of NOx−-15N. Different letters in the image indicate significant differences between treatments (p < 0.05).


Table 1.
Basic physical and chemical properties of soil and biochar.
| Properties | Soil | Rice Rusk Biochar (RB) |
|---|---|---|
| pH | 6.26 | 9.85 |
| CEC (cmol(+)/kg) | 20.60 | 31.70 |
| TOC (g/kg) | 8.60 | 260 |
| DOC (mg kg−1) | 11.0 | 4450 |
| TN (g/kg) | 1.23 | 4.29 |
| NH4+-N (mg kg−1) | 6.90 | 1.16 |
| NOx−-N (mg kg−1) | 16.63 | 3.00 |
| Ava. P (mg kg−1) | 22.40 | 195.8 |
| SSA (m2 g−1) | - | 11.08 |
Table 2.
Chemical properties of the leached soil.
| Properties | CK | RB | N | RBN |
|---|---|---|---|---|
| pH | 5.59 ± 0.02 b | 5.93 ± 0.068 a | 5.27 ± 0.02 c | 5.58 ± 0.03 b |
| TOC (g kg−1) | 8.51 ± 0.053 b | 18.23 ± 0.30 a | 8.49 ± 0.02 b | 18.17 ± 0.14 a |
| TN (g kg−1) | 1.22 ± 0.01 d | 1.43 ± 0.01 b | 1.28 ± 0.01 c | 1.49 ± 0.05 a |
| NH4+-N (mg kg−1) | 1.66 ± 0.06 a | 1.47 ± 0.01 a | 1.77 ± 0.16 a | 1.54 ± 0.21 a |
| NOx−-N (mg kg−1) | 1.91 ± 0.38 b | 1.65 ± 0.08 c | 2.46 ± 0.12 a | 1.99 ± 0.09 b |
| Ava. P (mg kg−1) | 15.16 ± 0.71 b | 22.06 ± 0.98 a | 14.95 ± 0.35 b | 23.49 ± 0.97 a |
Note: The values followed by the same letters within a row are not significantly different (p > 0.05) between treatments. The below is the same.
Table 3.
Losses and residues of 15N-labeled nitrogen added to the soil (mg).
| Treatments | NH4+-N Leached | NOx−-N Leached | Other N Loss | Retained N in the Soil |
|---|---|---|---|---|
| N | 7.75 ± 1.70 a | 31.79 ± 4.23 a | 29.01 ± 3.96 a | 28.96 ± 0.27 b |
| RBN | 6.97 ± 0.22 a | 22.30 ± 1.37 b | 35.31 ± 1.83 a | 32.92 ± 0.28 a |
Publisher’s Note: MDPI stays neutral with regard to jurisdictional claims in published maps and institutional affiliations. |
© 2022 by the authors. Licensee MDPI, Basel, Switzerland. This article is an open access article distributed under the terms and conditions of the Creative Commons Attribution (CC BY) license (https://creativecommons.org/licenses/by/4.0/).
Share and Cite
MDPI and ACS Style
Ding, Y.; Zhu, S.; Pan, R.; Bu, J.; Liu, Y.; Ding, A. Effects of Rice Husk Biochar on Nitrogen Leaching from Vegetable Soils by 15N Tracing Approach. Water 2022, 14, 3563. https://doi.org/10.3390/w14213563
AMA Style
Ding Y, Zhu S, Pan R, Bu J, Liu Y, Ding A. Effects of Rice Husk Biochar on Nitrogen Leaching from Vegetable Soils by 15N Tracing Approach. Water. 2022; 14(21):3563. https://doi.org/10.3390/w14213563
Chicago/Turabian StyleDing, Ying, Siyu Zhu, Run Pan, Jiangping Bu, Yong Liu, and Aifang Ding. 2022. "Effects of Rice Husk Biochar on Nitrogen Leaching from Vegetable Soils by 15N Tracing Approach" Water 14, no. 21: 3563. https://doi.org/10.3390/w14213563
Note that from the first issue of 2016, this journal uses article numbers instead of page numbers. See further details here.