
Repurposing of a Closed Surface Coal Mine with Respect to Pit Lake Development
by
 , , , and
Georgios Louloudis
1,*,
Christos Roumpos
1,*,
Emmanouil Louloudis
2,
Eleni Mertiri
1 and
Georgios Kasfikis
1 1
Public Power Corporation of Greece, Department of Mining Engineering and Closure Planning, 10432 Athens, Greece
2
Department of Statistics, Athens University of Economics and Business, 10434 Athens, Greece
*
Authors to whom correspondence should be addressed.
Water 2022, 14(21), 3558; https://doi.org/10.3390/w14213558
Submission received: 12 October 2022
/
Revised: 2 November 2022
/
Accepted: 2 November 2022
/
Published: 5 November 2022
(This article belongs to the Special Issue Groundwater Depletion: Current Trends and Future Challenges to Mitigate the Phenomenon)
Abstract
:In the coal phase-out era, achieving sustainable mine closure is significant and prioritizes targets for the mining industry. In this study, the already closed lignite mine of Kardia, North Greece, is investigated, where the mine void left is naturally filled with water. The viability of different repurposing land uses is evaluated, and the natural water level development inside the mine pit is investigated concerning its future uses. The potential for solar photovoltaic (PV) panels developed on mining land and its surrounding area is evaluated in combination with the application of pumped hydro storage (PHS) technology, utilizing pit lake water. Except for electricity system planning, other end-uses that offer multiple, mutually reinforcing and lasting benefits are investigated, such as recreation parks, terrestrial wildlife, aquaculture and agriculture. All repurposing scenarios are evaluated with regard to the spatiotemporal evolution of the lake, by generating forecasts of the dependent variables (rainfall and temperature) via linear (autoregressive integrated moving average) and non-linear (artificial neural network) models. The prediction of pit lake natural development redefines the new land use layout and the land repurposing decisions. This is essential for strategic planning, considering the Greek lignite mining industry’s priority regarding transitioning from the current coal-based electricity to renewable energy sources (RES) technology.
1. Introduction
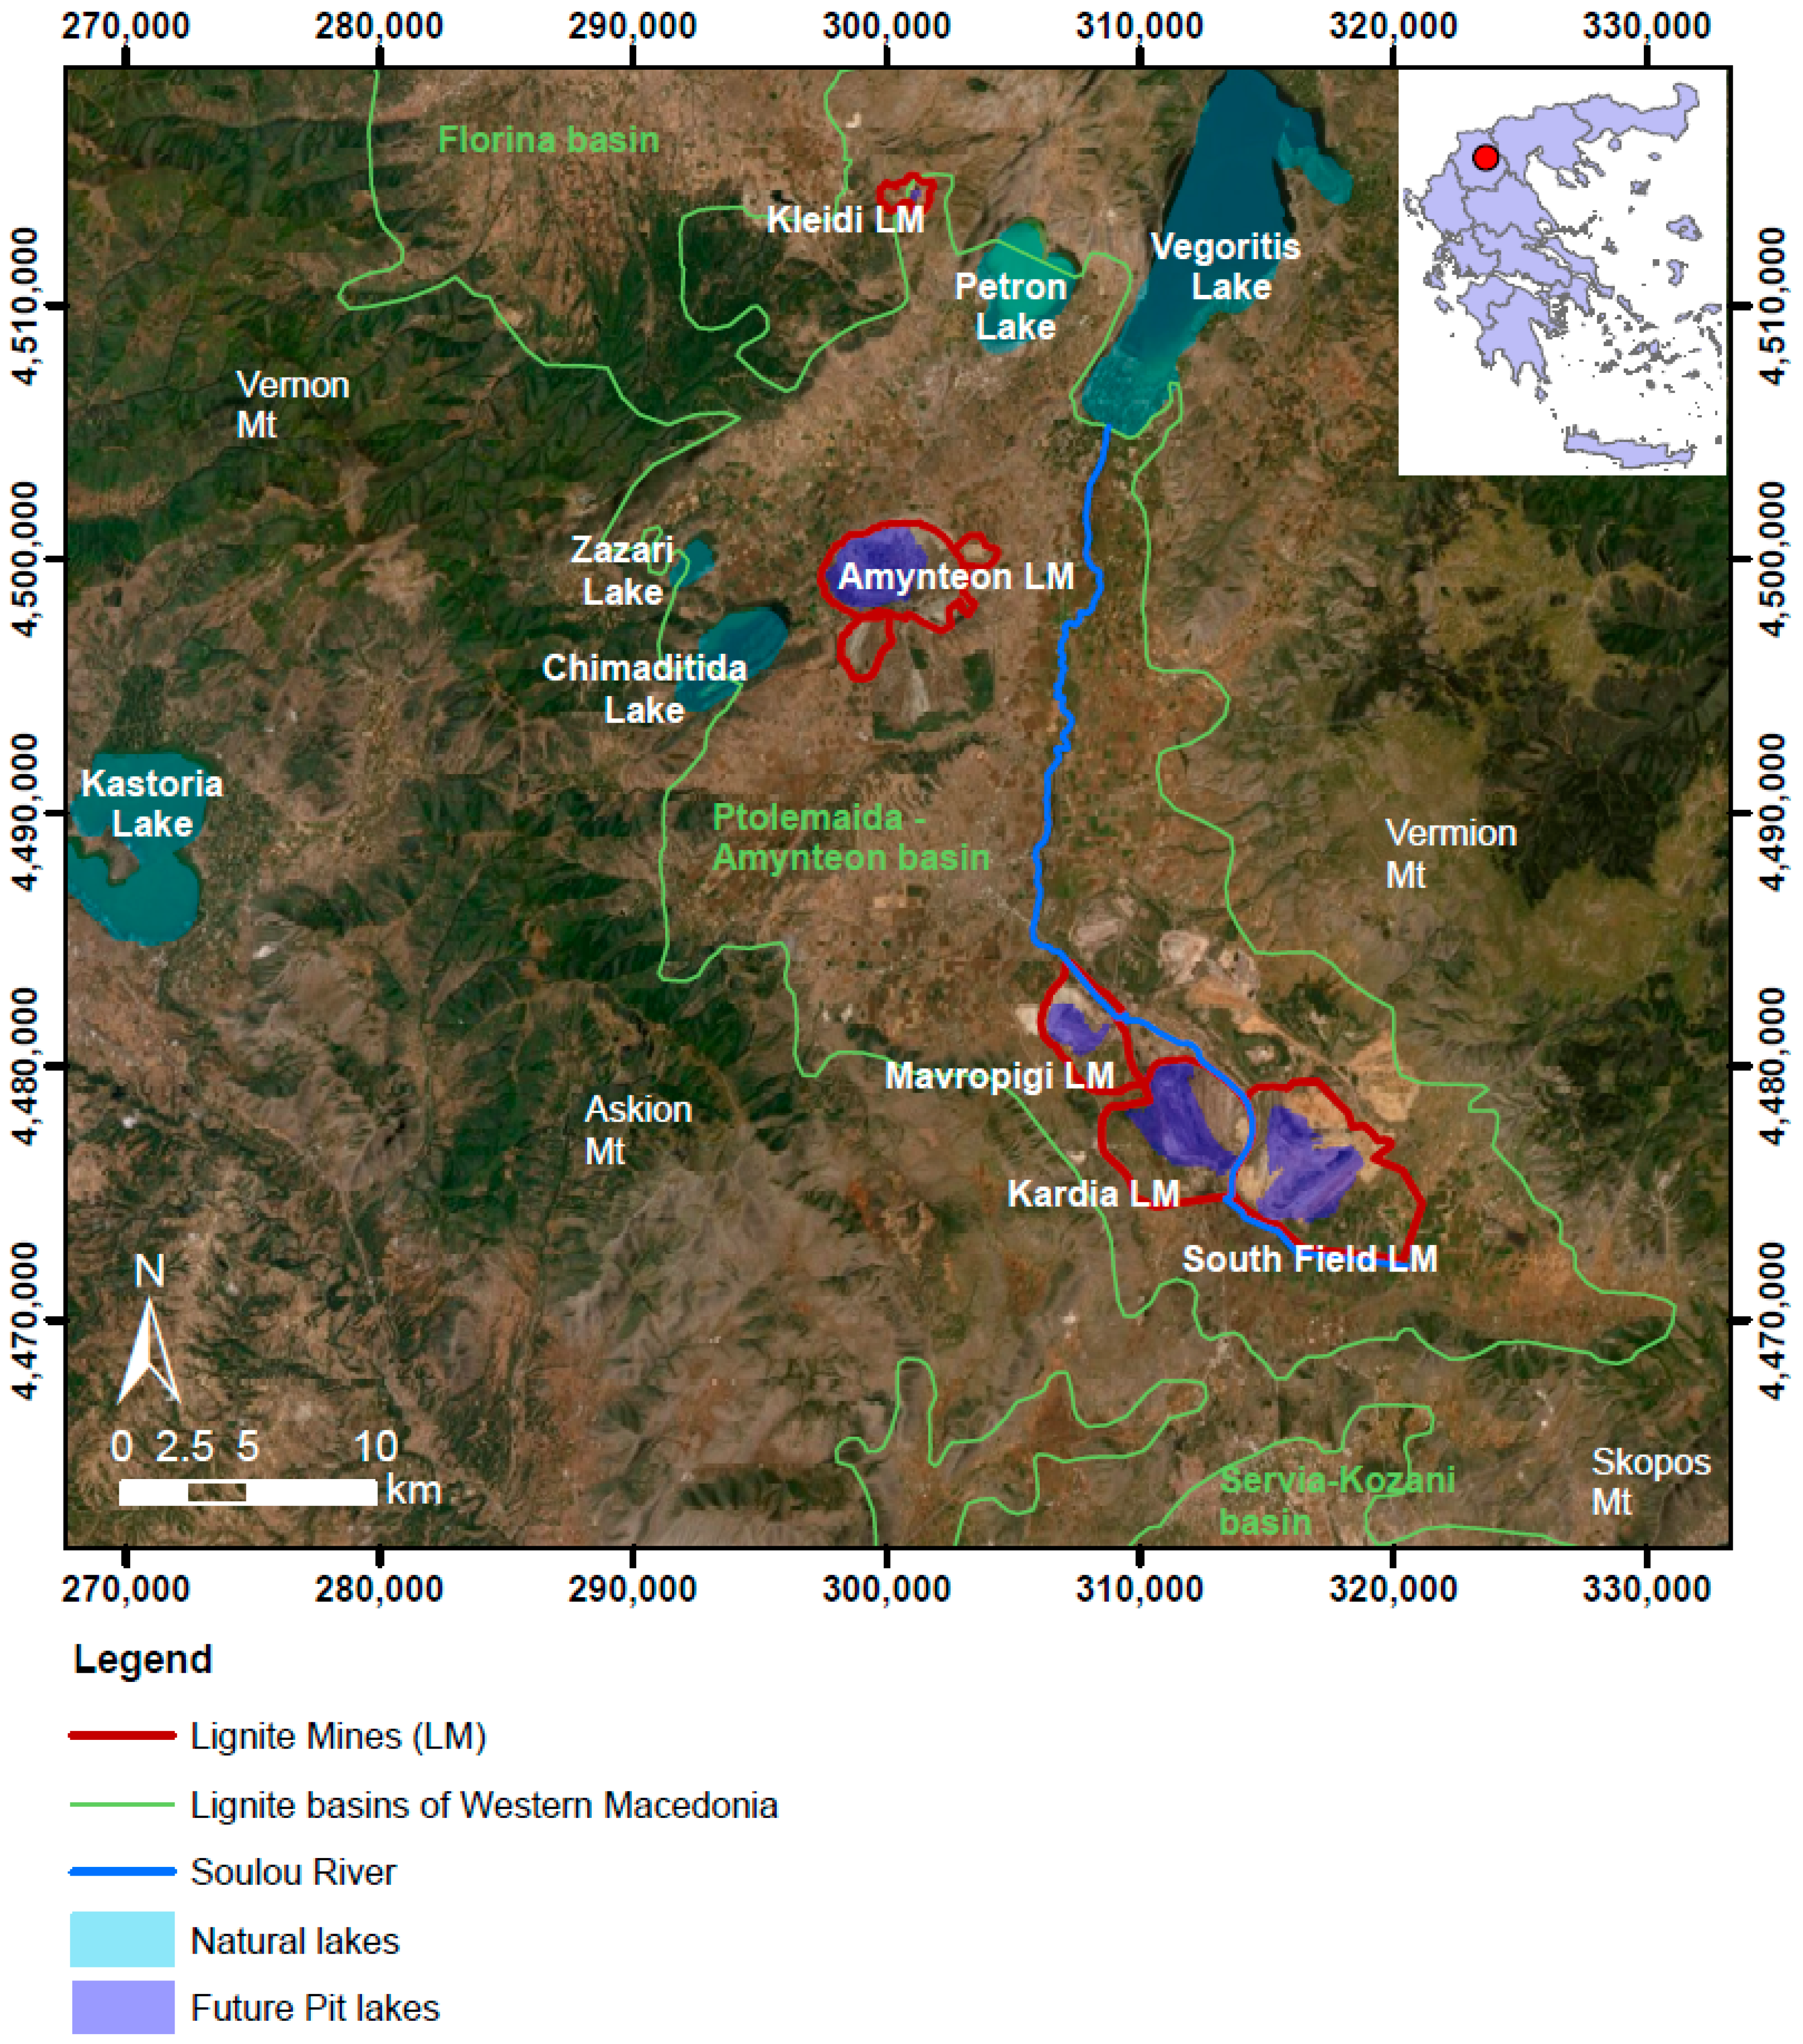
In the region of the South Ptolemais lignite-bearing basin, in Macedonia, N.W.( north-west) Greece (Figure 1), the Public Power Corporation (PPC) of Greece had developed extensive mining activity in order to provide adequate lignite quantities for 3000 MW power plants. However, Greece’s commitment to the European Commission’s long-term strategic vision to achieve net-zero greenhouse-gas emissions [1,2] has provided motivations for sustainable economic growth and spurred the modernization of the economy. The PPC operates within the framework of corporate environmental responsibility [3] and has established an environmental policy that reflects its commitment to comply with all applicable national and international laws and support continuous environmental improvement.
Over the last decade, particular policy attention has been paid to the transition from coal energy to clean energy technologies to reduce the risks of climate change impacts and contribute to climate-resilient pathways [4] for sustainable development. The goal is to integrate renewable sources and energy efficiency while simultaneously providing the lowest possible cost. As a result, multi-level planning is critical to designing and implementing effective strategies, exploring repurposing options, and making decisions about a post-mining future and economic transitions, considering regional and policy contexts [5].
Recently, the PPC has investigated and evaluated alternative repurposing options to produce energy using renewable energy sources (RES) and has planned post-mining land uses to be sustainable [6] in the long term. In this context, the PPC is planning to transition from coal-based electricity to renewable energy. Specifically, the PPC’s research is focused on the sustainable post-mining development of different RES plant types in the remaining post-mining landscapes and consequently evaluating whether implementing such technology could fulfill the electricity demand.
Regarding RES technology application, it is essential to consider the intermittent power outcome. In such a case, integrating energy storage technology with renewable energy production could be an effective solution. Therefore, the PPC uses a holistic approach to mine transition planning by examining energy storage technology, such as pumped hydro storage (PHS) technology.
A considerable volume of literature has been published on applying PHS technology in closed mines in combination with renewable energy sources, such as photovoltaic (PV) parks. According to Bódis et al. [7] the post-mining available landscape area for installing PV systems is abundant in the coal regions of the European Union. In addition, solar PV systems could replace the current coal-fired power plants, provided storage-flexible units with sufficient capacities are added. The first innovative project of a hybrid energy system, which combines PHS technology with multi-stage solar and wind renewable energy units in an abandoned mine, is the Kidston Clean Energy Hub Project [8] in Kidston, Far-North Queensland in Australia, which is expected to be in operation by 2024. According to Holcombe, pit voids in abandoned mines could become an asset underpinning RES development at mining sites and creatively reusing them [9]. Regarding economic feasibility, Wessel et al. reported that hybrid PHS–RES projects could be developed and operated at reasonably low costs [10].
Except for the production of electricity using RES, there is also a growing body of literature on other post-mining transitions and repurposing land-use scenarios [3,11,12], such as wildlife habitat, parks for recreation, eco-tourism and rehabilitation practices concerning pit lakes, i.e., development of fishing farms, recreational sport fisheries, angling, diving, hiking around the lake and even using pits for water storage and flood protection.
Therefore, water quality is an important parameter that could enable new beneficial end uses. Poor water quality could be significantly improved by rehabilitation practices, such as permanent flushing with river water, diverting seasonal floods into the pit lake [13,14], or even permanent river flow-through [15], which can mitigate the risk of eutrophication. Other rehabilitation practices have been reported in post-mining areas, such as appropriate landscaping of the pit lake banks with gentle sloping to emulate natural lakes if possible, filling the bottom of the open pit with alkaline substances such as re-excavated waste lime materials and application of riparian zone vegetation [14,16,17]. These rehabilitation practices could help the development of crucial aquatic biodiversity. Thus, a closure monitoring program is a prerequisite in post-mining areas to ensure long-term pit lake quality, since improving long-term environmental outcomes [18] could enhance pit lake ecosystem development and mitigate environmental damage.
Open pits include large areas that could also be used for waste disposal. Woodlawn is another innovative hybrid electric power project and an example of a circular economy, where the abandoned open pit was repurposed and is now converted into a bio-reactor landfill [12]. In this example, municipal wastes are disposed into the pit, and bio-gas power is produced, feeding the electricity grid. At the same time, other land repurposing is also applied in the surrounding area of the mine. It includes the development of RES technology using wind and solar farms to generate electricity, agricultural operations for farming practices, aquaculture and horticulture operations utilizing captured waste heat in hydroponic horticulture and to cultivate fish, and also the operation of a biological treatment facility to extract the organic content from waste and select recyclable materials or produce compost [19].
Another post-mining land-use transition is transforming mining landscapes into memorial pathways and places of remembrance, demonstrating historical artifacts to memorialize the local mining legacy [12]. In addition, these landmarks could become symbols of the region and thus help the development of tourism and recreation in the area [20].
This study aims to provide a case analysis to examine and evaluate land use repurposing scenarios in a mined-out pit of a closed mine. For this purpose, the mined-out pit of the already closed lignite mine of Kardia, northern Greece, was used as the case study. According to the planning studies for the closure of the lignite mines of western Macedonia [6], rehabilitation includes the development of lakes inside the open pits, photovoltaic (PV) parks developed in the surrounding area, areas used for agriculture or recreational activities and forest areas. In the Kardia mine, the construction of a PHS facility is proposed to work as an energy storage unit due to the major setback in the performance of PV panels, i.e., the difficulty in adjusting to power demands at all times [7,12,21,22]. More specifically, the pit lake is repurposed as a PHS plant. It is used as an energy storage unit to supplement variable renewable capacity and enhance the proposed photovoltaic panels’ performance, increasing the PV park’s capacity factor. The conceptual idea is to utilize the pit lake that will start to develop after the end of mining activities, ensure the cessation of dewatering measures (dewatering wells and pumping stations) and create another or use an existing upper reservoir at higher altitudes. Then, taking advantage of the head difference between the pit lake (lower reservoir) and upper reservoir, the whole system could be used as a storage battery, releasing power when needed to compensate for renewable energy fluctuations.
In this framework, the feasibility of applying PHS technology is examined concerning the prediction of the natural development lake inside the open pit. In addition, considering the lake’s potential growth, the application of different land repurposing scenarios in the Kardia mine is evaluated. Finally, all potential repurposing land uses are evaluated regarding the energy transition potential in the specific region, long-term socio-economic viability and successful adaptation. The intent of this paper is to recommend strategies for improving post-mining land use transition and transforming abandoned surface lignite mines—including pit lakes—into post-mining assets for the communities. In addition, our intent is to contribute to further advancing successful pit lake end uses, as pit lakes could become assets to the clean energy sector.
2. Materials and Methods
2.1. Research Area—Morphology of the Basin
The Ptolemais Lignite Field is located in Kozani Prefecture in north Greece, surrounded by the mountains Vermion, Askion and Skopos (Figure 1). The northern side of the basin is bounded by Komanos horst. The Public Power Corporation of Greece has exploited three lignite reserves in this area: Mavropigi, Kardia, and South Field. The Kardia deposit lies in the middle, with exploitable reserves of 273 million tons (since January 2020) that hosted a 1250 ΜW lignite-fired power plant for almost 40 years. Inside dumping was conducted mainly with spreaders (continuous surface mining) and, in some cases, with trucks and loaders (non-continuous surface mining). The internal waste dumps are estimated in the order of ≈1.0 billion m3. Currently, the region’s economy depends on agriculture and energy fuel reserves.
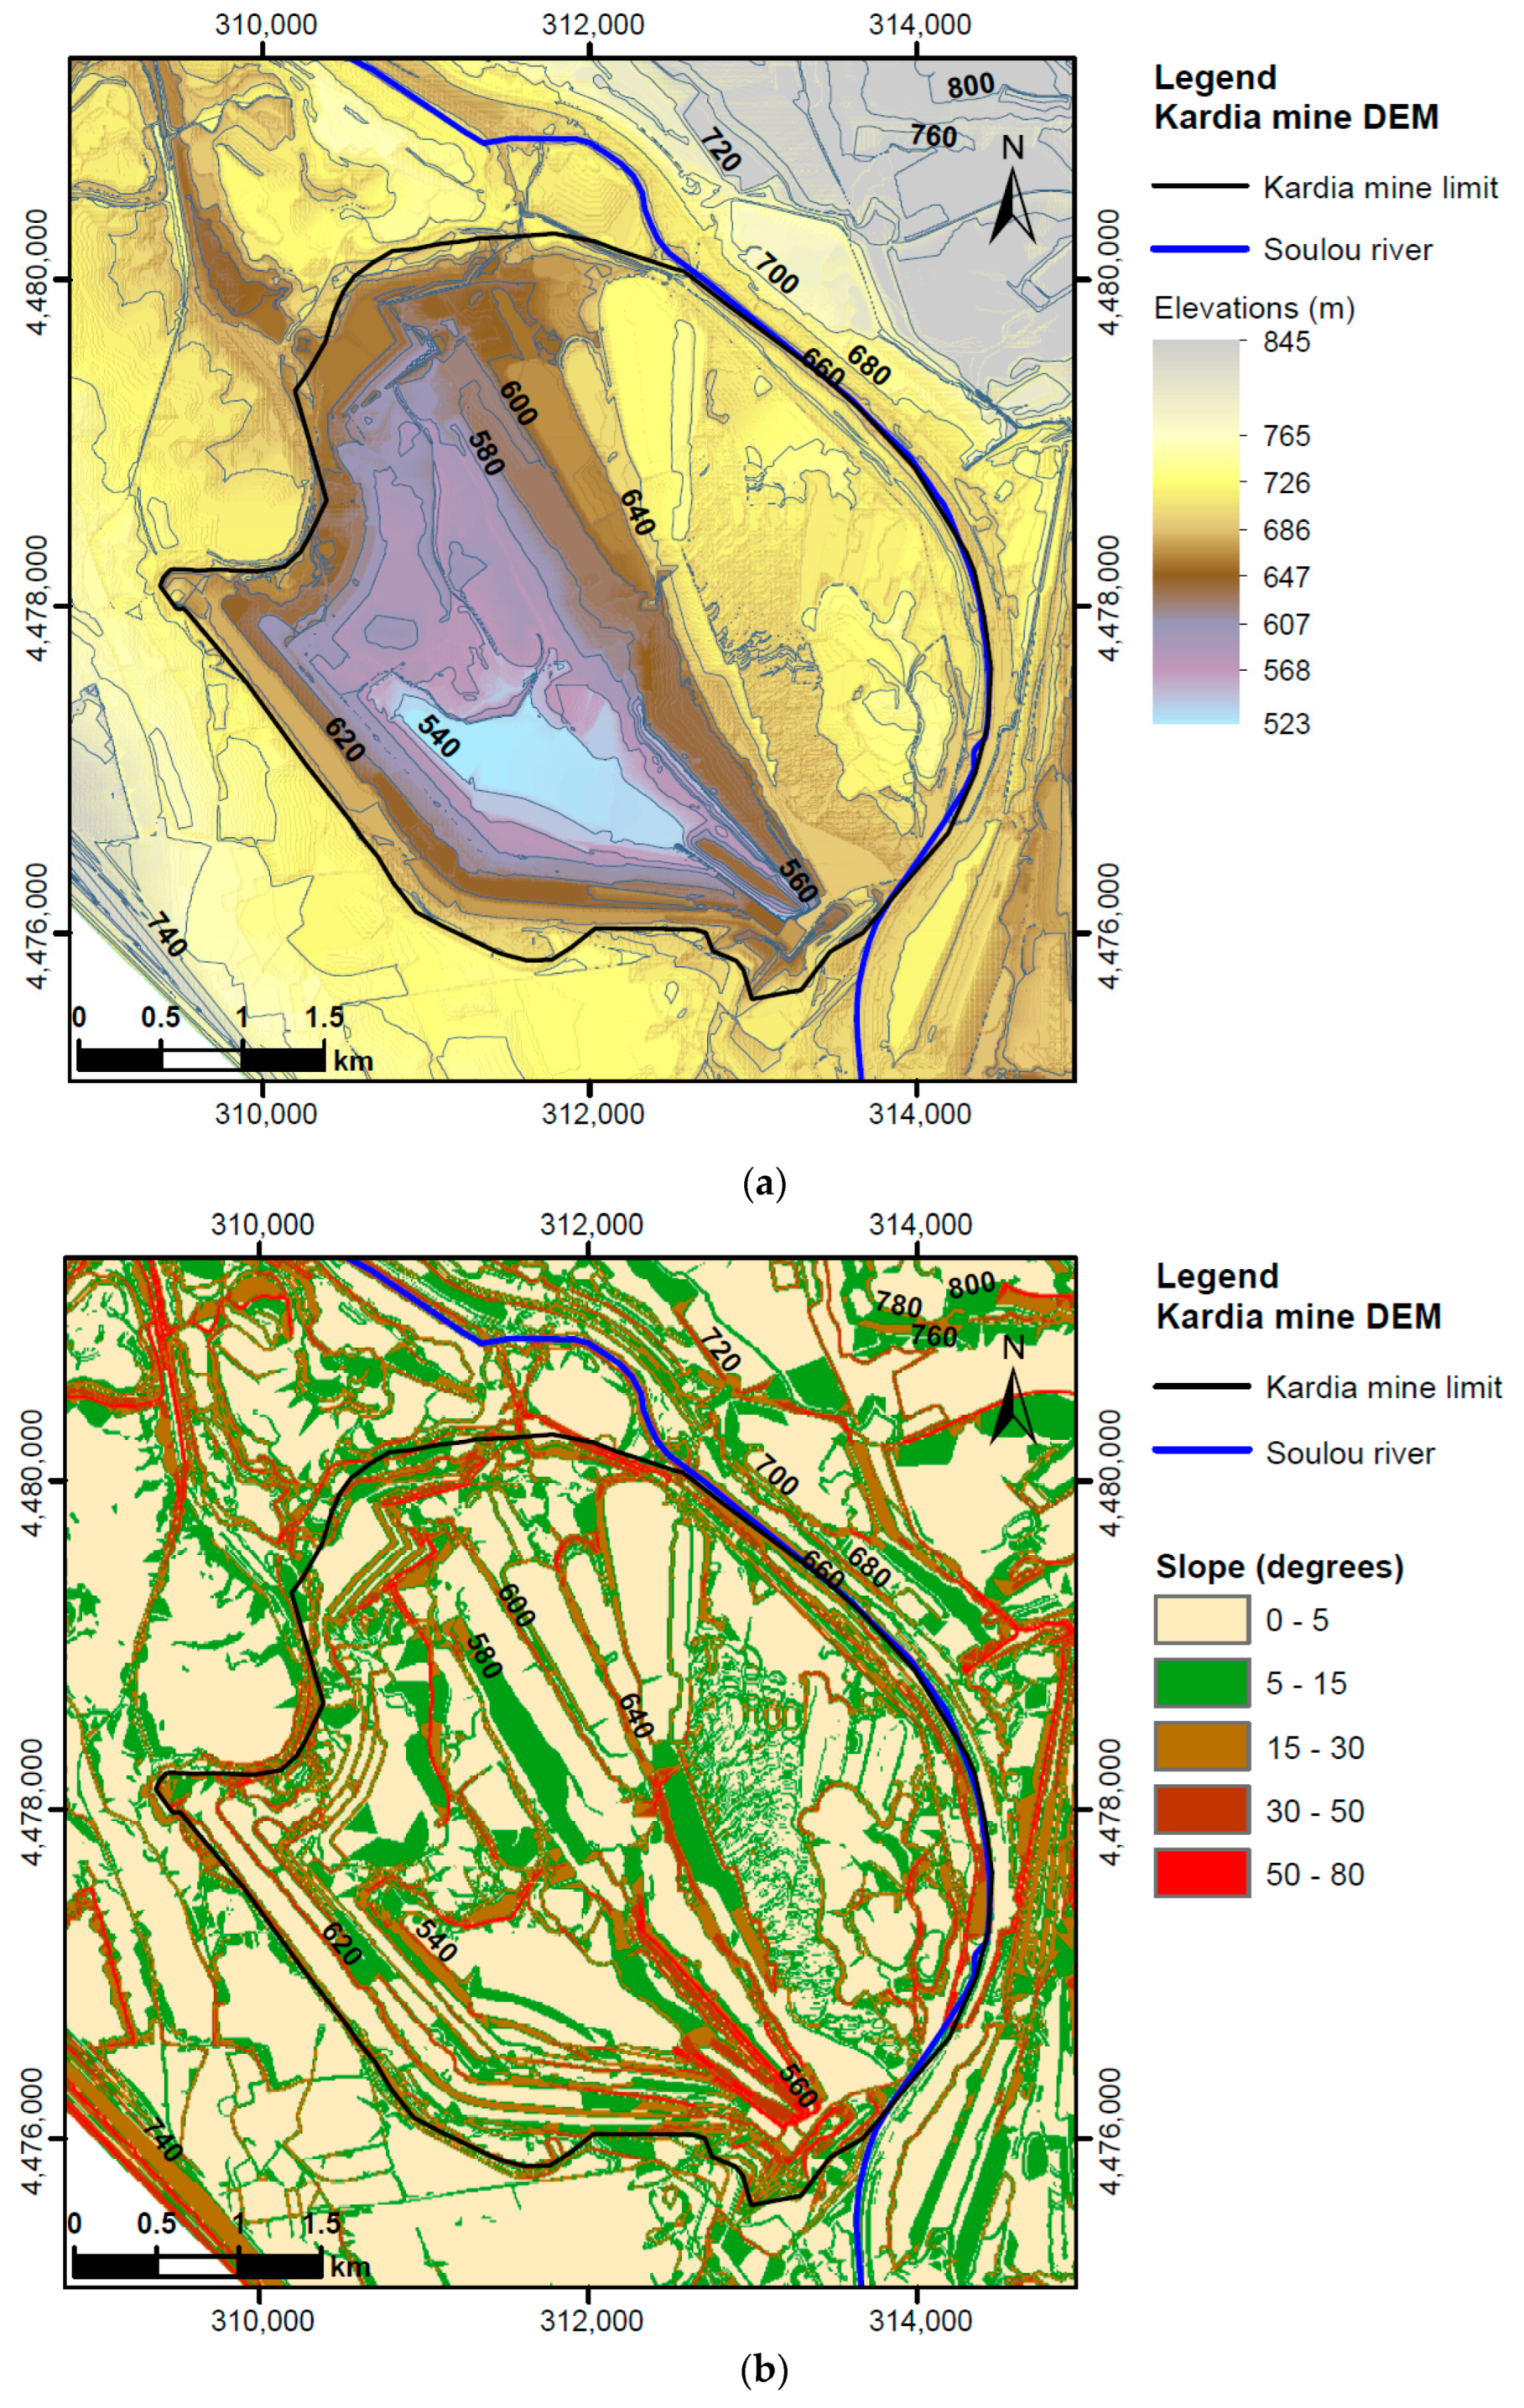
The deepest part of the Kardia mine excavation was +450 m a.s.l. when lignite exploitation activities terminated in 2021. By the end of 2022, backfilling of the bottom of the mine pit is planned to achieve slope stability conditions, and thus, the bathymetry of the Kardia excavation will alter, with the deepest part forming at approximately +523 m a.s.l. (Figure 2). The range of ground elevations in the pit is between ≈+523 m and +670 m a.s.l.
2.2. Hydrological and Hydrogeological Setting
The broader research area is part of larger lignite basins of western Macedonia, formed during the Pliocene. The region has a complex of natural lakes (Chimaditida, Zazari, Petron and Vegoritis) (Figure 1). Vegoritis Lake is located in the homonymous closed hydrological basin in western Macedonia, Greece, and is the final receiving body of the basin runoff, with a total area of 2000 km2. Vegoritis Lake is also the surficial feature of a major karstic aquifer [23]. Therefore, any alteration in the surface or groundwater conditions within this area would affect the level of the lake. The primary water discharge into the lake is achieved via the Soulou River [24,25]. Therefore, the main priority of the PPC is not only the protection of the natural lakes but also the monitoring of the artificial lake evolution developed in the open voids of the closed lignite mines, as well as the evaluation of the chemical properties of lake water and of the new aquatic ecosystem that is formed.
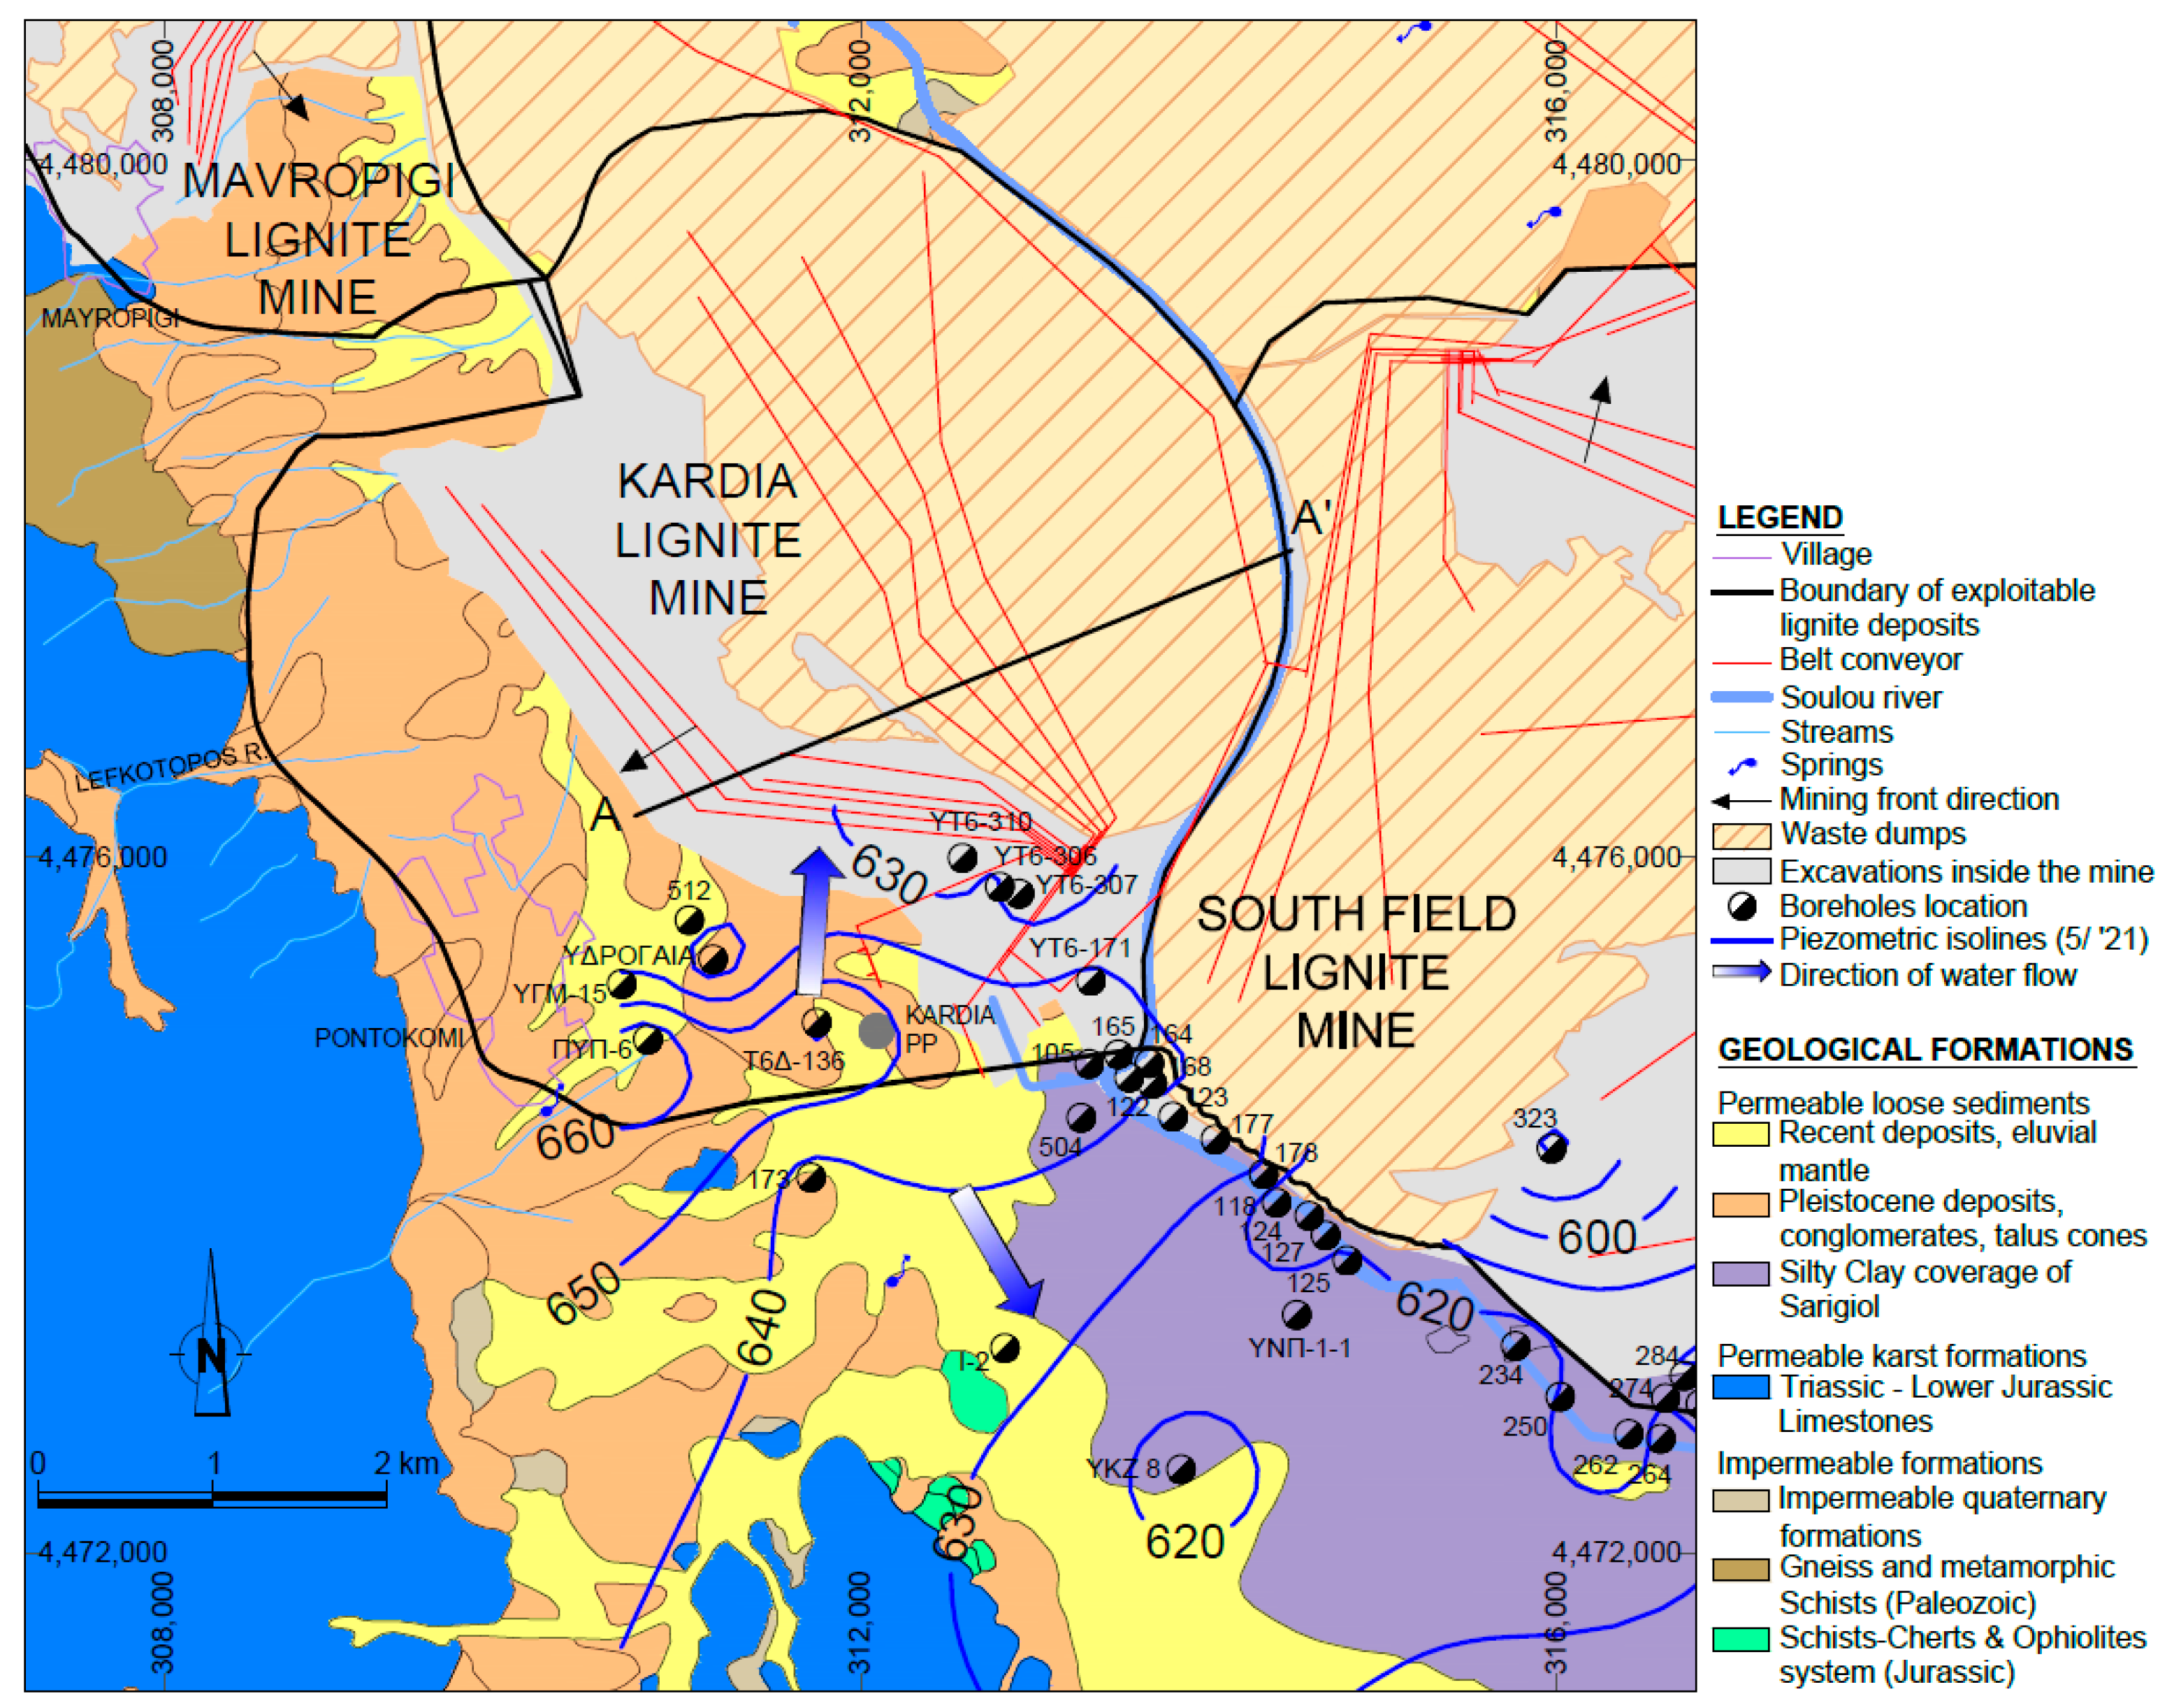
Kardia open pit is an exhausted mine located on the western margins of the South Ptolemais lignite-bearing basin (Sarigiol basin) in the foothills of Askion Mountain. Quaternary sediments are met on the broader area, which consists mainly of intercalations of sands, clays, sandy marls and conglomerates. These formations overlie Paleozoic schists, ophiolites and granite formations. In addition, Mesozoic dolomitic limestones, volcanic sediments and flysch overlay the Paleozoic formations [6,26]. The lignite sequence underlies the Quaternary sediments and consists of impermeable Pliocene formations of marls and lignite. Lignite sequence formation is significant for the South Field Lignite Mine (LM) and Kardia LM operations due to the potential slope instabilities associated with sliding along a sub-horizontal lignite-to-clay/marl interface, mainly caused by the groundwater pressures [27].
Regarding the hydrolithological conditions in the area of the Kardia mine, two aquifers are generally recognized, the upper (Sarigiol aquifer) and the lower (Komanos aquifer). These aquifers are separated via the impermeable lignite sequence. The upper unconfined aquifer consists of high permeability layers (sands, conglomerates) with intercalations of low permeability layers (clayey interlayers, fluvial deposits). This unit consists of a unique hydraulically connected network that behaves as one aquifer [24].
The hydrogeological basin of Ptolemais South Field (Sarigiol basin) is surrounded by the Vermion (east side), Askion (west side) and Skopos (south side) mountains. The northern part of the basin is bounded by the Komanos tectonic horst. Most of the streams originate from the surrounding mountains, where the general water flow direction is towards the Soulou River. Part of the surface run-off is discharged into the Soulou River via the consolidated sediment channels formed on the ground surface, while part of the water is infiltrated inside the sediment formations. The stream network and the Soulou River are presented in Figure 3. The recharge area of the Sarigiol aquifer is mainly the Vermion and Askion foothills conglomerates and talus cones, whereas the Soulou River is the main outflow channel of the basin, which directs the water flow into Vegoritis Lake, north of the Kardia lignite mine (Figure 1).
Regarding the Sarigiol aquifer, the piezometric surface is conducted by considering the water levels measured in the boreholes. Based on the piezometry in the area of interest, the piezometric level is met at elevations between ≈+640 m and +660 m a.s.l. (Figure 3). The predominant direction of groundwater flow in the Sarigiol aquifer body south of the Kardia mine is generally NW to SE, while locally, next to the open pit Kardia mine location, the direction that prevails is S to N. It is noted that in the same area, the lignite sequence is met at elevations between ≈+350 m and +500 m a.s.l., while during excavations inside the Kardia open pit, the bottom of the lignite sequence was not revealed. Thus, in the conceptual model of Kardia pit lake formation, the simulation was oriented only in the aquifer above the lignite sequence, i.e., the Sarigiol aquifer.
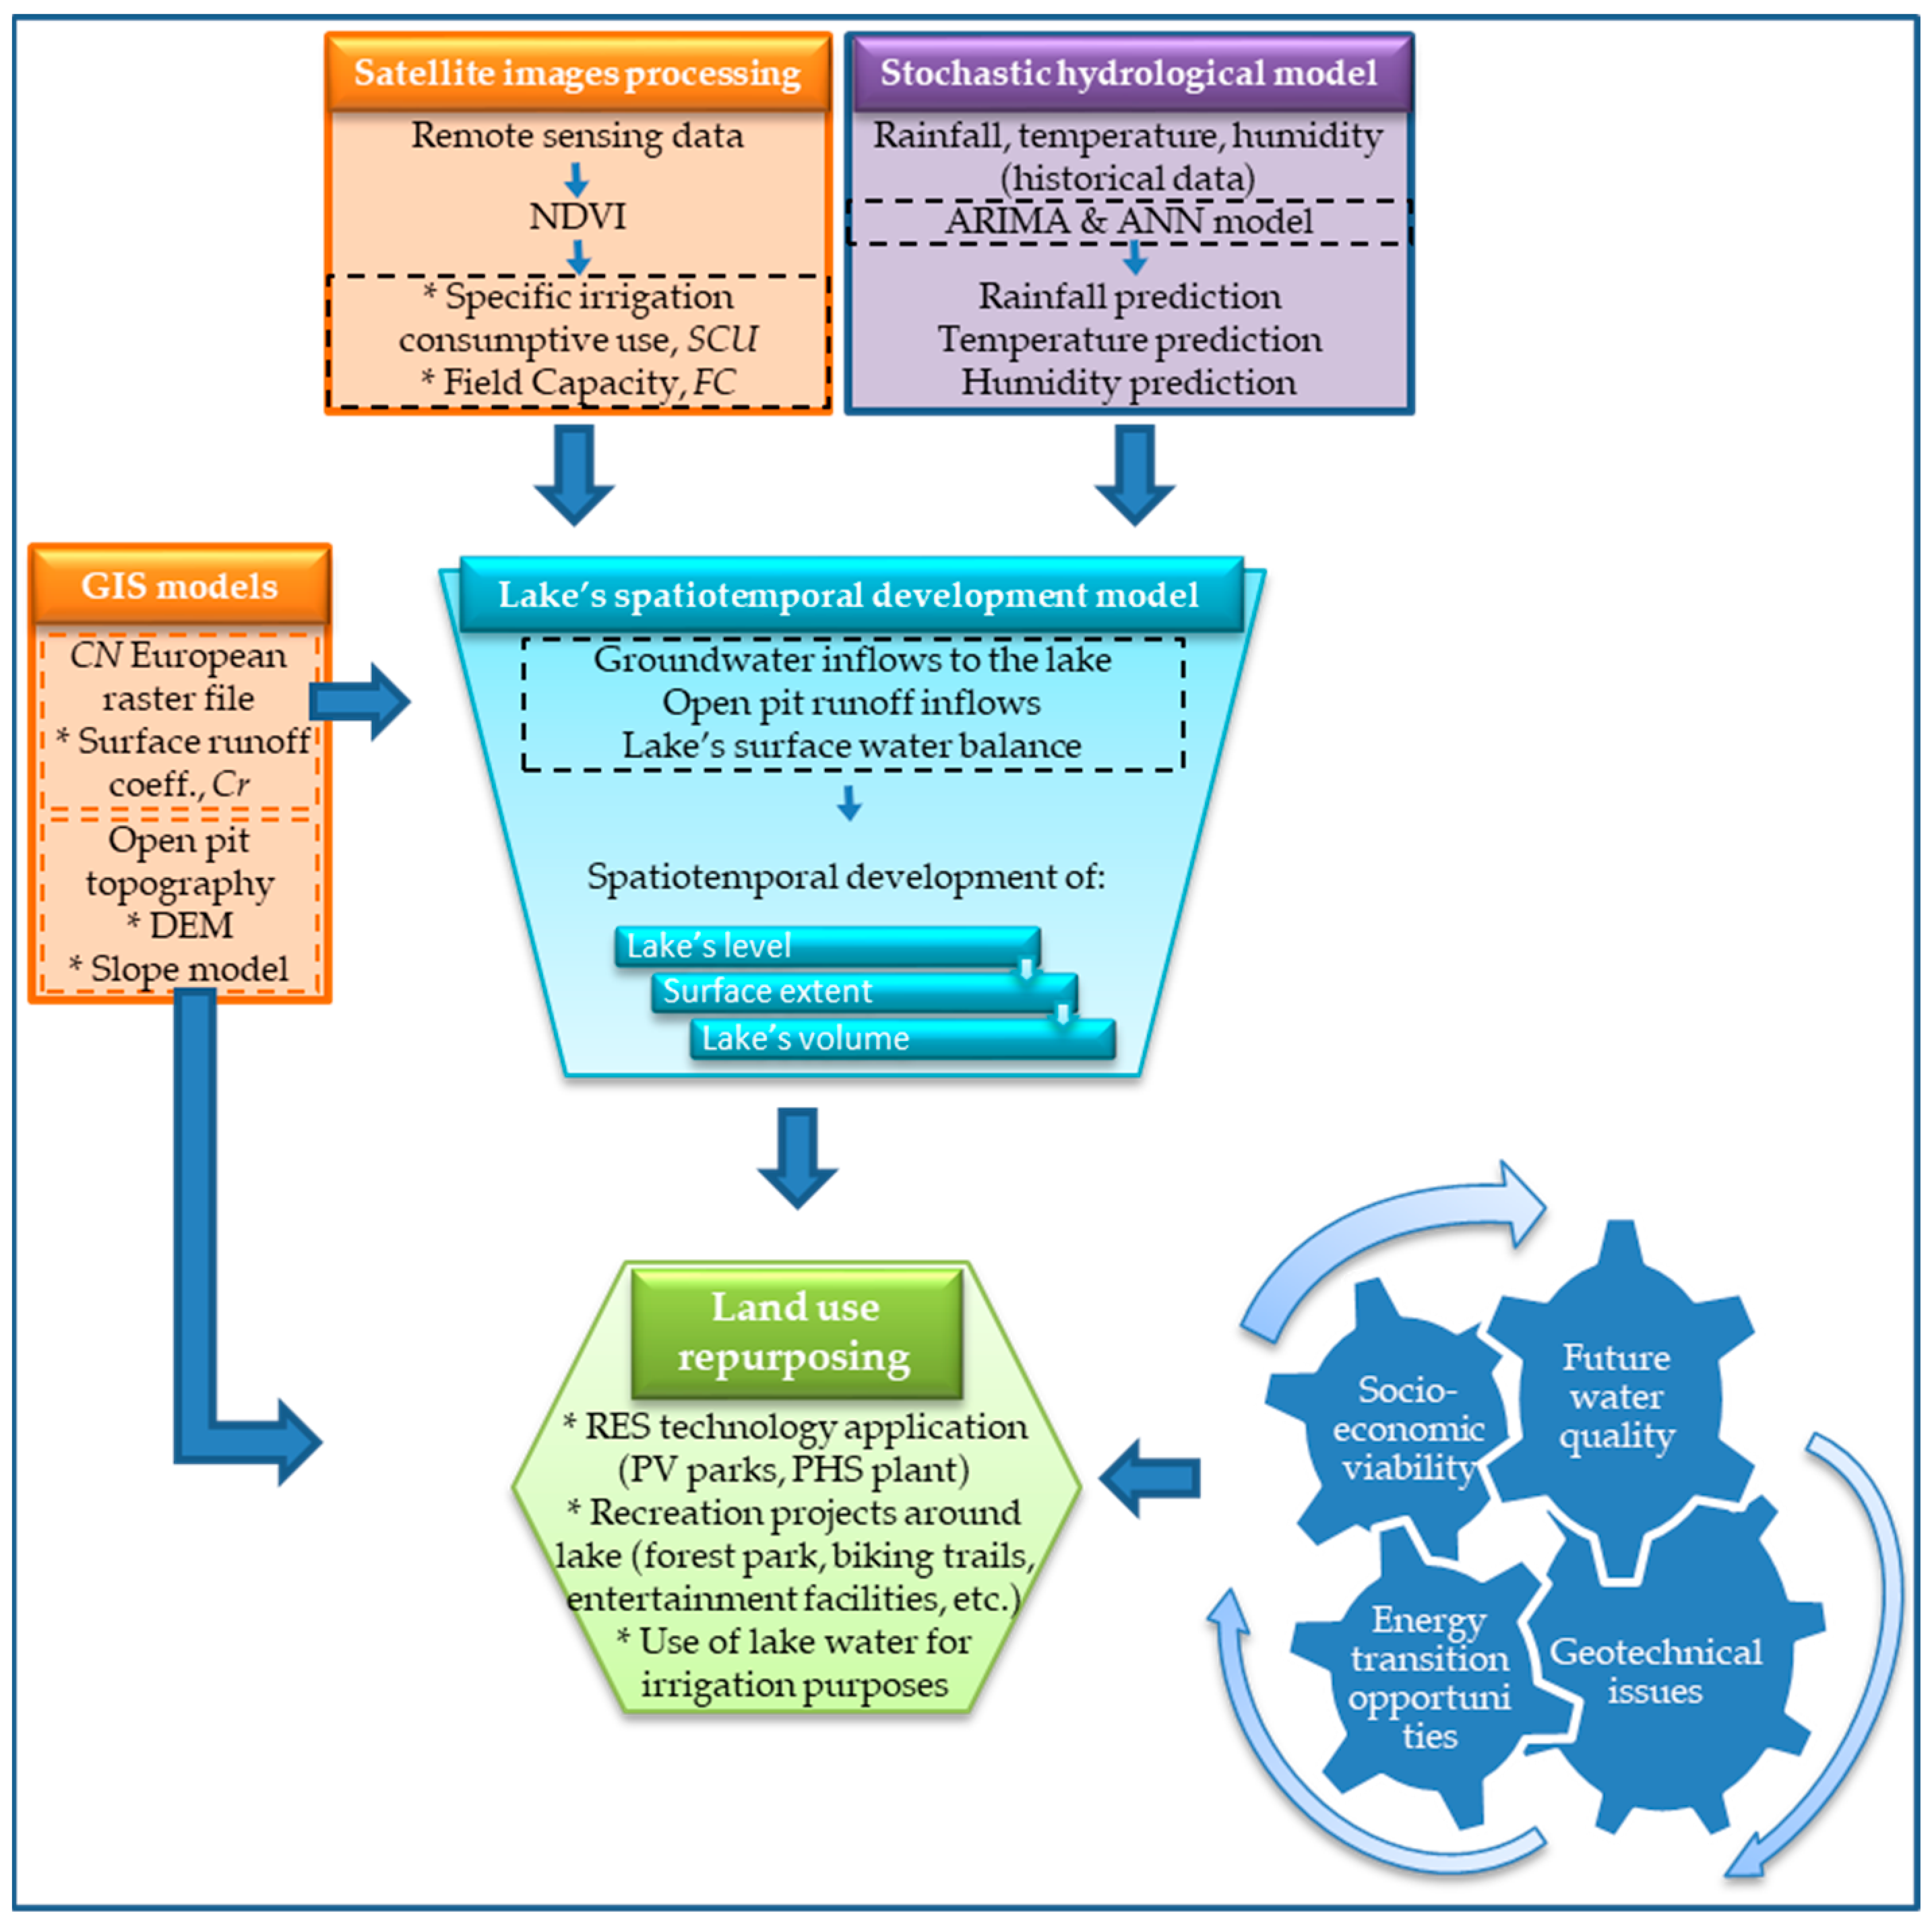
In Figure 4, the methodological approach is presented briefly illustrating the modeled processes.
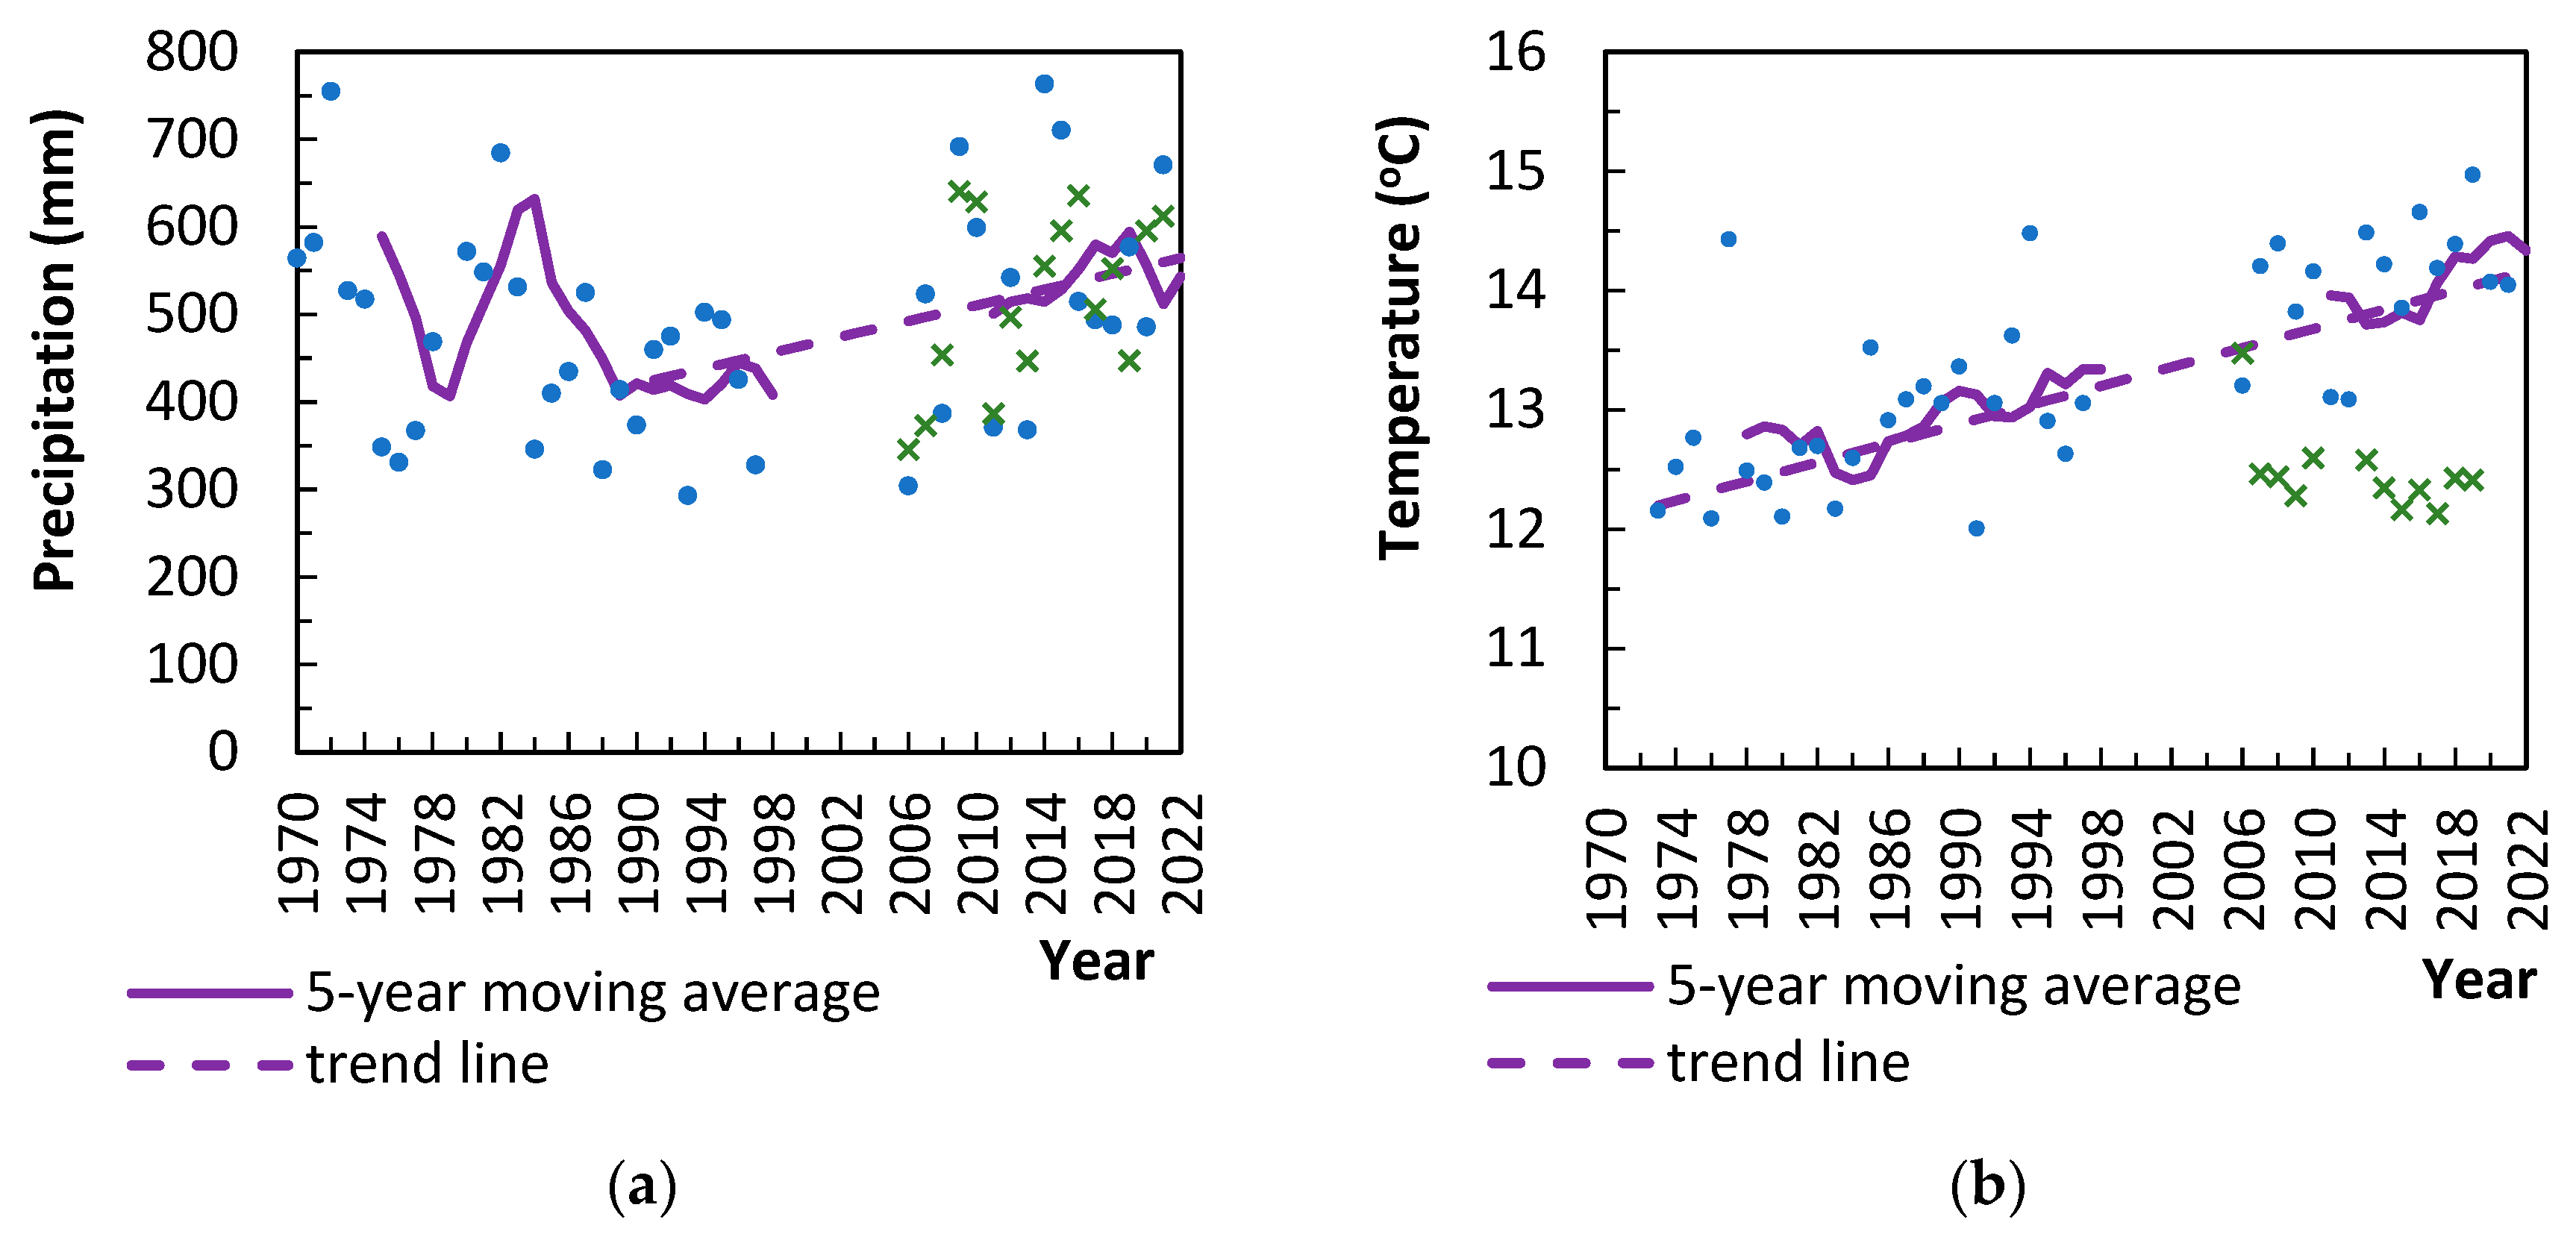
The renewable resource of the aquifer is the rainfall infiltration through the Quaternary sediments. Meteorological data (temperature, rainfall) were obtained from Kozani WMO No 16 632 weather station, recorded by the Hellenic National Meteorological Service, and spanning a period of 44 years, from 1970–1997 and 2006–2021 (Figure 5). This station is approximately at the same elevation as the Ptolemais lignite field, located 14 km south of the Kardia LM. Meteorological data were also obtained from Ptolemaida LG26 weather station, recorded by the National Observatory of Athens (ΝOA), and spanning a period of 15 years, from 2006–2021.
According to the meteorological stations’ data, the study location in the Kardia lignite mine, in Ptolemais, had a Köppen climate classification of Cfa (moist with mild winters, wet all seasons with a hot summer), which is consistent with the updated 1-km resolution global maps of the Köppen–Geiger climate classification [28]. The average annual rainfalls at Ptolemais were 498.1 mm (±132.1 mm s.d.), and November was the wettest month with average monthly precipitation of 56.7 mm, while August was the driest month with an average monthly precipitation of 31.7 mm. The average annual temperature was 13.3 °C (±0.8 °C s.d.), with January being the coldest month, with an average temperature of 2.4 °C and the highest temperature of 6.1 °C. According to the meteorological data, there is a visible trend of long-term increase in temperature, presenting an average increase of approximately 2.2 °C over the last 50 years. Regarding precipitation, there seems to be an increasing trend during the period of the last 30 years.
Thornthwaite’s water balance method [29,30] was used to predict the mean annual runoff for the unsaturated zone in the pit’s catchment area and the Sarigiol hydrological basin. This method can provide mean annual estimates in close agreement with measured values [31]. The unsaturated zone’s water balance during the time interval is described through the moisture content . The moisture content at the end of time is described by the following equation [30]:
where all quantities are expressed to the unit area, and is the water content stored inside the unsaturated zone at the time (mm), is the precipitation rate (mm/month), is the real evaporation (mm/month), is the surface runoff outflow (mm/month), is the percolation rate (mm/month).
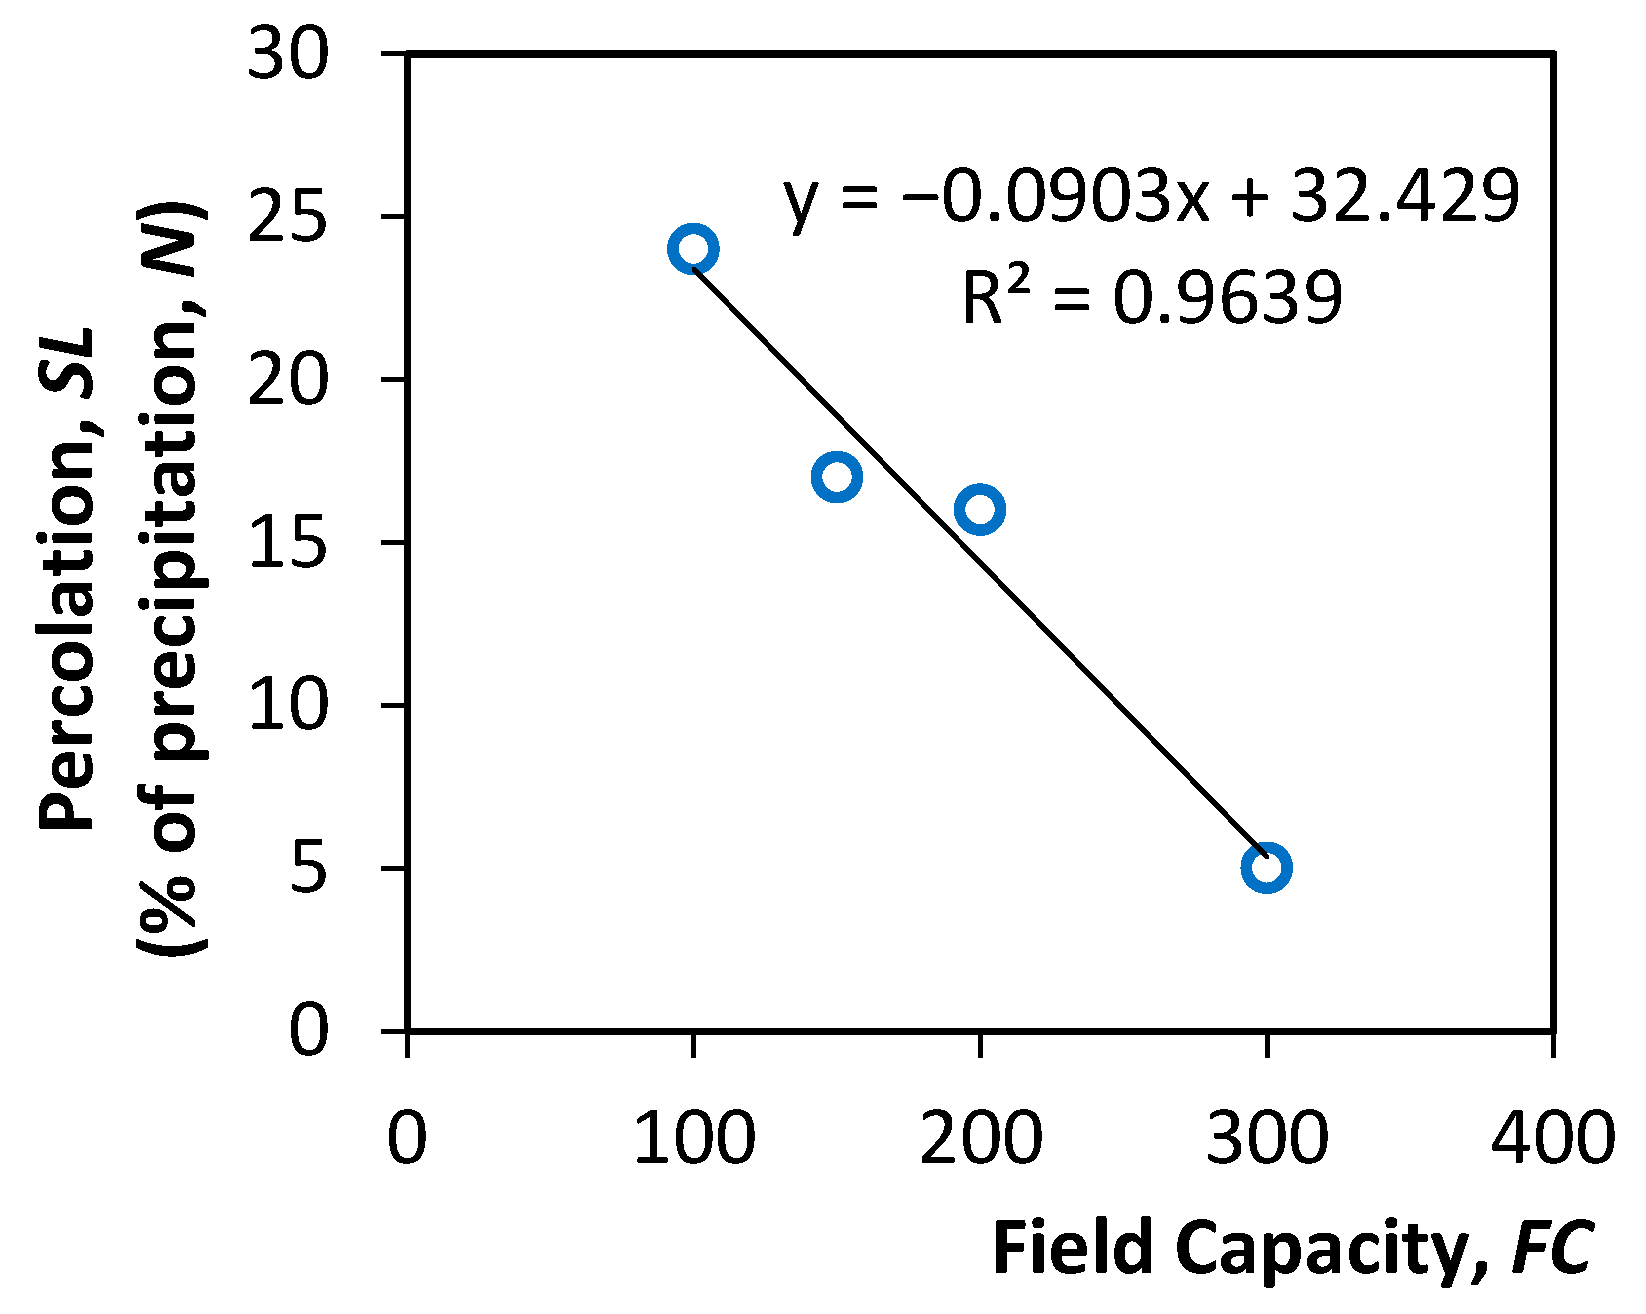
In the calculations, it was considered that deep percolation takes place when soil moisture reaches 70% of the field capacity () [32], where is the amount of water remaining when downward drainage has markedly decreased. Therefore, the following equations were applied for the different cases [30]:
The real evaporation was estimated as a portion of Τhornwaite potential evaporation . It was assumed that real evaporation takes place when soil moisture reaches 70% of the field capacity, and thus, the following equations were applied for the different cases:
The potential evaporation is derived by the following equation:
where is the mean temperature of month , is a temperature coefficient of monthly temperature coefficients summation (), where and value can be determined as a polynominal function of the temperature coefficient , where .
In addition, in the hydrological model it was assumed that real evaporation cannot exceed the available water derived from precipitation and soil moisture and thus, .
Considering the climate conditions in Greece, for the specific area, it is expected that soil moisture content reaches in April and thus, regarding the initial conditions of the unsaturated water balance at the time , then for April.
Sensitivity analysis performed towards field capacity for the unsuturated zone water balance Thornwaite model revealed the following linear relation between and percolation coefficient aspercentage (%) of rainfall, which is taken as a percentage of precipitation, presenting a coefficient of determination (Figure 6):
This relation helped in transforming values (deduced from values) into percolation rate values .
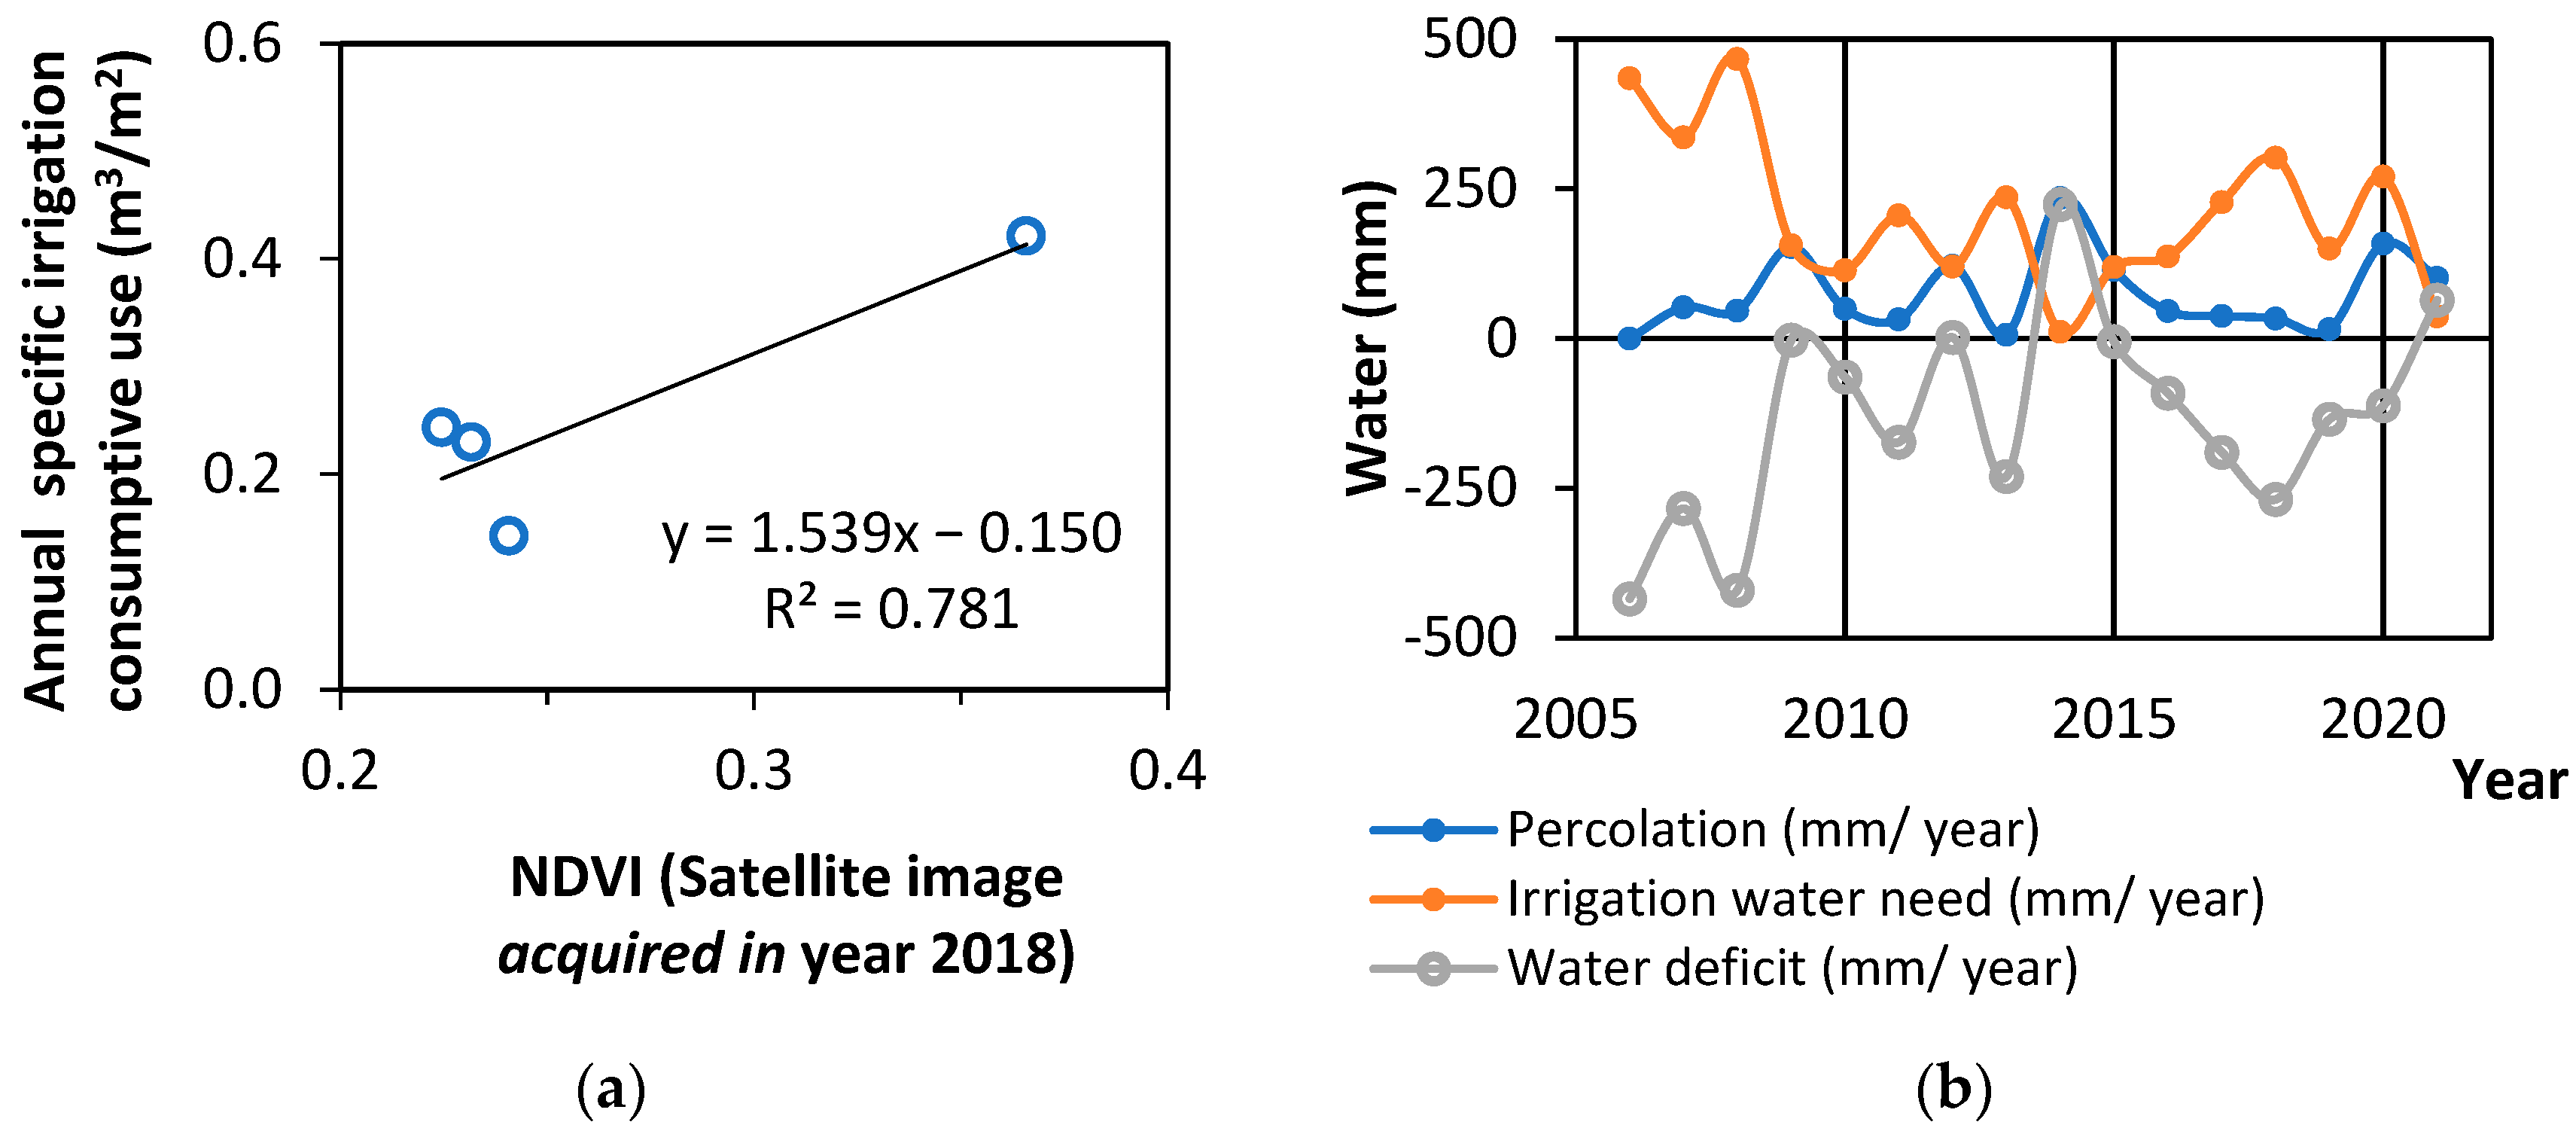
According to the results (Table 1), for the hydrological cycle in the Sarigiol basin (2006–2021), the mean annual precipitation that the loose sediment basin receives is approximately 584 mm, while the real annual evaporation is estimated to be approximately 425 mm. Also, based on the 15-hydrological year annual water balance output, only 86 mm per year percolates down and recharges the unsaturated zone, which constitutes the long-term renewable recharge of the aquifer. Therefore, there is only one discharge from the Sarigiol basin, i.e., the surface runoff that occurs through the outflow of the Soulou River. In different historical time periods, either the Sarigiol aquifer discharges into the Soulou River or the Soulou River recharges the Sarigiol aquifer, depending on the groundwater level.
2.3. Conceptual Model for the Pit Lake Long-Term Water Balance
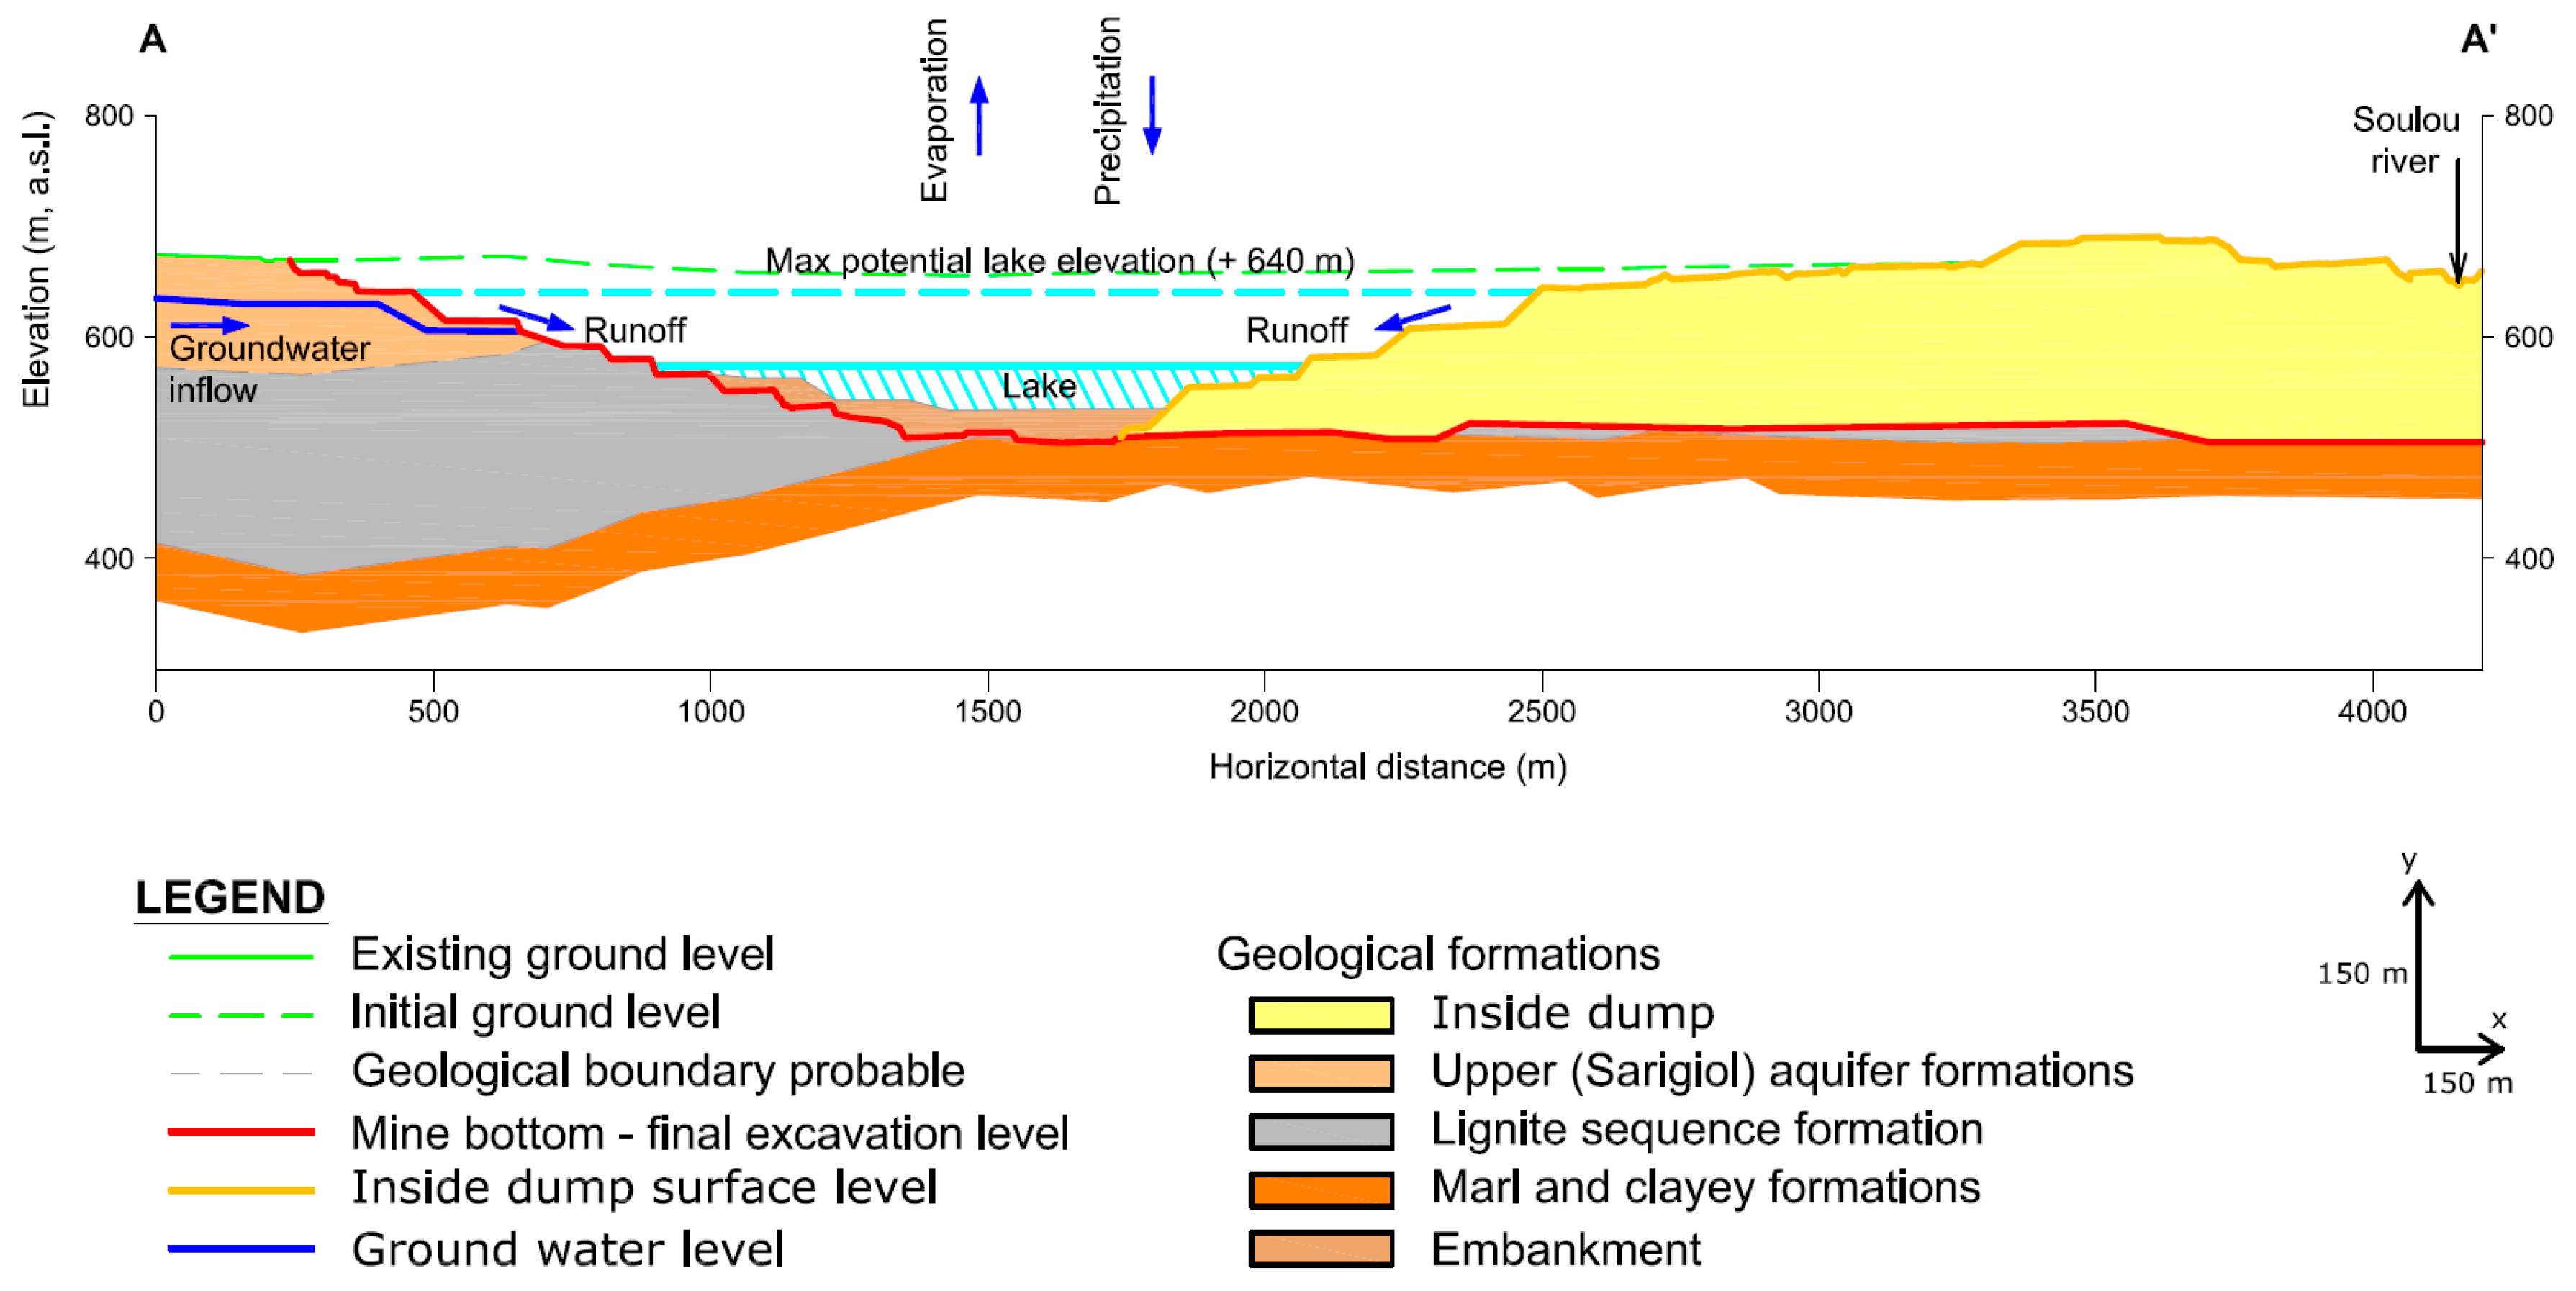
In order to calculate the spatiotemporal evolution of the lake inside the Kardia open pit, a simplified conceptual hydrogeological model was developed (Figure 7), following the hydrogeological conceptual model of Louloudis et al. [33], in which the different origins of water inflows into the pit lake’s body are presented. The inflows include (a) the groundwater inflows from the slope seepage face, (b) the surface runoff into the open pit, considering the open pit as a catchment area, and (c) water losses from the lake surface that occur due to direct evaporation processes which result in reducing the net recharge over the lake surface area (i.e., the hydrological processes of precipitation minus evaporative losses over the lake surface area).
2.3.1. Groundwater Inflows
Since the dewatering measures adopted for mine protection will cease after the mine closure by the end of the year 2022, the inflowing groundwater will then begin to increase. As a result, the open pit will fill with groundwater rebound, and the groundwater level will rise. The discharging water derives from the upper aquifer (i.e., above lignite stratification) and the confined aquifers inside the recently developed internal dumps.
For the initial conditions of the model in the year 2022 () the groundwater inflow was calculated by Darcy’s law [34] to be around 1.7 × 10⁶ m3. This quantity was cross-validated by the records of the water sump pumped quantities during the summer period in 2020, considered as baseflow of surficial hydraulic protection. Specifically, approximately 1.2 × 10⁶ m3 of groundwater inflow is pumped from the sumps, and 0.5 × 10⁶ m3 is pumped from the dewatering wells during the summer period. In addition, the seepage face of groundwater inflow into the excavation is also subjected to an evaporation procedure at mine’s benches. For the Kardia mine, it is estimated that 70% of this quantity is evaporated; thus, only 30% of the groundwater inflow finally reaches and recharges at the pit lake’s water body (i.e., around 0.6 × 10⁶ m3).
For each year of the prediction period, the groundwater inflow was estimated with respect to the surface lake water level increase. More specifically, the groundwater inflow rate per unit face length is calculated according to the following equation [35]:
where is the hydraulic conductivity, is the aquifer’s thickness, is the influence radius of the open pit and is the height of the lake water level calculated from the surface of the lignite sequence (considered as impermeable formation).
Hydraulic conductivity ranges from 1.03 to 25.92 m/day, according to pumping tests analysis [36], with an average value of 13.48 m/day. The upper aquifer’s thickness is estimated in the order of 100 m [24,36] and thus, transmissivity presents an average value in the order of 50 m2/day on the west side of Kardia excavation and a range of 200–1200 m2/day in the south region, while the average hydraulic gradient towards the excavation is approximately 2%, as depicted in Figure 3.
To delineate the groundwater inflow rate in the future, groundwater attenuation is considered due to the excessive irrigation consumptive use in the area. In the methodology followed for estimating the aquifer’s depletion, the groundwater recharge of the Sarigiol aquifer around Kardia excavation was considered and the specific consumptive use of irrigation water. The renewable recharge of the aquifer was estimated via Thornthwaite’s water balance method (Table 1), while the was derived from the evapotranspiration .
For the calculation of the crop water needs , i.e., the water amount needed to meet the water loss through evapotranspiration, the following general relationship between the reference crop and the crop actually grown was used:
where is the reference crop evapotranspiration calculated by using the Blaney–Criddle method (mm/month) [37], while is the crop factor derived from the normalized difference vegetation index () [38] which was estimated equal to :
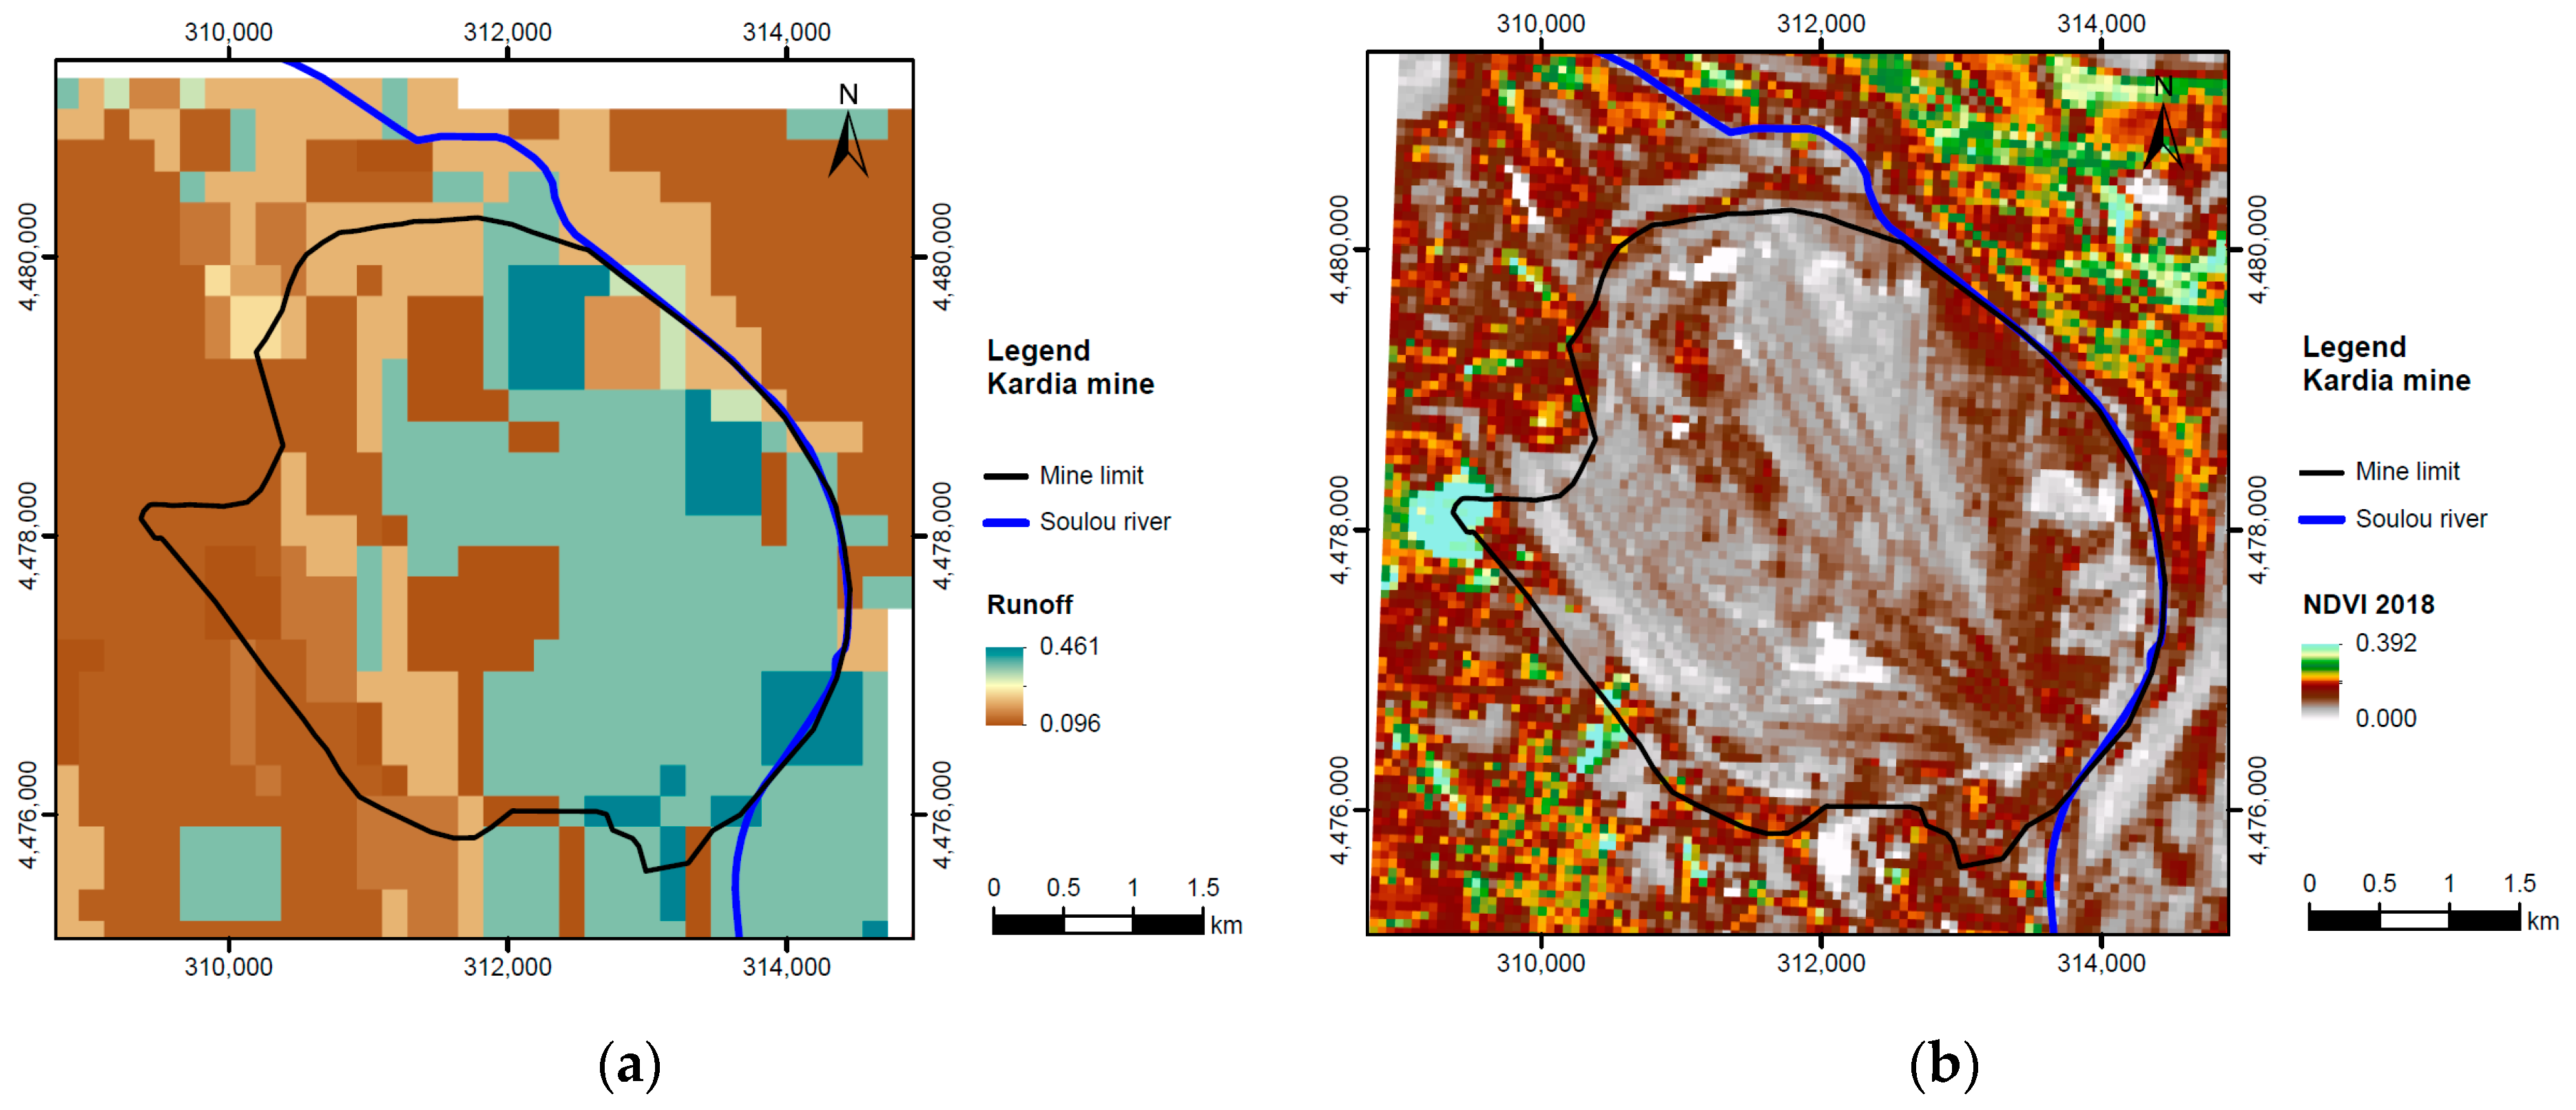
where is the mean daily temperature (°C), and is the mean daily percentage of annual daytime hours depending on the latitude of the area. In addition, satellite-based is computed from the red and near-infrared bands of the satellite by processing a satellite image acquired in 2018, as presented in Figure 8.
The crop water need is supplied to the crops by a combination of irrigation and rainfall. Therefore, the irrigation water need (, mm of water column/month) is the difference between the crop water need and the effective rainfall , i.e., the part of the rainfall effectively used by the plants:
where is estimated based on an empirical relationship presented by the Greek Land Reclamation Service of the Ministry of Agriculture [39] for the irrigation period from May to October:
where is the precipitation rate (mm/month).
Subsequently, the specific consumptive use (m3/m2) was derived from the irrigation water need (mm/ month), using the methodology used by Louloudis and Stathopoulos [40]. A statistically significant correlation between irrigation water (m3/m2) and is shown in the Figure 9, presenting a coefficient of determination . The linear regression analysis was performed by using the electric power consumption of irrigation pumps in the area of the Sarigiol basin for 2018 and also by using a Landsat image acquired in July 2018 (Landsat-8: 15 July 2018). Based on the results, the following relationship between the irrigation water (m3/m2) and was used for the calculation of the spatial distribution (Figure 8) for the Sarigiol basin area:
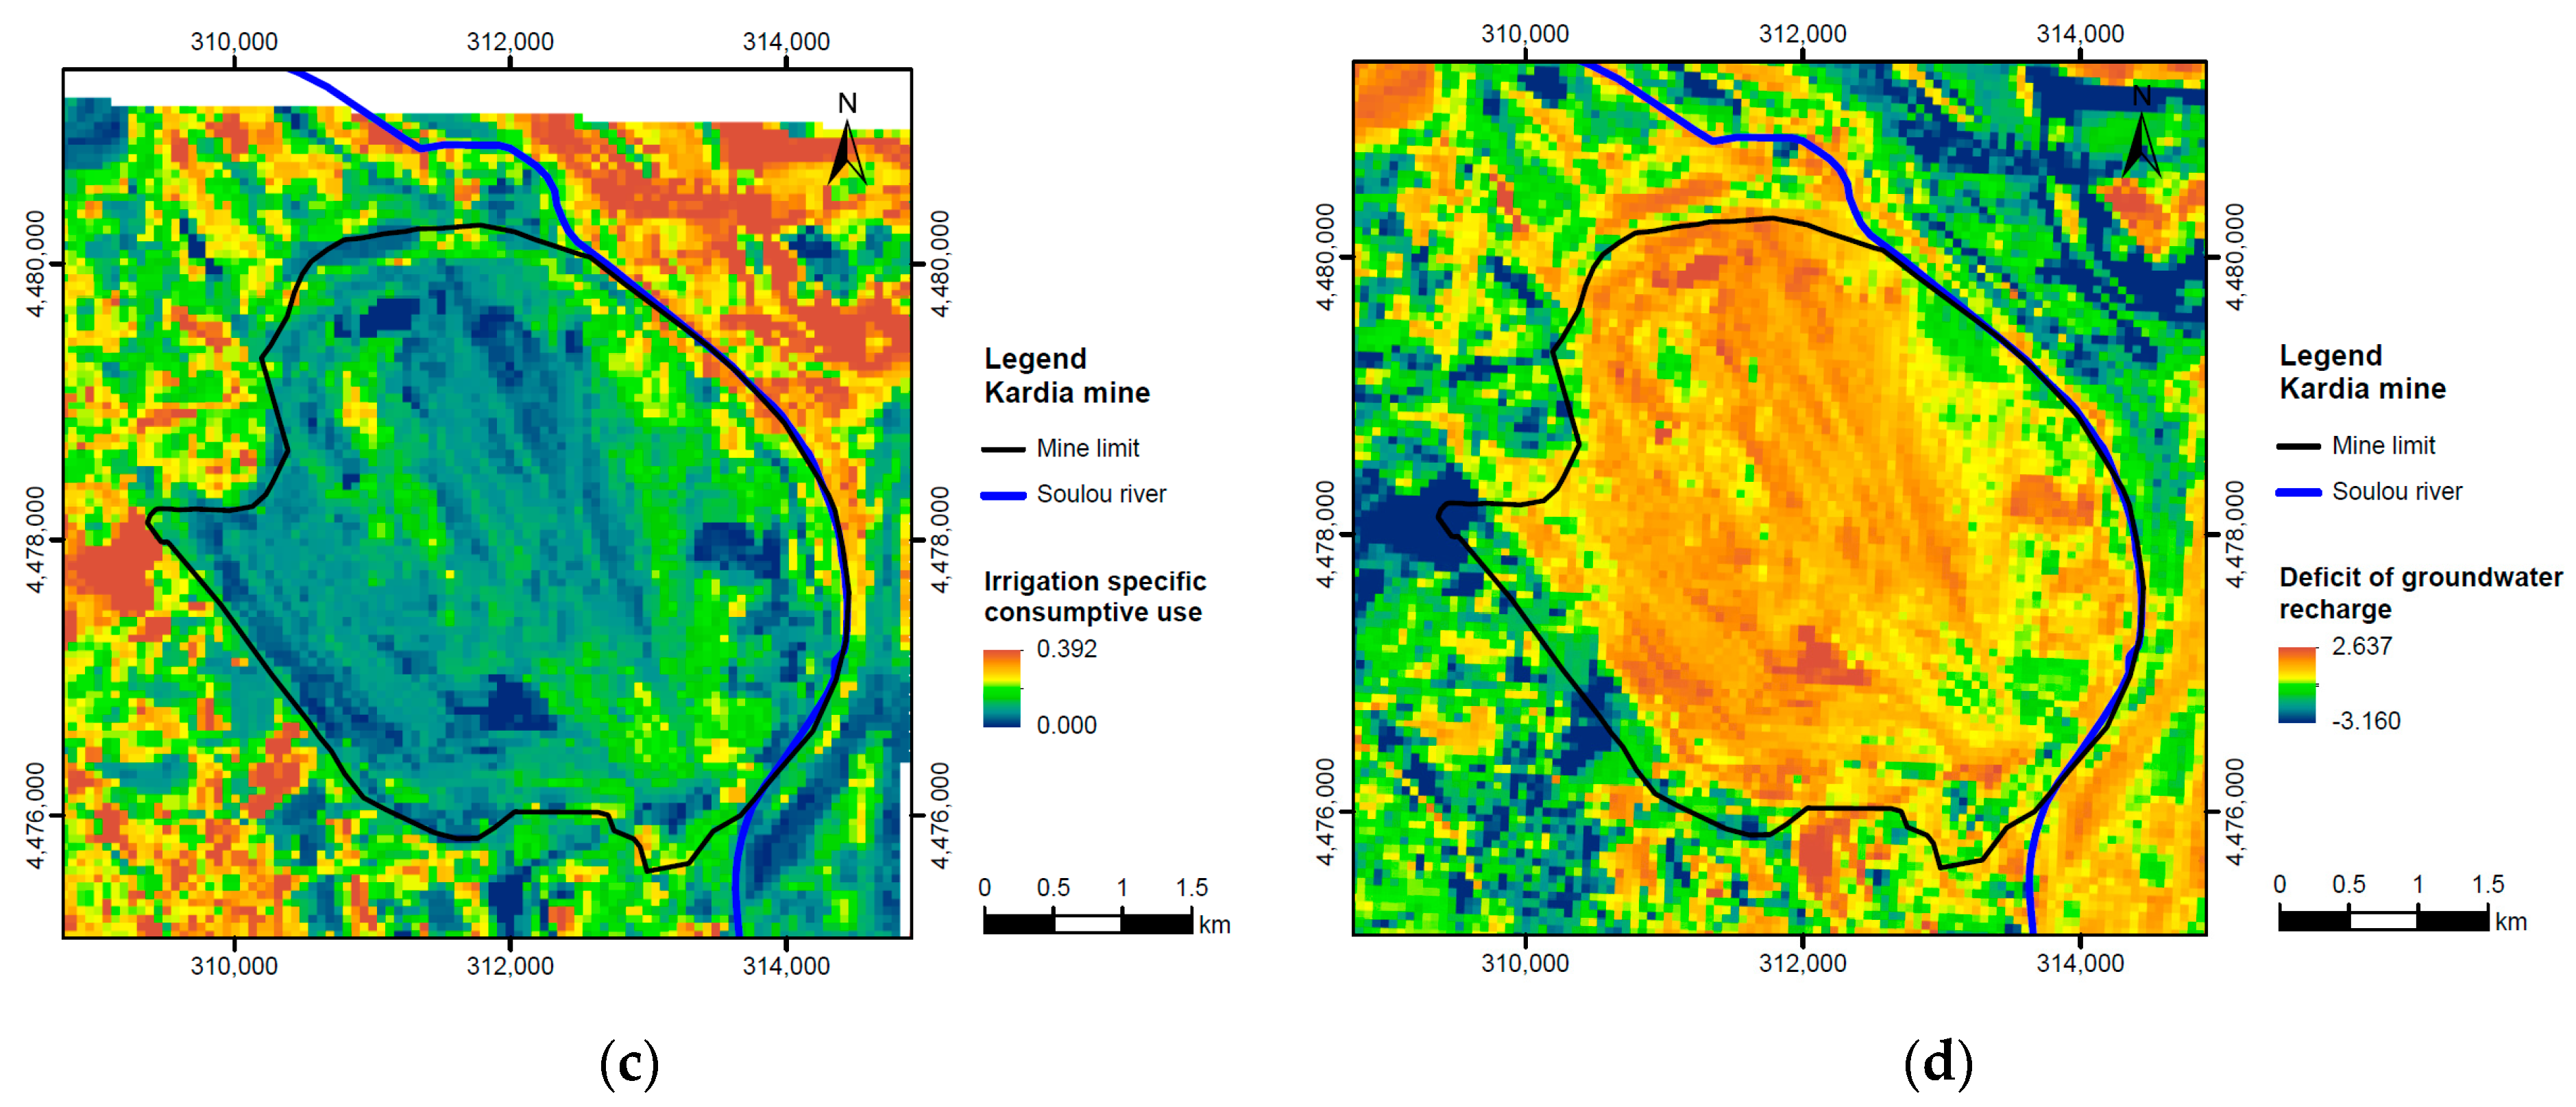
In addition, the deficit of groundwater recharge due to excessive irrigation consumptive use of groundwater near Kardia lignite field is presented in Figure 9, and its spatial distribution for the Sarigiol basin area is shown in Figure 8. The aquifer’s annual drawdown due to the irrigation for the period from July to September was calculated as a difference between annual percolation and irrigation water need, divided by the storage coefficient considered equal to 0.1.
2.3.2. Surface Runoff
Surface runoff is the most essential inflow to the lake’s body. Surface runoff also appears to be the more sensitive parameter in the lake’s filling model so there is a need for precision in surface runoff coefficients introduced to the model. In order to achieve a reliable estimation of the surface runoff coefficient, , in the hydrologically ungauged Kardia area, European raster file [41] was processed and the following equations were used [42,43]:
where is the volume of rainfall in mm, is the curve number, is the mean rainfall intensity (mm/h) for the time of the concentration (h) which is described by Giandotti equation [44].
In Figure 8 spatial distribution of the runoff coefficient using European raster file is presented. Based on the results, inside the active mine area, high values of the runoff coefficient are calculated, in the order of 30% to 40%, whereas outside the perimeter of the excavation, in the zone of the loose sediments between Kardia excavations and Askion Mountain the calculated values hardly exceed 15%. In the western area on the consolidated sediments of Askion Mountain, a runoff coefficient of 20% in magnitude is calculated, while northern of this area near Mavropigi village insignificant values in the order of 5% are revealed. Also, Lefkotopos and Lagorema streams in the region of Skopos Mountain consolidate carbonate sediments with a considerable runoff coefficient of 10% up to 20% in magnitude.
2.3.3. Water Losses from the Lake’s Surface
There are many expressions to evaluate evaporation from the lake’s water surface. The well-known, and highly accurate, Penman–Monteith approach involves many variables (air temperature, solar radiation, relative humidity, wind speed) [45,46,47] which in some cases may not be available. In these cases, adjusted equations with fewer weather parameters are used. Eagleman proposed a simple correlation between these parameters [48]:
where is the adjusted pan evaporation in inches per month (free surface evaporation), is the saturation vapour pressure [49] corresponding to the mean monthly temperature in millibars (mb), and is the mean monthly percent relative humidity:
In the case of the Kardia mine, mean values are used, i.e., the mean monthly temperature (°C), the mean monthly rainfall (mm) and the mean monthly relative humidity (%).
2.3.4. Spatiotemporal Development of the Pit Lake
A crucial research question that arises from this study is whether the pit lake can be naturally filled in a reasonable time frame or is there a need for artificial recharge by flooding with river water. Thus, the spatiotemporal development of the water level inside the Kardia pit void was assessed by generating forecasts of the dependent variables (rainfall and temperature) via linear (autoregressive integrated moving average—ARIMA) and non-linear (artificial neural network—ANN) models, following the same methodology described by Louloudis et al., for the Amynteon mine pit lake [33].
2.4. Energy Transition Strategies in the Post-Mining Era
In the Kardia mine, the PPC energy transition strategy is based on the PV parks that will be developed in the surrounding area, inside and outside the mining exploitation area. Thus, energy storage units are required to supplement the variable renewable capacity. In this mine, the best conditions prevail for a PHS facility installation thanks to its morphology, high exploitation depth of approximately 150 m, and sizable pit lake volume. Therefore, a PHS facility could be used as a storage battery and would provide sufficient storage capacity to compensate for renewable energy fluctuations.
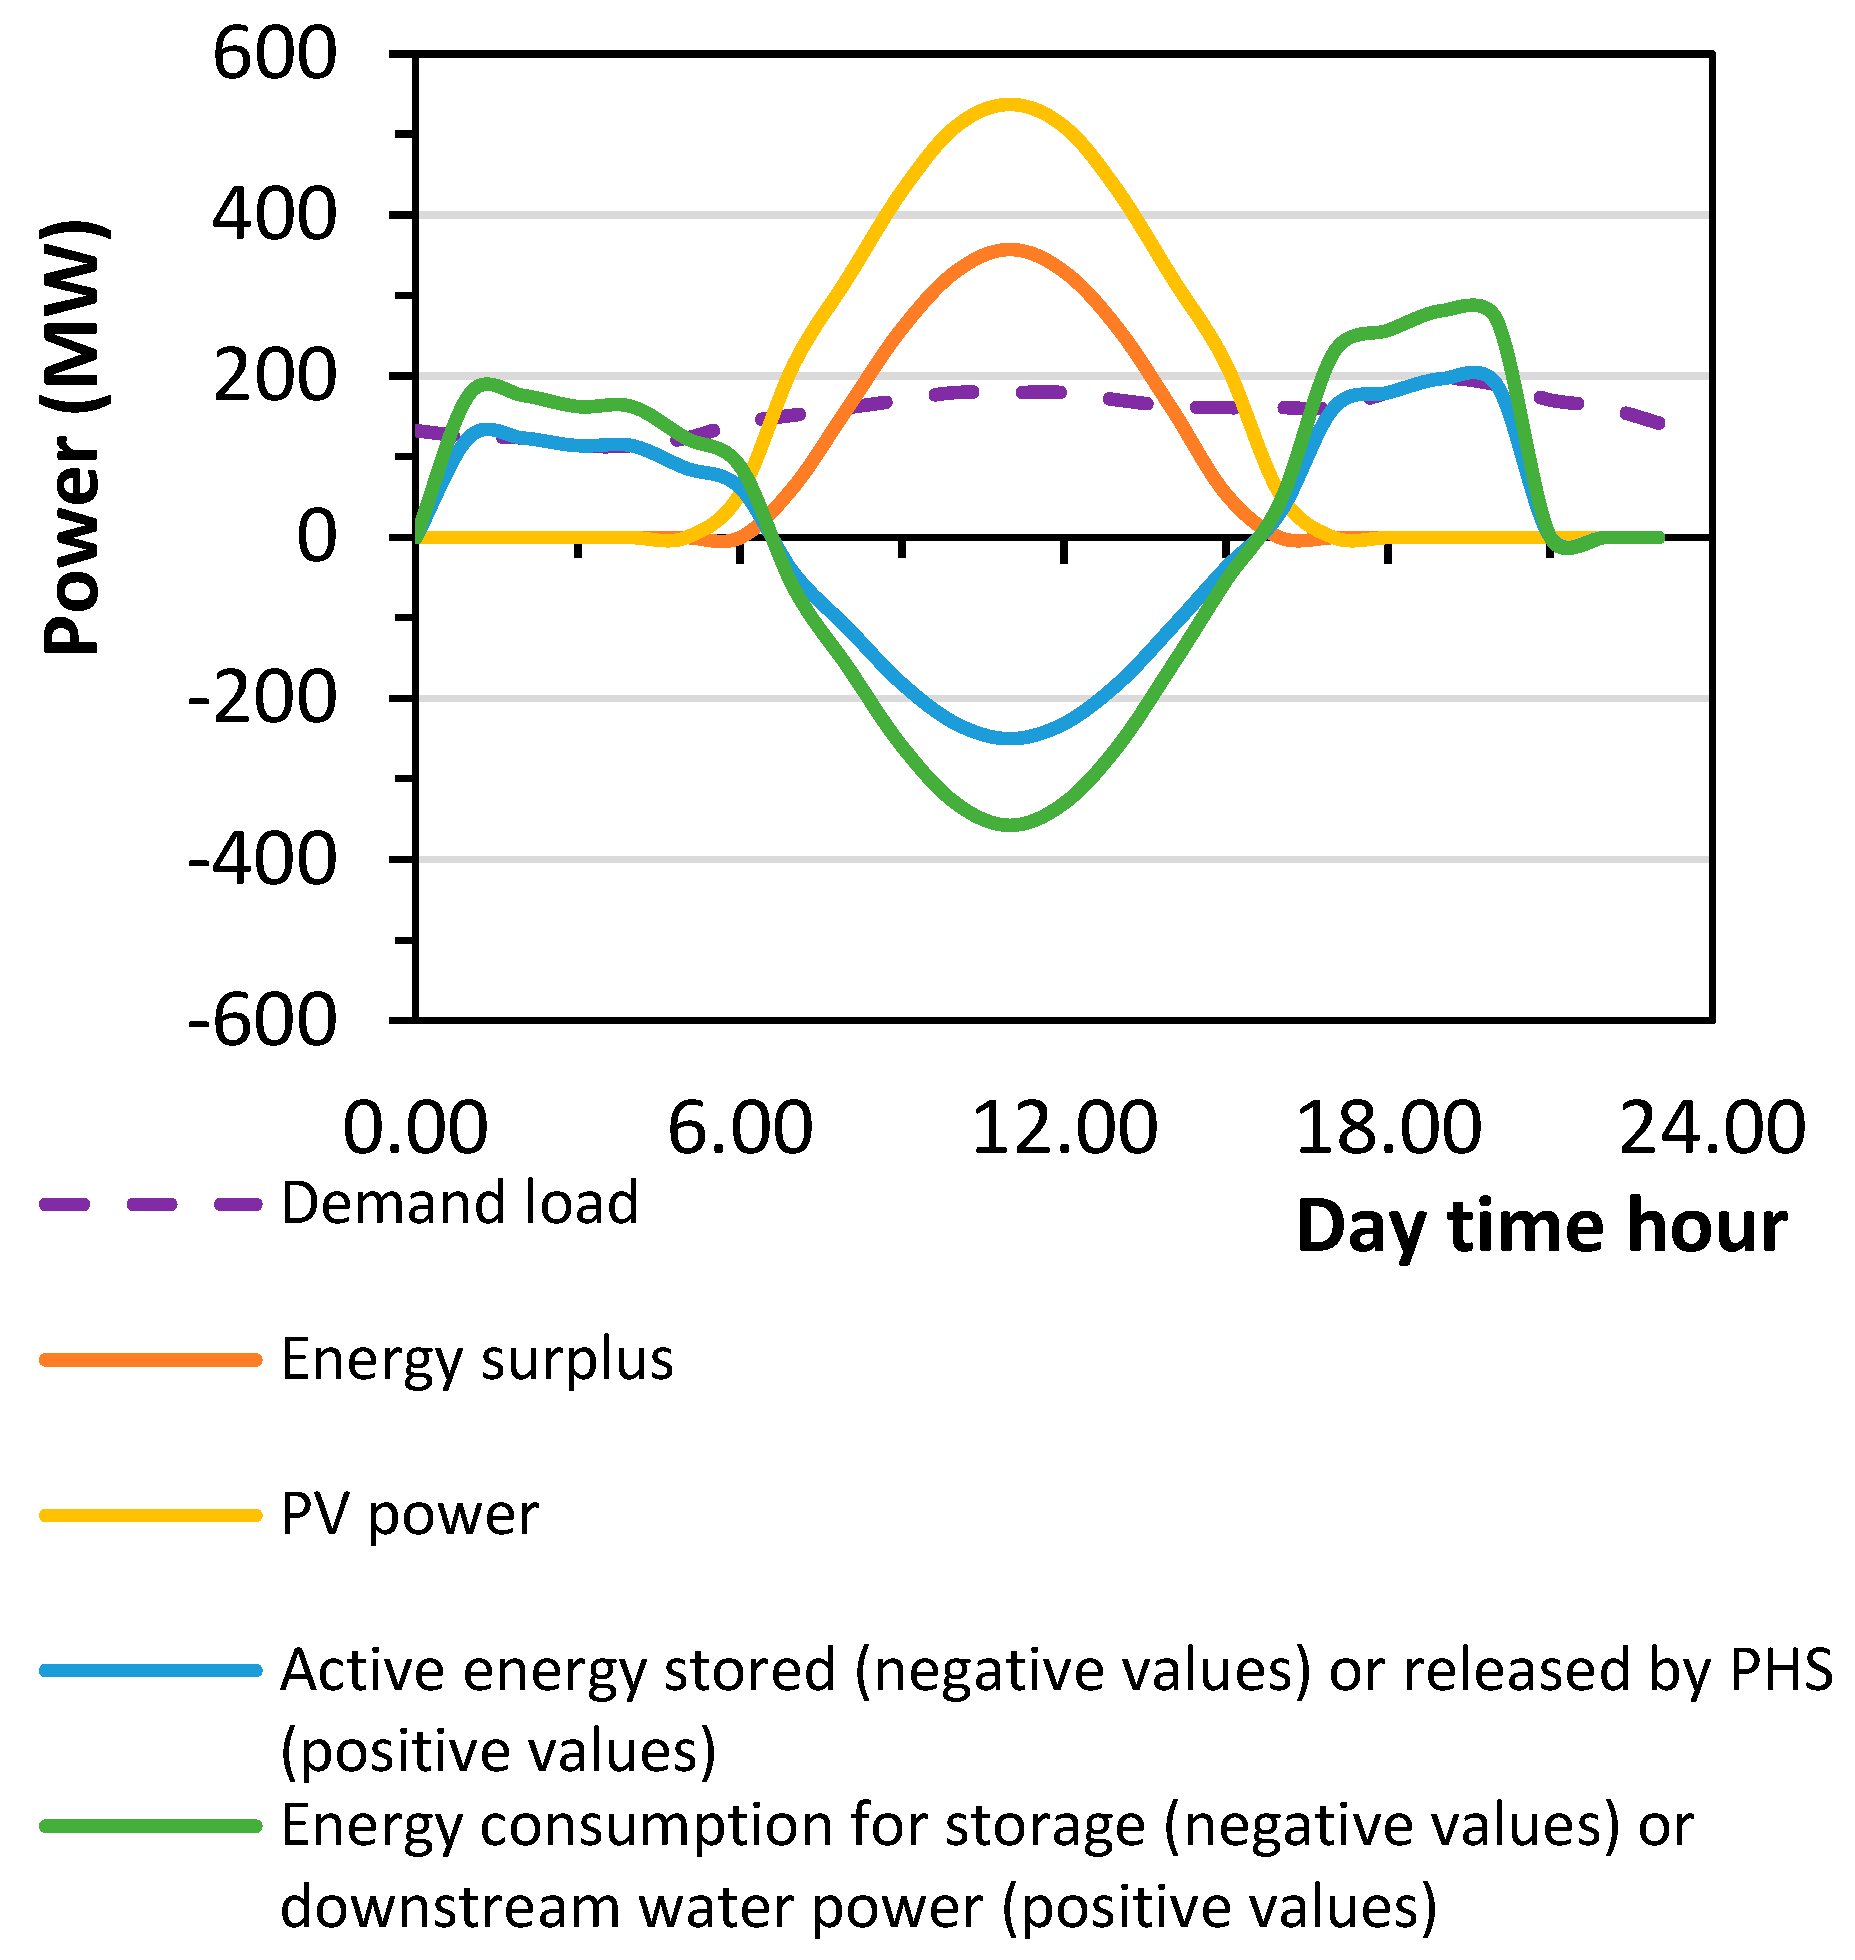
Analyzing the electricity demand is a prerequisite for optimal planning of a hybrid PHS system. Figure 10 presents a representative scheme for the hybrid pumped hydro storage (HPHS) plant operational schedule during daytime hours for the case study area of the Kardia mine. This scheme presents the integration of RES electricity production and the utilization of a hybrid plant. A linear programming optimization model using the simplex method [50] has been developed, where the objective function value addressed to the capacity factor [51] of the PV park is maximized. The main restriction is that the sum of the PV power produced, the energy released in PHS and the grid supplementary power should meet load demands. Another restriction concerns the water balance in the PHS system, where the quantity of the water pumped into the upper reservoir equals the quantity of the water released downstream into the lower reservoir.
In this idealized model, no legislative restrictions are taken into account regarding the deployment of energy storage by the PHS plant. According to the National Law provision (Law 3468, Government Gazette 129/A/27 June 2006) the total amount of electricity taken in from the network on an annual basis does not exceed 30 percent of the total amount of energy consumed for the filling of the storage system in that station. Thus only 30% of the energy produced by the PV plant is allowed to be stored using the PHS plant by utilizing the potential energy of water. Another assumption considered in the optimization problem is that the load demand distribution during daytime is set directly proportional to the electrical power distribution network flow [52]. In addition, the distribution system performance of the PV park during the daytime is set directly proportional to the distribution of the solar radiation production [53] during the daytime.
As depicted in Figure 10, the operation of the HPHS system dictates a pumping procedure between 7:00 and 16:00 and energy production in the rest of the 24 h cycle. The designed energy system for the PHS plant must be credible to cover the demand load of electricity during the whole day, providing efficient energy generation and a guaranteed rate. Consequently, when the energy system supplies more power than that required by the users (i.e., the total load produced is higher than the demand load), then this additional load is used to supply the PHS plant, and thus, some additional water can be stored in the upper reservoir of the plant. However, the “real” PHS storage load is lower due to energy losses.
For this purpose, representative synthetic time series, including load prediction data, must be generated during the design phase for the optimal planning of the HPHS system, aiming at the prediction of the potential energy storage. The potential energy storage in a PHS complex required to supplement the PV park can be estimated by calculating the pumping energy consumption via the following formula, which is an expansion of Bernoulli’s equation [54,55]:
where is the total power required (kW), is the flow rate (lt/s), is the total head, i.e., the pressure head and elevation head (m), is the combined effect of pumping efficiency and derating, and 102 is a unit conversion factor value. Pumping efficiency and derating account for the operating efficiency of pumps, and efficiency losses between the energy required at the pump shaft and the total energy required [54].
The total power required to be stored in order to return it to the electric grid when needed can be obtained using two alternatives: (a) either by having a great hydraulic difference between the upper and lower reservoir, with a relatively small quantity of water per daily cycle uplift, (b) or by having a smaller hydraulic difference between the reservoirs, though with a larger quantity of pumped water. In addition, the head difference influences the efficiency of pumps and turbines [56]. The selection between the two options is mainly a financial decision since the magnitude of the project (mainly the number of units of pumps and generators, excavation volume of both reservoirs and area covered for PHS facilities to be mounted) is proportional to the required quantity of stored water. Thus, it affects the total cost. So, the option of a significant head difference could have the advantage of minimum fixed cost.
The required quantity of stored water and the head difference set the limits for the pit lake level variation , which is a critical component in the design [10]. Based on this acknowledgment, a diagram that can help to select the appropriate altitude of the PHS upper reservoir water level can be the total power required per unit m of water level daily fluctuation in relation to the pit lake’s level, as presented in the Section 3. This approach could help in the decision-making process and achieving a PHS plant’s economic viability.
2.5. Economic Value
The prediction of the spatiotemporal evolution of the lake is crucial for achieving the financial efficiency of the HPHS project, by evaluating different levels of the lake’s filling. The financial efficiency of each water level in the pit lake can be determined via performance indicators, i.e., net present value () and net cash recovery () of a cash flow series.
In the case of the Kardia pit lake, initial calculations of the economic feasibility of a PHS plant were performed with the help of the method, where the values of alternative scenarios were evaluated. The value indicates whether the overall lifetime costs of the project (benefits and costs of different scenarios), i.e., the investment, is less or more than the income generated. For example, for an investment project with a minimum design operational lifetime of up to 50 years, the following equation was used to estimate [10]:
where is the in real terms, considering also the inflation rate and the interest rate , ; are costs and revenues at different points in time , is the initial investment at time = 0 and is the discounting factor which reflects the value of money in time :
The component in the equation above helps make the different cash flows in time comparable [10].
2.6. Geotechnical Issues to Be Considered in the Post-Mining Design
Several studies have sought to determine successful and unsuccessful cases of pit lakes in the post-closure mine phase. It has been documented that stability is improved as water levels increase inside the pit lake. Kavvadas et al. investigated the stability conditions that prevailed in decommissioning surface lignite mines in Greece [57], using the Amyntaion mine as a case study, where the pit is gradually filled with water. According to this report, it is shown that stability conditions are reinstated when the depth of water (critical depth) reaches approximately 15–35% of the final equilibrium condition, whereas, at higher lake levels, the safety factor is expected to increase significantly due to the beneficial effect of the lake water pressure acting on the slope. Table 2 presents preliminary predictions in slope stability for different scenarios of lake water development inside the open pit [57].
In addition, in the early stages of the lake’s development, more favorable slope stability conditions are expected to be achieved in only a few years. This result is associated with the fact that the surface area of the pit is smaller at deeper levels; thus, the depth of the water inside the pit increases rapidly in the early stages of the lake development.
Regarding the operation of the HPHS complex facility, in the daily cyclic process in the lower reservoir (i.e., the pit lake), excessive weathering and corrosion of the lake banks could appear, caused by the daily fluctuation of the head difference between the lower and the upper reservoir. Furthermore, the daily fluctuation induces an increase in water pressure at the pit lake banks; thus, slope instabilities could appear due to the fatigue effect. Consequently, adopting protection measures at the pit lake banks is a prerequisite, which could also affect the excavation volume and, as a result, the magnitude of the PHS complex facility.
3. Results and Discussion
3.1. Water Flux Trends and Forecast of Lake’s Spatiotemporal Development
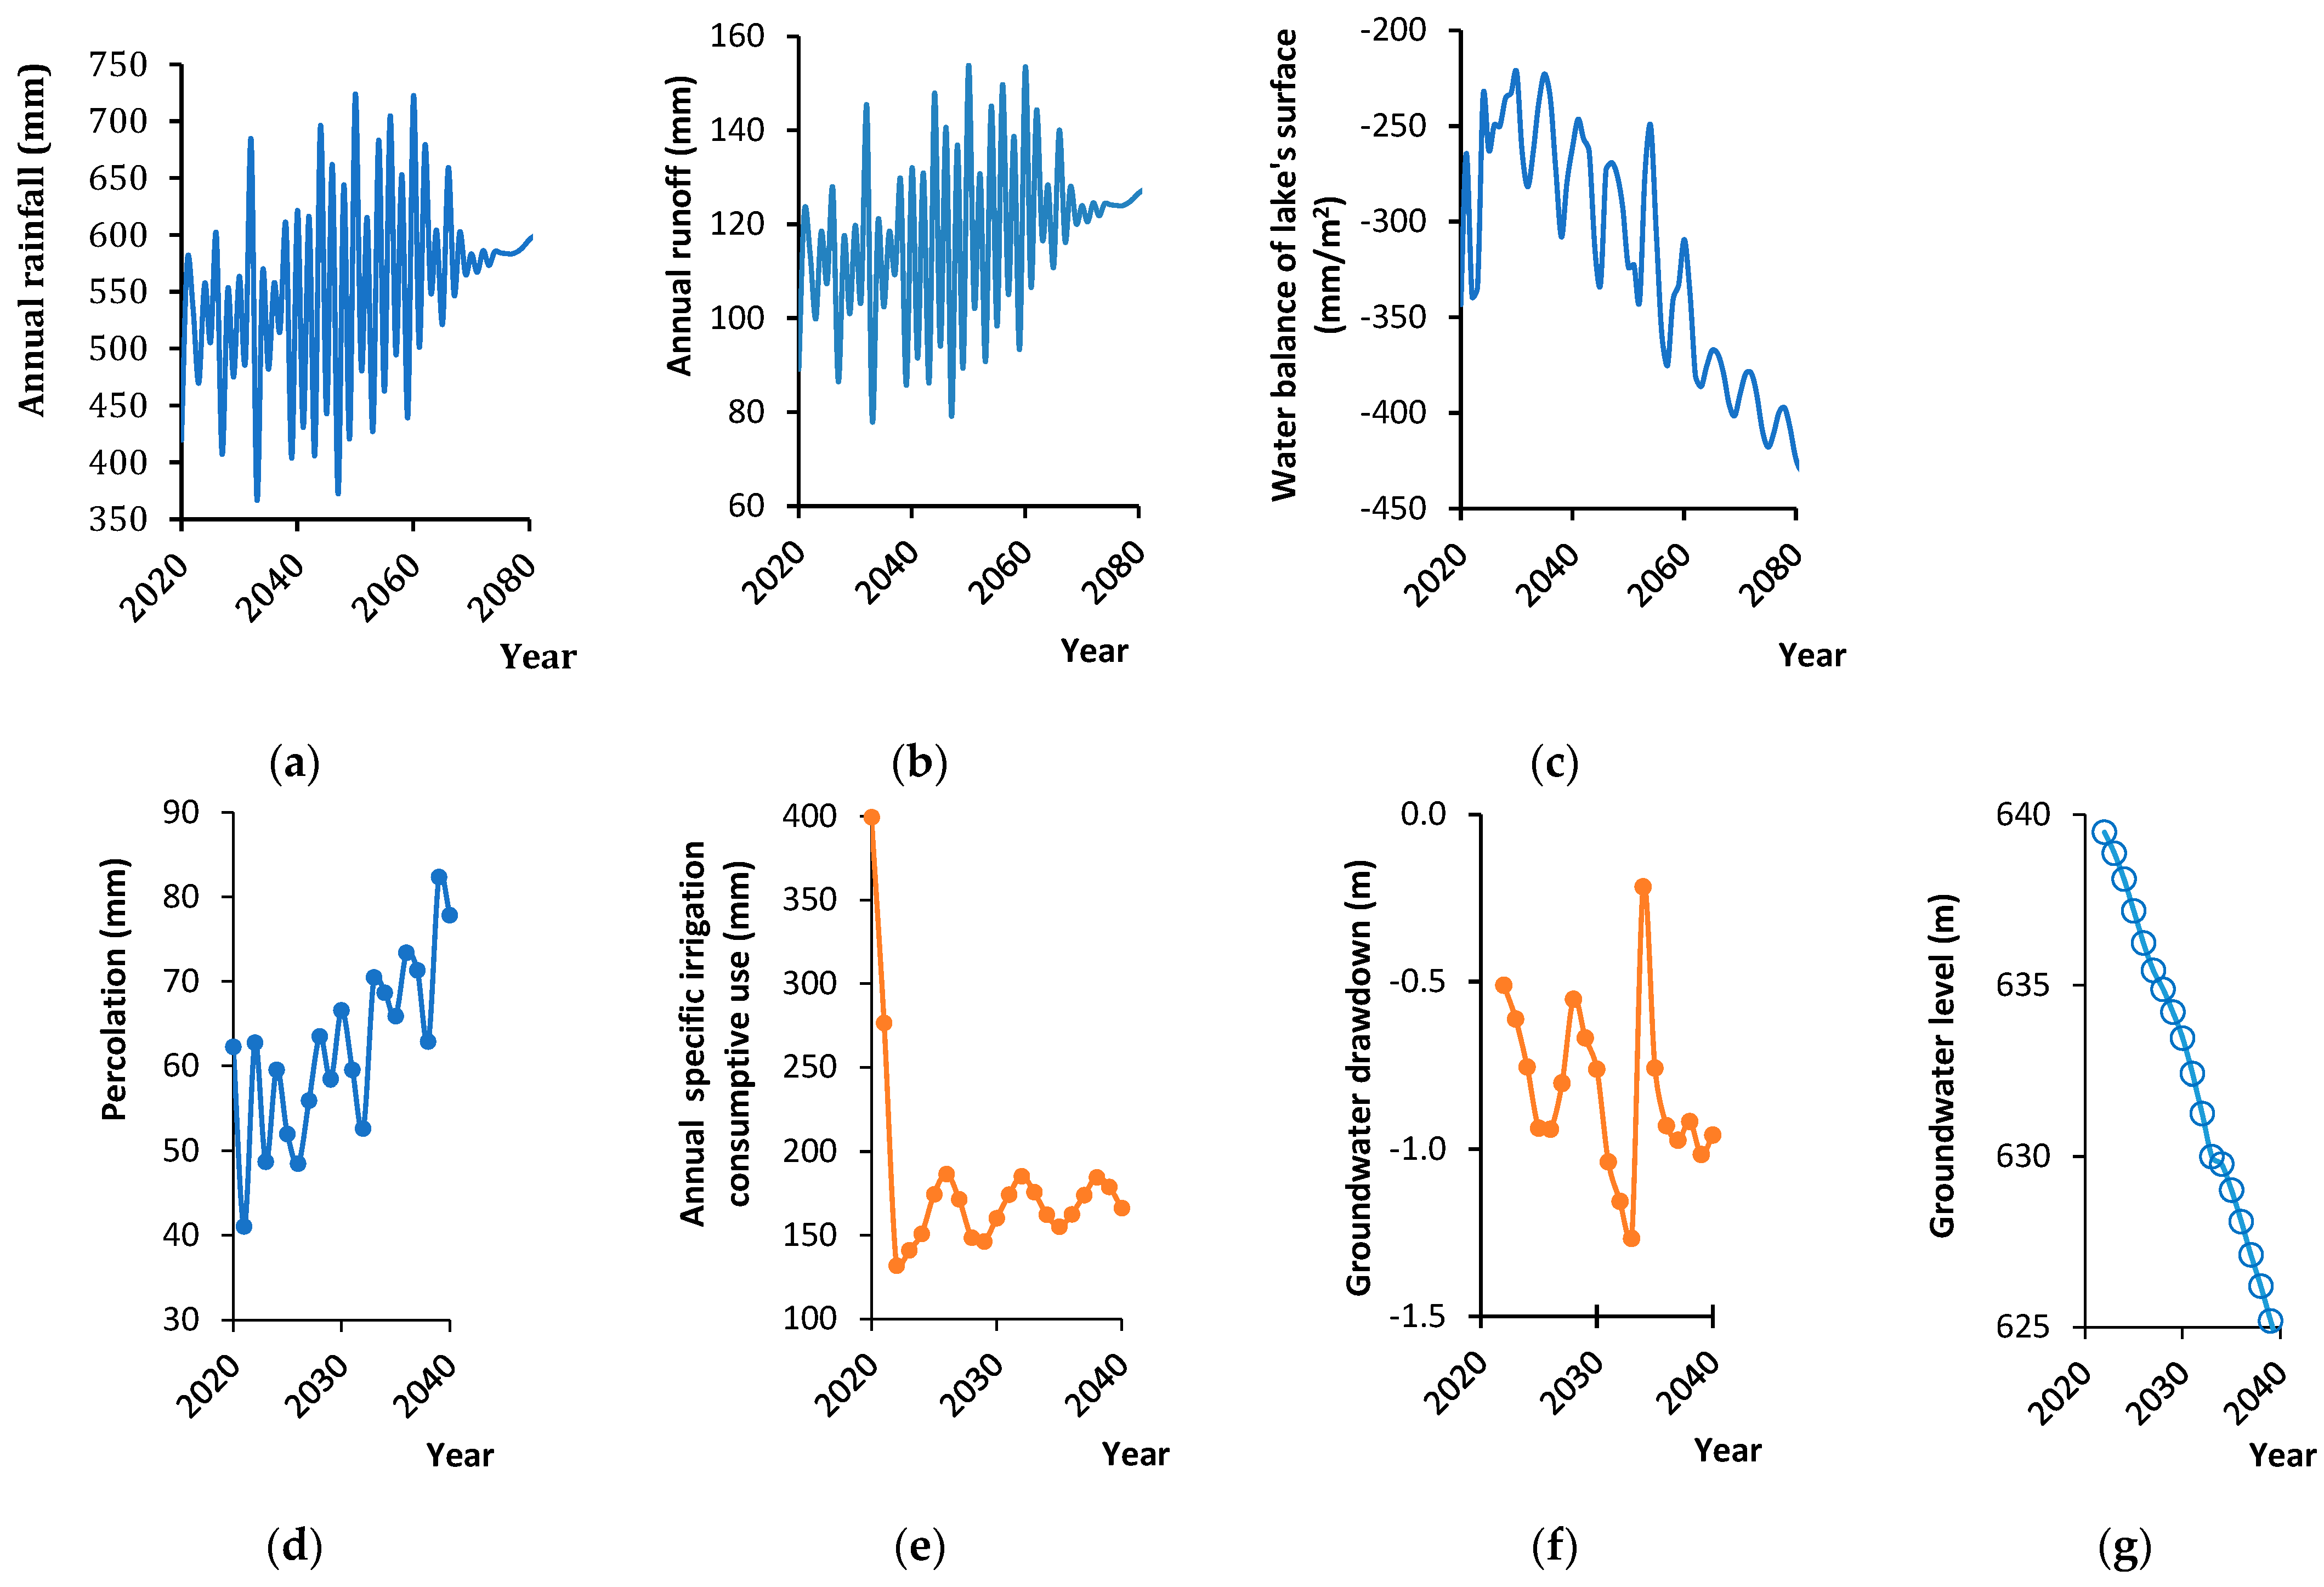
Predictive models to forecast rainfall in the near future, as well as surface runoff, evaporation, percolation rates and consumptive irrigation rates are generated for the next decade, from which the water balance of the lake’s surface is derived. The results from the implementation of the NNAR model (neural network autoregression) with no seasonal participation are presented in Figure 11.
According to the NNAR predictions for the next decade, the maximum expected groundwater attenuation of the Sarigiol aquifer is estimated at 10 m (i.e., approximately one meter per year on average). This drawdown is due to excessive irrigation water demands [40], which allows the expectation that the groundwater level will be successively lowered below the elevation +635 m during our conceptual model of the lake filling time interval. Time series forecasts of annual drawdown for the next two decades are computed. This groundwater level attenuation was incorporated into the mathematical model for predicting the lake’s water balance, where a 20% reduction in groundwater influxes to the lake’s water body was introduced.
In addition, the lake’s surface balance is displayed in Figure 11, as a result of the difference between evaporation and precipitation over the lake’s surface. The results showed an increasing trend of yearly water losses in the lake’s surface water balance due to a gradual increase in the water surface, as evaporation also increases.
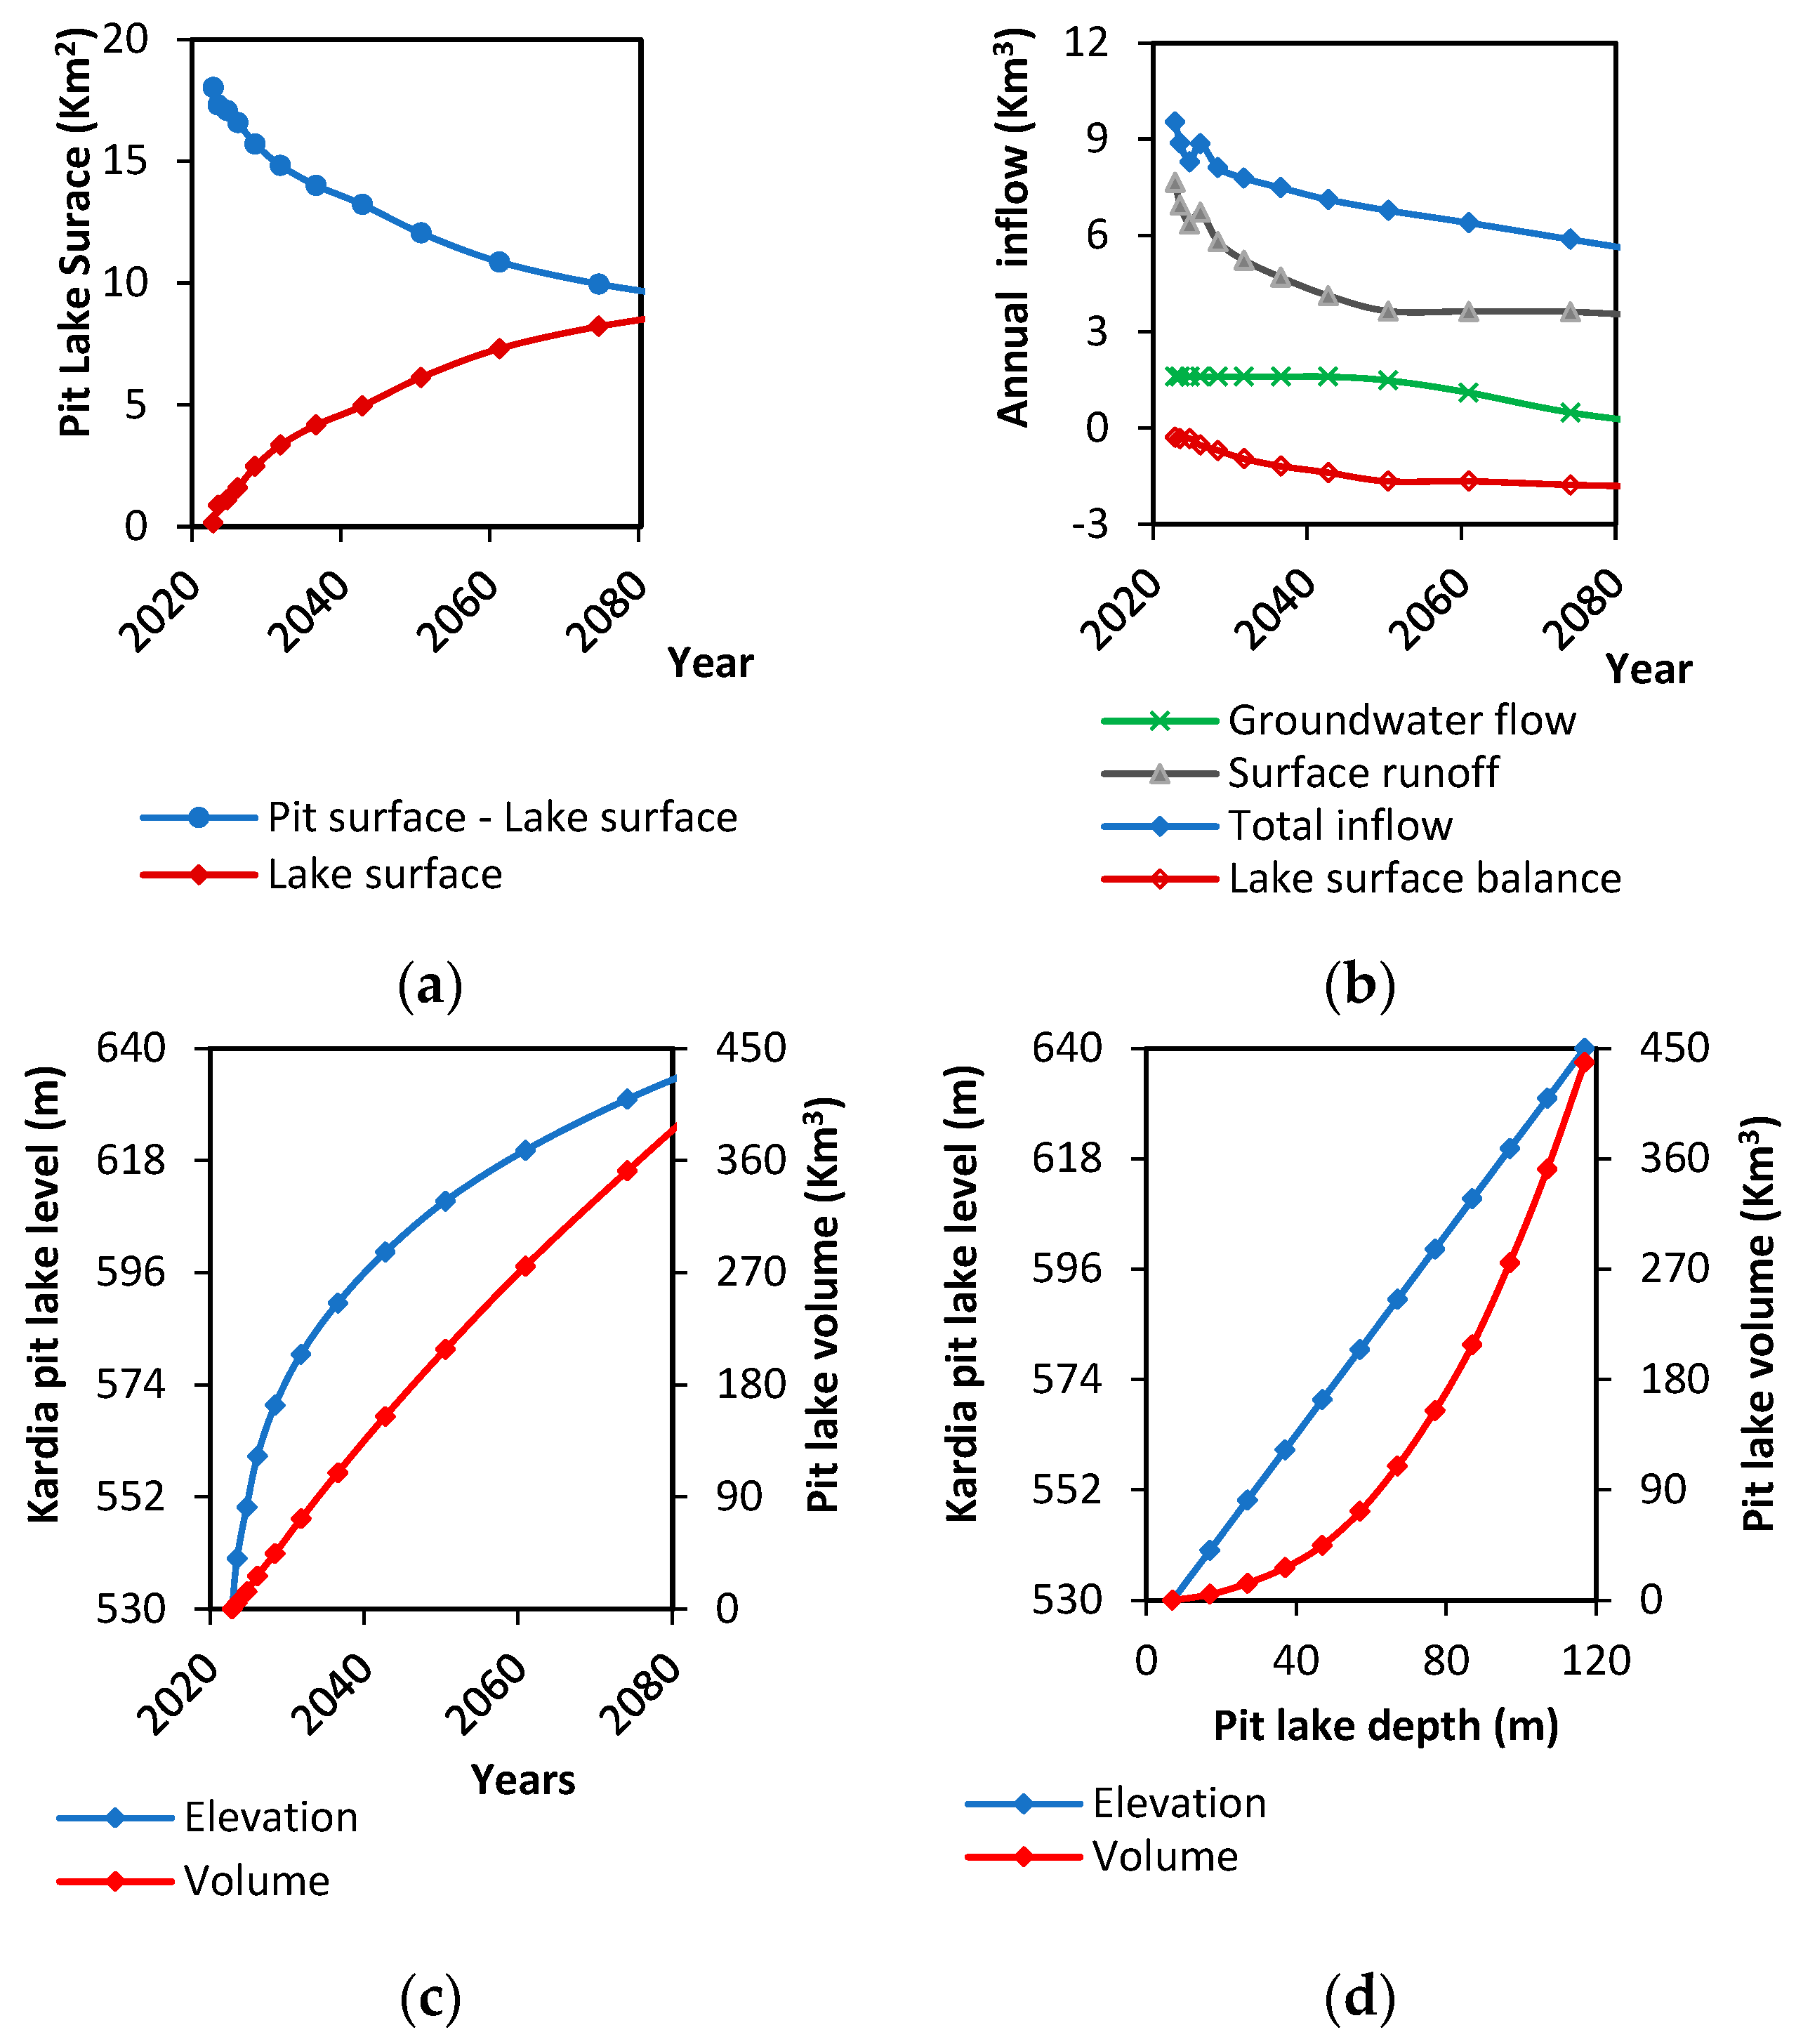
Figure 12 displays the lake’s spatiotemporal development based on the model developed in this study and the results from implementing the NNAR model. To highlight the influence of the time variable datasets, the different water inflows into the pit lake’s body have been plotted together and are associated with the time component. The results indicate that, the filling of the lake model is very sensitive to surface runoff, which is described by an average value of 0.3 for the area inside the open pit (Figure 8). There is a clear decreasing trend of annual surface runoff due to the gradual decrease in the watershed area.
As the pit lake level and volume increase with time, the surface area of the pit decreases and thus, the surface runoff decreases. It is interesting, though, that, during the last phase of the lake’s development, surface runoff still exceeds the lake’s surface losses (water balance of lake’s surface, i.e., precipitation minus evaporation on lake’s surface). Despite the large water losses (in mm/m2 of lake’s surface) compared to surface runoff (in mm/m2 of watershed surface) (Figure 11), the total annual surface runoff quantities exceed the water losses in the early stages of the lake’s development (Figure 12).
The results of the lake’s development displayed in Figure 12 indicate that the natural recharging of the lake is feasible. In the early stages, the lake expands rapidly, while in the last phase it does so very slowly. On the contrary, the lake’s water body volume increases almost steadily. As a result, the maximum natural lake growth inside the pit can potentially cover almost 50% of the pit’s total surface (Figure 2) in approximately 80 years, with a depth of approximately 117 m.
3.2. Evaluation of Potential Land Use Repurposing Scenarios
For the already closed lignite mine of Kardia, a preliminary evaluation was conducted for potential land use repurposing scenarios, by evaluating the landscape formed after the lignite exploitation activities terminated. Generally, in abandoned open pits, the pit void will eventually be filled with water at a specific time period. Thus, the viability of any repurposing land use scenarios should be evaluated concerning the spatiotemporal lake level development and the water coverage area compared to the pit’s total surface.
In evaluating different land use scenarios, the energy transition potential in the specific region is of primary importance. It is considered with respect to long-term socioeconomic viability in the area. At the same time, the transition should be in line with the holistic policy framework developed by Greece to further develop renewable technology in the electricity sector and eventually achieve net-zero greenhouse-gas emissions. Consequently, repurposing land uses includes RES technology application in the remaining post-mining landscapes. Moreover, “Smart Post-mining” has to be developed in concert with “Green and Climate Smart Mining” [58], in a holistic approach so that the climate-driven clean energy transition is managed responsibly and sustainably.
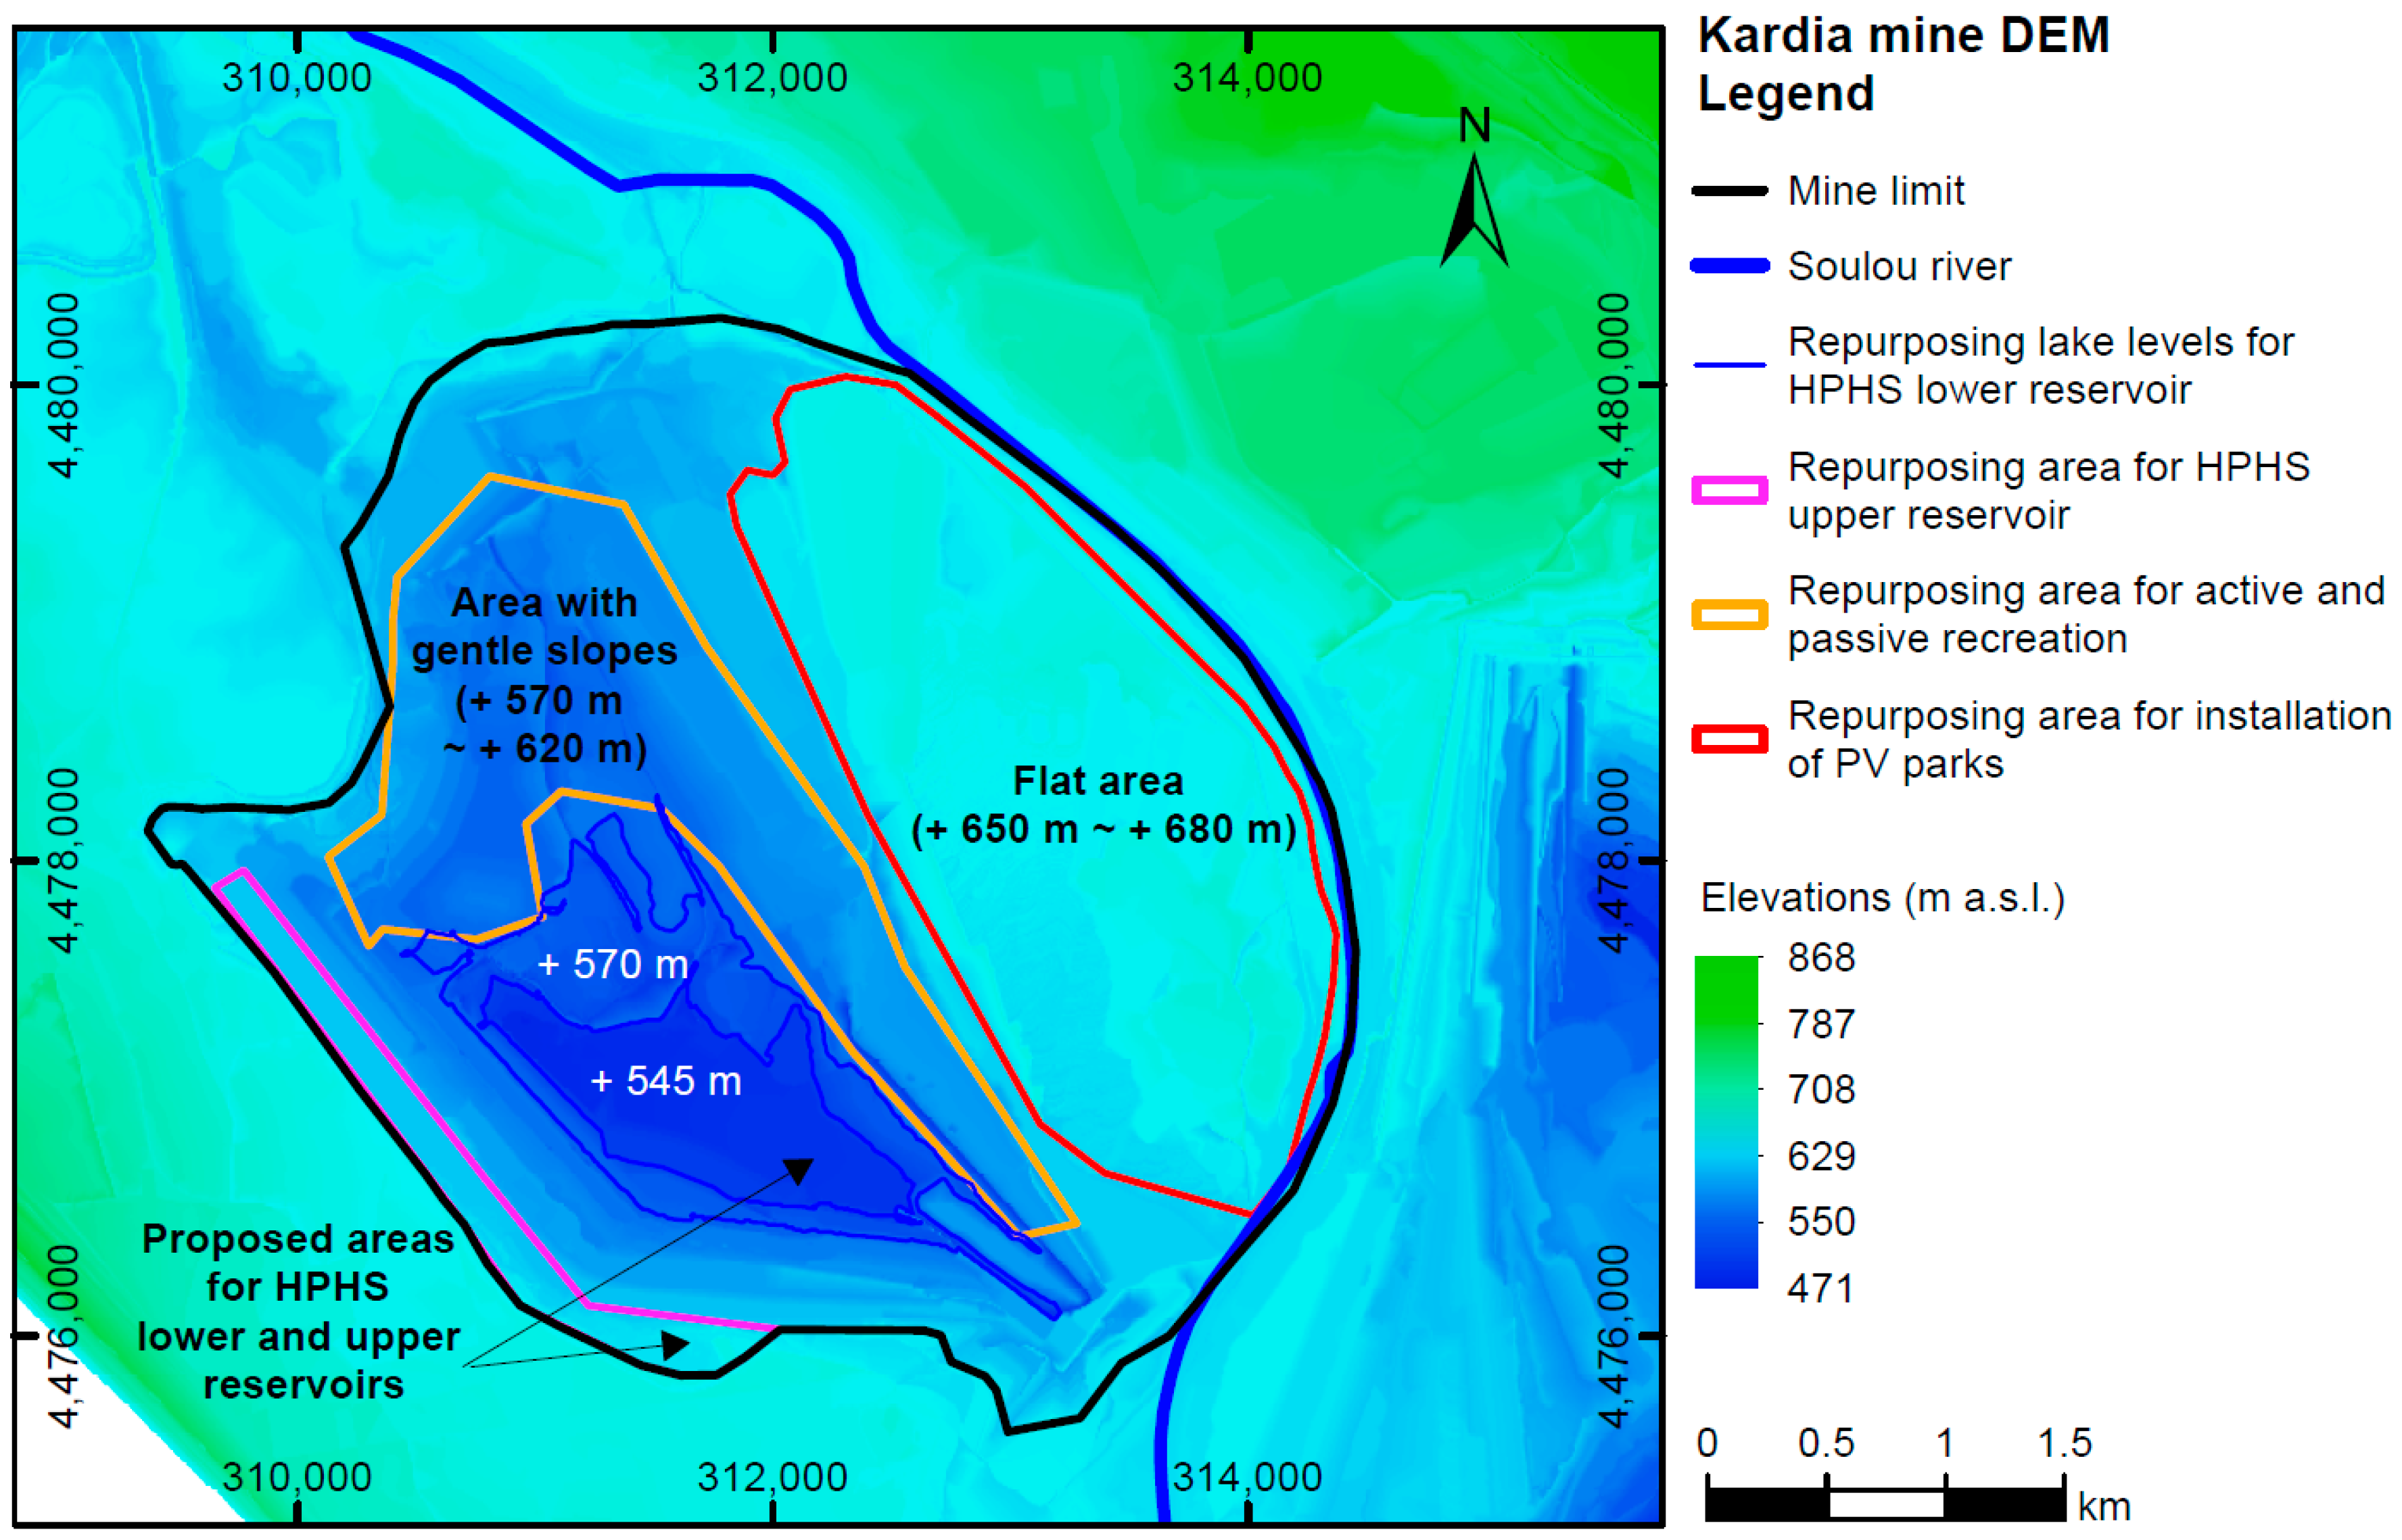
Based on topographical criteria, from the digital elevation model (DEM) and the slope model implemented (Figure 2), it can be seen that the area between elevations +650 m and +680 m could be characterized as relatively flat. The flatness of this area makes it ideal for installing PV parks. Consequently, lake growth should not exceed the elevation of +650 m. Also, based on preliminary predictions as described in Table 2, stability conditions are expected to be reinstated when the depth of lake water reaches approximately 22 m to 29 m, i.e., for pit lake elevations +545 m up to 552 m. Thus, adopting lower lake levels increases the risk of failure.
From the model developed in this study and the results from the implementation of the NNAR model, the maximum lake water level cannot exceed elevations +640 m ~ +650 m, as it is presented in Figure 12. This condition is due to hydraulic reasons, as this level is related to the groundwater level in the loose sediment aquifer overlying the lignite sequence. Considering the lake growth limitation, the flat area between elevations +650 m and +680 m could be examined for installing PV parks (Figure 13). This area is approximately 5 km2, with an average inclination of approximately 3.5%.
In addition, the area between elevations +570 m and +620 m on the lake’s northeast side could be repurposed for active (such as swimming, diving, etc.) and passive recreation (such as biking trails, recreation forest park, road access network to the lake, entertainment facilities, etc.). This area appears to have gentle slopes presenting average inclinations in the order of 12~17% and covers approximately 3 km2 of the surface.
An important issue emerging from these findings is that repurposing a PHS dam at the elevation of +545 m is feasible and can be achieved by naturally filling the pit lake for approximately three (3) years. Artificial recharging is also feasible if a fast filling is required to implement the PHS Project. More specifically, pumped water from Mavropigi and South field sumps could be diverted inside Kardia pit lake and, thus, fill the pit lake within a year.
Another alternative could be forming the lake water surface level at +570 m to implement the PHS and PV project. The findings from the implementation of the NNAR model suggest that this could be realized by naturally filling the pit lake in approximately seven (7) years. In the case of fast filling of the pit lake, this could be achieved in approximately three (3) years, i.e., four (4) years earlier.
The area on the southwest side of the lake is proposed for the upper reservoir installation of the PHS project. This area could be ideal for the location of the upper reservoir due to the proximity to both the lake (lower reservoir) and the Soulou River, where, after the PHS operational start, the required discharge of overflow is prospected to be rejected. This area covers approximately 0.5 km2 of the surface, with an average inclination of approximately 3%.
Based on these results, our findings indicate that the level + 570 m could cover the needs of a hybrid PHS plant (HPHS) and PV park while providing enough space for recreation projects on the lake banks and simultaneously ensuring slope stability. The stabilizing effect of the lake water pressure ensures more favorable slope stability conditions at higher lake levels. In addition, the stability conditions are further improved in case the PHS upper reservoir is mounted outside the mine exploitation area, at a safe distance from the excavations’ slopes.
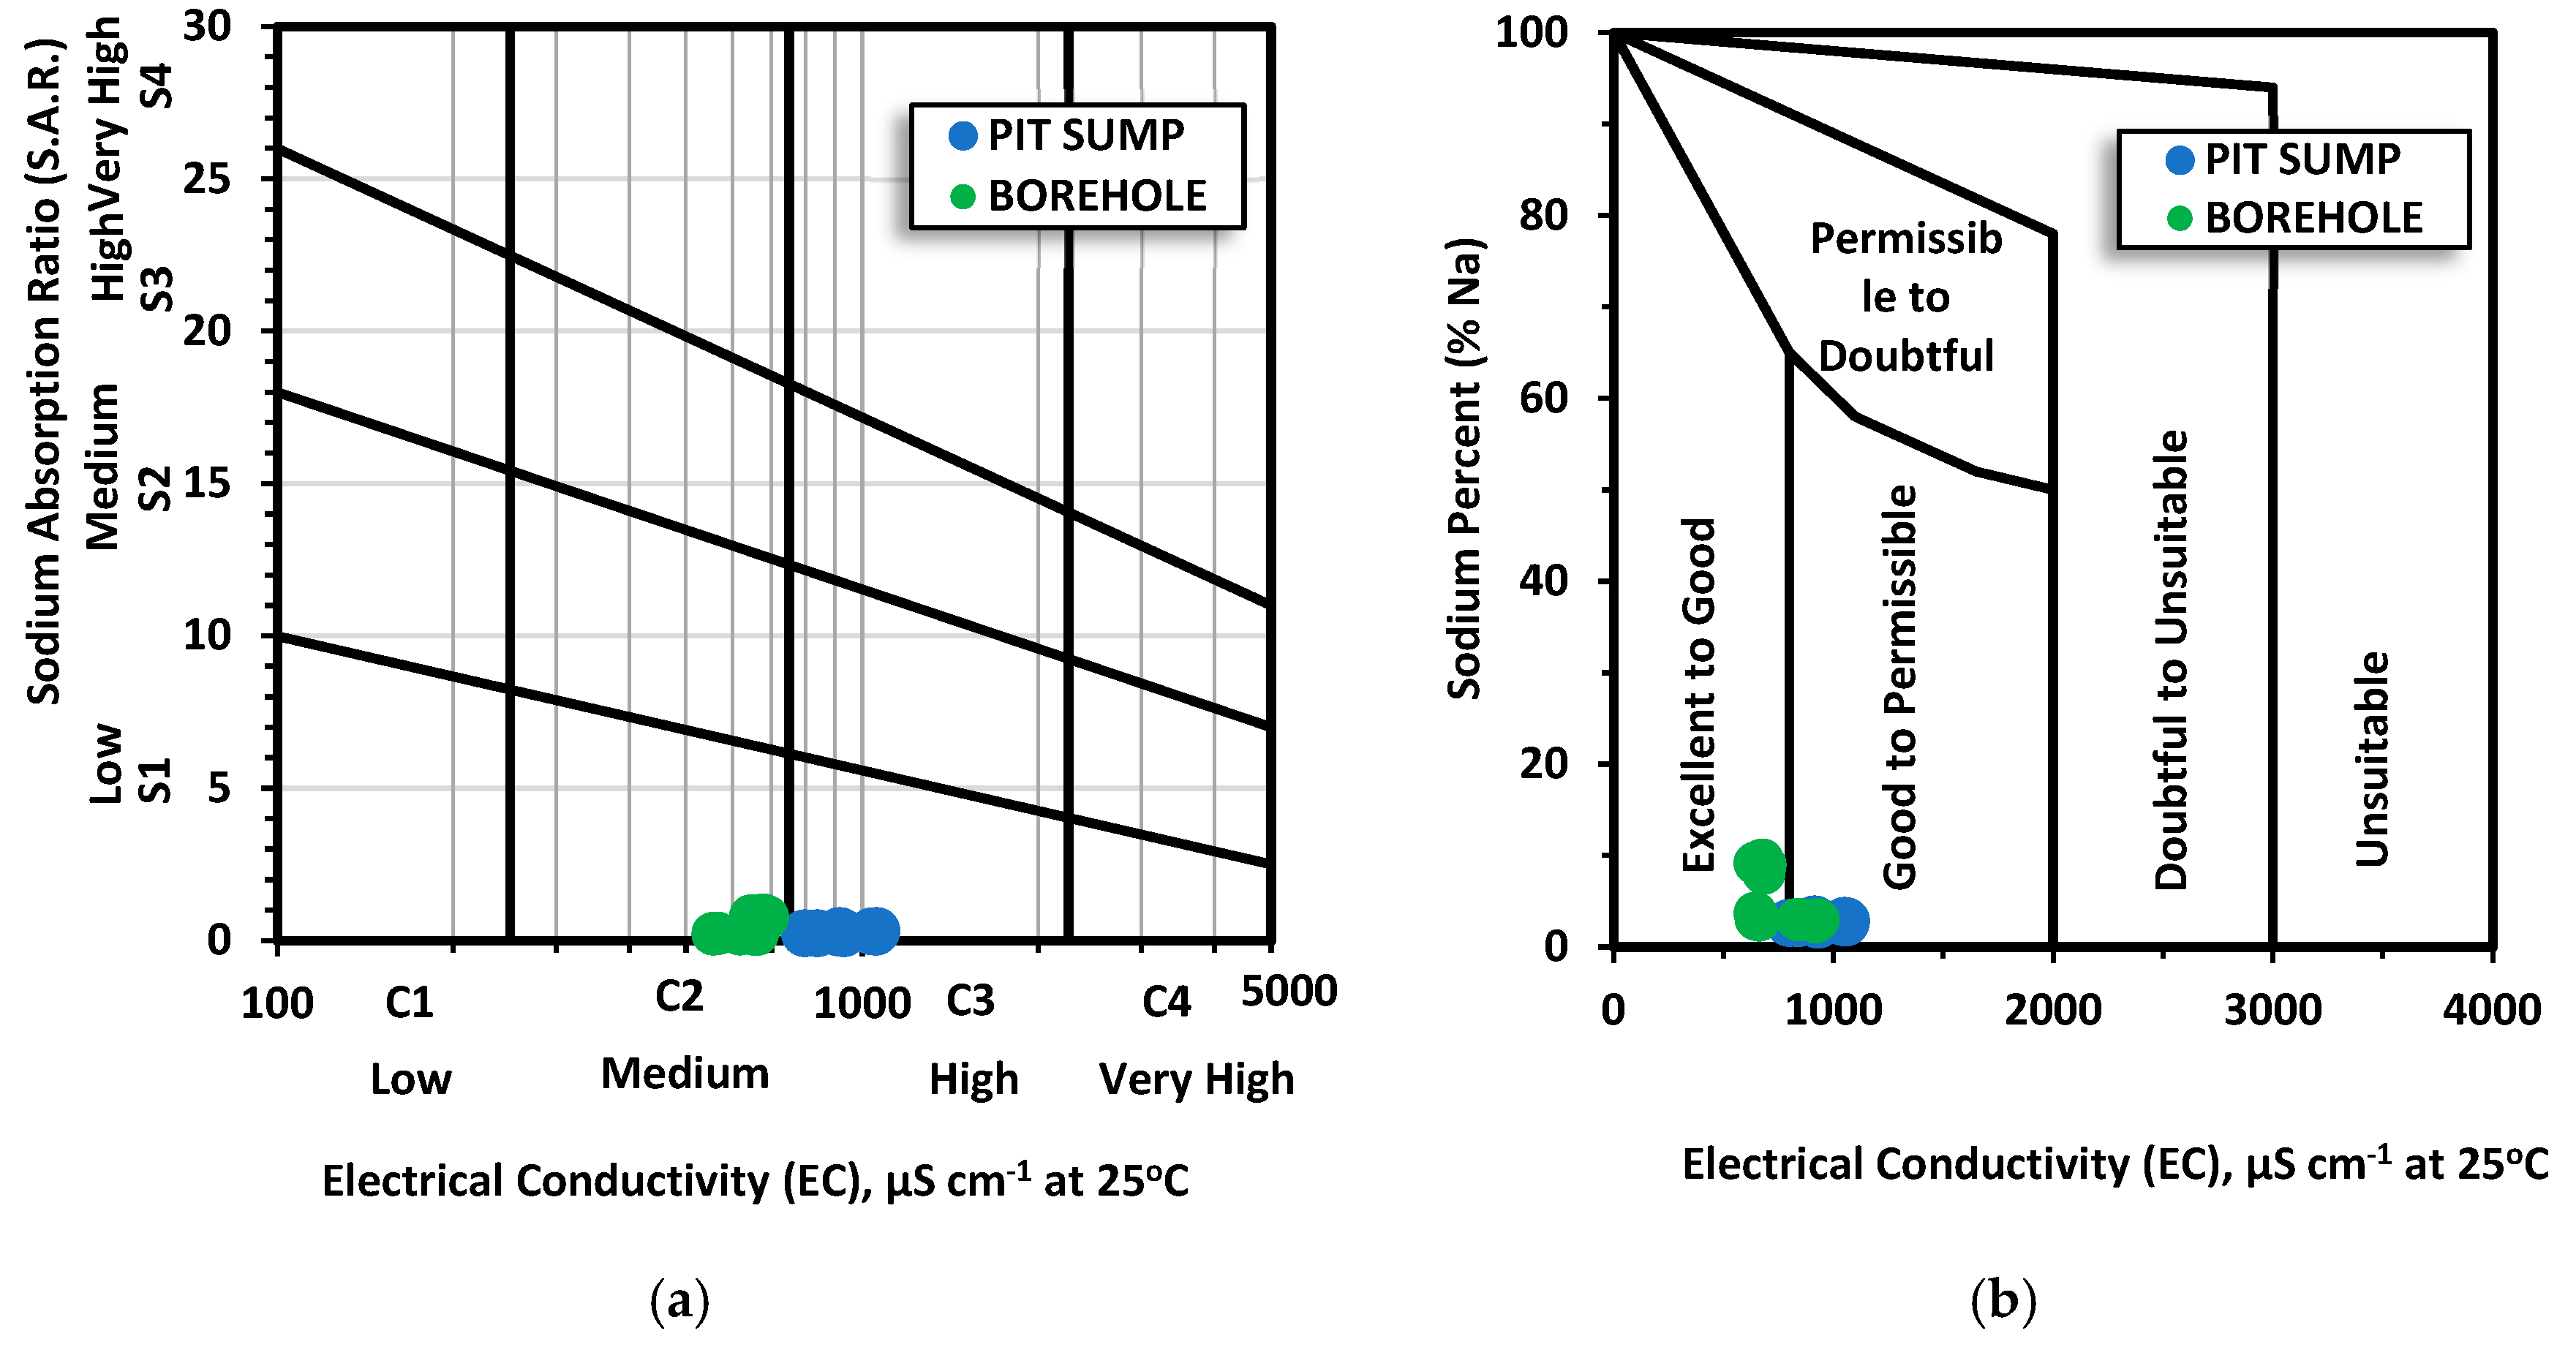
However, water pumping is required in such cases to maintain the level of the pit lake at a certain elevation. Thus, the pit lake water quality is an important parameter that could enable new beneficial end uses, such as exploiting the overflow of the pit lake water for irrigation purposes. For example, Figure 14 shows that the pit lake water is expected to have good quality and thus could be suitable for irrigation purposes. Moreover, waters are marked by salinization risk (measured on the x-axis by conductivity) rather than alkalinization risk (measured on the y-axis by sodium).
3.3. PHS Plant Efficiency Potential
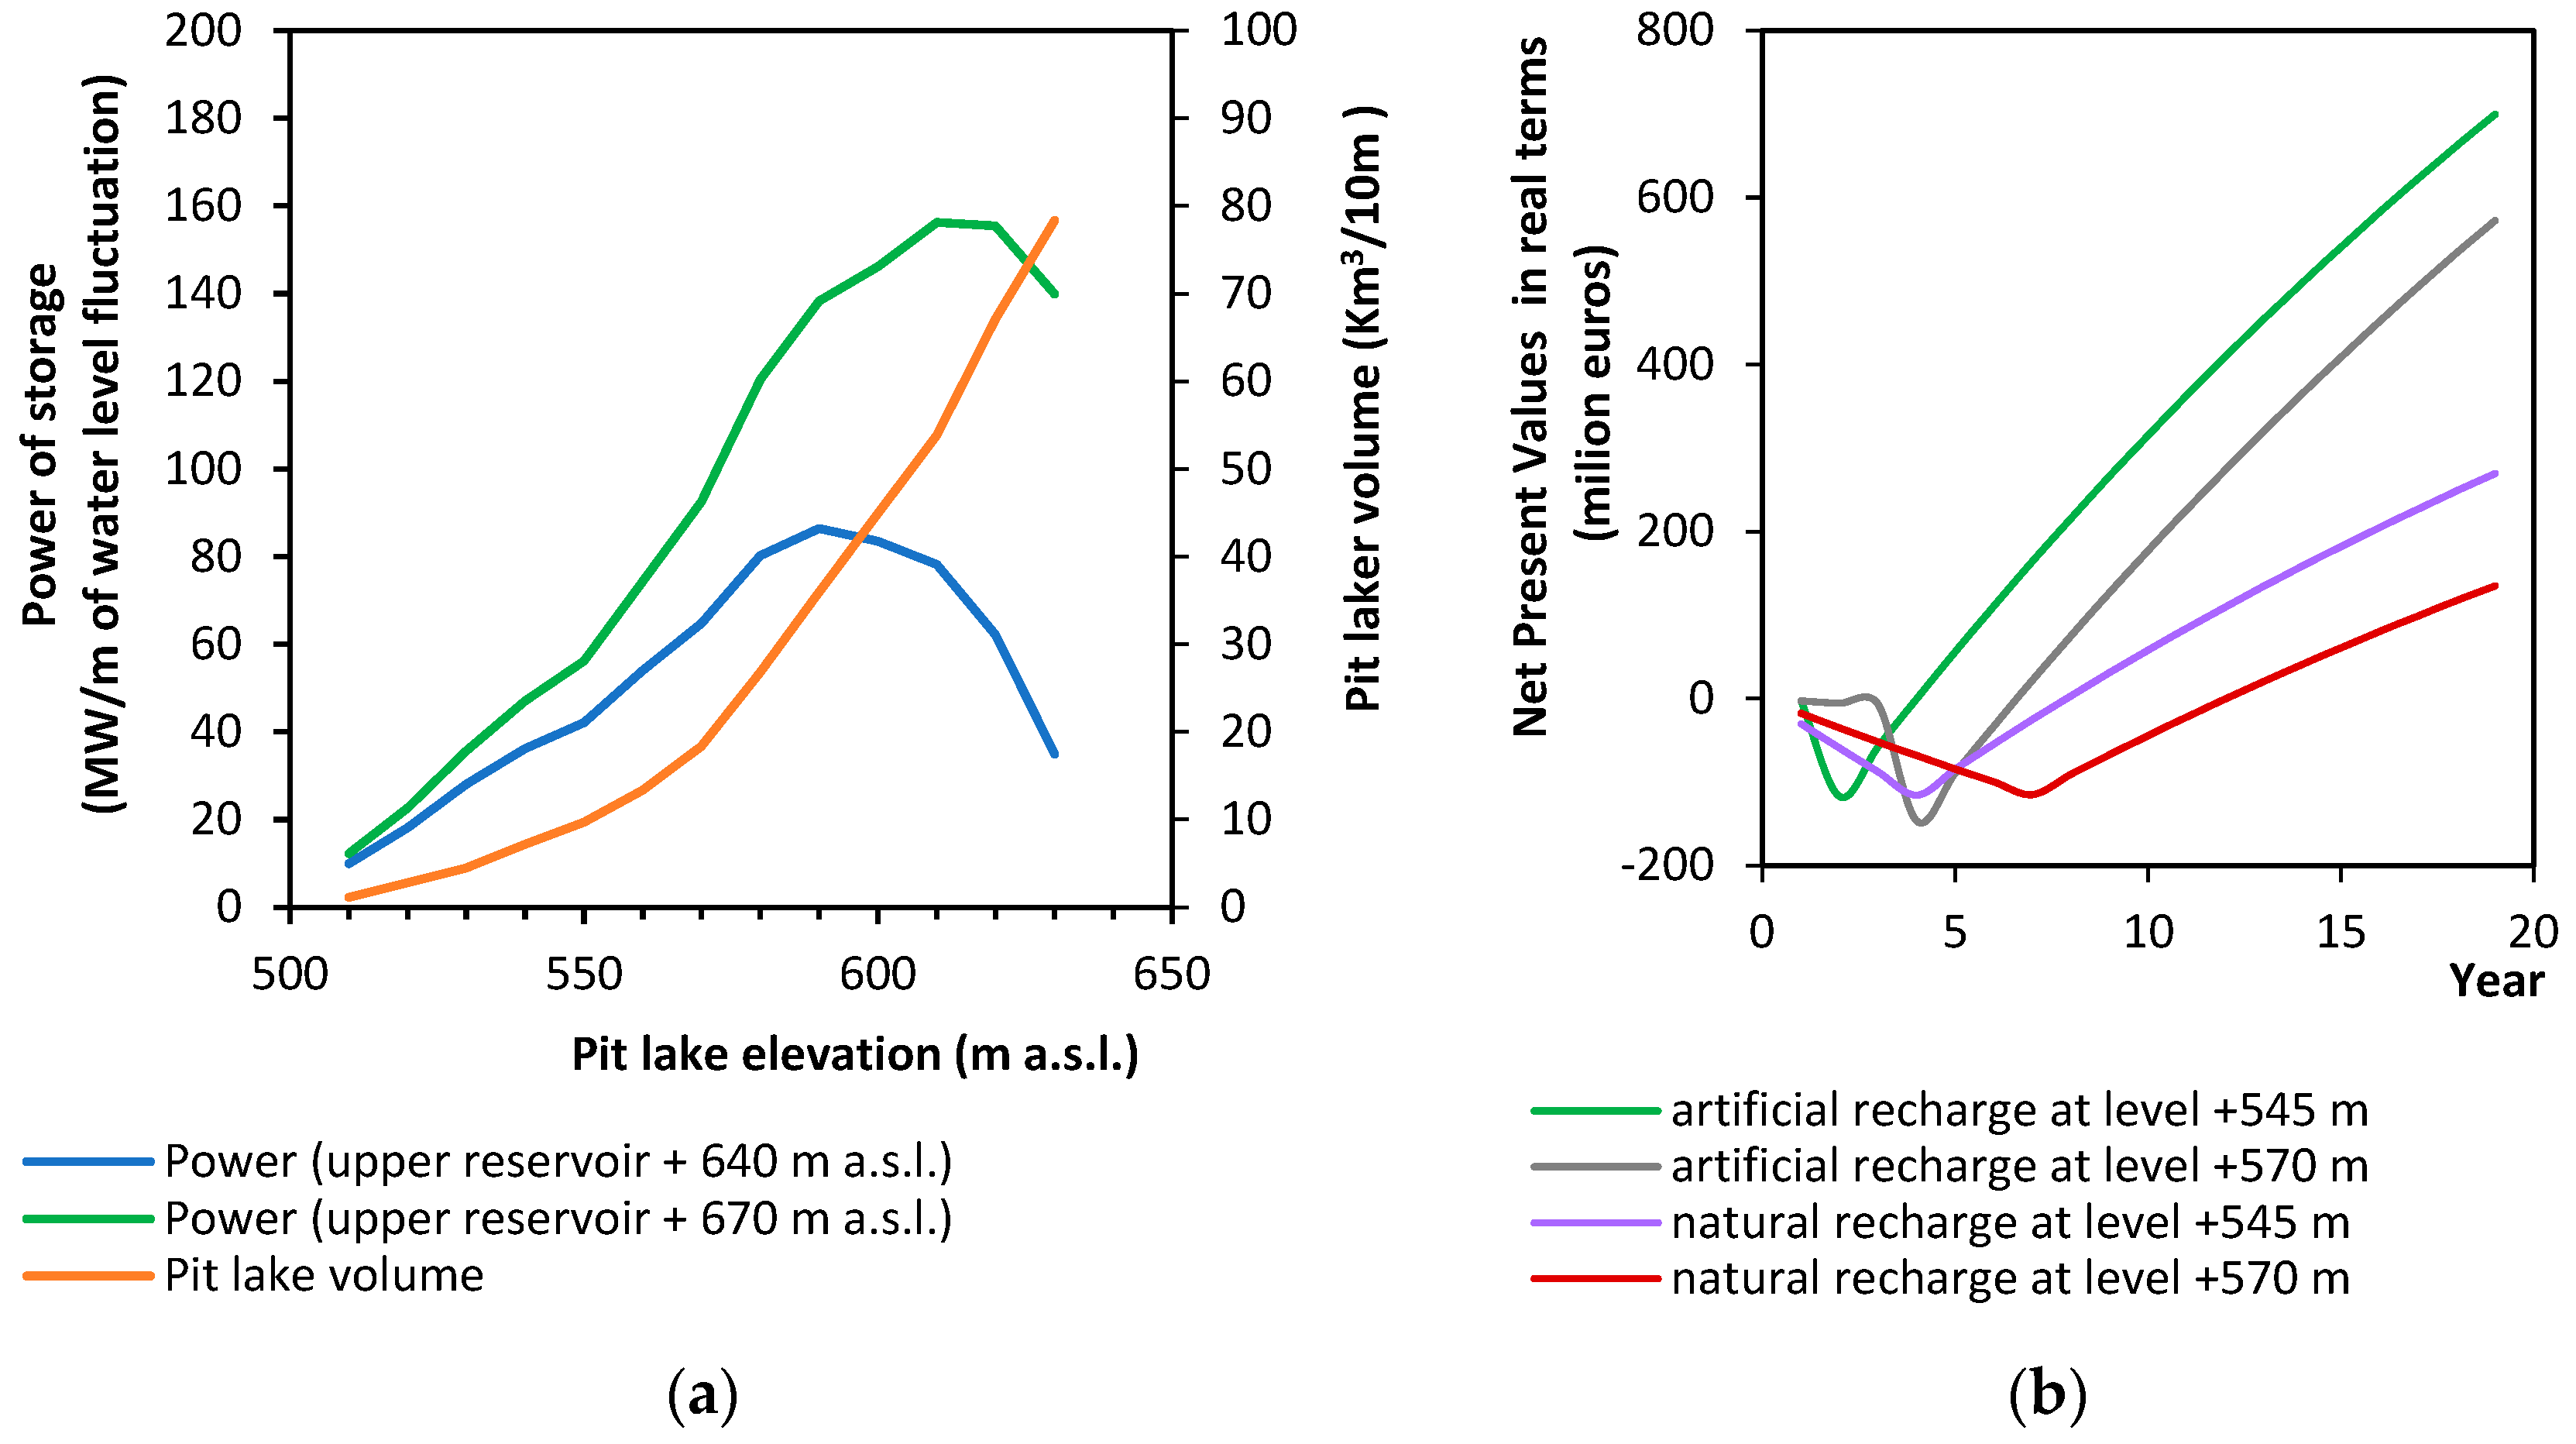
Figure 15 displays the potential energy storage per unit m of the daily water level fluctuation (MW/ m of water fluctuation) in relation to the pit lake’s elevation and volume, considering two different scenarios: a) in the case of the upper reservoir mounted inside the mine at the elevation +640 m a.s.l. and b) in the case of the upper reservoir mounted outside the mine exploitation area (i.e., +670 m a.s.l.). The graph shows that in the case of the Kardia mine and for a specific pit water level at + 570 m a.s.l., the estimated potential energy storage is 40% higher in the case of a 30 m increase in the total head (). In this example, lake level variation () at the pit lake was considered 1.0 m.
In a cash flow of revenues and expenses, net present values in real terms are evaluated for the next 20 years, as presented in Figure 15. Specifically, in the case of natural recharging of the pit lake, it is evident that an increase in the net present value in the order of 34% is estimated for the pit lake elevation +545 m, compared to the scenario where the pit lake elevation is formed at +570 m. In addition, in the case of artificial recharging of the pit lake, an increase in the net present value in the order of 18% is estimated for the pit lake elevation +545 m, compared to the scenario where the pit lake elevation is formed at +570 m, due to the late recovery of investment capital. In this initial economic feasibility evaluation, constant values of inflation and rate of interest were considered, whereas the same value of the investment was considered in all scenarios.
4. Conclusions
In the abandoned Kardia lignite mine, the evaluation of land potential and resources is assessed regarding the lake water development inside the open pit area. Thus, the natural development of the lake is predicted, and different repurposing land uses are considered, concerning the energy transition potential in this specific region.
Initially, the spatiotemporal development of the lake in the final pit is calculated, and subsequently, land use repurposing is evaluated with regard to lake growth. Considering the energy transition strategies at this specific mine, it is concluded that on the east side of the lake, there is a relatively flat area of approximately 5 km2, with an average inclination of approximately 3.5%. Therefore, this area is considered ideal for the installation of PV parks.
In addition, a hybrid PHS plant and PV park are examined to make provision for the energy surplus produced by the photovoltaic parks, aiming to meet electricity demand 24 h a day. Concentrating the solar power surplus with a PHS storage unit can provide flexible, renewable energy. This study has shown that repurposing a PHS dam at the elevation of + 545 m is feasible by naturally filling the pit lake for approximately three (3) years. Another scenario considering the elevation of +570 m could be achieved by recharging the pit within seven (7) years. Artificial recharging is also feasible in case fast filling is required due to the proximity of the Kardia lignite mine to two (2) other mines, the Mavropigi and South field lignite mines. Therefore, a fast filling could be achieved in less than one (1) year for a lake elevation of +545 m and less than three (3) years for an elevation of +570 m.
From an engineering point of view, forming the lake at the level of +570 m is considered a better option for implementing the HPHS plant, as the stabilizing effect of the lake water pressure ensures more favorable slope stability conditions at higher lake levels. Moreover, the slope stability conditions are further improved in case the PHS upper reservoir is mounted outside the mine exploitation area, at a safe distance from the excavations’ slopes.
Based on these results, our findings indicate that the surface lignite mine under investigation could cover both the needs of a hybrid PHS plant and PV park and, at the same time, provide enough space for activities (such as swimming, diving, etc.) and passive recreation (such as biking trails, recreation forest park, road access network to the lake, entertainment facilities, etc.) on the lake banks.
Forecasting the spatiotemporal development of a pit lake could help plan post-mining land repurposing, evaluate different scenarios, and find the optimum water level of the lake surface. The aim is to optimize land use repurposing in terms of economical design, efficiency and sustainability. In addition, the proximity of the Kardia lignite mine to the Mavropigi and South Field lignite mines is a crucial component to consider in the final design of the hybrid electric power project to make this project more economical, efficient and effective.
However, further studies need to be conducted to evaluate land repurposing, such as forecasting future water quality problems. In addition, different land repurposing projects are prospected to be developed under unfavorable geological settings of an abandoned open pit. This implies the need for detailed geotechnical (slope stability, bank erosion, corrosion, etc.) studies with the implementation of appropriate stability measures, in combination with a careful geotechnical monitoring application. To this end, continuous monitoring of ground movements is imperative. Therefore, this research question is an issue for further investigation and future model calibration when designing different repurposing land uses.
The whole system—pit lakes and alternative land repurposing scenarios—should be incorporated into a rational resources management program to optimize benefits to the land, water and electricity demands.
Author Contributions
Conceptualization, C.R. and G.L.; methodology, G.L., C.R., E.L. and E.M.; software, G.L. and E.M; validation, G.L., C.R., E.L., E.M. and G.K.; formal analysis, G.L., C.R., E.L, E.M. and G.K.; investigation, G.L., C.R., E.M. and G.K.; data curation, G.L., C.R., E.L., E.M. and G.K.; writing—original draft preparation, G.L. and E.L.; writing—review and editing, G.L., C.R. and E.M.; visualization, G.L., C.R., E.L., E.M. and G.K.; supervision G.L. and C.R.; project administration, C.R and G.L. All authors have read and agreed to the published version of the manuscript.
Funding
This research received no external funding.
Data Availability Statement
Data will be made available by the authors upon request.
Conflicts of Interest
The authors declare no conflict of interest.
References
- European Commission. A Clean Planet for All a European Strategic Long-Term Vision for a Prosperous, Modern, Competitive and Climate Neutral Economy; Document EUR-Lex-52018DC0773. COM(2018) 773 Final; Publications Office of the European Union: Brussels, Belgium, 2018. Available online: https://eur-lex.europa.eu/legal-content/EN/TXT/?uri=CELEX:52018DC0773 (accessed on 11 January 2021).
- European Commission. The European Green Deal; Document EUR-Lex-52019DC0640. COM(2019) 640 Final; Publications Office of the European Union: Brussels, Belgium, 2019. Available online: https://eur-lex.europa.eu/legal-content/EN/TXT/PDF/?uri=CELEX:52019DC0640&from=EN (accessed on 11 January 2021).
- Sokratidou, A.; Gkouvatsou, E.; Roumpos, C.; Perdiou, A.; Tsagkarakis, G.; Kaimaki, S. Innovative Approaches to Coal Surface Mine Sites Rehabilitation: A Case Study of Megalopolis Lignite Fields. In Proceedings of the 14th International Symposium of Continuous Surface Mining, Thesaloniki, Greece, 24 September 2018; Sideri, D., Paraskevis, N., Eds.; pp. 437–452. [Google Scholar]
- Pachauri, R.K.; Mayer, L.; Intergovernmental Panel on Climate Change (Eds.) Climate Change 2014: Synthesis Report; IPCC: Geneva, Switzerland, 2015; ISBN 978-92-9169-143-2. Available online: https://climate-adapt.eea.europa.eu/countries-regions/countries/greece (accessed on 11 January 2021).
- Bistline, J.E.T.; Blanford, G.J. Value of Technology in the U.S. Electric Power Sector: Impacts of Full Portfolios and Technological Change on the Costs of Meeting Decarbonization Goals. Energy Econ. 2020, 86, 104694. [Google Scholar] [CrossRef]
- Pavloudakis, F.; Roumpos, C.; Karlopoulos, E.; Koukouzas, N. Sustainable Rehabilitation of Surface Coal Mining Areas: The Case of Greek Lignite Mines. Energies 2020, 13, 3995. [Google Scholar] [CrossRef]
- Bódis, K.; Kougias, I.; Taylor, N.; Jäger-Waldau, A. Solar Photovoltaic Electricity Generation: A Lifeline for the European Coal Regions in Transition. Sustainability 2019, 11, 3703. [Google Scholar] [CrossRef] [Green Version]
- Nikolić, Z.; Nikolić, D. Practical Example of Solar and Hydro Energy Hybrid System—The Need for a Reversible Power Plant. In Proceedings of the International Conference on Renewable Electrical Power Sources, Belgrade, Serbia, 2 October 2018; Volume 6, pp. 165–171. [Google Scholar]
- Keenan, J.; Holcombe, S. Mining as a Temporary Land Use: A Global Stocktake of Post-Mining Transitions and Repurposing. Extr. Ind. Soc. 2021, 8, 100924. [Google Scholar] [CrossRef]
- Wessel, M.; Madlener, R.; Hilgers, C. Economic Feasibility of Semi-Underground Pumped Storage Hydropower Plants in Open-Pit Mines. Energies 2020, 13, 4178. [Google Scholar] [CrossRef]
- McCullough, C.; Schultze, M.; Vandenberg, J. Realizing Beneficial End Uses from Abandoned Pit Lakes. Miner 2020, 10, 133. [Google Scholar] [CrossRef] [Green Version]
- Holcombe, S.; Keenan, J. Mining as a Temporary Land Use Scoping Project: Transitions and Repurposing; The Social Aspects of Mine Closure Research Consortium; Centre for Social Responsibility in Mining, Sustainable Minerals Institute: Brisbane, Australia, 2020; Available online: https://www.mineclosure.net/elibrary/mining-as-a-temporary-land-use-industry-led-transitions-and-repurposing (accessed on 13 January 2021).
- Gammons, C.H.; Harris, L.N.; Castro, J.M.; Cott, P.A.; Hanna, B.W. Creating Lakes from Open Pit Mines: Processes and Considerations, Emphasis on Northern Environments. Can. Tech. Rep. Fish. Aquat. Sci. 2826 2009, 106. [Google Scholar]
- Schultze, M. The Filling and Remediation of Pit Lakes in Former Open Cast Lignite Mines. Ph.D. Dissertation, Tech Univ Braunschweig Fac Archit Constr Eng Environ Sci, Braunschweig, Germany, 2012. [Google Scholar]
- McCullough, C.D. Rehabilitation of Lake Kepwari: A Previously Acidic Mine Lake in Western Australia. In Proceedings of the IMWA—Mine Water Management for Future Generations; Stanley, P., Wolkersdorfer, C., Wolkersdorfer, K., Eds.; Cardiff University: Cardiff, Wales, UK, 2021; pp. 346–351. Available online: https://www.imwa.info/imwaconferencesandcongresses/proceedings/325-proceedings-2021.html (accessed on 20 January 2022).
- Lund, M.; van Etten, E.; Polifka, J.; Vasquez, M.Q.; Ramessur, R.; Yangzom, D.; Blanchette, M.L. The Importance of Catchments to Mine-Pit Lakes: Implications for Closure. Mine Water Environ. 2020, 39, 572–588. [Google Scholar] [CrossRef]
- Lund, M.A.; Blanchette, M. Can Saline Pit Lakes Offer Biodiversity Values at Closure? In Proceedings of the IMWA—Mine Water Management for Future Generations; Stanley, P., Wolkersdorfer, C., Wolkersdorfer, K., Eds.; Cardiff University: Cardiff, Wales, UK, 2021; pp. 300–306. Available online: https://www.imwa.info/imwaconferencesandcongresses/proceedings/325-proceedings-2021.html (accessed on 20 January 2022).
- Blanchette, M.L.; Lund, M.A. Pit Lakes Are a Global Legacy of Mining: An Integrated Approach to Achieving Sustainable Ecosystems and Value for Communities. Curr. Opin. Environ. Sustain. 2016, 23, 28–34. [Google Scholar] [CrossRef]
- Snashall, D.; Cox, K. Woodlawn Advanced Energy Recovery Centre Scoping Report; Australia. Available online: https://majorprojects.planningportal.nsw.gov.au (accessed on 11 May 2021).
- Pytel, S.; Sitek, S.; Chmielewska, M.; Zuzańska-Żyśko, E.; Runge, A.; Markiewicz-Patkowska, J. Transformation Directions of Brownfields: The Case of the Górnośląsko-Zagłębiowska Metropolis. Sustainability 2021, 13, 2075. [Google Scholar] [CrossRef]
- Ma, T.; Yang, H.; Lu, L.; Peng, J. Technical Feasibility Study on a Standalone Hybrid Solar-Wind System with Pumped Hydro Storage for a Remote Island in Hong Kong. Renew. Energy 2014, 69, 7–15. [Google Scholar] [CrossRef]
- Matos, C.R.; Carneiro, J.F.; Silva, P.P. Overview of Large-Scale Underground Energy Storage Technologies for Integration of Renewable Energies and Criteria for Reservoir Identification. J. Energy Storage 2019, 21, 241–258. [Google Scholar] [CrossRef]
- Kavvadas, M.J.; Marinos, P.G. Prediction of Groundwater Table Lowering for Lignite Open-Cast Mining in a Karstic Terrain in Western Macedonia, Greece. Q. J. Eng. Geol. Hydrogeol. 1994, 27, S41–S55. [Google Scholar] [CrossRef] [Green Version]
- Louloudis, G. Hydrogeological conditions of South Lignite Bearing Field of Ptolemais region. Confrontation of groundwater problems during the exploitation. Ph.D. Dissertation, Natl Tech University Athen Sch Min Metall Eng, Athens, Greece, 1991. (In Greek). [Google Scholar]
- Dimitrakopoulos, D.; Grigorakou, E. Aquatic Balance of Vegoritis Lake, West Macedonia, Greece, Ralated to Mining Activity. In Proceedings of the Mine Water 2004—International Mine Water Association Symposium 1; Jarvis, A.P., Dudgeon, B.A., Younger, P.L., Eds.; University of Newcastle: Newcastle upon Tyne, UK, 2004; pp. 201–207. Available online: https://www.imwa.info/imwaconferencesandcongresses/proceedings/189-proceedings-2004.html (accessed on 20 January 2022).
- Koukouzas, N.; Ward, C.R.; Li, Z. Mineralogy of Lignites and Associated Strata in the Mavropigi Field of the Ptolemais Basin, Northern Greece. Int. J. Coal Geol. 2010, 81, 182–190. [Google Scholar] [CrossRef]
- Kavvadas, M.; Roumpos, C.; Schilizzi, P. Stability of Deep Excavation Slopes in Continuous Surface Lignite Mining Systems. Geotech. Geol. Eng. 2020, 38, 791–812. [Google Scholar] [CrossRef]
- Beck, H.E.; Zimmermann, N.E.; McVicar, T.R.; Vergopolan, N.; Berg, A.; Wood, E.F. Present and Future Köppen-Geiger Climate Classification Maps at 1-Km Resolution. Sci. Data 2018, 5, 180214. [Google Scholar] [CrossRef] [PubMed] [Green Version]
- Thornthwaite, C.W.; Mather, J.R. The Water Balance; Drexel Institute of Technology, Laboratory of Climatology, N.J. Publications in Climatology, 1955; Volume VIII, p. 104. Available online: https://www.jstor.org/stable/210739?origin=crossref (accessed on 20 January 2022).
- Kinzelbach, W. Groundwater Modelling: An Introduction with Sample Programs in BASIC; Developments in water science; Elsevier: Amsterdam, The Netherlands; Oxford, UK; New York, NY, USA; Tokyo, Japan, 1986; ISBN 978-0-444-42582-9. [Google Scholar]
- Calvo, J.C. An Evaluation of Thornthwaite’s Water Balance Technique in Predicting Stream Runoff in Costa Rica. Hydrol. Sci. J. 1986, 31, 51–60. [Google Scholar] [CrossRef] [Green Version]
- Blau, R.V.; Hoehn, P.; Hufschmied, P.; Werner, A. Ermittlung Der Grundwasserneubildung Aus Niederschlägen. Gas Wasser Abwasser Schweiz. Ver. Des Gas- Und Wasserfaches 1983, 63, 45–54. [Google Scholar]
- Louloudis, G.; Louloudis, E.; Roumpos, C.; Mertiri, E.; Kasfikis, G.; Chatzopoulos, K. Forecasting Development of Mine Pit Lake Water Surface Levels Based on Time Series Analysis and Neural Networks. Mine Water Environ. 2021, 41, 458–474. [Google Scholar] [CrossRef]
- Manning, J.C. Applied Principles of Hydrology, 3rd ed.; Prentice Hall: Hoboken, NJ, USA, 1997. [Google Scholar]
- Dupuit, J. Theoretical and Practical Studies on the Movement of Water in Open Channels and through Permeable Soils; Dunod: Paris, Frence, 1863. (In French) [Google Scholar]
- Krassakis, P.; Pyrgaki, K.; Gemeni, V.; Roumpos, C.; Louloudis, G.; Koukouzas, N. GIS-Based Subsurface Analysis and 3D Geological Modeling as a Tool for Combined Conventional Mining and In-Situ Coal Conversion: The Case of Kardia Lignite Mine, Western Greece. Mining 2022, 2, 297–314. [Google Scholar] [CrossRef]
- Zhan, G.; Lin Shelp, M. Modified Blaney-Criddle Method—An Empirical Approach to Estimate Potential Evaporation Using Air Temperature; The University of Western Australia: Perth, Australia, 2009; pp. 461–471. [Google Scholar]
- Tasumi, M.; Allen, R.G.; Trezza, R. Calibrating Satellite-Based Vegetation Indices to Estimate Evapotranspiration and Crop Coefficients. In Proceedings of the USCID Water Management Conference; Wichelns, D., Anderson, S.S., Eds.; U.S. Committee on Irrigation and Drainage: Denver, CO, USA, 2006; pp. 103–112. [Google Scholar]
- Memmos, N. Soil Survey Report of the Drained Giannitsa Lake; Ministry of Agriculture, Sector of Land Reclamation Service (YEB, Acronym in Greek): Thessaloniki, Greece, 1973; unpublished. (In Greek)
- Louloudis, G.; Stathopoulos, N. Irrigation Water Consumptive Use Changes in South Ptolemais Lignite Bearing Hydrogeological Basin (Greece) Using NDVI Remotely Sensed Data. In Proceedings of the 15th Internat ional Congress of the Geological Society of Greece; Kranis, H., Ed.; Bulletin of the Geological Society of Greece; Harokopio University of Athens: Athens, Greece, 2019; Volume 7, pp. 611–612. Available online: https://ejournals.epublishing.ekt.gr/index.php/geosociety/issue/view/1265 (accessed on 20 January 2022).
- Panagos, P.; Van Liedekerke, M.; Jones, A.; Montanarella, L. European Soil Data Centre: Response to European Policy Support and Public Data Requirements. Land Use Policy 2012, 29, 329–338. [Google Scholar] [CrossRef]
- McCuen, R.H.; Bondelid, T.R. Relation Between Curve Number and Runoff Coefficient. J. Irrig. Drain. Div. 1981, 107, 395–400. [Google Scholar] [CrossRef]
- Kim, N.; Shin, M.-J. Estimation of Peak Flow in Ungauged Catchments Using the Relationship between Runoff Coefficient and Curve Number. Water 2018, 10, 1669. [Google Scholar] [CrossRef] [Green Version]
- Giandotti, M. Previsione delle piene e delle magre dei corsi d’acqua. In Memorie e Studi Idrografici; Ministero dei LL.PP., Servizio Idrografico Italiano: Rome, Italy, 1934; Volume 8, pp. 107–117. [Google Scholar]
- Penman, H.L. Natural Evaporation from Open Water, Bare Soil and Grass. Proc. R. Soc. Lond. A 1948, 193, 120–145. [Google Scholar] [CrossRef] [Green Version]
- Sellers, W.D. Physical Climatology; The University of Chicago Press: Chicago, IL, USA, 1965. [Google Scholar]
- Tetens, O. About some meteorological terms. J. Geophys. 1930, 6, 297–309. (In German) [Google Scholar]
- Eagleman, J.R. Pan Evaporation, Potential and Actual Evapotranspiration. J. Appl. Meteorol. Climatol. 1967, 6, 482–488. [Google Scholar] [CrossRef]
- Monteith, J.; Unsworth, M. Principles of Environmental Physics: Plants, Animals, and the Atmosphere; Academic Press: Warszawa, Poland, 2013; Volume 4, ISBN 978-0-12-386910-4. [Google Scholar]
- Gass, S.I. Linear Programming. In Encyclopedia of Statistical Sciences; Kotz, S., Read, C.B., Balakrishnan, N., Vidakovic, B., Johnson, N.L., Eds.; John Wiley & Sons, Inc.: Hoboken, NJ, USA, 2006; p. ess1466.pub2. ISBN 978-0-471-66719-3. [Google Scholar]
- Boretti, A.; Castelletto, S.; Al-Kouz, W.; Nayfeh, J. Capacity Factors of Solar Photovoltaic Energy Facilities in California, Annual Mean and Variability. E3S Web Conf. 2020, 181, 02004. [Google Scholar] [CrossRef]
- Tyralis, H.; Karakatsanis, G.; Tzouka, K.; Mamassis, N. Data and Code for the Exploratory Data Analysis of the Electrical Energy Demand in the Time Domain in Greece. Data Brief 2017, 13, 700–702. [Google Scholar] [CrossRef]
- Koudouris, G.; Dimitriadis, P.; Iliopoulou, T.; Mamassis, N.; Koutsoyiannis, D. Investigation on the Stochastic Nature of the Solar Radiation Process. Energy Procedia 2017, 125, 398–404. [Google Scholar] [CrossRef]
- Faour, K. Farm Budget Handbook, Southern NSW-Irrigated Winter Crops 2001; NSW Agriculture, 2001; Available online: https://lib.k-state.edu/gracroplands/cite.php?CiteID=3758 (accessed on 20 January 2022).
- Gemitzi, A.; Lakshmi, V. Estimating Groundwater Abstractions at the Aquifer Scale Using GRACE Observations. Geosciences 2018, 8, 419. [Google Scholar] [CrossRef] [Green Version]
- Pujades, E.; Orban, P.; Bodeux, S.; Archambeau, P.; Erpicum, S.; Dassargues, A. Underground Pumped Storage Hydropower Plants Using Open Pit Mines: How Do Groundwater Exchanges Influence the Efficiency? Appl. Energy 2017, 190, 135–146. [Google Scholar] [CrossRef]
- Kavvadas, M.; Roumpos, C.; Servou, A.; Paraskevis, N. Geotechnical Issues in Decommissioning Surface Lignite Mines—The Case of Amyntaion Mine in Greece. Mining 2022, 2, 278–296. [Google Scholar] [CrossRef]
- Jiskani, I.M.; Cai, Q.; Zhou, W.; Ali Shah, S.A. Green and Climate-Smart Mining: A Framework to Analyze Open-Pit Mines for Cleaner Mineral Production. Resour. Policy 2021, 71, 102007. [Google Scholar] [CrossRef]
- Richards, L.A.; Allison, L.E.; Brown, J.W.; Hayward, H.E.; Richards, L.A.; Bernstein, L.; Fireman, M.; Pearson, G.A.; Wilcox, L.V.; Bower, C.A.; et al. Diagnosis and Improvement of Saline and Alkali Soils; Agricultural Handbook No. 60; Salinity Laboratory, Soil and Water Conservation Research Branch, Agricultural Research Service, US Department of Agriculture: Washington, DC, USA, 1954; pp. 69–82.
- Wilcox, L.V. Classification and Use of Irrigation Waters; Salinity Laboratory, US Department of Agriculture: Washington, DC, USA, 1955; Circular No. 969; pp. 1–19.
- Wilcox, L.V. The Quality of Water for Irrigation Use; Salinity Laboratory, US Department of Agriculture: Washington, DC, USA, 1948; Technical Bulletin No. 962; pp. 1–40. [CrossRef]
Figure 1.
Research area and location of the Kardia Lignite Mine (LM), Greece. Basemap obtained from https://www.esri.com/en-us/home accessed on 30 March 2022 (Coordinate Reference System GGRS87/Greek Grid).
Figure 1.
Research area and location of the Kardia Lignite Mine (LM), Greece. Basemap obtained from https://www.esri.com/en-us/home accessed on 30 March 2022 (Coordinate Reference System GGRS87/Greek Grid).

Figure 2.
Kardia lignite mine geomorphology, Greece (Coordinate Reference System GGRS87/Greek Grid): (a) digital elevation model (DEM) of the open pit; (b) slope model (in degrees).
Figure 2.
Kardia lignite mine geomorphology, Greece (Coordinate Reference System GGRS87/Greek Grid): (a) digital elevation model (DEM) of the open pit; (b) slope model (in degrees).

Figure 3.
Geological and hydro-lithological map in the Ptolemais lignite field, northern Greece (Coordinate Reference System GGRS87/Greek Grid).
Figure 3.
Geological and hydro-lithological map in the Ptolemais lignite field, northern Greece (Coordinate Reference System GGRS87/Greek Grid).

Figure 4.
Flowchart of the methodological approach.

Figure 5.
Mean annual: (a) rainfall and (b) temperature from the Kozani weather station (blue color) and Ptolemaida weather station (green color), northern Greece.
Figure 5.
Mean annual: (a) rainfall and (b) temperature from the Kozani weather station (blue color) and Ptolemaida weather station (green color), northern Greece.

Figure 6.
Sensitivity analysis of percolation rate , as a percentage of precipitation , towards field capacity at the wider area of Ptolemais lignite field, northern Greece.
Figure 6.
Sensitivity analysis of percolation rate , as a percentage of precipitation , towards field capacity at the wider area of Ptolemais lignite field, northern Greece.

Figure 7.
Hydrogeological conceptual model for Kardia pit lake, Greece (the location of the cross section A-A’ is shown in Figure 3).
Figure 7.
Hydrogeological conceptual model for Kardia pit lake, Greece (the location of the cross section A-A’ is shown in Figure 3).

Figure 8.
Spatial distribution of: (a) runoff coefficient by processing European raster; (b) spectra indices of using Landsat-8 (image acquired in July 2018); (c) irrigation-specific consumptive use (m3/m2); (d) annual drawdown in m, corresponding to the deficit of groundwater recharge due to excessive irrigation consumptive use of groundwater in Kardia lignite field, northern Greece (Coordinate Reference System GGRS87/Greek Grid).


Figure 9.
(a) Irrigation-specific consumptive use (m3/m2) versus using Landsat-8 (image acquired in July 2018) and (b) Percolation, irrigation and groundwater deficit time series during the period 2006–2021 in Sarigiol basin, Greece.
Figure 9.
(a) Irrigation-specific consumptive use (m3/m2) versus using Landsat-8 (image acquired in July 2018) and (b) Percolation, irrigation and groundwater deficit time series during the period 2006–2021 in Sarigiol basin, Greece.

Figure 10.
Representative scheme for the hybrid pumped hydro storage (HPHS) plant operational schedule during daytime hours and photovoltaic (PV) integration, considering the installation of a 270 MW PV plant in the Kardia mine.
Figure 10.
Representative scheme for the hybrid pumped hydro storage (HPHS) plant operational schedule during daytime hours and photovoltaic (PV) integration, considering the installation of a 270 MW PV plant in the Kardia mine.

Figure 11.
Artificial neural network prediction (NNAR) implemented for the Kardia lignite field area, northern Greece. NNAR results of the annual: (a) rainfall; (b) runoff; (c) water balance of lake’s surface (precipitation minus evaporation on lake’s surface); (d) percolation rate; (e) specific consumptive irrigation use; (f) drawdown (percolation minus groundwater attenuation as a result of irrigation consumption); (g) groundwater level in the Sarigiol aquifer (i.e., above the lignite sequence).

Figure 12.
Forecast of the spatiotemporal development of the Kardia pit lake: (a) lake surface vs surface runoff decrease; (b) annual inflows and outflows; (c) the absolute elevations and gradual increase in stored water volume vs. time; (d) the absolute elevations and gradual increase in stored water volume vs. lake depth.

Figure 13.
Land use repurposing inside the Kardia mine, Greece (Project Coordinate Reference System GGRS87/Greek Grid).
Figure 13.
Land use repurposing inside the Kardia mine, Greece (Project Coordinate Reference System GGRS87/Greek Grid).

Figure 14.
Classification of groundwater and the mine’s internal sump water for irrigation purposes: (a) diagram of sodium hazard (sodium adsorption ration) and salinity hazard (electrical conductivity) [59,60]; (b) suitability of water for irrigation use, according to Wilcox diagram [61].

Figure 15.
(a) Potential power of storage provision (MW/ m of water fluctuation) in relation to pit lake volume and water level, considering 1.0 m for the pit lake level variation (), in the case of the upper reservoir mounted inside the mine (+ 640 m a.s.l.) and outside the mine exploitation area (+ 670 m a.s.l.) and, (b) indicative net present value in real terms () in alternative scenarios of the pit lake’s elevation and filling procedure, inside the Kardia mine, Greece.


Table 1.
Mean annual water balance for the unsaturated zone of the Sarigiol loose sediment basin.
| Hydrological Cycle in Sarigiol Basin (2006–2021) | mm/yr | 106 m3/yr | Precipitation (%) |
|---|---|---|---|
| Mean annual precipitation | 584 | 123 | 100 |
| Mean annual real evaporation | 425 | 90 | 73 |
| Mean annual percolation | 86 | 18 | 15 |
| Mean annual runoff | 72 | 15 | 12 |
Table 2.
Variation in slope stability conditions related to the pit lake development in decommissioning surface lignite mines in Greece, used for preliminary prediction.
Table 2.
Variation in slope stability conditions related to the pit lake development in decommissioning surface lignite mines in Greece, used for preliminary prediction.
| Lake Water Depth (Hw)/Height of the Slope (H) | FS/FSo* |
|---|---|
| 0 | 1.0 |
| 0.1 | <1.0 |
| 0.2 | 1.0 |
| 0.4 | 1.075 |
| 0.6 | 1.25 |
| 0.8 | 1.6 |
Note(s): * FS = Safety factor, FSo = initial FS when water depth Hw = 0. Source: [57].
Publisher’s Note: MDPI stays neutral with regard to jurisdictional claims in published maps and institutional affiliations. |
© 2022 by the authors. Licensee MDPI, Basel, Switzerland. This article is an open access article distributed under the terms and conditions of the Creative Commons Attribution (CC BY) license (https://creativecommons.org/licenses/by/4.0/).
Share and Cite
MDPI and ACS Style
Louloudis, G.; Roumpos, C.; Louloudis, E.; Mertiri, E.; Kasfikis, G. Repurposing of a Closed Surface Coal Mine with Respect to Pit Lake Development. Water 2022, 14, 3558. https://doi.org/10.3390/w14213558
AMA Style
Louloudis G, Roumpos C, Louloudis E, Mertiri E, Kasfikis G. Repurposing of a Closed Surface Coal Mine with Respect to Pit Lake Development. Water. 2022; 14(21):3558. https://doi.org/10.3390/w14213558
Chicago/Turabian StyleLouloudis, Georgios, Christos Roumpos, Emmanouil Louloudis, Eleni Mertiri, and Georgios Kasfikis. 2022. "Repurposing of a Closed Surface Coal Mine with Respect to Pit Lake Development" Water 14, no. 21: 3558. https://doi.org/10.3390/w14213558
Note that from the first issue of 2016, this journal uses article numbers instead of page numbers. See further details here.