
Regulation of Abiotic Factors on Aboveground Biomass and Biodiversity of Ditch Slope in Coastal Farmland
by
Yueying Wang
1,†, 
Songtao Wang
2,3,†,
Bing Jiang
2,3,
Yihao Zhu
1,
Xuchang Niu
1,
Changjiang Li
1,
Zhen Wu
2,3,* and
Weifeng Chen
1,2,* 1
Department of Soil Science, College of Resources and Environment, Shandong Agricultural University, Tai’an 271000, China
2
Key Laboratory of Coastal Zone Geological Environment Protection, Shandong Geology and Mineral Exploration and Development Bureau, Ji’nan 250000, China
3
Shandong Provincial No. 4 Institute of Geological and Mineral Survey, Weifang 261000, China
*
Authors to whom correspondence should be addressed.
†
These authors contributed equally to this work.
Water 2022, 14(21), 3547; https://doi.org/10.3390/w14213547
Submission received: 14 August 2022
/
Revised: 9 October 2022
/
Accepted: 30 October 2022
/
Published: 4 November 2022
(This article belongs to the Special Issue Monitoring, Reclamation and Management of Salt-Affected Lands)
Abstract
:Ditch plant biomass and diversity play an important role in maintaining ditch ecosystem structure and function stability, which are subject to environmental changes. However, the regulation of abiotic factors on the aboveground biomass and diversity of plants on the slopes of coastal agricultural ditches remains unclear. In this study, the spatial distribution of soil physicochemical properties, aboveground biomass, and diversity of vegetation on different slope positions (upper slope, middle slope, and lower slope) and slope aspects (north-south direction) of farmland drainage ditches and their correlations were investigated through field surveys of vegetation on the slopes of coastal farmland drainage ditches at different sampling sites. First, water content and bulk density) decreased with the increase of slope position, while the salinity showed the opposite spatial distribution characteristics and the distribution of soil nutrients in space was mainly concentrated in the 0–20 cm soil layer. Second, the aboveground biomass of vegetation was significantly higher on the south slope than on the north slope, with the highest biomass at the lower slope on the south slope and higher aboveground biomass on the north slope at the upper and middle slopes. The Shannon-Wiener index, Pielou index, and Margalef index of ditch slope vegetation in Dongying and Binzhou farmland ditch slopes showed the same pattern of change at different slope positions and directions, which were significantly higher at the upper and middle slopes than at the lower slopes. In contrast, the Simpson index showed the opposite pattern, decreasing with the increase in slope position. Further, WC, BD, organic matter content, and total nitrogen content had positive effects on vegetation aboveground biomass, while soil pH, salinity, and available potassium content hindered vegetation growth. Finally, the Shannon-Wiener index and Pielou index were positively correlated with soil BD and available phosphorus content, and negatively correlated with organic matter and total nitrogen content, while the Simpson index was positively correlated with soil BD and WC, and had a significant negative correlation with soil salinity.
1. Introduction
The Yellow River Delta is one of the nascent terrestrial ecosystems in China and is also the most active area of sea-land change. Subject to seawater erosion, the soils there have been accumulating salts on the surface, resulting in the gradual development of coastal saline soils under the influence of rainwater and microorganisms [1]. The salinization, poor permeability, and low nutrient content of agricultural soils in the Delta are not conducive to agricultural production [2]. The agricultural drainage ditch is an important engineering measure for saline soil improvement, which regulates the distribution of water and salt in agricultural fields through irrigation and then discharges through a drainage ditch, thus reducing the salinity of coastal agricultural fields and improving their farming conditions [3]. As a marginal part of the farmland ecosystem, farm drains carry salts, nutrients, and residual pesticides from the farmland with varying degrees of adsorption, forming a unique ecological landscape. Meanwhile, the slope vegetation of the drainage ditch can prolong the residence time of agricultural drainage in the ditch, and improve the desalination rate of the soil surface layer in the ditch and the purification rate of the drainage. Moreover, rich vegetation can also increase the content of soil organic matter, total nitrogen, and other nutrients, with a positive impact on the improvement of the soil [4].
The aboveground biomass and diversity of plants are important evaluation indicators for the composition and function of plant communities [5]. As the total aboveground organic matter accumulation of an organism or community in a certain period of time, aboveground biomass is usually used to evaluate vegetation community productivity and population function. Species diversity not only describes the abundance, degree of variation, and evenness of species in a community or habitat, but also reflects the interrelationship between different physical geographic conditions and communities [6]. The influencing factors of vegetation aboveground biomass and diversity are very complex. Various factors such as site conditions, environmental factors, disturbance characteristics, restoration degree, isolation degree, etc., may have an impact on species biomass and diversity. Environmental factors are usually considered to affect the growth of vegetation, and research on the effect of environmental factors has been a research hotspot, attracting the attention of ecologists [7]. Liu et al. [8] studied the influence of elevation-induced hydrothermal conditions and the spatial distribution of their combinations on vegetation structure, and found a positive correlation between elevation and vegetation diversity index and Margalef index. Yang et al. [9] found that vegetation diversity increased with the increase of restoration degree by analyzing the diversity characteristics of vegetation in different restoration stages of rocky slopes. Sewerniak et al. [10] deemed soil fertility as the most critical environmental factor affecting vegetation richness by analyzing the influence of topography-induced microclimate and soil conditions on vegetation diversity in Scottish pine woodlands. Xiao et al. [11] argued that environmental factors exerted an important influence on vegetation diversity.
Soil is the material basis for the occurrence and development of plant communities, with critical effects on plant community composition, community diversity, and biomass size [12]. Studies on the characteristics of plant community species diversity with different soil factors can reveal the interrelationship between biodiversity and soil factors, which has been a key area in ecological research [13]. Previous studies have mostly focused on grassland communities [5,14], forest communities [15], degraded sandy grasslands, roadside slopes, but less research has been conducted on saline drainage ditches. Therefore, the typical agricultural drainage ditches in the Yellow River Delta were selected as the research object in this study to investigate the spatial distribution characteristics of soil physicochemical properties, aboveground biomass, and diversity of vegetation in different slope positions (upper slope, middle slope, and lower slope) and slope aspects (north-south direction) of the ditch slopes. Because the elevation of the two sampling sites in the study area did not vary much and the climatic environment of the sites was similar, the influence of climatic factors such as temperature and precipitation on the aboveground biomass and diversity of vegetation was relatively small. In this paper, the vegetation index changes caused by soil factors were analyzed to explore the regulation of vegetation biomass and diversity on slopes by soil factors in coastal wetlands, which is expected to provide basic data and a theoretical basis for ecological restoration of saline soil on drainage ditch slopes.
2. Study Area Overview and Methodology
2.1. Study Area Overview
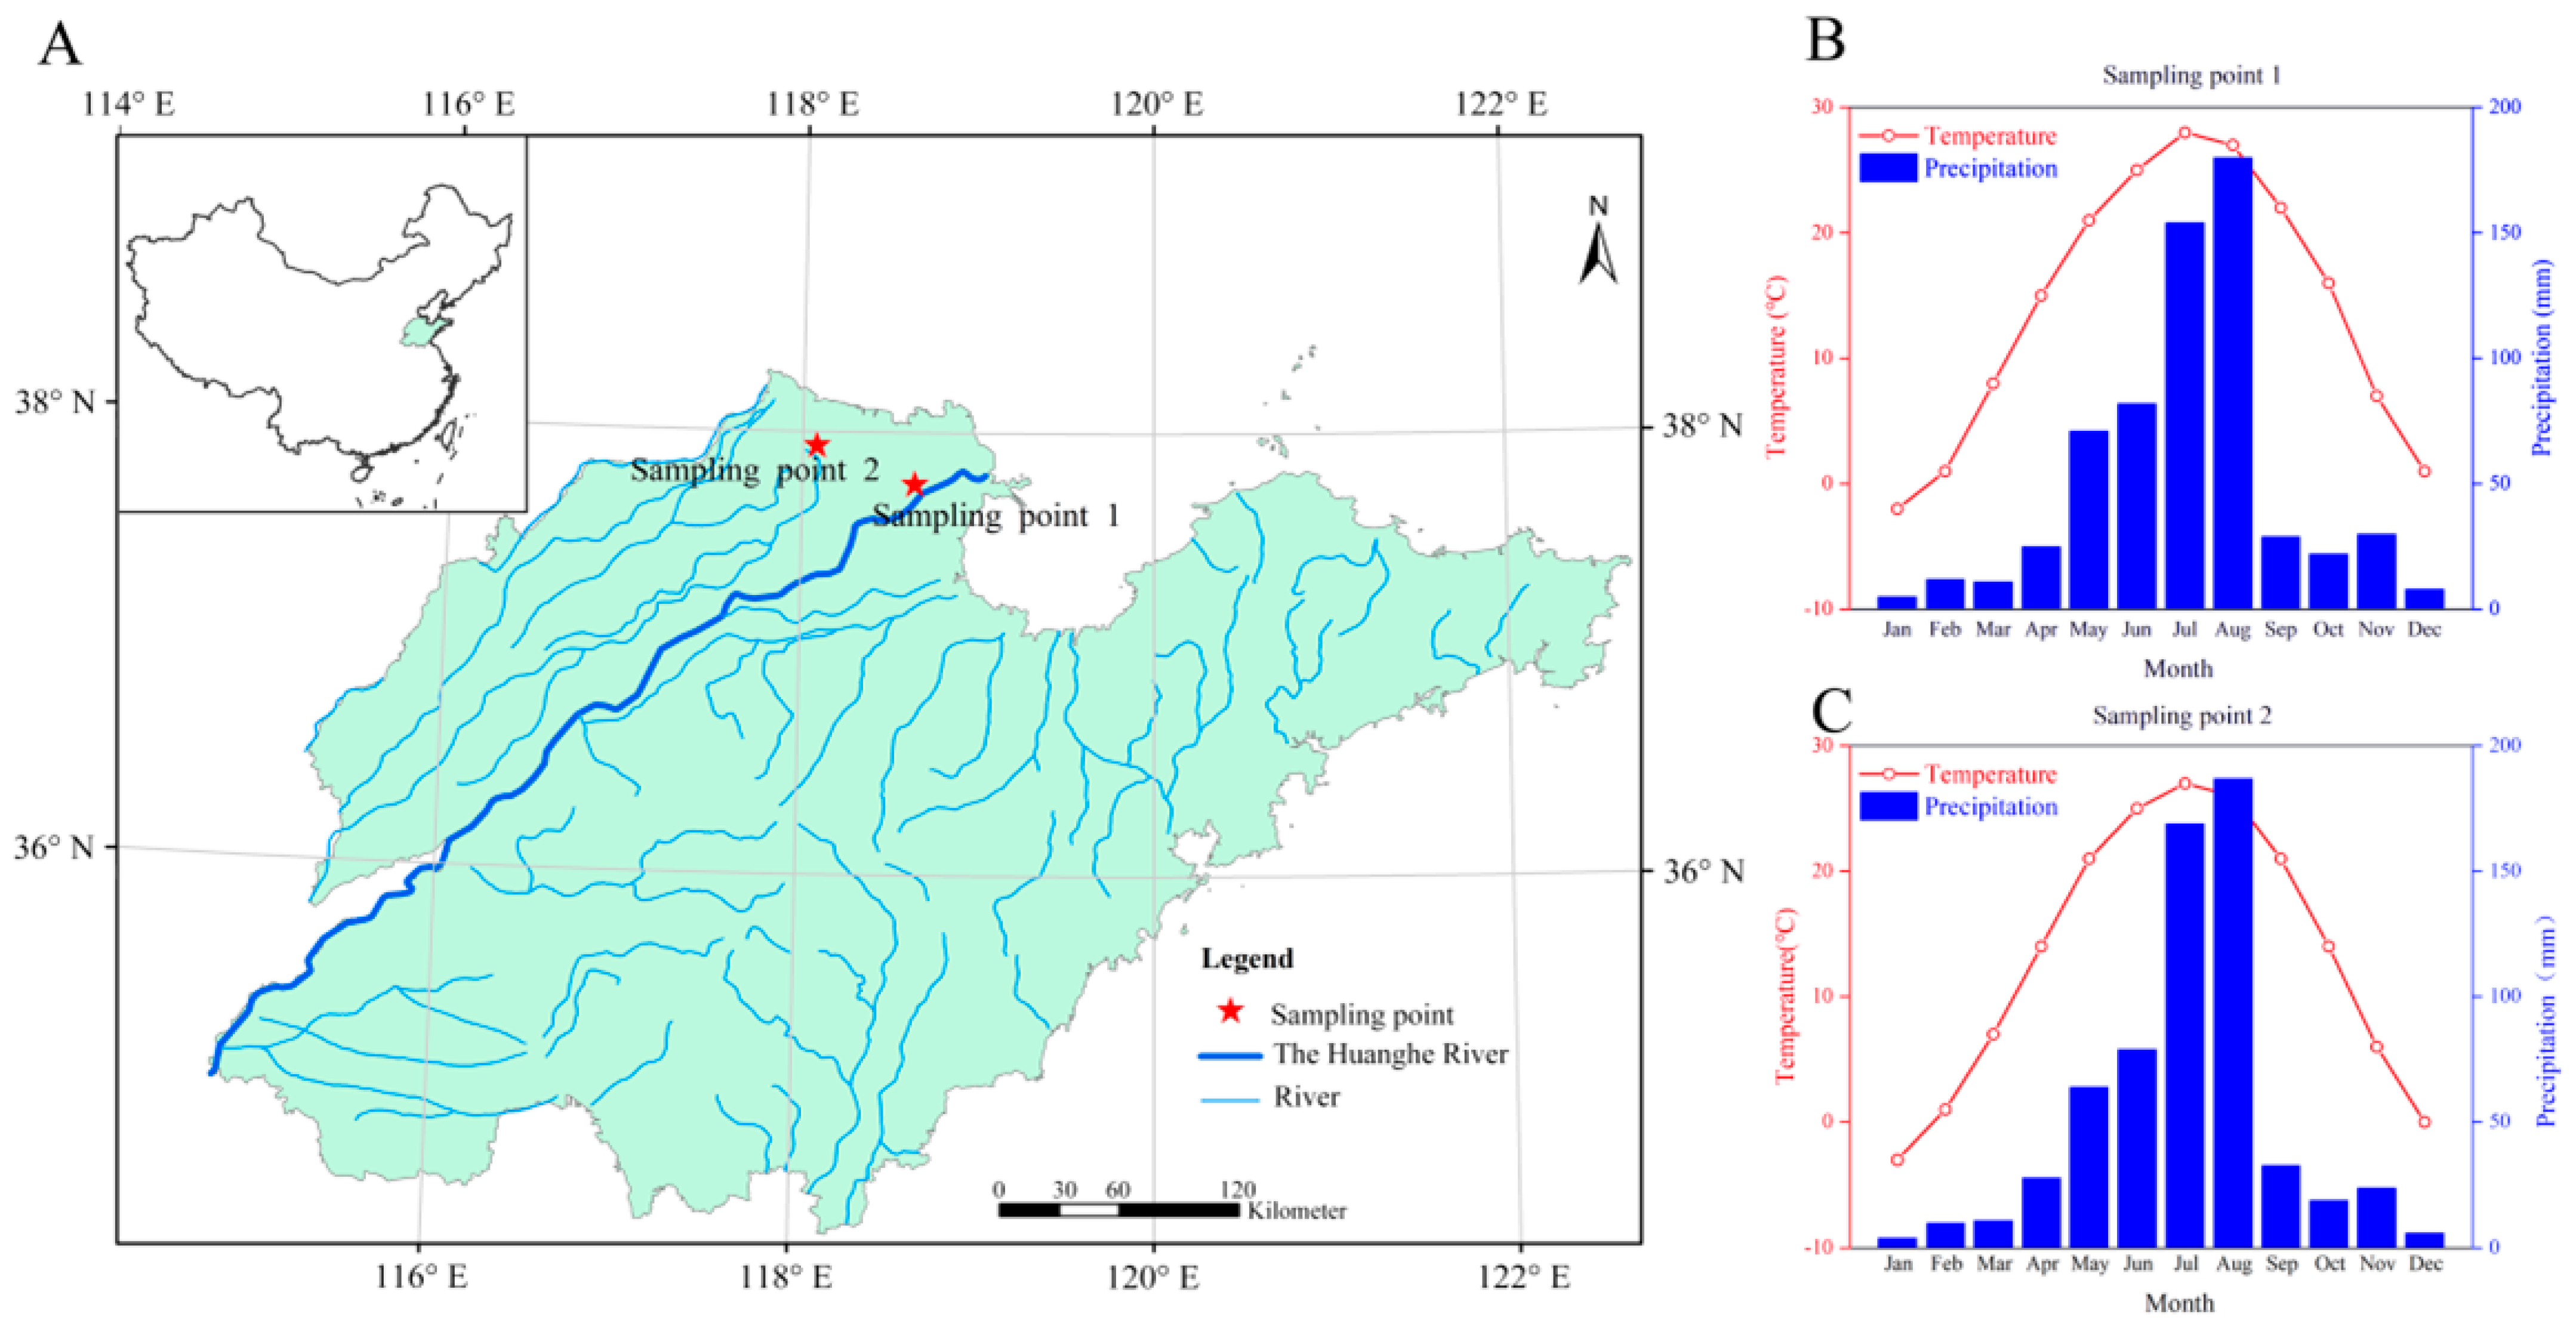
Bohai Farm, Lijin County, Dongying City, Shandong Province, and Huanghedao Island, Wudi County, Binzhou City, Shandong Province were selected as sample sites. The location and climatic conditions of sampling points are shown in Figure 1.
Lijin County is located in the northeastern part of Shandong Province, on the southwestern coast of the Bohai Sea, and on the left side of the near-mouth section of the Yellow River. The terrain of the whole territory slopes to the northeast; high in the southwest, low in the northeast, high near the Yellow River, and low at the far Yellow River. Given the frequent breach of the Yellow River, the area is subject to repeated punching by both flooding and sedimentation, thus forming a complex micro-land with interlocking hills, slopes, and depressions [16]. The average annual temperature is 14.2 °C, and the average precipitation is about 634.4 mm. It belongs to the continental monsoon region. The soil texture is mainly silting loam, a coastal saline Chao soil, and the farmland is a typical saline soil farmland [16]. Bohai Farm has formed a complete irrigation and drainage system after years of development, mainly planting corn, rice, and cotton. The self-sow herbaceous plants mainly include suaedasalsa (Suaeda glauca Bunge), reeds (Phragmites australis), Miscanthus sacchariftorus (Triarrhena sacchariflora Nakai), and cogon grass (Imperata cylindrica Beauv) [17,18].
Huanghedao Island, located in the transitional zone between the coastal plain and coastal mudflats, is the alluvial plain formed by the ancient Yellow River. Under the influence of river siltation and sea tide overflow, the area has formed a strip-like terrain surrounded by water on all sides, with a north-south direction and high and low. The soil is mainly silt loam, a typical coastal solonchak and coastal saline Chao soil with serious soil salinization. The annual average temperature is 13.6 °C, and the average rainfall is about 600 mm, a continental monsoon climate. The island has a wide variety of wildlife and plants, and self-sow vegetation mainly includes reeds (Phragmites australis), Tamarix (Tamarix chinensis Lour), Pyrus betulaefolia, and Suaedasalsa (Suaeda glauca Bunge), etc.
2.2. Sampling Design
A total of nine east-west aligned bucket ditches with typical vegetation were selected at each of the two sampling sites, with an average length of 1.7 km, an average depth of 2.0 m, a bottom width of 1.5 m, an upper width of 9.5 m, and a slope of 2:1. The north slope of the ditches faced the sun and had denser vegetation than the south slope. The bottom of the ditch was waterlogged all year round and covered by tall reeds with a coverage of 85%, and the vegetation diversity was higher on the middle and upper slopes, mainly growing with Suaeda salsa (Suaedaphysophora), artemisia annua (Artemisia annua L.), Apocynumvenetum (Apocynumvenetum L.), and chenopodium glaucum (Chenopodium glaucum L.).
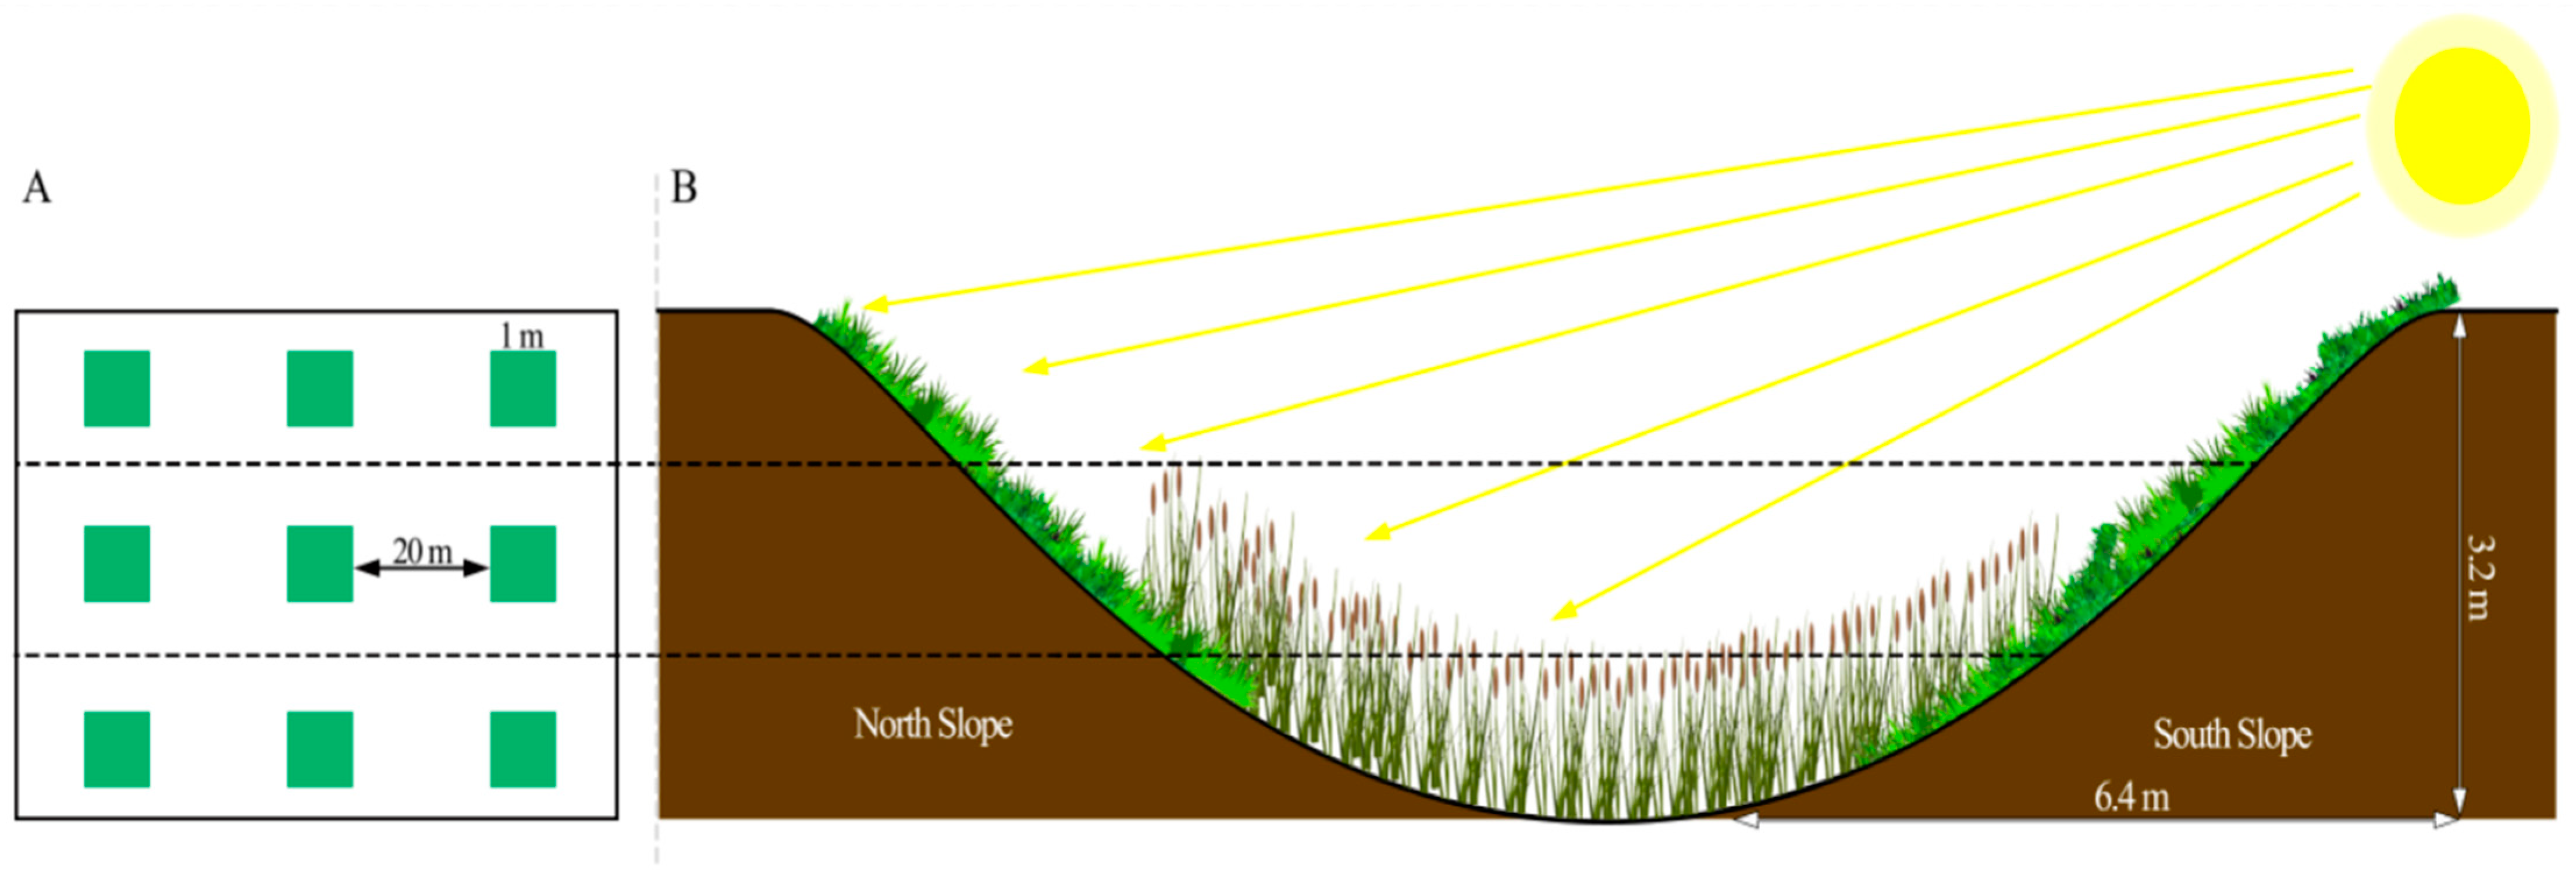
Field surveys and sampling were conducted in July 2020 (peak growth period), when the biomass in the ditch was at its maximum. The ditch was divided into three equal parts from the top down to the bottom of the ditch, marked as upper slope, middle slope, and lower slope; the ditch profile is shown in Figure 2A. An amount of 3 sample plots were selected as replicates (with an interval of 20 m) at the same slope position and slope aspect, and 18 sample plots were taken for each ditch, with 108 sample plots for 6 ditches slope sampling, as shown in Figure 2B. For good sample collection and vegetation survey, a random sample plot with the size of 1 m × 1 m was established. Four inflection points in the sample plot were marked with eye-catching markers. The names and basic traits of all plants in the sample plots: species composition, cover, height, abundance, and aboveground biomass, were measured as follows.
Height: Expressed as the average height of 10 random individuals.
Coverage: Expressed as the projected area on the ground of all individuals in the quadrant.
Abundance: Expressed as the average number of clumps of a species in the quadrant.
Aboveground biomass: The above-ground parts of the plants in 1 m2 were completely mowed and then killed at 105 °C for 30 min and dried to constant weight.
After harvesting the aboveground plants, soil samples from 0–20 cm and 20–40 cm soil layers were taken in self-sealing bags with an earth-boring auger in each quadrant, providing 216 bags in total, which were brought back to the laboratory, dried naturally in a place protected from light, the plant roots, residues, and gravels were removed, along with other debris from the soil, and were then sieved through 100 mesh for later use.
2.3. Determination of Soil Properties and Species Diversity
Soil indicators were determined according to the method of Yang et al., as follows: soil bulk density was determined with the cutting ring method; soil salt content and water content were determined with the oven drying method; bulk density was the ratio of water in the soil to the total weight of the soil; the soil-water suspension was prepared at a 5:1 (v/w) water-to-soil ratio and soil pH was determined by a pH meter (PHS-3C, Shanghai INESA Scientific Instruments Co., Ltd., Shanghai, China); soil organic matter content was determined by concentrated sulfuric acid-potassium dichromate oxidation-outer heating; total nitrogen content was determined by Kjeldahl apparatus (KDN-9820, Wuxi Chemical Equipment Co., Ltd., Wuxi, China) after the addition of boiled soil by concentrated sulfuric acid; available phosphorus content was extracted with 0.5 mol/L NaHCO3 solutions, and then colorimetry was conducted with spectrophotometer; and available potassium content was extracted with 1 mol/L NH4OAc solution, and then measured with a flame photometer (FP6430, Shanghai INESA Scientific Instruments Co., Ltd., Shanghai, China).
In this study, the importance values of the plant species were used as the basis for species diversity calculation. The importance value reflects the comprehensive quantitative index of the role and status of a species in the forest community, and is critical in determining the dominant species and constructive species, identifying the community type, and investigating the structure and function of ecological communities [19]. Different scholars have different approaches to calculating importance values, mainly differing in the combinations of relative density, relative dominance, relative height, relative coverage, and relative frequency. Because the number of individuals of species in the scrub and herbaceous layers is difficult to count compared to the tree layer, and Cr (relative coverage) and Hr (relative height) are the most readily available data in field surveys, relative height and relative cover are often used to calculate importance values for the shrub and herbaceous layers. In this study, the formula Iv = (Hr + Cr)/2 was used to calculate the importance value of each species. Four categories of species diversity measures were chosen: diversity index (Shannon-Wiener index), evenness index (Pielou index), richness index (Margalef index), and ecological dominance index (Simpson index); calculated as follows [14]:
Shannon-Wiener index (H):
Pielou index (E):
E = H/InS
Margalef index (M):
M = (S − 1)/lnS
Simpson index (C):
where H is the species Shannon-Wiener index, Pi is the dominance of the species in the sample plot, and S is the number of species in the sample plot.
2.4. Data Processing
The data were statistically sorted using Microsoft Excel and then processed and analyzed with SPSS to explore the correlations between vegetation biomass, species diversity, and soil factors. PCA analysis was performed and the correlation diagram was plotted using Origin 2019b (Origin Lab, Northampton, MA, USA). Finally, an SEM model was constructed using AMOS 22.0 to explain the effects of soil characteristics on plant biomass and vegetation diversity.
3. Results
3.1. Spatial Distribution Characteristics of Soil Physical and Chemical Properties
As can be seen in Table 1, the bulk density and pH of soil in the two slopes of sampling site 1 in the south and north were not significantly different in different soil depths, with the highest BD value found in the 20–40 cm soil layer in the lower slope of 1.56 g/cm3 and 1.52 g/cm3, respectively. The variation pattern of soil pH at different slope levels in both slope aspects was: lower slope position > middle slope position > upper slope position. Soil salt showed a pattern of upper slope position > middle slope position > lower slope position in both slope aspects, where the upper slope of the north slope showed significant surface aggregation with 4.03 g/kg in the 0–20 cm soil layer, 30% higher than that in the 20–40 cm soil layer, while the upper and middle slopes of the south slope both showed different degrees of surface aggregation with 4.14 g/kg and 2.7 g/kg, respectively. There was no significant difference in the total salt content of the soil at different soil depths on the other slope positions. The soil water content in both slopes showed a pattern of upper slope position > middle slope position > lower slope position, and the soil contents in the 0–20 cm soil layer were higher than those in the 20–40 cm soil layer in different slopes. The soil organic matter, total nitrogen, available phosphorus, and available potassium contents of soils on the north slope all exhibited the surface aggregation phenomenon, and the phenomenon in the 0–20 cm soil layer was significantly higher than that in the 20–40 cm soil layer. The contents of organic matter, total nitrogen, and available phosphorus did not significantly differ among the same soil layers at different slope positions, while the available potassium content showed a pattern of upper slope position > middle slope position > lower slope position. The organic matter content of the soil in the 0–20 cm soil layer on the lower slope position of the south slope was significantly higher than that in the 20–40 cm soil layer, while the differences in organic matter content between other slopes and soil layers were not significant. The total nitrogen and available phosphorus content were both highest in the 0–20 cm soil layer on the south slope, with 0.6 g/kg and 6.36 mg/kg, respectively.
As can be seen in Table 1, bulk density and pH at sampling site 2 on both south and north slopes were not significantly different in different soil layers on the same slope, and soil water content on different slopes showed the pattern of upper slope < middle slope < lower slope, with the soil water content in the 20–40 cm soil layer higher than that in the 0–20 cm soil layer. The soil organic matter content of the 0–20 cm soil layer on the north slope was the highest at 6.88 g/kg, significantly higher than that of the other slopes. The soil organic matter content of the 20–40 cm soil layer on the lower slope was the lowest at 4.88 g/kg, and the difference between the other slope layers was not significant. The highest soil organic matter content of 9.12 g/kg was found in the 0–20 cm soil layer on the south slope at the mid-slope, and the lowest organic matter content of 4.66 g/kg was found in the 20–40 cm soil layer on the upper slope. Total nitrogen content showed 0–20 cm > 20–40 cm on the upper and lower slopes of the northern slope, with no significant differences between different soil layers on the middle slope, while its content showed 0–20 cm > 20–40 cm on the upper and middle slopes of the southern slope, with no significant differences between different soil layers on the lower slope. The content of available phosphorus on the north slope showed a pattern of middle slope position > lower slope position > upper slope position, with the highest value of 9.45 mg/kg in the 0–20 cm soil layer of the middle slope position and the lowest value of 3.75 mg/kg in the 20–40 cm soil layer of the upper slope position. The content of available phosphorus in the south slope showed a pattern of lower slope position > upper slope position > middle slope position, in which the content in the 0–20 cm soil layer in the upper and lower slope positions was significantly higher than that in the 20–40 cm soil layer, and the difference between different soil layers in the middle slope was not significant. The content of available potassium showed a pattern of 0–20 cm > 20–40 cm on different slope aspects and slope positions, lower slope position > upper slope position > middle slope position on the north slope, and middle slope position > upper slope position > lower slope position on the south slope. As can be seen in Figure 3, soil physicochemical properties greatly varied on different slopes of the ditch, and nutrient mineralization also greatly varied between slope aspects under the influence of physical factors, such as soil temperature and soil moisture.
3.2. Spatial Distribution Characteristics of Vegetation Biomass and Diversity
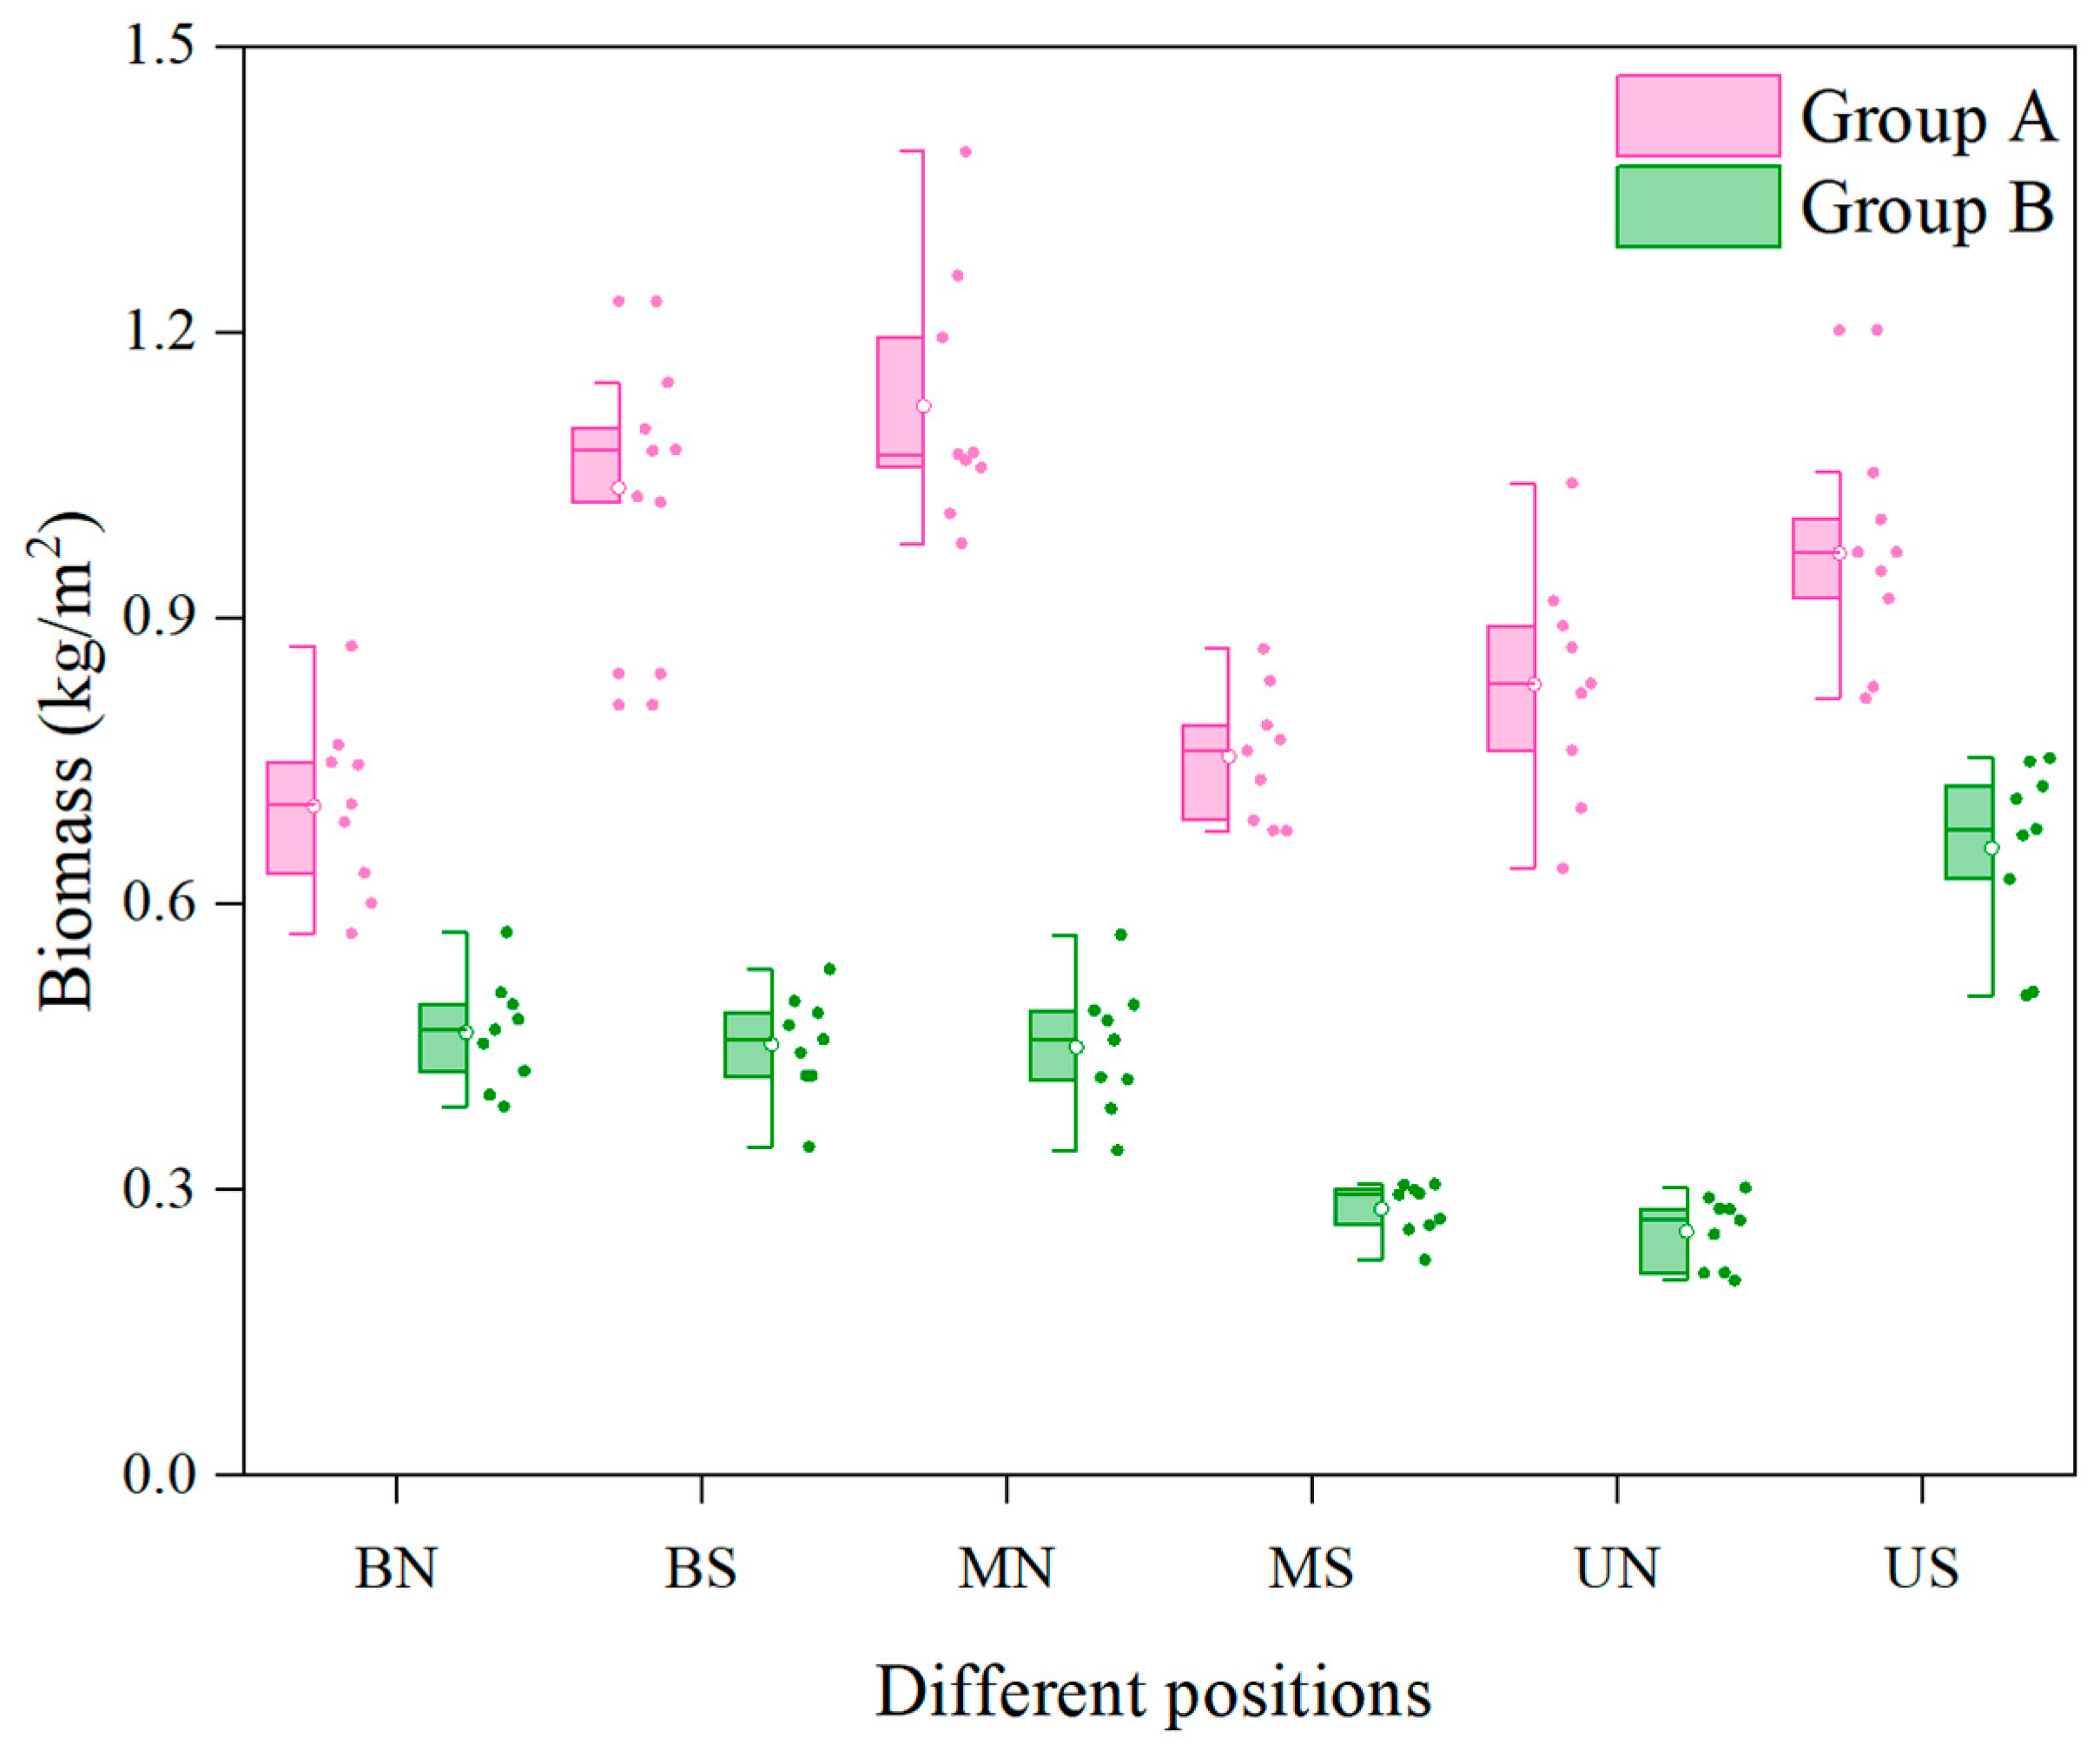
The analysis of the aboveground biomass of vegetation on the slope at different positions and aspects (Figure 4) revealed that the average aboveground vegetation biomass at site 1 was significantly higher than that at site 2, with the average vegetation biomass on the southern slope of the two sites, 0.70 kg/m2, substantially higher than the northern one. At site 1, the north slope with the order of middle slope position > upper slope position > lower slope position witnessed the mid-slope displaying 1.36 kg/m2 aboveground biomass on average; unquestionably higher than the other two. The average aboveground biomass on the south slope represented the highest in the lower slope position, followed by the upper slope position, and with that in the middle slope being the lowest. At site 2, the distribution of different slope positions on the north slope turned into the upper slope position > lower slope position > middle slope position, while the vegetation biomass of the lower slope position on the south slope was 0.53 kg/m2; significantly higher than that of the upper and middle counterparts.
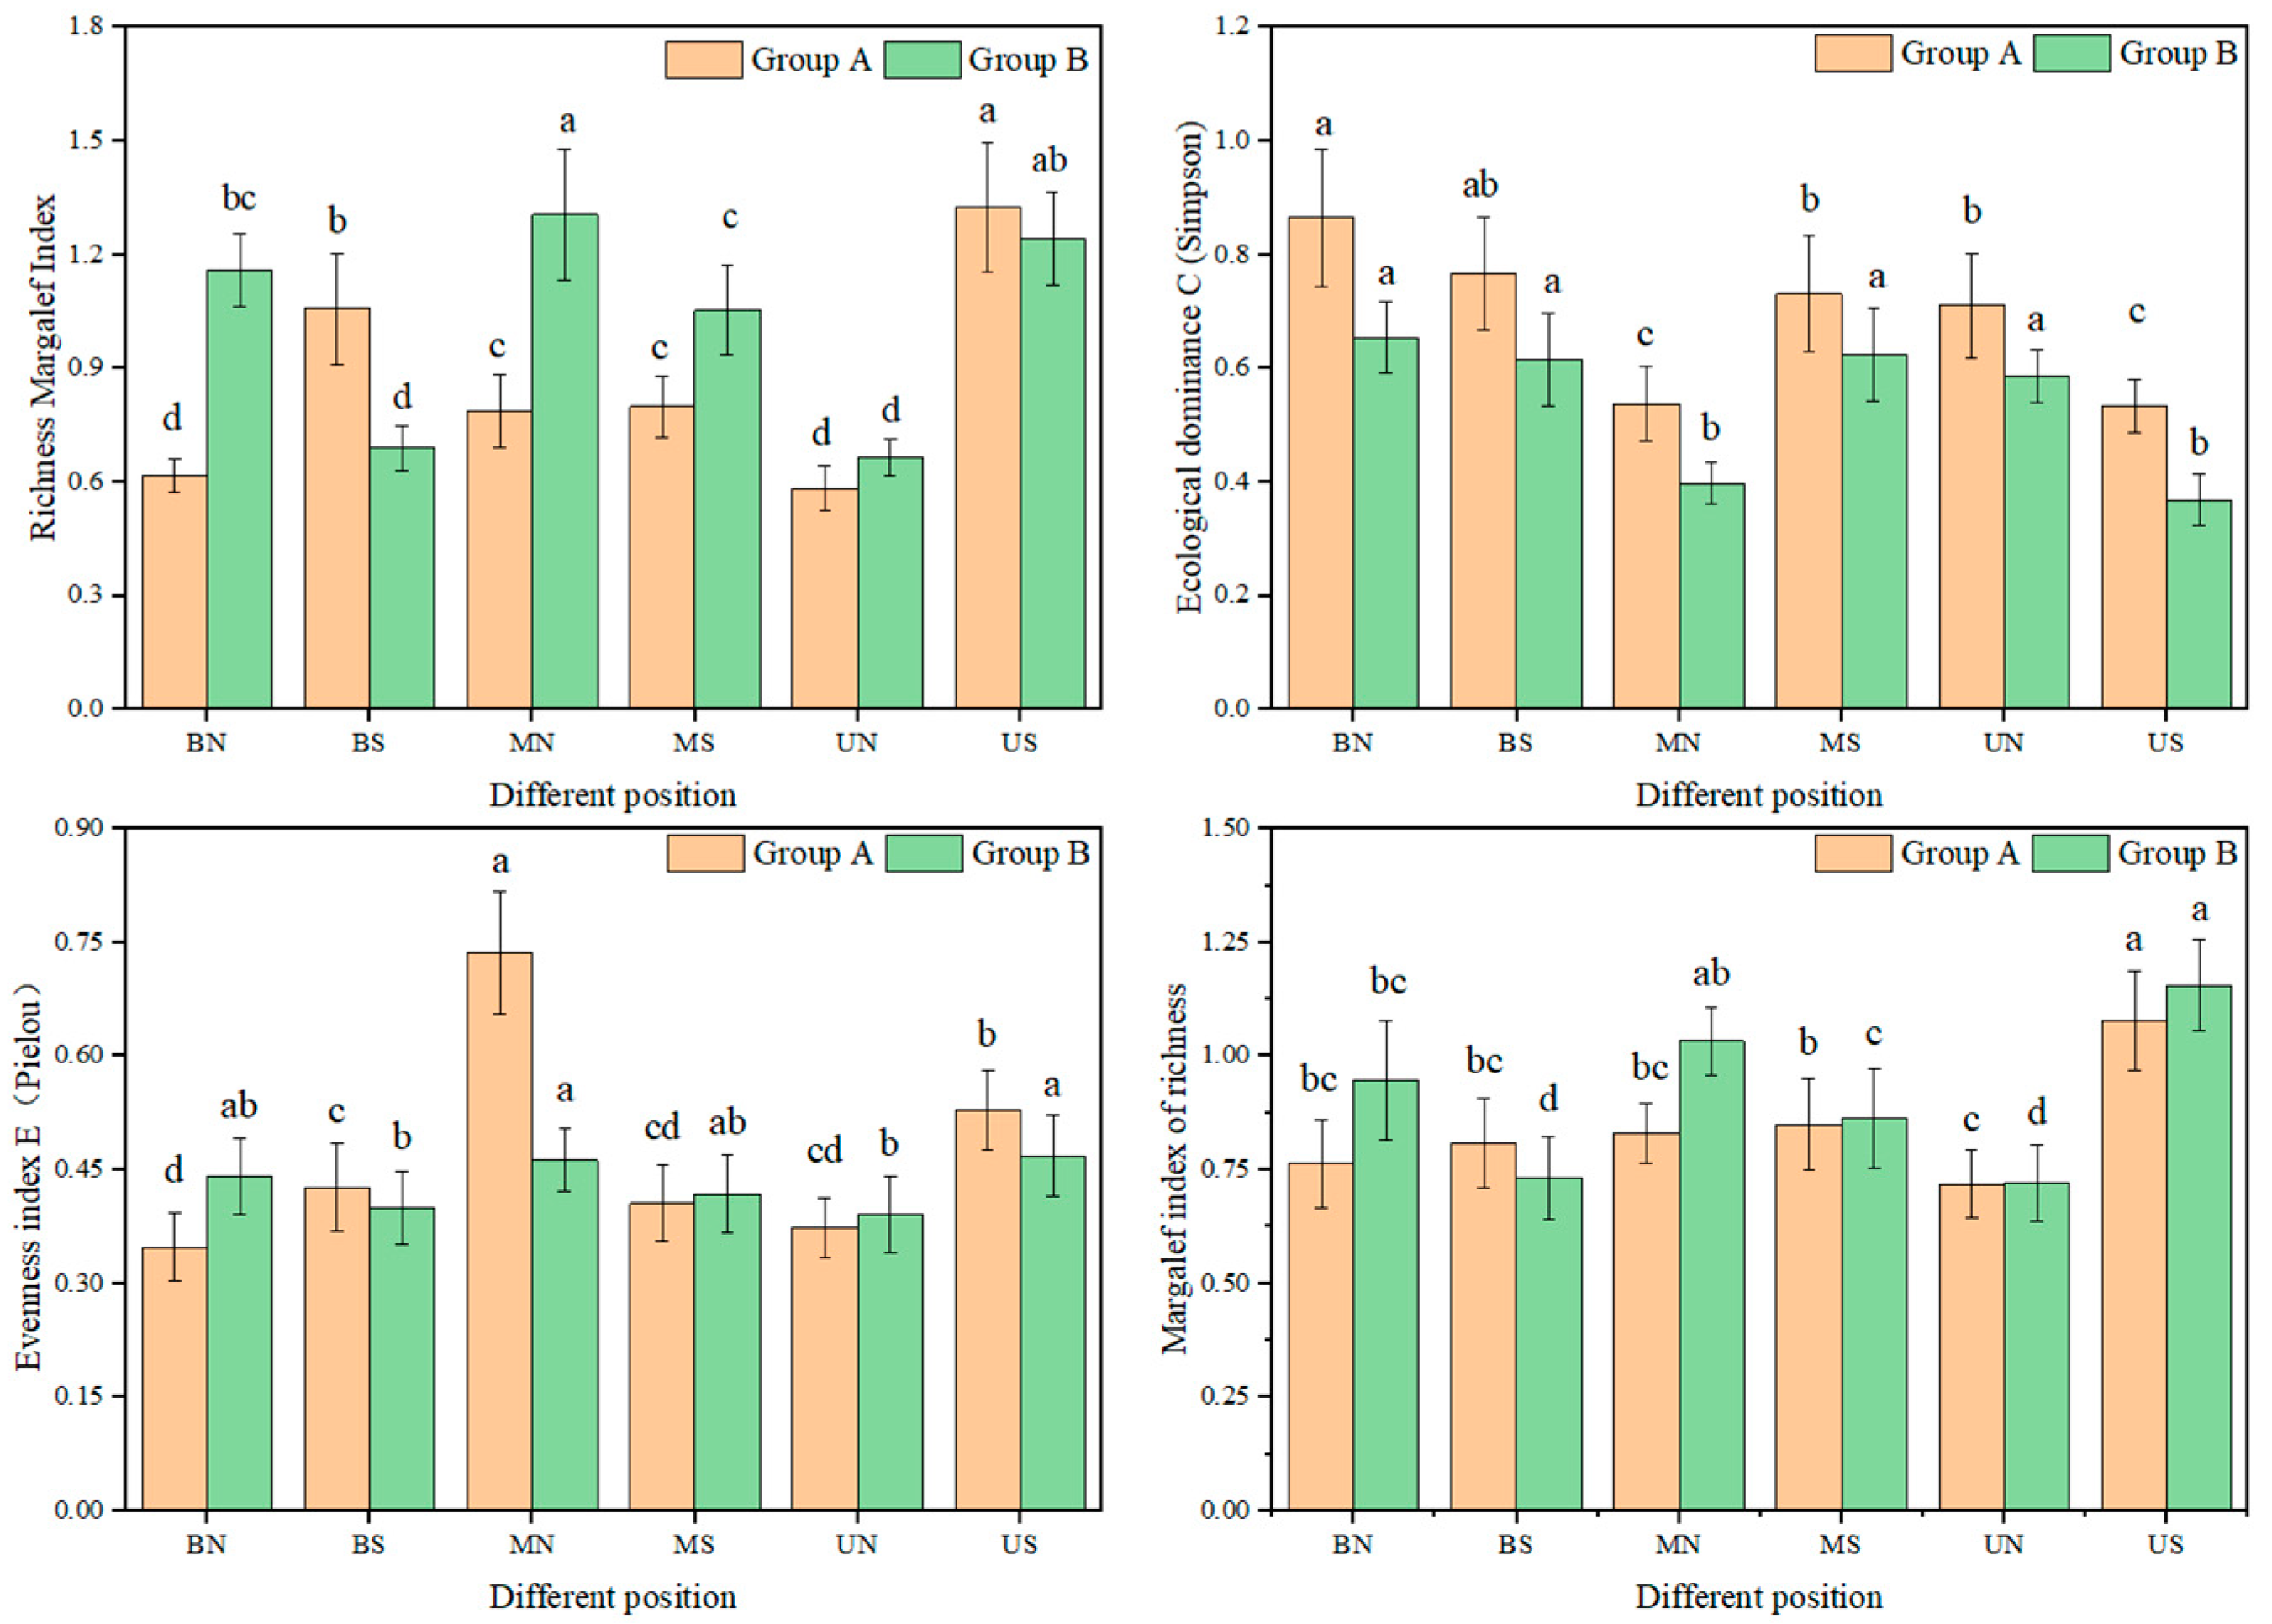
As can be observed in Figure 5, the species diversity exhibited distinct changes in different aspects and positions, with the same laws discovered on the indexes of species diversity, Margalef, and Pielou of the two sites: the upper position on the south slope was significantly higher than other slope positions with the middle on the north greater than other counterparts. The indexes of species diversity, Margalef, and Pielou showed upper slope position > lower slope position > middle slope position at the south slope of site 1 with middle slope position > upper slope position > lower slope position on the north. They surfaced upper slope position > middle slope position > lower slope position, with middle slope position > lower slope position > upper slope position on the north. The Simpson index saw the uniform law on the two site slopes: the lower slope position, the highest on the southern slope, swelled with the slope position climbing with lower slope position > upper slope position > middle slope position on the north.
3.3. Correlation Analysis of Plant Diversity and Soil Properties
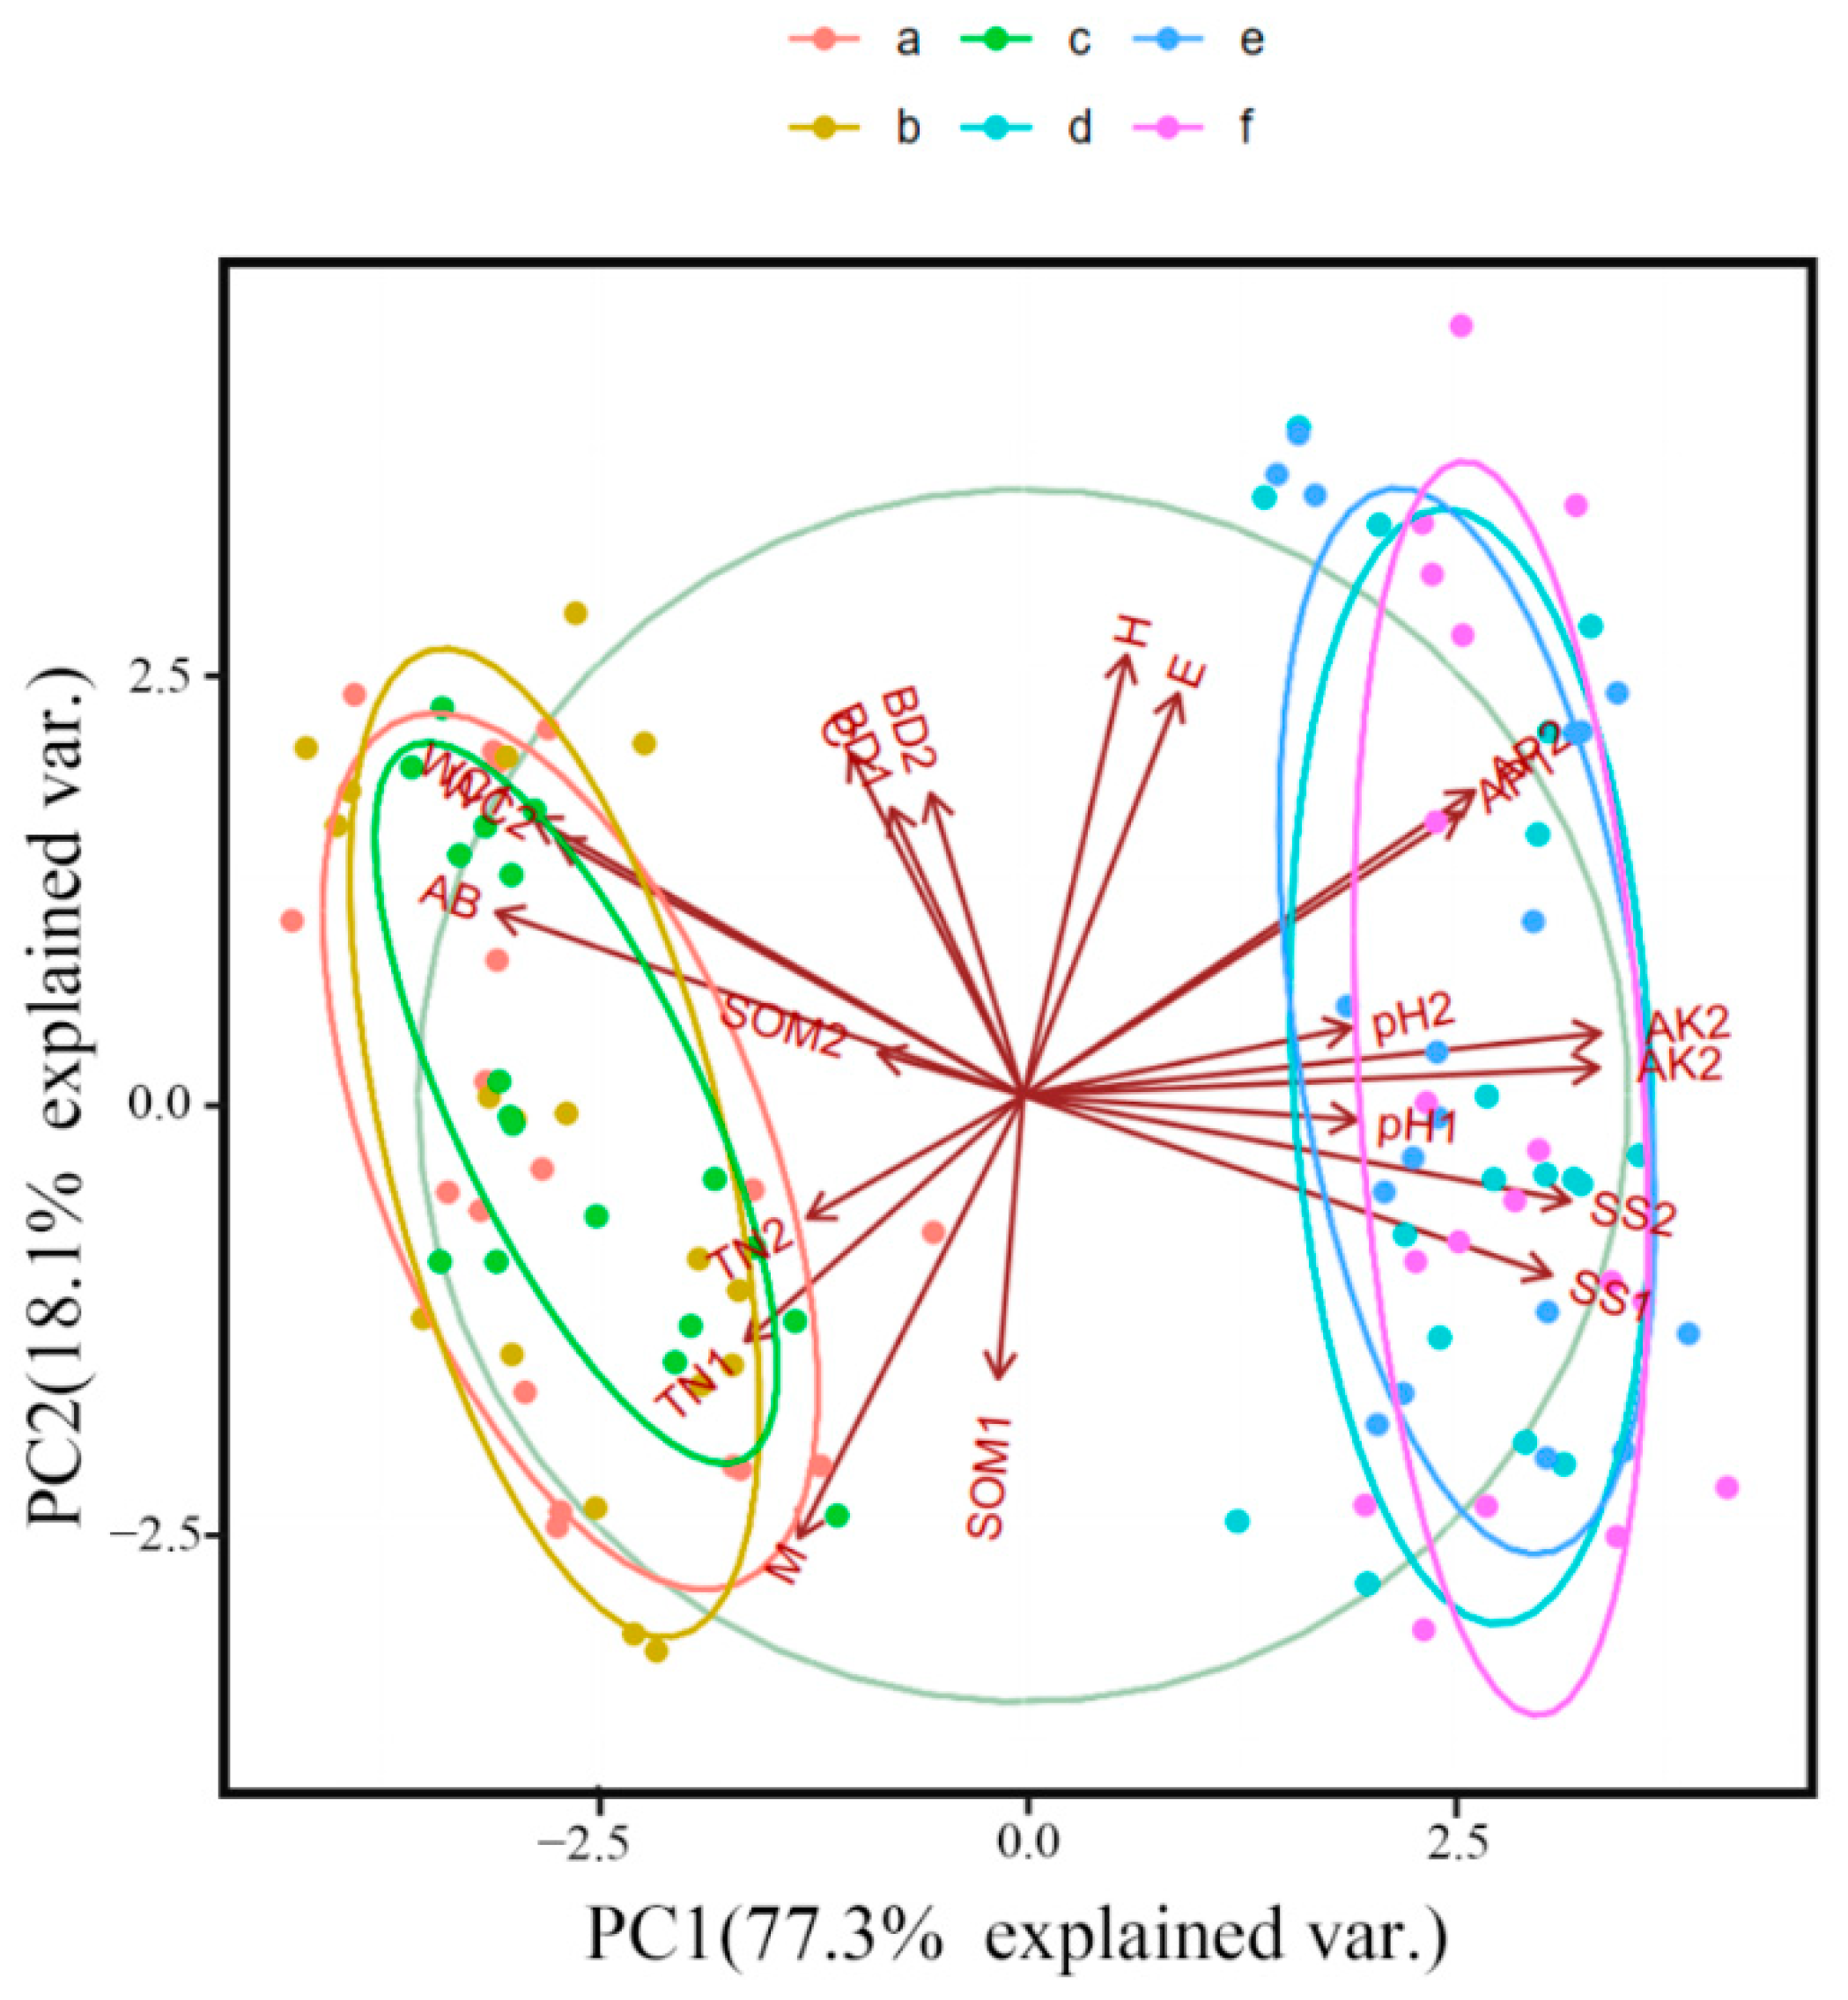
The accumulation and consumption of nutrients by plants on the slopes of coastal wetlands is a dynamic process. The close correlation between plant species diversity and soil properties indicates more than a simple and direct relationship. More importantly, species diversity could be affected through the integration of various soil characteristic factors, and therefore, both single- and multi-factor analyses are required for various influencing factors of soil. Principal component analysis (PCA) was performed on the 12 variables reflecting the soil characteristics of lateral ditches in the coastal wetland to determine the correlation between the variables and the aboveground vegetation biomass and diversity. The results are shown in Figure 5. The PC1 axis mainly reflected the soil chemical properties accounting for 37.3% of the overall change in the standard soil variables, with the PC2 axis mainly reflecting the soil physical properties, explaining 18.1% of the standard deviation. The cumulative variance contribution rate of the two was 55.4%, a primary mirror of the variation information of the soil characteristic factor system. Figure 6 presents a positive correlation between vegetation biomass and soil organic matter content, water content, and total nitrogen content, and a negative correlation between the former and soil salt content, pH, available phosphorus content, and available potassium content. The Shannon-Wiener index and Pielou index were positively correlated with soil bulk density and available phosphorus, with apparent negative correlation with soil organic matter content and total nitrogen content, while the Margalef index enjoyed visible positive correlation with soil organic matter content and total nitrogen content, with Simpson index buffeted hardest by soil bulk density and water content.
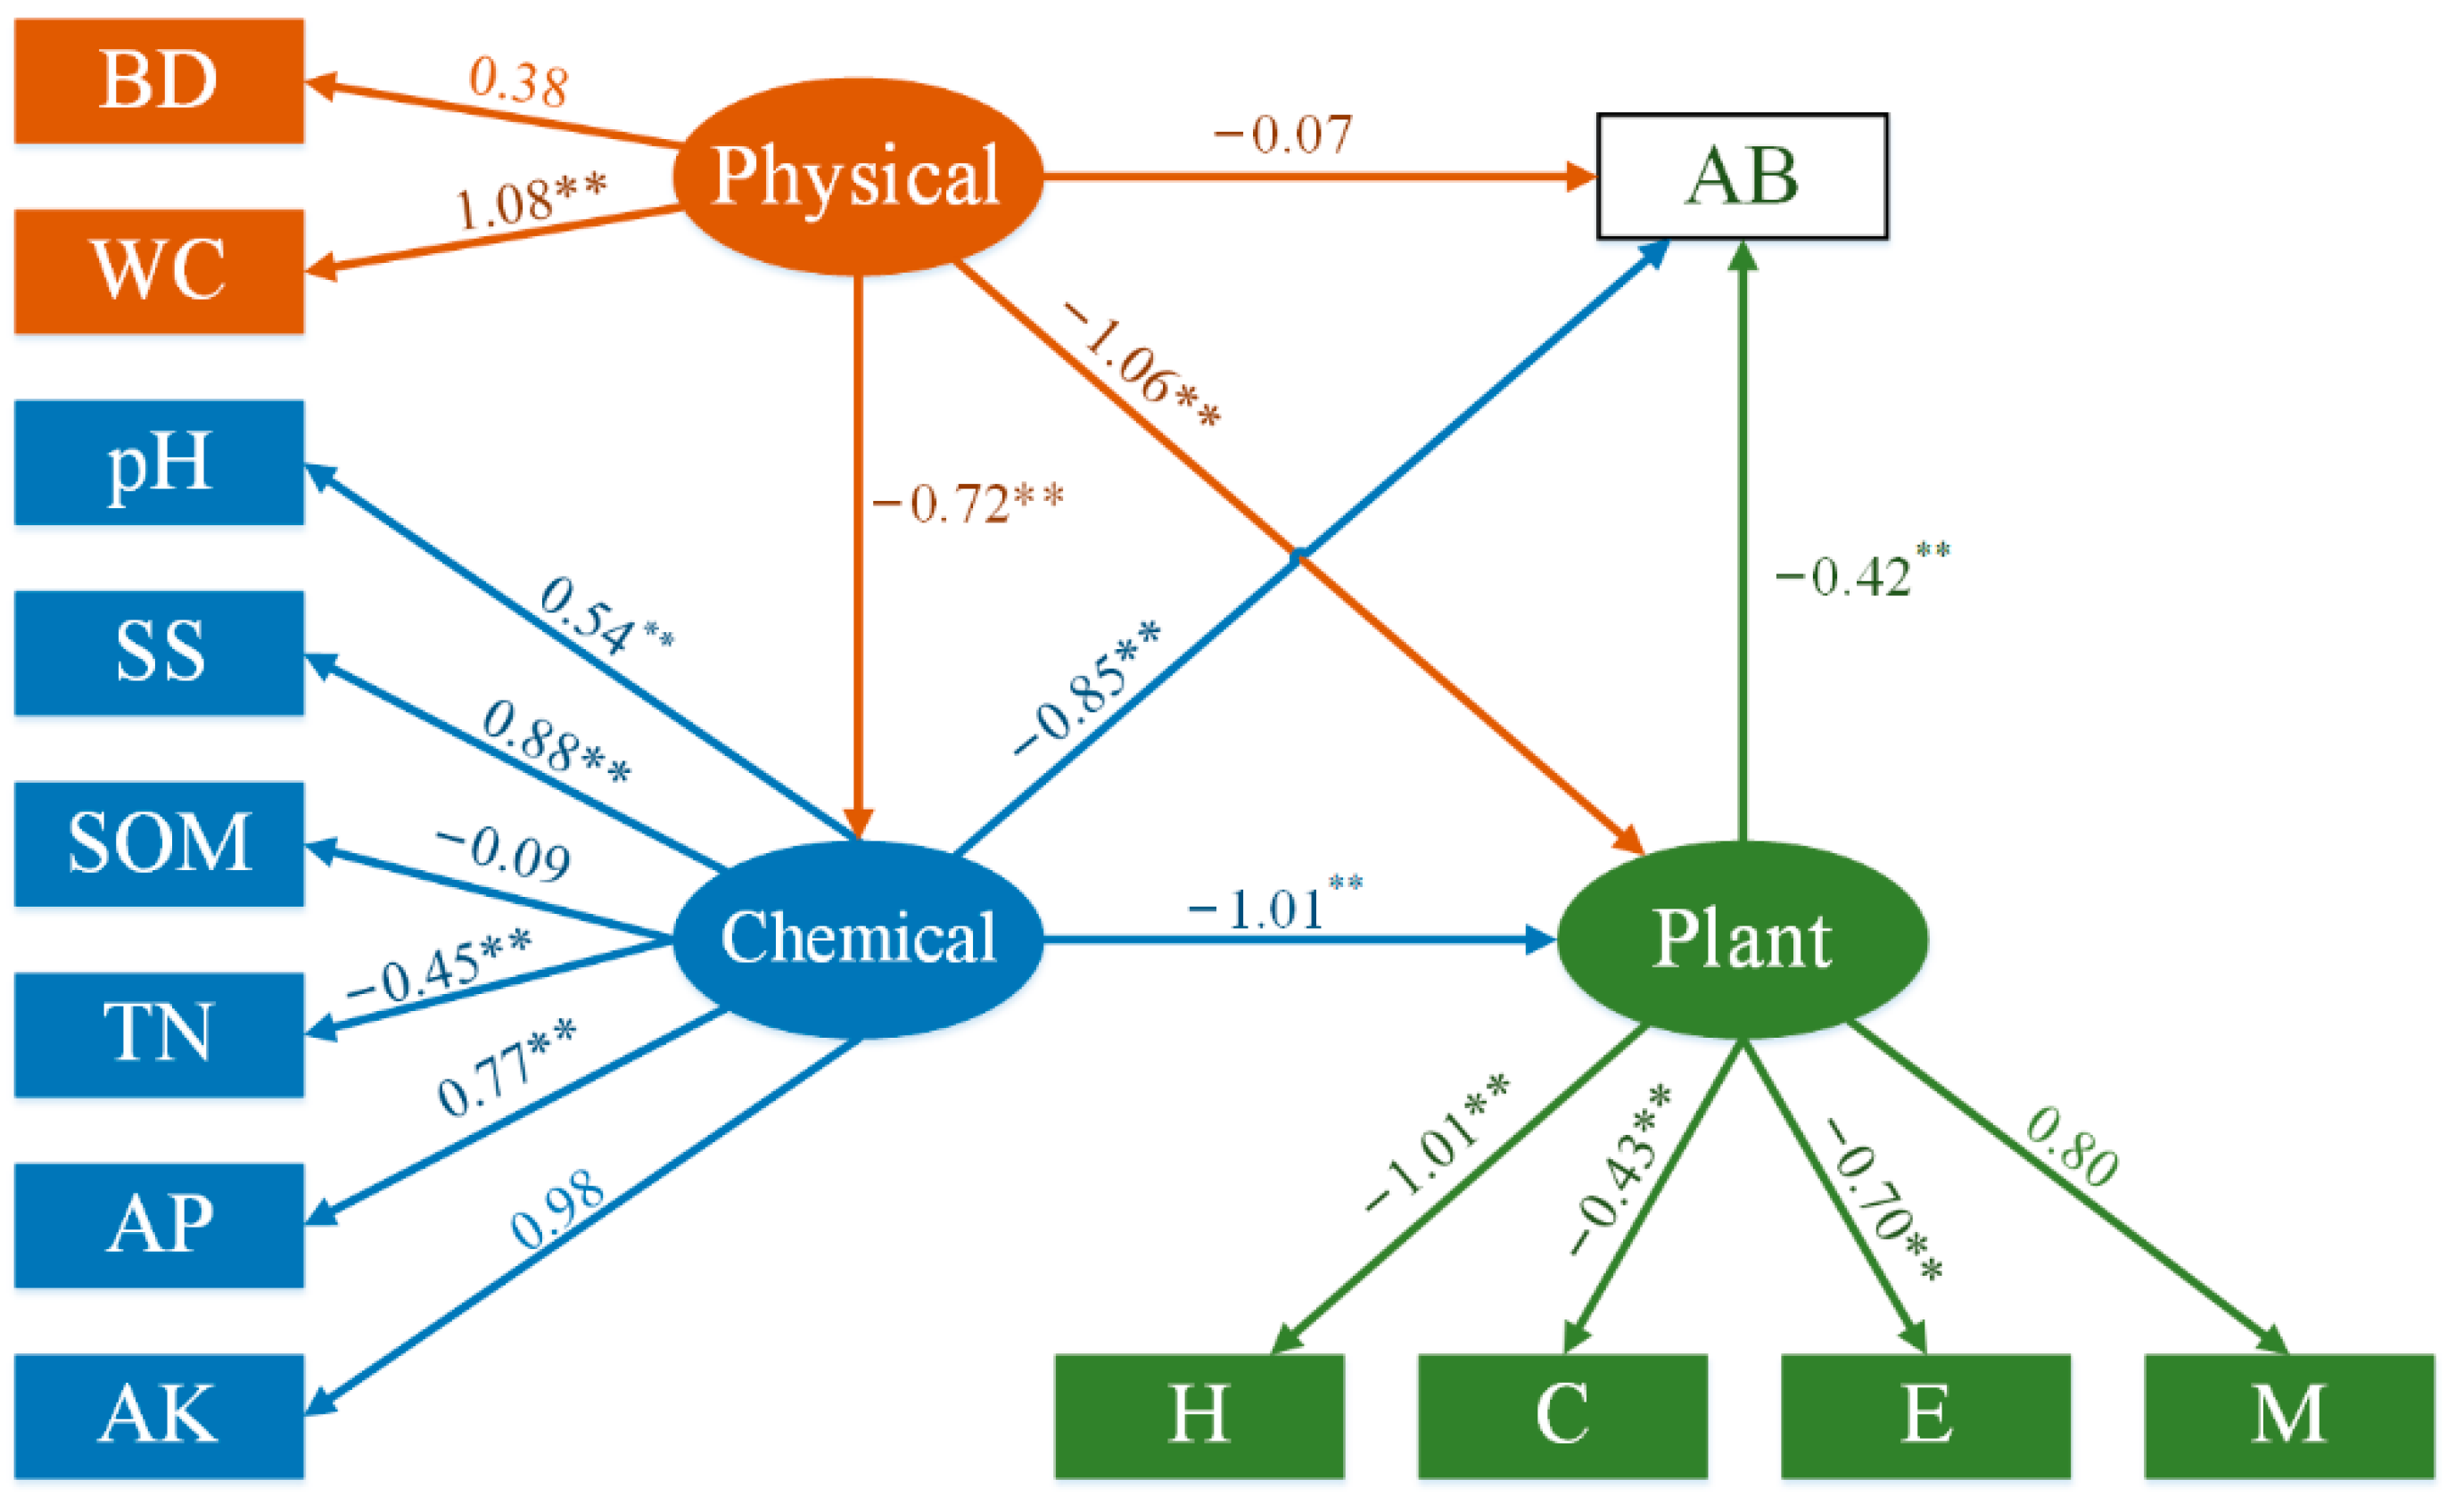
The structural equation model (SEM) is a technique suitable to evaluate the relations between variable networks that can be used as both predictive and response variables to study the direct and indirect effects of factor combination on variables. This paper adopted SEM in order to quantify the impact of physical and chemical soil properties on the diversity and aboveground biomass of the vegetation (Figure 7). The analysis results displayed a more significant impact of the latter than the former, whose influence on biomass was negligible, with a total effect of −0.85. Both physical and chemical soil properties exerted significant effects on vegetation diversity with the effects −1.06 and −1.01, respectively.
4. Discussion
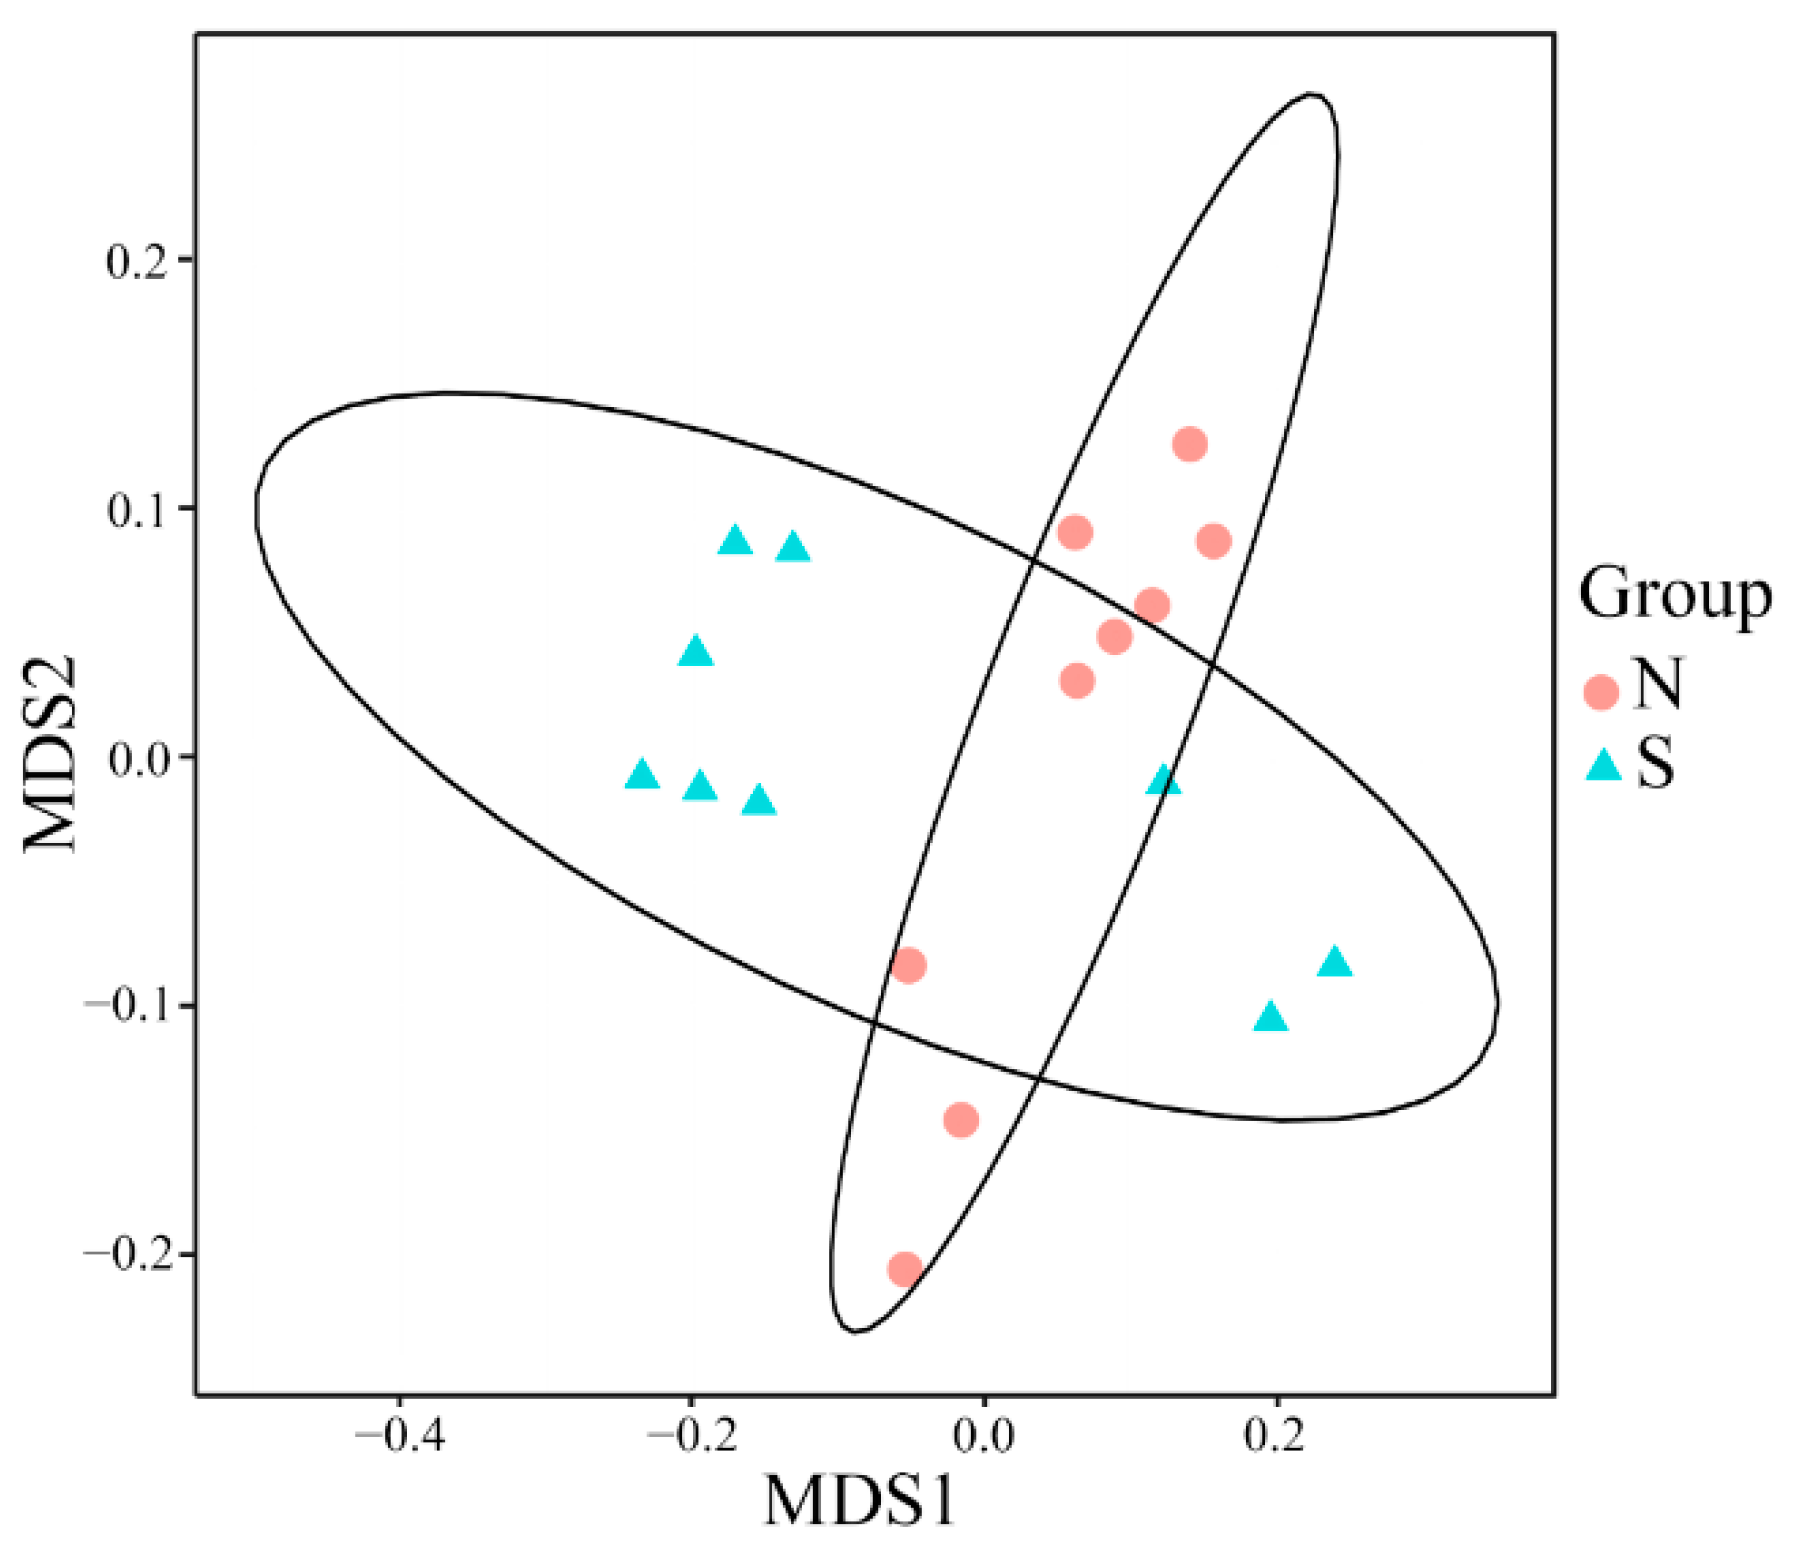
In coastal farmland drainage ditches, the diminutive reshaping of soil formation and vegetation growth by the slope aspect and position indicate the primary source of the spatial heterogeneity of soil and vegetation properties in the same altitude zone. Studies have revealed that aspect and position changes represented the ecological sequence of light, water, and nutrient conditions. This study signified that the lower slope with high vegetation coverage boasted higher soil water content and bulk density, as well as better water-holding and storage capacities. While the swelling slope position signals a poorer performance of the four indicators mentioned, with increased soil porosity and salt content. All these agreed with results obtained by Zhang [20], who studied the distribution characteristics of physical and chemical soil properties of desert riparian forests in the middle reaches of the Tarim River. In addition, the contents of soil organic matter, total nitrogen, available phosphorus, and potassium in the 0–20 cm soil layer, at different slope positions and aspects of the two sites, were all higher than those in the 20–40 cm counterparts. This could be explained by the fact that the more outstanding nutrient content was discharged from litter and irrigation water than the value absorbed by vegetation growth engendered nutrient enrichment in topsoil. In comparison, the 20–40 cm soil layer was less affected by the outside world, with a more minor change in nutrient content than the surface one. Slope aspect, as a pivotal topographical factor in ditches, can exert important effects on biodiversity, plant growth and development, productivity, and ecosystem functions by changing ecological factors, such as light, temperature, moisture, and soil [21]. The analysis of the nonmetric multidimensional scaling (NMDS) discovered significant distinctions in the soil physical and chemical properties on different slopes with a greater soil water content in the southern slope (shady slope) than that in the northern slope (sunny slope). This could be attributed to strong sunlight and high soil temperature, resulting in colossal evaporation accompanied by the moving up and surface concentration of salt, giving higher soil salt content from the northern slope than that in the southern counterpart. Maren [22] pointed out that the difference in soil temperature and soil moisture will also cause disparities in nutrient mineralization in various slope directions. Moreover, the fact that the northern slope boasted a remarkably higher bulk density than that of the southern agreed with the study results obtained by Schittko [23], the consequence of greater biomass, denser grassroots, and sparser soil in the southern slope. Analysis revealed lower soil water content of the farmland ditch slopes in site 2 compared with that of site 1, with the former assailed by more severe salinization, lower organic matter, and total nitrogen content, but supplied with more available nutrients. All these were possibly connected with the diversified irrigation volumes and modes in distinct areas.
The indexes of diversity, Pielou, and Margalef, in the different slope positions and aspects of the farmland ditch slopes in Dongying and Binzhou, witnessed significantly higher degrees in the upper and middle positions in comparison to the lower positions. Ricotta [24] indicated the close connection between species Margalef and Pielou and the diversity index, a statistic that combines the first two indexes, the diverse expression of the two-index combination. The vegetation Simpson index of the lower slope position in this study was significantly higher than that of the upper and middle slopes, in opposition to the other three indexes. That could be explained by the fact that the lower position was tormented by perennial flooding and laborious absorption of soil organic matter and other nutrients; therefore, the position was only suited for the emergent aquatic plants like reeds to form a single superior community [25]. In a community with obvious dominance where the dominant plant occupies more living conditions, other non-dominant species have little access to re-enter the community and be repulsed by them, with its species diversity reduced. The increased slope position of the ditch meant a gradual improved flooded environment, swelled soil aeration, and better mineralization of surface soil organic matter [26]. This possibly resulted in competition between individual plants and species for limited soil resources and affected the species composition of plant communities. At the same time, Harpole [27] also pointed out that in the absence of a dominant species, the number of species in the corresponding community could be increased, and so could its species diversity.
Through principal component analysis, it was determined that the soil water content of the coastal farmland ditch slopes exerted a significant positive effect on the vegetation aboveground biomass, which was in line with most research results on the relationship between vegetation biomass and soil [28]. Water represented a key factor in curbing plant growth, as declined soil moisture will severely limit vegetation growth with dropped plant height, leaf area, number of leaves, and other traits, clouding plant biomass accumulation [29]. Romina et al. [30] determined that slight differences in soil water content can also engender significant distinctions in seed germination and changes in vegetation biomass. In addition to water content, soil organic matter content and total nitrogen content are also positively correlated with aboveground biomass of vegetation, agreeing with the research results of Zhang [31]. It is generally believed that higher soil nutrients can promote vegetation growth with more litter produced by vegetation with high-ground biomass, along with soil organic matter and total nitrogen content. The negative correlation between Soil SS and pH, two factors curing aboveground biomass, is a result of high soil salinization in the coastal farmlands, with the plants being forced to become saline and alkali resistant. Furthermore, such a relation can also be applied to the connection between available phosphorus, available potassium, and the biomass previously mentioned. That is because excessive available nutrients fall heavily on plants; even moderate available phosphorus and available potassium can provide the necessary nutrients for vegetation growth.
Soil organic matter and total nitrogen, the leading nutrient indicators of the soil, directly affect soil fertility, water holding capacity, anti-erodibility, soil bulk density [22], and pH. The complex relationship between plants and soil nutrients is supported by the mixed research results of scholars in different regions [20]. Yang [32] et al. discovered a positive correlation between the species diversity index and organic matter and total nitrogen, after having studied the community diversity and soil nutrients of various vegetation types in the hilly region of Loess Plateau. Wang et al. [33] uncovered zero significance among organic matter, total phosphorus, and species diversity and plant quantitative features when studying the plant diversity and soil environmental factors in the Qinghai Lake area. Through principal component analysis, a negative correlation was found between organic matter, TN content, and the Shannon-Wiener index and Pielou index of vegetation with various negative correlations between the first two and the indexes of Margalef and dominance. This was in line with the research outcome of Al-Munqedhi [33]. The experimental results of Kejian [34] revealed raised soil nutrients indicated reduced species diversity. It is generally believed that the former leads to the rapid expansion of the dominant species population, with the growth of other plants being curbed, leaving simplistic community structures with decreased vegetation diversity, and improving the ecological dominance of dominant species. Lifted slope positions indicated ballooned plant community diversity; as the aquatic environment shifted to the wet, mesic, and xeric, so did the diversification and structure complexity of the plant community [35]. Alongside that, the substance decomposition rate and biological return rate of soil, fueled by promoted nutrient utilization, dwindled soil organic matter and total nitrogen content as the plant diversity enriched. This could help to explain the positive correlation between the ecological advantage of vegetation on the ditch slope and soil moisture.
In addition, through SEM analysis, it was revealed that changes in soil chemical properties cast more uncertainly on vegetation biomass than its physical counterparts. The soil chemical properties were the main limiting factor for the aboveground biomass of vegetation on the slopes of coastal ditches, as the properties disrupted biomass with indirect influence through confusing plant diversity on the aboveground biomass of vegetation, while the physical counterparts invisibly acted. Both soil physical and chemical properties can have a significant impact on vegetation diversity. In addition to directly affecting plant diversity, soil physical properties can also indirectly affect vegetation diversity by influencing soil chemical properties.
5. Conclusions
The analysis of the two sites shed light on the prominent spatial distinctions in the soil physical and chemical properties, vegetation biomass, and diversity of the slopes of the farmland drainage ditches in the Yellow River Delta on the diversified slope positions, aspects, and tops, with similar change patterns found in both sites.
(1) Soil nutrient content at the same slope and soil depth was higher on the north slope than on the south slope, and higher in the 0–20 cm soil layer than in the 20–40 cm soil layer, and the salt content also showed the same pattern. Soil water content was higher on the south slope than on the north slope and higher in the 20–40 cm soil layer than in the 0–20 cm soil layer at the same slope and soil depth.
(2) The vegetation biomass on the south slope of the same slope position of the ditch was higher than that on the north slope; on the south slope of the ditch, the biomass was highest on the upper slope; and on the north slope, the biomass was highest on the middle slope. The vegetation diversity, Margalef, and Pielou indices showed the same pattern on the north and south slopes; that is, the highest on the upper slope in the south slope and the highest on the middle slope in the north slope. The Simpson index of vegetation gradually increased with the increase in slope position.
(3) The physical and chemical properties of soil exert varying degrees of influence on the vegetation biomass and diversity of ditch slopes. Among them, soil water content, soil bulk density, organic matter content, and total nitrogen content have a positive influence on the aboveground biomass of vegetation, whose growth is impeded by soil pH and salinity content, and available potassium content. The Shannon-Wiener index and Pielou index of coastal ditch slope vegetation are positively correlated with soil BD and available phosphorus content, with a negative correlation with organic matter and total nitrogen content. The Simpson index is most affected by soil bulk density and water content.
Author Contributions
Conceptualization, Y.W. and W.C.; Data curation, S.W. and Y.Z.; Formal analysis, Y.W. and S.W.; Funding acquisition, W.C.; Investigation, B.J., X.N. and C.L.; Methodology, Y.W., S.W. and Z.W.; Project administration, Z.W. and W.C.; Resources, Z.W. and W.C.; Software, Y.Z.; Supervision, W.C.; Validation, Y.W., S.W. and B.J.; Visualization, Y.W. and S.W.; Writing—original draft, Y.W.; Writing—review and editing, S.W. All authors have read and agreed to the published version of the manuscript.
Funding
This thesis was supported by Key projects of National Natural Science Foundation of China and Shandong joint fund (Department of Science and Technology of Shandong Province, Ministry of Science and Technology of the People’s Republic of China) grant number U1906221; Major Scientific and Technological Innovation Project of Shandong Province (Department of Science and Technology of Shandong Province), grant number 2021CXGC010704; Open fund project of Key Laboratory of coastal zone geological environment protection of Shandong Bureau of Geology and mineral resources (Shandong Province Bureau of Geology and Mineral Resources), grant number SYS202102.
Institutional Review Board Statement
Not applicable.
Informed Consent Statement
Not applicable.
Data Availability Statement
All data generated or analyzed during this study are included in this article.
Conflicts of Interest
The authors declare no conflict of interest.
References
- Fu, Y.; Chen, S.; Ji, H.; Fan, Y.; Li, P. The modern Yellow River Delta in transition: Causes and implications. Mar. Geol. 2021, 436, 106476. [Google Scholar] [CrossRef]
- Wang, Y.; Liu, G.; Zhao, Z.; Wu, C.; Yu, B. Using soil erosion to locate nonpoint source pollution risks in coastal zones: A case study in the Yellow River Delta, China. Environ. Pollut. 2021, 283, 117117. [Google Scholar] [CrossRef] [PubMed]
- Herzon, I.; Helenius, J. Agricultural drainage ditches, their biological importance and functioning. Biol. Conserv. 2008, 141, 1171–1183. [Google Scholar] [CrossRef]
- Li, S.; Wu, M.; Jia, Z.; Luo, W.; Fei, L.; Li, J. Influence of different controlled drainage strategies on the water and salt environment of ditch wetland: A model-based study. Soil Tillage Res. 2020, 208, 104894. [Google Scholar] [CrossRef]
- Liu, B.; Zhao, W.; Liu, Z.; Yang, Y.; Luo, W.; Zhou, H.; Zhang, Y. Changes in species diversity, aboveground biomass, and vegetation cover along an afforestation successional gradient in a semiarid desert steppe of China. Ecol. Eng. 2015, 81, 301–311. [Google Scholar] [CrossRef]
- Chun, J.-H.; Ali, A.; Lee, C.-B. Topography and forest diversity facets regulate overstory and understory aboveground biomass in a temperate forest of South Korea. Sci. Total Environ. 2020, 744, 140783. [Google Scholar] [CrossRef]
- Bhat, J.A.; Kumar, M.; Negi, A.; Todaria, N.; Malik, Z.A.; Pala, N.A.; Kumar, A.; Shukla, G. Altitudinal gradient of Species diversity and community of woody vegetation along altitudinal gradient of the Western Himalayas. Glob. Ecol. Conserv. 2020, 24, e01302. [Google Scholar] [CrossRef]
- Liu, M.; Zhang, G.; Yin, F.; Wang, S.; Li, L. Relationship between biodiversity and ecosystem multifunctionality along the elevation gradient in alpine meadows on the eastern Qinghai-Tibetan plateau. Ecol. Indic. 2022, 141, 109097. [Google Scholar] [CrossRef]
- Yang, Y.; Dou, Y.; An, S.; Zhu, Z. Abiotic and biotic factors modulate plant biomass and root/shoot (R/S) ratios in grassland on the Loess Plateau, China. Sci. Total Environ. 2018, 636, 621–631. [Google Scholar] [CrossRef]
- Sewerniak, P.; Puchałka, R. Topographically induced variation of microclimatic and soil conditions drives ground vegetation diversity in managed Scots pine stands on inland dunes. Agric. For. Meteorol. 2020, 291, 108054. [Google Scholar] [CrossRef]
- Hou, X.-Y.; Liu, S.-L.; Cheng, F.-Y.; Su, X.-K.; Dong, S.-K.; Zhao, S.; Liu, G.-H. Variability of environmental factors and the effects on vegetation diversity with different restoration years in a large open-pit phosphorite mine. Ecol. Eng. 2018, 127, 245–253. [Google Scholar] [CrossRef]
- Teixeira, H.M.; Cardoso, I.M.; Bianchi, F.J.; Silva, A.D.C.; Jamme, D.; Peña-Claros, M. Linking vegetation and soil functions during secondary forest succession in the Atlantic forest. For. Ecol. Manag. 2019, 457, 117696. [Google Scholar] [CrossRef]
- Al-Robai, S.A.; Mohamed, H.A.; Ahmed, A.A.; Al-Khulaidi, A.W.A. Effects of elevation gradients and soil components on the vegetation density and species diversity of Alabna escarpment, southwestern Saudi Arabia. Acta Ecol. Sin. 2018, 39, 202–211. [Google Scholar] [CrossRef]
- Li, Y.; Dong, S.; Liu, S.; Su, X.; Wang, X.; Zhang, Y.; Zhao, Z.; Gao, X.; Li, S.; Tang, L. Relationships between plant diversity and biomass production of alpine grasslands are dependent on the spatial scale and the dimension of biodiversity. Ecol. Eng. 2018, 127, 375–382. [Google Scholar] [CrossRef]
- Ali, A.; Yan, E.-R. The forest strata-dependent relationship between biodiversity and aboveground biomass within a subtropical forest. For. Ecol. Manag. 2017, 401, 125–134. [Google Scholar] [CrossRef]
- Kuenzer, C.; Ottinger, M.; Liu, G.; Sun, B.; Baumhauer, R.; Dech, S. Earth observation-based coastal zone monitoring of the Yellow River Delta: Dynamics in China’s second largest oil producing region over four decades. Appl. Geogr. 2014, 55, 92–107. [Google Scholar] [CrossRef]
- Jiao, S.; Zhang, M.; Wang, Y.; Liu, J.; Li, Y. Variation of soil nutrients and particle size under different vegetation types in the Yellow River Delta. Acta Ecol. Sin. 2014, 34, 148–153. [Google Scholar] [CrossRef]
- Zhang, L.; Song, L.; Zhang, L.; Shao, H.; Chen, X.; Yan, K. Seasonal dynamics in nitrous oxide emissions under different types of vegetation in saline-alkaline soils of the Yellow River Delta, China and implications for eco-restoring coastal wetland. Ecol. Eng. 2013, 61, 82–89. [Google Scholar] [CrossRef]
- Elith, J.; Graham, C.H.; Anderson, R.P.; Dudík, M.; Ferrier, S.; Guisan, A.; Hijmans, R.J.; Huettmann, F.; Leathwick, J.R.; Lehmann, A.; et al. Novel Methods Improve Prediction of Species’ Distributions from Occurrence Data. Ecography 2006, 129–151. [Google Scholar] [CrossRef] [Green Version]
- Zhang, H.; Liang, J.; Zhou, Z.; Lv, R. Relationship between Distribution Characteristics of Soil Physicochemical Properties and Vegetation in Desert Riparian Forest in the Middle Reaches of the Tarim River. Res. Soil Water Conserv. 2016, 23, 6–12. [Google Scholar]
- Sherman, R.; Mullen, R.; Haomin, L.; Zhendong, F.; Yi, W. Spatial patterns of plant diversity and communities in Alpine ecosystems of the Hengduan Mountains, northwest Yunnan, China. J. Plant. Ecol. 2008, 1, 117–136. [Google Scholar] [CrossRef]
- Måren, I.E.; Karki, S.; Prajapati, C.; Yadav, R.K.; Shrestha, B.B. Facing north or south: Does slope aspect impact forest stand characteristics and soil properties in a semiarid trans-Himalayan valley? J. Arid Environ. 2015, 121, 112–123. [Google Scholar] [CrossRef] [Green Version]
- Schittko, C.; Onandia, G.; Bernard-Verdier, M.; Heger, T.; Jeschke, J.M.; Kowarik, I.; Maaß, S.; Joshi, J. Biodiversity maintains soil multifunctionality and soil organic carbon in novel urban ecosystems. J. Ecol. 2022, 110, 916–934. [Google Scholar] [CrossRef]
- Ricotta, C.; Szeidl, L.; Pavoine, S. Towards a unifying framework for diversity and dissimilarity coefficients. Ecol. Indic. 2021, 129, 107971. [Google Scholar] [CrossRef]
- Le Bagousse-Pinguet, Y.; Soliveres, S.; Gross, N.; Torices, R.; Berdugo, M.; Maestre, F.T. Phylogenetic, functional, and taxonomic richness have both positive and negative effects on ecosystem multifunctionality. Proc. Natl. Acad. Sci. 2019, 116, 8419–8424. [Google Scholar] [CrossRef] [Green Version]
- Biswas, S.R.; Mallik, A.U.; Braithwaite, N.T.; Biswas, P.L. Effects of disturbance type and microhabitat on species and functional diversity relationship in stream-bank plant communities. For. Ecol. Manag. 2018, 432, 812–822. [Google Scholar] [CrossRef]
- Harpole, W.S.; Tilman, D. Grassland species loss resulting from reduced niche dimension. Nature 2007, 446, 791–793. [Google Scholar] [CrossRef]
- Zheng, X.; Zhao, J.; Zhang, Y.; Wu, Y.; Jin, T.; Liu, G. Variation of Grassland Biomass and Its Relationships with Environmental Factors in Hulunbeier, Inner Mongolia. J. Ecol 2007, 04, 533–538. [Google Scholar]
- Yuan, Z.-Q.; Fang, C.; Zhang, R.; Li, F.-M.; Javaid, M.M.; Janssens, I.A. Topographic influences on soil properties and aboveground biomass in lucerne-rich vegetation in a semi-arid environment. Geoderma 2019, 344, 137–143. [Google Scholar] [CrossRef]
- Principe, R.E. Ecological effects of small dams on benthic macroinvertebrate communities of mountain streams (Córdoba, Argentina). Ann. de Limnol Int. J. Limnol. 2010, 46, 77–91. [Google Scholar] [CrossRef] [Green Version]
- Zang, M.; Liu, W.; Zhu, M.; Qin, Y.; Li, R. Responses of Soil Properties and Vegetation Biomass to Slope Aspect and Position in Forest-Steppe Zone of the Qilian Mountains. Glacier Frozen Soil 2021, 43, 233–241. [Google Scholar]
- Yang, L.; Chen, S.; An, J.; Zhao, F.; Han, X.; Feng, Y.; Yang, G.; Ren, G. Relationships among Community Diversity and Soil Organic Matter, Total Nitrogen under Different Vegetation Types in the Gully Region of Loess Region. Acta Agrestia Sin. 2014, 22, 291–298. [Google Scholar]
- Wang, S.; Chen, G.; Bai, Y.; Zhou, G.; Sun, J. Interrelation between plant species diversity and soil environmental factors in bird island of Qinghai Lake. Ying Yong Sheng Tai Xue Bao. 2005, 16, 186–188. [Google Scholar] [PubMed]
- He, K.; Huang, Y.; Qi, Y.; Sheng, Z.; Chen, H. Effects of nitrogen addition on vegetation and soil and its linkages to plant diversity and productivity in a semi-arid steppe. Sci. Total Environ. 2021, 778, 146299. [Google Scholar] [CrossRef]
- Al-Gifri, A.N.; Kasem, W.T.; Shalabi, L.F. Vegetation Structure and Diversity of Wadi Wasaa, Jazan, Saudi Arabia. J. Adv. Biol. Biotechnol. 2018, 18, 1–16. [Google Scholar] [CrossRef]
Figure 1.
Sampling location and climate in 2020. Note: (A) is the location of the two sampling sites; (B) is the monthly average precipitation and temperature of sampling site 1 in 2020; (C) is the monthly average precipitation and temperature of sampling site 2 in 2020.
Figure 1.
Sampling location and climate in 2020. Note: (A) is the location of the two sampling sites; (B) is the monthly average precipitation and temperature of sampling site 1 in 2020; (C) is the monthly average precipitation and temperature of sampling site 2 in 2020.

Figure 2.
Schematic diagram of ditch section and slope sampling location. Note: (A) is the distribution of sampling points on the slope, (B) is the profile of the trench.
Figure 2.
Schematic diagram of ditch section and slope sampling location. Note: (A) is the distribution of sampling points on the slope, (B) is the profile of the trench.

Figure 3.
NMDS ranking of soil indicators. Note: N is the north slope of the ditch, S is the south slope of the ditch. The blue triangles and red squares represent the differences in soil physicochemical properties between the south and north slopes in the nine sampling sites (in this study, nine ditches were selected for sampling in two sampling sites).

Figure 4.
Spatial distribution of biomass on the ground of vegetation on ditch slope. Note: The four lines on the left of each graph are the maximum, upper quartile, median, lower quartile, and minimum values from top to bottom, with the circle being the mean, and the values of the nine sampling points on the right. BN—lower position of the north slope, BS—the lower position of the south slope, MN—the middle position of the north slope, MS—middle position of the south slope, UN—upper position of the north slope, US—lower position of the south slope. Group A is Dongying, northeastern Shandong Province, China; Group B is Binzhou, northern Shandong Province, China.

Figure 5.
Spatial distribution characteristics of vegetation diversity on ditch slope. Note: BN—lower position of the north slope, BS—the lower position of the south slope, MN—the middle position of the north slope, MS—middle position of the south slope, UN—upper position of the north slope, US—lower position of the south slope. Group A is Dongying, northeastern Shandong Province, China; Group B is Binzhou, northern Shandong Province, China. Same lowercase letter indicates no significant difference between soil factors with different slope direction and slope position (p < 0.05).

Figure 6.
Principal component analysis. Note: a—South Slope direction, Upper Slope position; b—South Slope direction, Middle Slope position; c—South Slope direction, Bottom Slope position; d—North Slope direction, Upper Slope position; e—North Slope direction, Middle Slope position; f—North Slope direction, Bottom Slope position; 1 denotes 0–20 cm soil layer, 2 denotes 20–40 cm soil layer; SS—soil salt; WC—water content; BD—bulk density; SOM—soil organic matter; TN—total nitrogen; AP—available phosphorus; AK—available potassium; H—Shannon-Wiener index; E—Pielou index; M—Margalef index; C—Simpson index.

Figure 7.
The structural equation model (SEM) of biomass, soil physical properties, chemical properties, and plant biomass and diversity. Note: SS—soil salt content; WC—water content; BD—bulk density; SOM—soil organic matter content; TN—total nitrogen content; AP—available phosphorus content; AK—available potassium content; AB-aboveground biomass; H—Shannon-Wiener index; E—Pielou index; M—Margalef index; C—Simpson index; ** represents a significant correlation at p < 0.01.


Table 1.
Spatial distribution characteristics of soil physical and chemical properties.
| Sampling Point | Slope Direction | Slope Position | Soil Depth cm | Bulk Density g/cm3 | pH | Total Salt Content g/kg | Water Content % | Soil Organic Matter Content g/kg | Total Nitrogen Content g/kg | Available Phosphorus Content mg/kg | Available Potassium Content mg/kg |
|---|---|---|---|---|---|---|---|---|---|---|---|
| Sampling point 1 | North | Upper | 0–20 | 1.50 ± 0.03 b | 8.17 ± 0.11 bc | 4.03 ± 0.42 a | 17.97 ± 2.42 c | 7.09 ± 0.88 a | 0.57 ± 0.08 a | 4.29 ± 0.38 a | 185.67 ± 19.45 a |
| 20–40 | 1.52 ± 0.05 ab | 8.11 ± 0.10 c | 3.12 ± 0.43 b | 22.71 ± 3.08 b | 4.61 ± 0.64 b | 0.35 ± 0.04 b | 2.58 ± 0.25 c | 99.67 ± 9.24 cd | |||
| Middle | 0–20 | 1.51 ± 0.05 ab | 8.13 ± 0.11 bc | 2.71 ± 0.36 bc | 23.87 ± 2.36 b | 6.41 ± 0.68 a | 0.55 ± 0.07 a | 4.09 ± 0.49 a | 138.33 ± 18.47 b | ||
| 20–40 | 1.53 ± 0.04 ab | 8.21 ± 0.08 abc | 2.38 ± 0.33 cd | 26.28 ± 3.00 b | 4.56 ± 0.55 b | 0.34 ± 0.03 b | 2.74 ± 0.26 c | 83.78 ± 2.82 d | |||
| Bottom | 0–20 | 1.54 ± 0.05 ab | 8.29 ± 0.17 ab | 2.25 ± 0.27 d | 30.74 ± 3.03 a | 6.33 ± 0.73 a | 0.52 ± 0.05 a | 3.23 ± 0.32 b | 110.78 ± 9.48 c | ||
| 20–40 | 1.56 ± 0.03 a | 8.35 ± 0.19 a | 1.95 ± 0.25 d | 30.95 ± 2.91 a | 3.96 ± 0.47 b | 0.29 ± 0.04 b | 2.81 ± 0.33 bc | 65.33 ± 6.94 e | |||
| South | Upper | 0–20 | 1.46 ± 0.03 b | 8.15 ± 0.17 b | 4.14 ± 0.34 a | 21.60 ± 2.55 c | 4.57 ± 0.63 b | 0.45 ± 0.06 b | 4.29 ± 0.42 b | 139.56 ± 16.99 a | |
| 20–40 | 1.48 ± 0.03 ab | 8.14 ± 0.14 b | 3.97 ± 0.47 a | 22.60 ± 2.22 c | 4.41 ± 0.57 b | 0.29 ± 0.03 c | 1.79 ± 0.21 d | 88.44 ± 8.18 c | |||
| Middle | 0–20 | 1.47 ± 0.03 b | 8.28 ± 0.13 ab | 2.72 ± 0.38 b | 26.95 ± 2.45 b | 5.58 ± 1.10 b | 0.49 ± 0.06 b | 2.81 ± 0.30 c | 135.44 ± 12.72 a | ||
| 20–40 | 1.50 ± 0.03 ab | 8.26 ± 0.13 ab | 2.10 ± 0.25 c | 27.38 ± 3.81 b | 4.51 ± 0.44 b | 0.35 ± 0.03 c | 1.85 ± 0.21 d | 94.11 ± 11.60 c | |||
| Bottom | 0–20 | 1.49 ± 0.04 ab | 8.34 ± 0.09 a | 2.16 ± 0.28 c | 30.48 ± 2.59 ab | 7.20 ± 0.86 a | 0.60 ± 0.08 a | 6.36 ± 0.59 a | 120.11 ± 8.69 b | ||
| 20–40 | 1.52 ± 0.03 a | 8.37 ± 0.11 a | 2.08 ± 0.26 c | 32.36 ± 3.29 a | 5.30 ± 0.65 b | 0.31 ± 0.03 c | 2.89 ± 0.32 c | 81.44 ± 7.57 c | |||
| Sampling point 2 | North | Upper | 0–20 | 1.50 ± 0.06 a | 8.65 ± 0.40 a | 5.64 ± 0.57 a | 9.89 ± 1.30 d | 6.88 ± 0.78 a | 0.54 ± 0.06 a | 8.41 ± 1.16 b | 599.33 ± 58.88 a |
| 20–40 | 1.52 ± 0.03 a | 8.54 ± 0.24 a | 5.44 ± 0.44 ab | 15.51 ± 1.74 c | 5.10 ± 0.48 b | 0.31 ± 0.04 c | 3.75 ± 0.51 e | 517.00 ± 51.67 bc | |||
| Middle | 0–20 | 1.49 ± 0.02 a | 8.51 ± 0.17 a | 5.73 ± 0.52 a | 16.81 ± 2.21 c | 4.89 ± 0.46 b | 0.34 ± 0.04 c | 9.45 ± 1.03 a | 470.78 ± 63.89 c | ||
| 20–40 | 1.53 ± 0.06 a | 8.56 ± 0.20 a | 4.85 ± 0.30 bc | 19.81 ± 2.34 bc | 2.18 ± 0.29 b | 0.31 ± 0.03 c | 4.78 ± 0.47 d | 380.89 ± 41.05 d | |||
| Bottom | 0–20 | 1.52 ± 0.03 a | 8.55 ± 0.32 a | 5.79 ± 0.44 a | 17.26 ± 2.37 b | 5.07 ± 0.51 b | 0.40 ± 0.05 b | 8.40 ± 0.27 b | 594.78 ± 63.36 a | ||
| 20–40 | 1.54 ± 0.02 a | 8.53 ± 0.22 a | 4.60 ± 0.57 d | 23.38 ± 1.91 a | 4.88 ± 0.51 c | 0.31 ± 0.04 c | 6.62 ± 0.64 c | 557.78 ± 67.88 ab | |||
| South | Upper | 0–20 | 1.40 ± 0.05 d | 8.75 ± 0.50 a | 5.75 ± 0.77 a | 9.76 ± 1.09 d | 6.75 ± 0.61 b | 0.45 ± 0.05 b | 6.36 ± 0.50 b | 491.33 ± 34.79 ab | |
| 20–40 | 1.45 ± 0.06 cd | 8.64 ± 0.35 a | 5.02 ± 0.63 b | 13.49 ± 1.36 cd | 4.66 ± 0.43 c | 0.29 ± 0.03 c | 4.39 ± 0.42 c | 479.50 ± 51.30 abc | |||
| Middle | 0–20 | 1.46 ± 0.05 c | 8.55 ± 0.36 a | 5.72 ± 0.54 a | 12.07 ± 1.62 c | 9.12 ± 1.07 a | 0.54 ± 0.06 a | 4.45 ± 0.33 c | 520.89 ± 58.34 a | ||
| 20–40 | 1.49 ± 0.03 bc | 8.55 ± 0.36 a | 4.52 ± 0.15 bc | 18.30 ± 1.78 b | 3.13 ± 0.39 d | 0.25 ± 0.03 c | 3.66 ± 0.34 c | 459.44 ± 39.15 bc | |||
| Bottom | 0–20 | 1.53 ± 0.03 ab | 8.35 ± 0.36 a | 3.65 ± 0.49 d | 22.59 ± 2.70 a | 3.76 ± 0.53 d | 0.26 ± 0.03 c | 9.69 ± 1.26 a | 440.00 ± 41.15 bc | ||
| 20–40 | 1.55 ± 0.03 a | 8.45 ± 0.40 a | 3.97 ± 0.27 cd | 22.73 ± 2.64 a | 3.56 ± 0.47 d | 0.25 ± 0.03 c | 5.78 ± 0.70 b | 431.00 ± 52.93 c |
Note: Data in the table are mean ± standard deviation, and same lowercase letter indicates no significant difference between soil factors with different slope direction, slope position, and soil depth (p < 0.05).
Publisher’s Note: MDPI stays neutral with regard to jurisdictional claims in published maps and institutional affiliations. |
© 2022 by the authors. Licensee MDPI, Basel, Switzerland. This article is an open access article distributed under the terms and conditions of the Creative Commons Attribution (CC BY) license (https://creativecommons.org/licenses/by/4.0/).
Share and Cite
MDPI and ACS Style
Wang, Y.; Wang, S.; Jiang, B.; Zhu, Y.; Niu, X.; Li, C.; Wu, Z.; Chen, W. Regulation of Abiotic Factors on Aboveground Biomass and Biodiversity of Ditch Slope in Coastal Farmland. Water 2022, 14, 3547. https://doi.org/10.3390/w14213547
AMA Style
Wang Y, Wang S, Jiang B, Zhu Y, Niu X, Li C, Wu Z, Chen W. Regulation of Abiotic Factors on Aboveground Biomass and Biodiversity of Ditch Slope in Coastal Farmland. Water. 2022; 14(21):3547. https://doi.org/10.3390/w14213547
Chicago/Turabian StyleWang, Yueying, Songtao Wang, Bing Jiang, Yihao Zhu, Xuchang Niu, Changjiang Li, Zhen Wu, and Weifeng Chen. 2022. "Regulation of Abiotic Factors on Aboveground Biomass and Biodiversity of Ditch Slope in Coastal Farmland" Water 14, no. 21: 3547. https://doi.org/10.3390/w14213547
Note that from the first issue of 2016, this journal uses article numbers instead of page numbers. See further details here.