
DNA-Based Tracers for the Characterization of Hydrogeological Systems—Recent Advances and New Frontiers


1
Key Laboratory of Shale Gas and Geoengineering, Institute of Geology and Geophysics, Chinese Academy of Sciences, Beijing 100029, China
2
Department of Energy and Power Engineering, Tsinghua University, Beijing 100084, China
3
Department of Energy Resources Engineering, Stanford University, Stanford, CA 94305, USA
4
College of Earth and Planetary Sciences, University of Chinese Academy of Sciences, Beijing 100049, China
*
Authors to whom correspondence should be addressed.
Water 2022, 14(21), 3545; https://doi.org/10.3390/w14213545
Submission received: 4 October 2022
/
Revised: 30 October 2022
/
Accepted: 1 November 2022
/
Published: 4 November 2022
(This article belongs to the Section Hydrogeology)
Abstract
:Tracer technologies based on naturally occurring substances or intentionally introduced compounds have a broad spectrum of applications in hydrogeological research and subsurface resource management. DNA (deoxyribonucleic acid)-based tracers, with unlimited unique variations and exceptional specificity, could potentially map the complex intricacies of subsurface flow networks in greater detail than traditional tracer methods. Here, we review recent advances in DNA-based tracer research involving modern culture-independent (i.e., molecular) measurement techniques for subsurface/flowpath characterization purposes. The two broad categories of DNA-based tracers, i.e., synthetic and naturally occurring, are further classified into four specific types: “naked DNA”, “encapsulated DNA”, “barcoding microbial communities”, and “indicator microbial communities”. We summarize and compare the basic methodological workflows for each type of DNA-based tracer and provide an overview of research developments in the past two decades, covering both laboratory/field-scale experiments and data interpretation methods. Finally, we highlight remaining questions and challenges for each type of DNA-based tracer in terms of practicality. Future research directions are also identified, including the application of emerging DNA tracer methods to a wider range of geological formations. Fundamental characteristics of these novel tracers need to be better understood, and their applicability under a broader range of engineering scenarios requires further validation.
1. Introduction
Tracer methods, whether natural or artificial, are important tools for the characterization of hydrological systems. Natural tracers are defined as the inherent components of water that are not induced by an intended experiment and provide qualitative/quantitative information about hydrological systems, such as isotopes and geochemical compounds [1,2,3,4,5,6,7,8]. Artificial tracers are defined by their active injection into hydrological systems in the context of an experiment, such as salts, fluorescent compounds, dissolved gases, etc. [1]. Compared with natural tracers, the application of artificial tracers is more limited in time and space but can offer additional information of value at the local scale [1,9] including information about interwell connectivities [10,11,12,13]; flow directions [1,14]; and reservoir transport parameters, such as flow velocity, dispersivity, fracture surface area, etc. [15,16,17,18,19,20,21,22,23] The use of multiple tracers within a single experiment can maximize the amount of information obtained in a tracer campaign [18] and enable tracer-based tomography [24,25]. However, the maximum number of tracer compounds that can be used in parallel is limited [18]. The quantification of such tracer compounds requires various laborious analytical efforts, including fluorescence spectrometry, ion chromatography, mass spectrometry, wet chemistry, etc., further limiting the feasibility of their synchronous application [18,26]. The use of DNA-based tracers is an effective solution to this limitation. DNA is available in virtually infinite number of different sequences, enabling repeated tracer tests and/or tracer tomographic analysis and avoiding the problem of tracer signal interference [25,27,28,29].
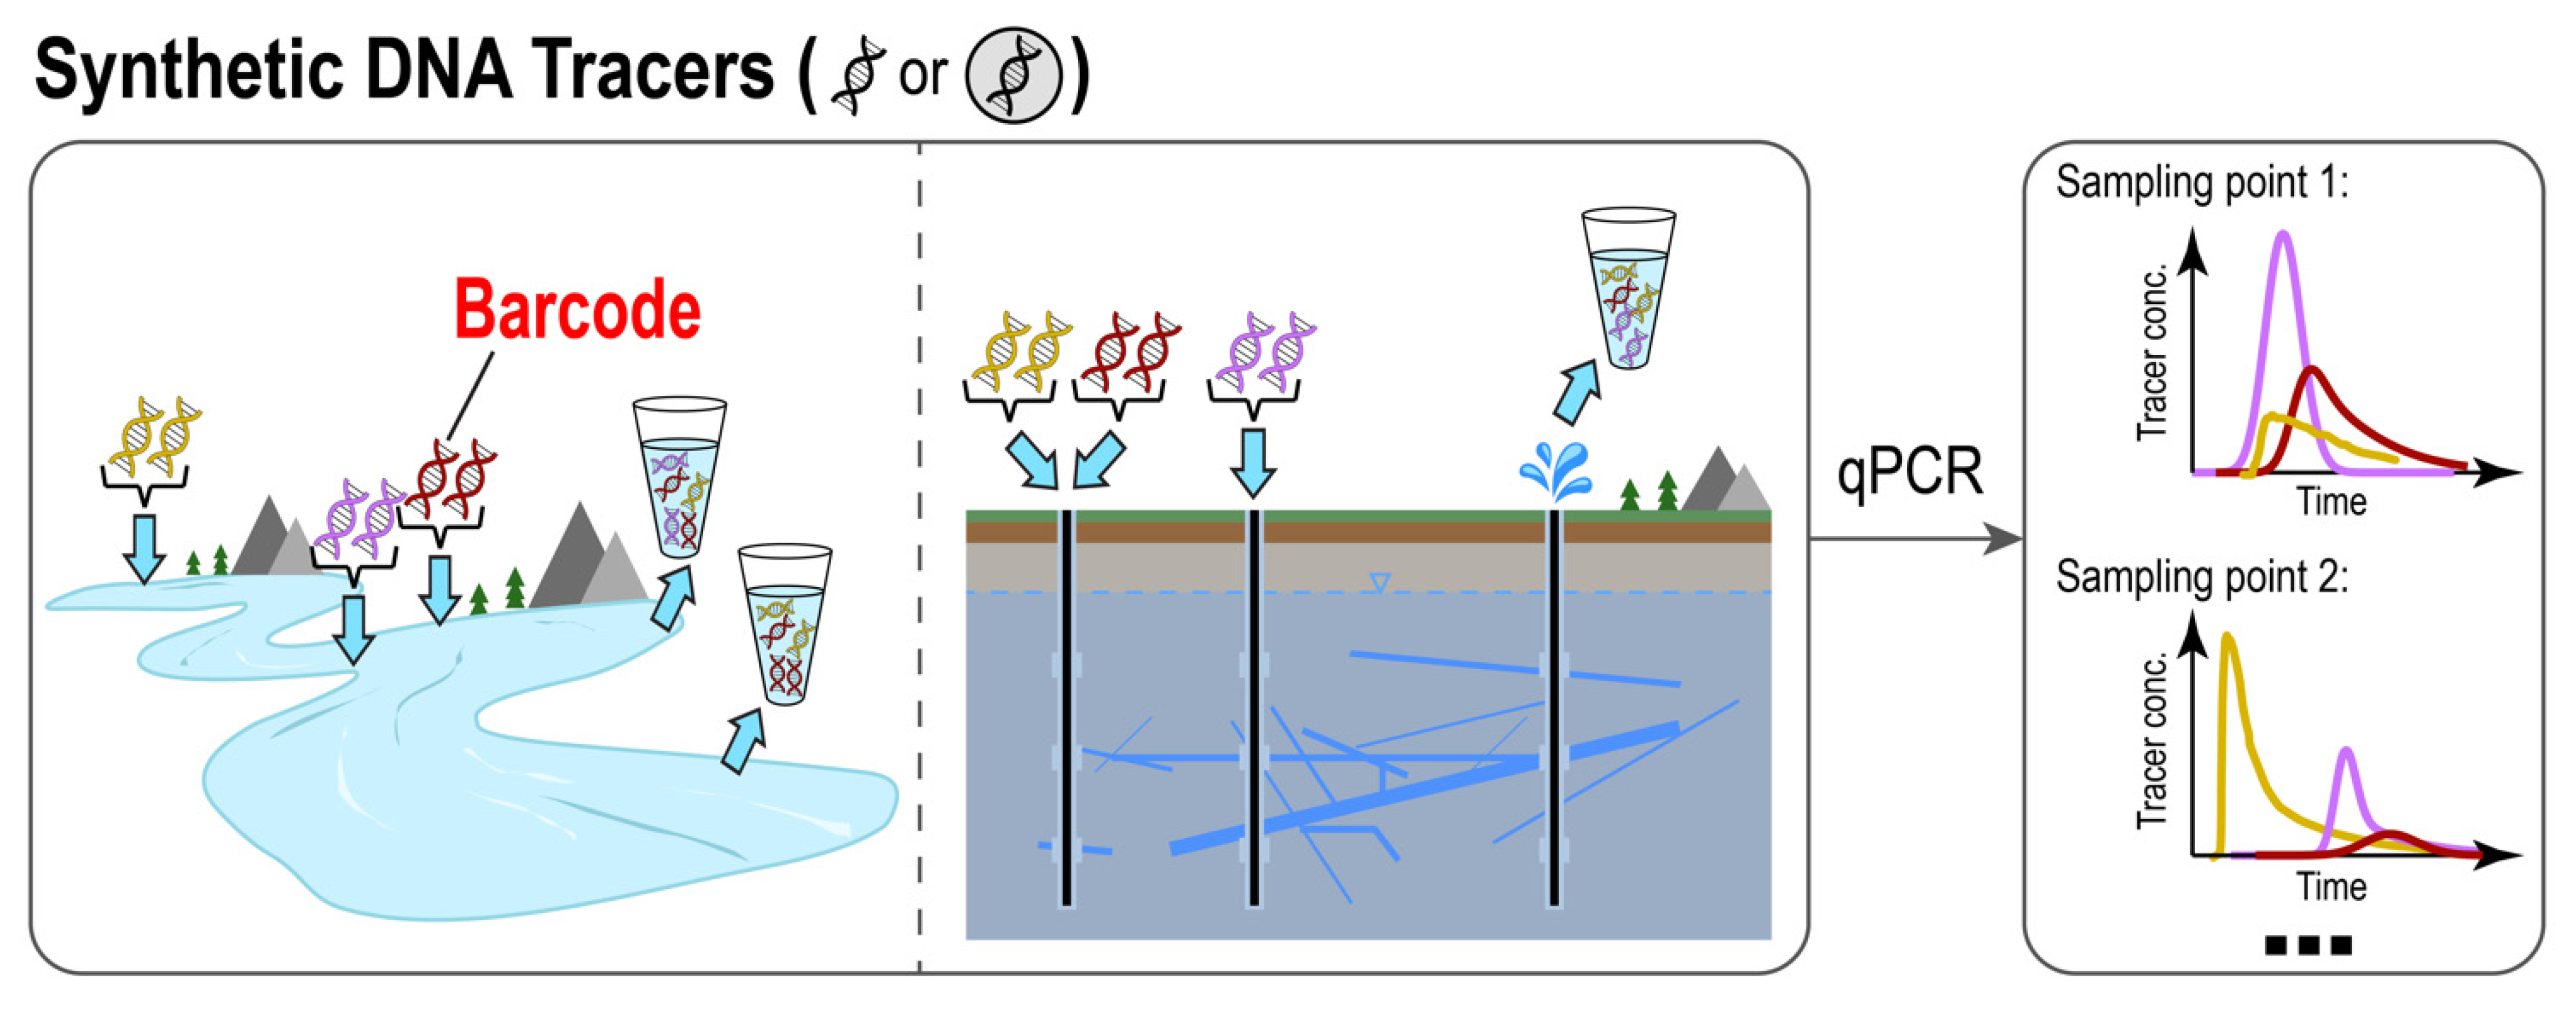
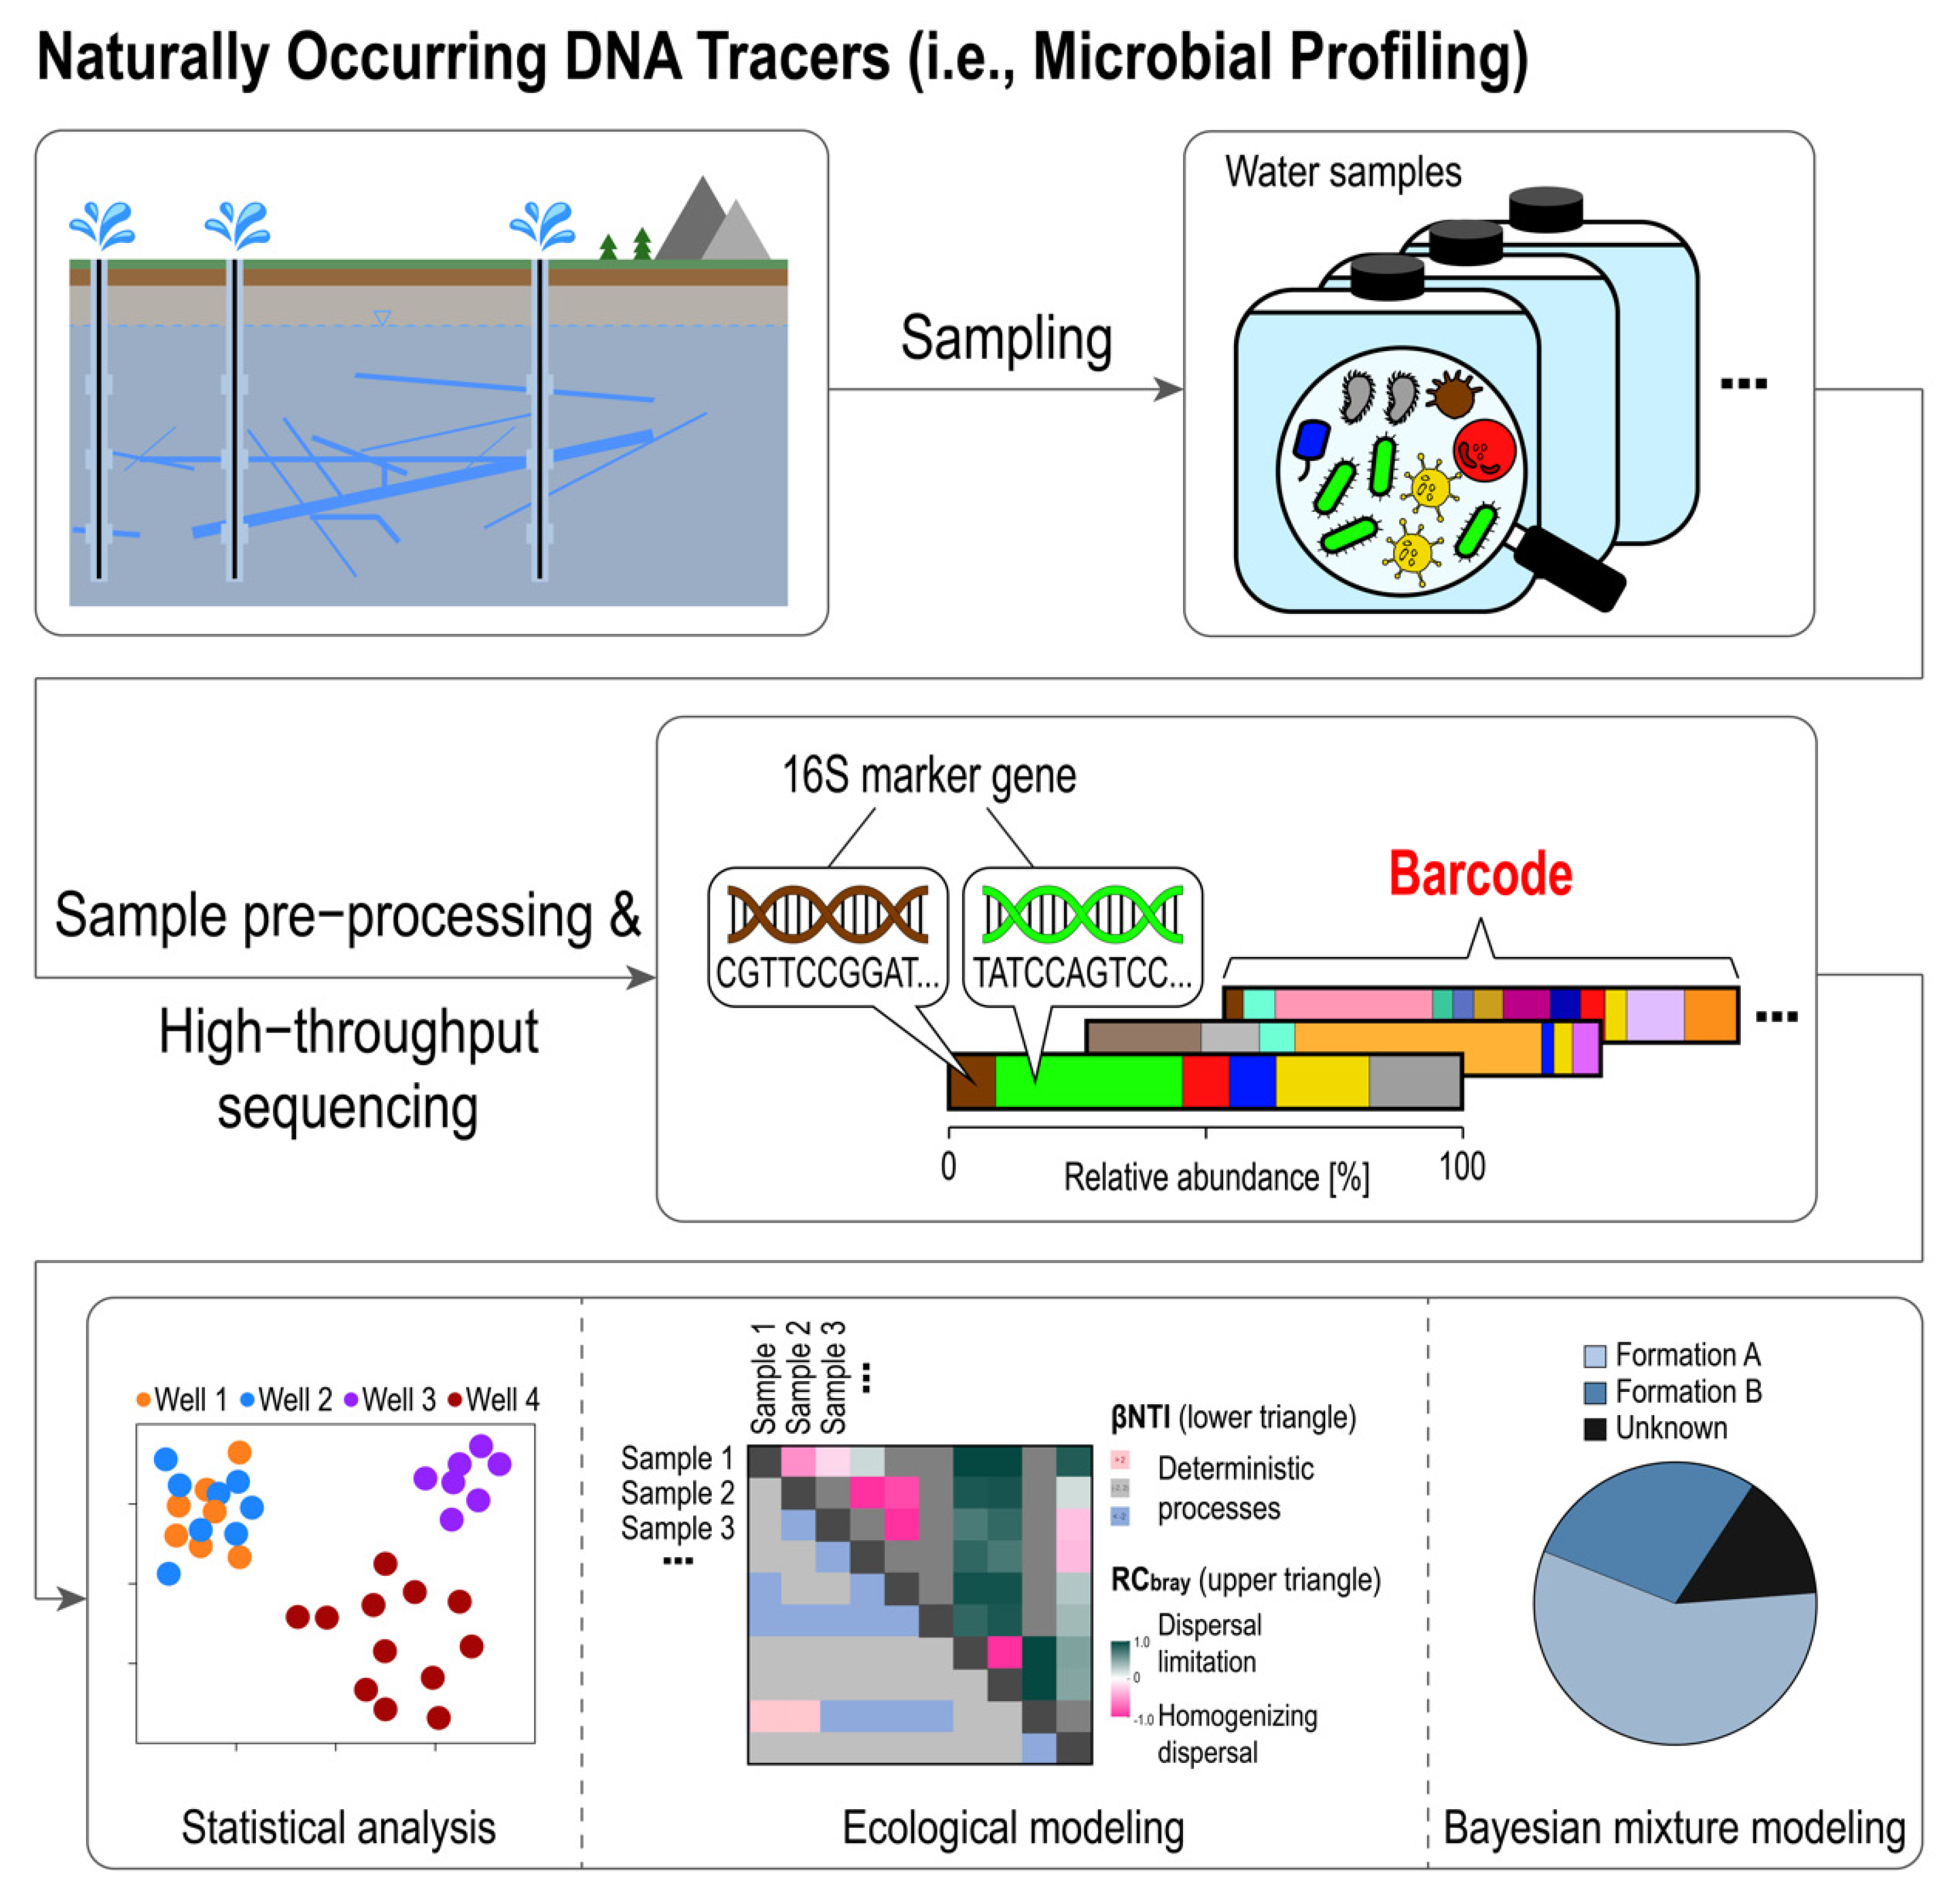
DNA-based tracers can be broadly classified into two categories: synthetic DNA tracers (Figure 1) [28,29] and naturally occurring DNA tracers (Figure 2) [10,30,31]. Synthetic DNA tracer methods involve the design and injection of artificially designed short DNA sequences that do not overlap with the DNA of any known microorganisms [26,28,32] (Figure 1). Synthetic DNA tracers can be in either free form (hereafter referred to as “naked DNA”) or embedded into micro-/nanoparticle carriers for protection against environmental stressors (hereafter referred to as “encapsulated DNA”). Naturally occurring DNA tracers, on the other hand, refer to the compositional information of the microbial communities (genomic DNA) inhabiting native reservoir fluids [10,33,34] or exogenous fluids [30,35] (Figure 2). Naturally occurring DNA tracers can either serve as metabolically passive particles traveling with the fluid of interest (hereafter referred to as “barcoding microbial communities”) or as metabolically active individuals that respond to the seepage/leakage of the fluid of interest (hereafter referred to as “indicator microbial communities”).
Synthetic and naturally occurring DNA-based tracers both have an unlimited number of unique variations, but in different ways. In synthetic DNA-based tracers, unique variations arise from varying combinations of the four nucleobases, adenine (A), thymine (T), guanine (G), and cytosine (C). In naturally occurring DNA-based tracers, unique variations arise from the tremendous microbial diversity in hydrological systems and the various drivers of microbial community structure. Such drivers include not only local environmental conditions (salinity, organic carbon, geochemistry, etc.), which are highly variable, especially in subsurface reservoirs, but also historical contingencies that occur during community assembly [36,37]. As a result, each hydrological compartment contains a unique compositional “barcode” of the microbial community (Figure 2). Such whole-microbiome data (instead of only a selected number of targeted species) could therefore sufficiently constrain the origin of fluids and uncover meaningful correlations for reservoir characterization purposes [10,38,39].
In recent years, a number of studies have investigated the application/utilization of DNA-based tracers in surface or subsurface environments by laboratory- or field-scale experiments. The increased attention to DNA-based tracers may be partly attributed to the advancement in molecular microbiology technologies in recent decades (namely, quantitative polymerase chain reaction [40] and high-throughput sequencing [41,42]), which enable the efficient quantification and profiling of DNA at low cost. The concept of DNA-based tracers is still relatively new in hydrogeology. The design, analytical techniques, data forms, and interpretation strategies of DNA-based tracing methods differ from those of classic chemical/isotopic tracer methods. In this review, we outline basic knowledge and compare several types of DNA-based tracers with the aim of promoting future studies on this topic and providing guidance for researchers interested in entering this field. We summarize recent research progress with respect to the application/utilization of “naked DNA” (Section 2), “encapsulated DNA” (Section 3), “barcoding microbial communities” (Section 4), and “indicator microbial communities” (Section 5) as novel tracers in hydrogeological systems. We provide an overview of each type of DNA-based tracer in terms of methodological workflows, experimental design, data interpretation methods, and the understandings achieved to date. Finally, we end this review by identifying remaining questions, challenges, and possible directions for future research (Section 6, Section 7). The scope of this review is restricted to DNA-based tracer methods that involve modern culture-independent (i.e., molecular) techniques for subsurface/flowpath characterization purposes. Studies focusing on contaminant tracing or involving culture-dependent techniques (e.g., [43,44,45,46]) are beyond the scope of this paper.
2. Naked DNA: Synthetic DNA in Its Free Form as an Artificial Tracer
2.1. Basic Methods: Design, Synthesis, and Quantification
For tracer applications, DNA sequences can be designed and produced by automated standard oligonucleotide synthesis [47] or simply purchased from commercial suppliers [26,28,48]. DNA is soluble in water [49] but sometimes classified as a particle tracer, owing to its large molecule size [1]. DNA molecules used as hydrological tracers can be single-stranded (ssDNA) or double-stranded (dsDNA) and are usually 70–350 bases/base pairs (bp) long. DNA tracer tests are performed in a similar manner as chemical tracer tests, whereby a concentrated tracer solution is pulse-injected and transported through the reservoir of interest. Tracer concentration is then monitored at the outlet and plotted against time to obtain a tracer breakthrough curve. The concentration of a DNA tracer solution is measured by quantitative polymerase chain reaction (qPCR), whereby a small amount of starting DNA molecules is replicated exponentially in a series of thermal cycles through an enzymatic process [50]. The total amount of DNA at the end of each thermal cycle is measured in terms of the fluorescence of either a dye that binds to any double-stranded DNA (e.g., SYBR Green) or a dye that binds to a predetermined sequence of the target DNA molecule (e.g., TaqMan probes). The concentration of the initial starting DNA can be deduced by monitoring the increase in fluorescence as the DNA duplicates and counting the number of thermal cycles required for the fluorescence intensity to reach a certain threshold [26]. The initiation of a qPCR reaction requires a pair of primers (ssDNA, usually with 15~20 bases) that is complementary to the sequence at the two ends of the DNA template. When multiple DNA sequences are present as a mixture, the DNA template of interest can be amplified and quantified by using primers with sequences specific to the target DNA in a qPCR reaction [50]. Therefore, unlike conventional tracers, which requires a variety of analytical techniques in the case of multiplexed testing, only one tracer quantification technique is necessary for synthetic DNA tracers. A number of sequence design criteria must be satisfied for efficient qPCR reactions, as detailed in [28]. DNA tracer sequences that have been verified in terms of usability can also be readily adopted from the literature as needed.
2.2. Recent Advances
In the past two decades, the utility of naked DNA tracers has been tested in various field-scale aquatic environments worldwide, including surface streams [27,48,51,52], sand/gravel aquifers [18,32,47,52,53], fractured hard-rock (gneiss, amphibolite, limestone, etc.) aquifers [53,54], karstic springs [55,56], subglacial drainage systems [26], and saturated/variably saturated soils [32,52,57]. Field tests are useful for assessment of the applicability of DNA-based tracers in the presence of the complexities, heterogeneities, and natural driving forces of geological environments. The experimental designs and major findings of the relevant literature are summarized in Table 1, grouped according to the first author and in chronological order. Naked DNA tracers have been successfully transported and recovered in the field at a distance of up to several kilometers [26,52,54,55]. Many studies have employed multiplexed tracer testing and demonstrated the specificity of DNA quantification without signal interference or background noise (e.g., [26,27,32]), provided that the sequences were properly designed [51]. Naked DNA tracers have generally been found to have faster [18,32,48,54,55] or similar [27,51,56] transport velocities compared with conservative reference tracers. The faster breakthrough of naked DNA tracers can be explained by the size exclusion effect, whereby relatively larger DNA molecules are excluded by smaller pores, resulting in selective travel through preferential pathways with high fluid velocities [18,32]. The breakthrough curves of naked DNA tracers usually have sharp pulses with significant scatter compared with the typical Gaussian shape of conventional chemical tracers [32,55]. The mass recoveries of naked DNA tracers are usually lower than those of reference tracers, which can be attributed to decay at elevated temperature, adsorption onto mineral surfaces, microbial consumption, or enzymatic degradation [32].
Although field experiments provide fundamental constraints on the effective transport properties of naked DNA tracers under realistic conditions, the drivers and mechanisms behind field observations are coupled and challenging to isolate. In contrast, laboratory experiments provide an effective means of controlling key variables for the analysis of individual processes [58,59,60] and the acquisition of mechanistic understandings of DNA tracer transport properties. A number of laboratory studies on naked DNA tracers were performed prior to field experiments, whereby sand and gravel from field sites were sampled and either mixed with DNA tracer solution for batch sorption tests [54] or packed in a column for preliminary tracer flow-through experiments [18,32,48,54]. Other laboratory studies were not associated with any field test but employed well-controlled conditions using simple media to understand the fundamental transport, adsorption, and degradation characteristics of naked DNA molecules [28,61,62]. The velocity and adsorptive behavior of naked DNA tracers during transport were found to be affected by both DNA length and mineral surface properties [28]. The presence of organic matter can reduce DNA adsorption by competing for adsorption sites [61]. The degradation rate of a DNA tracer sequence can be slowed by adding non-amplified flanking regions to the ends of the DNA amplicon [61,62].

Table 1.
Summary of the literature on the use of naked synthetic DNA molecules as hydrological/reservoir tracers. Studies are grouped according to the first author and are presented in chronological order.
Table 1.
Summary of the literature on the use of naked synthetic DNA molecules as hydrological/reservoir tracers. Studies are grouped according to the first author and are presented in chronological order.
| Authors | Year (Country a) | ss-/ds- | Length b | Medium | Scale c | Details |
|---|---|---|---|---|---|---|
| Amplicon /Total | ||||||
| Sabir, I.H., et al. | 1999 [47] (Norway) | ss | 72/72 | Aquifer with mostly sand (0.06–2 mm) and 5–10% silt (0.002–0.06 mm) | Field, 10 m (<10 m deep) | Presence/absence detection (PCR); sequenced to decode the encoded text. |
| 2000 [53] (Norway) | NM | NM/NM | 1) Aquifer with course glaciofluvial sand and gravel sediments; 2) fractured gneiss bedrock; 3) fractured amphibolite bedrock. | 1) Field, 100 m (<20 m deep); 2) Field, 100 m; 3) Field, 10 m. | Qualitative measurements (PCR); demonstrated the application of synthetic DNA tracers in different field situations. | |
| Ptak, T., et al. | 2004 [18] | ss | NM/90 | 1) Column packed with aquifer media (see below); 2) ~5 m thick saturated aquifer with clay, sand, and gravel. | 1) Lab, L = 50 cm, D = 10 cm; 2) Field, 10 m | Two DNA sequences were tested; the first quantitatively measured (qPCR) DNA breakthrough curves at the field scale. DNA had an earlier peak arrival than bromide in laboratory tests but not necessarily in field tests; tracer recovery NM. |
| Foppen, J.W., et al. | 2011 [27] (Netherlands) | ss | 80/80 | Two streams. | Field, 100–1000 m | Six DNA sequences were used in two injection tests; breakthrough curves were measured at multiple locations downstream. DNA and NaCl had similar peak arrivals; recovery: 94–115% for NaCl and 19–122% for DNA. |
| 2013 [51] (Luxembourg and the Netherlands) | ss | 80/80 | Four streams. | Field, 100 m | One DNA sequence was used in six injection tests; breakthrough curves were measured at multiple locations downstream. DNA and NaCl had similar peak arrivals; recovery: 66.7–106.1% for NaCl and 2.9–52.6% for DNA. | |
| Aquilanti, L., et al. | 2013 [54] (Italy) | ss | 72/72 | 1) Two columns packed with aquifer material (crushed limestone, ~5.1 mm grain size); 2) fractured limestone aquifer | 1) Lab, L = 20 cm, D = 1.8 cm & L = 44.6 cm, D = 5.2 cm; 2) Field, 1 km | One DNA sequence was injected into a sinkhole, and breakthrough curves were measured at a spring downstream. DNA peak arrival occurred earlier than the reference tracer in all lab/field tests; tracer recovery NM. |
| 2016 [55] (Italy) | ss | 72/72 | Two karstic springs. | Field, 1 km | One DNA sequence was tested. DNA peak arrival occurred earlier or at similar time as the fluorescein tracer; the DNA breakthrough curve had sharp pulses rather than a Gaussian shape; recovery: 0–63% for fluorescein; NM for DNA. | |
| Bovolin, V., et al. | 2014 [56] (Italy) | NM | NM/NM | Karstic spring. | Field, 100 m. | One DNA sequence was injected, and the breakthrough curve was measured ~300 m downstream. DNA and salt had similar peak arrivals; recovery: 33.5% for salt and 87% for DNA. |
| Dahlke, H.E., et al. | 2015 [26] (Sweden) | ss | 95/99, 88/90 | Subglacial drainage system. | Field, 1 km | Three DNA sequences were injected into different moulins, and breakthrough curves were measured along proglacial streams. Recovery: 99% for uranine and 1–57% for free DNA. |
| Pang, L., et al. | 2017 [32] (New Zealand) | ds | 198/302 | 1) Column packed with aquifer gravels (94% > 2 mm, 3% 0.5–2 mm, 3% < 0.5 mm) from field site; 2) alluvial gravel aquifer; 3) lysimeter with stony soil. | 1) Lab, L = 2 m, D = 19 cm; 2) Field, 10 m 3) Lab, L = 0.7 m, D = 0.5 m. | Ten DNA sequences were tested. DNA typically had earlier breakthrough, less dispersion, and less recovery than the bromide reference tracer. |
| 2020 [52] (New Zealand) | ds | 198/302, 200/352 | 1) Surface stream; 2) alluvial gravel aquifer; 3) coastal sand aquifer; 4) soil lysimeter. | 1) Field, 1 km; 2) Field, 10 m (16-m below ground); 3) Field, 1 m; 4) Lab, L = 0.7 m, D = 0.5 m. | Free DNA was tested and compared with DNA encapsulated in polymer microparticles. Free DNA had greater mass recoveries than encapsulated DNA in the gravel aquifer but lower recoveries in the surface water experiments. | |
| 2022 [61] (New Zealand) | ds | 198/302, 200/352 | 1) Incubation tests using stream water, groundwater, and wastewater; 2) batch adsorption tests using stream sediments, soils, and aquifer media with water from each site. | 1) Lab, 1.5 ml tubes; 2) Lab, 30 ml tubes. | Incubation tests were conducted for ~10 days, and adsorption tests were conducted for ~24 hr. With similar amplicon lengths, DNA with longer flanking regions degraded slower than DNA with shorter flanking regions. Longer DNA had similar or less adsorption than shorter DNA, depending on the type of solid phase. | |
| Zhang, Y., et al. | 2017 [62] (USA) | ds | 113/113, 141/~2-million | Batch heating test in Tris-EDTA buffer. | Lab, 5 ml vessels. | The heat degradation of short, synthetic DNA was compared with that of long, genomic DNA; the similar-length amplicon region was better preserved in the long DNA after one-hour heat treatment at 150 °C. |
| 2021 [28] (USA) | ds | 70/90, 90/110, 112/132, 114/134, 141/161, 160/180, 180/200 | 1) Column packed with glass beads (avg. 82.5 μm); 2) column packed with quartz sand (avg. 149 μm). | 1) Lab, L = 50 cm, D = 1 cm; 2) Lab, L = 50 cm, D = 1 cm. | The effect of DNA length and adsorption on DNA tracer transport was investigated (nine sequences with six lengths tested). DNA peaks occurred faster than bromide in the glass-bead column but slower in the sand column. DNA recovery increased with increasing length in the glass-bead column but decreased with increasing length in the sand column, which can be explained by the corresponding trends in adsorption partition coefficients. | |
| McCluskey, J., et al. | 2021 [48] (USA) | ds | 200/300 | 1) Incubation test using river water and distilled water; 2) column packed with sand and limestone; 3) surface stream. | 1) Lab, 2 ml tubes; 2) Lab, L = 25.4 cm, D = 6.35 cm; 3) Field, 10 m. | Two DNA sequences were tested; DNA concentrations were measured by droplet digital PCR (ddPCR). DNA had earlier peak arrival and lower mass recovery than uranine; different DNA sequences had the same peak arrival but different recoveries in the column test. |
| Wang, C., et al. | 2022 [57] (USA) | ss | 88/88 | Sloped lysimeter packed with crushed basaltic tephra (3.2% <2 μm, 12.2% 2–50 μm, 84.6% 50–2000 μm) | Lab, L = 2 m, W = 0.5 m, H = 1 m. | One DNA sequence was tested; DNA transport through the vadose zone under variably saturated transient flow conditions was studied both experimentally and numerically. Recovery: 97.78% for deuterium and 1.08% for DNA. |
a Country where the experiments were conducted or, if not mentioned, of the first-author institution. Underline indicates that the study tested synthetic DNA tracers both in their free form and encapsulated in micro-/nanoparticle carriers. b Lengths of naked DNA tracers are measured in bases for ssDNA and base pairs (bp) for dsDNA. c “Scale” describes the approximate tracer transport distance in an experiment. For field tests, the “scale” of each study is approximated as “1 m” for 1–9 m, “10 m” for 1–99 m, “100 m” for 1–999 m, etc. Abbreviations: ss, single-stranded; ds, double-stranded; NM, not mentioned; L, length; D, diameter; W, width; H, height/depth.
3. Encapsulated DNA: Synthetic DNA Embedded in Nano/Microparticle Carriers as an Artificial Tracer
3.1. Basic Methods: Design, Synthesis, Release and Quantification
DNA can be encapsulated into particle carriers so that it is protected from environmental stressors and degradation. Silica (SiO2) nanoparticles have been used as particle carriers in a number of studies [25,29,63,64,65,66,67,68,69], whereas biodegradable polymers were used as particle carriers in other studies, such as polylactic acid (PLA) [26,70,71,72], poly lactic-co-glycolic acid (PLGA) [73,74], and alginate-chitosan [52]. The design criteria, synthesis/purchase, and quantification of the DNA molecules to be embedded is the same as that for naked DNA, as described in Section 2.1. However, additional laboratory workflows are needed to encapsulate DNA molecules, usually by modified Stober methods for silica nanoparticles [64,65,75] or the double emulsion method for polymer-based microspheres [70,73], as detailed in the respective literature. Additionally, a DNA release protocol that removes the protective shell is needed before the DNA can be quantified with qPCR after transport. Silica nanoparticles are typically dissolved using buffered fluoride solution [25,29,63,64,65,66,67,68,69], whereas polymer particles can be dissolved using chloroform [70], methylene chloride [26], dichloromethane [71,73,74], or Chelex® [52], depending on the polymer type.
3.2. Recent Advances
In the past decade, the use of encapsulated DNA as hydrological tracers has been tested by a number of researchers, usually in the laboratory either as a proposal/proof of concept [29,63,70,74] or to understand specific transport behaviors of the particle carriers [65,67,68,69,71]. A summary of the experimental designs and major findings of the relevant literature is provided in Table 2. Laboratory studies have revealed that encapsulated DNA exhibits advective–dispersive behavior with less dispersion and more scattered (i.e., “noisier”) breakthrough curve datapoints compared with reference tracers [66,67,70]. Such scatter could be attributed to the discreteness of particles [66]; the nature of the amplification-based qPCR technique, which is only accurate on a logarithmic scale [51,67]; and the complex interplay between preferential retention–release mechanisms and the (often wide) particle size distributions [66,71]. Increased particle size was found to be associated with increased transport velocity and decreased recovery [65]. Batch heating tests have confirmed the improved stability of silica-encapsulated DNA compared with naked DNA at 80 °C for up to two weeks [65]. At higher temperatures (>100 °C), which can be encountered in a petroleum/geothermal reservoir setting, increased solubility of silica may impair the integrity of the particle carrier and hence the integrity of the embedded DNA [63,65,76]. Polymer particles have a higher degradation rate compared with silica [65]. The degradation of polymer-based encapsulated DNA has been tested, with the conclusion that an increased temperature (up to 20 °C) leads to an increased rate of degradation beyond 10 days [73].
Encapsulated DNA tracers have also been successfully flowed and recovered in field tests, including surface streams [52,74], subglacial drainage systems [26], unconsolidated gravel aquifers [25,52,65], soil media [73,74], and fractured crystalline rock [66] (Table 2). Encapsulated DNA tracers usually have earlier and sharper breakthroughs [52,65,66] and lower recoveries [26,66,71] compared with solute reference tracers. Earlier and sharper breakthroughs are explained by the size exclusion effect [65]. Lower recoveries could be attributed to the filtration effect [52,66]. For particles with higher densities than water, such as silica, gravitational settling is another factor that could lead to tracer loss [66]. In a field setting, microbial activity can also result in significant DNA loss, even with a protective silica shell [65]. Some studies have tested encapsulated DNA alongside naked DNA for comparison [26,52]. Compared with naked DNA in the same experiment, the mass recovery of encapsulated DNA can be higher [52], lower [52], or similar [26], depending on properties of the transport media [52] and the environmental conditions [26].
4. Barcoding Microbial Communities: The Composition of Reservoir Native Microbial Communities as a Natural Tracer
4.1. Basic Methods: High-Throughput Sequencing and Statistical Data Analysis
Microorganisms live in complex multispecies communities in the environment. Nowadays, microbial communities in an environmental sample can be profiled at high taxonomic resolution, with high throughput, and at a reasonable cost [10,33,77]. The technology to achieve this is called high-throughput sequencing (also known as next-generation sequencing or NGS), which emerged in the marketplace in the late 2000s [42]. In contrast with qPCR, which quantifies the absolute number of DNA copies for only the targeted sequence(s) in a sample, NGS sequences all DNA (usually a taxonomic marker gene, such as the 16S ribosomal RNA gene) present in a sample and returns a relative abundance profile. The laboratory workflow for NGS includes DNA extraction, library preparation, purification, and the sequencing run. Whereas many researchers perform DNA extraction and library preparation in-house at an equipped biological laboratory (e.g., [10,31,78]), it is also not uncommon to outsource portions of the workflow to NGS companies with automation capacity (e.g., [77]).
The data interpretation method for NGS also differs from that of qPCR. Synthetic DNA tracer data measured by qPCR are interpreted in a similar manner as classic chemical tracer data, such as by fitting the breakthrough curve to a solute transport model to deduce the transport parameters [15,28,79]. In contrast, microbial community data obtained by NGS has much higher dimensions in that a single sample can contain hundreds or even millions of simultaneous measurements [80]. Microbial community data are usually analyzed with the help of statistical methods, such as principal component analysis (PCA), nonmetric multidimensional scaling (NMDS), etc., for dimension reduction and visualization [80]. Standard data analytic pipelines are freely available for the implementation of those methods (e.g., in R or python, with extensive tutorial pages available, such as [81]). In the context of flowpath characterization, alternative methods, such as Bayesian mixture modeling [39,82] and ecological null modeling [31,34], can also be used to obtain quantitative information from the dataset (see Section 4.2).
4.2. Recent Advances
To the best of our knowledge, barcoding microbial communities are used as natural tracers mostly in subsurface environments, such as groundwater [10,30,31,34] and hydrocarbon reservoirs [33,35,39]. This is possibly due to the stable environmental conditions in deep terrestrial habitats [83,84], where variations in microbial community composition likely reflect properties of the flowpaths instead of environmental fluctuations [31]. Furthermore, subsurface resource management is long hindered by spatially and temporally sparse characterization data [58,85,86], owing to the inaccessibility of deep formations. Microbiome data remain an unutilized data source for most subsurface research/engineering projects and could expand current subsurface characterization capacities. Consequently, the use of barcoding microbial communities as natural tracers may be most relevant in subsurface settings.
In the past five years, the use of microbial communities as natural tracers for reservoir characterization has attracted interest in both the scientific community and industry. Field studies have been performed to verify the informativeness of this novel data source, as summarized in Table 3. Note that all groundwater studies listed in Table 3 were performed by research institutions [10,30,31,34], whereas the hydrocarbon studies were performed by industrial entities [12,33,35,38,39,87,88]. At a 1478 m deep mesoscale (10–100 m) fractured hard-rock aquifer developed for enhanced geothermal system (EGS) research [89,90,91,92], a series of studies profiled and correlated the microbial communities in reservoir fluids across space and time. These studies demonstrated that (1) fluid-associated microbial communities of artesian boreholes could be used to infer natural interwell connectivities [10], (2) time-series microbial profiling of reservoir produced fluids could be used to monitor physical changes in the fracture network in the long term [31], and (3) injector–producer microbial profiling (in the context of interwell fluid displacement for resource extraction) could reveal the relative connectivities across different producers with a given injector [30]. These studies took advantage of the rich characterization data available at the research site, such as core logs, microseismic, and chemical tracer data, to corroborate the findings from the microbial community analyses [10,30,31]. In another groundwater study, indigenous microbial communities were found to follow patterns largely consistent with known hydraulic connections at the regional scale (100 km) and could therefore serve as a new tool to characterize hydraulic connections along groundwater flowpaths [34].
Microbial community profiling has also been employed for the characterization and monitoring of commercial hydrocarbon reservoirs. In unconventional hydrocarbon reservoirs subjected to hydraulic fracturing, the microbial community profiles of produced fluids can be compared with a drill-cutting-derived baseline in order to infer per-formation and per-frac-stage contributions [12,33,38,39,87,88] (i.e., what fraction of the produced fluids is sourced from which formation/stage). Cross correlation of microbial communities among produced fluids has also been used to characterize well-to-well communication [33,38] (i.e., to identify “fracture hits” [93]). The development of conventional oil reservoirs can also benefit from microbial community analysis. The combined profiling of injected and produced fluid microbial communities in a water-flooded oil reservoir was shown to be a useful indicator for the progression of the waterflood front [35]. Similar findings have been reported by other research groups as well [30,94].
5. Indicator Microbial Communities: Microbial Response to Environmental Anomalies as an Indicator to Indirectly “Trace” the Seepage/Leakage of Hydrocarbon/CO2
The use of barcoding microbial communities described in Section 4 is based on the premise that the communities can be considered metabolically passive. In contrast, the use of indicator microbial communities takes advantage of the ability of microorganisms to metabolically respond to an environmental anomaly, even when the anomaly is not directly detectable [95]. For example, locating the seepage of light gaseous hydrocarbons (C1–C5) to the surface is useful for assessment of hydrocarbon prospects and to improve the likelihood of success in drilling new wells [96]. However, the volume of seeping gases can be insufficient for direct measurement. For microbial communities, even very slight changes in the environment can act as an evolutionary constraint on their development and trigger a response in the community structure [97,98]. Therefore, the microbial communities in environmental samples above a hydrocarbon reservoir could potentially serve as a sensitive indicator to trace microseepage and hence facilitate decision making for improved asset management [96].
Indicator microbial communities for tracing of microseepage have been used in shale plays to identify sweet spots prior to drilling, as reported by several industrial entities [98,99,100]. In these studies, hundreds of shallow sediment samples (soil and seabed) per field were collected above hydrocarbon accumulations, and the microbial communities were profiled by high-throughput sequencing. Machine learning algorithms were used to uncover correlations between small variations in community structures and the presence/absence of thermogenic hydrocarbons. Promising accuracies for sweet spot prediction were demonstrated, ranging from >70% [100] to 97% [98].
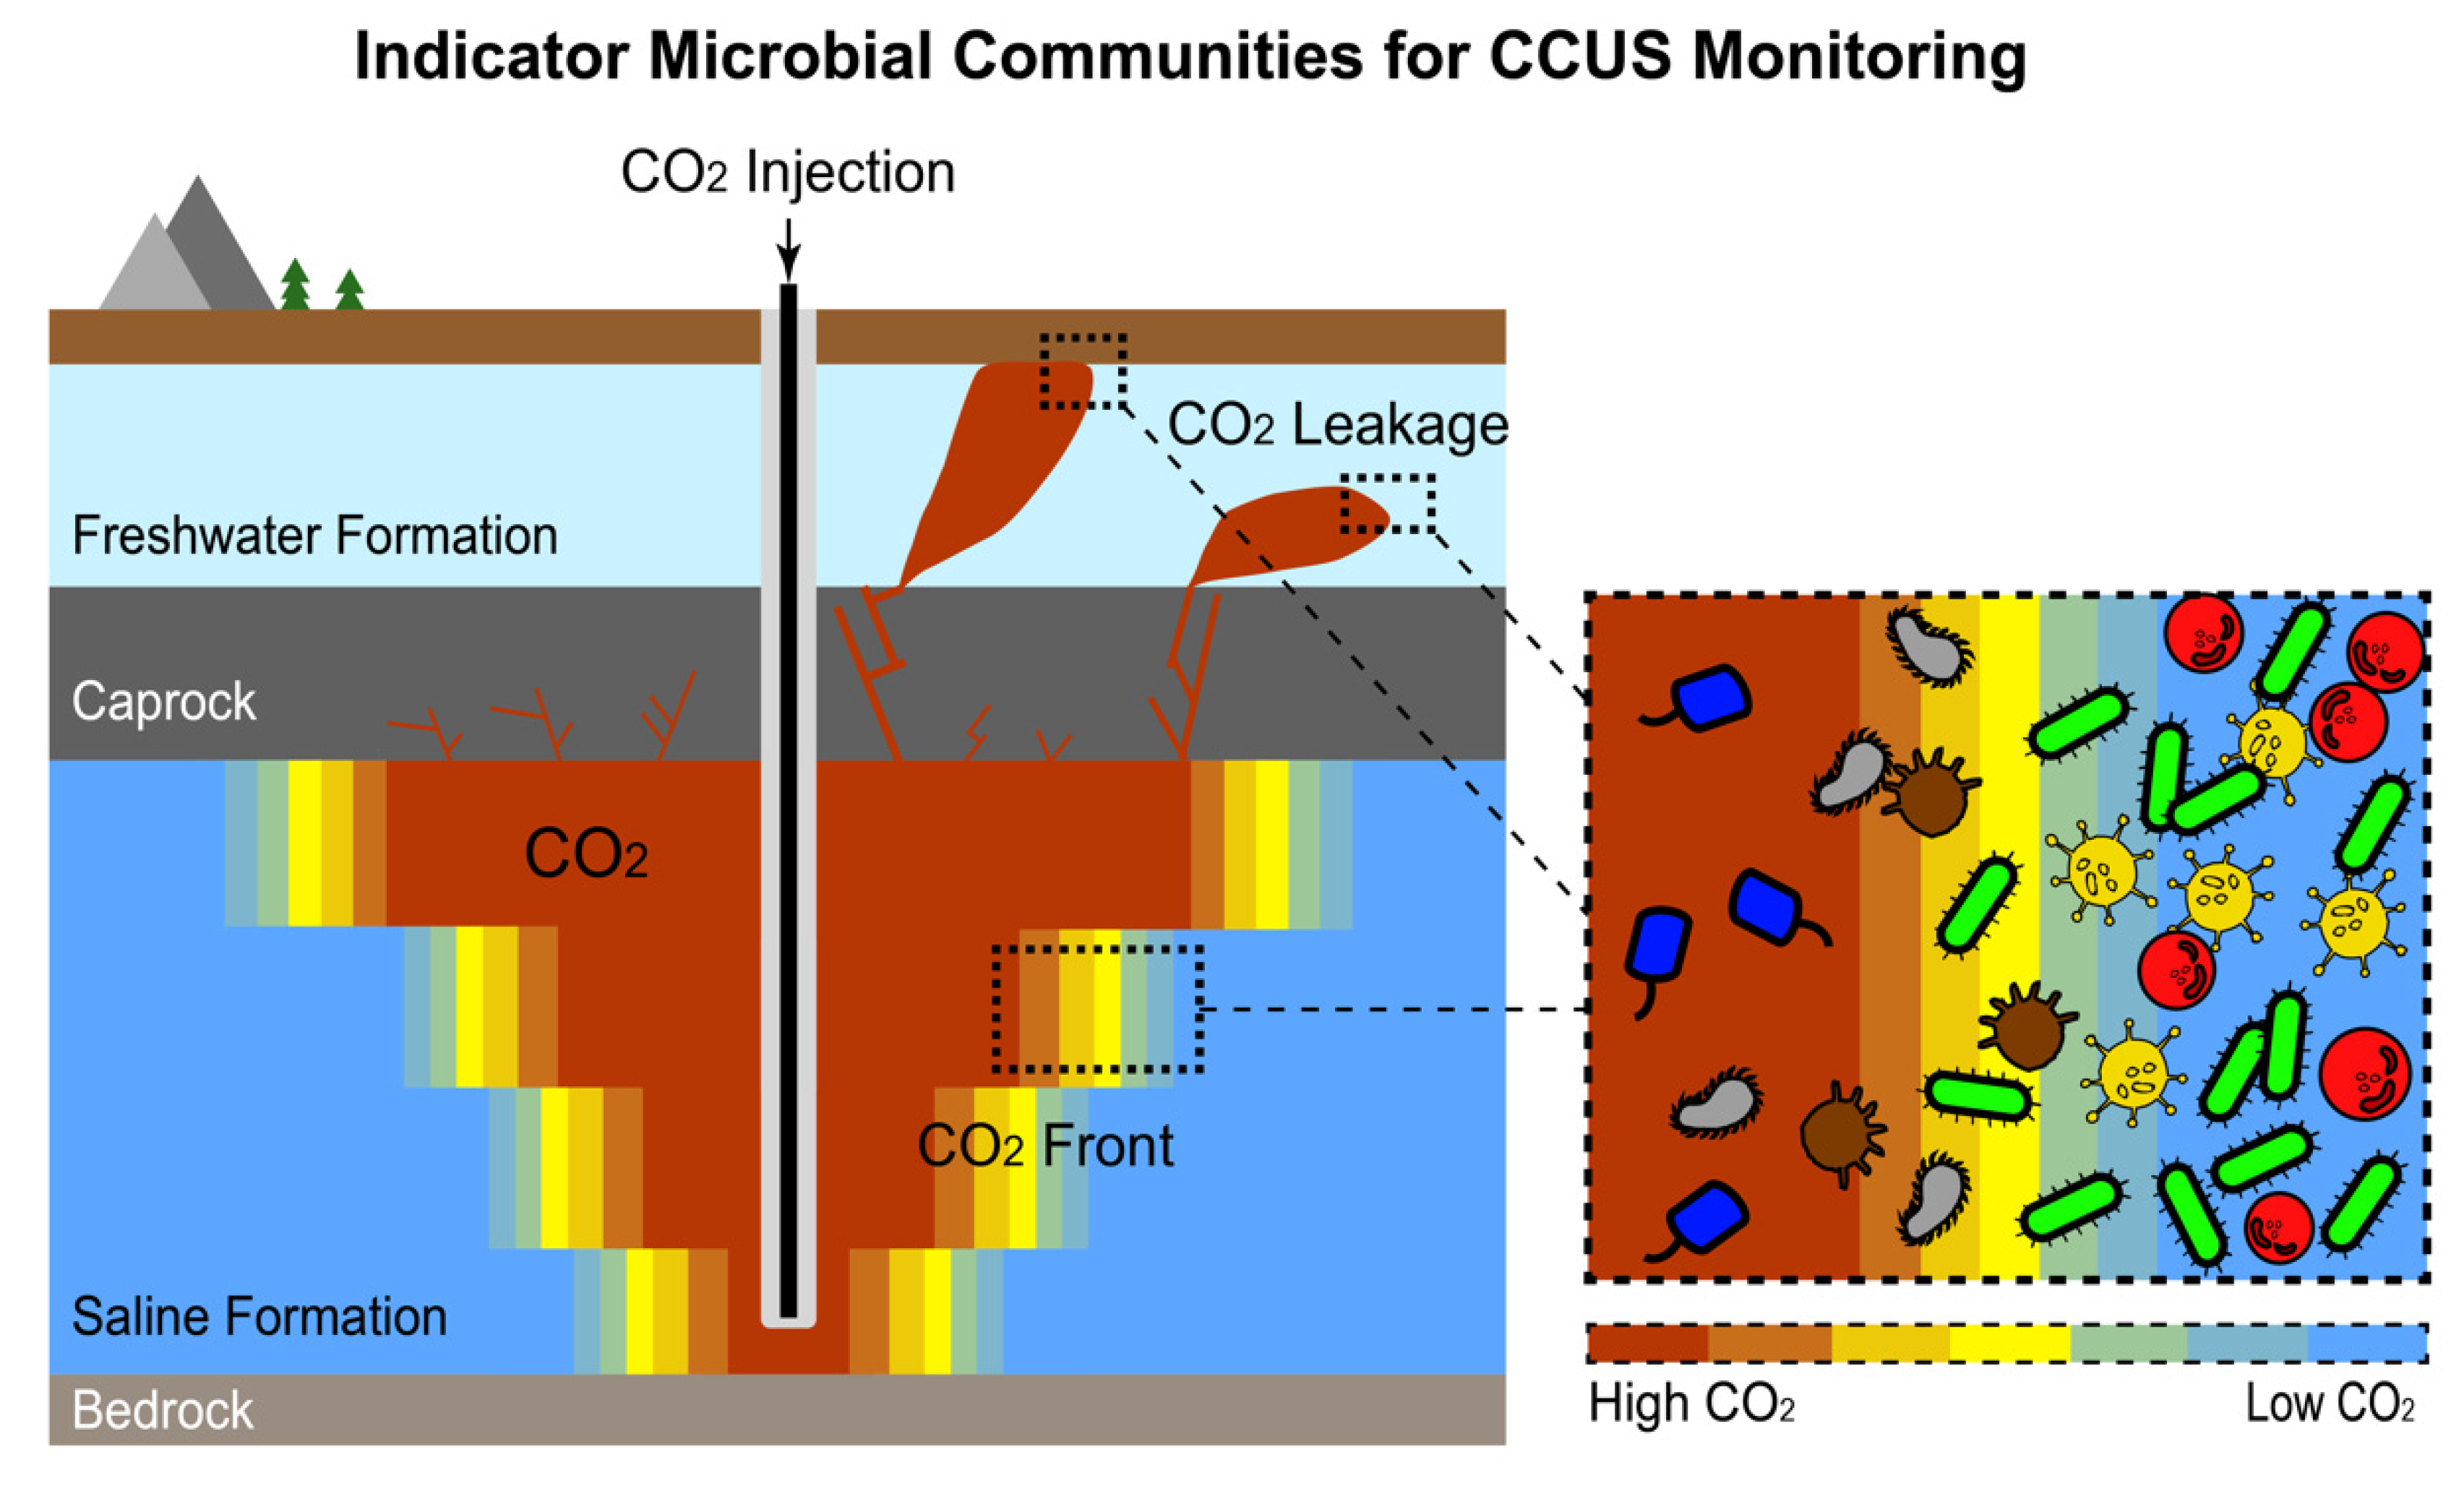
Indicator microbial communities may also be a useful tool in carbon capture (utilization) and sequestration (CCS/CCUS), as illustrated in Figure 3. Specifically, their ability to rapidly respond to environmental changes and their various pathways for assimilation of CO2 make microorganisms ideal candidates for detection of leakage and plume front at CO2 storage sites [97], providing an alternative to other monitoring methods, such as soil gas surveys [101]. A few studies have explored the community-level response of microbes to elevated CO2 levels at natural CO2 gas vents [102,103] and at dedicated field testbeds with artificially introduced CO2 to simulate a leakage [104,105,106,107,108,109,110,111]. An increasing CO2 flux is often associated with decreasing bacterial community diversity [103,104,108,111], although the reverse trend has also been observed at extremely high CO2 fluxes [102]. In a study comparing CO2-exposed communities across different types of geological formations, CO2-selected microbial communities were found to vary among sites [105]. Another study reported no significant changes in microbial community profile after CO2 exposure [107]. Overall, the current understanding of how CO2 impacts terrestrial microbiomes is limited, with contradictions in some cases, possibly owing to the spatiotemporal heterogeneities of environmental conditions in terrestrial environments [112]. Methodological limitation is another possible cause of the inconsistent conclusions reported across studies, as many studies used traditional microbial profiling techniques (e.g., denaturing gradient gel electrophoresis) with limited resolution [112]. Further studies with carefully designed experiments and employing modern high-throughput sequencing techniques are needed to gain a deeper understanding of how microbes respond to CO2 and how such knowledge can be integrated into CCS monitoring programs [97,112].
6. Two Decades of Progress, Side-by-Side Comparisons and the Path Forward
Chronological information on the studies reviewed herein (e.g., Table 1, Table 2 and Table 3) shows a clear temporal association between the emergence of each DNA tracer method and the invention of the molecular technique upon which it depends. Naked DNA tracing was first documented in the 1990s, several years after the invention of PCR and qPCR [40]. Later, in the 2010s, researchers attempted to improve DNA tracer stability by embedding DNA molecules into nano-/microparticle carriers with the help of nanotechnology. The use of barcoding and indicator microbial communities for reservoir characterization emerged in the late 2010s, not long after the arrival of high-throughput sequencing service in the marketplace in the late 2000s [42]. Despite its relatively short history, microbial community tracing has been successfully employed in a number of field-scale studies and, in some cases, aided in the management of commercial reservoirs (see Section 4 and Section 5).
Compared with classic chemical/isotopic tracer methods, DNA-based tracers require more careful experimental handling for contamination control and biological molecule preservation (e.g., samples need to be kept cold/frozen), leading to increased logistical costs. However, such costs can be well compensated for by the improved specificity and the wealth of subsurface information that can be obtained by DNA-based tracers. Among synthetic DNA-based tracers, naked DNA tracers have the advantage of being commercially available and relatively easy to implement. However, adsorption to geological materials and degradation by environmental stressors have limited the use of naked DNA, especially in subsurface environments. Encapsulated DNA tracers with a protective particle carrier alleviate the degradation problem. However, embedding DNA molecules into micro-/nanoparticle carriers (as well as subsequent DNA release) requires complex laboratory workflows. Additionally, the particle carriers may generate aggregation and filtration problems. Compared with typical environmental tracers, naturally occurring DNA tracer methods (i.e., microbial profiling) involve more complex sample processing workflows and produce high-dimensional data that are challenging to analyze (see Figure 2 and Section 4). However, the sample processing workflow can be standardized [30] and is automatable. Analysis of such high-dimensional data could readily benefit from the rapid development of bioinformatics and biostatistical tools. Once these challenges are resolved, microbial community data could provide improved constraints on the origin of a given fluid and reveal flowpath information with much higher resolution compared with traditional environmental tracers.
There remain questions and challenges that need to be resolved to improve and potentially expand the utility of each type of DNA-based tracer. For example, the adsorption and degradation characteristics of naked DNA tracers need to be quantified under a broader range of geological environments to better understand their applicability. Although encapsulated DNA has shown better stability than naked DNA in the presence of environmental stressors, its decreased recovery due to particle filtration/settling and the increased risk of agglomeration, especially under high salinity [52,73], need to be resolved to justify the added cost of particle fabrication. New types of micro-/nanoparticle carriers for DNA encapsulation are needed to improve the practicality of encapsulated DNA tracers [63,113]. With respect to naturally occurring DNA tracers, the use of barcoding and indicator microbial communities for reservoir characterization requires fundamental knowledge of the distribution, dynamics, and ecology of the subsurface microbiome. However, deep biosphere research is long hindered by sample inaccessibility and the high cost of drilling. Cross-disciplinary collaboration is therefore needed to integrate deep biosphere research with knowledge from other facets of geoscience, such as hydrogeology, to achieve thorough understanding of subsurface microbial processes [31]. Additionally, the experimental designs of published works can be adopted in future field studies in distinct geographical locations and geological formations to verify the robustness of the proposed tracer methods under a broader range of conditions and spatial scales.
7. Concluding Remarks
A thorough understanding of subsurface flowpaths and fluid migration is crucial to solving the many challenges in the fields of energy, water, and climate change. DNA-based tracer methods, facilitated by modern molecular techniques, complement and expand current subsurface characterization capabilities. Synthetic DNA tracer methods introduce artificially designed, non-preexisting sequences into a system for multiplexed artificial tracer testing to understand complex flow pathways. Naturally occurring DNA tracer methods, on the other hand, utilize the wealth of available microbial information in the subsurface and correlate microbial community patterns with flowpath structure or fluid migration. With increasingly powerful molecular techniques, carefully designed experiments, improved integration across fields of geoscience, and the development of new data interpretation tools, DNA-based tracer methods show potential for the mapping of the inaccessible subsurface in much more detail than allowed by conventional approaches.
Author Contributions
Conceptualization, Y.Z. and T.H.; Methodology, Y.Z. and T.H.; Formal analysis, Y.Z.; Writing—original draft preparation, Y.Z.; Writing—review and editing, T.H.; Funding acquisition, T.H. All authors have read and agreed to the published version of the manuscript.
Funding
This research was funded by the National Natural Science Foundation of China (grants 42141009, 41877207, and 42172277) and the Second Tibetan Plateau Scientific Expedition and Research Program (STEP) (grant 2019QZKK0904). Additional support was provided to the first author by the Shuimu Tsinghua Scholar Program at Tsinghua University (no. 2020SM014) and the Chinese International Postdoctoral Exchange Fellowship Program (Talent-Introduction Program; no. YJ20200102).
Institutional Review Board Statement
Not applicable.
Informed Consent Statement
Not applicable.
Data Availability Statement
Not applicable.
Conflicts of Interest
The authors declare no conflict of interest.
References
- Leibundgut, C.; Maloszewski, P.; Külls, C. Tracers in Hydrology; Wiley-Blackwell Chichester: Chichester, UK, 2009. [Google Scholar]
- Huang, T.; Pang, Z.; Yang, S.; Yin, L. Impact of Afforestation on Atmospheric Recharge to Groundwater in a Semiarid Area. J. Geophys. Res. Atmos. 2020, 125, e2019JD032185. [Google Scholar] [CrossRef]
- Medici, G.; Langman, J.B. Pathways and Estimate of Aquifer Recharge in a Flood Basalt Terrain; A Review from the South Fork Palouse River Basin (Columbia River Plateau, USA). Sustainability 2022, 14, 11349. [Google Scholar] [CrossRef]
- Li, J.; Pang, Z.; Tian, L.; Zhao, H.; Bai, G. Variations of Stable Isotopes in Daily Precipitation in a Monsoon Region. Water 2022, 14, 2891. [Google Scholar] [CrossRef]
- Kong, Y.; Pang, Z. A positive altitude gradient of isotopes in the precipitation over the Tianshan Mountains: Effects of moisture recycling and sub-cloud evaporation. J. Hydrol. 2016, 542, 222–230. [Google Scholar] [CrossRef]
- Huang, T.; Pang, Z. Changes in groundwater induced by water diversion in the Lower Tarim River, Xinjiang Uygur, NW China: Evidence from environmental isotopes and water chemistry. J. Hydrol. 2010, 387, 188–201. [Google Scholar] [CrossRef]
- Huang, T.; Li, Z.; Ma, B.; Long, Y. Tracing the Origin of Groundwater Nitrate in an Area Affected by Acid Rain Using Dual Isotopic Composition of Nitrate. Geofluids 2019, 2019, 1–12. [Google Scholar] [CrossRef] [Green Version]
- Koletzko, B.; Sauerwald, T.; Demmelmair, H. Safety of stable isotope use. Eur. J. Pediatr. 1997, 156, S12–S17. [Google Scholar] [CrossRef]
- Yurtsever, Y. An overview of conceptual model formulations for evaluation of isotope data in hydrological systems. IAHS Publ.-Ser. Proc. Rep.-Intern Assoc. Hydrol. Sci. 1995, 229, 3–12. [Google Scholar]
- Zhang, Y.; Dekas, A.E.; Hawkins, A.J.; Parada, A.E.; Gorbatenko, O.; Li, K.; Horne, R.N. Microbial Community Composition in Deep-Subsurface Reservoir Fluids Reveals Natural Interwell Connectivity. Water Resour. Res. 2020, 56, e2019WR025916. [Google Scholar] [CrossRef] [Green Version]
- Aydin, H.; Nagabandi, N.; Jamal, D.; Temizel, C. A Comprehensive Review of Tracer Test Applications in Geothermal Reservoirs. In Proceedings of the SPE Western Regional Meeting, Bakersfield, CA, USA, 26–28 April 2022. [Google Scholar]
- Ursell, L.; Hale, M.; Menendez, E.; Zimmerman, J.; Dombroski, B.; Hoover, K.; Everman, Z.; Liu, J.K.; Shojaei, H.; Percak-Dennett, E.M. High Resolution Fluid Tracking from Verticals and Laterals Using Subsurface DNA Diagnostics in the Permian Basin. In Proceedings of the Unconventional Resources Technology Conference, Denver, CO, USA, 22–24 July 2019; pp. 1291–1302. [Google Scholar]
- Horne, R.N. Geothermal Reinjection Experience in Japan. J. Pet. Technol. 1982, 34, 495–503. [Google Scholar] [CrossRef]
- Tayyib, D.; Al-Qasim, A.; Kokal, S.; Huseby, O. Overview of tracer applications in oil and gas industry. In Proceedings of the SPE Kuwait Oil & Gas Show and Conference, Mishref, Kuwait, 14 October 2019. [Google Scholar]
- Hawkins, A.J.; Becker, M.W.; Tester, J.W. Inert and Adsorptive Tracer Tests for Field Measurement of Flow-Wetted Surface Area. Water Resour. Res. 2018, 54, 5341–5358. [Google Scholar] [CrossRef]
- Hawkins, A.J.; Fox, D.B.; Koch, D.L.; Becker, M.W.; Tester, J.W. Predictive Inverse Model for Advective Heat Transfer in a Short-Circuited Fracture: Dimensional Analysis, Machine Learning, and Field Demonstration. Water Resour. Res. 2020, 56, e2020WR027065. [Google Scholar] [CrossRef]
- Suzuki, A.; Cui, J.; Zhang, Y.; Uehara, S.; Li, K.; Horne, R.N.; Ito, T. Experimental Study on Nano-/Microparticles Transport to Characterize Structures in Fractured Porous Media. Rock Mech. Rock Eng. 2020, 53, 4357–4365. [Google Scholar] [CrossRef]
- Ptak, T.; Piepenbrink, M.; Martac, E. Tracer tests for the investigation of heterogeneous porous media and stochastic modelling of flow and transport—A review of some recent developments. J. Hydrol. 2004, 294, 122–163. [Google Scholar] [CrossRef]
- McKay, L.D.; Sanford, W.E.; Strong, J.M. Field-Scale Migration of Colloidal Tracers in a Fractured Shale Saprolite. Ground Water 2000, 38, 139–147. [Google Scholar] [CrossRef]
- Medici, G.; West, L.J. Groundwater flow velocities in karst aquifers; importance of spatial observation scale and hydraulic testing for contaminant transport prediction. Env. Sci. Pollut. Res. Int. 2021, 28, 43050–43063. [Google Scholar] [CrossRef]
- Worthington, S.R. Diagnostic tests for conceptualizing transport in bedrock aquifers. J. Hydrol. 2015, 529, 365–372. [Google Scholar] [CrossRef]
- Worthington, S.R.; Ford, D. Self-organized permeability in carbonate aquifers. Groundwater 2009, 47, 326–336. [Google Scholar] [CrossRef]
- Goldscheider, N.; Meiman, J.; Pronk, M.; Smart, C. Tracer tests in karst hydrogeology and speleology. Int. J. Speleol. 2008, 37, 27–40. [Google Scholar] [CrossRef] [Green Version]
- Brauchler, R.; Böhm, G.; Leven, C.; Dietrich, P.; Sauter, M. A laboratory study of tracer tomography. Hydrogeol. J. 2013, 21, 1265–1274. [Google Scholar] [CrossRef]
- Kong, X.Z.; Deuber, C.A.; Kittila, A.; Somogyvari, M.; Mikutis, G.; Bayer, P.; Stark, W.J.; Saar, M.O. Tomographic Reservoir Imaging with DNA-Labeled Silica Nanotracers: The First Field Validation. Env. Sci. Technol. 2018, 52, 13681–13689. [Google Scholar] [CrossRef] [PubMed]
- Dahlke, H.E.; Williamson, A.G.; Georgakakos, C.; Leung, S.; Sharma, A.N.; Lyon, S.W.; Walter, M.T. Using concurrent DNA tracer injections to infer glacial flow pathways. Hydrol. Process. 2015, 29, 5257–5274. [Google Scholar] [CrossRef] [Green Version]
- Foppen, J.W.; Orup, C.; Adell, R.; Poulalion, V.; Uhlenbrook, S. Using multiple artificial DNA tracers in hydrology. Hydrol. Process. 2011, 25, 3101–3106. [Google Scholar] [CrossRef]
- Zhang, Y.; Hartung, M.B.; Hawkins, A.J.; Dekas, A.E.; Li, K.; Horne, R.N. DNA tracer transport through porous media—The effect of DNA length and adsorption. Water Resour. Res. 2021, 57, 2020WR028382. [Google Scholar] [CrossRef]
- Zhang, Y.; Manley, T.S.; Li, K.; Home, R.N. DNA-Encapsulated silica nanoparticle tracers for fracture characterization. In Proceedings of the 39th Geothermal Resources Council Annual Meeting—Geothermal: Always on, GRC 2015, Reno, NV, USA, 20–23 September 2015; pp. 967–974. [Google Scholar]
- Zhang, Y.; Dekas, A.E.; Hawkins, A.J.; Primo, J.C.; Gorbatenko, O.; Horne, R.N. Comparison of Microbial Profiling and Tracer Testing for the Characterization of Injector-Producer Interwell Connectivities. Water 2022, 14, 2921. [Google Scholar] [CrossRef]
- Zhang, Y.; Horne, R.N.; Hawkins, A.J.; Primo, J.C.; Gorbatenko, O.; Dekas, A.E. Geological activity shapes the microbiome in deep-subsurface aquifers by advection. Proc. Natl. Acad. Sci. USA 2022, 119, e2113985119. [Google Scholar] [CrossRef] [PubMed]
- Pang, L.; Robson, B.; Farkas, K.; McGill, E.; Varsani, A.; Gillot, L.; Li, J.; Abraham, P. Tracking effluent discharges in undisturbed stony soil and alluvial gravel aquifer using synthetic DNA tracers. Sci. Total Environ. 2017, 592, 144–152. [Google Scholar] [CrossRef] [PubMed]
- Lascelles, P.; Wan, J.; Robinson, L.; Allmon, R.; Evans, G.; Ursell, L.; Scott, N.M.; Chase, J.; Jablanovic, J.; Karimi, M. Applying Subsurface DNA Sequencing in Wolfcamp Shales, Midland Basin. In Proceedings of the SPE Hydraulic Fracturing Technology Conference and Exhibition, The Woodlands, TX, USA, 25 January 2017. [Google Scholar]
- Merino, N.; Jackson, T.R.; Campbell, J.H.; Kersting, A.B.; Sackett, J.; Fisher, J.C.; Bruckner, J.C.; Zavarin, M.; Hamilton-Brehm, S.D.; Moser, D.P. Subsurface microbial communities as a tool for characterizing regional-scale groundwater flow. Sci. Total Environ. 2022, 842, 156768. [Google Scholar] [CrossRef]
- Sawadogo, J.; Ursell, L.; Reeve, N.; Schlecht, M. Mature Fields-Optimizing Waterflood Management Through DNA Based Diagnostics. In Proceedings of the Abu Dhabi International Petroleum Exhibition & Conference, Abu Dhabi, UAE, 11 November 2020. [Google Scholar]
- Fukami, T. Historical contingency in community assembly: Integrating niches, species pools, and priority effects. Annu. Rev. Ecol. Evol. Syst. 2015, 46, 1–23. [Google Scholar] [CrossRef] [Green Version]
- Zhou, J.; Ning, D. Stochastic community assembly: Does it matter in microbial ecology? Microbiol. Mol. Biol. Rev. 2017, 81, e00002–e00017. [Google Scholar] [CrossRef] [Green Version]
- Schlecht, M.; Sawadogo, J.; Sadeghi, S.; Reeve, N.; Haggerty, M.; Liu, J.; Ursell, L. Improved Stacked Permian Development by Integrating DNA Diagnostics with Traditional Reservoir Analysis. In Proceedings of the SPE Annual Technical Conference and Exhibition, Virtual, 27 October 2020. [Google Scholar]
- Silva, J.; Ursell, L.; Percak-Dennett, E. Applying Subsurface DNA Diagnostics and Data Science in the Delaware Basin. In Proceedings of the SPE Hydraulic Fracturing Technology Conference and Exhibition, The Woodlands, TX, USA, 23–25 January 2018. [Google Scholar]
- Deepak, S.; Kottapalli, K.; Rakwal, R.; Oros, G.; Rangappa, K.; Iwahashi, H.; Masuo, Y.; Agrawal, G. Real-Time PCR: Revolutionizing Detection and Expression Analysis of Genes. Curr. Genom. 2007, 8, 234–251. [Google Scholar] [CrossRef] [PubMed]
- Wetterstrand, K.A. DNA Sequencing Costs: Data from the NHGRI Genome Sequencing Program (GSP). Available online: www.genome.gov/sequencingcostsdata (accessed on 23 September 2022).
- Metzker, M.L. Sequencing technologies—the next generation. Nat. Rev. Genet. 2010, 11, 31–46. [Google Scholar] [CrossRef] [PubMed] [Green Version]
- Dong, H.; Rothmel, R.; Onstott, T.C.; Fuller, M.E.; DeFlaun, M.F.; Streger, S.H.; Dunlap, R.; Fletcher, M. Simultaneous transport of two bacterial strains in intact cores from Oyster, Virginia: Biological effects and numerical modeling. Appl Env. Microbiol 2002, 68, 2120–2132. [Google Scholar] [CrossRef] [PubMed] [Green Version]
- Paruch, L.; Paruch, A.M. An Overview of Microbial Source Tracking Using Host-Specific Genetic Markers to Identify Origins of Fecal Contamination in Different Water Environments. Water 2022, 14, 1809. [Google Scholar] [CrossRef]
- Pang, L.; Farkas, K.; Bennett, G.; Varsani, A.; Easingwood, R.; Tilley, R.; Nowostawska, U.; Lin, S. Mimicking filtration and transport of rotavirus and adenovirus in sand media using DNA-labeled, protein-coated silica nanoparticles. Water Res. 2014, 62, 167–179. [Google Scholar] [CrossRef]
- Grass, R.N.; Schälchli, J.; Paunescu, D.; Soellner, J.O.; Kaegi, R.; Stark, W.J. Tracking trace amounts of submicrometer silica particles in wastewaters and activated sludge using silica-encapsulated DNA barcodes. Environ. Sci. Technol. Lett. 2014, 1, 484–489. [Google Scholar] [CrossRef]
- Sabir, I.H.; Torgersen, J.; Haldorsen, S.; Aleström, P. DNA tracers with information capacity and high detection sensitivity tested in groundwater studies. Hydrogeol. J. 1999, 7, 264–272. [Google Scholar] [CrossRef]
- McCluskey, J.; Flores, M.E.; Hinojosa, J.; Jafarzadeh, A.; Moghadam, S.V.; Phan, D.C.; Green, R.T.; Kapoor, V. Tracking Water with Synthetic DNA Tracers Using Droplet Digital PCR. ACS EST Water 2021, 1, 1177–1183. [Google Scholar] [CrossRef]
- Anderson, C.F.; Record Jr, M.T. Polyelectrolyte theories and their applications to DNA. Annu. Rev. Phys. Chem. 1982, 33, 191–222. [Google Scholar] [CrossRef]
- Cooper, G.M.; Hausman, R.E.; Hausman, R.E. The Cell: A Molecular Approach; ASM Press: Washington, DC, USA, 2007; Volume 4. [Google Scholar]
- Foppen, J.W.; Seopa, J.; Bakobie, N.; Bogaard, T. Development of a methodology for the application of synthetic DNA in stream tracer injection experiments. Water Resour. Res. 2013, 49, 5369–5380. [Google Scholar] [CrossRef] [Green Version]
- Pang, L.; Abeysekera, G.; Hanning, K.; Premaratne, A.; Robson, B.; Abraham, P.; Sutton, R.; Hanson, C.; Hadfield, J.; Heiligenthal, L.; et al. Water tracking in surface water, groundwater and soils using free and alginate-chitosan encapsulated synthetic DNA tracers. Water Res. 2020, 184, 116192. [Google Scholar] [CrossRef] [PubMed]
- Sabir, I.H.; Haldorsen, S.; Torgersen, J.; Alestrom, P.; Gaut, S.; Colleuille, H.; Pedersen, T.S.; Kitterod, N.-O.; Alestrom, P. Synthetic DNA tracers: Examples of their application in water related studies. IAHS Publ. (Int. Assoc. Hydrol. Sci. ) 2000, 262, 159–165. [Google Scholar]
- Aquilanti, L.; Clementi, F.; Landolfo, S.; Nanni, T.; Palpacelli, S.; Tazioli, A. A DNA tracer used in column tests for hydrogeology applications. Environ. Earth Sci. 2013, 70, 3143–3154. [Google Scholar] [CrossRef]
- Aquilanti, L.; Clementi, F.; Nanni, T.; Palpacelli, S.; Tazioli, A.; Vivalda, P.M. DNA and fluorescein tracer tests to study the recharge, groundwater flowpath and hydraulic contact of aquifers in the Umbria-Marche limestone ridge (central Apennines, Italy). Environ. Earth Sci. 2016, 75, 1–17. [Google Scholar] [CrossRef]
- Bovolin, V.; Cuomo, A.; Guida, D.; Foppen, J.W. Using artificial DNA as tracer in a bedrock river of the Middle Bussento Karst System (Cilento, Vallo Diano and Alburni European & Global Geopark, southern Italy). In Proceedings of the the 7th International Conference on Engineering Mechanics, Structures, Engineering Geology (EMESEG14), Salerno, Italy, 3–5 June 2014; pp. 105–112. [Google Scholar]
- Wang, C.; Liu, G.; McNew, C.P.; Volkmann, T.H.M.; Pangle, L.; Troch, P.A.; Lyon, S.W.; Kim, M.; Huo, Z.; Dahlke, H.E. Simulation of experimental synthetic DNA tracer transport through the vadose zone. Water Res. 2022, 223, 119009. [Google Scholar] [CrossRef]
- Viswanathan, H.S.; Ajo-Franklin, J.; Birkholzer, J.T.; Carey, J.W.; Guglielmi, Y.; Hyman, J.; Karra, S.; Pyrak-Nolte, L.; Rajaram, H.; Srinivasan, G. From fluid flow to coupled processes in fractured rock: Recent advances and new frontiers. Rev. Geophys. 2022, 60, e2021RG000744. [Google Scholar] [CrossRef]
- Huang, T.; Li, Z.; Long, Y.; Zhang, F.; Pang, Z. Role of desorption-adsorption and ion exchange in isotopic and chemical (Li, B, and Sr) evolution of water following water–rock interaction. J. Hydrol. 2022, 610, 127800. [Google Scholar] [CrossRef]
- Huang, T.; Li, Z.; Mayer, B.; Nightingale, M.; Li, X.; Li, G.; Long, Y.; Pang, Z. Identification of Geochemical Processes During Hydraulic Fracturing of a Shale Gas Reservoir: A Controlled Field and Laboratory Water-Rock Interaction Experiment. Geophys. Res. Lett. 2020, 47, e2020GL090420. [Google Scholar] [CrossRef]
- Pang, L.; Heiligenthal, L.; Premaratne, A.; Hanning, K.R.; Abraham, P.; Sutton, R.; Hadfield, J.; Billington, C. Degradation and adsorption of synthetic DNA water tracers in environmental matrices. Sci Total Environ. 2022, 844, 157146. [Google Scholar] [CrossRef]
- Zhang, Y.; Zeng, Z.; Li, K.; Horne, R. DNA Barcoding for Fractured Reservoir Analysis—An Initial Investigation. In Proceedings of the 42nd Workshop on Geothermal Reservoir Engineering, Stanford University, Stanford, CA, USA, 13–15 February 2017. [Google Scholar]
- Alaskar, M.; Ames, M.; Liu, C.; Li, K.; Horne, R. Temperature nanotracers for fractured reservoirs characterization. J. Pet. Sci. Eng. 2015, 127, 212–228. [Google Scholar] [CrossRef] [Green Version]
- Zhang, Y.; Manley, T.S.; Li, K.; Horne, R. Uniquely Identifiable DNA-Embedded Silica Nanotracer for Fractured Reservoir Characterization. In Proceedings of the 41st Workshop on Geothermal Reservoir Engineering, Stanford University, Stanford, CA, USA, 22–24 February 2016. [Google Scholar]
- Mikutis, G.; Deuber, C.A.; Schmid, L.; Kittila, A.; Lobsiger, N.; Puddu, M.; Asgeirsson, D.O.; Grass, R.N.; Saar, M.O.; Stark, W.J. Silica-Encapsulated DNA-Based Tracers for Aquifer Characterization. Environ. Sci. Technol. 2018, 52, 12142–12152. [Google Scholar] [CrossRef] [PubMed]
- Kittilä, A.; Jalali, M.R.; Evans, K.F.; Willmann, M.; Saar, M.O.; Kong, X.Z. Field Comparison of DNA-Labeled Nanoparticle and Solute Tracer Transport in a Fractured Crystalline Rock. Water Resour. Res. 2019, 55, 6577–6595. [Google Scholar] [CrossRef]
- Tang, Y.; Foppen, J.W.; Bogaard, T.A. Transport of silica encapsulated DNA microparticles in controlled instantaneous injection open channel experiments. J. Contam. Hydrol. 2021, 242, 103880. [Google Scholar] [CrossRef] [PubMed]
- Chakraborty, S.; Foppen, J.W.; Schijven, J.F. Effect of concentration of silica encapsulated ds-DNA colloidal microparticles on their transport through saturated porous media. Colloids Surf. A Physicochem. Eng. Asp. 2022, 651, 129625. [Google Scholar] [CrossRef]
- Kianfar, B.; Tian, J.; Rozemeijer, J.; van der Zaan, B.; Bogaard, T.A.; Foppen, J.W. Transport characteristics of DNA-tagged silica colloids as a colloidal tracer in saturated sand columns; role of solution chemistry, flow velocity, and sand grain size. J. Contam. Hydrol. 2022, 246, 103954. [Google Scholar] [CrossRef]
- Sharma, A.N.; Luo, D.; Walter, M.T. Hydrological tracers using nanobiotechnology: Proof of concept. Environ. Sci. Technol. 2012, 46, 8928–8936. [Google Scholar] [CrossRef]
- Wang, C.; McNew, C.P.; Lyon, S.W.; Walter, M.T.; Volkman, T.H.M.; Abramson, N.; Sengupta, A.; Wang, Y.; Meira Neto, A.A.; Pangle, L.; et al. Particle tracer transport in a sloping soil lysimeter under periodic, steady state conditions. J. Hydrol. 2019, 569, 61–76. [Google Scholar] [CrossRef] [Green Version]
- Liao, R.; Zhang, J.; Li, T.; Luo, D.; Yang, D. Biopolymer/plasmid DNA microspheres as tracers for multiplexed hydrological investigation. Chem. Eng. J. 2020, 401, 126035. [Google Scholar] [CrossRef]
- McNew, C.P.; Wang, C.; Walter, M.T.; Dahlke, H.E. Fabrication, detection, and analysis of DNA-labeled PLGA particles for environmental transport studies. J. Colloid. Interface Sci. 2018, 526, 207–219. [Google Scholar] [CrossRef] [Green Version]
- Georgakakos, C.B.; Richards, P.L.; Walter, M.T. Tracing Septic Pollution Sources Using Synthetic DNA Tracers: Proof of Concept. Air Soil Water Res. 2019, 12. [Google Scholar] [CrossRef] [Green Version]
- Paunescu, D.; Puddu, M.; Soellner, J.O.; Stoessel, P.R.; Grass, R.N. Reversible DNA encapsulation in silica to produce ROS-resistant and heat-resistant synthetic DNA ‘fossils’. Nat. Protoc. 2013, 8, 2440–2448. [Google Scholar] [CrossRef] [PubMed]
- Alexander, G.B.; Heston, W.M.; Iler, R.K. The Solubility of Amorphous Silica in Water. J. Phys. Chem. 1954, 58, 453–455. [Google Scholar] [CrossRef]
- Liao, H.; Yu, K.; Duan, Y.; Ning, Z.; Li, B.; He, L.; Liu, C. Profiling microbial communities in a watershed undergoing intensive anthropogenic activities. Sci. Total Environ. 2019, 647, 1137–1147. [Google Scholar] [CrossRef] [PubMed]
- Semler, A.C.; Fortney, J.L.; Fulweiler, R.W.; Dekas, A.E. Cold Seeps on the Passive Northern U.S. Atlantic Margin Host Globally Representative Members of the Seep Microbiome with Locally Dominant Strains of Archaea. Appl Environ. Microbiol. 2022, 88, e0046822. [Google Scholar] [CrossRef] [PubMed]
- Suzuki, A.; Hashida, T.; Li, K.; Horne, R.N. Experimental tests of truncated diffusion in fault damage zones. Water Resour. Res. 2016, 52, 8578–8589. [Google Scholar] [CrossRef]
- Nguyen, L.H.; Holmes, S. Ten quick tips for effective dimensionality reduction. PLoS Comput. Biol. 2019, 15, e1006907. [Google Scholar] [CrossRef] [Green Version]
- Callahan, B.J.; Sankaran, K.; Fukuyama, J.A.; McMurdie, P.J.; Holmes, S.P. Bioconductor Workflow for Microbiome Data Analysis: From raw reads to community analyses. F1000Res 2016, 5, 1492. [Google Scholar] [CrossRef]
- Knights, D.; Kuczynski, J.; Charlson, E.S.; Zaneveld, J.; Mozer, M.C.; Collman, R.G.; Bushman, F.D.; Knight, R.; Kelley, S.T. Bayesian community-wide culture-independent microbial source tracking. Nat. Methods 2011, 8, 761–763. [Google Scholar] [CrossRef] [Green Version]
- Griebler, C.; Lueders, T. Microbial biodiversity in groundwater ecosystems. Freshw. Biol. 2009, 54, 649–677. [Google Scholar] [CrossRef]
- Hubalek, V.; Wu, X.; Eiler, A.; Buck, M.; Heim, C.; Dopson, M.; Bertilsson, S.; Ionescu, D. Connectivity to the surface determines diversity patterns in subsurface aquifers of the Fennoscandian shield. ISME J. 2016, 10, 2447–2458. [Google Scholar] [CrossRef]
- Gringarten, E.; Deutsch, C. Methodology for variogram interpretation and modeling for improved reservoir characterization. In Proceedings of the Spe annual technical conference and exhibition, Houston, TX, USA, 3–6 October 1999. [Google Scholar]
- Mukerji, T.; Avseth, P.; Mavko, G.; Takahashi, I.; González, E.F. Statistical rock physics: Combining rock physics, information theory, and geostatistics to reduce uncertainty in seismic reservoir characterization. Lead. Edge 2001, 20, 313–319. [Google Scholar] [CrossRef]
- Percak-Dennett, E.; Liu, J.; Shojaei, H.; Luke, U.; Thomas, I. High Resolution Dynamic Drainage Height Estimations using Subsurface DNA Diagnostics. In Proceedings of the SPE Western Regional Meeting, San Jose, CA, USA, 24 April 2019. [Google Scholar]
- Sawadogo, J.; Haggerty, M.; Mallory, C.; Huchton, J.; DeAngelis, W.; Price, C. Impact of Completion Design and Interwell Communication on Well Performance in Full Section Development: A STACK Case Study Using DNA Based Diagnostics. In Proceedings of the SPE Annual Technical Conference and Exhibition, Virtual, 27 October 2020. [Google Scholar]
- Kneafsey, T.J.; Blankenship, D.; Dobson, P.F.; Morris, J.P.; White, M.D.; Fu, P.; Schwering, P.C.; Ajo-Franklin, J.B.; Huang, L.; Schoenball, M.; et al. The EGS Collab Project -Learnings from Experiment 1. In Proceedings of the 45th Workshop on Geothermal Reservoir Engineering, Stanford University, Stanford, CA, USA, 10–12 February 2020. [Google Scholar]
- Fu, P.; Schoenball, M.; Ajo-Franklin, J.B.; Chai, C.; Maceira, M.; Morris, J.P.; Wu, H.; Knox, H.; Schwering, P.C.; White, M.D.; et al. Close Observation of Hydraulic Fracturing at EGS Collab Experiment 1: Fracture Trajectory, Microseismic Interpretations, and the Role of Natural Fractures. J. Geophys. Res. Solid Earth 2021, 126, e2020JB020840. [Google Scholar] [CrossRef]
- Wu, H.; Fu, P.; Frone, Z.; White, M.D.; Ajo-Franklin, J.B.; Morris, J.P.; Knox, H.A.; Schwering, P.C.; Strickland, C.E.; Roberts, B.Q.; et al. Modeling heat transport processes in enhanced geothermal systems: A validation study from EGS Collab Experiment 1. Geothermics 2021, 97, 102254. [Google Scholar] [CrossRef]
- Wu, H.; Fu, P.; Morris, J.P.; Mattson, E.D.; Neupane, G.; Smith, M.M.; Hawkins, A.J.; Zhang, Y.; Kneafsey, T. Characterization of flow and transport in a fracture network at the EGS Collab field experiment through stochastic modeling of tracer recovery. J. Hydrol. 2021, 593, 125888. [Google Scholar] [CrossRef]
- Gupta, I.; Rai, C.; Devegowda, D.; Sondergeld, C.H. Fracture hits in unconventional reservoirs: A critical review. SPE J. 2021, 26, 412–434. [Google Scholar] [CrossRef]
- Gao, P.K.; Li, G.Q.; Tian, H.M.; Wang, Y.S.; Sun, H.W.; Ma, T. Differences in microbial community composition between injection and production water samples of water flooding petroleum reservoirs. Biogeosciences 2015, 12, 3403–3414. [Google Scholar] [CrossRef] [Green Version]
- Mouser, P.J.; Rizzo, D.M.; Druschel, G.K.; Morales, S.E.; Hayden, N.; O’Grady, P.; Stevens, L. Enhanced detection of groundwater contamination from a leaking waste disposal site by microbial community profiles. Water Resour. Res. 2010, 46, 2010wr009459. [Google Scholar] [CrossRef]
- McElhinney, J.; Catacutan, M.K.; Mawart, A.; Hasan, A.; Dias, J. Interfacing Machine Learning and Microbial Omics: A Promising Means to Address Environmental Challenges. Front. Microbiol. 2022, 13, 851450. [Google Scholar] [CrossRef]
- Hicks, N.; Vik, U.; Taylor, P.; Ladoukakis, E.; Park, J.; Kolisis, F.; Jakobsen, K.S. Using Prokaryotes for Carbon Capture Storage. Trends Biotechnol. 2017, 35, 22–32. [Google Scholar] [CrossRef] [Green Version]
- Chiţu, A.G.; Zijp, M.H.; Zwaan, J. A novel exploration technique using the microbial fingerprint of shallow sediment to detect hydrocarbon microseepage and predict hydrocarbon charge—An Argentinian case study. Interpretation 2022, 10, SB77–SB92. [Google Scholar] [CrossRef]
- Zijp, M.; Mallinson, T.; Zwaan, J.; Chitu, A.; David, P. Eagle Ford and Bakken productivity prediction using soil microbial fingerprinting and machine learning. In Proceedings of the SPE/AAPG/SEG Unconventional Resources Technology Conference, Online, 16–18 November 2021. [Google Scholar]
- Te Stroet, C.; Zwaan, J.; de Jager, G.; Montijn, R.; Schuren, F. Predicting sweet spots in shale plays by DNA fingerprinting and machine learning. In Proceedings of the SPE/AAPG/SEG Unconventional Resources Technology Conference, Austin, TX, USA, 24–26 July 2017. [Google Scholar]
- Graziani, S.; Beaubien, S.E.; Ciotoli, G.; Bigi, S. Development and testing of a rapid, sensitive, high-resolution tool to improve mapping of CO2 leakage at the ground surface. Appl. Geochem. 2022, 145, 105424. [Google Scholar] [CrossRef]
- Fernández-Montiel, I.; Pedescoll, A.; Bécares, E. Microbial communities in a range of carbon dioxide fluxes from a natural volcanic vent in Campo de Calatrava, Spain. Int. J. Greenh. Gas Control 2016, 50, 70–79. [Google Scholar] [CrossRef]
- Sáenz de Miera, L.E.; Arroyo, P.; de Luis Calabuig, E.; Falagán, J.; Ansola, G. High-throughput sequencing of 16S RNA genes of soil bacterial communities from a naturally occurring CO2 gas vent. Int. J. Greenh. Gas Control 2014, 29, 176–184. [Google Scholar] [CrossRef]
- Gulliver, D.M.; Lowry, G.V.; Gregory, K.B. Effect of CO2(aq) Exposure on a Freshwater Aquifer Microbial Community from Simulated Geologic Carbon Storage Leakage. Environ. Sci. Technol. Lett. 2014, 1, 479–483. [Google Scholar] [CrossRef]
- Gulliver, D.M.; Lowry, G.V.; Gregory, K.B. Comparative study of effects of CO2 concentration and pH on microbial communities from a saline aquifer, a depleted oil reservoir, and a freshwater aquifer. Environ. Eng. Sci. 2016, 33, 806–816. [Google Scholar] [CrossRef]
- Tait, K.; Stahl, H.; Taylor, P.; Widdicombe, S. Rapid response of the active microbial community to CO2 exposure from a controlled sub-seabed CO2 leak in Ardmucknish Bay (Oban, Scotland). Int. J. Greenh. Gas Control 2015, 38, 171–181. [Google Scholar] [CrossRef]
- Fernández-Montiel, I.; Touceda, M.; Pedescoll, A.; Gabilondo, R.; Prieto-Fernández, A.; Bécares, E. Short-term effects of simulated below-ground carbon dioxide leakage on a soil microbial community. Int. J. Greenh. Gas Control 2015, 36, 51–59. [Google Scholar] [CrossRef]
- Chen, F.; Yang, Y.; Ma, Y.; Hou, H.; Zhang, S.; Ma, J. Effects of CO2 leakage on soil bacterial communities from simulated CO2-EOR areas. Environ. Sci. Process. Impacts 2016, 18, 547–554. [Google Scholar] [CrossRef]
- Trautz, R.C.; Pugh, J.D.; Varadharajan, C.; Zheng, L.; Bianchi, M.; Nico, P.S.; Spycher, N.F.; Newell, D.L.; Esposito, R.A.; Wu, Y.; et al. Effect of dissolved CO2 on a shallow groundwater system: A controlled release field experiment. Env. Sci Technol 2013, 47, 298–305. [Google Scholar] [CrossRef]
- Taylor, P.; Stahl, H.; Vardy, M.E.; Bull, J.M.; Akhurst, M.; Hauton, C.; James, R.H.; Lichtschlag, A.; Long, D.; Aleynik, D.; et al. A novel sub-seabed CO2 release experiment informing monitoring and impact assessment for geological carbon storage. Int. J. Greenh. Gas Control 2015, 38, 3–17. [Google Scholar] [CrossRef]
- Ma, J.; Zhang, W.; Zhang, S.; Zhu, Q.; Feng, Q.; Chen, F. Short-term effects of CO2 leakage on the soil bacterial community in a simulated gas leakage scenario. PeerJ 2017, 5, e4024. [Google Scholar] [CrossRef] [PubMed] [Green Version]
- Yu, T.; Chen, Y. Effects of elevated carbon dioxide on environmental microbes and its mechanisms: A review. Sci. Total Environ. 2019, 655, 865–879. [Google Scholar] [CrossRef] [PubMed]
- Sharma, A.; Foppen, J.W.; Banerjee, A.; Sawssen, S.; Bachhar, N.; Peddis, D.; Bandyopadhyay, S. Magnetic Nanoparticles to Unique DNA Tracers: Effect of Functionalization on Physico-chemical Properties. Nanoscale Res. Lett. 2021, 16, 24. [Google Scholar] [CrossRef] [PubMed]
Figure 1.
Schematic illustration of synthetic DNA-based tracer methods. The introduced DNA tracer can be either in its free from (naked DNA) or embedded into particle carriers (encapsulated DNA). Data are presented in the form of a breakthrough curve and interpreted in a similar manner to classic artificial tracer data.

Figure 2.
Schematic illustration of naturally occurring DNA-based tracer methods. The composition of the entire microbial communities inhabiting reservoir fluids (presence/absence and relative abundance based on the 16S rRNA marker gene sequences) can be utilized, with the help of statistical methods, to correlate microbial community patterns with the structure of subsurface flow conduits.

Figure 3.
Schematic illustration of the use of indicator microbial communities as a naturally occurring DNA-based “tracer” for CO2 front/leakage monitoring at carbon storage sites.
Figure 3.
Schematic illustration of the use of indicator microbial communities as a naturally occurring DNA-based “tracer” for CO2 front/leakage monitoring at carbon storage sites.

Table 2.
Summary of the literature on the use of DNA encapsulated into micro-/nanoparticles as hydrological/reservoir tracers. Studies are grouped according to the first author and are presented in chronological order.
Table 2.
Summary of the literature on the use of DNA encapsulated into micro-/nanoparticles as hydrological/reservoir tracers. Studies are grouped according to the first author and are presented in chronological order.
| Authors | Year (Country a) | Type of Particle Carrier | Average Particle Size | Solvent for DNA Release | Medium | Scale b | Details |
|---|---|---|---|---|---|---|---|
| Sharma, A.N., et al. | 2012 [70] (USA) | Polylactic acid (PLA) microspheres | 400−500 nm | Chloroform | 1) Column packed with quartz sand; 2) asphalt surface with manually established stream; 3) a stream. | 1) Lab, L = 30.5 cm, D = 2.54 cm; 2) field, 1 m; 3) field, 10 m. | Proof-of-concept experiments; particles were synthesized using the double emulsion method; iron oxide nanoparticles were embedded into the PLA microspheres for magnetic separation. The DNA microtracers exhibited advective–dispersive behavior, with recovery rates similar to those of a conservative tracer. |
| Dahlke, H.E., et al. | 2015 [26] (Sweden) | PLA microspheres | NM | Methylene chloride | Subglacial drainage system. | Field, 1 km | Six DNA microtracers were injected into moulins/crevasses, and breakthrough curves were measured along proglacial streams. Recovery: 99% for uranine and 15–66% for DNA microtracers. |
| Alaskar, M., et al. | 2015 [63] (USA) | Silica (SiO2) nanoparticles | 175 nm | Buffered hydrofluoric acid (HF) | Column packed with quartz sand (150–180 μm). | Lab, L = 30.48 cm, D = 0.46 cm. | Concept proposal in the context of geothermal reservoir characterization; a high-temperature (up to 180 °C) column test on the DNA nanotracer showed particle dissolution and aggregation in the effluent. |
| Zhang, Y., et al. | 2015 [29] (USA) | Silica nanoparticles | 160 nm | Buffered HF | Column packed with quartz sand. | Lab, <1 m. | Concept proposal; DNA nanotracers were synthesized according to the literature, with agglomeration observed. A preliminary column test showed successful but limited particle breakthrough. |
| 2016 [64] (USA) | Silica nanoparticles | 160 nm | Buffered HF | Column packed with quartz sand. | Lab, <1 m. | Injection test on a self-synthesized DNA nanotracer. Particles were retained in the sand column after transport; DNA could not be quantified in the effluent particles. | |
| Mikutis, G., et al. | 2018 [65] (Switzerland) | Silica nanoparticles | 159 nm, 410 nm, 848 nm | Buffered HF | 1) Column packed with sand (0.20–0.63 mm); 2) unconsolidated aquifer with sandy gravels. | 1) Lab, L = 29.6 cm, D = 6.3 cm; 2) field, 1 m (<10 m deep). | DNA nanotracers had earlier and sharper breakthrough than uranine in all cases; 159, 410, and 848 nm particles were compared in the column test; transport velocity increased, and recovery (39.3–85.9%) decreased with increasing particle size. The 159 nm nanotracer was tested in the field, with peak concentrations of 10−4–10−7 that of the injection concentration; recovery NM. |
| Kong, X., et al. | 2018 [25] (Switzerland) | Silica nanoparticles | ~150 nm | Buffered HF | Unconsolidated aquifer with sandy gravels. | Field, 1 m (<10 m deep). | Multilevel DNA nanotracer injection tests; three unique DNA nanotracers were injected, one of which successfully generated breakthrough and recovery data (recovery was larger than that of the sulforhodamine B reference tracer); tomographic inversion yielded a hydraulic conductivity tomogram. |
| McNew C.P., et al. | 2018 [73] (USA) | Poly(lactic-co-glycolic acid) (PLGA) microspheres | ~300 nm | Dichloromethane | 1) A hillslope (soil); 2) batch test with deionized, NaCl, and stream water. | 1) Field, 1 m (0–65 cm deep); 2) lab. | Protocols were optimized for particle preparation and quantification; field tests demonstrated lack of signal interference among unique DNA tracers or with background environmental DNA; batch tests showed temperature-dependent biodegradability of the PLGA particles. |
| Kittilä, A., et al. | 2019 [66] (Switzerland) | Silica nanoparticles | 166 nm | Buffered HF | Fractured crystalline rock. | Field, 10 m (400–500 m overburden). | Seven unique DNA nanotracers were tested, along with solute dye tracers; breakthrough curves were obtained and analyzed by temporal moments. DNA nanotracers had smaller mean residence times, lower mass recoveries, less dispersion, and lower swept volume than the dye tracers and tended to settle, especially at low flow velocities. |
| Wang, C., et al. | 2019 [71] (USA) | PLA microspheres | ~900 nm | Dichloromethane | Sloped lysimeter packed with crushed basaltic tephra (0.17% <2 μm, 13.5% 2–50 μm, 86.5% > 50 μm) | Lab, L = 2 m, W = 0.5 m, H = 1 m. | Four unique DNA microtracers were injected sequentially and in parallel. Complex interplay was observed between fast transport (e.g., size exclusion effect) and slow retention–release (e.g., straining and adsorption) mechanisms; recovery: 97.78% for deuterium and 1–2% for DNA microtracers. |
| Georgakakos C.B., et al. | 2019 [74] (USA) | PLGA microspheres | NM | Dichloromethane | 1) Silt loam underlain by clay; 2) gravel loam and stream. | 1) Field, 10 m; 2) field, 100 m. | Proof-of-concept experiments confirming the applicability of DNA microtracers in septic systems at both the local scale and watershed scale. |
| Pang, L., et al. | 2020 [52] (New Zealand) | Alginate-chitosan microparticles | 312 nm | Chelex® treatment and 5 min heating at 95°C | 1) Surface stream; 2) alluvial gravel aquifer; 3) soil lysimeter. | 1) Field, 1 km; 2) field, 10 m (16-m below ground); 3) lab, L = 0.7 m, D = 0.5 m. | DNA microtracers were compared with free DNA in flow experiments; encapsulated DNA had greater recoveries than free DNA in surface water experiments but lower recoveries in the gravel aquifer. |
| Liao, R., et al. | 2020 [72] (China) | PLA microspheres | 246 μm | NM | Open channel with tap water. | Lab, L = 5 m, W = 0.6 m, H = 1 m. | Magnetite nanoparticles attached with plasmid DNA (3500–6500 bp) were encapsulated; microspheres were buoyant on the water surface; DNA was detected at the outlet. |
| Tang, Y., et al. | 2021 [67] (Netherlands) | Silica nanoparticles | 237–299 nm | Buffered HF | Open channel with six types of environmental water. | Lab, L = 20 cm, W = 10 cm, H = 3 cm. | DNA nanotracers had similar hydrodynamic dispersion compared with NaCl under surface water conditions but more scattered breakthrough curve datapoints. |
| Chakraborty, S., et al. | 2022 [68] (Netherlands) | Silica nanoparticles | 280–300 nm | Buffered HF | Column packed with acid-washed quartz sand (~400 μm). | Lab, L = 15 cm, D = 2.1 cm. | A DNA nanotracer with varying particle concentrations was flowed through a saturated column and modeled; particle retention depended on the injection concentration; the kinetic attachment rate coefficient decreased with increasing injection concentration. |
| Kianfar, B., et al. | 2022 [69] (Netherlands) | Silica nanoparticles | ~270 nm | Buffered HF | Column packed with acid-washed quartz sand (1–1.4 mm) or silver sand (0.5–0.63 mm) | Lab, L = 6.5 cm, D = 2.5 cm. | The effect of solution chemistry, flow velocity, and sand grain size on DNA nanotracer transport was investigated. Higher ionic strength enhanced particle sticking after collision with sand grains; the DNA nanotracer was most applicable for coarse-grained aquifers with high flow rates. |
a Country where the experiments were conducted or, if not mentioned, of the first-author institution. Underline indicates that the study tested synthetic DNA tracers both in their free form and encapsulated in micro/nanoparticle carriers. b “Scale” describes the approximate tracer transport distance in an experiment. For field tests, the “scale” of each study is approximated as “1 m” for 1–9 m, “10 m” for 1–99 m, “100 m” for 1–999 m, etc. Abbreviations: NM, not mentioned; L, length; D, inner diameter; W, width; H, height (depth).
Table 3.
Summary of the literature on the use of indigenous microbial communities as naturally occurring hydrogeological/reservoir tracers. Studies are grouped according to the first author and presented in chronological order.
Table 3.
Summary of the literature on the use of indigenous microbial communities as naturally occurring hydrogeological/reservoir tracers. Studies are grouped according to the first author and presented in chronological order.
| Authors | Year, Reference (Country a) | Reservoir Type | Microbiome Type | Scale b | Primary Data Interpretation Method | Proposed Utility | Validation of Proposed Utility |
|---|---|---|---|---|---|---|---|
| Lascelles, P., et al. | 2017 [33] (USA) | Hydrocarbon (unconventional) | Drill cuttings and produced oil. | Field, 1 km. | “Percentage contribution of DNA signature”. | Effective drainage height; well-to-well communication; production contribution by fracturing stage. | Blinded analyses; well log data. |
| Silva, J., et al. | 2018 [39] (USA) | Hydrocarbon (unconventional) | Drill cuttings and produced hydrocarbon/water. | Field, 33 wells in the Delaware Basin. | Composition; ordination c; Bayesian mixture modeling. | Production contribution by formation. | NM. |
| Percak-Dennett, E., et al. | 2019 [87] (USA) | Hydrocarbon (unconventional) | Drill cuttings and produced fluids. | Field, >1 km (to a depth of >3 km). | Composition; “percentage contribution”; Bayesian mixture modeling. | Production contribution by formation. | Blinded analyses; tracer, geochemistry, and microseismic data. |
| Ursell, L., et al. | 2019 [12] (USA) | Hydrocarbon (unconventional) | Drill cuttings and produced fluids. | Field, >1 km (to a depth of >3 km). | Bayesian mixture modeling. | Contribution of fracturing fluid to produced fluids; effective drainage height; production contribution by lateral stage. | Oil production rate; oil-based chemical tracers. |
| Zhang, Y., et al. | 2020 [10] (USA) | Groundwater | Groundwater (0.2 and 0.02 μm d). | Field, 10 m (1478 m deep). | Composition; ordination. | Indicator for the natural connectivities among artesian wells. | Fracture model informed by core log and sewer camera footages. |
| 2022 [31] (USA) | Groundwater | Groundwater (0.2 μm). | Field, 10 m (1478 m deep). | Composition; ordination; ecological modeling. | Monitoring of changes in a permeable fracture network over time, e.g., fracture opening/closure. | Data-informed fracture network model; conservative tracer and flow rate data; ecological modeling results. | |
| 2022 [30] (USA) | Groundwater | Groundwater (0.2 μm). | Field, 10 m (1478 m deep). | Percentage of injectate ASVs detected in each producer. | Indicator of relative connectivities across several producers with an injector. | Conservative tracer data (recoveries). | |
| Schlecht, M., et al. | 2020 [38] (USA) | Hydrocarbon (unconventional) | Drill cuttings, cores, injected fluids, and produced fluids. | Field, >1 km (to a depth of >3 km). | Composition; Bayesian mixture modeling. | Effective drainage height; well-to-well communication; fracture height and half length; production contribution by formation. | Petrophysical logs (gamma ray, effective porosity, and water saturation); geochemical data. |
| Sawadogo, J., et al. | 2020 [88] (USA) | Hydrocarbon (unconventional) | Drill cuttings and produced fluids. | Field, >1 km (to a depth of >2 km). | Composition; Bayesian mixture modeling. | Production contribution by formation. | Oil and water tracer data. |
| 2020 [35] (USA) | Hydrocarbon (conventional) | Injected fluids (for waterflooding) and produced fluids. | Field, 1 km (to a depth of 1 km). | Composition; ordination; abundance of injector DNA markers in the produced fluids. | Injector–producer communication; waterflood monitoring. | Interference test results and historical field observations. | |
| Merino, N., et al. | 2022 [34] (USA) | Groundwater | Groundwater (0.2 μm). | Field, 100 km. | Ordination; network analysis; ecological modeling. | Tracing of regional-scale groundwater flow. | Prior knowledge of regional groundwater flowpaths; ecological modeling results. |
a Country where the experiments were conducted or, if not mentioned, of the first-author institution. b Approximated as “1 m” for 1–9 m, “10 m” for 10–99 m, “100 m” for 100–999 m, etc. For studies without detailed sampling methods described, the scale is estimated based on side information. c Ordination methods include principal coordinate analysis (PCoA), nonmetric multidimensional scaling (NMDS), canonical correspondence analysis (CCA), etc. [80]. d Pore size of the filter membrane used to capture microbial cells. Abbreviations: NM, not mentioned.
Publisher’s Note: MDPI stays neutral with regard to jurisdictional claims in published maps and institutional affiliations. |
© 2022 by the authors. Licensee MDPI, Basel, Switzerland. This article is an open access article distributed under the terms and conditions of the Creative Commons Attribution (CC BY) license (https://creativecommons.org/licenses/by/4.0/).
Share and Cite
MDPI and ACS Style
Zhang, Y.; Huang, T. DNA-Based Tracers for the Characterization of Hydrogeological Systems—Recent Advances and New Frontiers. Water 2022, 14, 3545. https://doi.org/10.3390/w14213545
AMA Style
Zhang Y, Huang T. DNA-Based Tracers for the Characterization of Hydrogeological Systems—Recent Advances and New Frontiers. Water. 2022; 14(21):3545. https://doi.org/10.3390/w14213545
Chicago/Turabian StyleZhang, Yuran, and Tianming Huang. 2022. "DNA-Based Tracers for the Characterization of Hydrogeological Systems—Recent Advances and New Frontiers" Water 14, no. 21: 3545. https://doi.org/10.3390/w14213545
Note that from the first issue of 2016, this journal uses article numbers instead of page numbers. See further details here.