Article

Aquatic Macrophytes Shape the Foraging Efficiency, Trophic Niche Breadth, and Overlap among Small Fish in a Neotropical River

by
Bárbara Angélio Quirino
1,*,
Sidinei Magela Thomaz
1,
Erik Jeppesen
2,3,4,5,
Martin Søndergaard
2,3,
Mário Sérgio Dainez-Filho
1 and
Rosemara Fugi
1
1
Graduate Program in Ecology of Inland Water Ecosystems, Department of Biology, Universidade Estadual de Maringá, Maringá 87020-900, Brazil
2
Department of Ecoscience, Aarhus University, 6000 Aarhus, Denmark
3
Sino-Danish Centre for Education and Research, Beijing 100039, China
4
Limnology Laboratory, Department of Biological Sciences and Centre for Ecosystem Research and Implementation, Middle East Technical University, Ankara 06800, Turkey
5
Institute of Marine Sciences, Middle East Technical University, Erdemli-Mersin 33731, Turkey
*
Author to whom correspondence should be addressed.
Water 2022, 14(21), 3543; https://doi.org/10.3390/w14213543
Submission received: 6 October 2022 / Revised: 31 October 2022 / Accepted: 2 November 2022 / Published: 4 November 2022

Abstract

:
Aquatic macrophytes are generally recognized to influence fish–prey interactions. We assessed how fish consume particular foods, and how their foraging efficiency, trophic niche breadth, and niche overlap respond to gradients of macrophyte density and diversity. We sampled fish and macrophytes in 30 stands distributed over a 13.7 km stretch of the littoral zone of a river in Brazil. By generating generalized linear models, we showed that increasing macrophyte density (from 366 to 7066 g DW m−3) favored herbivory and fish foraging efficiency. Beta regressions showed that fish reduced their trophic niche breadth along the gradient of macrophyte density, while niche overlap increased until a certain extent of plant density when species started to segregate the niche more strongly. However, niche breadth responses varied according to the trophic guild considered, with omnivorous and herbivorous fish generally showing opposite responses. Macrophyte diversity was important for the preferred food items of the fish, with stomach contents shifting from higher plants, algae, and detritus to insects with increasing macrophyte diversity. Therefore, in addition to the presumable effects of macrophyte density on resource availability and prey encounter rates, our findings highlight the importance of maintaining diverse macrophyte stands for the conservation of fish diversity.

1. Introduction

Macrophytes are recognized as one of the major components providing structural complexity in aquatic environments [1]. Their submerged structures, along with the occurrence of different life forms, lead to great diversity and stability in biotic communities [2]. These plants affect various processes, influencing the lake ecological state and water features [1,3,4], as well as supplying multiple ecosystem services, such as erosion regulation, water purification, and habitat provisioning [5]. Several organisms inhabit vegetated habitats, including invertebrates, fish, and other primary producers (such as algae) [2]. Due to the protection from predators and the food associated with macrophytes, littoral regions represent important spawning and feeding grounds for fish [6,7], and the plants stabilize the dynamic interactions between fish and their prey [1,8,9].
For fish, in particular, the trophic niche is a dominant dimension affecting how species interact [10,11,12]. Two important feeding features determining the chance of fish coexistence are trophic niche breadth (the level of diet specialization) and trophic niche overlap (the degree of diet similarity between species). Both vary with competition strength and food availability, and they may increase when there is a substantial food supply [13,14], as in more complex macrophyte stands [15]. In habitats with high food availability and consequently less intense competition for resources, the maximum tolerable overlap may be greater [16,17], while, when resources are scarce, a contraction of the trophic niche and consequently a reduction in overlap are predicted according to the classical theory of competition for resources [16,18]. However, there is no consensus regarding these responses, particularly concerning the effects of aquatic macrophytes on trophic niche aspects [19].
Macrophytes are colonized by organisms that potentially are food sources for fish, such as periphytic algae [20,21] and invertebrates [15,22,23]. Studies have shown that the richness, diversity, and abundance of macroinvertebrates increase in structurally more complex macrophyte beds, e.g., with finely divided leaves [24,25,26], with various growth forms [27], and with greater biomass and density [15,22]. Fish, in turn, are also able to select aquatic macrophytes based on plant characteristics, such as stem density [28]. However, unlike their food resources, fish community attributes (e.g., richness and diversity) increase with plant density to an optimal density level above which they decline [29,30]. Several factors may explain this decline, such as (1) chemical restrictions due to oxygen depletion [31,32]; (2) physical restrictions found at high plant densities, which generate adverse conditions for fish to move in and visualize prey [33], limiting them depending on their size and body shape [29]; and (3) reduced foraging efficiency, which is affected by plant architecture [34], macrophyte density, and coverage [35,36,37].
Fish that can easily swim through macrophyte structures may show a better foraging efficiency [38]. Generally, their food consumption may increase with macrophyte coverage due to a larger amount of food [39,40] and their trophic niche breadth becomes broader in more abundant vegetation [9,19,41]. However, in dense vegetation, prey encounter and attack rates may decline, such that fish capture smaller amounts of food, thereby reducing their feeding efficiency [37,42]. Thus, intermediate levels of macrophyte density have been recognized as optimal for small fish [43]. Regardless of the trophic niche breadth, more pronounced diet segregation, and hence reduced interspecific resource competition, has already been found in conditions of abundant macrophyte vegetation [19,44]. The effects of macrophyte diversity levels on fish diets, however, is rarely studied [45].
In addition, the availability of food items varies according to plant density and composition in macrophyte stands, which can influence fish diets. For example, the predominant use of algae by some fish species in low-complexity habitats (e.g., open areas) may be related to the higher abundance of phytoplankton in these areas, while in habitats with high levels of complexity provided by macrophytes, zooplankton can be the most consumed resource [46]. At the same time, complex macrophyte stands provide refuges for certain prey, resulting in lower foraging efficiency and higher interindividual variability in fish diets [1,41,46]. Omnivorous fish, in turn, can have their individual specializations reduced in stands with low macrophyte biomass due to the high competition in these sites [47]. Moreover, omnivorous fish can increase the consumption of plant material and expand their trophic niche breadths with increased macrophyte biomass [9]. Therefore, variation in macrophyte density and diversity can affect fish species belonging to distinct trophic guilds differently.
In this study, we hypothesized that variations in the density and diversity of aquatic macrophytes affect the consumption of different food items, influencing each fish trophic guild differently. Specifically, we predicted that (1) plant consumption by fish increases with macrophyte density and decreases with macrophyte diversity, while the consumption of invertebrates has an inverse relationship, and that (2) the foraging efficiency, trophic niche breadth, and overlap among fish species are greatest at intermediate levels of macrophyte density (resulting in a hump-shaped relationship) and at high levels of macrophyte diversity (resulting in a linear relationship). The first prediction was based on the greater availability of plants expected in denser macrophyte stands, while higher invertebrate density is expected in more diverse macrophyte stands [48]. The second prediction was expected because, although very densely structured macrophytes provide more food resources, they also can lead to low foraging rates due to the physical barriers they create [15,42], while a greater diversity of macrophytes can support a greater diversity of invertebrates [45], leading to increases in niche breadth and diet overlap among species [49]. Finally, despite these general trend expectations, based on the first prediction, we also expected that (3) the foraging efficiency and niche breadth of herbivorous fish may respond oppositely to invertivores/insectivores/omnivores. As the trophic niche is also mediated by species interactions, we also considered fish community attributes (density, richness, and diversity) as influencing their feeding aspects.

2. Materials and Methods
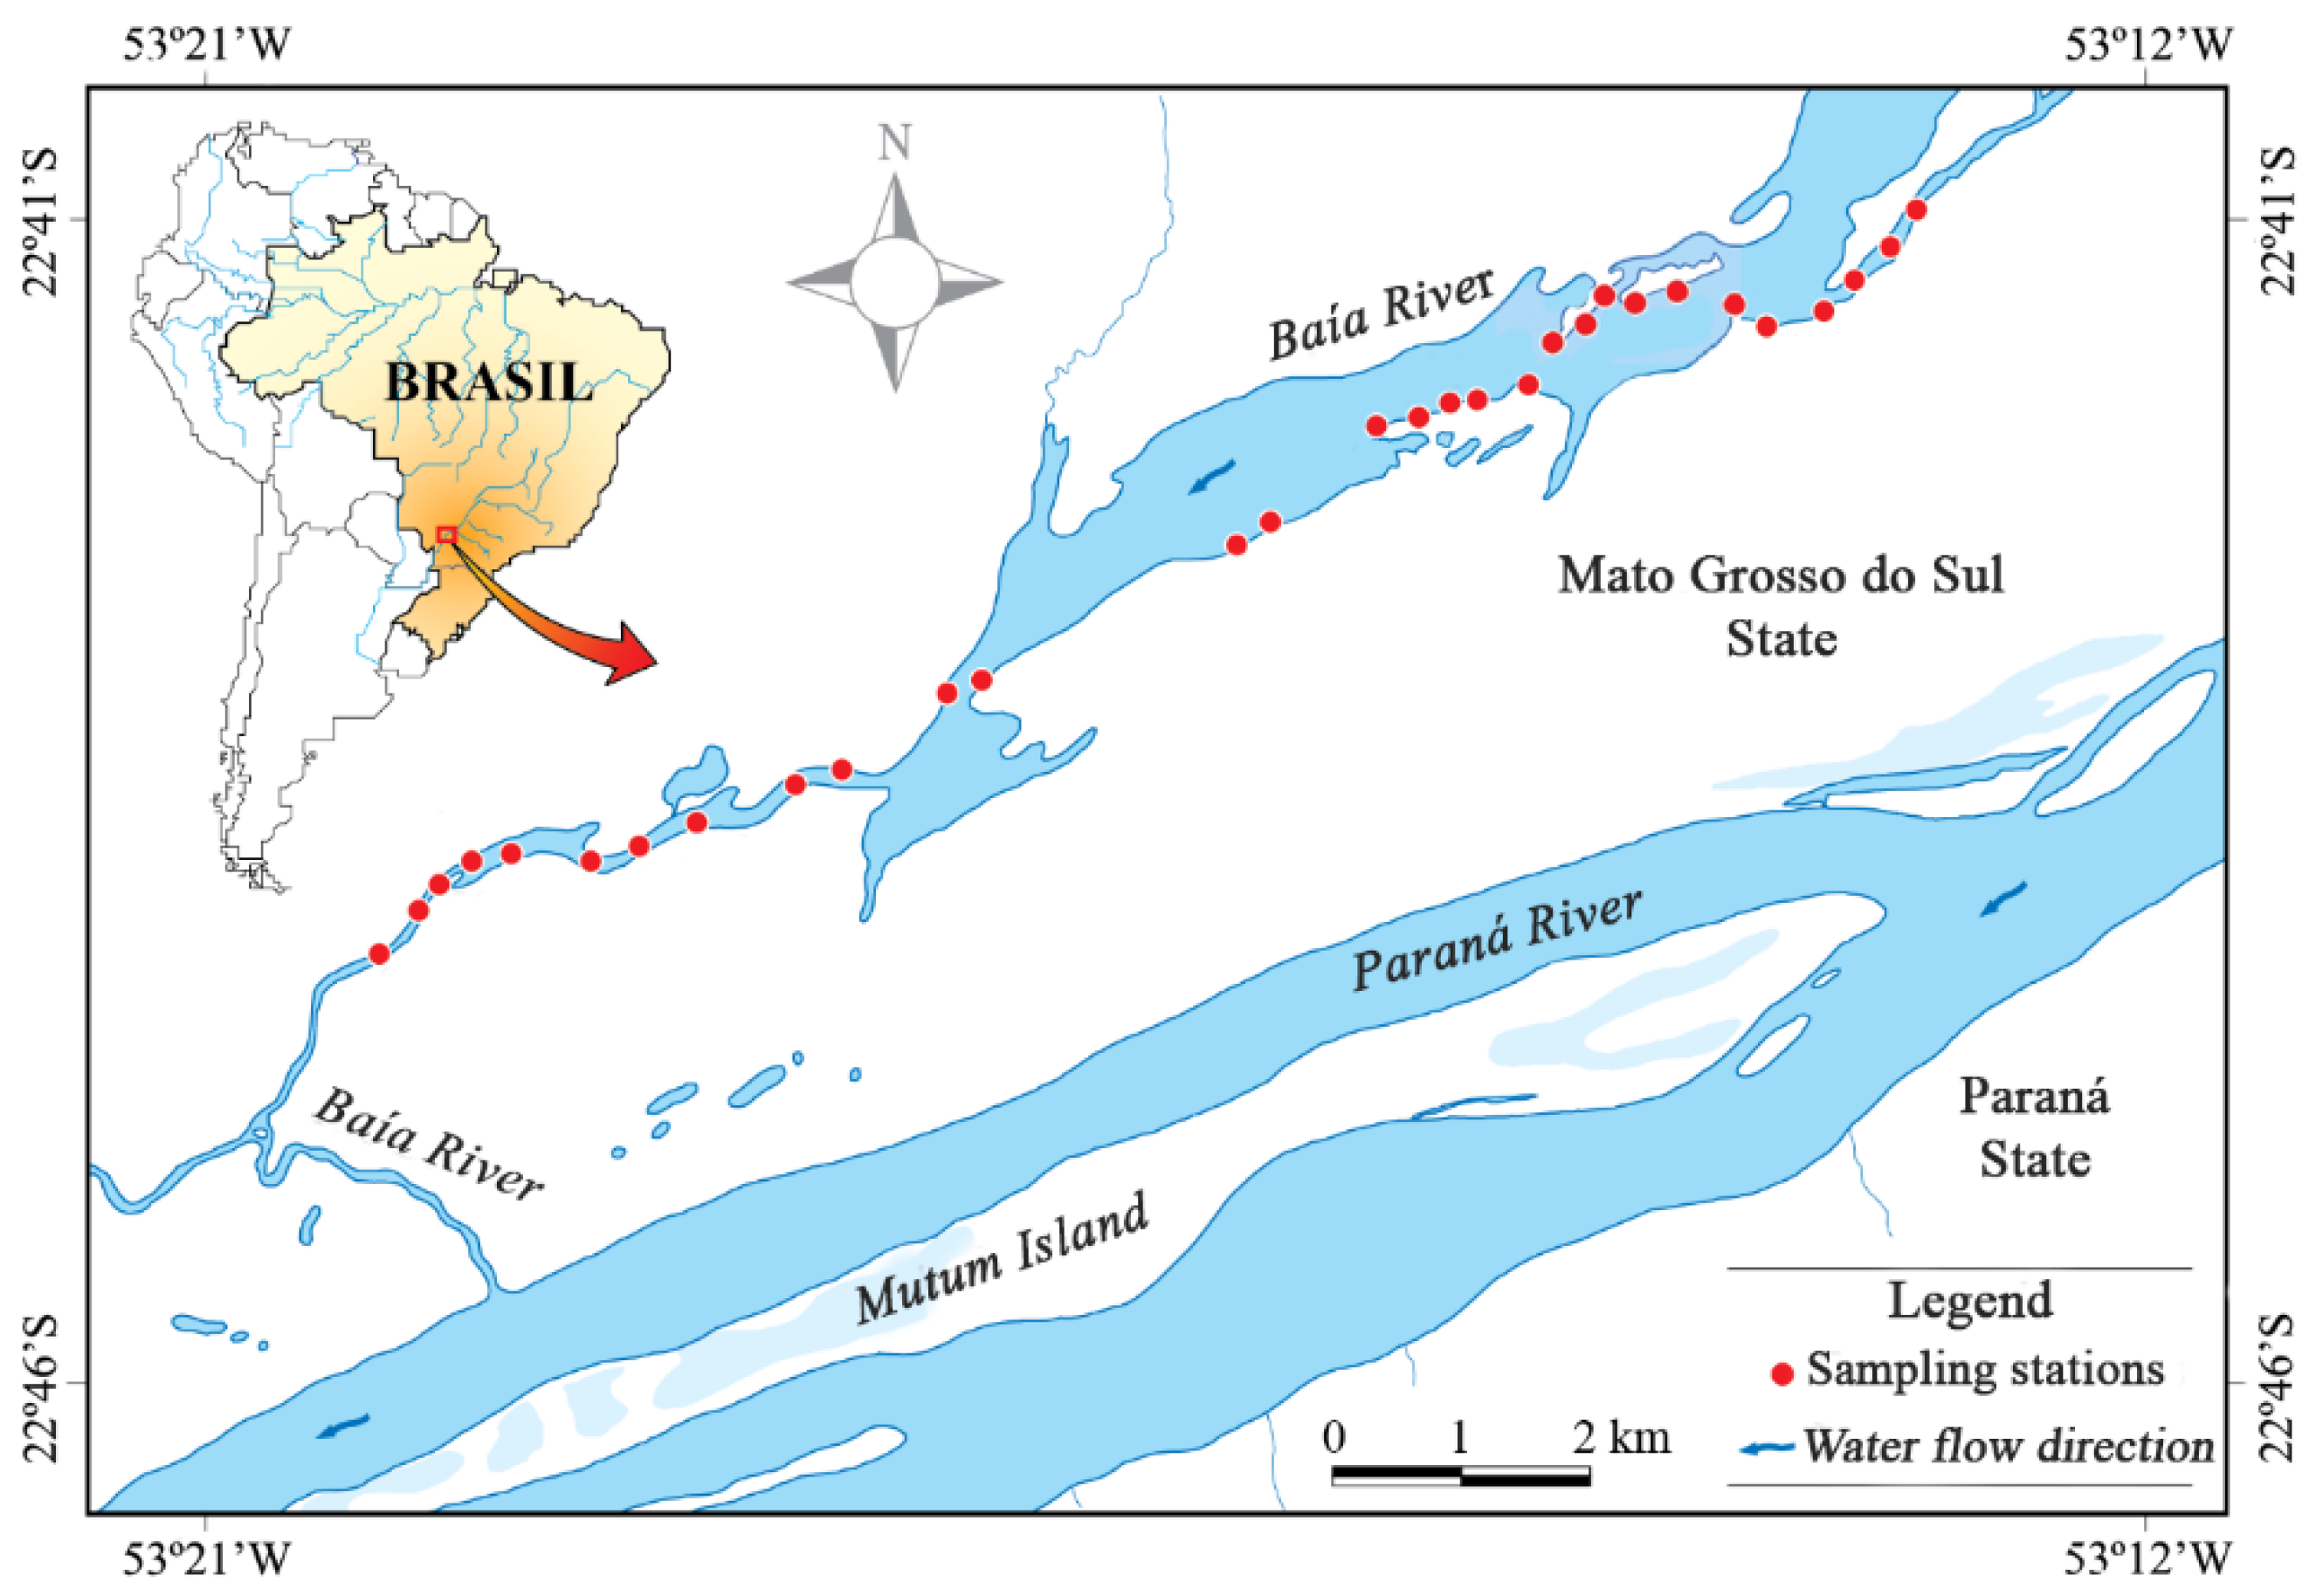
2.1. Study Area

The study was conducted in the Upper Paraná River floodplain. The samplings were carried out in the Baía River (22°43′23″ S, 53°17′25″ W—Figure 1), an ~70 km long tributary that runs parallel to the Paraná River. This river has an average depth of 3.2 m and a low flow speed, ranging from 0.11 to 0.55 m s−1 [50], with the establishment of large stands of aquatic macrophytes [51] and a high richness of fish species [52]. During low-water periods, such as the one in which we conducted the sampling, the floodplain habitats remain less connected and are most dissimilar in terms of abiotic characteristics and communities [53], which factors tend to maximize fish interactions living in association with aquatic macrophytes [54]. Thus, great variability among habitats with gradients of abiotic and biotic characteristics were found during this period–propitious conditions in which to test our hypotheses.

2.2. Sampling

Fish and plants were sampled during the dry season (August 2018) in 30 macrophyte stands separated by at least 350 m and distributed over a 13.7 km—long stretch of the littoral region of the Baía River (Figure 1) [30]. We sampled macrophyte stands with different levels of plant density and diversity, and these were assessed visually through field observations and later confirmed with results for plant dry weights. Some stretches did not have macrophyte stands or stands with suitable depths for the installment of fish traps, which explains the great distances between some of the sampling points (Figure 1).
Fish were collected using plexiglass traps (0.3 m × 0.3 m × 0.3 m; [29,55]). In each macrophyte stand, we placed three traps inside the stands ~4 m from the border to minimize the possibility of capturing pelagic species. We placed the traps at 7 a.m., and they were checked for fish and emptied every 8 h for a total of 24 h. The captured fish were anesthetized with clove oil, according to ethical practices (Animal Use Ethics Committee of the State University of Maringá (CEUA/UEM)—protocol number 5980040618) and fixed in 4% formaldehyde. Subsequently, we identified them at the species level ([56]—Table S1). Fish density in each macrophyte stand was expressed as the number of individuals/3 traps/24 h. Fish diversity was calculated using the Shannon–Wiener Diversity Index:
( H ) =   i = 1 n P i   ln P i
where Pi is the proportion of fish species i and n is the number of fish species found in each macrophyte stand. Fish richness (S) was considered as the total number of species per macrophyte stand.
After the last inspection of the traps, we sampled the macrophytes using one 0.5 m × 0.5 m square per macrophyte stand, and all plant material to a depth of 0.5 m was removed, the volume of which was 0.125 m−3. The macrophytes were separated, identified at species level [57,58], washed, and dried out in an oven at 60 °C until a constant dry weight (DW) was reached to obtain the biomass for each species. Since we estimated the water volume, we pooled the biomass of all species and expressed it in grams of dry weight m−3 (g DW m−3) to estimate the macrophyte density in each stand. To calculate the macrophyte diversity in each stand, we used the Shannon–Wiener index (H′), considering the biomass of each species to evaluate the relative abundance values.
In the laboratory, we weighed, measured, and gutted the fish. After fish evisceration, the stomachs were visually assessed for degree of stomach fullness and assigned to one of the following categories: 0 = empty stomach; 1 = 1–25% of stomach volume occupied by food; 2 = 25–75%; and 3 = 75–100%. We analyzed the stomach contents under stereoscopic and optical microscopes and identified the food items to the lowest possible taxonomic level [59,60].

2.3. Trophic Variables

After identification, the 61 food items were quantified using a volumetric method [61] and a gridded dish in which the volumes of the items were obtained in mm3. These data were used for the later calculation of niche breadth and overlap. Subsequently, food items were grouped into five categories: higher plants (macrophyte leaves and seeds), algae (Zygnematophyceae, Oedogoniophyceae, Bacillariophyceae, Cyanophyceae, and Rhodophyceae), insects (terrestrial and aquatic, totaling 29 taxa), other invertebrates (including 20 taxa), and detritus–sediment. These categories were used to verify whether the consumption of these resources was associated with the macrophyte and fish community attributes (predictor variables).
The foraging efficiency of each species in each macrophyte stand was assessed by the degree of stomach fullness (DF), expressed by the following equation: DF = (N0 × 0) + (N1 × 1) + (N2 × 2) + (N3 × 3)/N, where N0, N1, N2, and N3 correspond to the number of individuals with stomach fullness of 0, 1, 2, and 3, respectively, and N is the total number of captured individuals of a given species in a given macrophyte stand [62]. To calculate foraging efficiency, we used all the individuals captured, a total of 4648 individuals belonging to 25 fish species. The consumption of each food category (higher plants, algae, insects, other invertebrates, and detritus–sediment) was evaluated by calculating the volume percentage of each food category for each individual per macrophyte stand to prevent interference from the size or degree of stomach fullness. For this purpose, we used only the stomachs with food contents, excluding empty ones, which totaled 1813 stomachs of 18 fish species.
Trophic niche breadth was evaluated through the mean distance from the centroid (DC) for each species in each macrophyte stand in a multidimensional space. For the calculation of DC, a PCoA was performed from a data matrix of the volumes of food items (columns) by individuals (rows) using Bray–Curtis distances. Then, the mean distances of individuals in relation to the centroids of their populations were calculated for each species in each macrophyte stand. Greater DCs indicate that the diets of the individuals are more dissimilar and have a broader niche [10]. Trophic niche overlap was calculated for each pair of species in each macrophyte stand using Pianka’s Index (O):
Ojk   =   Okj   = i n P i j   P i k / i n P i j ²   i n P i k ²
where Pij and Pik are the proportions (volumes) of the ith food item used by the jth and kth species. This index varies from 0 (no resource overlap) to 1 (complete overlap in resource use) [16]. For these analyses, we considered only those species with at least two individuals with stomach contents per macrophyte stand and up to a maximum of 30 stomachs, resulting in a total of 1506 stomachs for the 12 fish species analyzed (Table S3).
Since the niche is a population metric and in order to reduce the influence of species composition in macrophyte stands, all the response variables were initially assessed by population (DF, food categories, and DC) or by population pairs (O) in each macrophyte stand. Subsequently, they were summarized as means (mean of each food category, mDF, mDC, and mO). Thus, we obtained a single value for each response variable per macrophyte stand, which allowed us to assess the general fish responses along the gradients of macrophyte density and diversity. In addition, we also calculated mean values of mDF and mDC to each trophic guild for each macrophyte stand to evaluate the patterns separately.

2.4. Data Analysis

To test the relationships between macrophyte attributes (density and diversity) and the trophic variables (mDF, mDC, mO, and the consumption of different food items), we used polynomial models from first to third orders for macrophyte density. The third–order term was used to assist the lowering of the model’s curve after the peak. Models with different polynomials were evaluated by likelihood ratio tests using the “lrtest” function of the lmtest package [63]. When no significant differences were found, we chose the model with the least number of polynomials. Generalized linear models (GLMs) were generated to model foraging efficiency (mDF) and the consumption of different food items against macrophyte density and diversity, as well as fish density, diversity, and richness, using a Gaussian distribution with the “glm” function of the vegan package. Beta regressions [64] were used to model trophic niche breadth (mDC) and overlap (mO), since these variables are continuous and constrained between 0 and 1, and they were performed using the “betareg” function of the betareg package [65].
The models analyzing mDF and mDC responses were produced considering a general mean for all populations and considering each trophic guild separately. To encompass the interspecific competition in all the models, which has a strong influence on the trophic niche [66], we also used fish density, diversity, and richness as predictor variables besides macrophyte density and diversity. For GLM modeling, we checked and met the linearity, normality of residuals, and homogeneity of variances. Possible spatial autocorrelations of response variables among macrophyte stands were assessed using Moran’s I correlograms [67]. According to this analysis, none of the response variables presented biases related to spatial autocorrelation structures; thus, spatial effects were not considered in the models. All the analyses were performed in the R environment version 4.1.2 [68], and a significance level of p ≤ 0.05 was considered.

3. Results

We recorded a total of 17 macrophyte and 25 fish species (the total lengths of fish ranging from 29 mm to 42.4 mm) (Tables S1 and S2). Considering the 30 macrophyte stands, plant density ranged from 366 to 7066 g DW m−3, while plant diversity (H′) ranged from 0 to 2.22 (Table S4). Fish density ranged from 15 to 563 individuals per macrophyte stand and fish richness ranged from 6 to 15 species, while fish diversity (H′) ranged from 0.96 to 1.91 (Table S4).
According to the food categories, fish species were classified into four trophic guilds: herbivores (>60% of diet volume composed of higher plants and algae, totaling three species), insectivores (>60% of aquatic or terrestrial insects, totaling seven species), invertivores (>60% of other invertebrates than insects, totaling two species), and omnivores (no food category over 60% of diet volume, totaling four species) (Table S5).

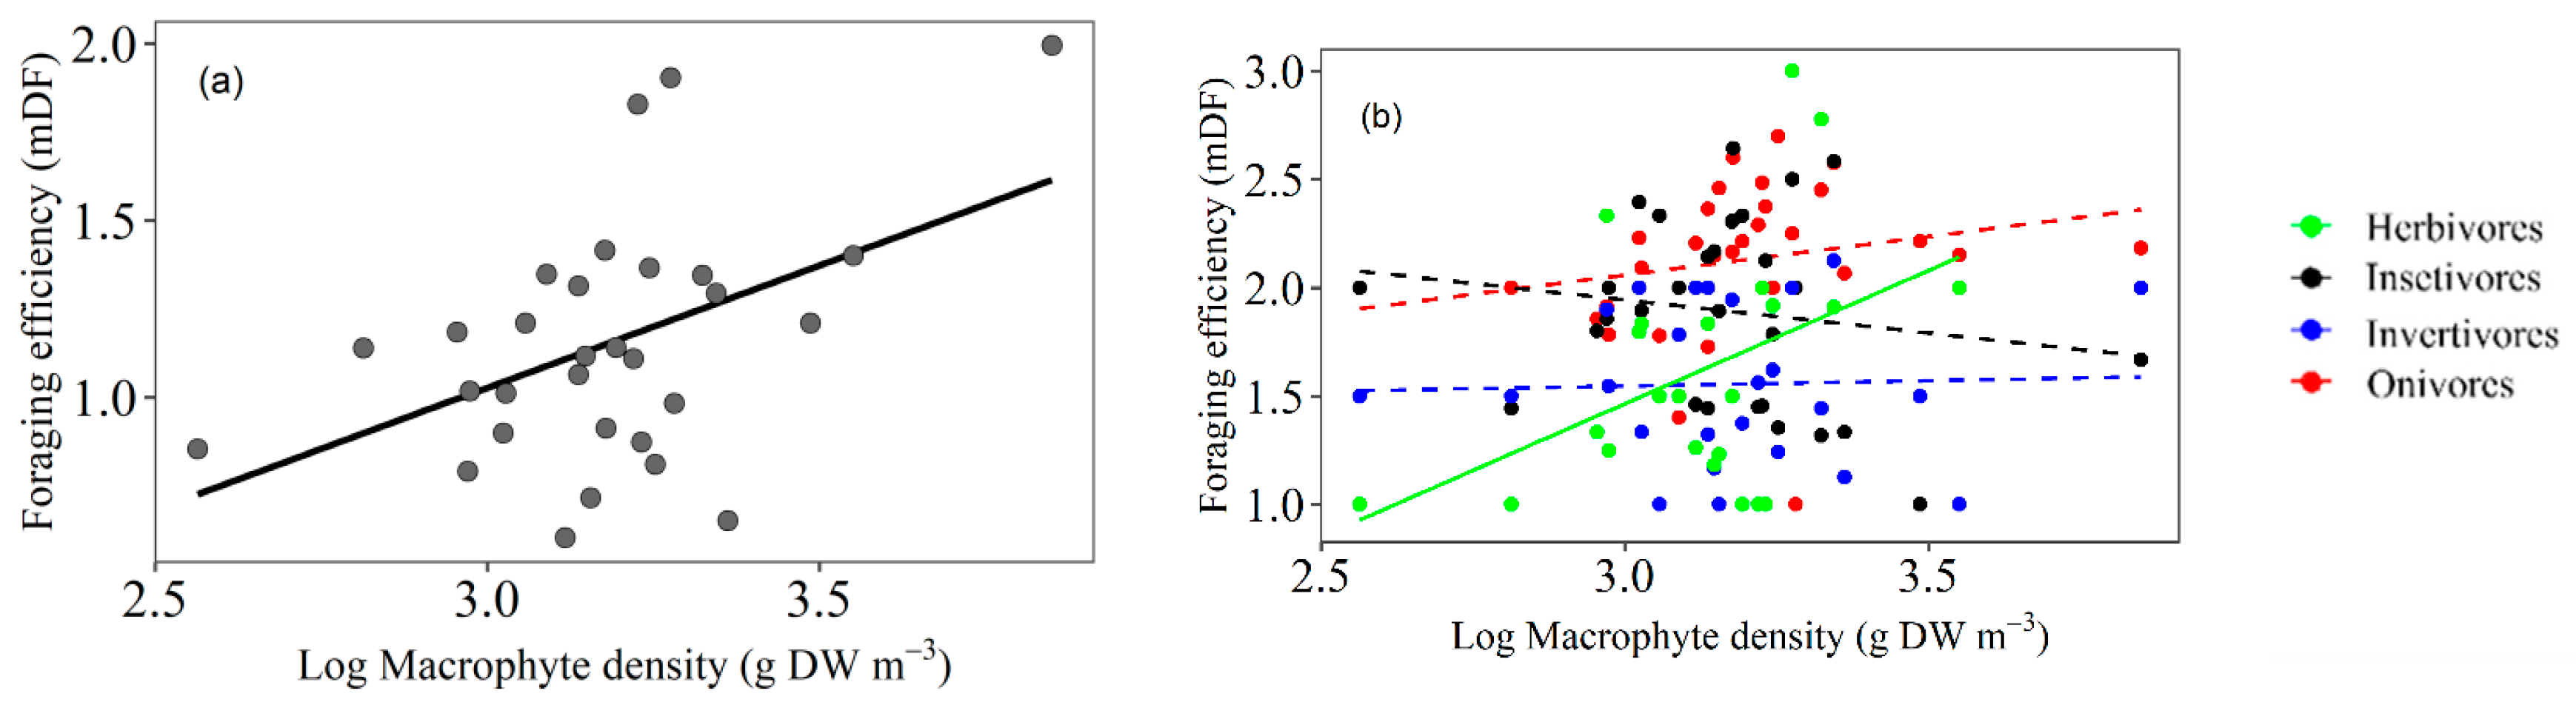
3.1. Foraging Efficiency

The relationship between foraging efficiency and macrophyte density was best described by a first-order polynomial relationship (Table S6), which explained 33% (Nagelkerke R2) of the variance. The generalized linear model showed that the amount of food consumed increased significantly with increasing macrophyte density, while the other predictor variables did not affect foraging efficiency (Table 1; Figure 2a). When considering mDF for trophic guilds separately, only the model for herbivores (Nagelkerke R2 = 0.34) showed a significant (and positive) relationship with macrophyte density, with a range of mDF from 1 to 3 (Figure 2b; Table 1). Omnivores also showed a positive but not significant trend (Nagelkerke R2 = 0.25).

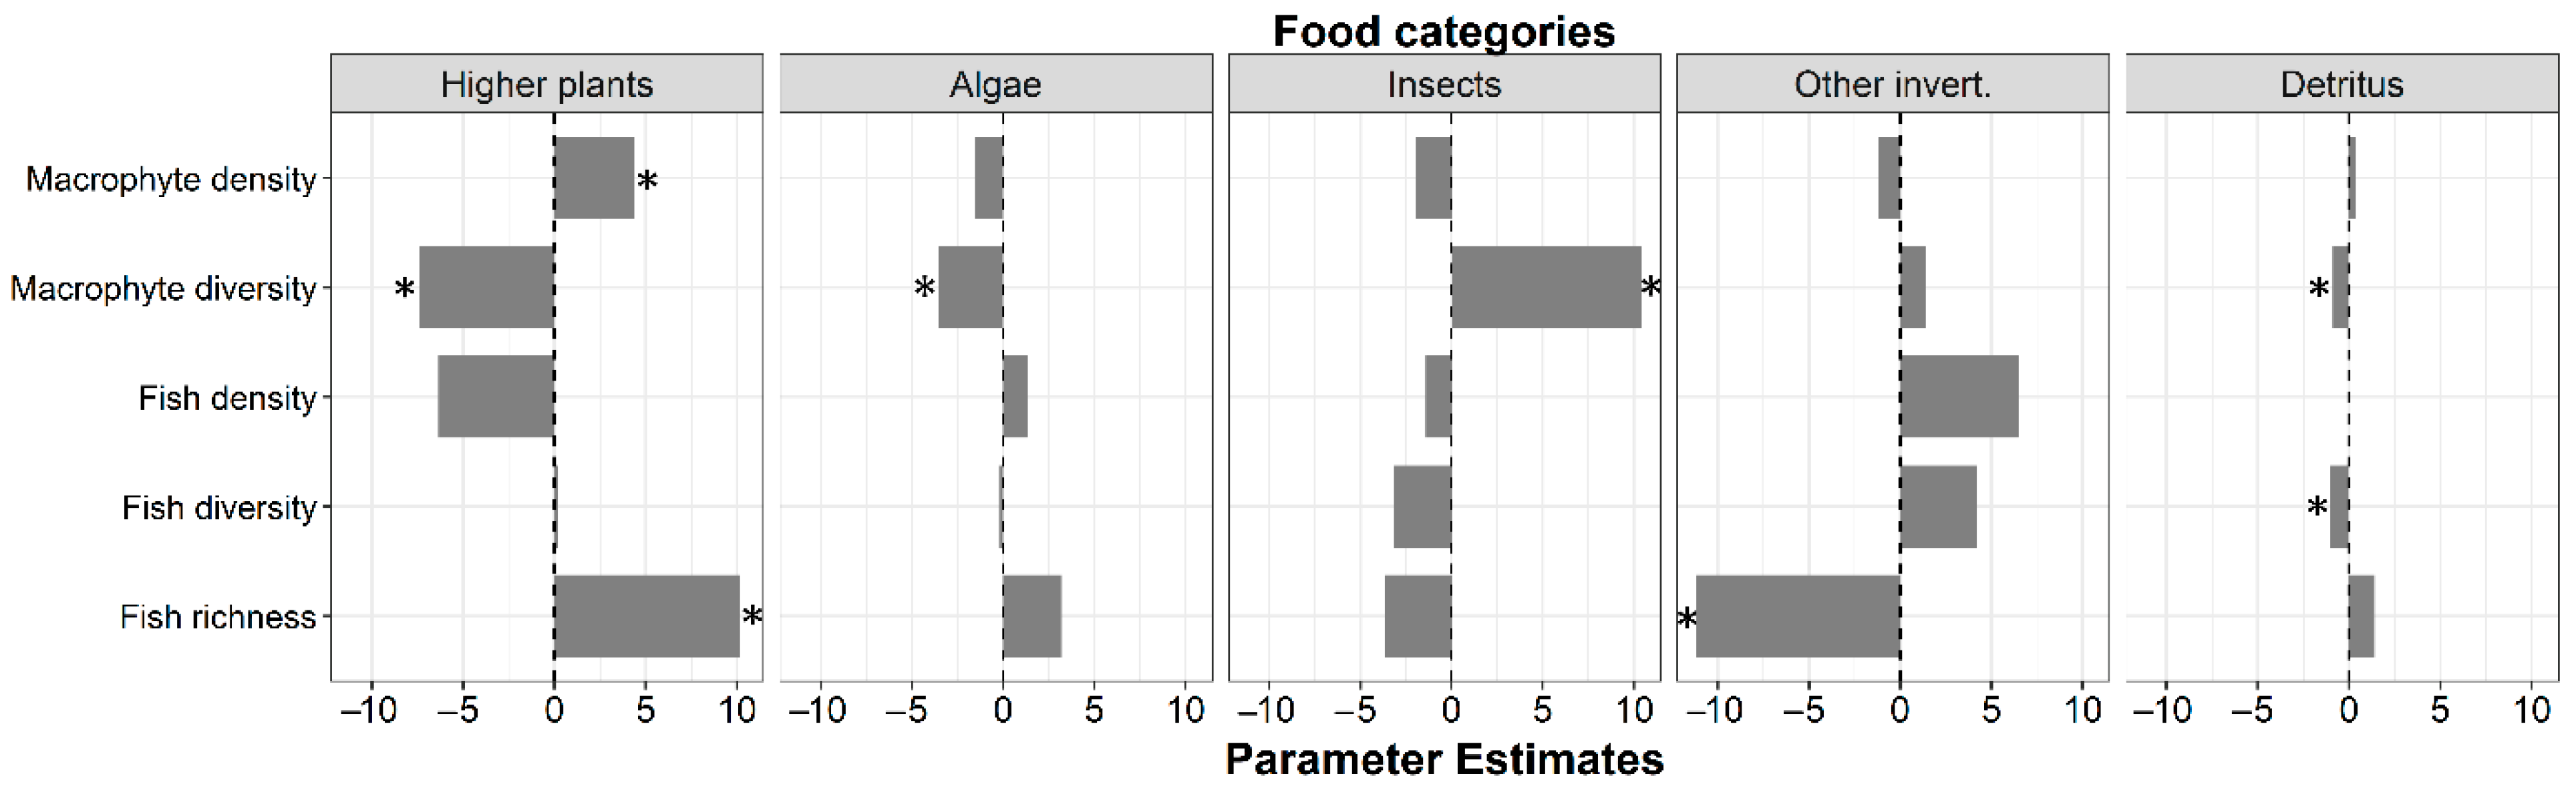
3.2. Food Categories

Regarding food items ingested by fish, we found that plant density only influenced the consumption of higher plants, which increased with increasing macrophyte density (Table 2; Figure 3). There was a replacement of food items along the macrophyte diversity gradient, with the consumption of higher plants, algae, and detritus being negatively and insect consumption being positively related to macrophyte diversity (Table 2; Figure 3). Detritus consumption was also negatively associated with fish diversity. The consumption of higher plants and detritus was positively related to fish richness, while the consumption of other invertebrates was negatively related to fish richness.

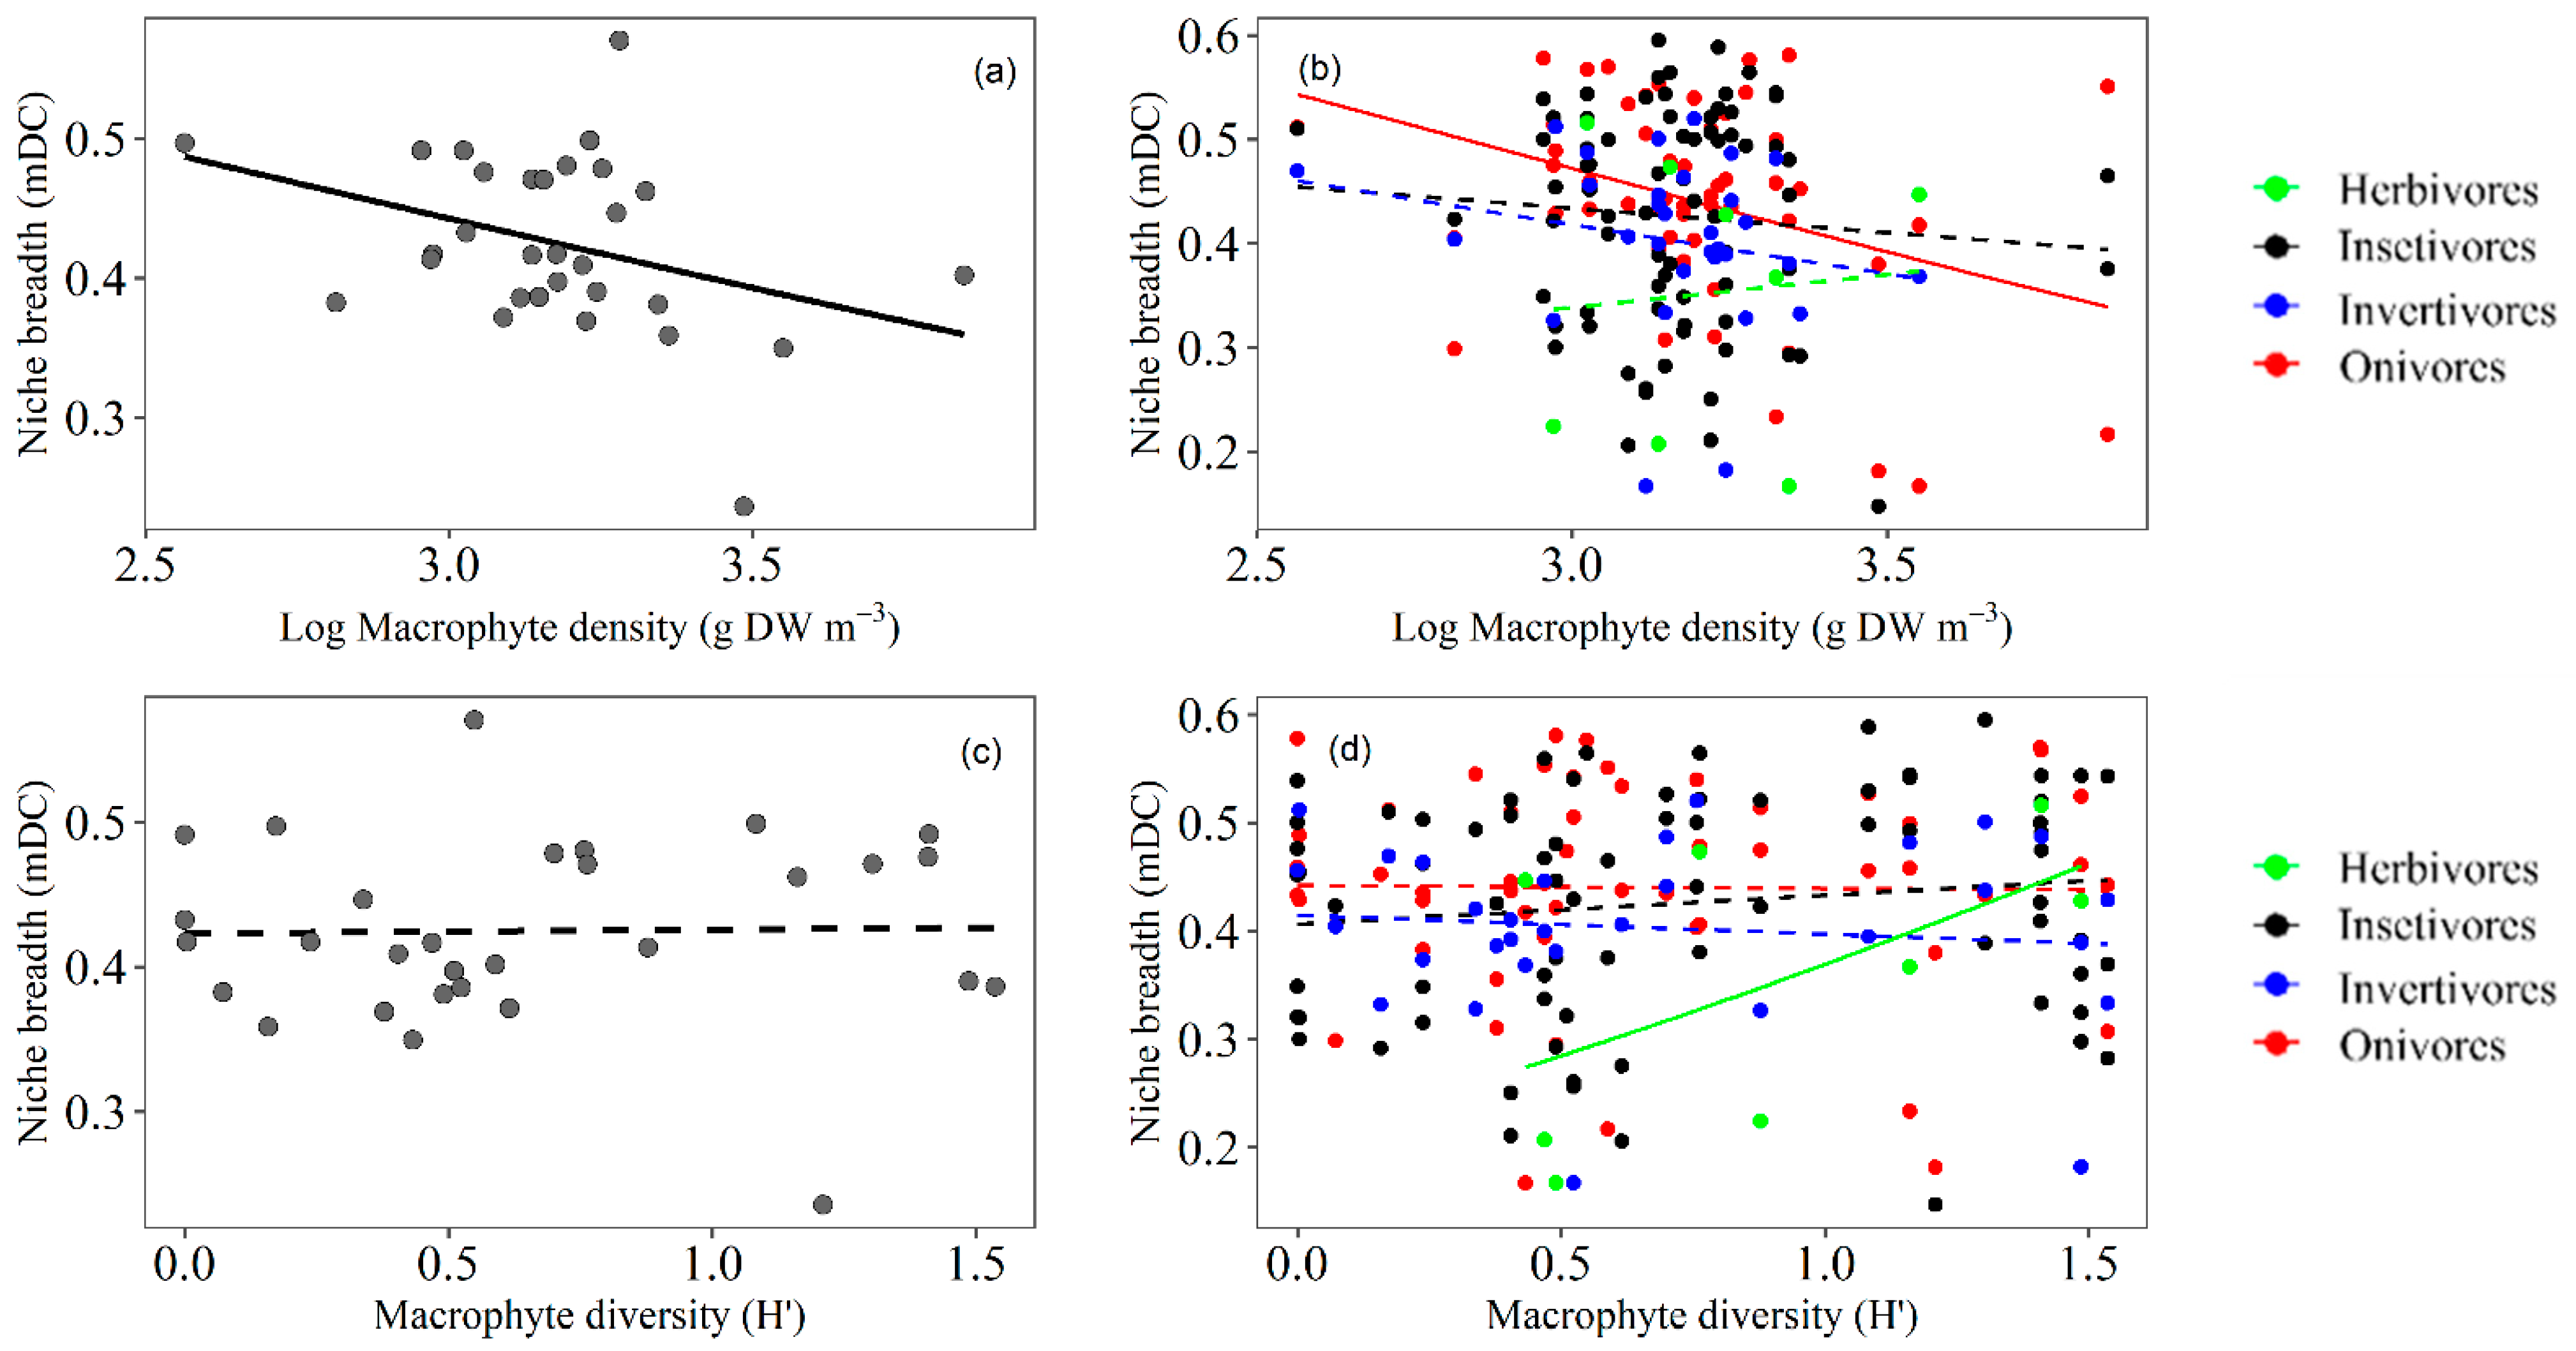
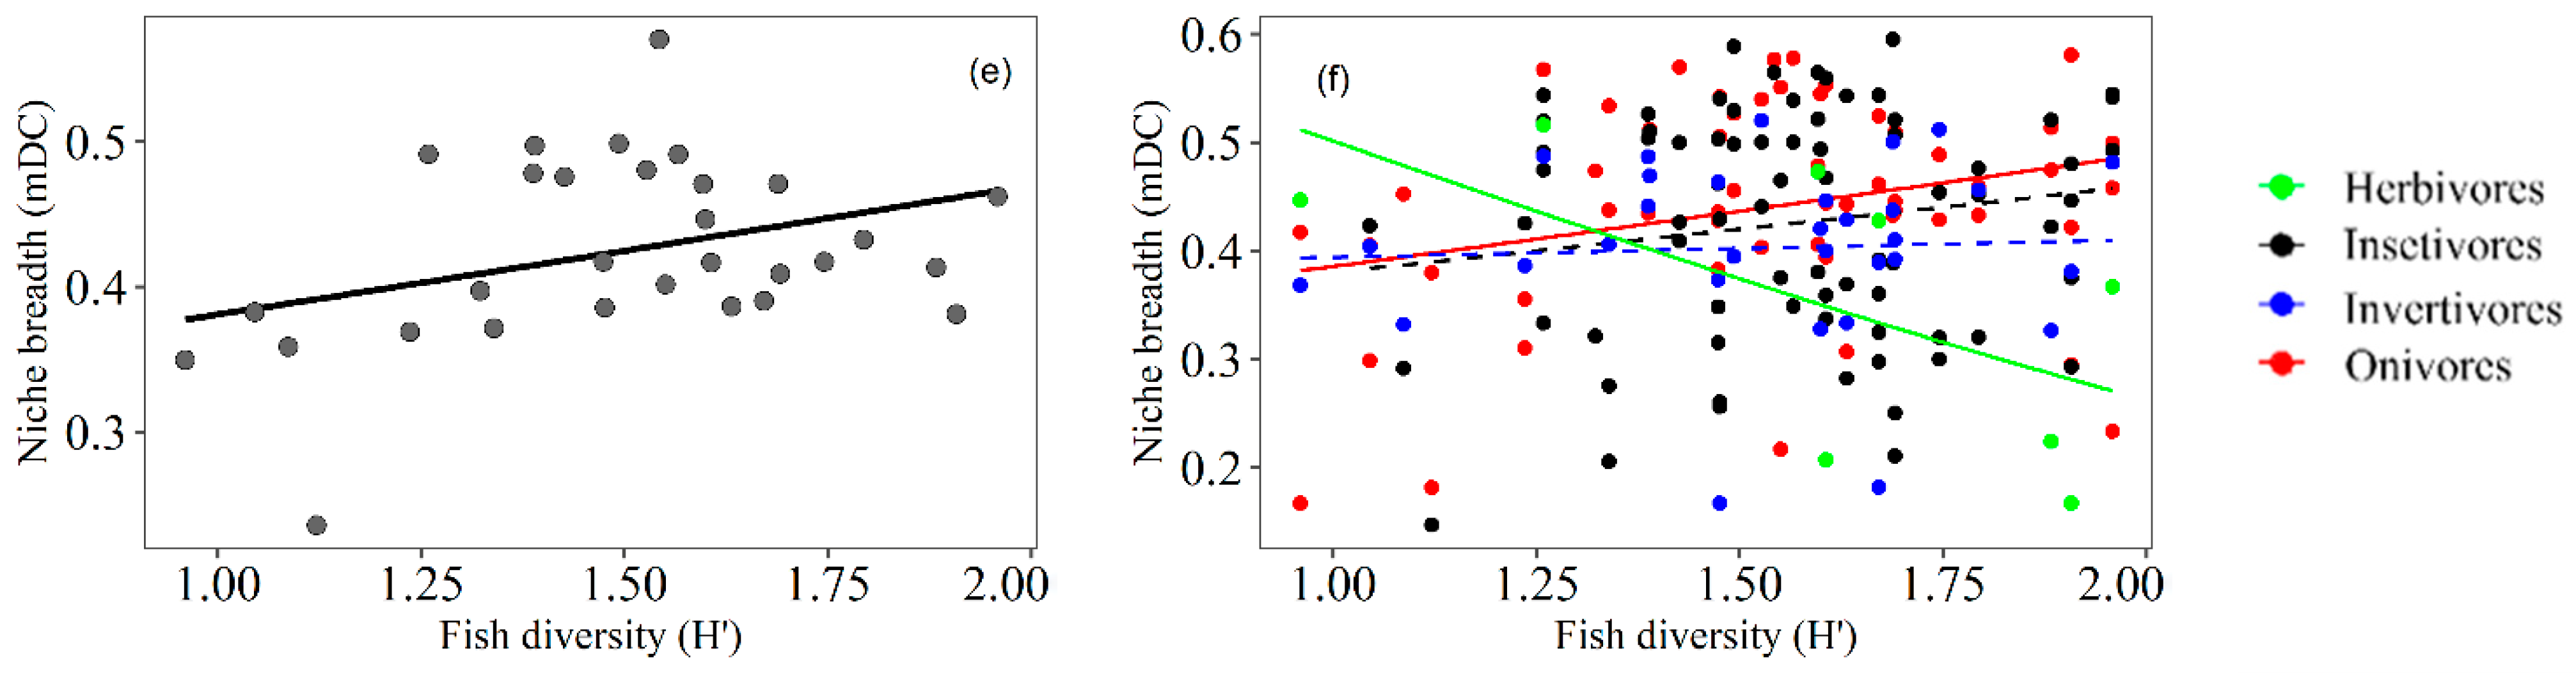
3.3. Trophic Niche Breadth

The beta regression model revealed a moderate explained variance (pseudo-R2 = 0.24) with a first-order polynomial relationship (Table S7), and the trophic niche breadth was negatively associated with macrophyte density but positively associated with fish diversity (Table 3; Figure 4a,c). When considering the mean trophic niche breadth for the guilds separately, omnivores (pseudo-R2 = 0.20) and herbivores (pseudo-R2 = 0.80) were the only guilds that showed significant relationships in the models, and they generally showed opposite trends. The only significant variables for herbivores were macrophyte diversity (positive relationship) and fish diversity (negative relationship) (Figure 4d,f). For omnivores, macrophyte density showed a negative relationship, in addition to fish diversity, whichwas positively related to trophic niche breadth (Figure 4b,f; Table 3).

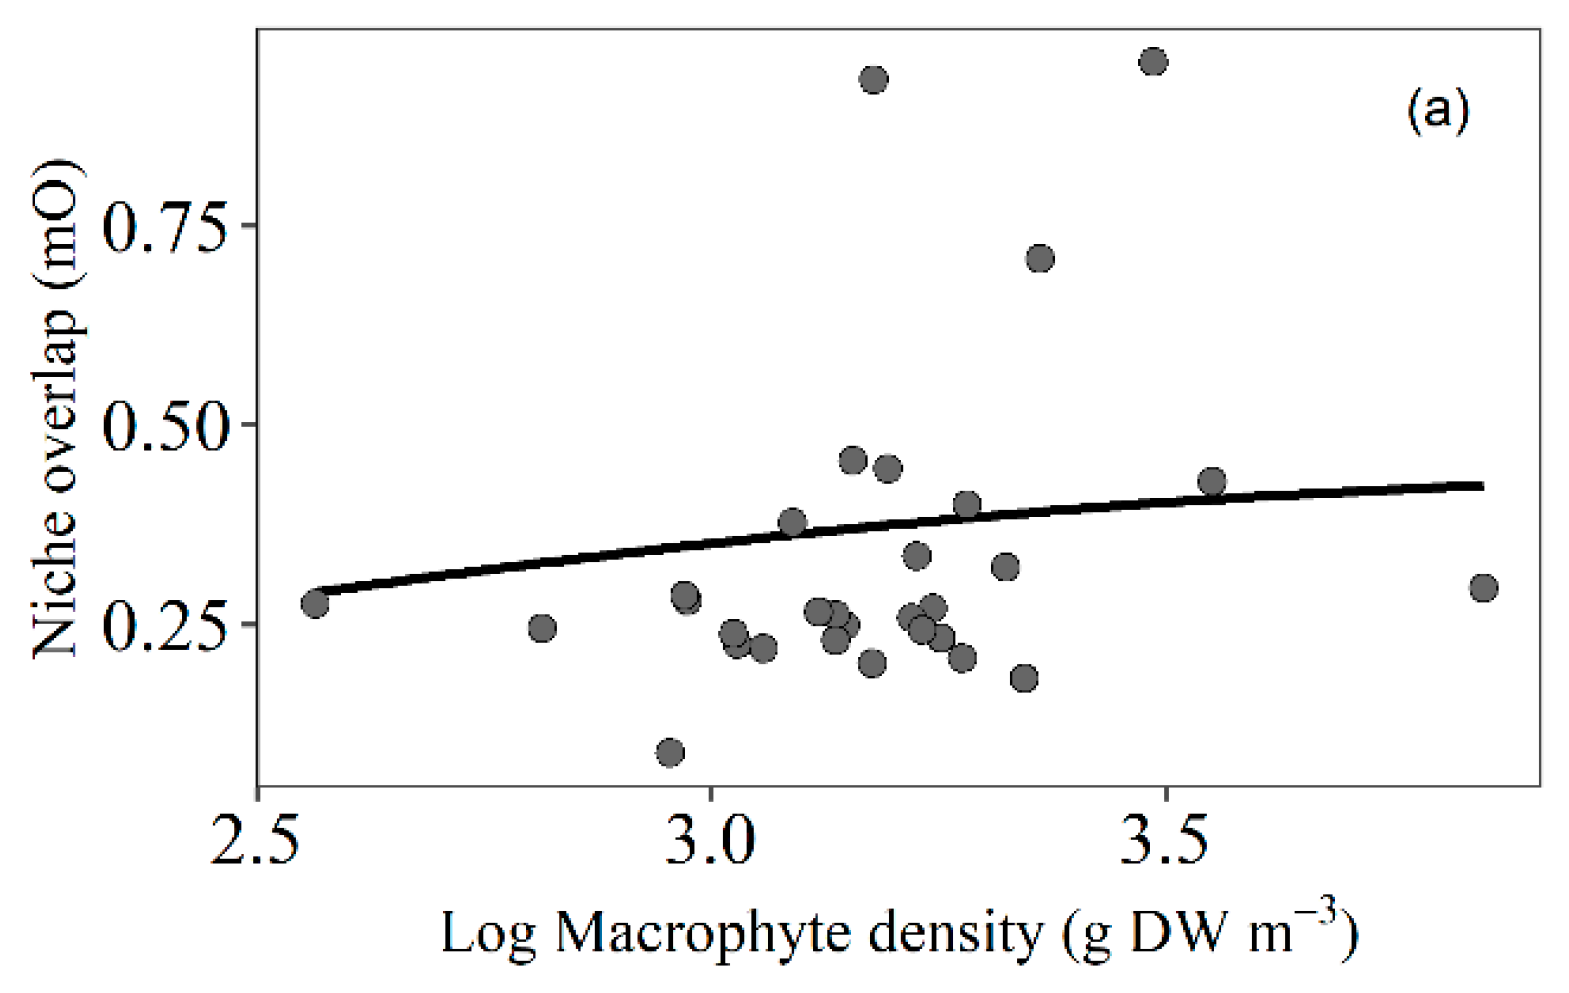
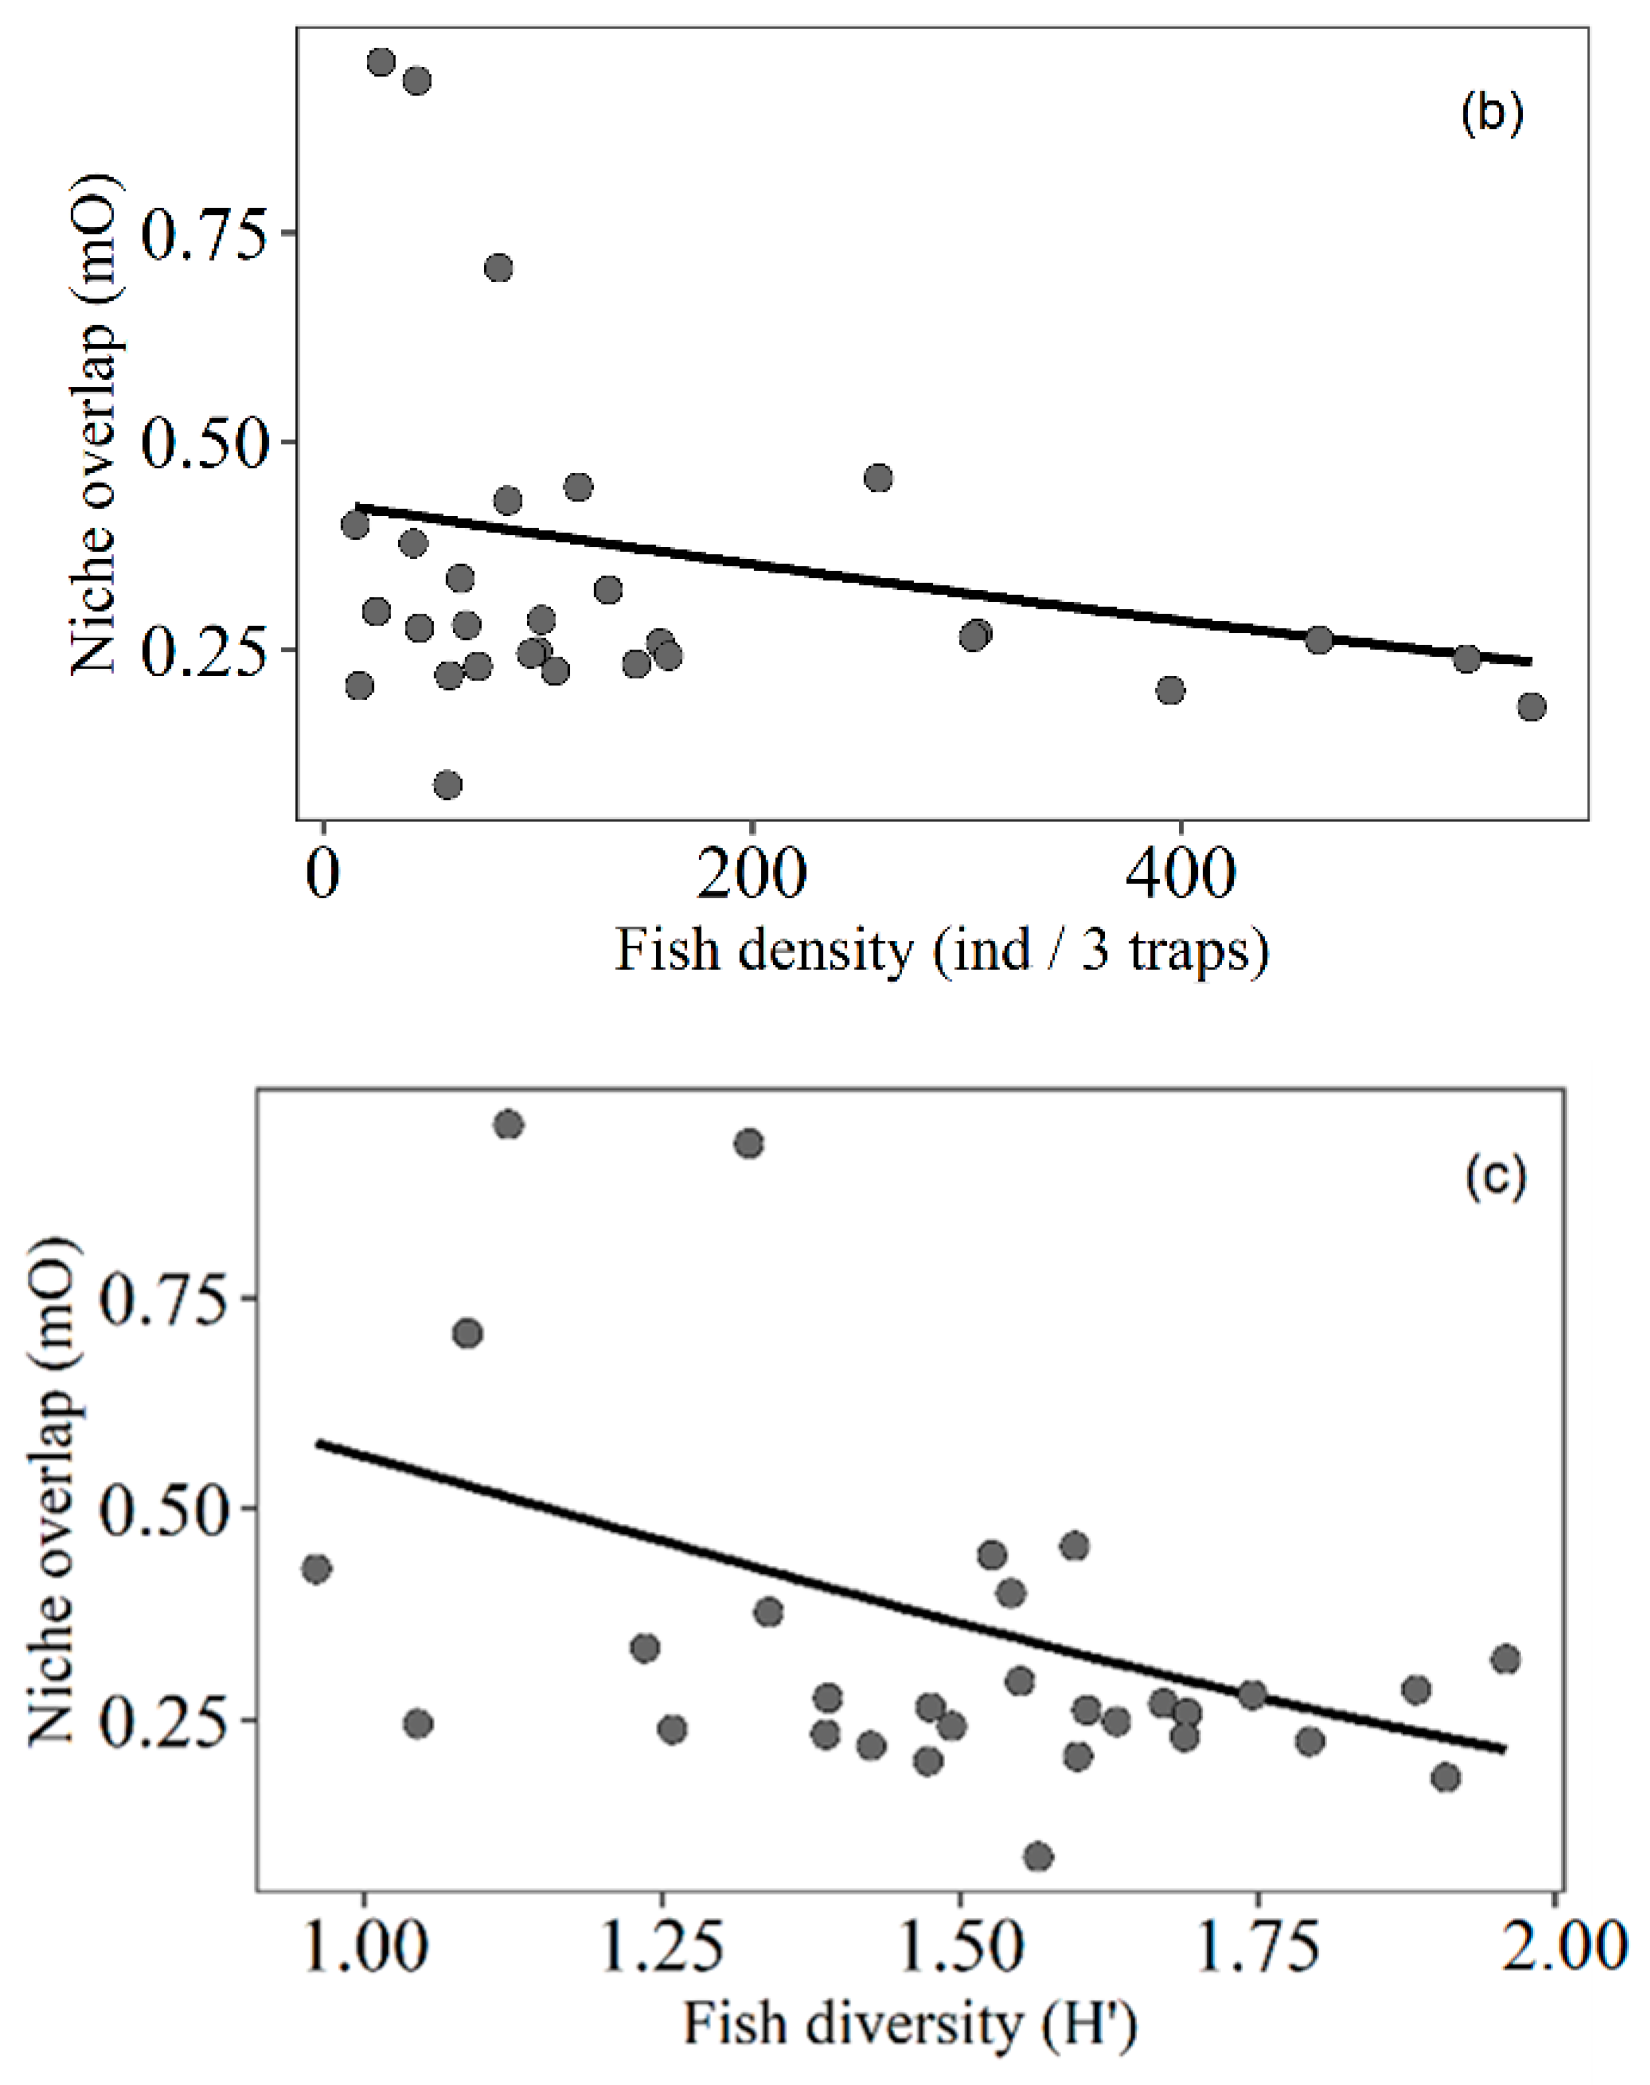
3.4. Trophic Niche Overlap

The beta regression showed that trophic niche overlap was significantly related to macrophyte density (with a second-order polynomial relationship; Table S8), fish density, and fish diversity, and the model explained 32% of the variation (pseudo-R2 = 0.32; Table 4; Figure 5). The trophic niche overlap increased slightly with macrophyte density, while it decreased with fish density and diversity.

4. Discussion

Macrophyte density, widely known to provide habitat complexity and influence predator–prey interactions [1,2], was found to be related to fish foraging efficiency, trophic niche breadth and overlap, as well as plant consumption by fish in general. More importantly, our data show the relevance of macrophyte diversity to explaining the consumption of different food items by fish, with the consumption of higher plants, algae and detritus being replaced by the consumption of insects along the macrophyte diversity gradient. Although diversity of structures is recognized as a component of habitat complexity [69], the effects of macrophyte diversity on trophic responses have rarely been investigated [45]. Fish density, diversity, and richness, used here as a proxy for competition, were also related to the consumption of certain food resources by fish as well as to their trophic niche breadth and overlap.

4.1. Fish Foraging Efficiency Related to Macrophyte Density

Numerous studies have demonstrated that fish foraging efficiency declines as macrophyte density increases because dense vegetation may restrict access to prey by decreasing visibility and the swimming speed of fish [35,36,37,42]. However, we found an opposite response, as also observed in another field study [39] and an experiment [40] where higher prey consumption by fish occurred in habitats with high macrophyte coverage than in low-vegetation habitats. This may reflect the possibility that a high density of available prey overwhelms the negative effects of structurally dense vegetation [39]. Alternatively, the highest macrophyte densities found in our study may be lower than the amounts of biomass that have been found in other ecosystems where fish are eliminated from macrophyte stands [70]. However, some studies have shown no effect of vegetation density on feeding activity for some fish species [8,71]. The general positive relationship with fish foraging in our study was especially due to the responses of herbivorous fish. As herbivorous fish can directly graze on submerged plants [72], increase in macrophyte density, even if excessive, favors their foraging because it increases the availability of resources and does not demand efficient maneuverability and performance—attributes required to exploit resources in structurally complex habitats [73].
The foraging efficiency of omnivorous fish also showed a positive, though not significant, trend related to macrophyte density, which is consistent with their ability to feed on plants. Although macrophytes provide protection to prey by reducing the visual contact between them and their predators [74,75], fish can switch to alternative food sources according to prey availability [10]. In general, macrophytes and associated algae may be a vital food resource for omnivorous fish [76,77] and constitute most of their diet in high-macrophyte-biomass stands because of the extreme availability of these resources [9]. In fact, we found that plant consumption by fish, regardless of trophic guilds, increased significantly along the macrophyte density gradient, suggesting the prevalence of herbivory in the denser macrophyte stands. When there is an energy limitation, omnivores are able to enhance feeding on low trophic position food items (e.g., plants) [78,79]. In addition, according to the optimal foraging theory [18], predators consider the balance between the energetic gains and metabolic costs of a prey. Thus, plant resources may become a more profitable food for fish in denser macrophyte stands due to their high availability and lack of mobility. However, we might have failed to detect a negative relationship between fish foraging and macrophyte density because extremely dense stands were not present, likely because floodplain environments are naturally subject to regulation by droughts and floods, which prevents the excessive proliferation of macrophytes [80].

4.2. Trophic Niche Breadth of Fish Related to Macrophyte Density

Despite higher foraging efficiency, the trophic niche breadth of fish responded negatively to the increase in plant density. The negative response of trophic niche breadth to the increase in macrophyte density was especially clear for omnivorous fish, while the other guilds did not show significant patterns. Vejříková et al. (2017) and Eloranta et al. (2017) also verified lower individual variation and narrow trophic niches of generalist fish in lakes with higher macrophyte abundance than in macrophyte-poor lakes. This may be associated with the fact that complex habitats can present physical barriers to foraging, offering refuges that prevent predator–prey encounters [2,38]. The lower availability of food resources—in this case, due to lower accessibility—generally leads fish to consume a smaller variety of food items [81] that are easier to prey on under these conditions (e.g., plants), which does not necessarily imply a smaller amount of food ingested. Then, trophic niche breadth may be higher in habitats with low macrophyte density, not because of food availability (which is reduced), but presumably because they do not protect prey against predation as highly structurally complex macrophyte stands do [48,74,75].

4.3. Trophic Niche Breadth of Fish Related to Macrophyte Diversity

Macrophyte diversity, in turn, was found to be positively related to the trophic niche breadth of herbivorous fish. In addition, there was a significant decline in higher plant, algae, and detritus consumption by fish and an increase in the consumption of insects with increasing plant diversity, which suggests that in stands with high macrophyte diversity fish can replace basal resources by new ones. Yofukuji et al. (2021) observed that an omnivorous fish increased its consumption of invertebrates and decreased its consumption of aquatic plants as macrophyte diversity increased. High diversity of plants means different architectures, growth forms, and physiologies and, therefore, different types of microhabitats. This enhances food sources and shelter, which supports dense and diverse biotic communities [45,82]. The diverse structural habitats provided by different architectures can potentially contribute to differences in fish diets [34,45]. A more diverse macrophyte community, with submerged and floating macrophytes, may facilitate coexistence between plant-associated macroinvertebrates and fish [83]. Choi et al. (2016) verified that mixed vegetation zones (containing five macrophyte species) presented higher zooplankton densities than zones with fewer macrophyte species.

4.4. Relationship between Fish Community Attributes and Fish Trophic Aspects

Fish diversity is a particularly important factor determining resource use and the structure of food webs. Higher fish diversity leads to the substitution of intermediate consumers and increasing competition and predation [84]. We found that fish diversity was positively related to the trophic niche breadth of herbivorous fish and negatively related to that of omnivorous fish. Moreover, there was an increase in the consumption of higher plants and a decrease in the consumption of invertebrates (except insects) and detritus with increasing fish diversity and richness. These observations suggest that fish may consume more low-energy foods, such as plants, than invertebrates in a situation of high competition that causes a shortage of animal food items [85,86]. For example, a high biomass of invertivorous fish can significantly reduce the density of macroinvertebrate prey [87], which may have contributed to the observed dietary shift to plant resources. In situations of greater competition, fish may avoid it by reducing among-individual variation and thereby population niche breadth [88], which may have been the case with the omnivorous fish. In addition, high fish richness can be associated with high food availability [43], which can lead herbivorous fish to consume items to which their functional morphological traits are best adapted, potentially enhancing their nutritional gains [10]. Thus, trophic niche breadth adjustments become important for the coexistence of different fish species [89], and each trophic guild can adjust the width by expanding or narrowing it. In fact, trophic niche overlap was also altered according to fish density and diversity in our study, responding positively to these attributes. In this case, when the fish experienced intense competition, regardless of whether they reduced or increased niche breadth, the general tendency was for niches to overlap. This result is probably associated with the limitation of food resources via top-down regulation by fish [90].

4.5. Trophic Niche Overlap of Fish Related to Macrophyte Density

Regarding the macrophyte density gradient evaluated in this study, the trophic niche overlap for fish in general increased slightly to an intermediate point of plant density and then declined. This suggests that, while fish tend to reduce niche breadth along the gradient of macrophyte density (except for herbivores), the niche overlap among species increases, but this occurs only to a certain extent of plant density when species start to segregate the niche more strongly. The greater niche overlap observed in the macrophyte stands with intermediate levels of macrophyte density is justified by the high availability of resources compared to stands with little vegetation and the low restriction of swimming movement compared to denser stands [2,47,91]. When resources are abundant, trophic niche overlap can be high, but it does not necessarily imply intense competition, or it means that strong competition has not yet led to segregation in resource use [90]. However, as access to prey becomes more restricted in high-density stands, fish from different guilds can feed on the resources they are most suited to, since each species has a foraging ability among macrophyte structures [74], leading to reduced niche overlap. A fish that can easily swim through macrophyte structures is able to forage more efficiently than other fish, thereby segregating and partitioning the habitats [38]. In fact, fish may segregate the niche more strongly and, consequently, reduce competition for resources in lakes with abundant macrophytes compared to macrophyte-poor lakes [19,44]; thus, habitat complexity can fundamentally affect interactions among fish.

5. Conclusions

Our study gives new insights into how macrophyte density and diversity, as well as fish density and diversity, can influence the use of food resources by fish and hence their trophic niche breadths and segregation patterns. Although rarely studied, macrophyte diversity proved to be more important than macrophyte density for the consumption of different food items. Insects were the most important food resources supporting the fish community associated with high macrophyte diversities, while higher plants, algae, and detritus were mainly consumed by fish in stands with low macrophyte diversity. Considering that most captured fish species were insectivores, invertivores, and omnivores (which are also able to feed on insects), the maintenance of highly diverse macrophyte stands is of the utmost importance for the conservation of fish diversity. Our results also indicate that the response of the trophic aspects of fish depends on their feeding habits, because, despite the general results, we observed different responses (opposite or null) according to the trophic guild, such as, for example, the niche breadth of herbivores that responded oppositely to the breadth of omnivores. Thus, macrophyte vegetation increases the overall physical complexity and improves the availability of resources and, at the same time, reduces prey encounter rates, favoring herbivory under high–plant–density conditions and insectivory under conditions of high plant diversity. Seen from a management perspective, our findings highlight the importance of maintaining diverse macrophyte stands for the conservation of fish diversity and to restore plant beds if lost.

Supplementary Materials

The following supporting information can be downloaded at: https://www.mdpi.com/article/10.3390/w14213543/s1, Table S1: Macrophyte species sampled; Table S2: Fish species sampled in aquatic macrophyte stands; Table S3: Number of stomachs of each fish species used to calculate trophic niche breadth and overlap. Table S4: Limnological parameters and biotic communities in each macrophyte stand. Table S5: Diet composition and trophic guild of fish species. Tables S6–S8: Results of likelihood ratio tests.

Author Contributions

Conceptualization, B.A.Q., R.F. and S.M.T.; methodology, B.A.Q. and M.S.D.-F.; formal analysis, B.A.Q.; writing—original draft preparation, B.A.Q.; writing—review and editing, R.F., S.M.T., E.J., M.S. and M.S.D.-F.; supervision, R.F., S.M.T., E.J. and M.S. All authors have read and agreed to the published version of the manuscript.

Funding

This research was funded by Conselho Nacional de Desenvolvimento Científico e Tecnológico (CNPq—grant 141158/2018-2), and Coordenação de Aperfeiçoamento de Pessoal de Nível Superior-Brasil (CAPES—Code 001). E.J. was supported by the TÜBITAL program BIDEB2232 (project 118C250).

Data Availability Statement

The data presented in this study are available in Supplementary Materials.

Acknowledgments

The authors would like to thank the Núcleo de Pesquisas em Limnologia, Ictiologia e Aquicultura (Nupélia) and the Department of Ecoscience from Aarhus University for the infrastructure for developing this study, Anne Mette Poulsen for valuable advice for English grammar, and the students from the lab of trophic ecology of fish for helping in stomach analysis.

Conflicts of Interest

The authors declare no conflict of interest.

References

  1. Jeppesen, E.; Lauridsen, T.L.; Kairesalo, T.; Perrow, M.R. Impact of Submerged Macrophytes on Fish-Zooplankton Interactions in Lakes. In The Structuring Role of Submerged Macrophytes in Lakes; Jeppesen, E., Søndergaard, M., Søndergaard, M., Christoffersen, K., Eds.; Springer: New York, NY, USA, 1998; Volume 131, pp. 91–114. [Google Scholar]
  2. Thomaz, S.M.; Cunha, E.R. The Role of Macrophytes in Habitat Structuring in Aquatic Ecosystems: Methods of Measurement, Causes and Consequences on Animal Assemblages’ Composition and Biodiversity. Acta Limnol. Bras. 2010, 22, 218–236. [Google Scholar] [CrossRef]
  3. Søndergaard, M.; Jensen, J.P.; Jeppesen, E.; Møller, P.H. Seasonal Dynamics in the Concentrations and Retention of Phosphorus in Shallow Danish Lakes after Reduced Loading. Aquat. Ecosyst. Health Manag. 2002, 5, 19–29. [Google Scholar] [CrossRef]
  4. Søndergaard, M.; Johansson, L.S.; Lauridsen, T.L.; Jørgensen, T.B.; Liboriussen, L.; Jeppesen, E. Submerged Macrophytes as Indicators of the Ecological Quality of Lakes. Freshw. Biol. 2010, 55, 893–908. [Google Scholar] [CrossRef]
  5. Thomaz, S.M. Ecosystem Services Provided by Freshwater Macrophytes. Hydrobiologia 2021, 1–21. [Google Scholar] [CrossRef]
  6. Nakatani, K.; Baumgartner, G.; Cavicchioli, M. Ecologia de Ovos e Larvas de Peixes. In A Planície de Inundação do Alto Rio Paraná: Aspectos Físicos, Biológicos e Socioeconômicos; Vazzoler, A., Agostinho, A., Hahn, N., Eds.; EDUEM/Nupélia: Maringá, Brazil, 1997; pp. 281–306. [Google Scholar]
  7. Carniatto, N.; Cunha, E.R.; Thomaz, S.M.; Quirino, B.A.; Fugi, R. Feeding of Fish Inhabiting Native and Non-Native Macrophyte Stands in a Neotropical Reservoir. Hydrobiologia 2020, 847, 1553–1563. [Google Scholar] [CrossRef]
  8. Pelicice, F.M.; Agostinho, A.A. Feeding Ecology of Fishes Associated with Egeria spp. Patches in a Tropical Reservoir, Brazil. Ecol. Freshw. Fish 2006, 15, 10–19. [Google Scholar] [CrossRef]
  9. Aleixo, M.H.F.; Quirino, B.A.; Yofukuji, K.Y.; Cardozo, A.L.P.; Fugi, R. Macrophyte Biomass Mediates Trophic Relationships between Congeneric Fishes and Invertebrate Communities. Limnologica 2022, 93, 125957. [Google Scholar] [CrossRef]
  10. Correa, S.B.; Winemiller, K.O. Niche Partitioning among Frugivorous Fishes in Response to Fluctuating Resources in the Amazonian Floodplain Forest. Ecology 2014, 95, 210–224. [Google Scholar] [CrossRef] [Green Version]
  11. Mateus, L.; Ortega, J.; Mendes, A.; Penha, J. Nonlinear Effect of Density on Trophic Niche Width and between-Individual Variation in Diet in a Neotropical Cichlid. Austral Ecol. 2016, 41, 492–500. [Google Scholar] [CrossRef]
  12. Carniatto, N.; Fugi, R.; Thomaz, S.M. Highly Segregated Trophic Niche of Two Congeneric Fish Species in Neotropical Floodplain Lakes. J. Fish Biol. 2017, 90, 1118–1125. [Google Scholar] [CrossRef]
  13. Abbey-Lee, R.N.; Gaiser, E.E.; Trexler, J.C. Relative Roles of Dispersal Dynamics and Competition in Determining the Isotopic Niche Breadth of a Wetland Fish. Freshw. Biol. 2013, 58, 780–792. [Google Scholar] [CrossRef] [Green Version]
  14. Walker, R.H.; Kluender, E.R.; Inebnit, T.E.; Reid Adams, S. Differences in Diet and Feeding Ecology of Similar-Sized Spotted (Lepisosteus oculatus) and Shortnose (Lepisosteus platostomus) Gars during Flooding of a South-Eastern US River. Ecol. Freshw. Fish 2013, 22, 617–625. [Google Scholar] [CrossRef]
  15. Warfe, D.M.; Barmuta, L.A. Habitat Structural Complexity Mediates Food Web Dynamics in a Freshwater Macrophyte Community. Oecologia 2006, 150, 141–154. [Google Scholar] [CrossRef]
  16. Pianka, E.R. Niche Overlap and Diffuse Competition. Proc. Natl. Acad. Sci. USA 1974, 71, 2141–2145. [Google Scholar] [CrossRef] [PubMed] [Green Version]
  17. Dukowska, M.; Grzybkowska, M. Coexistence of Fish Species in a Large Lowland River: Food Niche Partitioning between Small-Sized Percids, Cyprinids and Sticklebacks in Submersed Macrophytes. PLoS ONE 2014, 9, e109927. [Google Scholar] [CrossRef] [PubMed]
  18. MacArthur, R.; Pianka, E. On Optimal Use of a Patchy Environment. Am. Nat. 1966, 100, 603–609. [Google Scholar] [CrossRef] [Green Version]
  19. Vejříková, I.; Eloranta, A.P.; Vejřík, L.; Šmejkal, M.; Čech, M.; Sajdlová, Z.; Frouzová, J.; Kiljunen, M.; Peterka, J. Macrophytes Shape Trophic Niche Variation among Generalist Fishes. PLoS ONE 2017, 12, e0177114. [Google Scholar] [CrossRef]
  20. Rodrigues, L.; Bicudo, D.C.; Moschinicarlos, V. O Papel Do Perifíton em Áreas Alagáveis e nos Diagnósticos Ambientais. In Ecologia e Manejo de Macrófitas Aquáticas; Thomaz, S.M., Bini, L.M., Eds.; EDUEM: Maringá, Brazil, 2003; pp. 211–230. [Google Scholar]
  21. Schneck, F.; Schwarzbold, A.; Melo, A.S. Substrate Roughness Affects Stream Benthic Algal Diversity, Assemblage Composition, and Nestedness. J. N. Am. Benthol. Soc. 2011, 30, 1049–1056. [Google Scholar] [CrossRef]
  22. Thomaz, S.M.; Dibble, E.D.; Evangelista, L.R.; Higuti, J.; Bini, L.M. Influence of Aquatic Macrophyte Habitat Complexity on Invertebrate Abundance and Richness in Tropical Lagoons. Freshw. Biol. 2008, 53, 358–367. [Google Scholar] [CrossRef]
  23. Campos, R.; Rosa, J.; Ferreira, V.G.; Conceição, E.d.O.; Martens, K.; Higuti, J. Macrophyte Life Forms Influence the Effects of Environmental and Spatial Factors on the Beta-Diversity of Associated Ostracod Communities (Crustacea). Aquat. Sci. 2021, 83, 27. [Google Scholar] [CrossRef]
  24. Taniguchi, H.; Nakano, S.; Tokeshi, M. Influences of Habitat Complexity on the Diversity and Abundance of Epiphytic Invertebrates on Plants. Freshw. Biol. 2003, 48, 718–728. [Google Scholar] [CrossRef] [Green Version]
  25. Mormul, R.P.; Thomaz, S.M.; Takeda, A.M.; Behrend, R.D. Structural Complexity and Distance from Source Habitat Determine Invertebrate Abundance and Diversity. Biotropica 2011, 43, 738–745. [Google Scholar] [CrossRef]
  26. Walker, P.D.; Wijnhoven, S.; van der Velde, G. Macrophyte Presence and Growth form Influence Macroinvertebrate Community Structure. Aquat. Bot. 2013, 104, 80–87. [Google Scholar] [CrossRef]
  27. Brown, C.L.; Poe, T.P.; Iii, J.R.P.F.; Schloesser, D.W. Relationships of Phytomacrofauna to Surface Area in Naturally Occurring Macrophyte Stands. J. N. Am. Benthol. Soc. 1988, 7, 129–139. [Google Scholar] [CrossRef]
  28. Gotceitas, V. Plant Stem Density as a Cue in Patch Choice by Foraging Juvenile Bluegill Sunfish. Environ. Biol. Fishes 1990, 29, 227–232. [Google Scholar] [CrossRef]
  29. Cunha, E.R.; Winemiller, K.O.; Silva, J.C.B.; Lopes, T.M.; Gomes, L.C.; Thomaz, S.M.; Agostinho, A.A. α and β Diversity of Fishes in Relation to a Gradient of Habitat Structural Complexity Supports the Role of Environmental Filtering in Community Assembly. Aquat. Sci 2019, 81, 38. [Google Scholar] [CrossRef]
  30. Quirino, B.A.; Lansac-Tôha, F.M.; Thomaz, S.M.; Heino, J.; Fugi, R. Macrophyte Stand Complexity Explains the Functional α and β Diversity of Fish in a Tropical River-Floodplain. Aquat. Sci. 2021, 83, 12. [Google Scholar] [CrossRef]
  31. Miranda, L.E.; Hodges, K.B. Role of Aquatic Vegetation Coverage on Hypoxia and Sunfish Abundance in Bays of a Eutrophic Reservoir. Hydrobiologia 2000, 427, 51–57. [Google Scholar] [CrossRef]
  32. Bunch, A.J.; Allen, M.S.; Gwinn, D.C. Influence of Macrophyte-Induced Hypoxia on Fish Communities in Lakes with Altered Hydrology. Lake Reserv. Manag. 2015, 31, 11–19. [Google Scholar] [CrossRef]
  33. Harrel, S.L.; Dibble, E.D. Foraging Efficiency of Juvenile Bluegill, Lepomis macrochirus, among Different Vegetated Habitats. Environ. Biol. Fishes 2001, 62, 441–453. [Google Scholar] [CrossRef]
  34. Dibble, E.D.; Harrel, S.L. Largemouth Bass Diets in Two Aquatic Plant Communities. J. Aquat. Plant Manag. 1997, 35, 74–78. [Google Scholar]
  35. Savino, J.F.; Stein, R.A. Predator-Prey Interaction between Largemouth Bass and Bluegills as Influenced by Simulated, Submersed Vegetation. Trans. Am. Fish Soc. 1982, 111, 255–266. [Google Scholar] [CrossRef]
  36. Sammons, S.M.; Maceina, M.J. Changes in Diet and Food Consumption of Largemouth Bass Following Large-Scale Hydrilla Reduction in Lake Seminole, Georgia. Hydrobiologia 2006, 560, 109–120. [Google Scholar] [CrossRef]
  37. Liversage, K.; Nurkse, K.; Kotta, J.; Järv, L. Environmental Heterogeneity Associated with European Perch (Perca fluviatilis) Predation on Invasive Round Goby (Neogobius melanostomus). Mar. Environ. Res. 2017, 132, 132–139. [Google Scholar] [CrossRef] [PubMed]
  38. Priyadarshana, T.; Asaeda, T.; Manatunge, J. Foraging Behaviour of Planktivorous Fish in Artificial Vegetation: The Effects on Swimming and Feeding. Hydrobiologia 2001, 442, 231–239. [Google Scholar] [CrossRef]
  39. Middaugh, C.R.; Foley, C.J.; Höök, T.O. Local and Lake-Scale Habitat Effects on Abundance, Lengths, and Diets of Age-0 Largemouth Bass and Bluegill in Indiana Temperate Lakes. Trans. Am. Fish Soc. 2013, 142, 1576–1589. [Google Scholar] [CrossRef]
  40. Nohner, J.K.; Taylor, W.W.; Hayes, D.B.; Roth, B.M. Influence of Aquatic Macrophytes on Age-0 Largemouth Bass Growth and Diets. Trans. Am. Fish Soc. 2018, 147, 758–769. [Google Scholar] [CrossRef]
  41. Quirino, B.A.; Teixeira de Mello, F.; Deosti, S.; Bonecker, C.C.; Cardozo, A.L.P.; Yofukuji, K.Y.; Aleixo, M.H.F.; Fugi, R. Interactions between a Planktivorous Fish and Planktonic Microcrustaceans Mediated by the Biomass of Aquatic Macrophytes. J. Plankton Res. 2021, 43, 46–60. [Google Scholar] [CrossRef]
  42. Crowder, L.B.; Cooper, W.E. Habitat Structural Complexity and the Interaction between Bluegills and Their Prey. Ecology 1982, 63, 1802–1813. [Google Scholar] [CrossRef]
  43. Grenouillet, G.; Pont, D.; Seip, K.L. Abundance and Species Richness as a Function of Food Resources and Vegetation Structure: Juvenile Fish Assemblages in Rivers. Ecography 2002, 25, 641–650. [Google Scholar] [CrossRef] [Green Version]
  44. Eloranta, A.P.; Vejříková, I.; Čech, M.; Vejřík, L.; Holubová, M.; Šmejkal, M.; Frouzová, J.; Kiljunen, M.; Jones, R.I.; Peterka, J. Some like It Deep: Intraspecific Niche Segregation in Ruffe (Gymnocephalus cernua). Freshw. Biol. 2017, 62, 1401–1409. [Google Scholar] [CrossRef]
  45. Yofukuji, K.Y.; Cardozo, A.L.P.; Quirino, B.A.; Aleixo, M.H.F.; Fugi, R. Macrophyte Diversity Alters Invertebrate Community and Fish Diet. Hydrobiologia 2021, 848, 913–927. [Google Scholar] [CrossRef]
  46. Dias, R.M.; Tófoli, R.M.; Silva, J.C.B.; Gomes, L.C.; Agostinho, A.A. Effects of Habitat Complexity on Trophic Interactions of Three Congeneric Fish Species. Aquat. Ecol. 2022, 56, 877–889. [Google Scholar] [CrossRef]
  47. Cardozo, A.L.P.; Quirino, B.A.; Yofukuji, K.Y.; Aleixo, M.H.F.; Fugi, R. Habitat Complexity and Individual Variation in Diet and Morphology of a Fish Species Associated with Macrophytes. Ecol. Freshw. Fish. 2021, 30, 184–196. [Google Scholar] [CrossRef]
  48. Choi, J.Y.; Jeong, K.S.; Kim, S.K.; Joo, G.J. Impact of Habitat Heterogeneity on the Biodiversity and Density of the Zooplankton Community in Shallow Wetlands (Upo Wetlands, South Korea). Oceanol. Hydrobiol. Stud. 2016, 45, 485–492. [Google Scholar] [CrossRef]
  49. Pianka, E.R. Competition and Niche Theory. In Theoretical Ecology: Principles and Applications; May, R.M., Ed.; Blackwell Scientific: Oxford, UK, 1976; pp. 114–141. [Google Scholar]
  50. Carvalho, P.; Thomaz, S.M.; Kobayashi, J.T.; Bini, L.M. Species Richness Increases the Resilience of Wetland Plant Communities in a Tropical Floodplain. Austral Ecol. 2013, 38, 592–598. [Google Scholar] [CrossRef]
  51. Thomaz, S.M.; Bini, L.M.; Pagioro, T.A.; Murphy, K.J.; dos Santos, A.M.; Souza, D.C. Aquatic Macrophytes of the Upper Paraná River Floodplain: Patterns of Diversity, Biomass and Decomposition. In The Upper Paraná River and Its Floodplain: Physical Aspects, Ecology and Conservation; Agostinho, A.A., Thomaz, S.M., Hahn, N.S., Eds.; Backhuys Publishers: Leiden, The Netherlands, 2004; pp. 331–352. [Google Scholar]
  52. Lopes, T.M.; Cunha, E.R.; Silva, J.C.B.; Behrend, R.D.L.; Gomes, L.C. Dense Macrophytes Influence the Horizontal Distribution of Fish in Floodplain Lakes. Environ. Biol. Fishes 2015, 98, 1741–1755. [Google Scholar] [CrossRef]
  53. Thomaz, S.M.; Bini, L.M.; Bozelli, R.L. Floods Increase Similarity among Aquatic Habitats in River-Floodplain Systems. Hydrobiologia 2007, 579, 1–13. [Google Scholar] [CrossRef]
  54. Gomes, L.C.; Bulla, C.K.; Agostinho, A.A.; Vasconcelos, L.P.; Miranda, L.E. Fish Assemblage Dynamics in a Neotropical Floodplain Relative to Aquatic Macrophytes and the Homogenizing Effect of a Flood Pulse. Hydrobiologia 2012, 685, 97–107. [Google Scholar] [CrossRef]
  55. Dibble, E.D.; Pelicice, F.M. Influence of Aquatic Plant-Specific Habitat on an Assemblage of Small Neotropical Floodplain Fishes. Ecol. Freshw. Fish 2010, 19, 381–389. [Google Scholar] [CrossRef]
  56. Ota, R.R.; Deprá, G.C.; Graça, W.J.; Pavanelli, C.S. Peixes Da Planície de Inundação Do Alto Rio Paraná e Áreas Adjacentes: Revised, Annotated and Updated. Neotrop. Ichthyol. 2018, 16, e170094. [Google Scholar] [CrossRef]
  57. Lorenzi, H. Plantas Daninhas Do Brasil: Terrestres, Aquáticas, Parasitas e Tóxicas, 3rd ed.; Instituto Plantarum: Nova Odessa, Brazil, 2000. [Google Scholar]
  58. Pott, V.J.; Pott, A. Plantas Aquáticas Do Pantanal; Embrapa: Brasília, Brazil, 2000. [Google Scholar]
  59. McCafferty, W.P. Aquatic Entomology: The Fishermen’s and Ecologists’ Illustrated Guide to Insects and Their Relative; Jones and Bartlett Learning Publishers: Boston, MA, USA, 1983. [Google Scholar]
  60. Elmoor-Loureiro, L.M.A. Manual de Identificação de Cladóceros Límnicos Do Brasil; Universa: Brasília, Brazil, 1997. [Google Scholar]
  61. Hyslop, E.J. Stomach Contents Analysis—A Review of Methods and Their Application. J. Fish Biol. 1980, 17, 411–429. [Google Scholar] [CrossRef] [Green Version]
  62. Carniatto, N.; Fugi, R.; Quirino, B.A.; Cunha, E.R.; Thomaz, S.M. An Invasive and a Native Macrophyte Species Provide Similar Feeding Habitat for Fish. Ecol. Freshw. Fish 2020, 29, 112–120. [Google Scholar] [CrossRef]
  63. Zeileis, A.; Hothorn, T. Diagnostic Checking in Regression Relationships. R. News 2002, 2, 7–10. [Google Scholar]
  64. Ferrari, S.L.P.; Cribari-Neto, F. Beta Regression for Modelling Rates and Proportions. J. Appl. Stat. 2004, 31, 799–815. [Google Scholar] [CrossRef]
  65. Zeileis, A.; Cribari-Neto, F.; Gruen, B.; Kosmidis, I. Beta Regression. R Package Version 3.1-2. Available online: https://Cran.Rproject.Org/Web/Packages/Betareg/Betareg.Pdf (accessed on 1 December 2021).
  66. Hutchinson, G.E. An Introduction to Population Ecology; Yale University Press: New Haven, CT, USA, 1978. [Google Scholar]
  67. Legendre, P.; Legendre, L. Numerical Ecology, 3rd ed.; Elsevier Science BV: Amsterdam, CT, USA, 2012. [Google Scholar]
  68. R Core Team R: A Language and Environment for Statistical Computing. Vienna, Austria: R Foundation for Statistical Computing. Available online: http://www.r-project.org/ (accessed on 1 December 2021).
  69. Tokeshi, M.; Arakaki, S. Habitat Complexity in Aquatic Systems: Fractals and Beyond. Hydrobiologia 2012, 685, 27–47. [Google Scholar] [CrossRef]
  70. Carniatto, N.; Thomaz, S.M.; Cunha, E.R.; Fugi, R.; Ota, R.R. Effects of an Invasive Alien Poaceae on Aquatic Macrophytes and Fish Communities in a Neotropical Reservoir. Biotropica 2013, 45, 747–754. [Google Scholar] [CrossRef]
  71. Olson, M.H.; Young, B.P.; Blinkoff, K.D. Mechanisms Underlying Habitat Use of Juvenile Largemouth Bass and Smallmouth Bass. Trans. Am. Fish Soc. 2003, 132, 398–405. [Google Scholar] [CrossRef]
  72. Wang, H.L.; Li, Z.F.; Liu, Y.; Zhang, J.W.; Zhang, X.K.; Xie, J. Growth Responses of the Submerged Macrophyte Sago Pondweed (Potamogeton pectinatus) to Disturbance by Three Omnivorous Fishes. Appl. Ecol. Environ. Res. 2020, 18, 3639–3649. [Google Scholar] [CrossRef]
  73. Prado, A.V.R.; Goulart, E.; Pagotto, J.P.A. Ecomorphology and Use of Food Resources: Inter- and Intraspecific Relationships of Fish Fauna Associated with Macrophyte Stands. Neotrop. Ichthyol. 2016, 14, e150140. [Google Scholar] [CrossRef] [Green Version]
  74. Dibble, E.D. Assessment of Fish-Plant Interactions. Am. Fish. Soc. Symp. 1996, 16, 357–372. [Google Scholar]
  75. Padial, A.A.; Thomaz, S.M.; Agostinho, A.A. Effects of Structural Heterogeneity Provided by the Floating Macrophyte Eichhornia azurea on the Predation Efficiency and Habitat Use of the Small Neotropical Fish Moenkhausia Sanctaefilomenae. Hydrobiologia 2009, 624, 161–170. [Google Scholar] [CrossRef]
  76. Rao, W.; Ning, J.; Zhong, P.; Jeppesen, E.; Liu, Z. Size-Dependent Feeding of Omnivorous Nile Tilapia in a Macrophyte-Dominated Lake: Implications for Lake Management. Hydrobiologia 2015, 749, 125–134. [Google Scholar] [CrossRef]
  77. Gao, J.; Zhong, P.; Ning, J.; Liu, Z.; Jeppesen, E. Herbivory of Omnivorous Fish Shapes the Food Web Structure of a Chinese Tropical Eutrophic Lake: Evidence from Stable Isotope and Fish Gut Content Analyses. Water 2017, 9, 69. [Google Scholar] [CrossRef] [Green Version]
  78. Beisner, B.E.; McCauley, E.; Wrona, F.J. The Influence of Temperature and Food Chain Length on Plankton Predator-Prey Dynamics. Can. J. Fish. Aquat. Sci. 1997, 54, 586–595. [Google Scholar] [CrossRef]
  79. Arim, M.; Bozinovic, F.; Marquet, P.A. On the Relationship between Trophic Position, Body Mass and Temperature: Reformulating the Energy Limitation Hypothesis. Oikos 2007, 116, 1524–1530. [Google Scholar] [CrossRef]
  80. Pedro, F.; Maltchik, L.; Bianchini, I. Hydrologic Cycle and Dynamics of Aquatic Macrophytes in Two Intermittent Rivers of the Semi-Arid Region of Brazil. Braz. J. Biol. 2006, 66, 575–585. [Google Scholar] [CrossRef] [Green Version]
  81. Quirino, B.A.; Carniatto, N.; Guglielmetti, R.; Fugi, R. Changes in Diet and Niche Breadth of a Small Fish Species in Response to the Flood Pulse in a Neotropical Floodplain Lake. Limnologica 2017, 62, 126–131. [Google Scholar] [CrossRef]
  82. Habib, S.; Yousuf, A.R. Effect of Macrophytes on Phytophilous Macroinvertebrate Community: A Review. J. Entomol. Zool. Stud. 2015, 3, 377–384. [Google Scholar]
  83. Clemente, J.M.; Boll, T.; Teixeira de Mello, F.; Iglesias, C.; Pedersen, A.R.; Jeppesen, E.; Meerhoff, M. Role of Plant Architecture on Littoral Macroinvertebrates in Temperate and Subtropical Shallow Lakes: A Comparative Manipulative Field Experiment. Limnetica 2019, 38, 759–772. [Google Scholar] [CrossRef]
  84. Eloranta, A.P.; Kahilainen, K.K.; Amundsen, P.A.; Knudsen, R.; Harrod, C.; Jones, R.I. Lake Size and Fish Diversity Determine Resource Use and Trophic Position of a Top Predator in High-Latitude Lakes. Ecol. Evol. 2015, 5, 1664–1675. [Google Scholar] [CrossRef] [PubMed] [Green Version]
  85. Persson, L. Food Consumption and the Significance of Detritus and Algae to Intraspecific Competition in Roach Rutilus rutilus in a Shallow Eutrophic Lake. Oikos 1983, 41, 118. [Google Scholar] [CrossRef]
  86. Brabrand, A. Food of Roach (Rutilus rutilus) and Ide (Leusiscus idus): Significance of Diet Shift for Interspecific Competition in Omnivorous Fishes. Oecologia 1985, 66, 461–467. [Google Scholar] [CrossRef] [PubMed]
  87. Lovell, J.A.; Fletcher, D.E.; Cooper, S.D.; Vaun McArthur, J. Fish Predation and Macroinvertebrate Abundance on Snags in Low-Gradient Blackwater Streams. Freshw. Sci. 2017, 36, 626–634. [Google Scholar] [CrossRef]
  88. Bolnick, D.I.; Ingram, T.; Stutz, W.E.; Snowberg, L.K.; Lau, O.L.; Pauli, J.S. Ecological Release from Interspecific Competition Leads to Decoupled Changes in Population and Individual Niche Width. Proc. R. Soc. B Biol. Sci. 2010, 277, 1789–1797. [Google Scholar] [CrossRef] [PubMed] [Green Version]
  89. Corrêa, C.E.; Albrecht, M.P.; Hahn, N.S. Patterns of Niche Breadth and Feeding Overlap of the Fish Fauna in the Seasonal Brazilian Pantanal, Cuiabá River Basin. Neotrop. Ichthyol. 2011, 9, 637–646. [Google Scholar] [CrossRef] [Green Version]
  90. Sinistro, R. Top-down and Bottom-up Regulation of Planktonic Communities in a Warm Temperate Wetland. J. Plankton Res. 2010, 32, 209–220. [Google Scholar] [CrossRef]
  91. Kovalenko, K.E.; Thomaz, S.M.; Warfe, D.M. Habitat Complexity: Approaches and Future Directions. Hydrobiologia 2012, 685, 1–17. [Google Scholar] [CrossRef]
Figure 1. Map of the study area showing the sites (red points) where macrophyte stands were sampled in the Baía River (river–floodplain system of the Upper Paraná River, Brazil). EPSG: 4618.
Water 14 03543 g001
Figure 2. Fish foraging efficiency assessed by degree of stomach fullness, considering a general mean (a—gray dots) and a mean calculated for each trophic guild separately (b—colorful dots) related to the only variable with a significant effect in the generalized linear model performed for the general mean and for some of the trophic guilds. Dashed lines represent non-significant models. Note that log scale was used for macrophyte density.
Water 14 03543 g002
Figure 3. Parameter estimates of generalized linear models for the consumption of five food categories (higher plants, algae, insects, other invertebrates, and detritus) in relation to macrophyte and fish attributes. The dashed lines represent the confidence intervals. * = statistically significant values.
Water 14 03543 g003
Figure 4. Trophic niche breadth, assessed by the mean of the distance from the centroid (mDC) considering a general mean (a,c,e—gray dots) and a mean calculated for each trophic guild separately (b,d,f—colorful dots), related to the variables with a significant effect for some of the trophic guilds or for the general mean in the performed beta regression. Dashed lines represent non-significant models. Note that log scale was used for macrophyte density.
Water 14 03543 g004aWater 14 03543 g004b
Figure 5. Trophic niche overlap assessed by the mean of Pianka’s Index (mO) related to macrophyte density (a), fish diversity (b), and fish density (c)—the variables with significant effects in the performed beta regression. Note that log scale was used for macrophyte density.
Water 14 03543 g005aWater 14 03543 g005b
Table 1. Results of the generalized linear model for fish foraging efficiency assessed by degree of stomach fullness (mDF) considering a general mean and a mean calculated for each trophic guild separately. Herb = herbivores; Omni = omnivores; Insect = insectivores; Invert = invertivores. * = statistically significant values.
R2General MeanTrophic Guilds
HerbOmniInsectInvert
0.320.350.260.160.25
EstimateSEtptptptptp
(Intercept)0.660.381.750.09−0.120.904.57<0.01 *3.31<0.01 *2.43<0.01 *
Macrophyte density0.000.003.24<0.01 *2.170.04 *1.420.17−0.900.370.530.60
Macrophyte diversity−0.120.14−0.860.40−0.220.82−0.730.470.200.84−0.090.92
Fish density0.000.00−0.990.33−0.840.410.150.881.610.121.960.07
Fish diversity−0.040.30−0.130.890.680.51−1.030.311.050.301.860.06
Fish richness0.050.050.980.340.780.441.310.20−1.000.32−1.540.14
Table 2. Results of generalized linear models for the consumption of five food categories. * = statistically significant values.
R2Food Items
Higher PlantsAlgaeInsectsOther
Invertebrates
Detritus
0.430.470.290.210.42
tptptptptp
(Intercept)11.2<0.01 *8.37<0.01 *18.2<0.01 *10.2<0.01 *3.45<0.01 *
Macrophyte density2.380.03 *−1.510.14−0.640.53−0.570.571.030.31
Macrophyte diversity−3.77<0.01 *−3.20<0.01 *3.22<0.01 *0.620.54−2.640.01 *
Fish density−1.910.070.730.47−0.260.801.710.10−0.080.94
Fish diversity0.070.95−0.150.88−0.830.421.600.12−2.630.01 *
Fish richness2.490.02 *1.400.17−0.540.59−2.410.02 *2.010.06
Table 3. Results of beta regression analysis for the trophic niche breadth assessed by the mean distance from the centroid (mDC) considering a general mean and a mean calculated for each trophic guild separately. Herb = herbivores; Omni= omnivores; Insect = insectivores; Invert = invertivores. * = statistically significant values.
General MeanTrophic Guilds
HerbOmniInsectInvert
EstimateSEzpzpzpzpzp
(Intercept)−0.630.28−2.280.020.810.42−0.490.62−2.280.02 *−0.690.49
Macrophyte density<−0.000.00−1.950.05 *−0.070.94−2.90<0.01 *−0.590.55−0.890.37
Macrophyte diversity0.050.100.540.562.400.01 *0.700.480.860.39−0.900.37
Fish density<0.00<0.000.680.50−1.200.232.270.08−0.380.70−1.350.18
Fish diversity0.510.222.300.02 *−2.440.01 *1.74<0.02 *0.820.41−0.420.67
Fish richness−0.040.04−1.170.24−0.680.49−1.920.060.450.651.150.25
Table 4. Results of beta regression analysis for trophic niche breadth, assessed by Pianka’s Index (mO), considering a general mean. * = statistically significant values.
EstimateSEzp
(Intercept)1.380.801.720.09
Macrophyte density0.980.741.320.19
Macrophyte density2−1.710.75−2.290.02 *
Macrophyte diversity0.020.310.070.94
Fish density<−0.00<0.00−2.650.05 *
Fish diversity−1.850.70−1.95<0.01 *
Fish richness0.140.111.250.11
Publisher’s Note: MDPI stays neutral with regard to jurisdictional claims in published maps and institutional affiliations.

