
A Concise Review of Theoretical Models and Numerical Simulations of Membrane Fouling
by
Haiyan Yang
1,
Xuri Yu
2,
Junxia Liu
2,*,
Zhiwei Tang
2,
Tianyi Huang
2,
Zhihong Wang
2,
Qiyun Zhong
3,
Zhihong Long
3 and
Lin Wang
4,* 1
School of Environment, South China Normal University, Guangzhou 510006, China
2
School of Civil and Transportation Engineering, Guangdong University of Technology, Guangzhou 510006, China
3
Guangzhou Water Supply Co., Ltd., Guangzhou 510600, China
4
School of Municipal and Environmental Engineering, Shandong Jianzhu University, Jinan 250101, China
*
Authors to whom correspondence should be addressed.
Water 2022, 14(21), 3537; https://doi.org/10.3390/w14213537
Submission received: 17 September 2022
/
Revised: 27 October 2022
/
Accepted: 31 October 2022
/
Published: 3 November 2022
(This article belongs to the Special Issue Sustainable Water and Wastewater Treatment)
Abstract
:Membrane fouling can cause severe flux drops and affect the quality of produced water, which is a major obstacle for membrane applications. Great efforts have been made to examine theoretical models and numerical simulations for fouling behavior and mechanisms in the past decades, but there is a lack of literature providing a systematic summary. This work aims to present a state-of-the-art review of the principles, applicability and advantages of fouling theoretical models (i.e., the concentration polarization, cake layer formation and blocking models), and numerical simulations (i.e., computational fluid dynamics, Monte Carlo simulation, and artificial neural networks) for fouling behavior and mechanisms. Through these models and simulations, the behaviors of foulant particles at the microscopic level are analyzed in detail from the perspective of force, energy, and particle trajectory during the fouling process. The concise summary of fouling modeling in this review gives guidelines for the selection and application of models to simulate the membrane fouling process accurately, and the optimization of the operation in membrane-based processes.
1. Introduction
Due to the effective removal of contaminants with various sizes, from suspended solids to emerging pollutants, easy-to-operate and cost-effective membrane filtration technology is broadly applied in wastewater and drinking water treatment, water reuse, and desalination. However, membrane fouling, mainly including inorganic fouling (e.g., scaling), organic fouling (e.g., humic acids, polysaccharides) and biofouling (e.g., bacteria, fungi), can lead to reduced water production, increased operating costs, and shortened membrane service lifespan. Membrane fouling is thus one of the major barriers restricting their sustainable applications [1,2].
Membrane fouling is the successive processes of concentration polarization, membrane pore blockage, and cake layer formation [3,4], which are highly affected by feed characteristics, solution chemistry, membrane properties, and operating conditions [4,5,6]. These factors can significantly affect the transport of foulants towards the membrane and back-diffusion of particles away from the membrane, as well as the interfacial interaction between foulants and the membrane, thereby regulating fouling [4,7,8,9]. Owing to the complicated fouling process, theoretical simulations are often applied to reveal the underlying mechanism. Compared with experimental tests, investigation via theoretical models can achieve expected aims effectively and economically, providing a theoretical basis for fouling control strategies.
Traditionally, the concentration polarization model, cake layer formation, and pore blocking model have been developed and widely used to describe fouling behaviors over the past few decades [10,11,12]. With the on-going development in computer science (e.g., computer calculation and programming), various numerical simulation methods such as computational fluid dynamics (CFD), Monte Carlo (MC) simulation, and artificial neural networks (ANNs) have been increasingly applied as powerful tools to the intensive simulation of membrane fouling [13,14,15], especially combined with those theoretical models. Compared to the conventional theoretical models (i.e., concentration polarization, cake formation, and pore blocking), these numerical simulations for separate or combined application can describe the fouling behavior of particles in fine detail. Specifically, CFD is used mainly to simulate the fouling process by describing flow hydrodynamics (e.g., mass transfer) during the membrane process, while the MC approach is used to simulate fouling by describing the random trajectory of foulant particles. Meanwhile, ANNs can predict the membrane process in a comprehensive environmental matrix with high accuracy and simplicity through its powerful capability to learn and recognize trends. Despite the fundamental importance of understanding fouling mechanisms, fouling characteristics, and fouling control strategies, few articles have been published giving an overall review of fouling modelling, especially for the numerical simulation of fouling.
The object of this review is to provide a concise and critical summary of theoretical models and the numerical simulation approaches for membrane fouling. Their principles, applicability, and advantages are discussed in detail. Firstly, the major theoretical models, including concentration polarization, cake layer formation, and pore blocking are introduced from the perspective of the membrane fouling formation process, followed by a summary of the numerical simulation approaches of CFD, MC simulation, and ANNs. Through these models and simulations, the behaviors of foulant particles at the microscopic level are analyzed from the perspective of force, energy, and particle trajectory during the fouling process. Unlike the previous reviews which focused on theoretical models solely, or only on one specific numerical simulation approach (e.g., CFD [16], ANN [17]), the present study summarizes the theoretical models and numerical simulations for membrane fouling overall, which is to provide guidelines for the accurate selection and application of models to simulate membrane fouling and further optimization of membrane-based water treatment.
2. Theoretical Models
2.1. Concentration Polarization
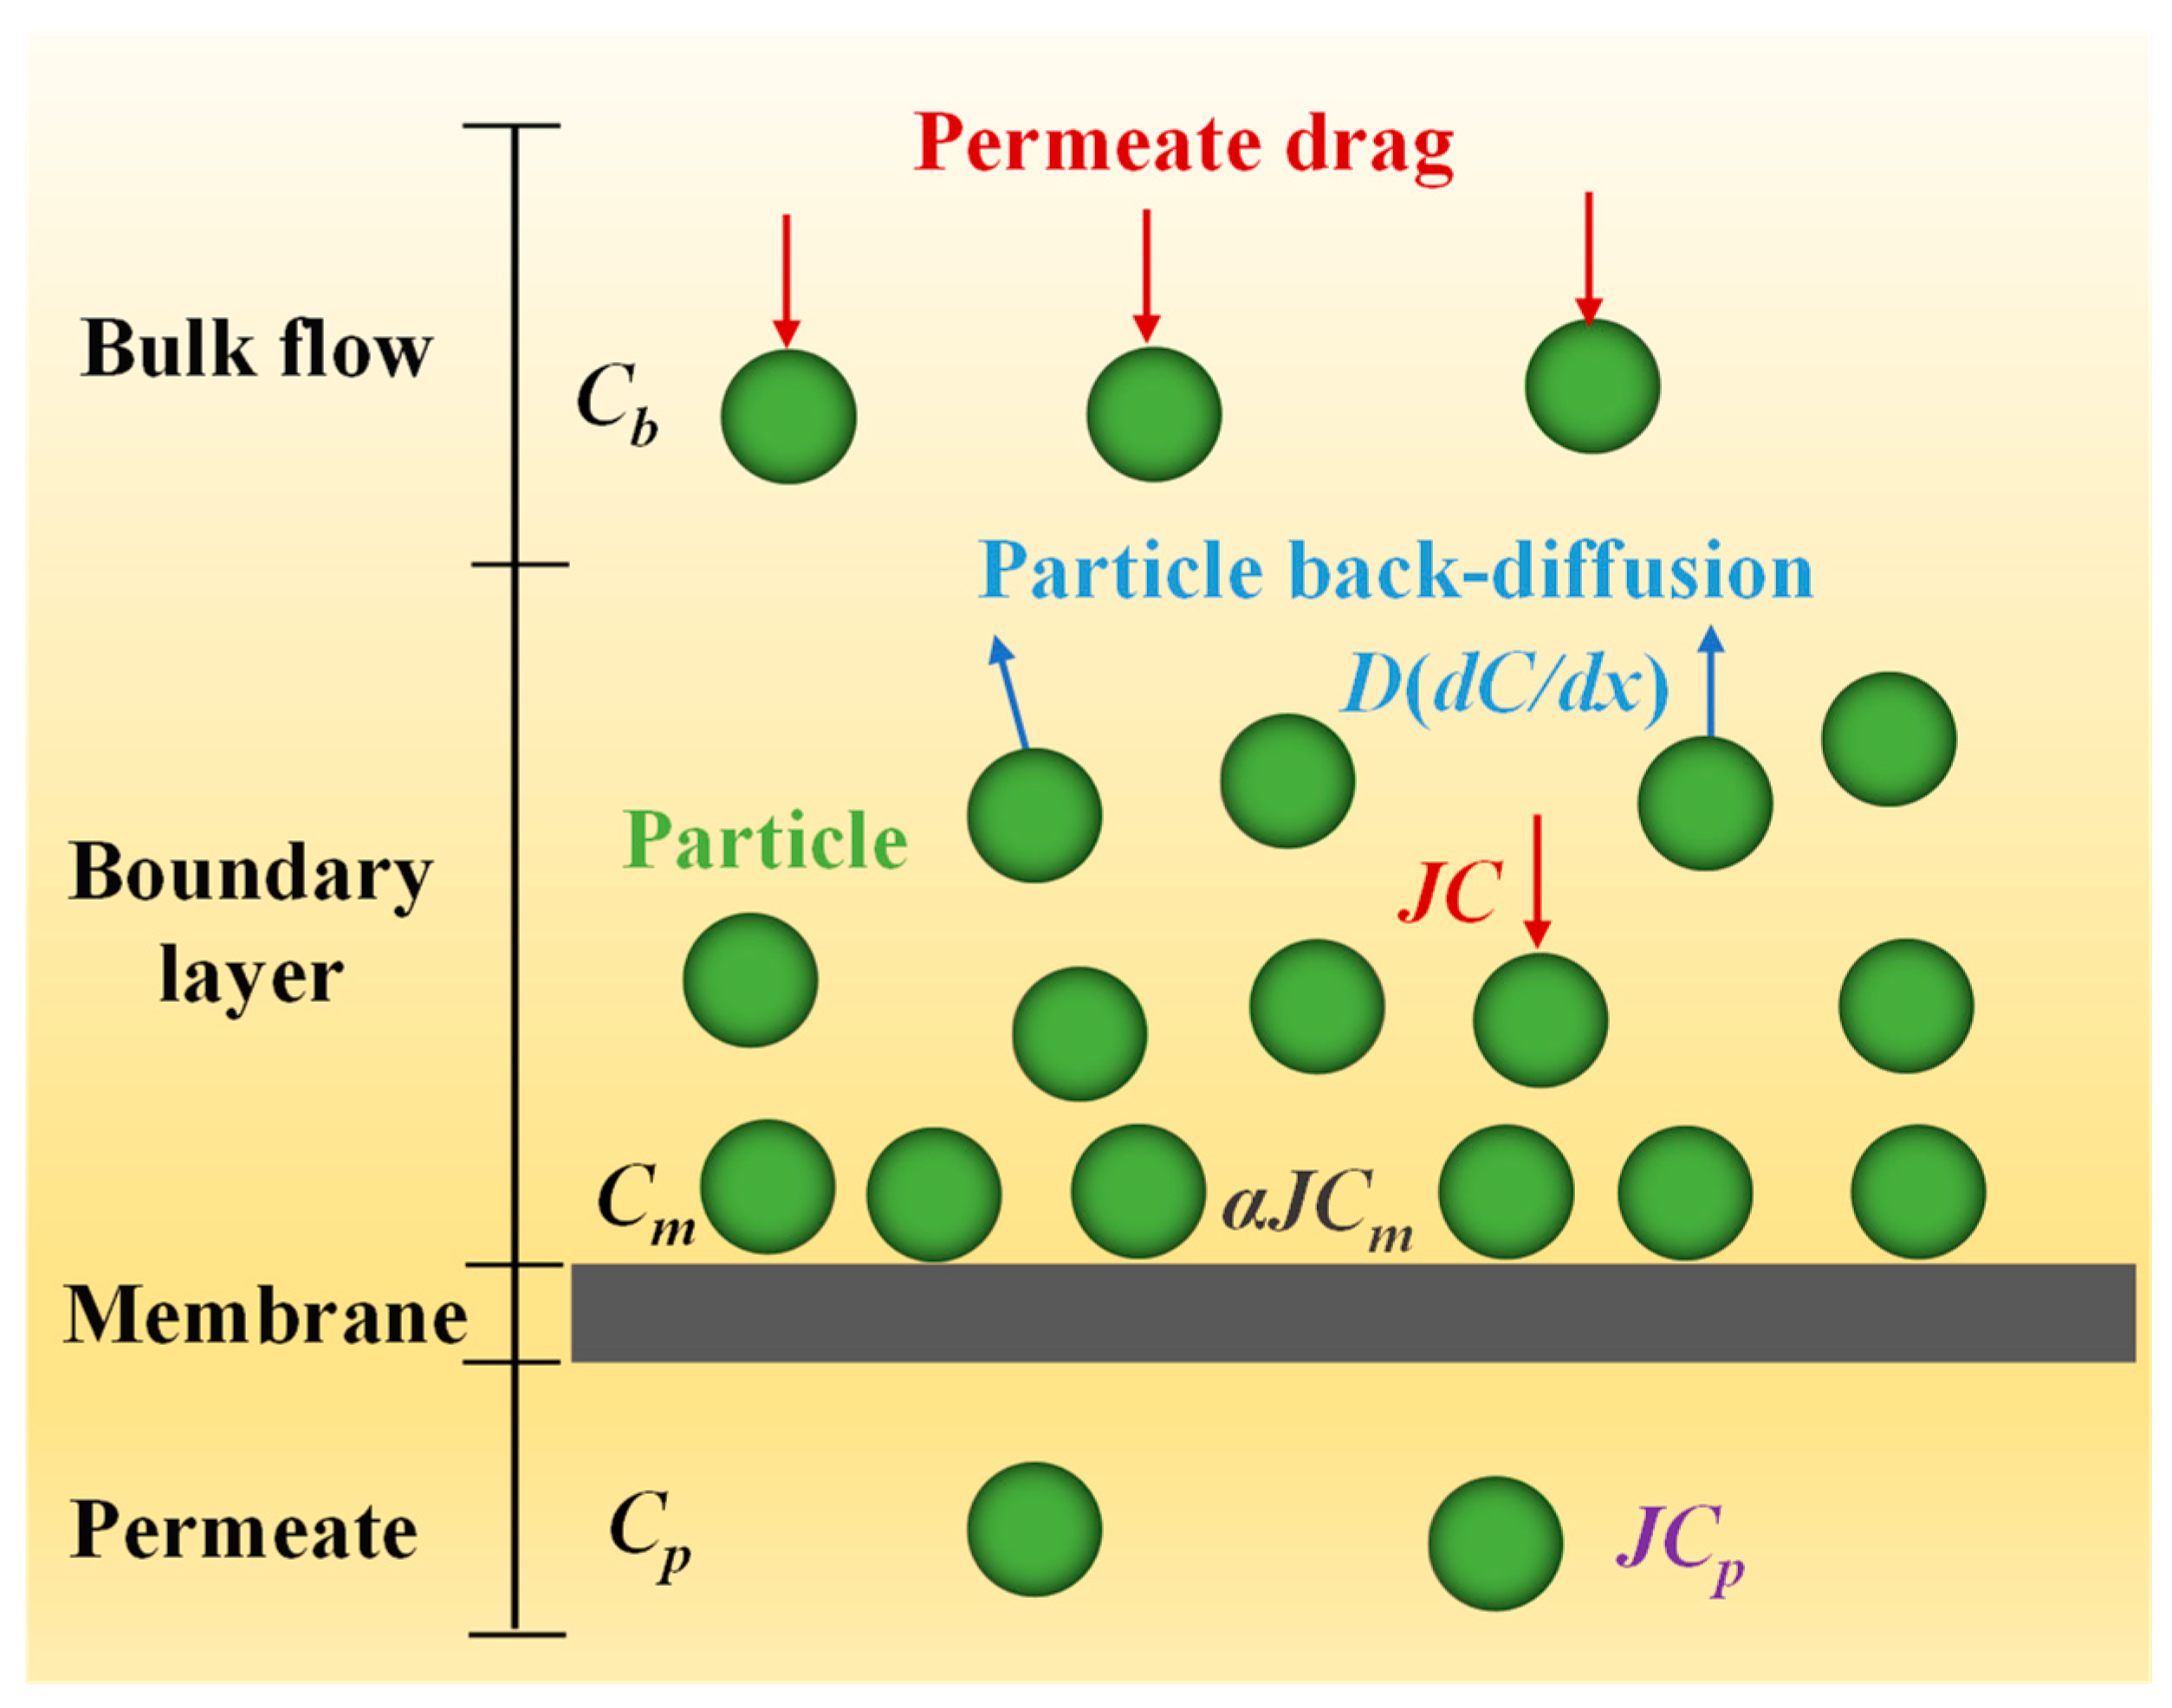
During membrane filtration, the foulant particles can transport towards the surface of the membrane by the permeate drag (Figure 1). The retention of foulants on the membrane can lead to an increased concentration of foulant near the membrane surface compared to that in the bulk flow. This phenomenon of the foulant concentration gradient is named concentration polarization (CP) [10]. At the same time, these foulant particles in the hydrodynamic boundary layer will back migrate towards the bulk flow due to the existence of the concentration gradient. In a steady state, the convection transport of solute towards the membrane surface (JC) is balanced by the back-diffusion transport D (dC ⁄ dx), and thus a film theory was proposed by Porker in 1972 to describe the CP phenomenon [10]:
where J and C are the solvent flux through the membrane, and the concentration of foulant at distance x away from membrane, respectively. D represents the particle diffusion coefficient, and represents the concentration gradient in the hydrodynamic boundary layer. The foulant concentration at x = 0 (i.e., at the membrane surface) is fixed at an upper limit (Cm) and the foulant concentration at x = δ (i.e., at the boundary layer near the bulk flow) is fixed at lower limit Cb [10]. Thus, the CP model enhances the integration of Equation (1) as:
where is the thickness of the boundary layer. Cm and Cb are the foulant concentration at the membrane surface and bulk flow, respectively. Equation (2) shows that the flux through the membrane J is dependent on the solute characteristics of D and Cm/Cb, and the boundary layer thickness . Operational management thus should be directed towards increasing D or decreasing δ. Here the diffusion coefficient D can be obtained according to the Stokes-Einstein equation [18]:
where kB is the Boltzmann’s constant; T represents the absolute temperature; μ represents the solution viscosity; and dp is the particle size. In addition, the term D/δ in the right part of Equation (2) is recognized as the mass transfer coefficient k [10]:
By substituting Equation (4) into Equation (2), one can obtain:
where J/k is Péclet number, the ratio of convective to diffusive transport in the boundary layer [6]. Cm/Cb is the CP modulus M, which represents the degree of CP [4]. It is worthwhile to note that the concentration of foulant in permeate Cp is not included in the mass balance (Equation (1)). Therefore, Equation (5) can be applied to model the CP behavior where the concentration of foulant in permeate Cp is negligible compared to that at the membrane surface Cm and bulk flow Cb (i.e., in the NF/RO process). When further considering the role of Cp, the convection transport of solute towards the membrane surface (JC) should be balanced by the sum of permeate JCp and the back diffusion transport D(dC ⁄dx) away from the membrane. Thus, Equation (5) can be expressed as a common form [19]:
Equations (5) and (6) are the typical CP models, which were widely applied to scale the CP in processes such as reverse osmosis (RO), nanofiltration (NF), ultrafiltration (UF), and microfiltration (MF) [5,6,10,19].
An important assumption in conventional CP models (i.e., Equations (5) and (6)) is that the deposit of foulants onto the membrane is not considered in the mass balance. On this account, the influence of the deposited foulants on CP was further considered. For example, Kostoglou and Karabelas considered the probability of attachment which was expected to depend on the physical properties of the particles [20]. Furthermore, Liu and co-workers [5,6,18] recently proposed a modified CP model stating that the convection transport of foulant towards the membrane (JC) depended on the balance of the back diffusion D(dC/dx), the permeate JCp, and the foulant loss from the solution phase because of their attachment onto the membrane αJCm. Accordingly, the CP model can be given by [6]:
where α is the attachment coefficient, which describes the probability of the successful attachment of foulant when particles transport and collide with the membrane. The value of α is therefore between 0 and 1, which represents the conditions from that collision never resulting in fouling (α = 0), to that collision always leading to colloidal attachment (α = 1). To determine α, Liu et al. [6] further adopted the classical Boltzmann distribution to describe the number density of particles during their attachment in different energy states. For attachment of a free particle onto the membrane, the particle must overcome the potential energy barrier of ΔEb inducing from the membrane–colloid interaction [21]. At the same time, a potential energy ΔEd is provided to promote its attachment by the hydrodynamic drag force acting on the particle [18]. Therefore, the attachment coefficient α can be given by:
A distinct feature of Equations (7) and (8) is that they can be applied to simulate the role of membrane-colloid interaction in CP, which is often overlooked in traditional CP models (Equations (5) and (6)).
2.2. Cake Formation
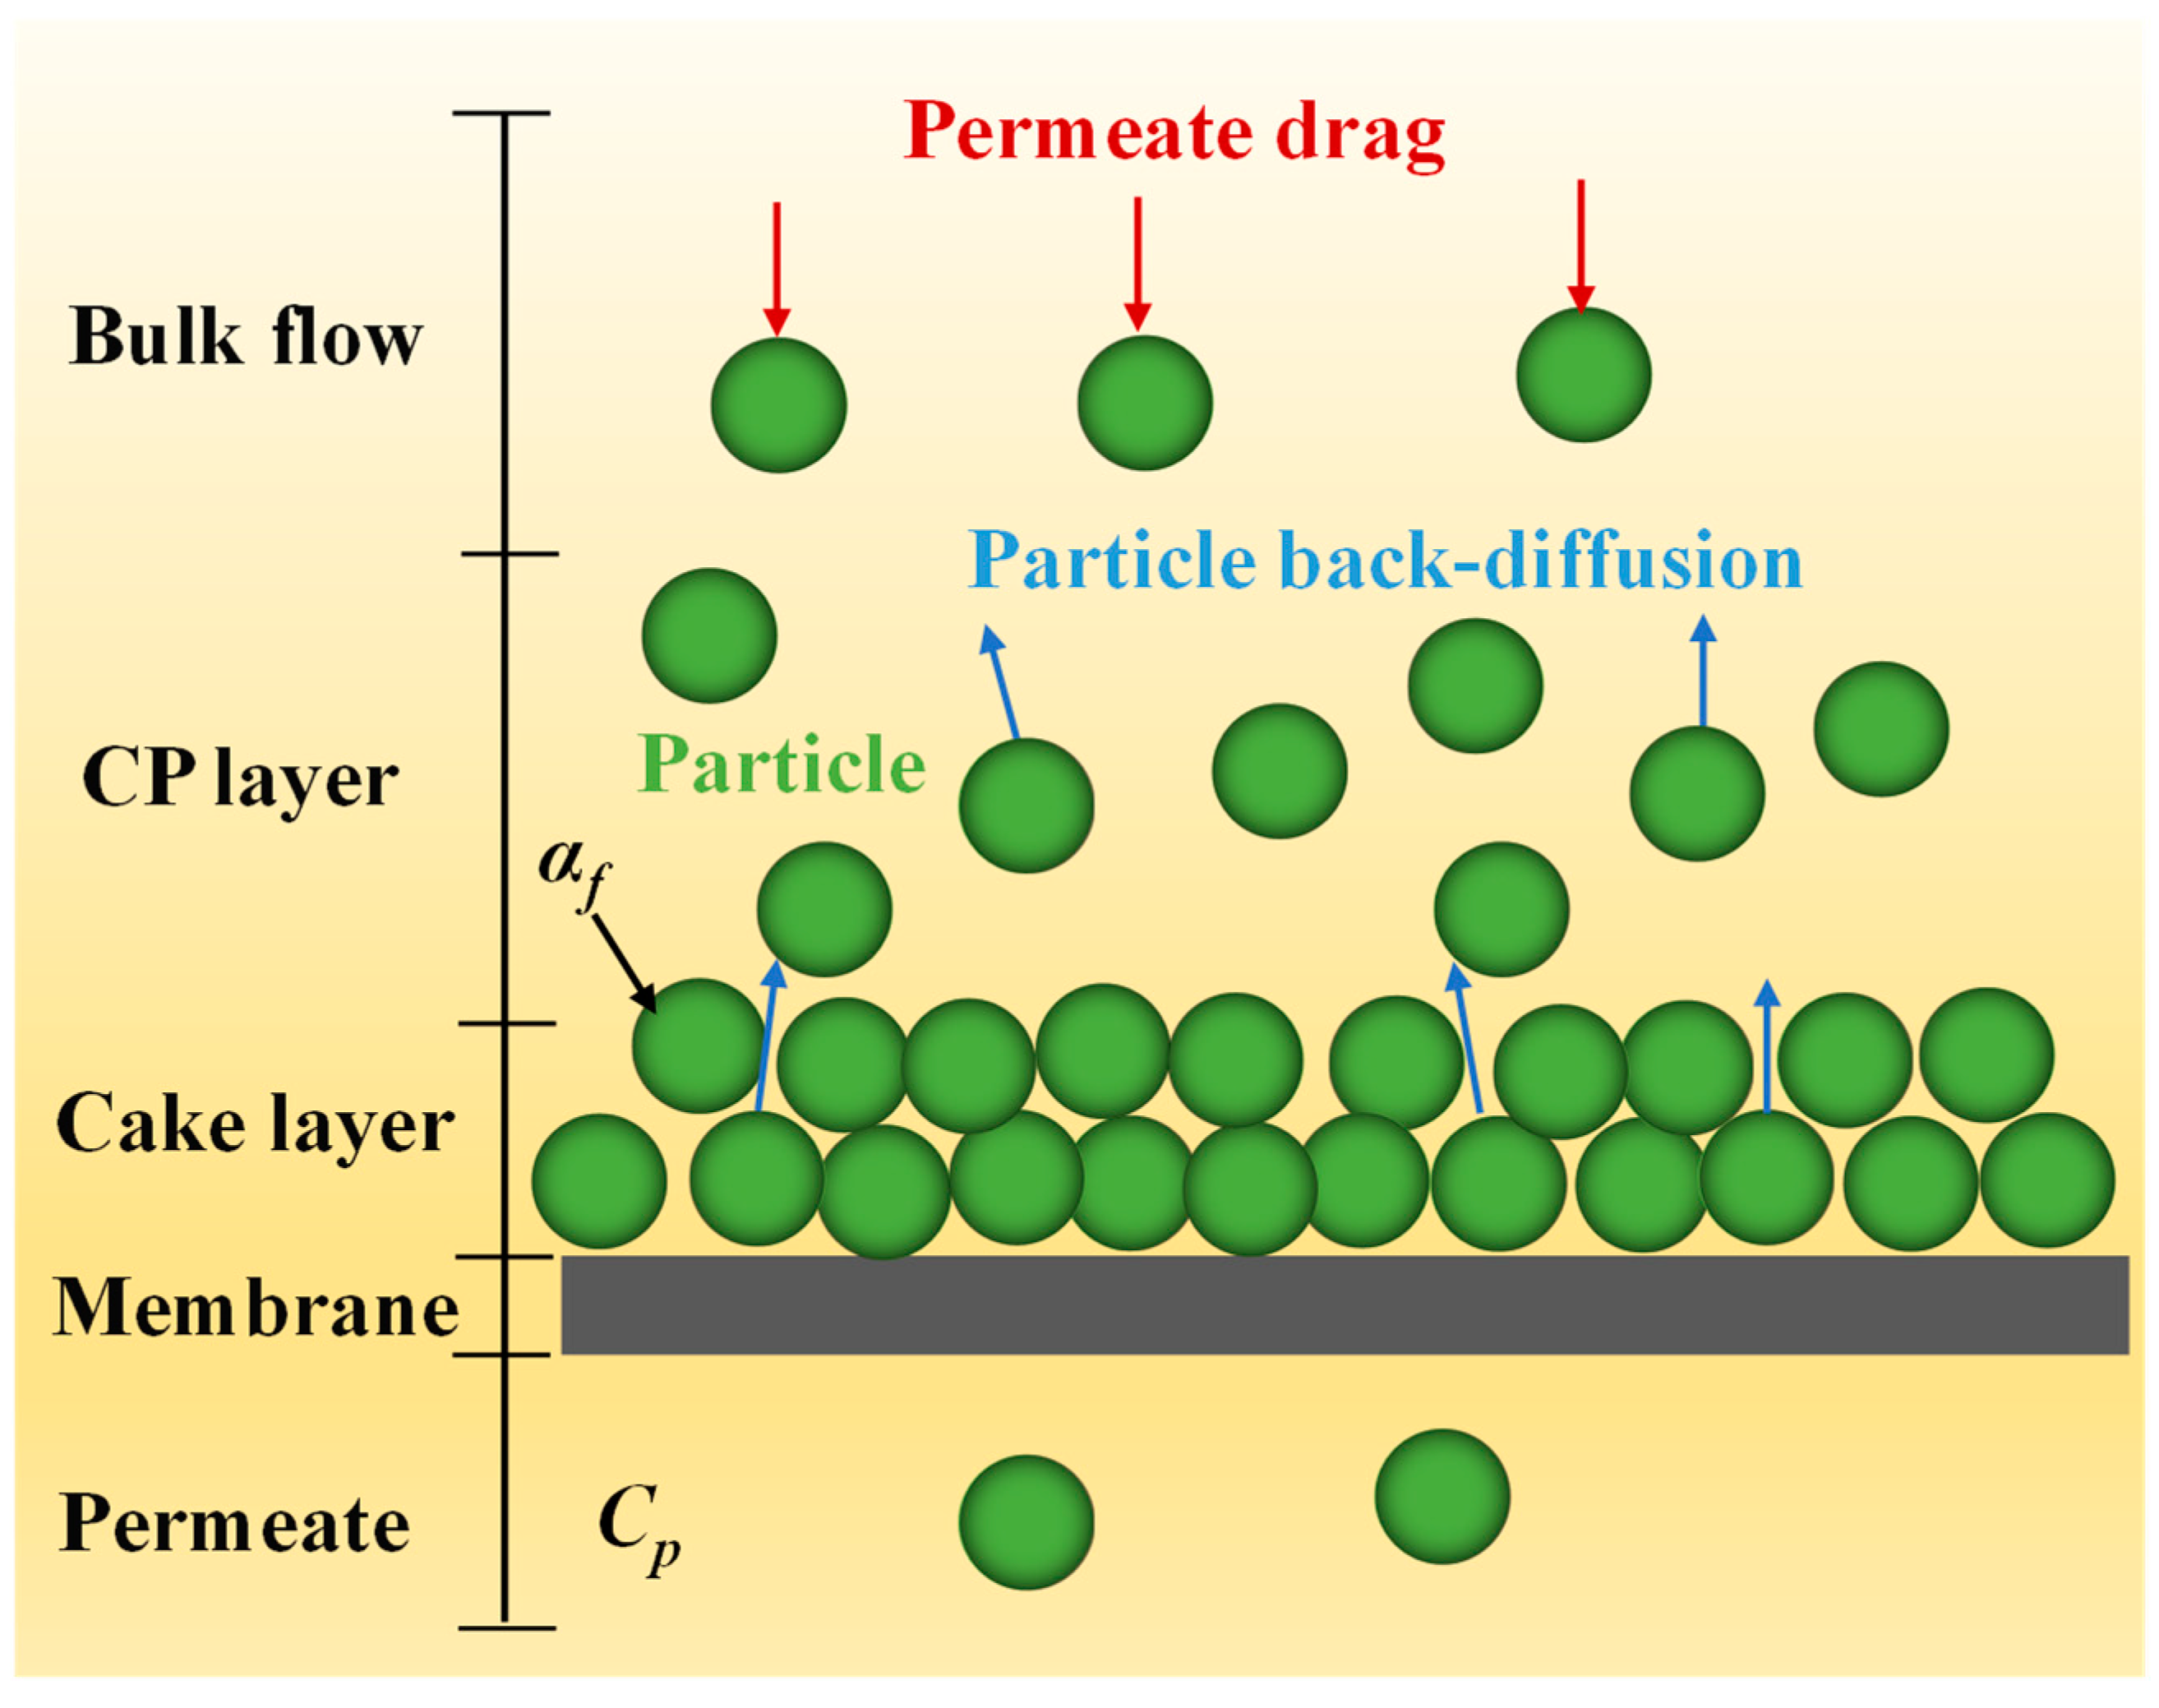
A fouling cake layer is formed with more and more foulant attaching onto the membrane surface (Figure 2), which results in an additional hydraulic resistance (i.e., the cake resistance Rf). The membrane permeate flux is thus decreased under constant applied pressure due to this cake resistance. Based on Darcy’s law [22], the permeate flux can be expressed as:
where and are the applied pressure and membrane inherent resistance, respectively. The cake resistance Rf is decided by the foulant mass deposition mf and specific cake resistance αf as shown in Equation (10):
It is well known that the specific cake resistance αf exerts important roles in membrane fouling [23,24,25]. The value of αf can be calculated by the Carmen–Kozeny equation [26]:
where , are the cake layer porosity and particle density, respectively. In addition, αf can also be experimentally determined according to the foulant mass deposition mf and flux variation [27]:
where J0 and Jf is the initial flux and final flux, respectively, for any given filtration period.
The cake layer is considered to be compressible and soft, in which case the specific cake resistance strengthens with the operational pressure [28,29,30]. An empirical power law is assumed as Equation (13) for practical purposes [30,31]:
where β and s represent an empirical coefficient and the cake compressibility, respectively. Notably, αf cannot change with respect to ΔP when s = 0 for incompressible foulant cake layers, and the value of s is larger for a more compressible cake layer. It was reported that the value of s ranges from 0.4–1.0 for UF and MF membranes fouled by bentonite and kaolin particles [32]. In addition, the value of s is highly affected by the solution chemistry. For silica colloids fouling UF membranes, s is ~0.82 in distilled water, and it decreases to ~0.36 when ionic strength increases to 100 mM [33].
The cake layer filtration model considers the effects of deposition kinetics and the resistance of the deposit layer on the fouling process. It is suitable for the simulation of cake layer formation. Besides introducing an additional hydraulic resistance, the cake-enhanced osmotic pressure (CEOP) phenomenon is also induced by the foulant cake layer [34]. The CEOP phenomenon arises by the hindered back diffusion of salt ions and particles from the fouled membrane surface to the bulk solution, in which the foulants diffuse within the cake layer through tortuous paths [4]. This causes the osmotic pressure and the concentration of solute at the membrane wall to be significantly enhanced [34,35]. This CEOP is also a source of flux decline, which is expressed as a modified cake filtration model [34]:
where represents the drop of transient osmotic pressure. This CEOP model provides insights into membrane fouling driven by osmotic pressure, which successfully simulates the fouling process of forward osmosis (FO) [36], reverse osmosis (RO) [35], and pressure-retarded osmosis (PRO) [37], where the osmotic pressure cannot be neglected during membrane filtration.
2.3. Pore Blocking
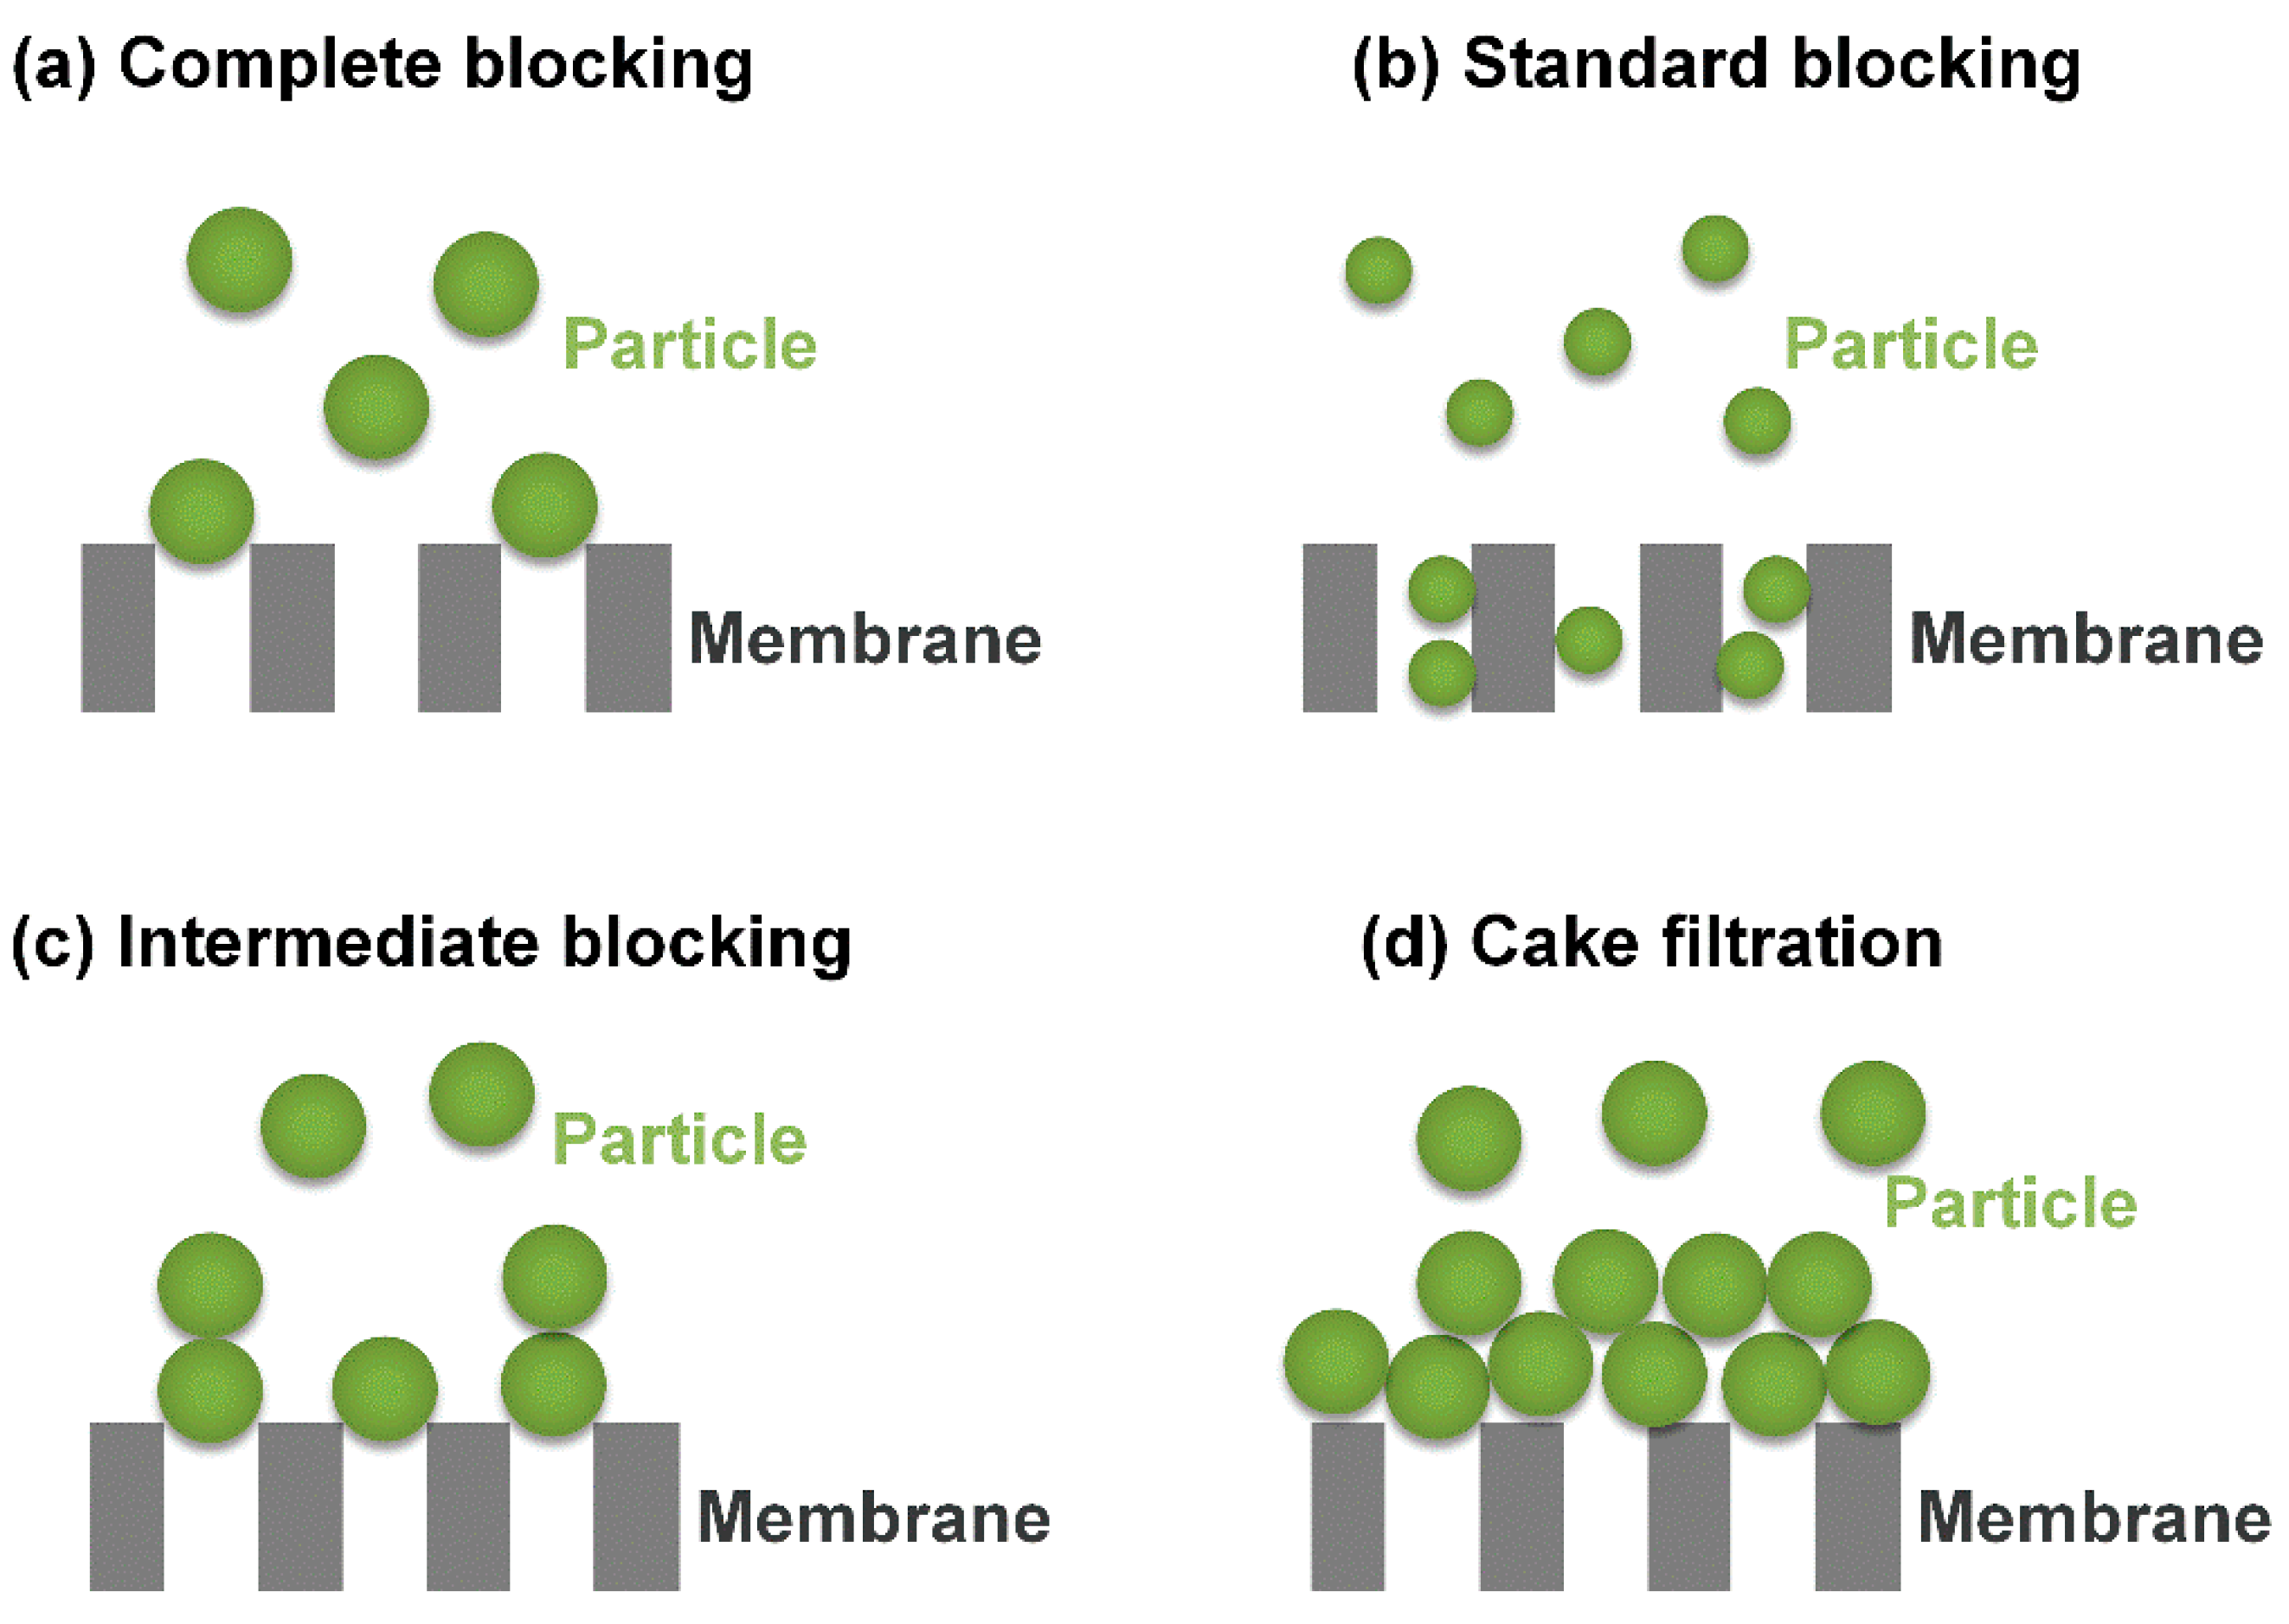
For porous MF/UF membranes, pore blocking is also a significant factor leading to a drop in water flux. Particles with a smaller size compared to the size of the membrane pores will deposit or adsorb onto the pore wall. The attached particles will narrow the pore size, and thus reduce the flow cross-sectional area significantly [38,39,40], while particles with a larger size compared to the size of the membrane pores will block pore entrances, leading to increased filtration resistance, and form a contiguous cake layer which can block or attach on the membrane surface [3,41]. Based on the physical mechanisms of pore blockage, Hermans and Bredee [12] proposed four blocking models, which are complete pore blocking, standard pore blocking, intermediate pore blocking, and cake filtration (Figure 3).
After that, Hermia [3] proposed another mathematical equation for the above blocking processes using the common power law framework for non-Newtonian fluids, which can be given by:
where V and t are the cumulative filtrate volume in unit area, and the filtration time, respectively. K is the resistance coefficient, and n represents the pore blocking index, a dimensionless filtration constant depended on the pore blocking situation. The value of n is 2, 1.5, 1 and 0, for complete pore blocking, standard pore blocking, intermediate pore blocking and cake filtration, respectively.
In complete pore blocking (Figure 3a), each particle completely blocks an open pore where the particle size is larger than that of the membrane. It is assumed that all particles deposited onto the membrane surface are ‘‘sealing’’ membrane pores [40]. It is idealized to assume that no particles are on the membrane surface or on top of other particles. The formula of complete pore blocking (n = 2) can be expressed as Equation (16) [39], where Kc represents the complete pore blocking coefficient.
In the standard pore blocking law (Figure 3b), the particle size is considerably smaller than the pore size. The flux decline therefore is caused by the constriction of membrane pores due to the small particles deposited onto the pore walls [3]. The equation of standard pore blocking (n = 1.5) can be given as [39]:
where Ks represents the standard pore blocking coefficient.
For intermediate pore blocking (Figure 3c), those foulants reaching the membrane cause not only pore blocking, but also the attachment on other, already deposited, fouling particles [41]. The model of intermediate pore blocking (n = 1) can be described as [39,41]:
where Ki is the intermediate pore blocking coefficient.
In the case of cake filtration (Figure 3d), the cake layer gradually grows as filtration proceeds. Particles do not change the membrane pores since the cake layer forms on the membrane surface, increasing hydraulic resistance [3]. The law of cake formation (n = 0) is given by [39,41]:
where Kcf is the complete pore blocking coefficient.
Pore blocking is a critical factor controlling the overall performance of membrane filtration. The blocking filtration laws, including complete blocking, standard blocking, intermediate blocking, and cake filtration, are convenient to confirm fouling mechanisms from experimental data, and thus can provide guidelines in selecting the membrane module and fouling control strategies. It has been widely applied in the fouling simulation for MF [38,42], UF [39,43] and membrane bioreactors (MBR) [44,45]. However, an obvious shortcoming of the Hermia blocking models is the difficulty in identifying the behavior of solution chemistry and colloid-membrane interaction on fouling.
3. Numerical Simulation
3.1. Computational Fluid Dynamics (CFD)
CFD is a branch of the science of fluid mechanics that produces quantitative predictions of the fluid flow phenomena according to the conservation laws. In the CFD simulation, the governing equations of fluid flow are discretized through the finite difference, finite volume, or finite element methods; the numerical solutions of fluid flow (e.g., mass, momentum, and energy) are then developed at the desired boundary conditions using computer calculations. A variety of approaches are utilized in multiphase simulations of CFD, such as volume of fluid (VOF), coupled VOF and level-set (CLSVOF), the Lattice-Boltzmann and Eulerian methods [46]. As a result, CFD can provide a detailed quantitative description of flow hydrodynamics, which could hardly be achieved by conventional experimental tests [47,48,49,50].
CFD is an effective modeling tool for the study of membrane fouling. To describe the fouling process, the CFD model coupled with the Navier-Stokes equation and Darcy’s law has been developed for the simulation of fluid flow in porous tubes [51]. In this model, the governing equations (conservation equations of mass, momentum, and energy) are linearized and solved numerically using a finite difference scheme with dynamically updating boundary conditions. The continuity equation of mass is expressed as Equation (20), where is the fluid density, and and represent the distance and fluid velocity at i direction, respectively.
The conservation equation of momentum is expressed as Equation (21), where p, and f are pressure, viscous stress, and body force, respectively.
The conservation equation of energy is expressed as Equation (22), where e, T and Se are energy, temperature, and the source term of energy, respectively.
Compared with those approaches using simple equations, the spatial variation in driving force [52], and the physical properties dependent on concentrations [53] are considered in the CFD simulation. Thus, more comprehensive, and accurate solutions regarding flow field, the concentration distribution as well as the fouling resistance can be obtained. Due to the ability to predict local variables and time factors, CFD has been widely applied to explore the processes of fluid flow transmission and fouling, as well as the critical parameters for these processes in pressure-derived membranes, membrane distillation, MBR, reverse osmosis filtration and other membrane-based separations [54,55,56,57,58,59]. The recent applications of CFD in membrane simulations have been summarized in Table 1.
For example, CFD has been used successfully to simulate the fluid velocity for MF and UF filtration accurately [60,61], and explain the negligible impact of a powdered activated carbon layer on the permeation of mobile genetic elements [60]. In addition, 2D and 3D CFD simulations have been developed to study the comprehensive effects of operating conditions (e.g., feed and permeate velocities, temperatures, and salinities) and membrane modules (e.g., system length, membrane conductivity and thickness) on MD treatment [57,58,62,63]. The relationship between mass transfer and heat transfer have been explored for different MD configurations using a CFD simulation. For instance, temperature polarization was found to be more significant at high feed temperature and low feed velocity for vacuum MD [58]. Liang et al. also found that slip velocity was a major driving force of mass transfer and flux enhancement for the electro-osmosis process using a CFD simulation [64]. Additionally, CFD was applied to simulate the water quality, multiphase dynamics, and the backwashing process for MBR [56,65]. The simulation results suggested that the membrane fouling level can alter the backwash solution velocity inside fiber lumen and have a further effect on effective backwash length [56]. As a result, CFD modeling is also a useful tool to provide guidelines on the membrane module design, process optimization, as well as module scale-up through simulation of membrane processes under different conditions [58,63,65,66,67,68] (Table 1). The fluid velocity distribution of microfiltration simulated by CFD, combined with the experimental microfiltration test data, suggested that the optimal geometry of the turbulence promoter should be elliptical for enhancing filtration flux and mitigating fouling. Meanwhile, a 3D CFD model was developed to simulate the multiphase dynamics and water quality of MBR to obtain the optimized level of gas–liquid dispersion for membrane scouring, achieving cost-effective membrane scouring and nitrogen removal [65]. Zhang et al. [58] obtained a short module design for high thermal efficiency of vacuum membrane distillation through analyzing the effects of operating conditions and module dimensions on heat transfer by using a CFD model.

Table 1.
Application of CFD for fouling simulation in different membrane systems from the literature.
Table 1.
Application of CFD for fouling simulation in different membrane systems from the literature.
| Membranes | Aims | Highlights | References |
|---|---|---|---|
| RO/NF |
|
| [69] |
|
| [66] | |
|
| [67] | |
|
| [70] | |
| Electro-osmosis |
|
| [55] |
| UF |
|
| [60] |
| MF |
|
| [68] |
|
| [61] | |
| MBR |
|
| [65] |
|
| [56] | |
| Distillation |
|
| [62] |
|
| [58] | |
|
| [63] | |
| Forward Osmosis (FO) |
|
| [71] |
CFD is a powerful tool to study the parameters of fluid characteristic and distribution during the filtration process. It also has unparalleled flexibility in seeking optimal operating conditions and membrane module design. However, CFD cannot use a universal model for simulation of contaminant removal of both low pressure (e.g., UF and MF) and high pressure (e.g., RO and NF) membrane filtration due to their different mechanisms. The high accuracy achieved by CFD simulation requires huge calculations and computer power. In addition, the times required for calculations are lengthy.
3.2. Monte Carlo Simulation
The Monte Carlo (MC) simulation is an approach to describe the random movements of particles by capturing the fine details of distinct force and the resulting random particles displacement [14]. During an MC simulation, a stochastic modeling strategy is utilized for the selection of discrete particle displacements with statistical randomness and evaluation of the selection based on its physical validity. As the simulation proceeds, each particle trajectory can be mapped through the generation of a pool of statistically random and discrete particle movements at the microscopic level [14].
Among various numerical models in microscopic scale, the MC simulation is a computationally efficient algorithm for multiparticle interactions [72]. Briefly, the probability distribution is firstly developed according to the experimental conditions (e.g., effective membrane pore size and molecular solute). Sampling is then conducted by random number based on the Poisson probability distribution and the results are estimated based on the probability of particle random displacements. The particle i is supposed to be randomly displaced from the location of to using the algorithm:
where represents a random number with value of 0–1, and represents the maximum displacement allowed. The proposed displacement of the particle is then evaluated to be accepted or rejected, with a criterion of the change in potential energy for the system calculated by Equation (24):
If > 0, the proposed move is uphill; if < 0, the proposed move is downhill. Whether the move is accepted or not is dependent on the qualification of the probability which is corresponded to the Boltzmann factor for the energy difference in the Metropolis method:
where β′ is equal to 1/kBT. A uniform random number (0–1) is generated and compared with When < , the uphill move is accepted. Otherwise ( ≥ , the proposed move is rejected.
The MC simulation can capture the random movement of particles at the microscopic level and thus accurately describe the trajectory, collision, and energy of these particles in the short time step. In the past decades, the MC approach has been extensively applied to simulate the mass transport and fouling behavior during the membrane filtration processes of MF, UF, NF and RO, etc. The application of the MC approach for the simulation of membrane fouling is listed in Table 2.
For porous UF/MF membranes, the MC simulation can be adopted to model the behaviors of pore blocking [73,74,75], cake formation/structure [72,73] and phase transition phenomenon [14]. For instance, Chen et al. [74] performed the MC method to simulate particle capture and membrane pore blocking within the early stage of MF and found that a narrow pore distribution and high porosity of the membrane was unfavorable for pore blocking. Furthermore, Chen and co-workers [73] adopted the MC method coupled with DLVO theory for cake layer formation simulation and found that the morphology and density of the cake layer varied at different capture probabilities, which depended on the energy barrier and flow modes. In addition to the above factors, the roles of the foulant zeta potential, feed ionic strength, osmotic pressure, and the diffusion coefficient on the volume fraction of the particle deposit process (i.e., phase transition phenomenon), can also been simulated by the MC approach [76,77].
For nano/non-porous NF/RO membranes, an MC simulation can be utilized to model the effects of membrane properties, membrane defects as well as foulant–membrane interaction on mass transport and fouling. For example, Xu and Chen [78] adopted the MC approach to investigate the effect of nanoparticles (NPs) in the active layer of a thin film composite membrane on its flux enhancement, in which the addition of porous or even non-porous NPs was simulated to produce an obvious flux elevation. Membrane defects were unavoidable in membrane fabrication [2,79]. With the help of the MC model, Elimelech and co-workers [80] found that small imperfections in the stacking of 2D laminate nanosheets led to the emergence of microporous framework defects in the membrane’s matrix. They further found 2D nanomaterial frameworks with a packing density of 75% were projected to achieve <92% NaCl rejection at a water permeability of <1 Lm−2 h−1 bar−1, even with ideal interlayer spacing [81]. Liu et al. [82] also dissected the different effects of local defects on fouling due to their local energy barrier towards the membrane surface. Through a collision–attachment-based MC approach, Liu and co-workers [5] systematically investigated the transitional fouling behavior from foulant–clean membrane interaction (F-M) to foulant–deposited-membrane interaction (F-F) for colloidal fouling of NF/RO membranes. They further applied the MC approach to dissect the effect of local defects of the local energy barrier of the membrane surface and found that when F-F repulsion (Ef) was above a critical value (Ec), flux stability was independent of defects; when Ef < Ec and Em (F-M energy barrier) ≥ Ec, large coverage or a low energy barrier of defects enhanced fouling; for Ef < Ec and Em < Ec, serious fouling occurred with/without defects [82].
Besides the MF/UF and RO/NF processes, the MC method can also be applied to model MD processes [83,84]. For example, Khayet and co-workers [83] performed the MC method to examine heat and mass transfer applying direct contact MD process. Their MC model can simultaneously simulate the vapor flux and membrane surface temperatures, with the results well in agreement with the experimental data. Imdakm et al. [84] adopted an MC simulation to describe the vapor flux in a vacuum distillation process, and found that the higher feed temperature and larger pore size didn’t necessarily result in an elevated vapor flux.
Despite the fundamental advances achieved, there are still some serious concerns in implementing the MC method for predicting membrane fouling, including (1) most reported MC models estimate the compressive force using only the cake volume fraction, but cannot simulate the force summation or transfer phenomenon; (2) colloidal particles can overcome the repulsive barrier, and directly contact and adhere to each other when the hydrodynamic drag force is enhanced too much. In this condition, the MC simulation thus cannot accurately evaluate the adhesion forces [72].
Table 2.
Application of MC method for fouling simulation in different membrane systems from the literature.
Table 2.
Application of MC method for fouling simulation in different membrane systems from the literature.
| Membrane | Aims | Highlights | References |
|---|---|---|---|
| MF |
|
| [74] |
|
| [85] | |
|
| [86] | |
| UF |
|
| [76] |
| UF/MF |
|
| [72] |
|
| [73] | |
| RO |
|
| [78] |
| RO/NF |
|
| [87] |
| RO/NF |
|
| [81] |
|
| [80] | |
|
| [5] | |
|
| [82] | |
| MD |
|
| [83] |
|
| [84] |
3.3. Artificial Neural Networks (ANN)
ANNs are biologically-inspired computational networks, with a large number of nerve cells or neurons which can work in parallel to promote rapid decision-making [88]. Due to its high speed, simplicity, and powerful capability to learn and recognize trends within a series of input and output data with high precision, the ANN is considered as a powerful, fast and competitive alternative method for membrane fouling modeling [89].
An ANN is able to accurately predict the complex non-linear relationships among variables in the system and simulate the impacts of these variables on fouling during MF, UF, MBR and RO processes [90,91]. For instance, membrane fouling during crossflow MF treatment of polydisperse suspensions was simulated by an ANN model previously, with a highly accurate simulation of time-variant specific fluxes for different feed solutions with a wide range of hydrodynamic parameters [92]. Meanwhile, the trans-membrane pressure and membrane permeability of a submerged MBR has also been successfully simulated using an ANN and the effects of simultaneous aeration on the membrane fouling and contaminant removal efficiency were investigated through ANN modeling [93]. In addition, ANNs have been applied in the dynamic simulation of protein crossflow UF, in which total hydraulic resistance and permeate flux were accurately simulated with excellent agreement with the actual data (average errors less than 1.1%) [94]. Moreover, a good consistency was also observed using an ANN model (trained by a multi-layered feed-forward network with a back-propagation algorithm) with the experimental flux data during NF treatment of leather plant effluents, with a deviation no more than 1% [95]. More application of the ANN approach to the simulation of membrane fouling are listed in Table 3.
Compared to the traditional test methods and mathematical models, the ANN has strong abilities of nonlinear mapping, self-learning, and self-adaption by using “black-box” methods. However, the disadvantages of ANN simulation therefore are (1) operation time, an important parameter for membrane separation, is ignored in ANN modeling; (2) in-depth analysis of the algorithm is lacking for its selection; (3) the input variables of the ANN are often selected based on experience without theoretical supports.
4. Conclusions
This review summarizes the application of mathematical modeling for fouling analysis and prediction with regard to the aspects of principle, applicability, advantages, and disadvantages. A series of fouling models and numerical simulation methods have been applied to successfully predict membrane fouling in a variety of membrane separation processes under different conditions. CP, cake layer formation, and pore blocking models have been developed to simulate the fouling formation processes. CFD, MC, and ANN simulations are the dominant algorithms for the microscopic behavior of foulant particles. CFD is used to describe flow hydrodynamics during membrane processes, while the MC approach is used to describe the random trajectory of foulant particles, and ANNs can predict the fouling process in a comprehensive environmental matrix through “black-box” learning methods. These models and algorithms are powerful tools for revealing the essential fouling process from the perspectives of force and energy under various complex conditions. Compared to the traditional experimental tests for the study of fouling, fouling analysis and prediction is more effective and rapid through mathematical models and algorithms. This concise summary of fouling models and numerical simulation approaches provides support for the appropriate selection and application of membrane fouling modeling. These fouling models and simulations can be a powerful and cost-effective tool to provide fouling control strategies for further field applications of membrane technology.
Author Contributions
Conceptualization, J.L. and T.H.; writing—original draft preparation, H.Y. and Z.T.; Methodology, X.Y.; writing—review and editing, H.Y., J.L.; visualization, Q.Z.; revision of the manuscript, Z.L.; supervision, L.W. and Z.W.; funding acquisition, H.Y. All authors have read and agreed to the published version of the manuscript.
Funding
This work was financially supported by the Guangdong Basic and Applied Basic Research Foundation under Grant No. 2020A1515110833 and the National Natural Science Foundation of China under Grant No. 42107431. We also thank the Introduction and Cultivation Plan for Young Innovative Talents of Colleges and Universities by the Education Department of Shandong Province.
Institutional Review Board Statement
Not applicable.
Informed Consent Statement
Not applicable.
Data Availability Statement
Not applicable.
Conflicts of Interest
The authors declare no conflict of interest.
References
- Van der Bruggen, B.; Manttari, M.; Nystrom, M. Drawbacks of Applying Nanofiltration and How to Avoid Them: A Review. Sep. Purif. Technol. 2008, 63, 251–263. [Google Scholar] [CrossRef]
- Yang, Z.; Sun, P.F.; Li, X.; Gan, B.; Wang, L.; Song, X.; Park, H.D.; Tang, C.Y. A Critical Review on Thin-Film Nanocomposite Membranes with Interlayered Structure: Mechanisms, Recent Developments, and Environmental Applications. Environ. Sci. Technol. 2020, 54, 15563–15583. [Google Scholar] [CrossRef] [PubMed]
- Iritani, E.; Katagiri, N. Developments of Blocking Filtration Model in Membrane Filtration. Kona Powder Part. J. 2016, 33, 179–202. [Google Scholar] [CrossRef] [Green Version]
- Tang, C.Y.; Chong, T.H.; Fane, A.G. Colloidal Interactions and Fouling of NF and RO Membranes: A Review. Adv. Colloid Interface Sci. 2011, 164, 126–143. [Google Scholar] [CrossRef] [PubMed]
- Liu, J.; Huang, T.; Ji, R.; Wang, Z.; Tang, C.Y.; Leckie, J.O. Stochastic Collision-Attachment-Based Monte Carlo Simulation of Colloidal Fouling: Transition from Foulant-Clean-Membrane Interaction to Foulant-Fouled-Membrane Interaction. Environ. Sci. Technol. 2020, 54, 12703–12712. [Google Scholar] [CrossRef] [PubMed]
- Liu, J.; Wang, Z.; Tang, C.Y.; Leckie, J.O. Modeling Dynamics of Colloidal Fouling of RO/NF Membranes with a Novel Collision-Attachment Approach. Environ. Sci. Technol. 2018, 52, 1471–1478. [Google Scholar] [CrossRef]
- Tan, Y.W.; Lin, T.; Chen, W.; Zhou, D.J. Effect of Organic Molecular Weight Distribution on Membrane Fouling in an Ultrafiltration System with Ozone Oxidation from the Perspective of Interaction Energy. Environ.Sci. Water Res. Technol. 2017, 3, 1132–1142. [Google Scholar] [CrossRef]
- She, Q.; Tang, C.Y.; Wang, Y.-N.; Zhang, Z. The Role of Hydrodynamic Conditions and Solution Chemistry on Protein Fouling During Ultrafiltration. Desalination 2009, 249, 1079–1087. [Google Scholar] [CrossRef]
- Tang, C.Y.; Leckie, J.O. Membrane Independent Limiting Flux for RO and NF Membranes Fouled by Humic Acid. Environ. Sci. Technol. 2007, 41, 4767–4773. [Google Scholar] [CrossRef]
- Porter, M.C. Concentration Polarization with Membrane Ultrafiltration. Ind. Eng. Chem. Prod. Res. Dev. 1972, 11, 234–248. [Google Scholar] [CrossRef]
- Yao, W.; Wang, Z.; Song, P. The Cake Layer Formation in the Early Stage of Filtration in MBR: Mechanism and Model. J. Membr. Sci. 2018, 559, 75–86. [Google Scholar] [CrossRef]
- Hermans, P.H. Zur Kenntnis Der Filtrationsgesetze. Recl. Des Trav. Chim. Des Pays-Bas 1935, 54, 680–700. [Google Scholar] [CrossRef]
- Keir, G.; Jegatheesan, V. A Review of Computational Fluid Dynamics Applications in Pressure-Driven Membrane Filtration. Rev. Environ. Sci. Bio/Technol. 2014, 13, 183–201. [Google Scholar] [CrossRef]
- Chen, J.; Elimelech, M.; Kim, A. Monte Carlo Simulation of Colloidal Membrane Filtration: Model Development with Application to Characterization of Colloid Phase Transition. J. Membr. Sci. 2005, 255, 291–305. [Google Scholar] [CrossRef]
- Cai, X.; Zhang, M.J.; Yang, L.N.; Lin, H.J.; Wu, X.L.; He, Y.M.; Shen, L.G. Quantification of Interfacial Interactions between a Rough Sludge Floc and Membrane Surface in a Membrane Bioreactor. J. Colloid Interface Sci. 2017, 490, 710–718. [Google Scholar] [CrossRef] [PubMed]
- Ghidossi, R.; Veyret, D.; Moulin, P. Computational Fluid Dynamics Applied to Membranes: State of the Art and Opportunities. Chem. Eng. Process. 2006, 45, 437–454. [Google Scholar] [CrossRef]
- Niu, C.; Li, X.; Dai, R.; Wang, Z. Artificial Intelligence-Incorporated Membrane Fouling Prediction for Membrane-Based Processes in the Past 20 Years: A Critical Review. Water Res. 2022, 216, 118299. [Google Scholar] [CrossRef]
- Liu, J.X.; Zhao, Y.X.; Fan, Y.Q.; Yang, H.Y.; Wang, Z.H.; Chen, Y.L.; Tang, C.Y.Y. Dissect the Role of Particle Size through Collision-Attachment Simulations for Colloidal Fouling of RO/NF Membranes. J. Membr. Sci. 2021, 638, 119679. [Google Scholar] [CrossRef]
- Kim, S.; Hoek, E.M.V. Modeling Concentration Polarization in Reverse Osmosis Processes. Desalination 2005, 186, 111–128. [Google Scholar] [CrossRef]
- Kostoglou, M.; Karabelas, A.J. Modeling Scale Formation in Flat-Sheet Membrane Modules During Water Desalination. AIChE J. 2013, 59, 2917–2927. [Google Scholar] [CrossRef]
- Liu, J.X.; Fan, Y.Q.; Sun, Y.H.; Wang, Z.H.; Zhao, D.S.; Li, T.; Dong, B.Z.; Tang, C.Y.Y. Modelling the Critical Roles of Zeta Potential and Contact Angle on Colloidal Fouling with a Coupled XDLVO-Collision Attachment Approach. J. Membr. Sci. 2021, 623, 119048. [Google Scholar] [CrossRef]
- Hong, S.; Elimelech, M. Chemical and Physical Aspects of Natural Organic Matter (NOM) Fouling of Nanofiltration Membranes. J. Membr. Sci. 1997, 132, 159–181. [Google Scholar] [CrossRef]
- Meng, F.; Zhang, H.; Yang, F.; Liu, L. Characterization of Cake Layer in Submerged Membrane Bioreactor. Environ. Sci. Technol. 2007, 41, 4065–4070. [Google Scholar] [CrossRef] [PubMed]
- Quideau, S.; Deffieux, D.; Douat-Casassus, C.; Pouysegu, L. Plant Polyphenols: Chemical Properties, Biological Activities, and Synthesis. Angew. Chem. Int. Ed. Engl. 2011, 50, 586–621. [Google Scholar] [CrossRef]
- Teng, J.; Shen, L.; Xu, Y.; Chen, Y.; Wu, X.L.; He, Y.; Chen, J.; Lin, H. Effects of Molecular Weight Distribution of Soluble Microbial Products (SMPs) on Membrane Fouling in a Membrane Bioreactor (MBR): Novel Mechanistic Insights. Chemosphere 2020, 248, 126013. [Google Scholar] [CrossRef]
- Carman, P.C. Fluid Flow through Granular Beds. Chem. Eng. Res. Des. 1997, 75, S32–S48. [Google Scholar] [CrossRef]
- Tang, C.Y.; Kwon, Y.-N.; Leckie, J.O. Characterization of Humic Acid Fouled Reverse Osmosis and Nanofiltration Membranes by Transmission Electron Microscopy and Streaming Potential Measurements. Environ. Sci. Technol. 2007, 41, 942–949. [Google Scholar] [CrossRef]
- Iritani, E.; Hattori, K.; Murase, T. Analysis of Dead-End Ultrafiltration Based on Ultracentrifugation Method. J. Membr. Sci. 1993, 81, 1–13. [Google Scholar] [CrossRef]
- Sioutopoulos, D.C.; Yiantsios, S.G.; Karabelas, A.J. Relation between Fouling Characteristics of RO and UF Membranes in Experiments with Colloidal Organic and Inorganic Species. J. Membr. Sci. 2010, 350, 62–82. [Google Scholar] [CrossRef]
- Sioutopoulos, D.C.; Karabelas, A.J. Evolution of Organic Gel Fouling Resistance in Constant Pressure and Constant Flux Dead-End Ultrafiltration: Differences and Similarities. J. Membr. Sci. 2016, 511, 265–277. [Google Scholar] [CrossRef]
- Belfort, G.; Davis, R.H.; Zydney, A.L. The Behavior of Suspensions and Macromolecular Solutions in Crossflow Microfiltration. J. Membr. Sci. 1994, 96, 1–58. [Google Scholar] [CrossRef]
- Hamachi, M.; Mietton-Peuchot, M. Experimental Investigations of Cake Characteristics in Crossflow Microfiltration. Chem. Eng. Sci. 1999, 54, 4023–4030. [Google Scholar] [CrossRef]
- Singh, G.; Song, L.F. Cake Compressibility of Silica Colloids in Membrane Filtration Processes. Ind. Eng. Chem. Res. 2006, 45, 7633–7638. [Google Scholar] [CrossRef]
- Hoek, E.M.; Elimelech, M. Cake-Enhanced Concentration Polarization: A New Fouling Mechanism for Salt-Rejecting Membranes. Environ. Sci. Technol. 2003, 37, 5581–5588. [Google Scholar] [CrossRef]
- Chong, T.H.; Fane, A.G. Implications of Critical Flux and Cake Enhanced Osmotic Pressure (CEOP) on Colloidal Fouling in Reverse Osmosis: Modeling Approach. Desalination Water Treat. 2009, 8, 68–90. [Google Scholar] [CrossRef]
- Park, M.; Lee, J.; Boo, C.; Hong, S.; Snyder, S.A.; Kim, J.H. Modeling of Colloidal Fouling in Forward Osmosis Membrane: Effects of Reverse Draw Solution Permeation. Desalination 2013, 314, 115–123. [Google Scholar] [CrossRef]
- Abbasi-Garravand, E.; Mulligan, C.N.; Laflamme, C.B.; Clairet, G. Investigation of the Fouling Effect on a Commercial Semi-Permeable Membrane in the Pressure Retarded Osmosis (PRO) Process. Sep. Purif. Technol. 2018, 193, 81–90. [Google Scholar] [CrossRef] [Green Version]
- Iritani, E.; Katagiri, N.; Takenaka, T.; Yamashita, Y. Membrane Pore Blocking During Cake Formation in Constant Pressure and Constant Flux Dead-End Microfiltration of Very Dilute Colloids. Chem. Eng. Sci. 2015, 122, 465–473. [Google Scholar] [CrossRef]
- Said, M.; Ahmad, A.; Mohammad, A.W.; Nor, M.T.M.; Abdullah, S.R.S. Blocking Mechanism of PES Membrane During Ultrafiltration of Pome. J. Ind. Eng. Chem. 2015, 21, 182–188. [Google Scholar] [CrossRef]
- Zhang, W.X.; Ding, L.H. Investigation of Membrane Fouling Mechanisms Using Blocking Models in the Case of Shear-Enhanced Ultrafiltration. Sep. Purif. Technol. 2015, 141, 160–169. [Google Scholar] [CrossRef]
- Iritani, E. A Review on Modeling of Pore-Blocking Behaviors of Membranes During Pressurized Membrane Filtration. Dry. Technol. 2013, 31, 146–162. [Google Scholar] [CrossRef]
- Teng, J.H.; Chen, Y.F.; Ma, G.C.; Hong, H.C.; Sun, T.Y.; Liao, B.Q.; Lin, H.J. Membrane Fouling by Alginate in Polyaluminum Chloride (PACL) Coagulation/Microfiltration Process: Molecular Insights. Sep. Purif. Technol. 2020, 236, 116294. [Google Scholar] [CrossRef]
- Wang, N.; Li, X.; Yang, Y.L.; Zhou, Z.W.; Shang, Y.; Zhuang, X.X. Photocatalysis-Coagulation to Control Ultrafiltration Membrane Fouling Caused by Natural Organic Matter. J. Clean. Prod. 2020, 265, 121790. [Google Scholar] [CrossRef]
- Zhang, M.J.; Leung, K.T.; Lin, H.J.; Liao, B.Q. Characterization of Foaming and Non-Foaming Sludge Relating to Aeration and the Implications for Membrane Fouling Control in Submerged Membrane Bioreactors. J. Water Process. Eng. 2019, 28, 250–259. [Google Scholar] [CrossRef]
- Zheng, Y.; Zhang, W.; Tang, B.; Ding, J.; Zheng, Y.; Zhang, Z. Membrane Fouling Mechanism of Biofilm-Membrane Bioreactor (BF-MBR): Pore Blocking Model and Membrane Cleaning. Bioresour. Technol. 2018, 250, 398–405. [Google Scholar] [CrossRef]
- Monfared, M.A.; Kasiri, N.; Mohammadi, T. A Cfd Model for Prediction of Critical Electric Potential Preventing Membrane Fouling in Oily Waste Water Treatment. J. Membr. Sci. 2017, 539, 320–328. [Google Scholar] [CrossRef]
- Yan, X.; Wu, Q.; Sun, J.; Liang, P.; Zhang, X.; Xiao, K.; Huang, X. Hydrodynamic Optimization of Membrane Bioreactor by Horizontal Geometry Modification Using Computational Fluid Dynamics. Bioresour. Technol. 2016, 200, 328–334. [Google Scholar] [CrossRef]
- Salafi, M.; Asasian-Kolur, N.; Sharifian, S.; Ghadimi, A. A Flat-Plate Spiral-Channeled Membrane Heat Exchanger for Methane Dehumidification: Comparison of Kraft Paper and Thin-Film Composite Membrane. Int. J. Therm. Sci. 2021, 167, 107046. [Google Scholar] [CrossRef]
- Asasian-Kolur, N.; Sharifian, S.; Haddadi, B.; Pourhoseinian, M.; Mousazadeh Shekarbaghani, Z.; Harasek, M. Membrane-Based Enthalpy Exchangers for Coincident Sensible and Latent Heat Recovery. Energy Convers. Manag. 2022, 253, 115144. [Google Scholar] [CrossRef]
- Jahed Mogharrab, A.; Sharifian, S.; Asasian-Kolur, N.; Ghadimi, A.; Haddadi, B.; Harasek, M. Air-to-Air Heat and Moisture Recovery in a Plate-Frame Exchanger Using Composite and Asymmetric Membranes. Membranes 2022, 12, 484. [Google Scholar] [CrossRef]
- Damak, K.; Ayadi, A.; Zeghmati, B.; Schmitz, P. A New Navier-Stokes and Darcy’s Law Combined Model for Fluid Flow in Crossflow Filtration Tubular Membranes. Desalination 2004, 161, 67–77. [Google Scholar] [CrossRef]
- Kahrizi, M.; Lin, J.Y.; Ji, G.Z.; Kong, L.X.; Song, C.W.; Dumee, L.F.; Sahebi, S.; Zhao, S.F. Relating Forward Water and Reverse Salt Fluxes to Membrane Porosity and Tortuosity in Forward Osmosis: CFD Modelling. Sep. Purif. Technol. 2020, 241, 116727. [Google Scholar] [CrossRef]
- Liu, J.X.; Liu, Z.J.; Xu, X.F.; Wei, W.; Wang, X.J.; Liu, F.X. Numerical Investigation of the Membrane Fouling During Microfiltration of Semiconductor Wastewater. Desalination Water Treat. 2016, 57, 4756–4768. [Google Scholar]
- Chan, F.S.; Tan, C.K.; Ratnayake, P.; Junaidi, M.U.M.; Liang, Y.Y. Reduced-Order Modelling of Concentration Polarization with Varying Permeation: Analysis of Electro-Osmosis in Membranes. Desalination 2020, 495, 114677. [Google Scholar] [CrossRef]
- Lim, S.Y.; Liang, Y.Y.; Weihs, G.A.F.; Wiley, D.E.; Fletcher, D.F. A CFD Study on the Effect of Membrane Permeance on Permeate Flux Enhancement Generated by Unsteady Slip Velocity. J. Membr. Sci. 2018, 556, 138–145. [Google Scholar] [CrossRef]
- Cui, Z.; Wang, J.; Zhang, H.; Ngo, H.H.; Jia, H.; Guo, W.; Gao, F.; Yang, G.; Kang, D. Investigation of Backwashing Effectiveness in Membrane Bioreactor (MBR) Based on Different Membrane Fouling Stages. Bioresour. Technol. 2018, 269, 355–362. [Google Scholar] [CrossRef]
- Shirazi, M.M.A.; Kargari, A.; Ismail, A.F.; Matsuura, T. Computational Fluid Dynamic (CFD) Opportunities Applied to the Membrane Distillation Process: State-of-the-Art and Perspectives. Desalination 2016, 377, 73–90. [Google Scholar] [CrossRef]
- Zhang, Y.G.; Peng, Y.L.; Ji, S.L.; Wang, S.B. Numerical Simulation of 3d Hollow-Fiber Vacuum Membrane Distillation by Computational Fluid Dynamics. Chem. Eng. Sci. 2016, 152, 172–185. [Google Scholar] [CrossRef]
- Pourhoseinian, M.; Asasian-Kolur, N.; Sharifian, S. CFD Investigation of Heat and Moisture Recovery from Air with Membrane Heat Exchanger. Appl. Therm. Eng. 2021, 191, 116911. [Google Scholar] [CrossRef]
- Schwaller, C.; Fokkens, K.; Helmreich, B.; Drewes, J.E. CFD Simulations of Flow Fields During Ultrafiltration: Effects of Hydrodynamic Strain Rates with and without a Particle Cake Layer on the Permeation of Mobile Genetic Elements. Chem. Eng. Sci. 2022, 254, 117606. [Google Scholar] [CrossRef]
- Rahimi, M.; Madaeni, S.S.; Abbasi, K. CFD Modeling of Permeate Flux in Cross-Flow Microfiltration Membrane. J. Membr. Sci. 2005, 255, 23–31. [Google Scholar] [CrossRef]
- Lou, J.; Vanneste, J.; DeCaluwe, S.C.; Cath, T.Y.; Tilton, N. Computational Fluid Dynamics Simulations of Polarization Phenomena in Direct Contact Membrane Distillation. J. Membr. Sci. 2019, 591, 117150. [Google Scholar] [CrossRef]
- Afsari, M.; Ghorbani, A.H.; Asghari, M.; Shon, H.K.; Tijing, L.D. Computational Fluid Dynamics Simulation Study of Hypersaline Water Desalination Via Membrane Distillation: Effect of Membrane Characteristics and Operational Parameters. Chemosphere 2022, 305, 135294. [Google Scholar] [CrossRef] [PubMed]
- Liang, Y.Y.; Chapman, M.B.; Weihs, G.A.F.; Wiley, D.E. CFD Modelling of Electro-Osmotic Permeate Flux Enhancement on the Feed Side of a Membrane Module. J. Membr. Sci. 2014, 470, 378–388. [Google Scholar] [CrossRef]
- Yang, M.; Wei, Y.; Zheng, X.; Wang, F.; Yuan, X.; Liu, J.; Luo, N.; Xu, R.; Yu, D.; Fan, Y. CFD Simulation and Optimization of Membrane Scouring and Nitrogen Removal for an Airlift External Circulation Membrane Bioreactor. Bioresour. Technol. 2016, 219, 566–575. [Google Scholar] [CrossRef]
- Qamar, A.; Bucs, S.; Picioreanu, C.; Vrouwenvelder, J.; Ghaffour, N. Hydrodynamic Flow Transition Dynamics in a Spacer Filled Filtration Channel Using Direct Numerical Simulation. J. Membr. Sci. 2019, 590, 117264. [Google Scholar] [CrossRef]
- El Kadi, K.; Adeyemi, I.; Janajreh, I. Application of Directional Freezing for Seawater Desalination: Parametric Analysis Using Experimental and Computational Methods. Desalination 2021, 520, 115339. [Google Scholar] [CrossRef]
- Tsai, H.Y.; Huang, A.; Soesanto, J.F.; Luo, Y.L.; Hsu, T.Y.; Chen, C.H.; Hwang, K.J.; Ho, C.D.; Tung, K.L. 3d Printing Design of Turbulence Promoters in a Cross-Flow Microfiltration System for Fine Particles Removal. J. Membr. Sci. 2019, 573, 647–656. [Google Scholar] [CrossRef]
- Radu, A.I.; Vrouwenvelder, J.S.; van Loosdrecht, M.C.M.; Picioreanu, C. Modeling the Effect of Biofilm Formation on Reverse Osmosis Performance: Flux, Feed Channel Pressure Drop and Solute Passage. J. Membr. Sci. 2010, 365, 1–15. [Google Scholar] [CrossRef]
- Shang, W.T.; Li, X.Y.; Liu, W.J.; Yue, S.F.; Li, M.; von Eiff, D.; Sun, F.Y.; An, A.K. Effective Suppression of Concentration Polarization by Nanofiltration Membrane Surface Pattern Manipulation: Numerical Modeling Based on Lif Visualization. J. Membr. Sci. 2021, 622, 119021. [Google Scholar] [CrossRef]
- Pankaj, S.; Sajikumar, N.; Kaimal, R. Simulation of Forward Osmosis Using CFD. Procedia Technol. 2016, 24, 70–76. [Google Scholar] [CrossRef]
- Guan, K.; Liu, Y.; Yin, X.Q.; Zhu, W.Y.; Chu, Y.H.; Peng, C.; Lv, M.; Sun, Q.; Rao, P.G.; Wu, J.Q. Influence of Operation Conditions on Cake Structure in Dead-End Membrane Filtration: Monte Carlo Simulations and a Force Model. Chem. Eng. Res. Des. 2017, 124, 124–133. [Google Scholar] [CrossRef]
- Chen, Y.B.; Kim, H. Monte Carlo Simulation of Pore Blocking and Cake Formation by Interfacial Interactions During Membrane Filtration. Desalination 2008, 233, 258–266. [Google Scholar] [CrossRef]
- Chen, Y.; Hu, X.; Kim, H. Monte Carlo Simulation of Pore Blocking Phenomena in Cross-Flow Microfiltration. Water Res. 2011, 45, 6789–6797. [Google Scholar] [CrossRef]
- Kawakatsu, T.; Nakajima, M.; Nakao, S.I.; Kimura, S. Three-Dimensional Simulation of Random Packing and Pore Blocking Phenomena During Microfiltration. Desalination 1995, 101, 203–209. [Google Scholar] [CrossRef]
- Petrosino, F.; Hallez, Y.; De Luca, G.; Curcio, S. Osmotic Pressure and Transport Coefficient in Ultrafiltration: A Monte Carlo Study Using Quantum Surface Charges. Chem. Eng. Sci. 2020, 224, 115762. [Google Scholar] [CrossRef]
- Khayet, M.; Cojocaru, C. Artificial Neural Network Modeling and Optimization of Desalination by Air Gap Membrane Distillation. Sep. Purif. Technol. 2012, 86, 171–182. [Google Scholar] [CrossRef]
- Xu, C.; Chen, Y. Understanding Water and Solute Transport in Thin Film Nanocomposite Membranes by Resistance-in-Series Theory Combined with Monte Carlo Simulation. J. Membr. Sci. 2021, 626, 119106. [Google Scholar] [CrossRef]
- Ulbricht, M. Advanced Functional Polymer Membranes. Polymer 2006, 47, 2217–2262. [Google Scholar] [CrossRef] [Green Version]
- Lu, X.; Gabinet, U.R.; Ritt, C.L.; Feng, X.; Deshmukh, A.; Kawabata, K.; Kaneda, M.; Hashmi, S.M.; Osuji, C.O.; Elimelech, M. Relating Selectivity and Separation Performance of Lamellar Two-Dimensional Molybdenum Disulfide (MoS2) Membranes to Nanosheet Stacking Behavior. Environ. Sci. Technol. 2020, 54, 9640–9651. [Google Scholar] [CrossRef]
- Ritt, C.L.; Werber, J.R.; Deshmukh, A.; Elimelech, M. Monte Carlo Simulations of Framework Defects in Layered Two Dimensional Nanomaterial Desalination Membranes: Implications for Permeability and Selectivity. Environ. Sci. Technol. 2019, 53, 6214–6224. [Google Scholar] [CrossRef] [PubMed]
- Liu, J.; Tang, Z.; Yang, H.; Li, X.; Yu, X.; Wang, Z.; Huang, T.; Tang, C.Y. Dissecting the Role of Membrane Defects with Low-Energy Barrier on Fouling Development through a Collision Attachment-Monte Carlo Approach. J. Membr. Sci. 2022, 663, 120981. [Google Scholar] [CrossRef]
- Khayet, M.; Imdakm, A.O.; Matsuura, T. Monte Carlo Simulation and Experimental Heat and Mass Transfer in Direct Contact Membrane Distillation. Int. J. Heat Mass Transfer 2010, 53, 1249–1259. [Google Scholar] [CrossRef]
- Imdakm, A.O.; Khayet, M.; Matsuura, T. A Monte Carlo Simulation Model for Vacuum Membrane Distillation Process. J. Membr. Sci. 2007, 306, 341–348. [Google Scholar] [CrossRef]
- Seminario, L.; Rozas, R.; Bórquez, R.; Toledo, P.G. Pore Blocking and Permeability Reduction in Cross-Flow Microfiltration. J. Membr. Sci. 2002, 209, 121–142. [Google Scholar] [CrossRef]
- Yoon, S.H.; Lee, C.H.; Kim, K.J.; Fane, A.G. Three-Dimensional Simulation of the Deposition of Multi-Dispersed Charged Particles and Prediction of Resulting Flux During Cross-Flow Microfiltration. J. Membr. Sci. 1999, 161, 7–20. [Google Scholar] [CrossRef]
- Boyle, P.M.; Houchens, B.C.; Kim, A.S. Simulation of Colloidal Fouling by Coupling a Dynamically Updating Velocity Profile and Electric Field Interactions with Force Bias Monte Carlo Methods for Membrane Filtration. J. Colloid Interface Sci. 2013, 399, 77–86. [Google Scholar] [CrossRef]
- Guadix, A.; Zapata, J.E.; Almecija, M.C.; Guadix, E.M. Predicting the Flux Decline in Milk Cross-Flow Ceramic Ultrafiltration by Artificial Neural Networks. Desalination 2010, 250, 1118–1120. [Google Scholar] [CrossRef]
- Corbaton-Baguena, M.J.; Vincent-Vela, M.C.; Gozalvez-Zafrilla, J.M.; Alvarez-Blanco, S.; Lora-Garcia, J.; Catalan-Martinez, D. Comparison between Artificial Neural Networks and Hermia’s Models to Assess Ultrafiltration Performance. Sep. Purif. Technol. 2016, 170, 434–444. [Google Scholar] [CrossRef] [Green Version]
- Madaeni, S.S.; Hasankiadeh, N.T.; Kurdian, A.R.; Rahimpour, A. Modeling and Optimization of Membrane Fabrication Using Artificial Neural Network and Genetic Algorithm. Sep. Purif. Technol. 2010, 76, 33–43. [Google Scholar] [CrossRef]
- Barello, M.; Manca, D.; Patel, R.; Mujtaba, I.M. Neural Network Based Correlation for Estimating Water Permeability Constant in RO Desalination Process under Fouling. Desalination 2014, 345, 101–111. [Google Scholar] [CrossRef]
- Chellam, S. Artificial Neural Network Model for Transient Crossflow Microfiltration of Polydispersed Suspensions. J. Membr. Sci. 2005, 258, 35–42. [Google Scholar] [CrossRef]
- Mirbagheri, S.A.; Bagheri, M.; Bagheri, Z.; Kamarkhani, A.M. Evaluation and Prediction of Membrane Fouling in a Submerged Membrane Bioreactor with Simultaneous Upward and Downward Aeration Using Artificial Neural Network-Genetic Algorithm. Process. Saf. Environ. Prot. 2015, 96, 111–124. [Google Scholar] [CrossRef]
- Razavi, M.A.; Mortazavi, A.; Mousavi, M. Application of Neural Networks for Crossflow Milk Ultrafiltration Simulation. Int. Dairy J. 2004, 14, 69–80. [Google Scholar] [CrossRef]
- Purkait, M.K.; Kumar, V.D.; Maity, D. Treatment of Leather Plant Effluent Using Nf Followed by Ro and Permeate Flux Prediction Using Artificial Neural Network. Chem. Eng. J. 2009, 151, 275–285. [Google Scholar] [CrossRef]
- Aish, A.M.; Zaqoot, H.A.; Abdeljawad, S.M. Artificial Neural Network Approach for Predicting Reverse Osmosis Desalination Plants Performance in the Gaza Strip. Desalination 2015, 367, 240–247. [Google Scholar] [CrossRef]
- Roehl, E.A.; Ladner, D.A.; Daamen, R.C.; Cook, J.B.; Safarik, J.; Phipps, D.W.; Xie, P. Modeling Fouling in a Large RO System with Artificial Neural Networks. J. Membr. Sci. 2018, 552, 95–106. [Google Scholar] [CrossRef]
- Park, S.; Baek, S.S.; Pyo, J.; Pachepsky, Y.; Park, J.; Cho, K.H. Deep Neural Networks for Modeling Fouling Growth and Flux Decline During NF/RO Membrane Filtration. J. Membr. Sci. 2019, 587, 117164. [Google Scholar] [CrossRef]
- Khaouane, L.; Ammi, Y.; Hanini, S. Modeling the Retention of Organic Compounds by Nanofiltration and Reverse Osmosis Membranes Using Bootstrap Aggregated Neural Networks. Arab. J. Sci. Eng. 2017, 42, 1443–1453. [Google Scholar] [CrossRef]
- Hu, J.H.; Kim, C.S.; Halasz, P.; Kim, J.F.; Kim, J.; Szekely, G. Artificial Intelligence for Performance Prediction of Organic Solvent Nanofiltration Membranes. J. Membr. Sci. 2021, 619, 118513. [Google Scholar] [CrossRef]
- Peleato, N.M.; Legge, R.L.; Andrews, R.C. Continuous Organic Characterization for Biological and Membrane Filter Performance Monitoring. J. Am. Water Work. Assoc. 2017, 109, E86–E98. [Google Scholar] [CrossRef]
- Chew, C.M.; Aroua, M.K.; Hussain, M.A. A Practical Hybrid Modelling Approach for the Prediction of Potential Fouling Parameters in Ultrafiltration Membrane Water Treatment Plant. J. Ind. Eng. Chem. 2017, 45, 145–155. [Google Scholar] [CrossRef]
- Nandi, B.K.; Moparthi, A.; Uppaluri, R.; Purkait, M.K. Treatment of Oily Wastewater Using Low Cost Ceramic Membrane: Comparative Assessment of Pore Blocking and Artificial Neural Network Models. Chem. Eng. Res. Des. 2010, 88, 881–892. [Google Scholar] [CrossRef]
- Ghandehari, S.; Montazer-Rahmati, M.M.; Asghari, M. A Comparison between Semi-Theoretical and Empirical Modeling of Cross-Flow Microfiltration Using ANN. Desalination 2011, 277, 348–355. [Google Scholar] [CrossRef]
- Viet, N.D.; Jang, A. Development of Artificial Intelligence-Based Models for the Prediction of Filtration Performance and Membrane Fouling in an Osmotic Membrane Bioreactor. J. Environ. Chem. Eng. 2021, 9, 105337. [Google Scholar] [CrossRef]
- Zhao, Z.T.; Lou, Y.; Chen, Y.F.; Lin, H.J.; Li, R.J.; Yu, G.Y. Prediction of Interfacial Interactions Related with Membrane Fouling in a Membrane Bioreactor Based on Radial Basis Function Artificial Neural Network (ANN). Bioresour. Technol. 2019, 282, 262–268. [Google Scholar] [CrossRef]
- Mittal, S.; Gupta, A.; Srivastava, S.; Jain, M. Artificial Neural Network Based Modeling of the Vacuum Membrane Distillation Process: Effects of Operating Parameters on Membrane Fouling. Chem. Eng. Process. 2021, 164, 108403. [Google Scholar] [CrossRef]
Figure 1.
Schematics of fluid transport and CP during membrane filtration.

Figure 2.
Schematics of cake formation during membrane filtration.

Figure 3.
Schematic view of pore blocking during membrane filtration.

Table 3.
Application of ANNs for fouling simulation in different membrane system from the literature.
Table 3.
Application of ANNs for fouling simulation in different membrane system from the literature.
| Membranes | Aims | Highlights | References |
|---|---|---|---|
| RO |
|
| [91] |
|
| [96] | |
|
| [97] | |
|
| [98] | |
| NF |
|
| [99] |
|
| [100] | |
| UF |
|
| [101] |
|
| [102] | |
| MF |
|
| [103,104] |
| MBR |
|
| [105] |
|
| [106] | |
| MD |
|
| [77] |
|
| [107] |
Note(s): MLP: multilayer perceptron; RBF: radial basis function; DNN: deep neural network; SVM: support vector machine; RF: random forest; MD: Membrane Distillation.
Publisher’s Note: MDPI stays neutral with regard to jurisdictional claims in published maps and institutional affiliations. |
© 2022 by the authors. Licensee MDPI, Basel, Switzerland. This article is an open access article distributed under the terms and conditions of the Creative Commons Attribution (CC BY) license (https://creativecommons.org/licenses/by/4.0/).
Share and Cite
MDPI and ACS Style
Yang, H.; Yu, X.; Liu, J.; Tang, Z.; Huang, T.; Wang, Z.; Zhong, Q.; Long, Z.; Wang, L. A Concise Review of Theoretical Models and Numerical Simulations of Membrane Fouling. Water 2022, 14, 3537. https://doi.org/10.3390/w14213537
AMA Style
Yang H, Yu X, Liu J, Tang Z, Huang T, Wang Z, Zhong Q, Long Z, Wang L. A Concise Review of Theoretical Models and Numerical Simulations of Membrane Fouling. Water. 2022; 14(21):3537. https://doi.org/10.3390/w14213537
Chicago/Turabian StyleYang, Haiyan, Xuri Yu, Junxia Liu, Zhiwei Tang, Tianyi Huang, Zhihong Wang, Qiyun Zhong, Zhihong Long, and Lin Wang. 2022. "A Concise Review of Theoretical Models and Numerical Simulations of Membrane Fouling" Water 14, no. 21: 3537. https://doi.org/10.3390/w14213537
Note that from the first issue of 2016, this journal uses article numbers instead of page numbers. See further details here.