Figure 1.
(
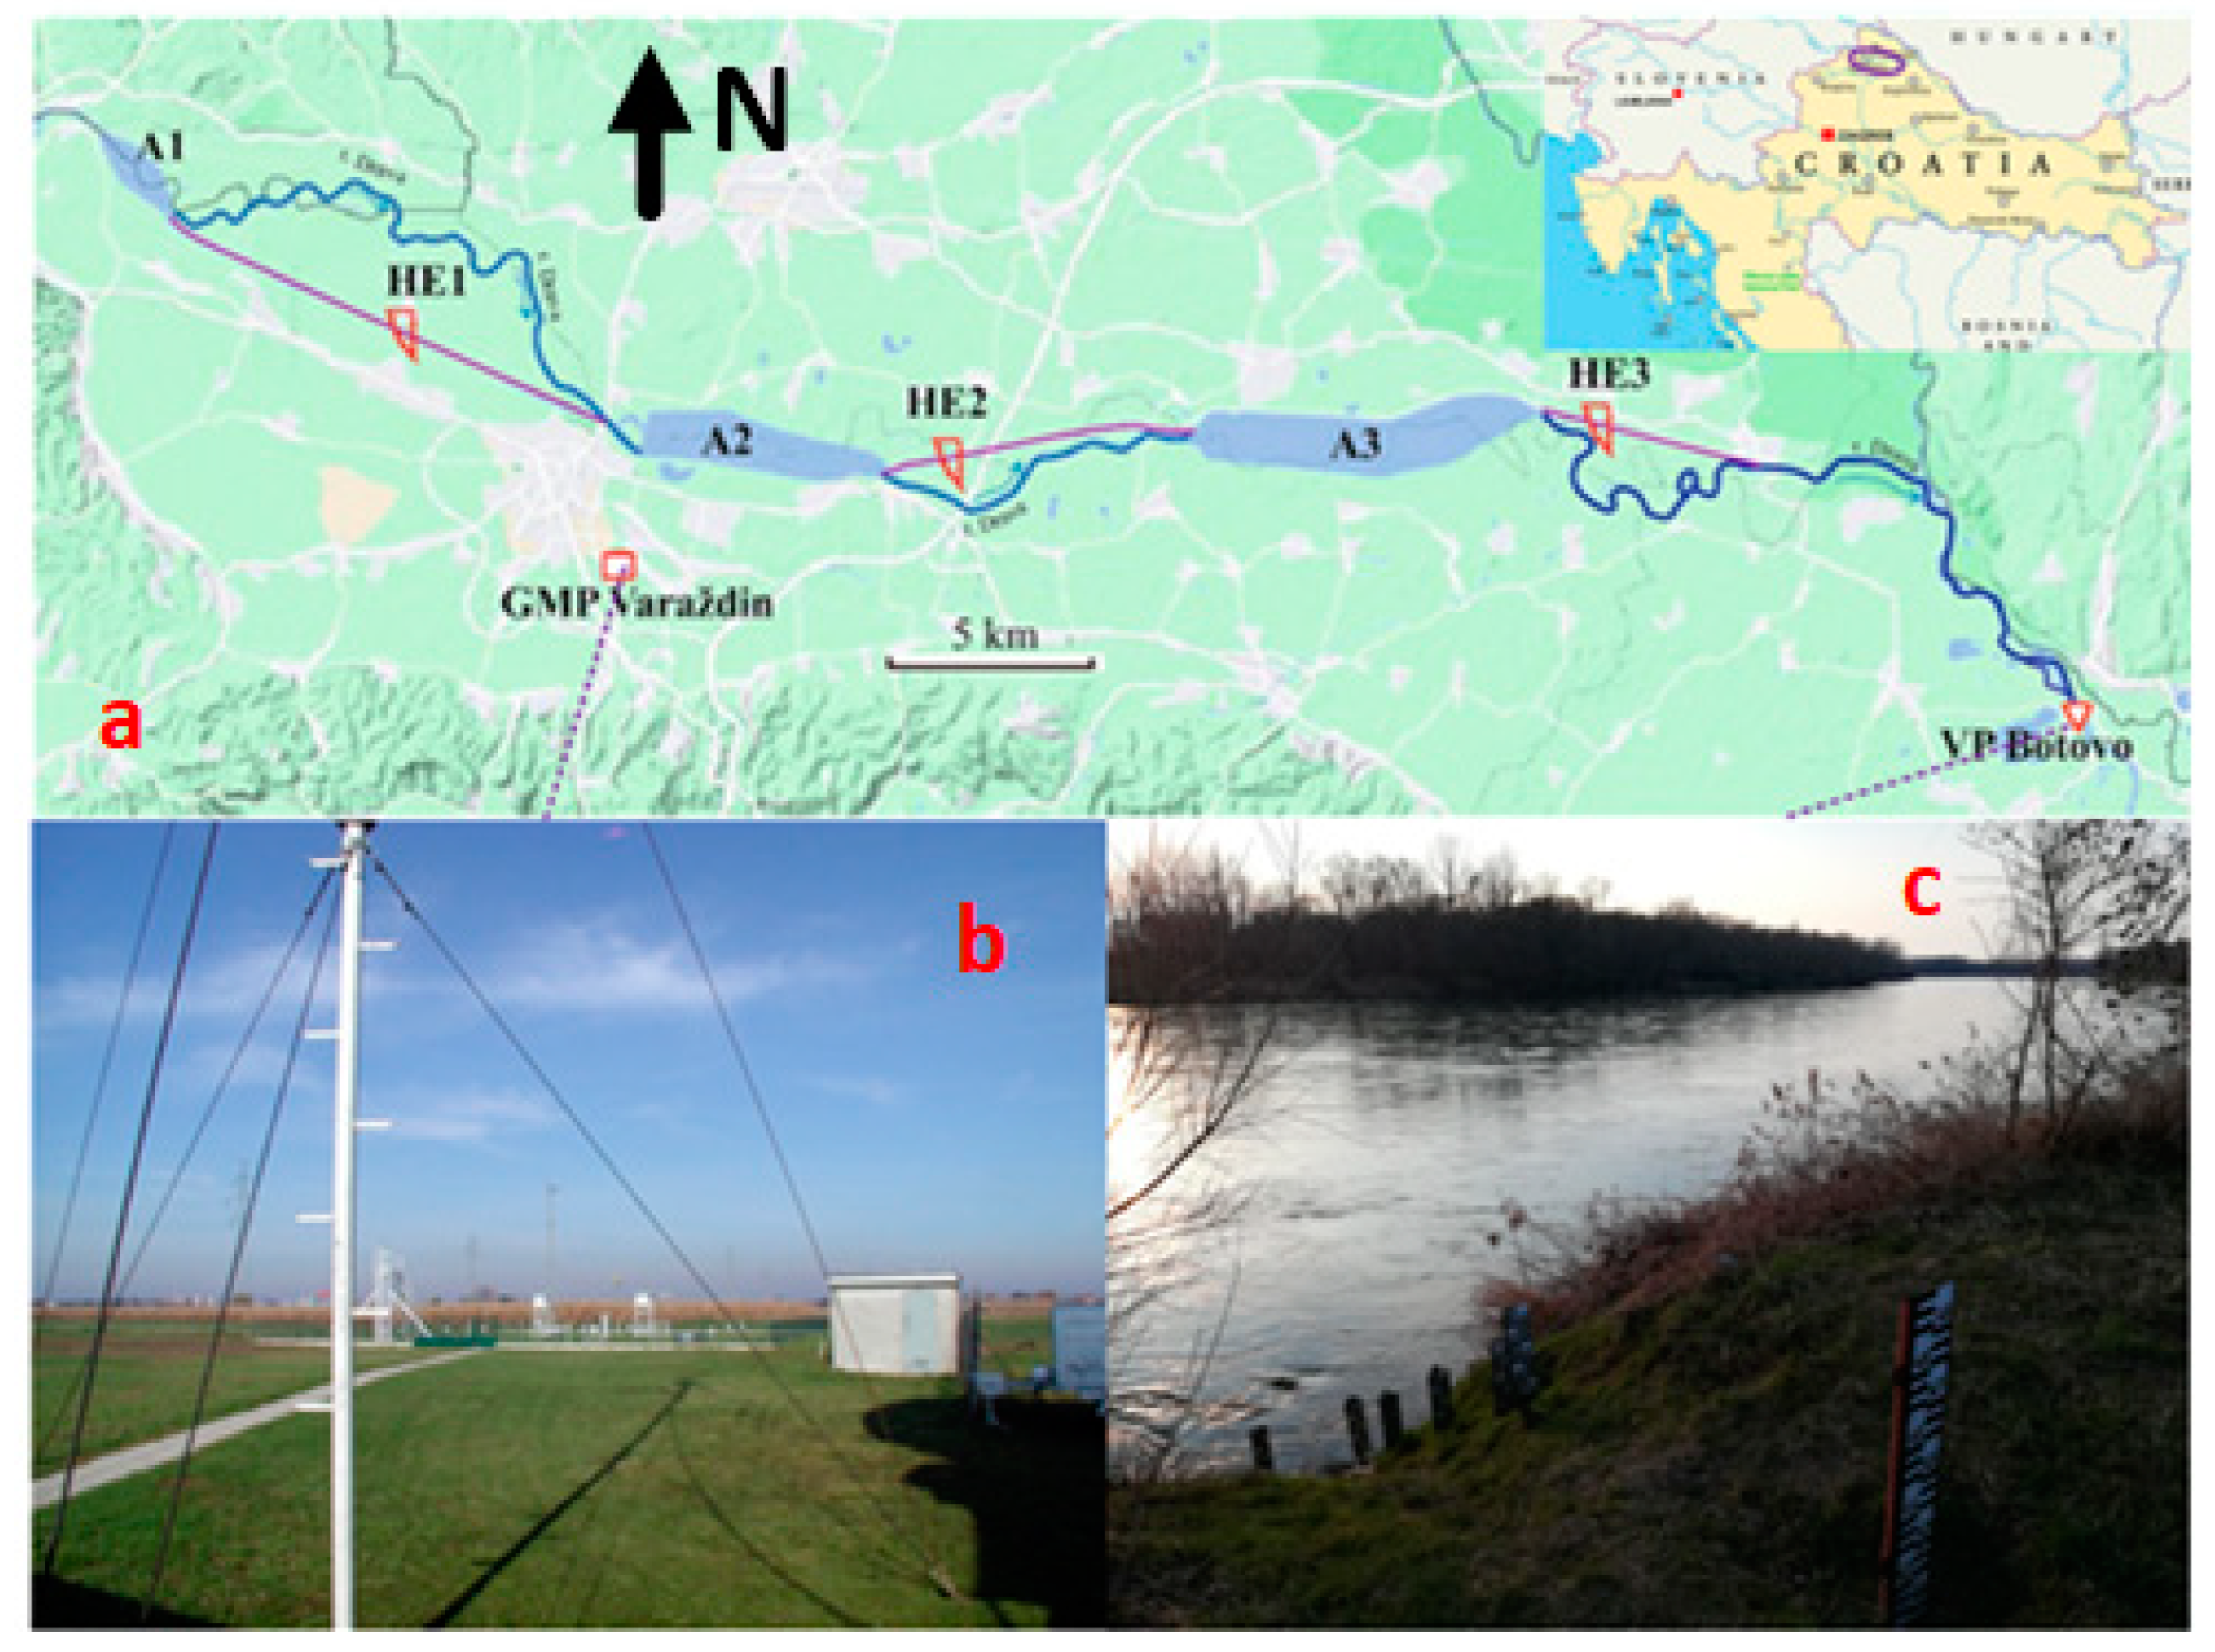
a) Map of the analyzed area (purple ellipse) with marked positions for the reservoirs: A1, A2, A3, hydroelectric power plant: HE1, HE2, HE3, (
b) central meteorological station (GMP) Varaždin, (
c) the water measuring station (VP) Botovo on the Drava River, with their pictures [
26,
27,
28].
Figure 1.
(
a) Map of the analyzed area (purple ellipse) with marked positions for the reservoirs: A1, A2, A3, hydroelectric power plant: HE1, HE2, HE3, (
b) central meteorological station (GMP) Varaždin, (
c) the water measuring station (VP) Botovo on the Drava River, with their pictures [
26,
27,
28].
Figure 2.
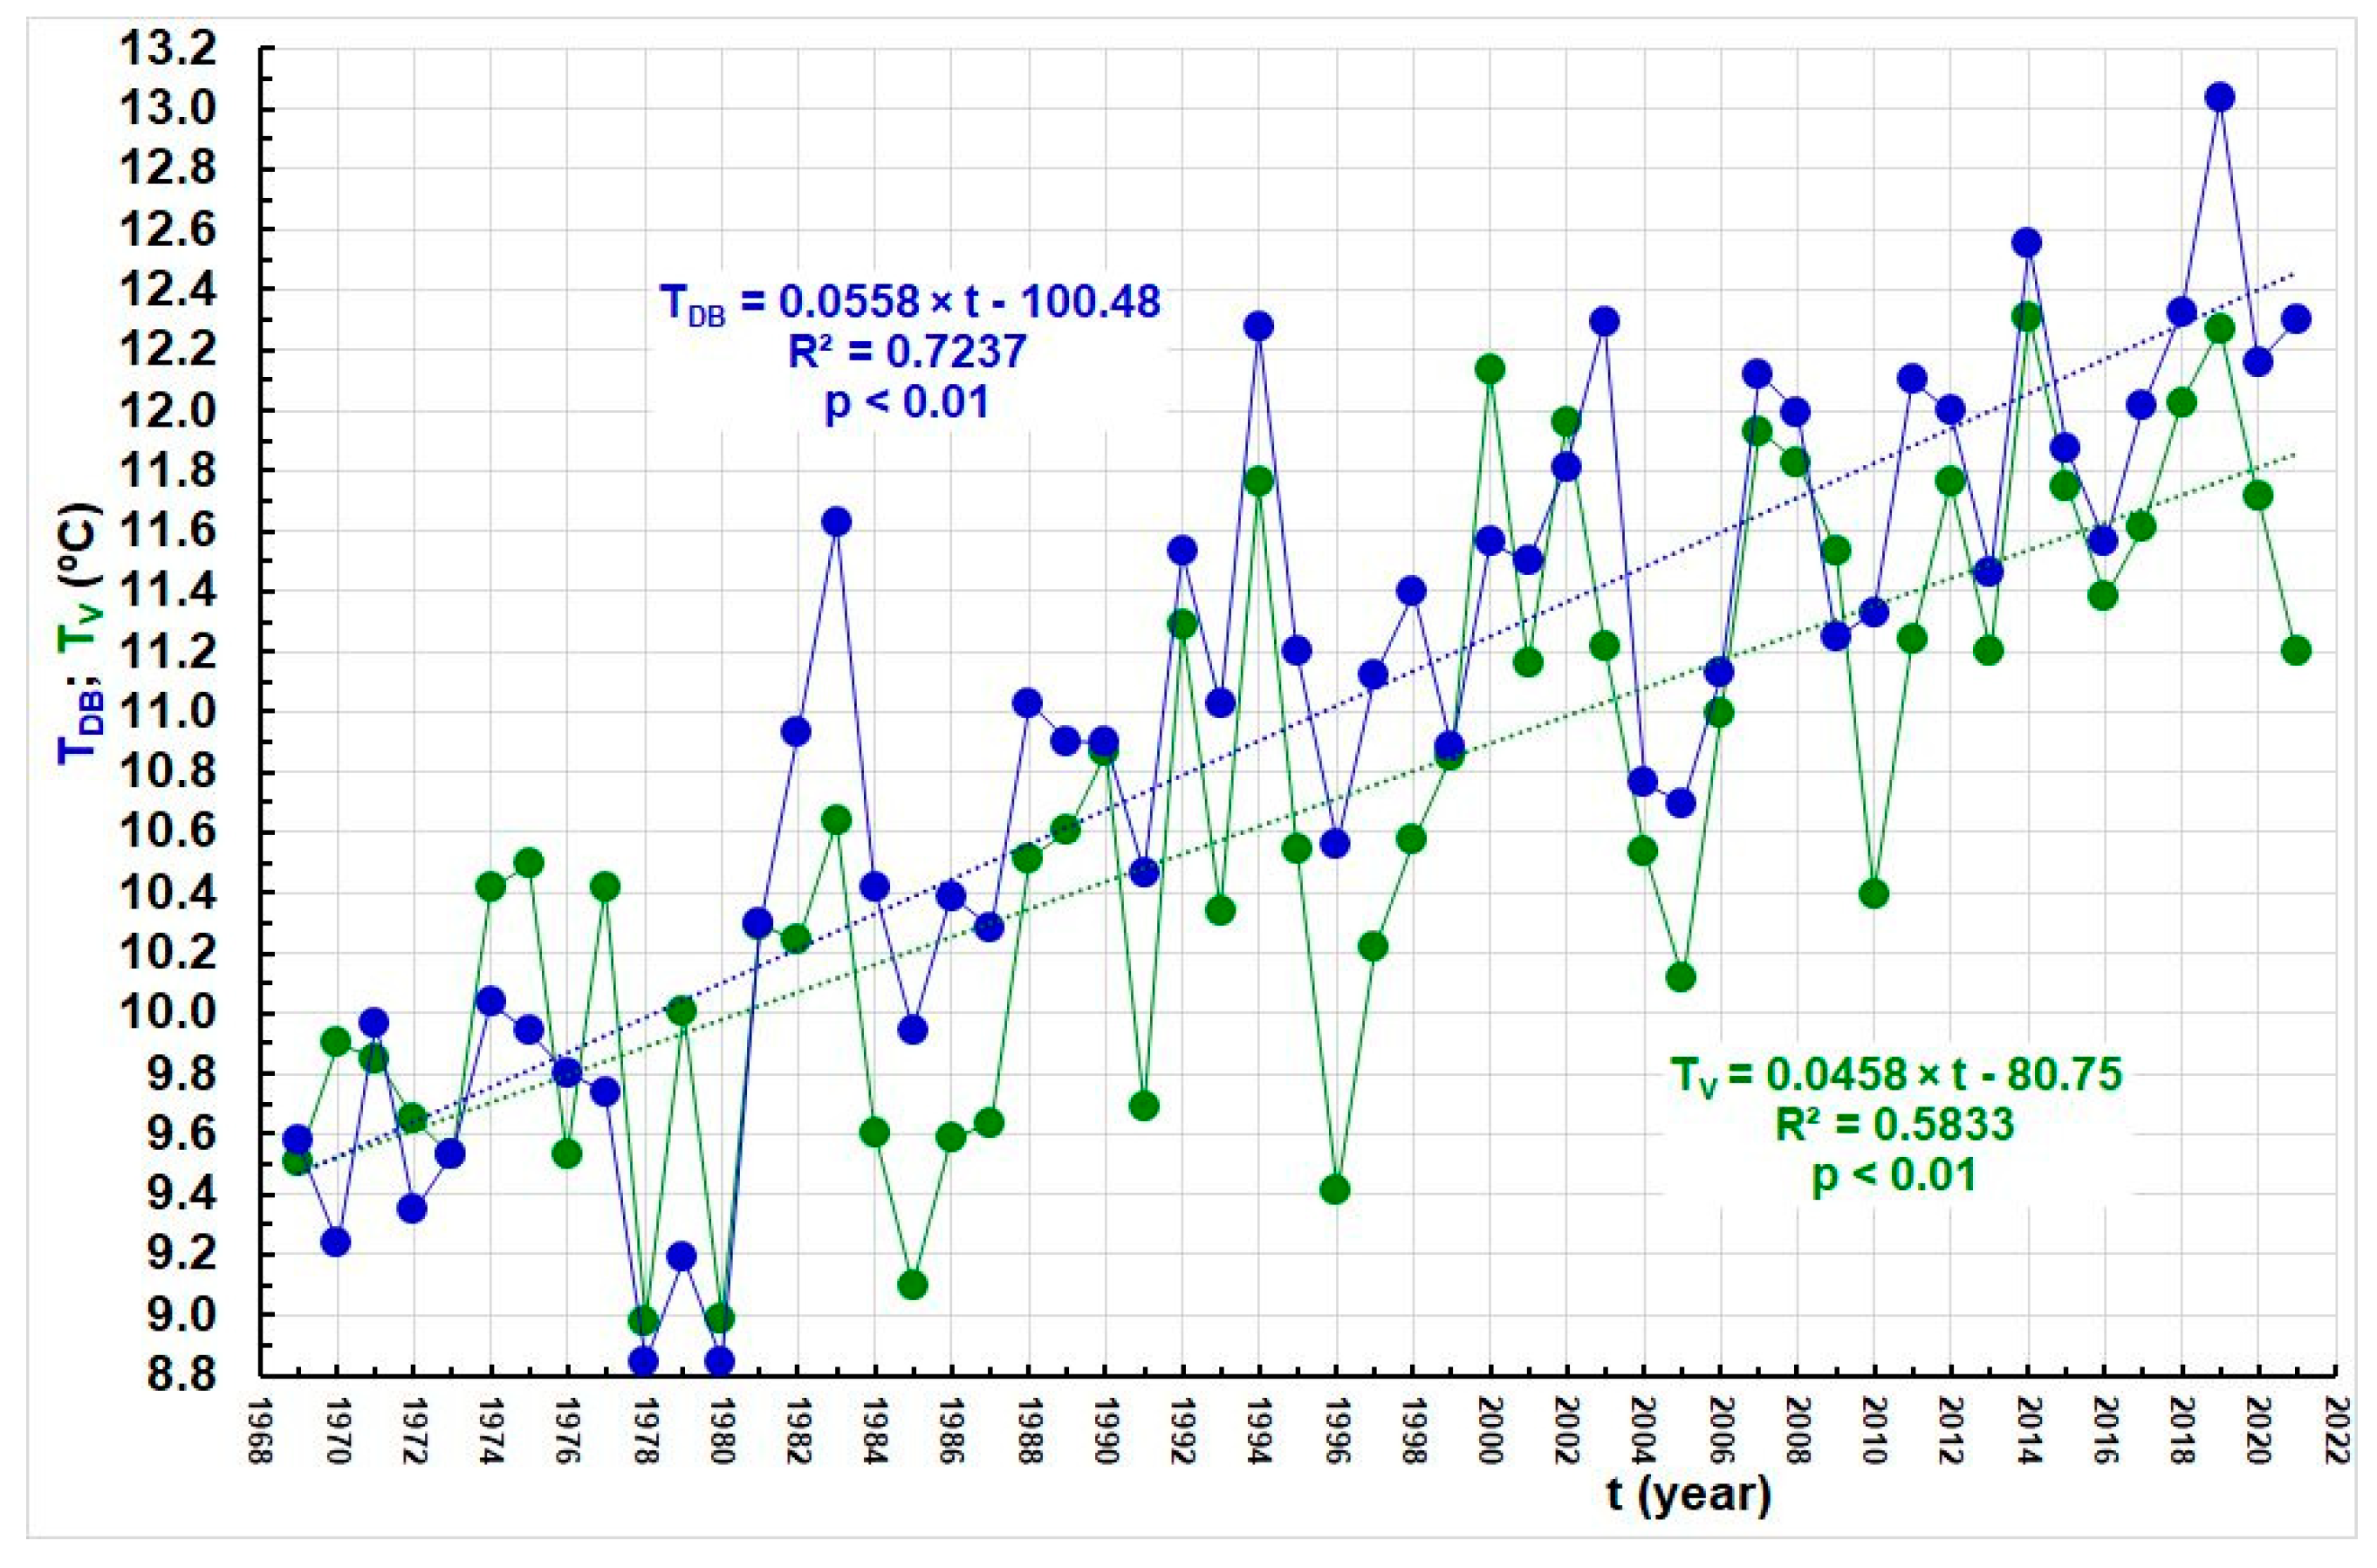
Series of mean annual water temperatures of the Drava at the station Botovo, TDB, and air temperatures at the GMP Varaždin, TV, from 1969–2021.
Figure 2.
Series of mean annual water temperatures of the Drava at the station Botovo, TDB, and air temperatures at the GMP Varaždin, TV, from 1969–2021.
Figure 3.
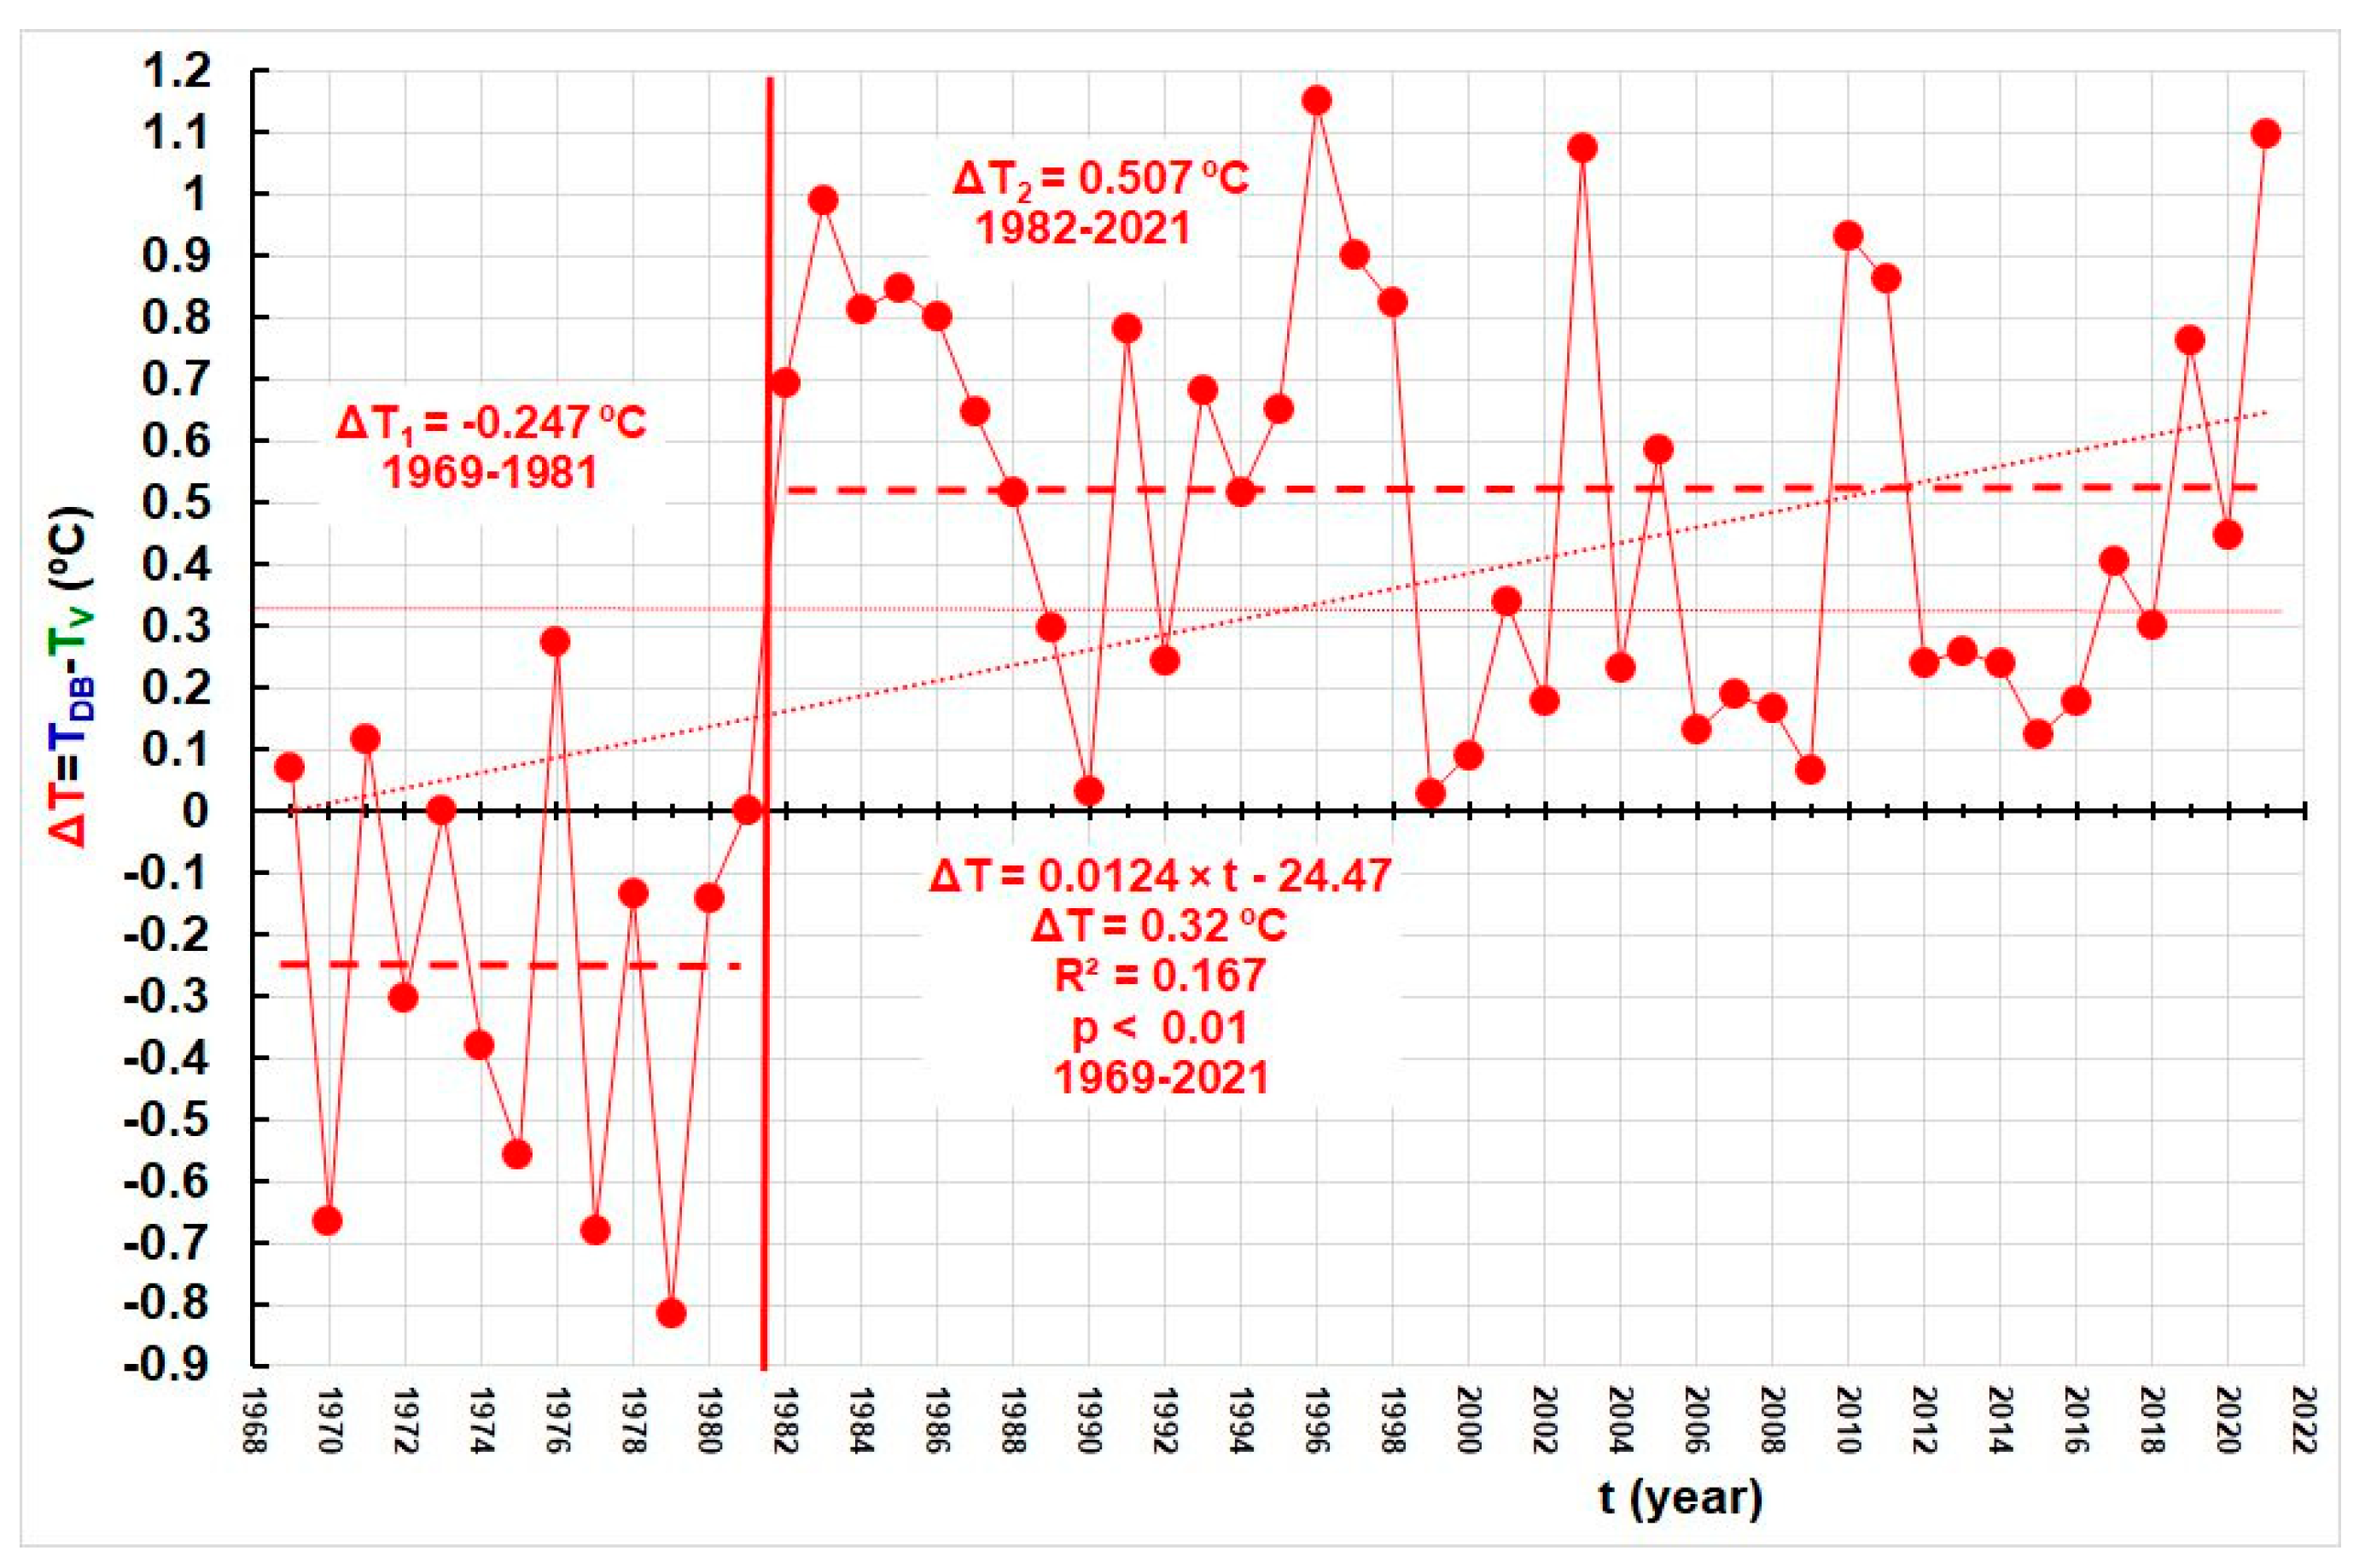
Series of differences in mean annual water and air temperatures, ΔT = TDB − TV, from 1969–2021.
Figure 3.
Series of differences in mean annual water and air temperatures, ΔT = TDB − TV, from 1969–2021.
Figure 4.
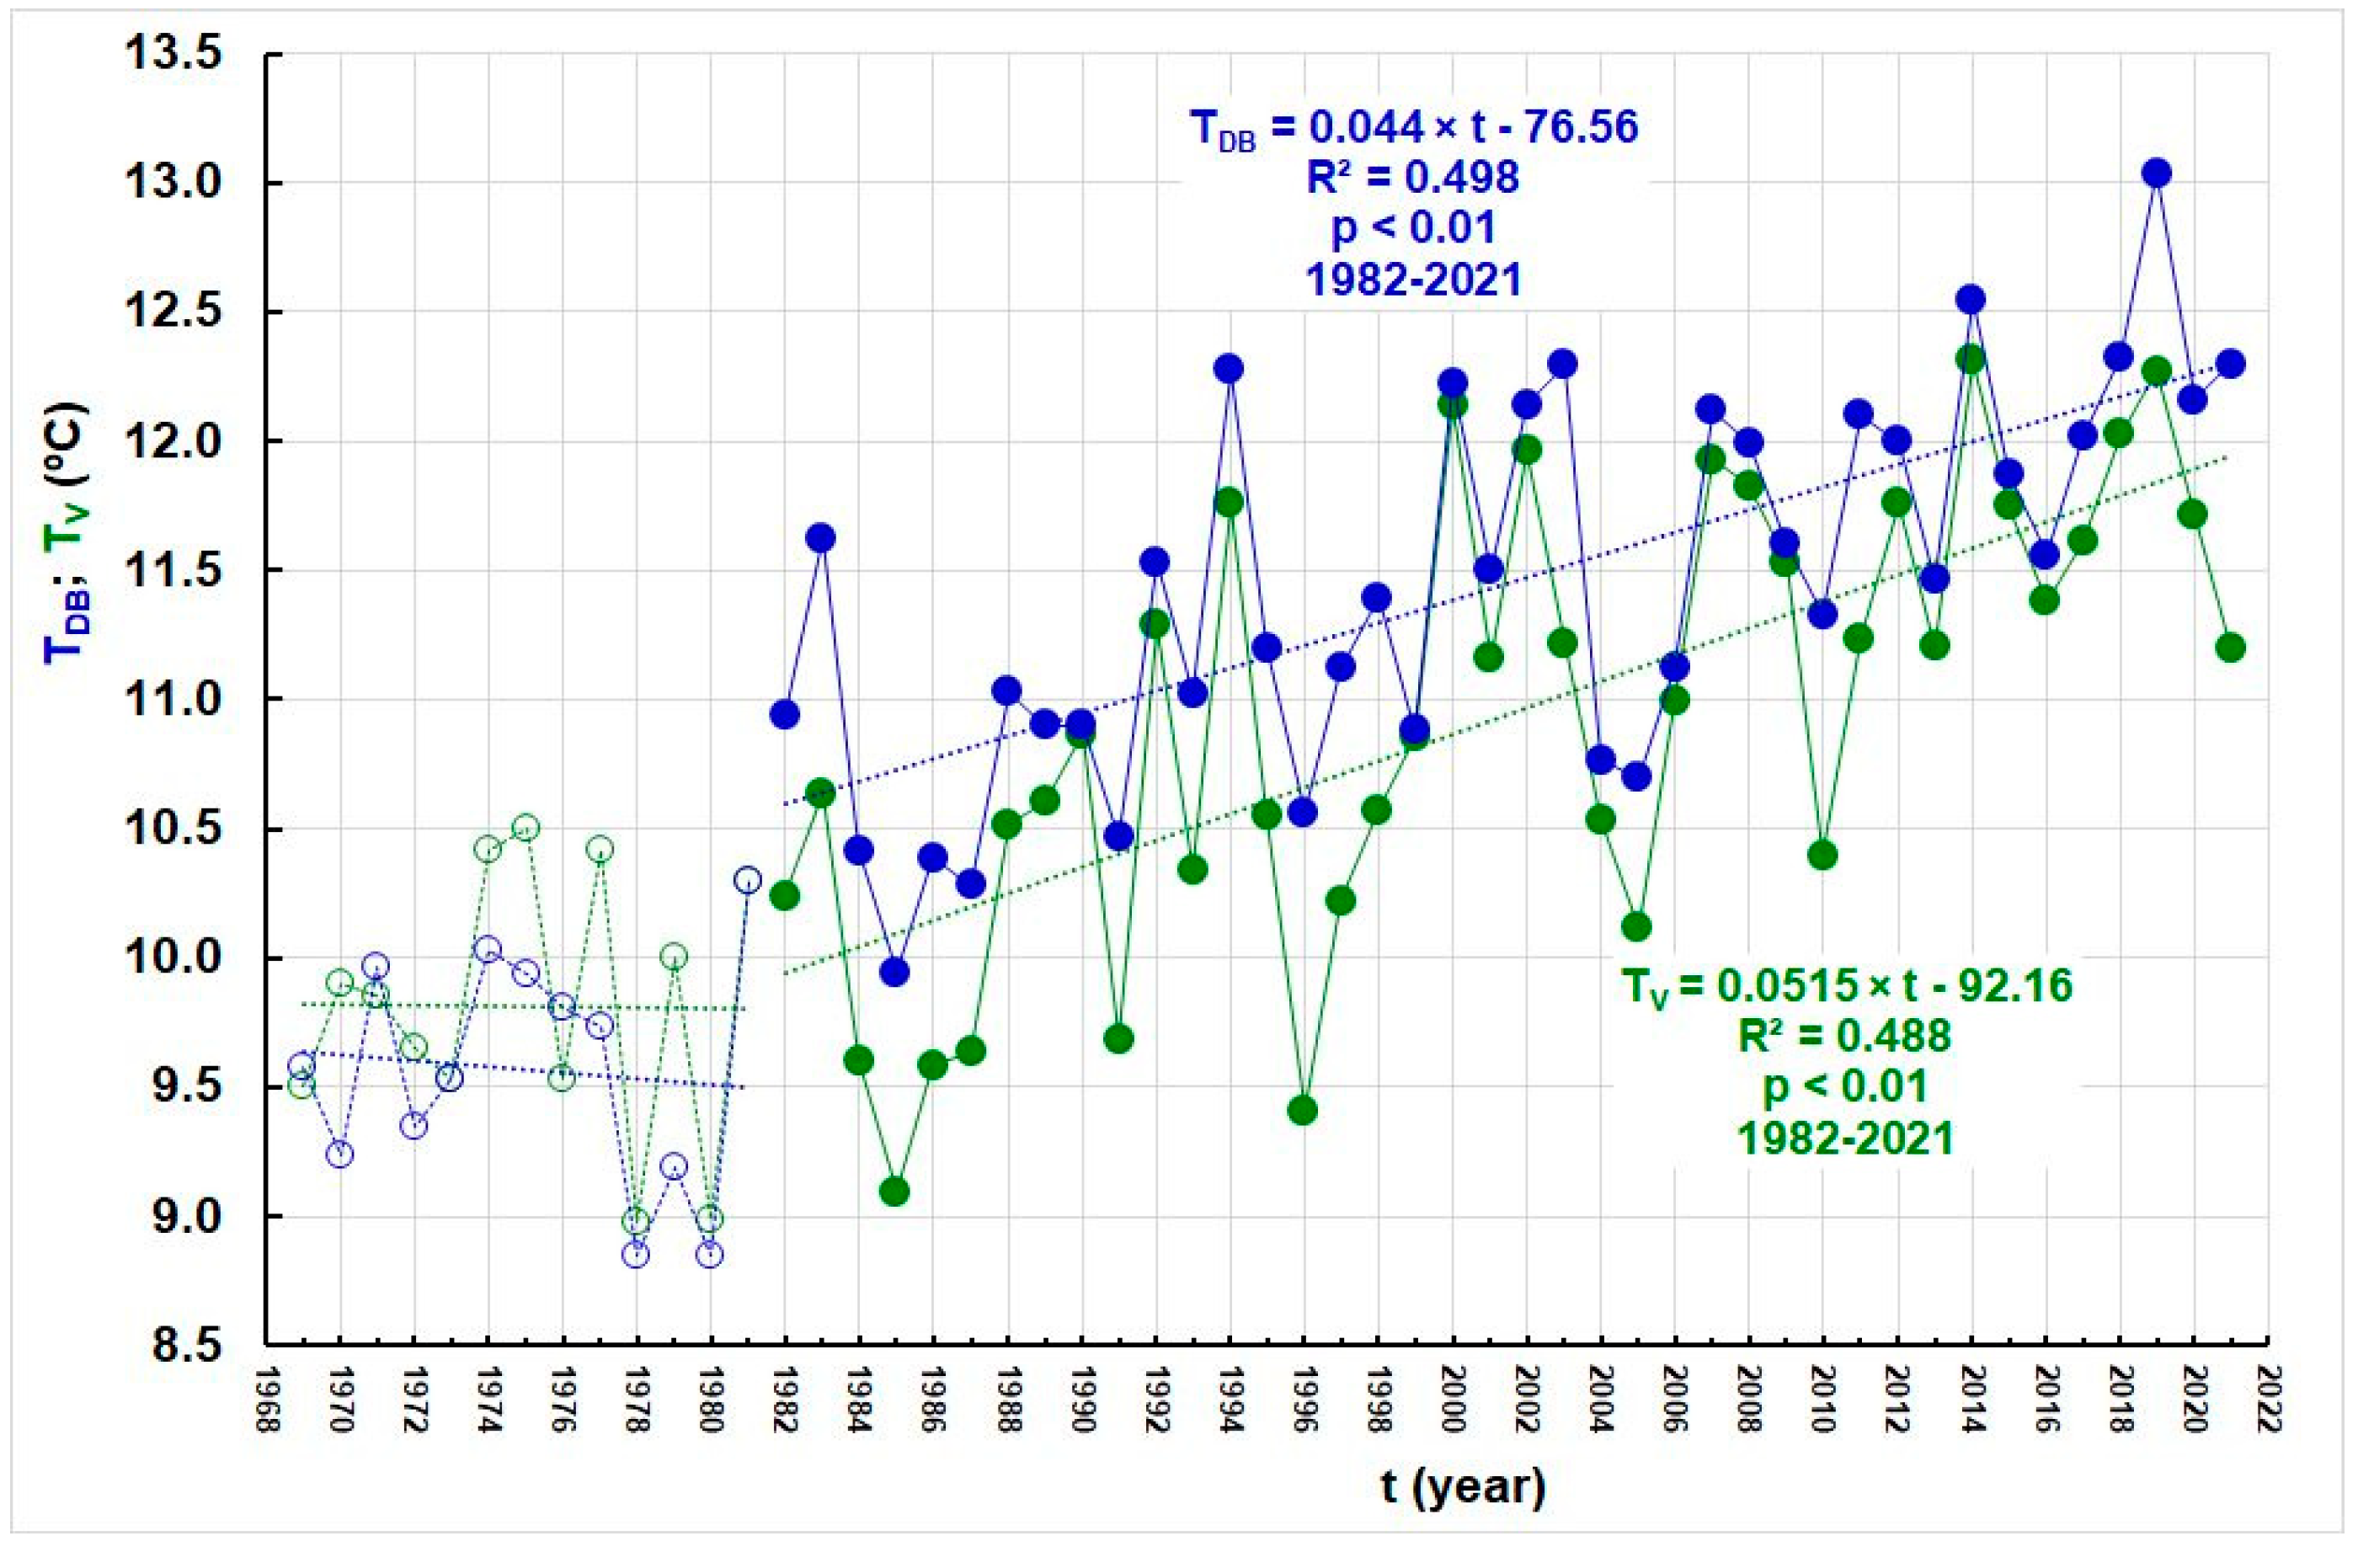
Two subseries of mean annual water temperatures of the Drava at the Botovo station, TDB, and air temperatures at the GMP Varaždin, TV, during the subperiods (1) 1969–1981 and (2) 1982–2021.
Figure 4.
Two subseries of mean annual water temperatures of the Drava at the Botovo station, TDB, and air temperatures at the GMP Varaždin, TV, during the subperiods (1) 1969–1981 and (2) 1982–2021.
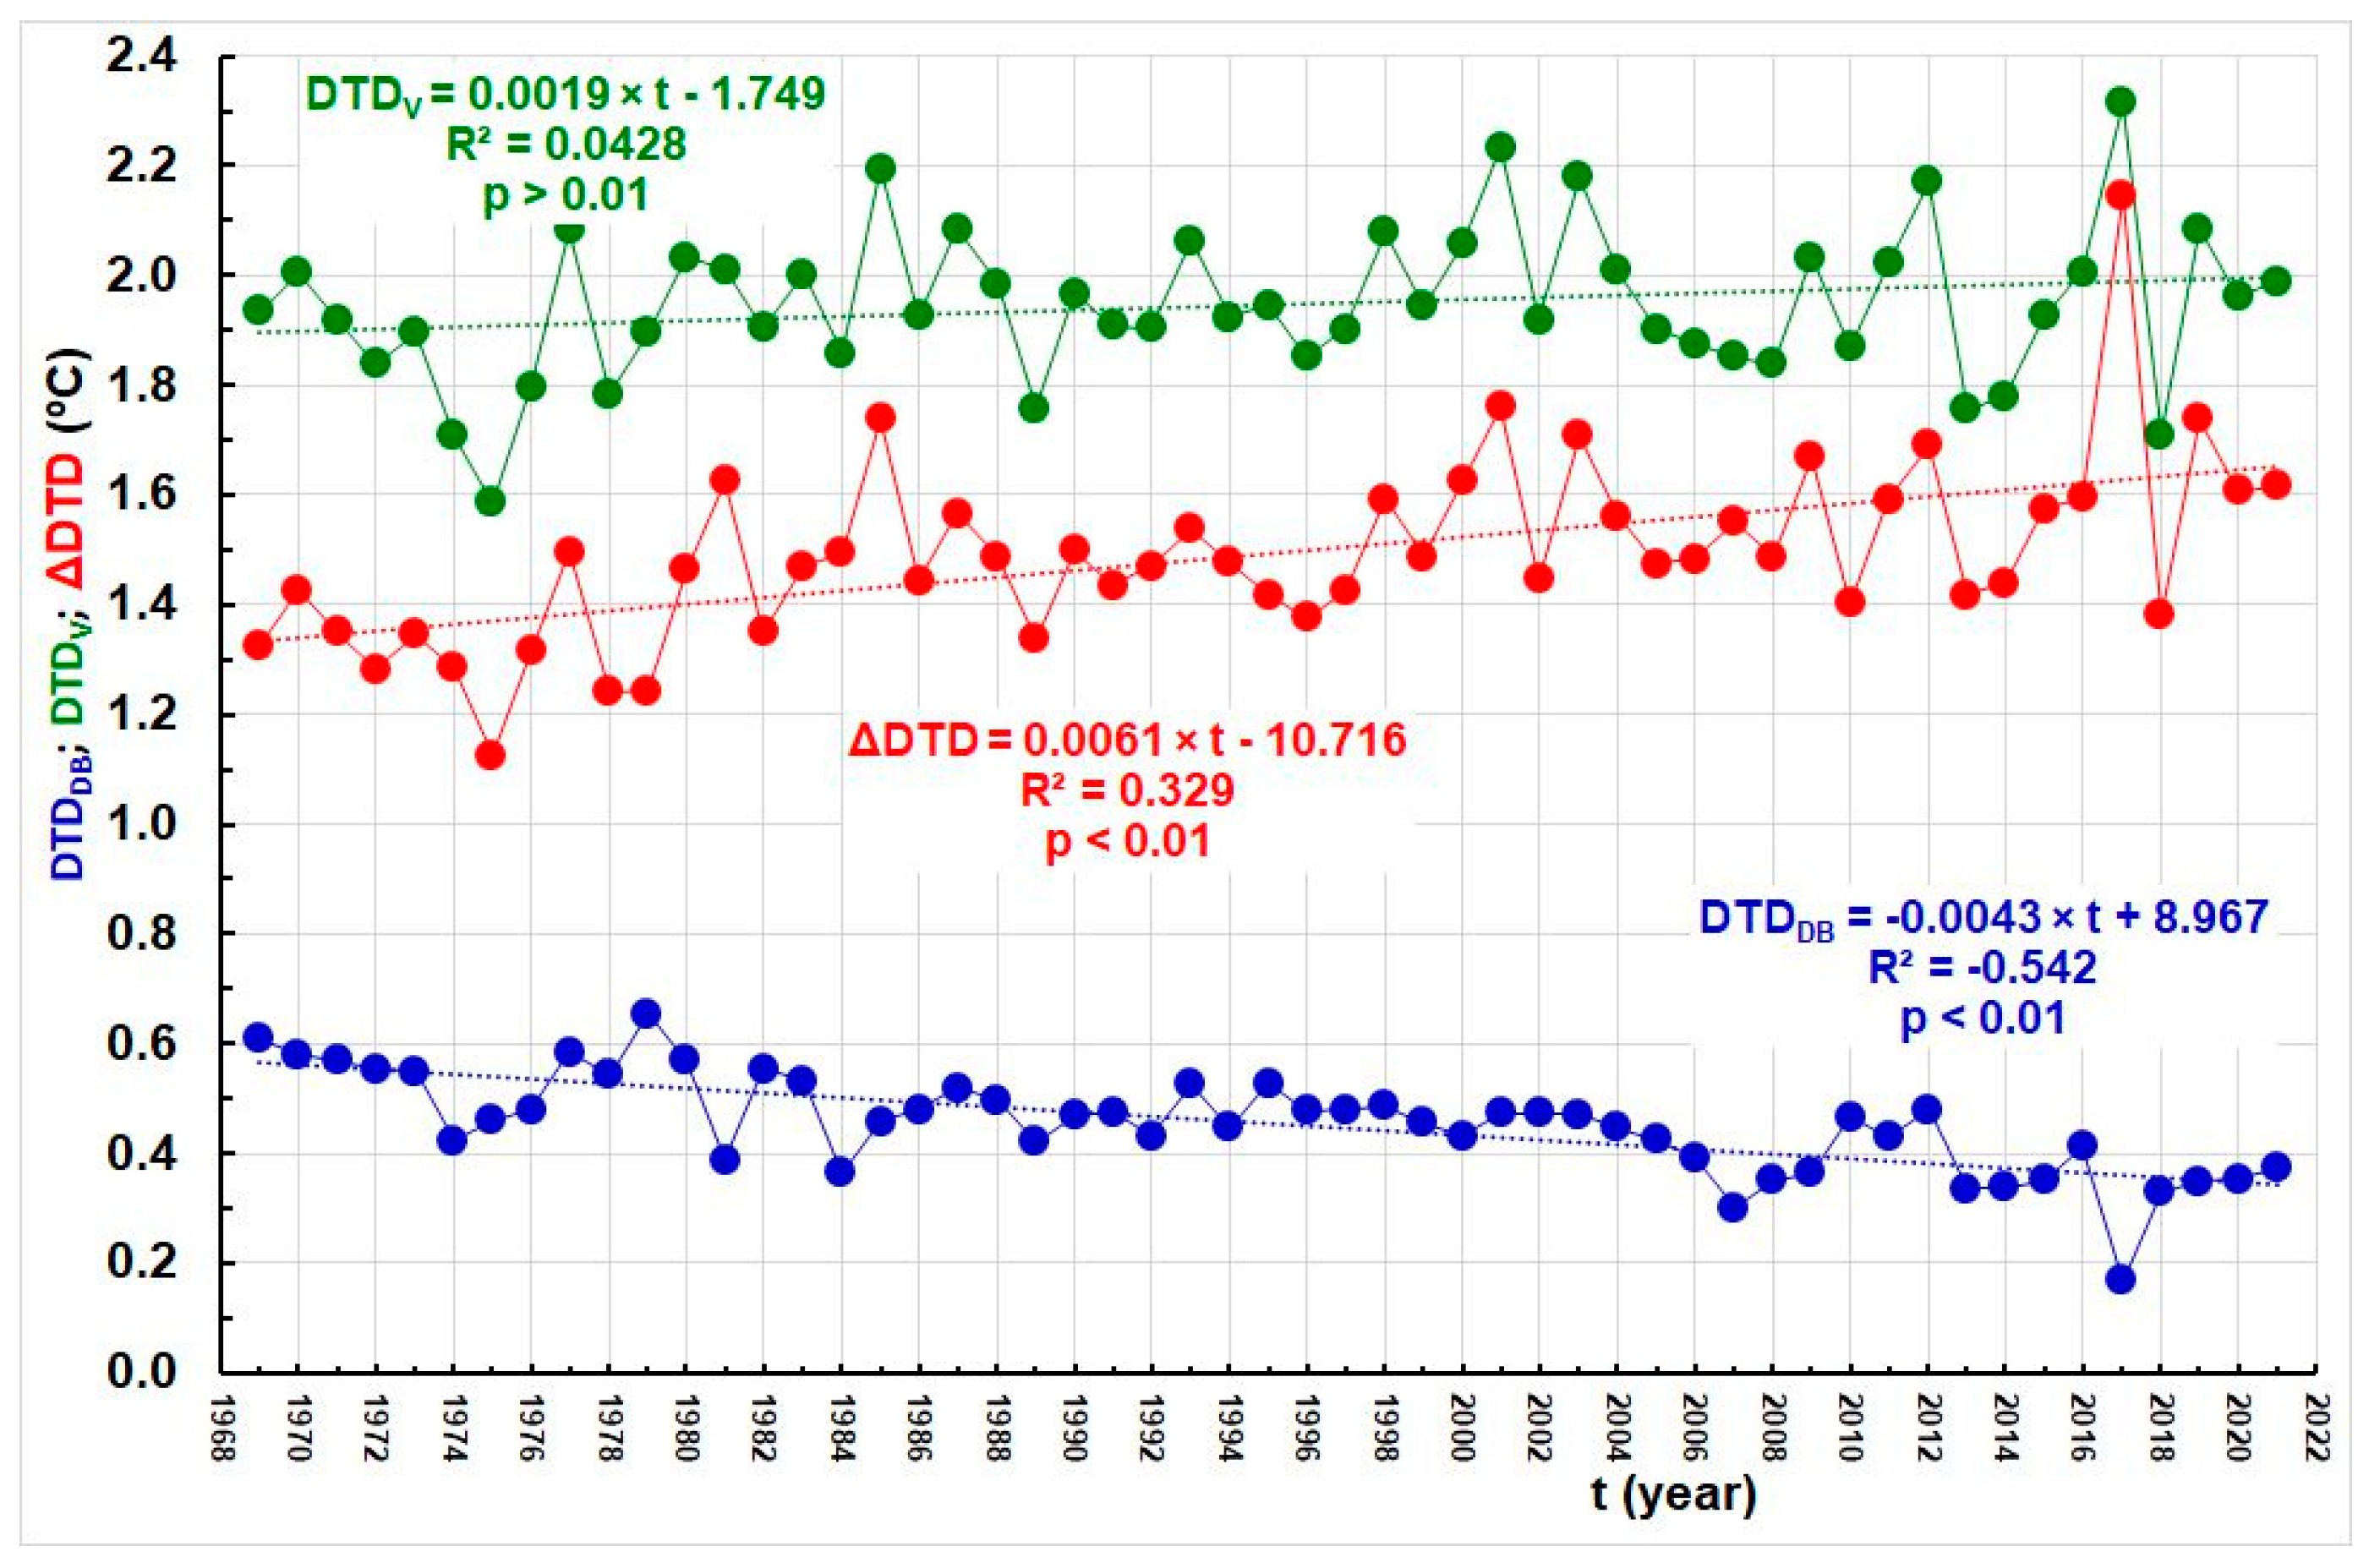
Figure 5.
Series of annual values of water temperatures day-to-day, DTDDB, air temperature, day after day, DTDV, and their differences, ΔDTD = DTDDB − DTDV, from 1969–2021.
Figure 5.
Series of annual values of water temperatures day-to-day, DTDDB, air temperature, day after day, DTDV, and their differences, ΔDTD = DTDDB − DTDV, from 1969–2021.
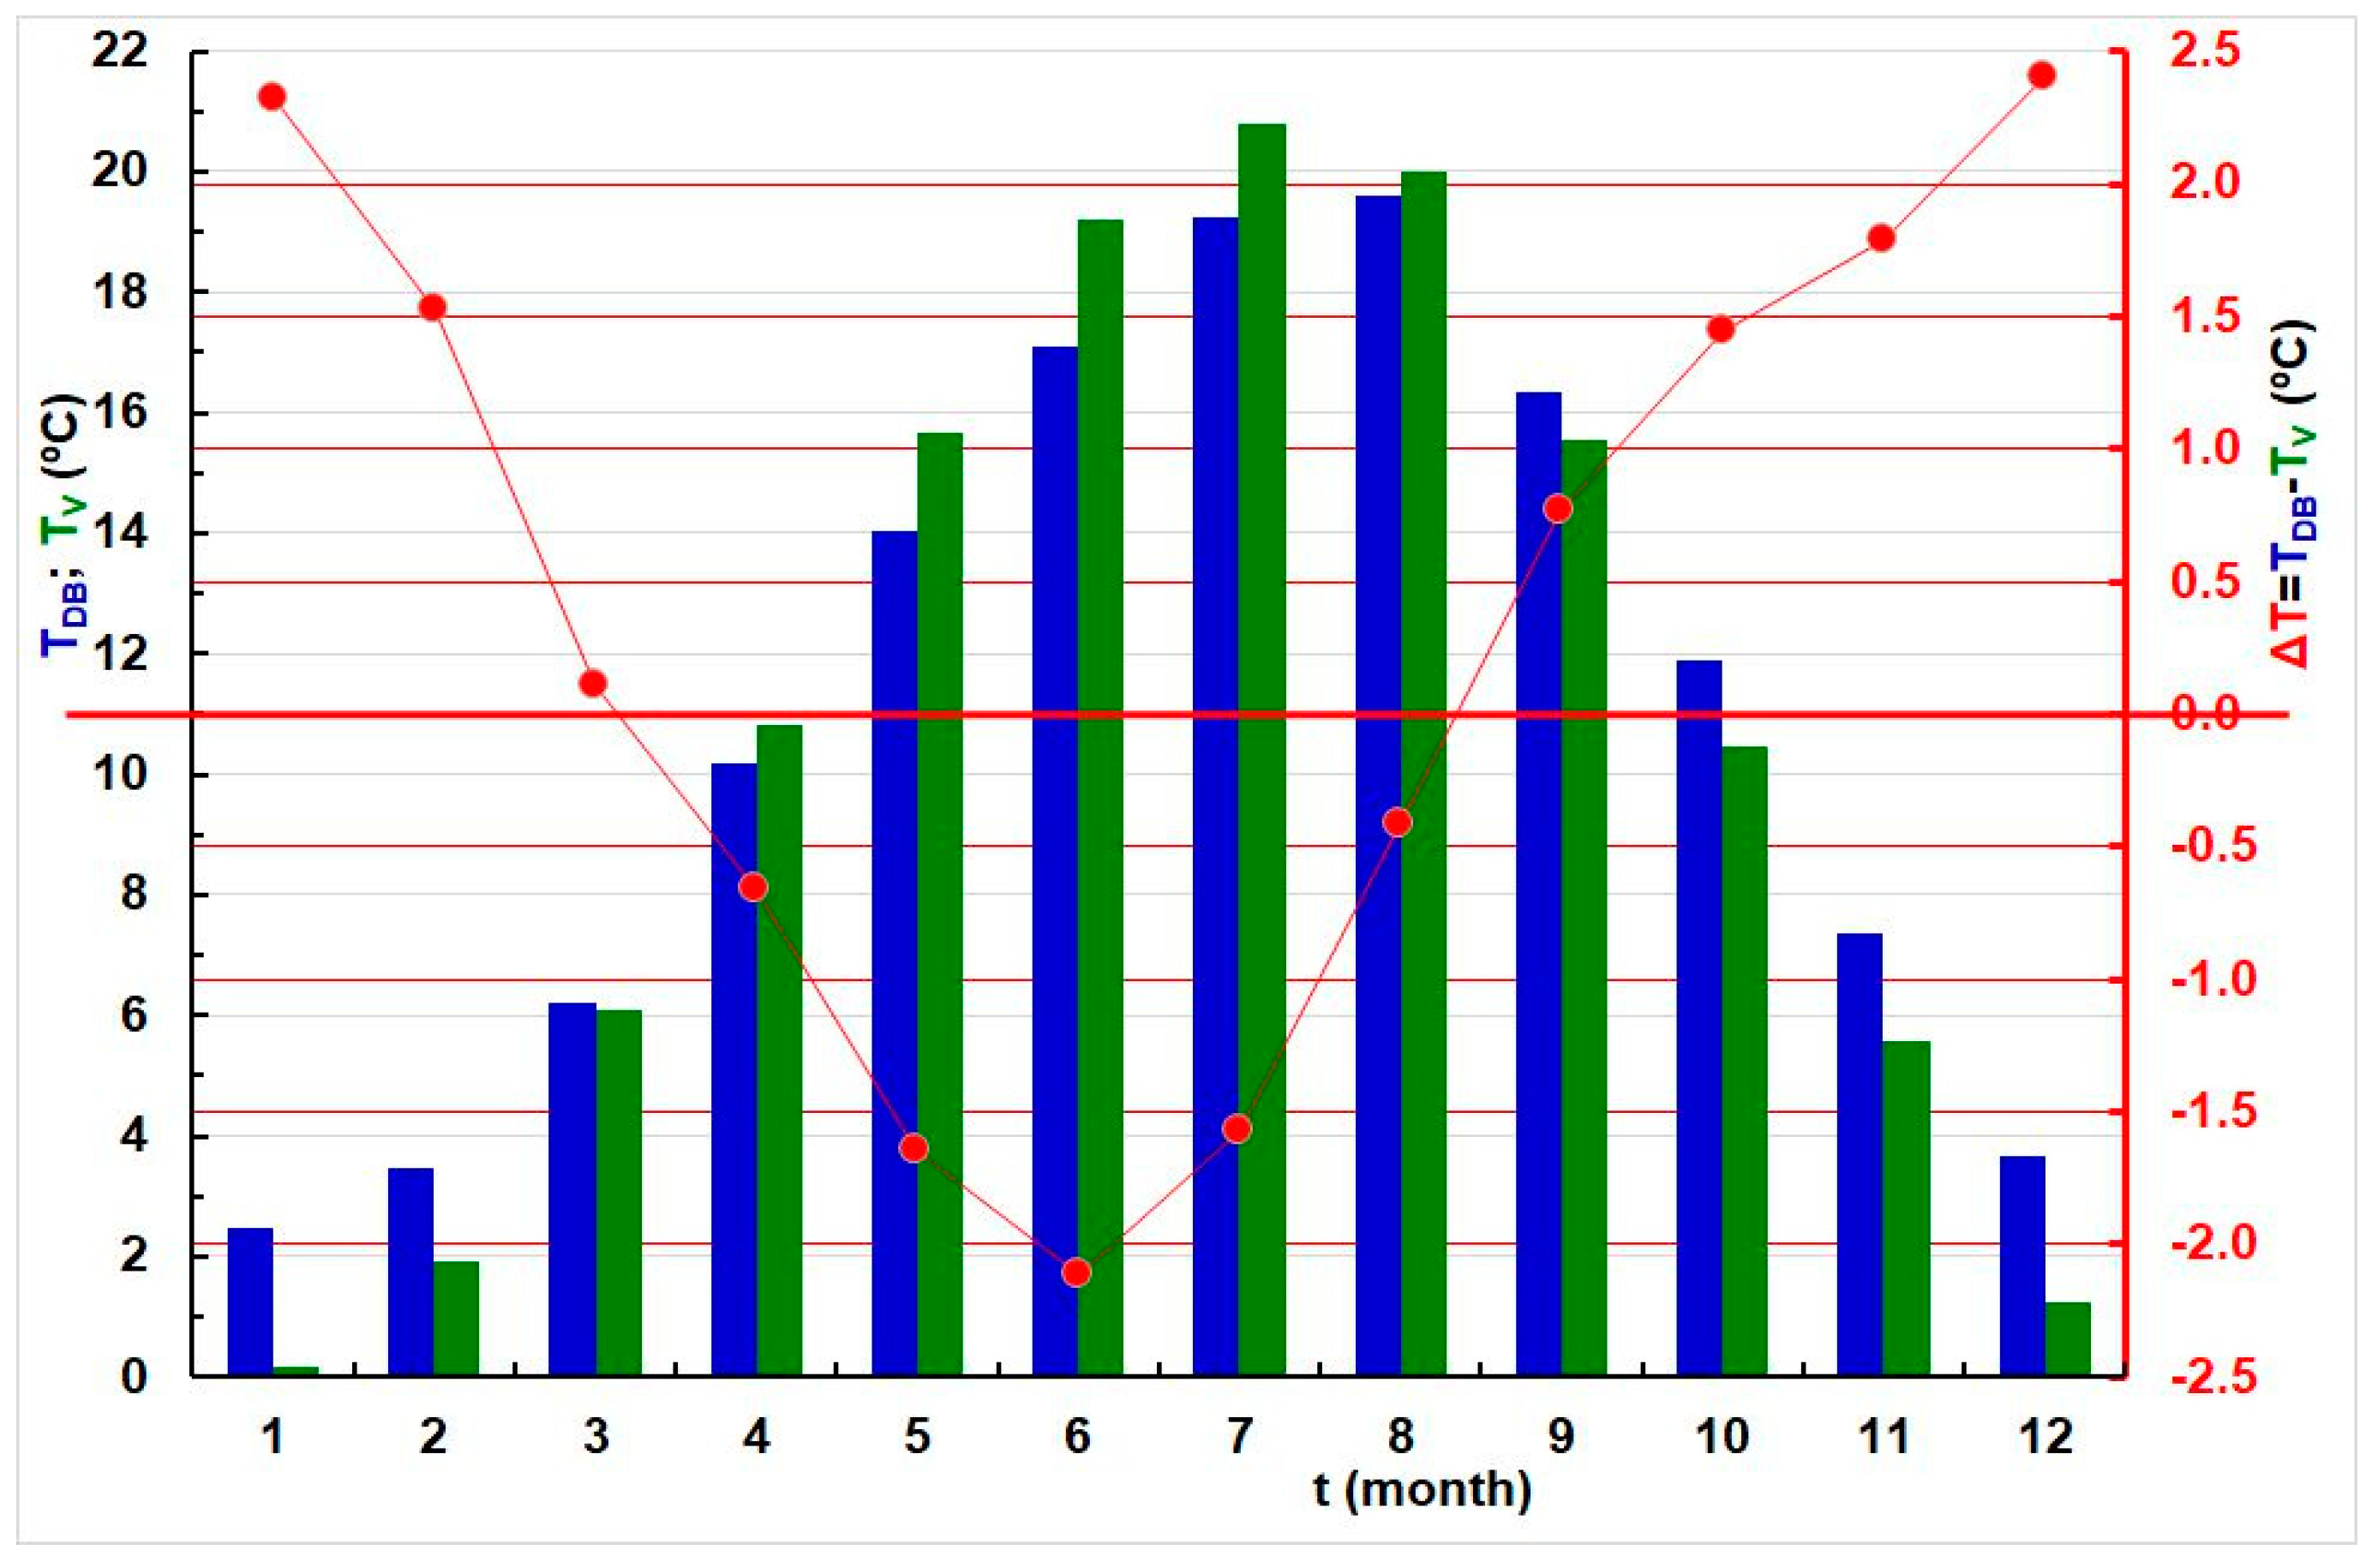
Figure 6.
Histograms of the average monthly water temperatures of the Drava at the Botovo station (blue color), TDB, and the air temperatures of Varaždin (green color), TV, with a line graph of their differences (red color), ΔT = TDB − TV, from 1969–2021.
Figure 6.
Histograms of the average monthly water temperatures of the Drava at the Botovo station (blue color), TDB, and the air temperatures of Varaždin (green color), TV, with a line graph of their differences (red color), ΔT = TDB − TV, from 1969–2021.
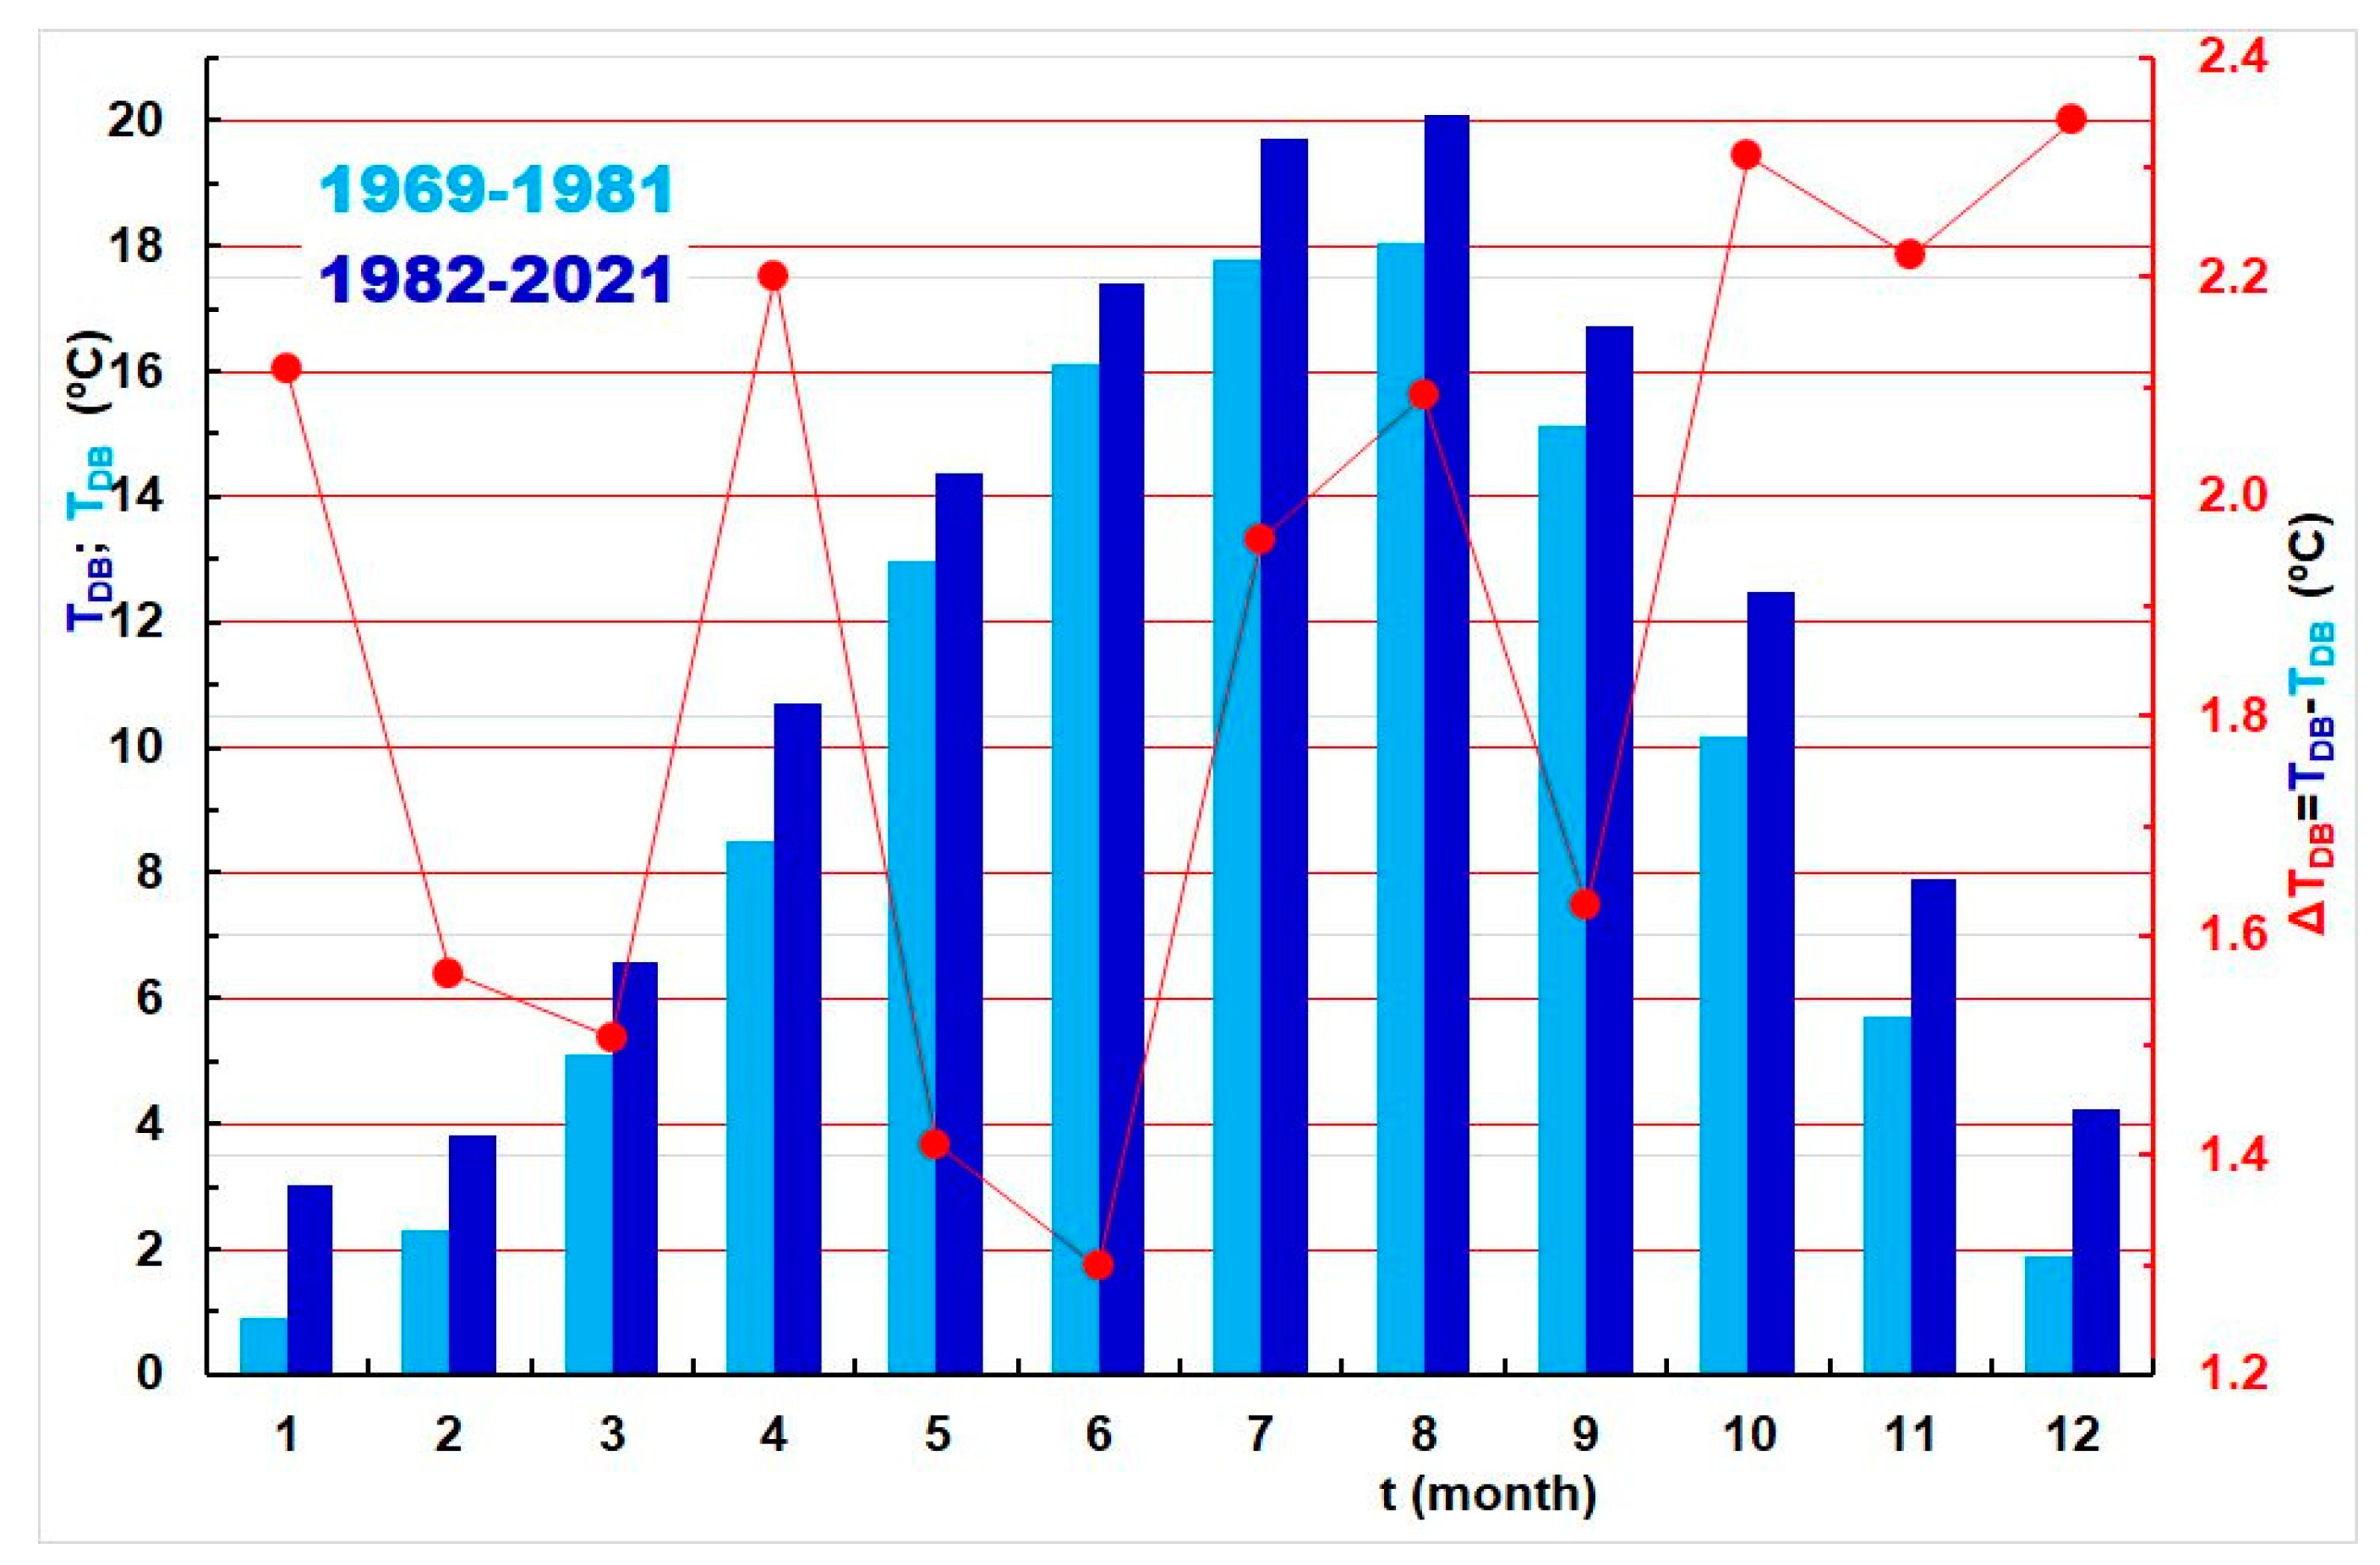
Figure 7.
Histograms of average monthly water temperatures of the Drava at the station Botovo, TDB, during the two subperiods: 1969–1981 (light blue color) and 1982–2021 (dark blue color). A line graph of their differences, ΔTDB, for the two subperiods above is shown in red.
Figure 7.
Histograms of average monthly water temperatures of the Drava at the station Botovo, TDB, during the two subperiods: 1969–1981 (light blue color) and 1982–2021 (dark blue color). A line graph of their differences, ΔTDB, for the two subperiods above is shown in red.
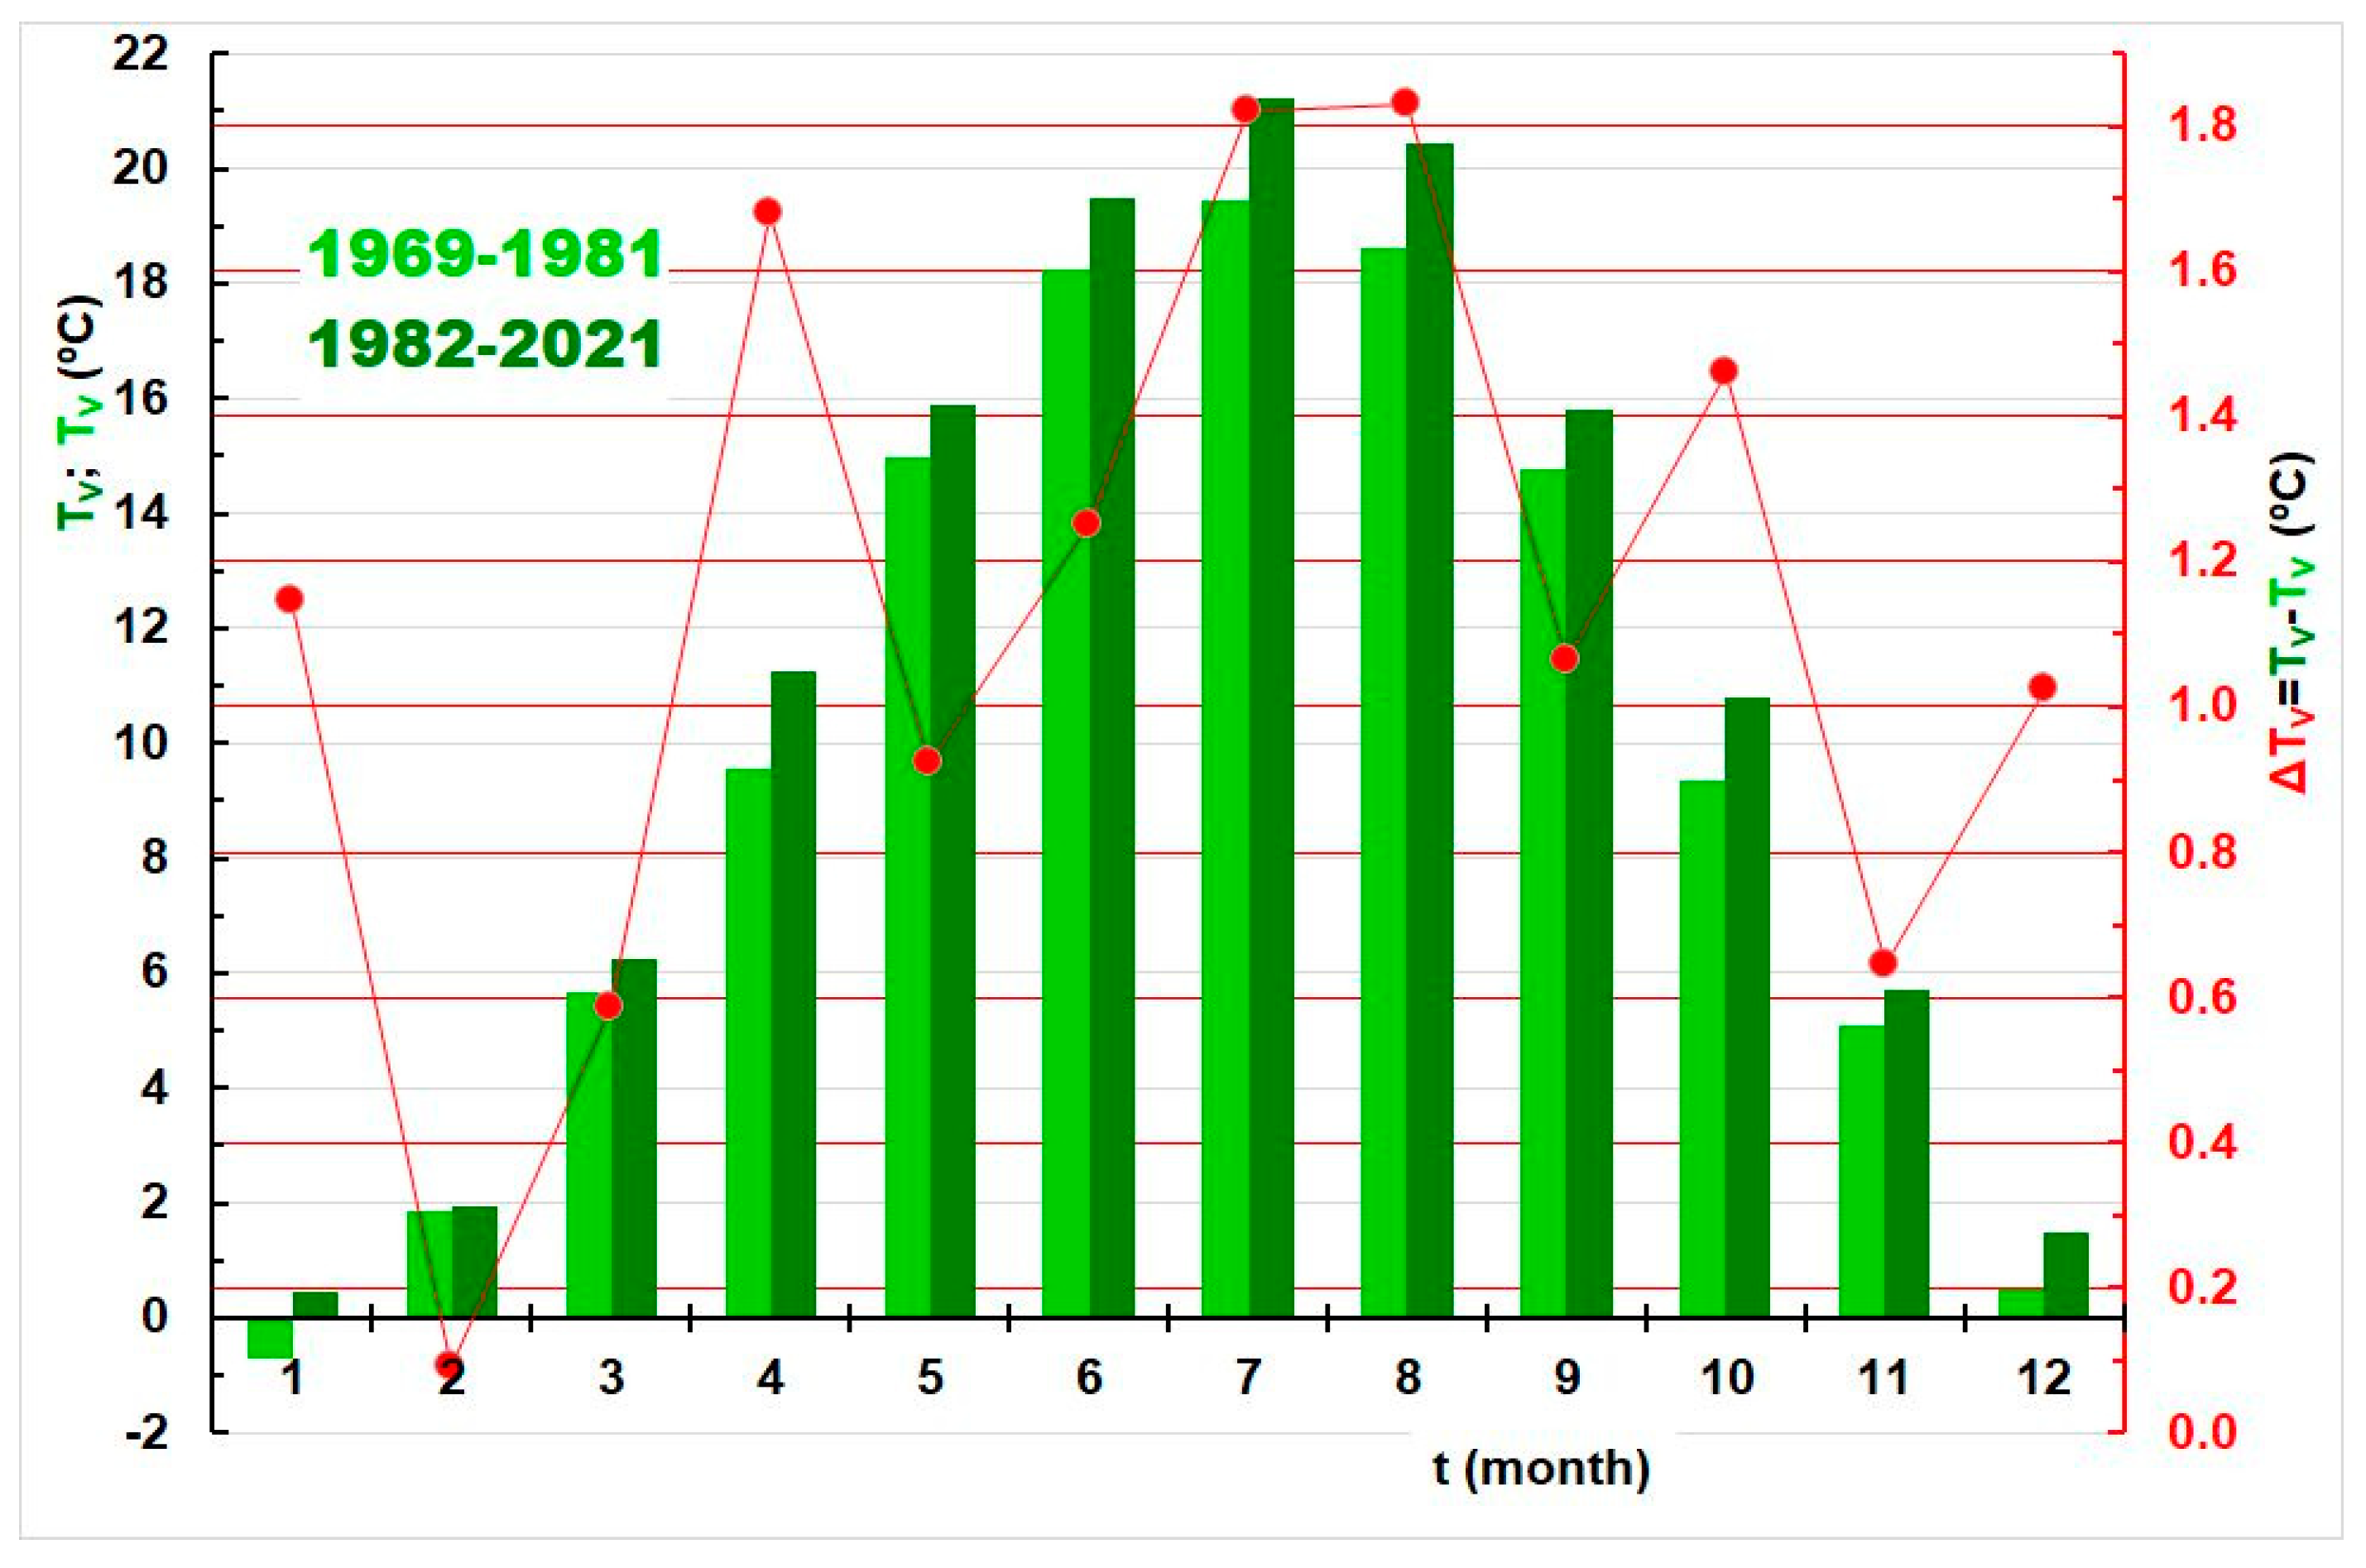
Figure 8.
Histograms of average monthly air temperatures in Varaždin, TV, during the two subperiods: 1969–1981 (light green color) and 1982–2021 (dark green color). A line graph of their differences, ΔTV, during the two subperiods above is shown in red.
Figure 8.
Histograms of average monthly air temperatures in Varaždin, TV, during the two subperiods: 1969–1981 (light green color) and 1982–2021 (dark green color). A line graph of their differences, ΔTV, during the two subperiods above is shown in red.
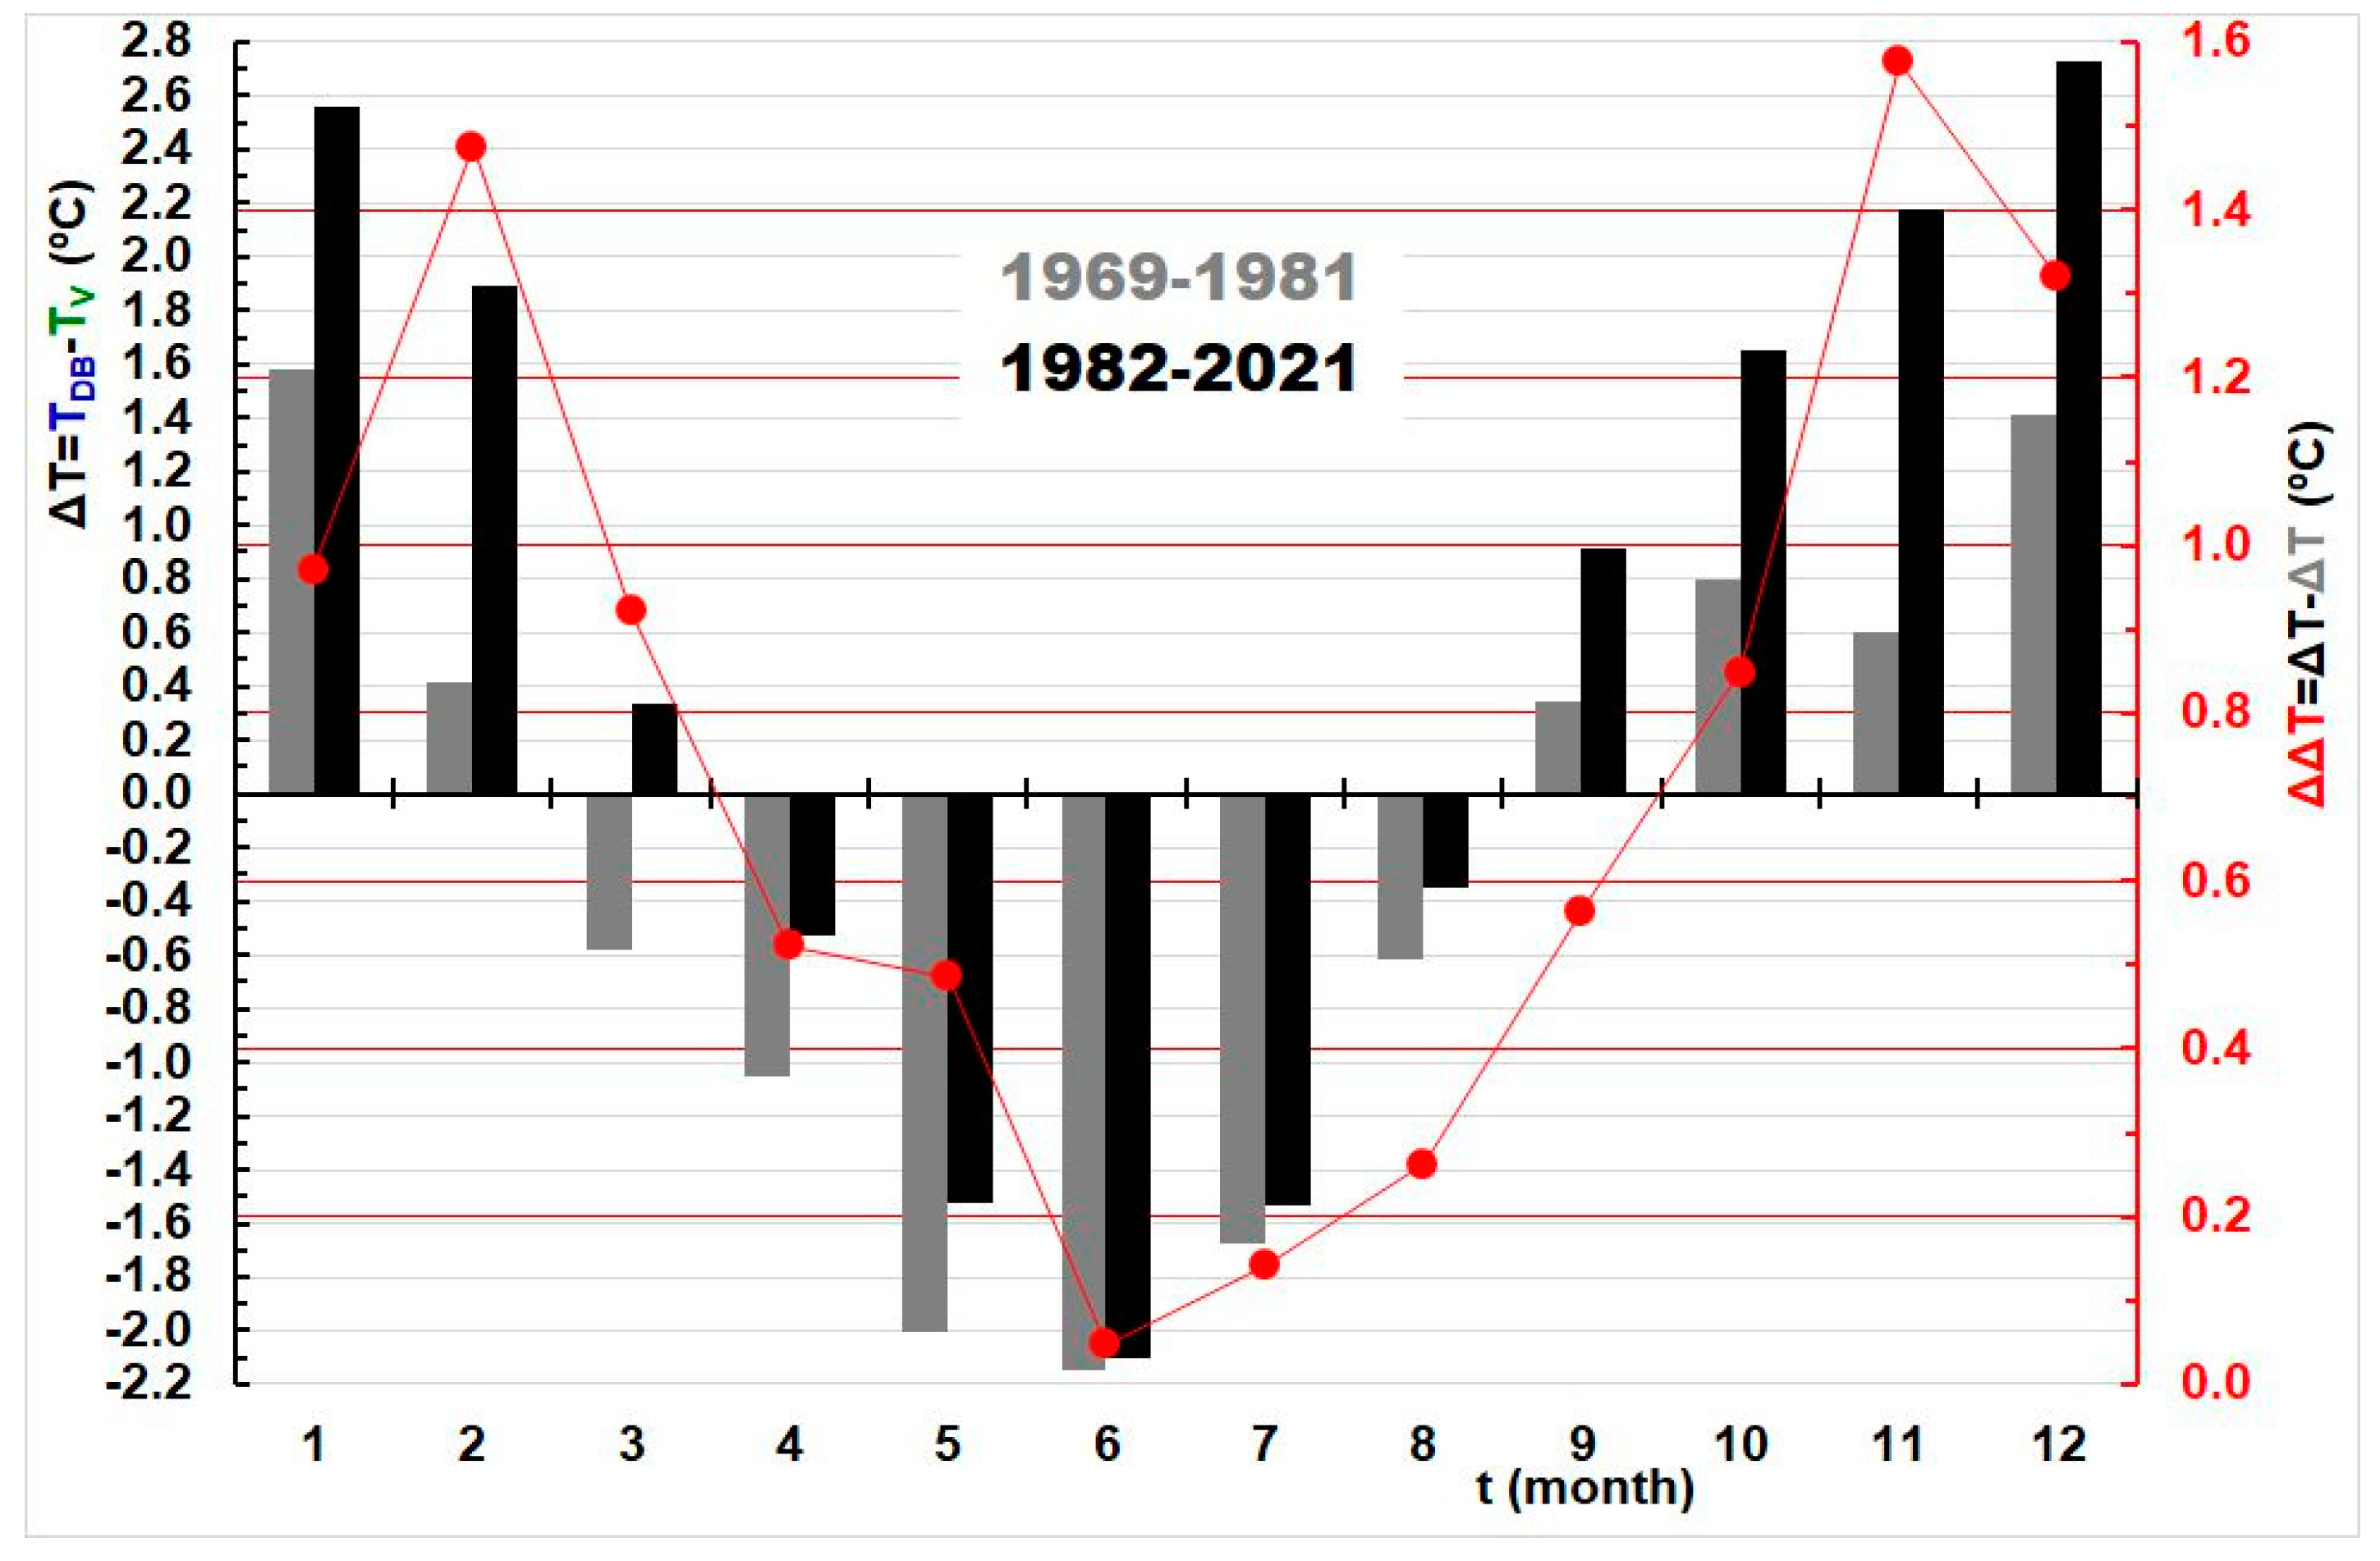
Figure 9.
Histograms of average monthly differences in water temperature of the Drava at the station Botovo, TDB, and the air temperature at Varaždin, TV, ΔT = TDB − TV, during the two subperiods: 1969–1981 (grey color) and 1982–2021 (black color). A line graph of their differences, ΔΔT, during the two subperiods above is shown in red.
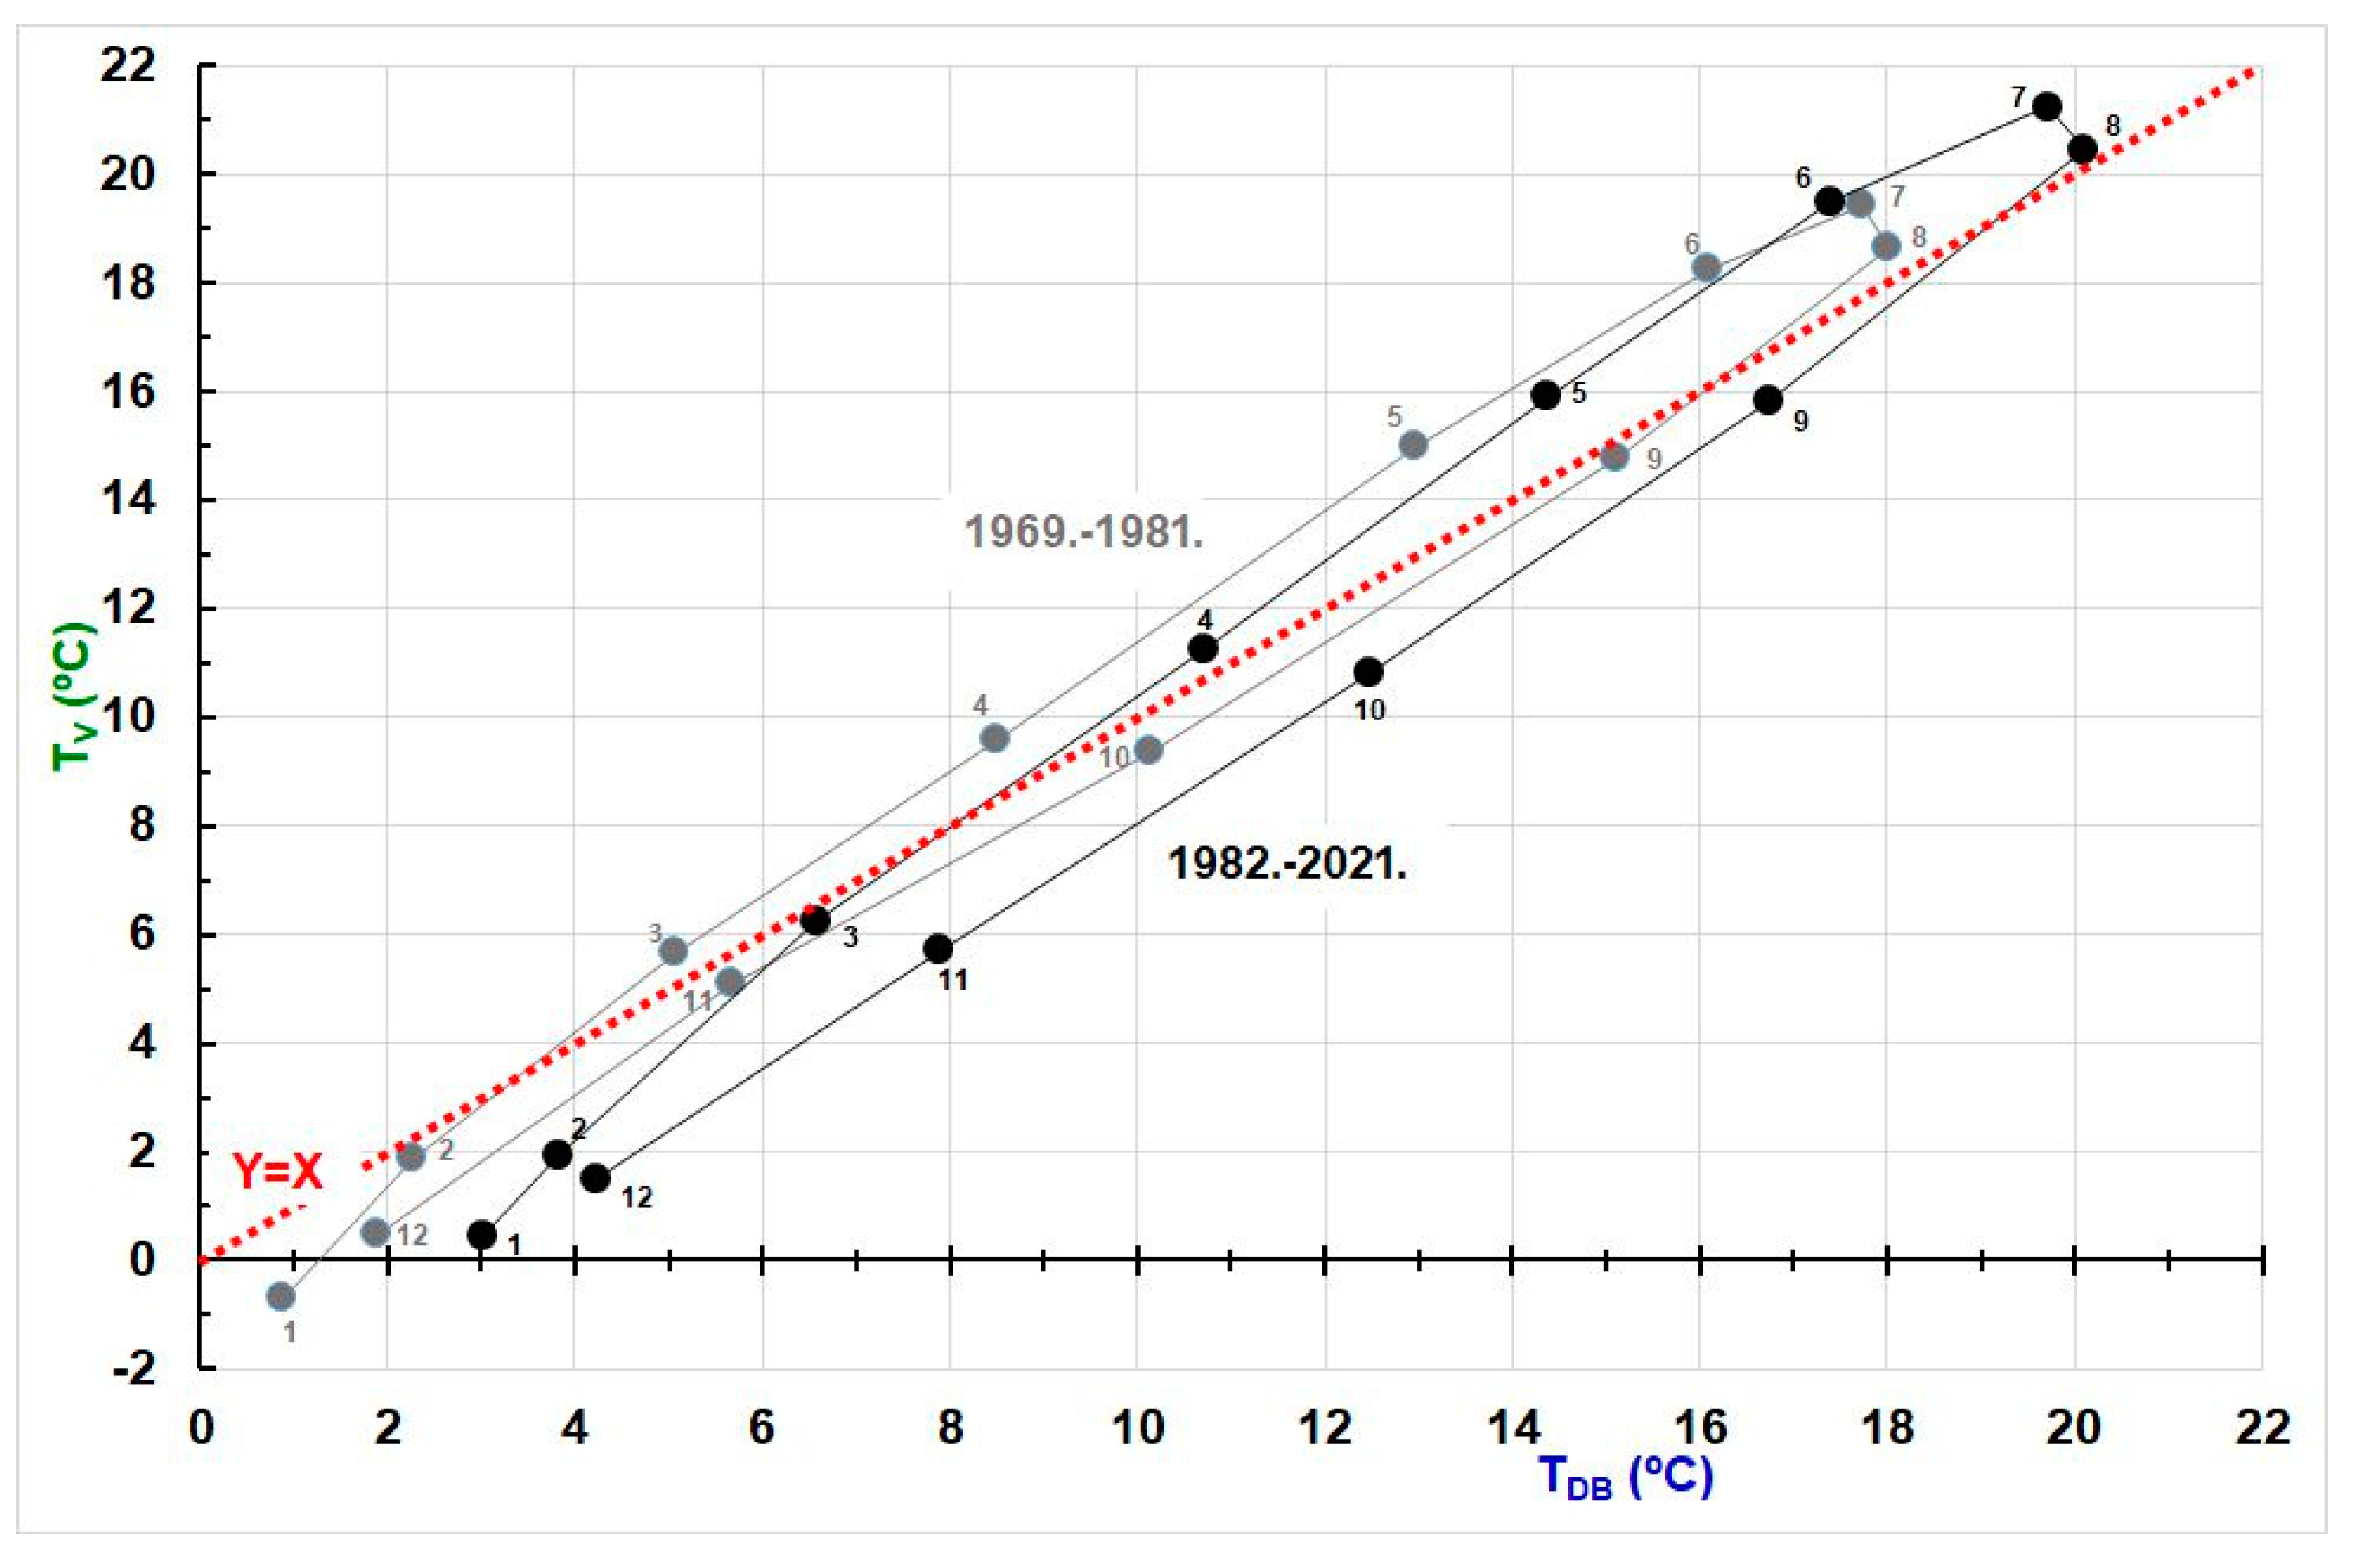
Figure 10.
Graphic representation of the relationship between the average monthly water temperatures of the Drava at the Botovo station (abscissa axis), TDB, and the average daily air temperatures at Varaždin (ordinate axis), TV, during the following two subperiods: (1) 1969–1981 (Gray color) and (2) 1982–2021 (black).
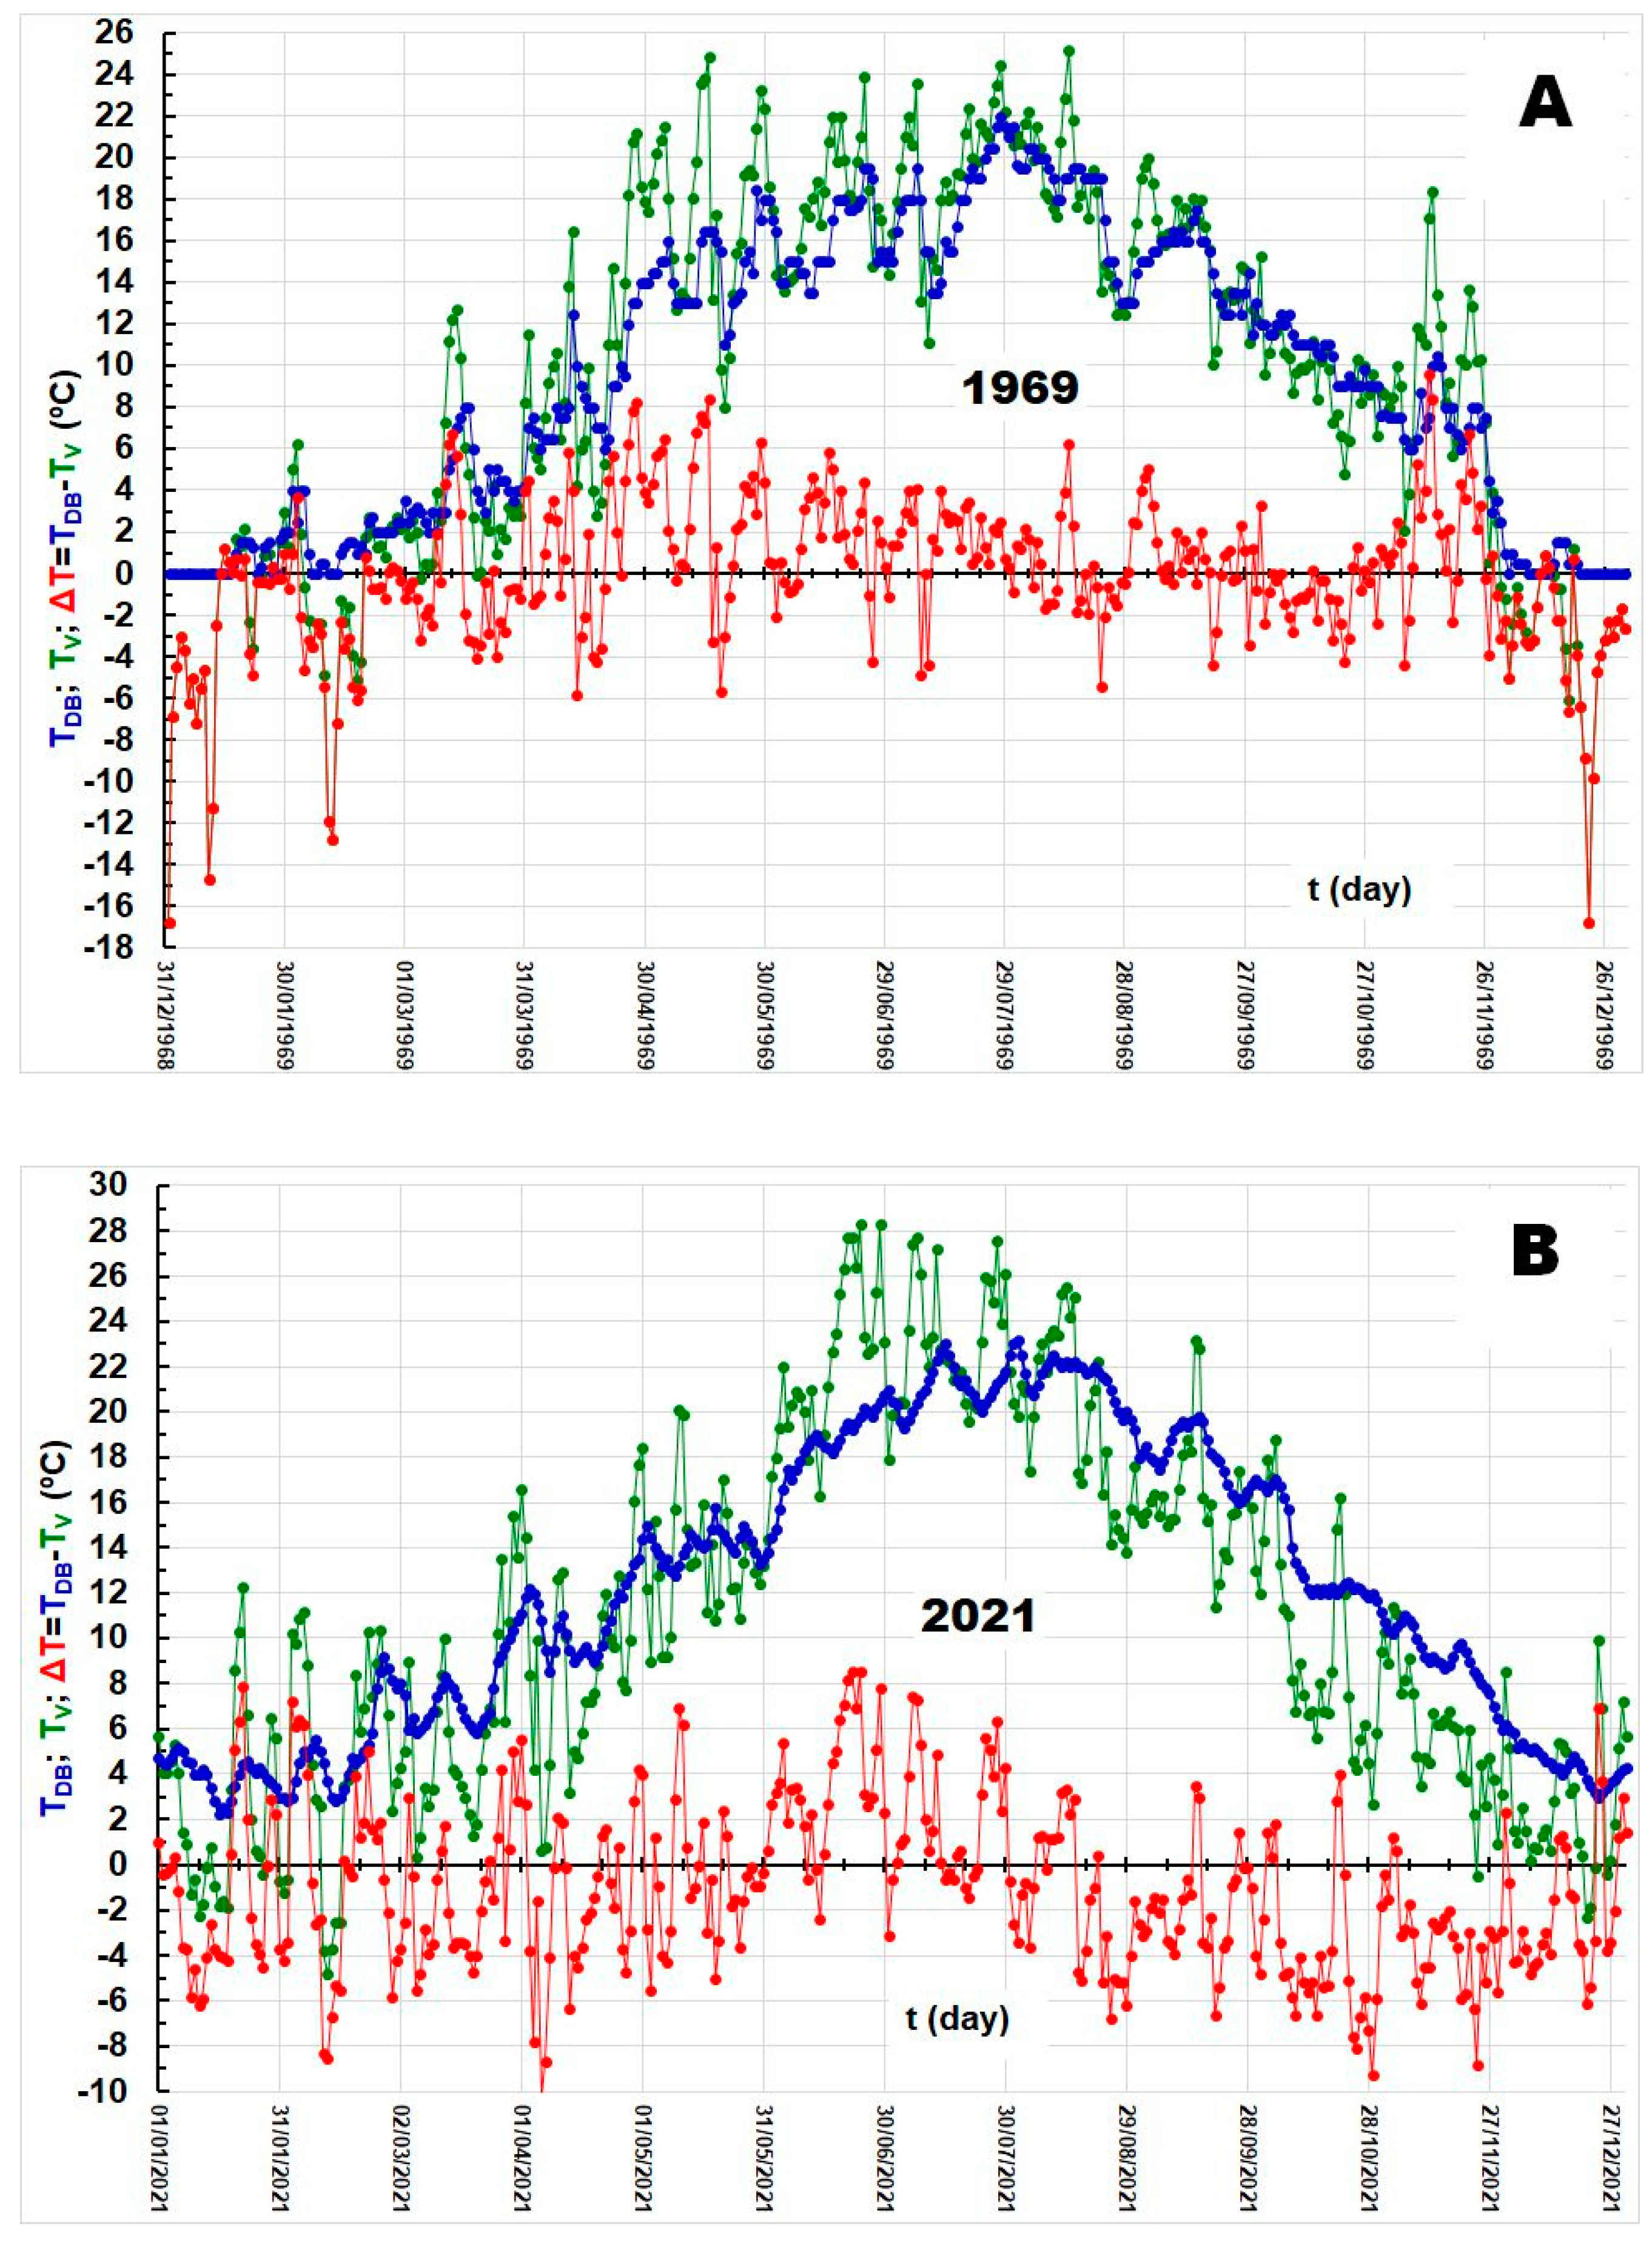
Figure 11.
Series of daily water temperatures of the Drava at Botovo station (blue color), TDB, average daily air temperatures at Varaždin (green color), TV, and their differences (red color), ΔT = TDB − TV, during 1969 (A) and 2021 (B).
Figure 11.
Series of daily water temperatures of the Drava at Botovo station (blue color), TDB, average daily air temperatures at Varaždin (green color), TV, and their differences (red color), ΔT = TDB − TV, during 1969 (A) and 2021 (B).
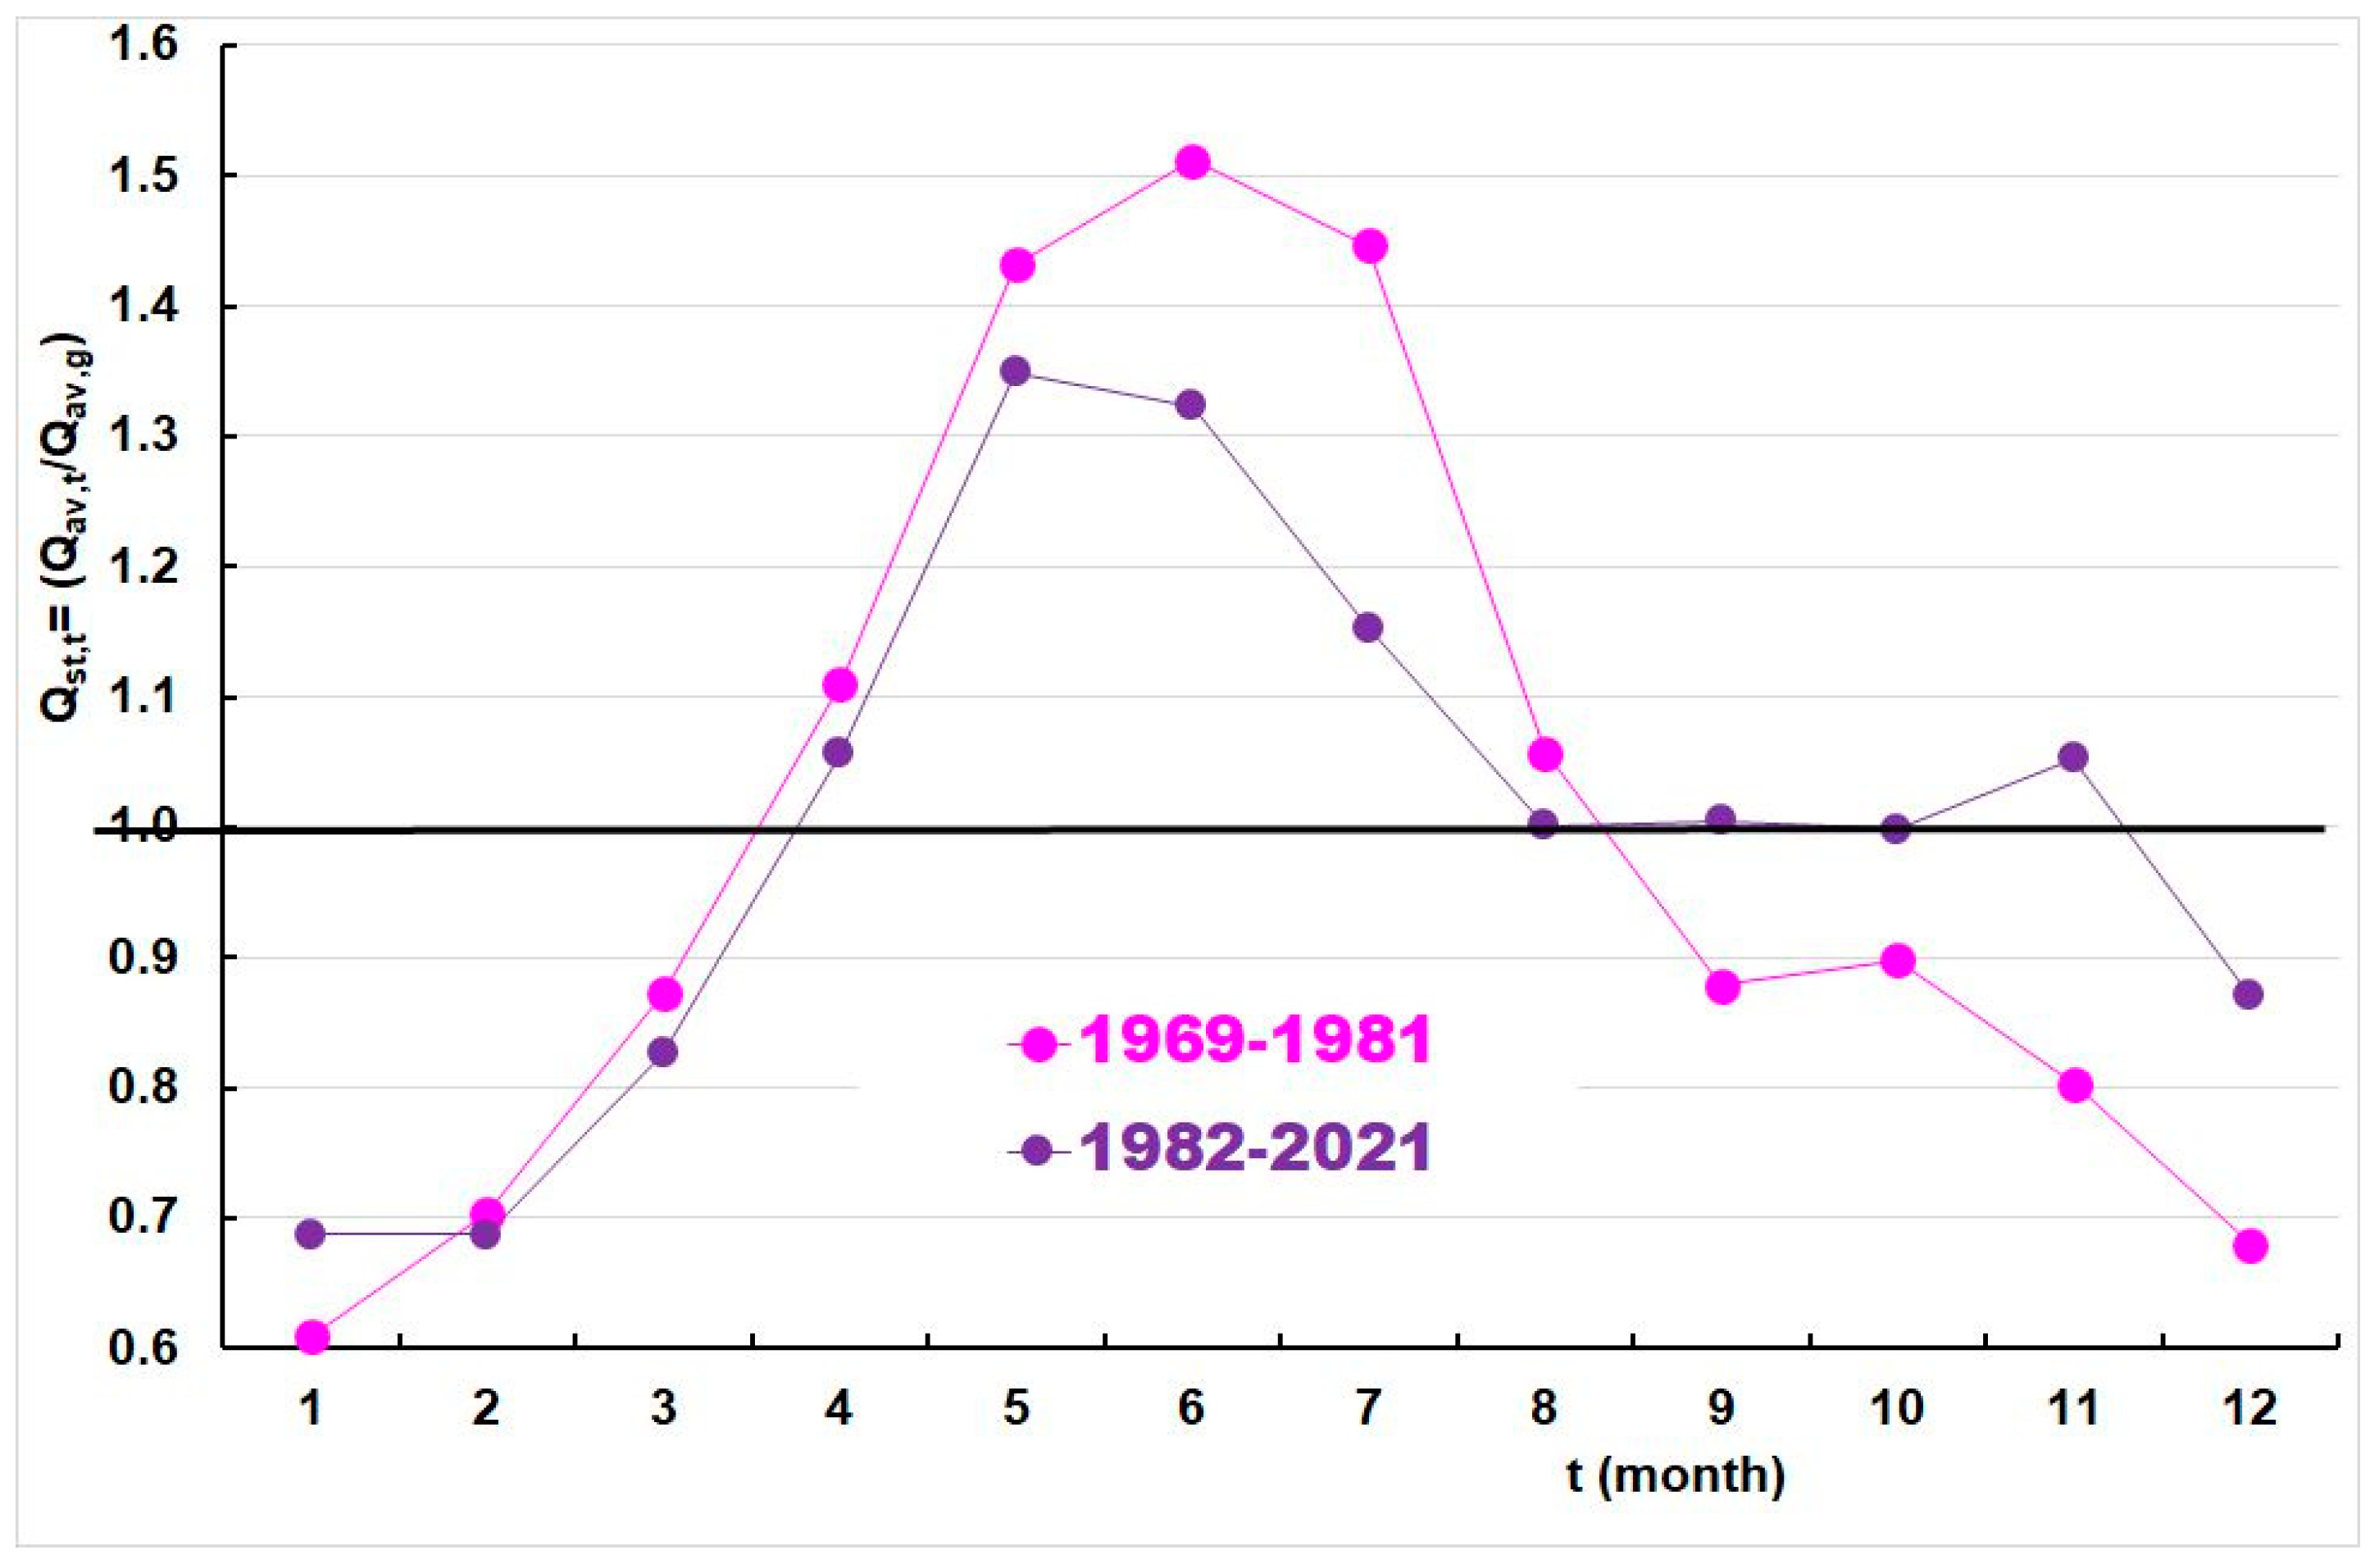
Figure 12.
Graphical representation of the values of the standardized, average monthly flows of the Drava near Botovo, Qst,t, during the following two subperiods: (1) 1969–1981 (light purple color); (2) 1982–2021 (dark purple color).
Figure 12.
Graphical representation of the values of the standardized, average monthly flows of the Drava near Botovo, Qst,t, during the following two subperiods: (1) 1969–1981 (light purple color); (2) 1982–2021 (dark purple color).
Table 1.
Aerial distances between individual locations.
Table 1.
Aerial distances between individual locations.
| L (km) | Drava Botovo | GMP Varaždin | A1 | A2 | A3 |
|---|
| Drava Botovo | - | 29 | 36 | 22 | 11 (28 *) |
| GMP Varaždin | | - | 16 | 3.2 | 18 |
| A1 | | | - | 9.8 | 26.8 |
| A2 | | | | - | 5.2 |
| A3 | | | | | - |
Table 2.
Basic characteristics of reservoirs on the Drava are shown in
Figure 1.
Table 2.
Basic characteristics of reservoirs on the Drava are shown in
Figure 1.
| | A1 | A2 | A3 |
|---|
| Starting of the work (years) | 1975 | 1982 | 1989 |
| Volume (106 m3) | 8.0 | 51.0 | 93.5 |
| Area (km2) | 3.0 | 10.5 | 16.6 |
| Max. altitude (m asl) | 191.0 | 168.0 | 149.6 |
Table 3.
Characteristic (minimum, average, maximum) annual values, squares of linear correlation coefficient of series, R2, probabilities of the Mann–Kendall test, p, series of yearly water temperatures of the Drava near Botovo, TDB, series of air temperature GMP Varaždin, TV, series of their differences, ΔT = TDB − TV, series of Day-to-Day water temperature of the Drava near Botovo, DTDDB, series of Day-to-Day air temperature of GMP Varaždin, DTDV, series of their differences, ΔDTD = (DTDV − DTDDB), series of mean flows of the Drava near Botovo, Q, in the period 1969–2021.
| | TDB | TV | ΔT | DTDDB | DTDV | ΔDTD | Q |
| °C | m3/s |
| 1 | 2 | 3 | 4 | 5 | 6 | 7 |
| minimum | 8.85 | 8.98 | −0.81 | 0.17 | 1.59 | 1.12 | 327 |
| average | 10.99 | 10.67 | 0.32 | 0.045 | 1.95 | 1.49 | 490 |
| maximum | 13.04 | 12.31 | 1.15 | 0.65 | 2.31 | 2.15 | 739 |
| R2 | 0.7253 | 0.5833 | 0.1668 | −0.542 | 0.0428 | 0.329 | −0.0146 |
| p | p < 0.01 | p < 0.01 | p < 0.01 | p < 0.01 | p > 0.01 | p < 0.01 | p > 0.01 |
Table 4.
Characteristic monthly values (minimum, average, and maximum) of the series of mean monthly water temperatures of Drava Botovo, TDB, the series of mean monthly air temperatures of Varaždin, TV, and the series of their differences, ΔT = TDB − TV, from 1969–2021.
Table 4.
Characteristic monthly values (minimum, average, and maximum) of the series of mean monthly water temperatures of Drava Botovo, TDB, the series of mean monthly air temperatures of Varaždin, TV, and the series of their differences, ΔT = TDB − TV, from 1969–2021.
| | TDB | TV | ΔT |
|---|
| Min. | Aver. | Max. | Min. | Aver. | Max. | Min. | Aver. | Max. |
|---|
| January | 0.1 | 2.49 | 6.6 | −6.0 | 0.17 | 5.8 | −1.2 | 2.32 | 6.9 |
| February | 0.4 | 3.45 | 7.5 | −4.5 | 1.92 | 7.1 | −1.1 | 1.53 | 5.7 |
| March | 3.5 | 6.21 | 9.4 | 0.4 | 6.10 | 9.9 | −2.7 | 0.11 | 3.1 |
| April | 7.2 | 10.17 | 13.0 | 8.0 | 10.83 | 15.1 | −3.4 | −0.66 | 1.7 |
| May | 10.9 | 14.03 | 16.7 | 12.2 | 15.67 | 18.7 | −3.8 | −1.64 | 0.7 |
| June | 14.5 | 17.08 | 21.3 | 16.7 | 19.19 | 23.8 | −4.0 | −2.11 | −0.6 |
| July | 15.5 | 19.23 | 22.4 | 17.8 | 20.80 | 23.0 | −3.5 | −1.57 | 0.9 |
| August | 16.3 | 19.59 | 23.5 | 16.3 | 20.00 | 24.5 | −2.5 | −0.42 | 1.7 |
| September | 12.9 | 16.33 | 19.5 | 12.3 | 15.56 | 18.4 | −1.8 | 0.77 | 5 |
| October | 8.1 | 11.90 | 15.7 | 6.6 | 10.46 | 13.8 | −0.3 | 1.44 | 4.1 |
| November | 3.5 | 7.35 | 10.3 | 0.8 | 5.56 | 9.5 | −2.0 | 1.79 | 5.1 |
| December | 0.3 | 3.65 | 6.2 | −3.2 | 1.25 | 4.7 | −0.5 | 2.40 | 5.2 |
Table 5.
Values of the square of the correlation coefficient, R2, and the probability of the Mann–Kendall test, p, for the series of mean monthly water temperatures of Drava Botovo, TDB, the series of mean monthly air temperatures of Varaždin, TV, and the series of their differences, ΔT = TDB − TV, from 1969–2021.
| | TDB | TV | ΔT |
|---|
| R2 | p | R2 | p | R2 | p |
|---|
| January | 0.419 | p < 0.01 | 0.089 | p < 0.01 | 0.088 | p > 0.01 |
| February | 0.235 | p < 0.01 | 0.054 | p > 0.01 | 0.007 | p > 0.01 |
| March | 0.268 | p < 0.01 | 0.081 | p > 0.01 | 0.028 | p > 0.01 |
| April | 0.542 | p < 0.01 | 0.323 | p < 0.01 | 0.041 | p > 0.01 |
| May | 0.194 | p < 0.01 | 0.037 | p > 0.01 | 0.096 | p > 0.01 |
| June | 0.286 | p < 0.01 | 0.407 | p < 0.01 | 0.090 | p > 0.01 |
| July | 0.312 | p < 0.01 | 0.441 | p < 0.01 | 0.000 | p > 0.01 |
| August | 0.304 | p < 0.01 | 0.286 | p < 0.01 | 0.008 | p > 0.01 |
| September | 0.264 | p < 0.01 | 0.088 | p > 0.01 | 0.148 | p < 0.01 |
| October | 0.463 | p < 0.01 | 0.212 | p < 0.01 | 0.061 | p > 0.01 |
| November | 0.546 | p < 0.01 | 0.113 | p < 0.01 | 0.081 | p > 0.01 |
| December | 0.506 | p < 0.01 | 0.125 | p < 0.01 | 0.081 | p > 0.01 |
Table 6.
Average values of the subseries of monthly water temperatures of the Drava near Botovo (1969–1981 and 1982–2021), TDB, the subseries of Varaždin air temperature, TV, and the subseries of their differences, ΔT = TDB − TV, and the probability of the t-test, p.
Table 6.
Average values of the subseries of monthly water temperatures of the Drava near Botovo (1969–1981 and 1982–2021), TDB, the subseries of Varaždin air temperature, TV, and the subseries of their differences, ΔT = TDB − TV, and the probability of the t-test, p.
| Months | Subperiods | Tdb | Tv | Δt |
|---|
| Average | p | Average | p | Average | p |
|---|
| January | 1969–1981 | 0.89 | p < 0.01 | −0.69 | p > 0.01 | 1.58 | p > 0.01 |
| 1982–2021 | 3.01 | 0.45 | 2.56 |
| February | 1969–1981 | 2.27 | p < 0.01 | 1.85 | p > 0.01 | 0.42 | p < 0.01 |
| 1982–2021 | 3.84 | 1.95 | 1.89 |
| March | 1969–1981 | 5.08 | p < 0.01 | 5.66 | p > 0.01 | −0.58 | p > 0.01 |
| 1982–2021 | 6.58 | 6.25 | 0.34 |
| April | 1969–1981 | 8.51 | p < 0.01 | 9.56 | p < 0.01 | 1.05 | p > 0.01 |
| 1982–2021 | 10.71 | 11.24 | −0.53 |
| May | 1969–1981 | 12.96 | p < 0.01 | 14.97 | p > 0.01 | −2.01 | p > 0.01 |
| 1982–2021 | 14.37 | 15.89 | −1.52 |
| June | 1969–1981 | 16.10 | p < 0.01 | 18.25 | p < 0.01 | −2.15 | p > 0.01 |
| 1982–2021 | 17.40 | 19.50 | −2.10 |
| July | 1969–1981 | 17.75 | p < 0.01 | 19.42 | p < 0.01 | −1.68 | p > 0.01 |
| 1982–2021 | 19.71 | 21.24 | −1.53 |
| August | 1969–1981 | 18.01 | p < 0.01 | 18.62 | p < 0.01 | −0.62 | p > 0.01 |
| 1982–2021 | 20.10 | 20.45 | −0.35 |
| September | 1969–1981 | 15.10 | p < 0.01 | 14.75 | p > 0.01 | 0.35 | p > 0.01 |
| 1982–2021 | 16.73 | 15.82 | 0.91 |
| October | 1969–1981 | 10.15 | p < 0.01 | 9.35 | p < 0.01 | 0.80 | p > 0.01 |
| 1982–2021 | 12.46 | 10.82 | 1.65 |
| November | 1969–1981 | 5.68 | p < 0.01 | 5.08 | p > 0.01 | 0.60 | p < 0.01 |
| 1982–2021 | 7.90 | 5.72 | 2.18 |
| December | 1969–1981 | 1.88 | p < 0.01 | 0.48 | p > 0.01 | 1.41 | p < 0.01 |
| 1982–2021 | 4.23 | 1,50 | 2.73 |


