
Spatial and Temporal Evaluation of Water Streams Using Quality Indexes: A Case Study
 ,
,
Abstract
:1. Introduction
2. Material and Methods
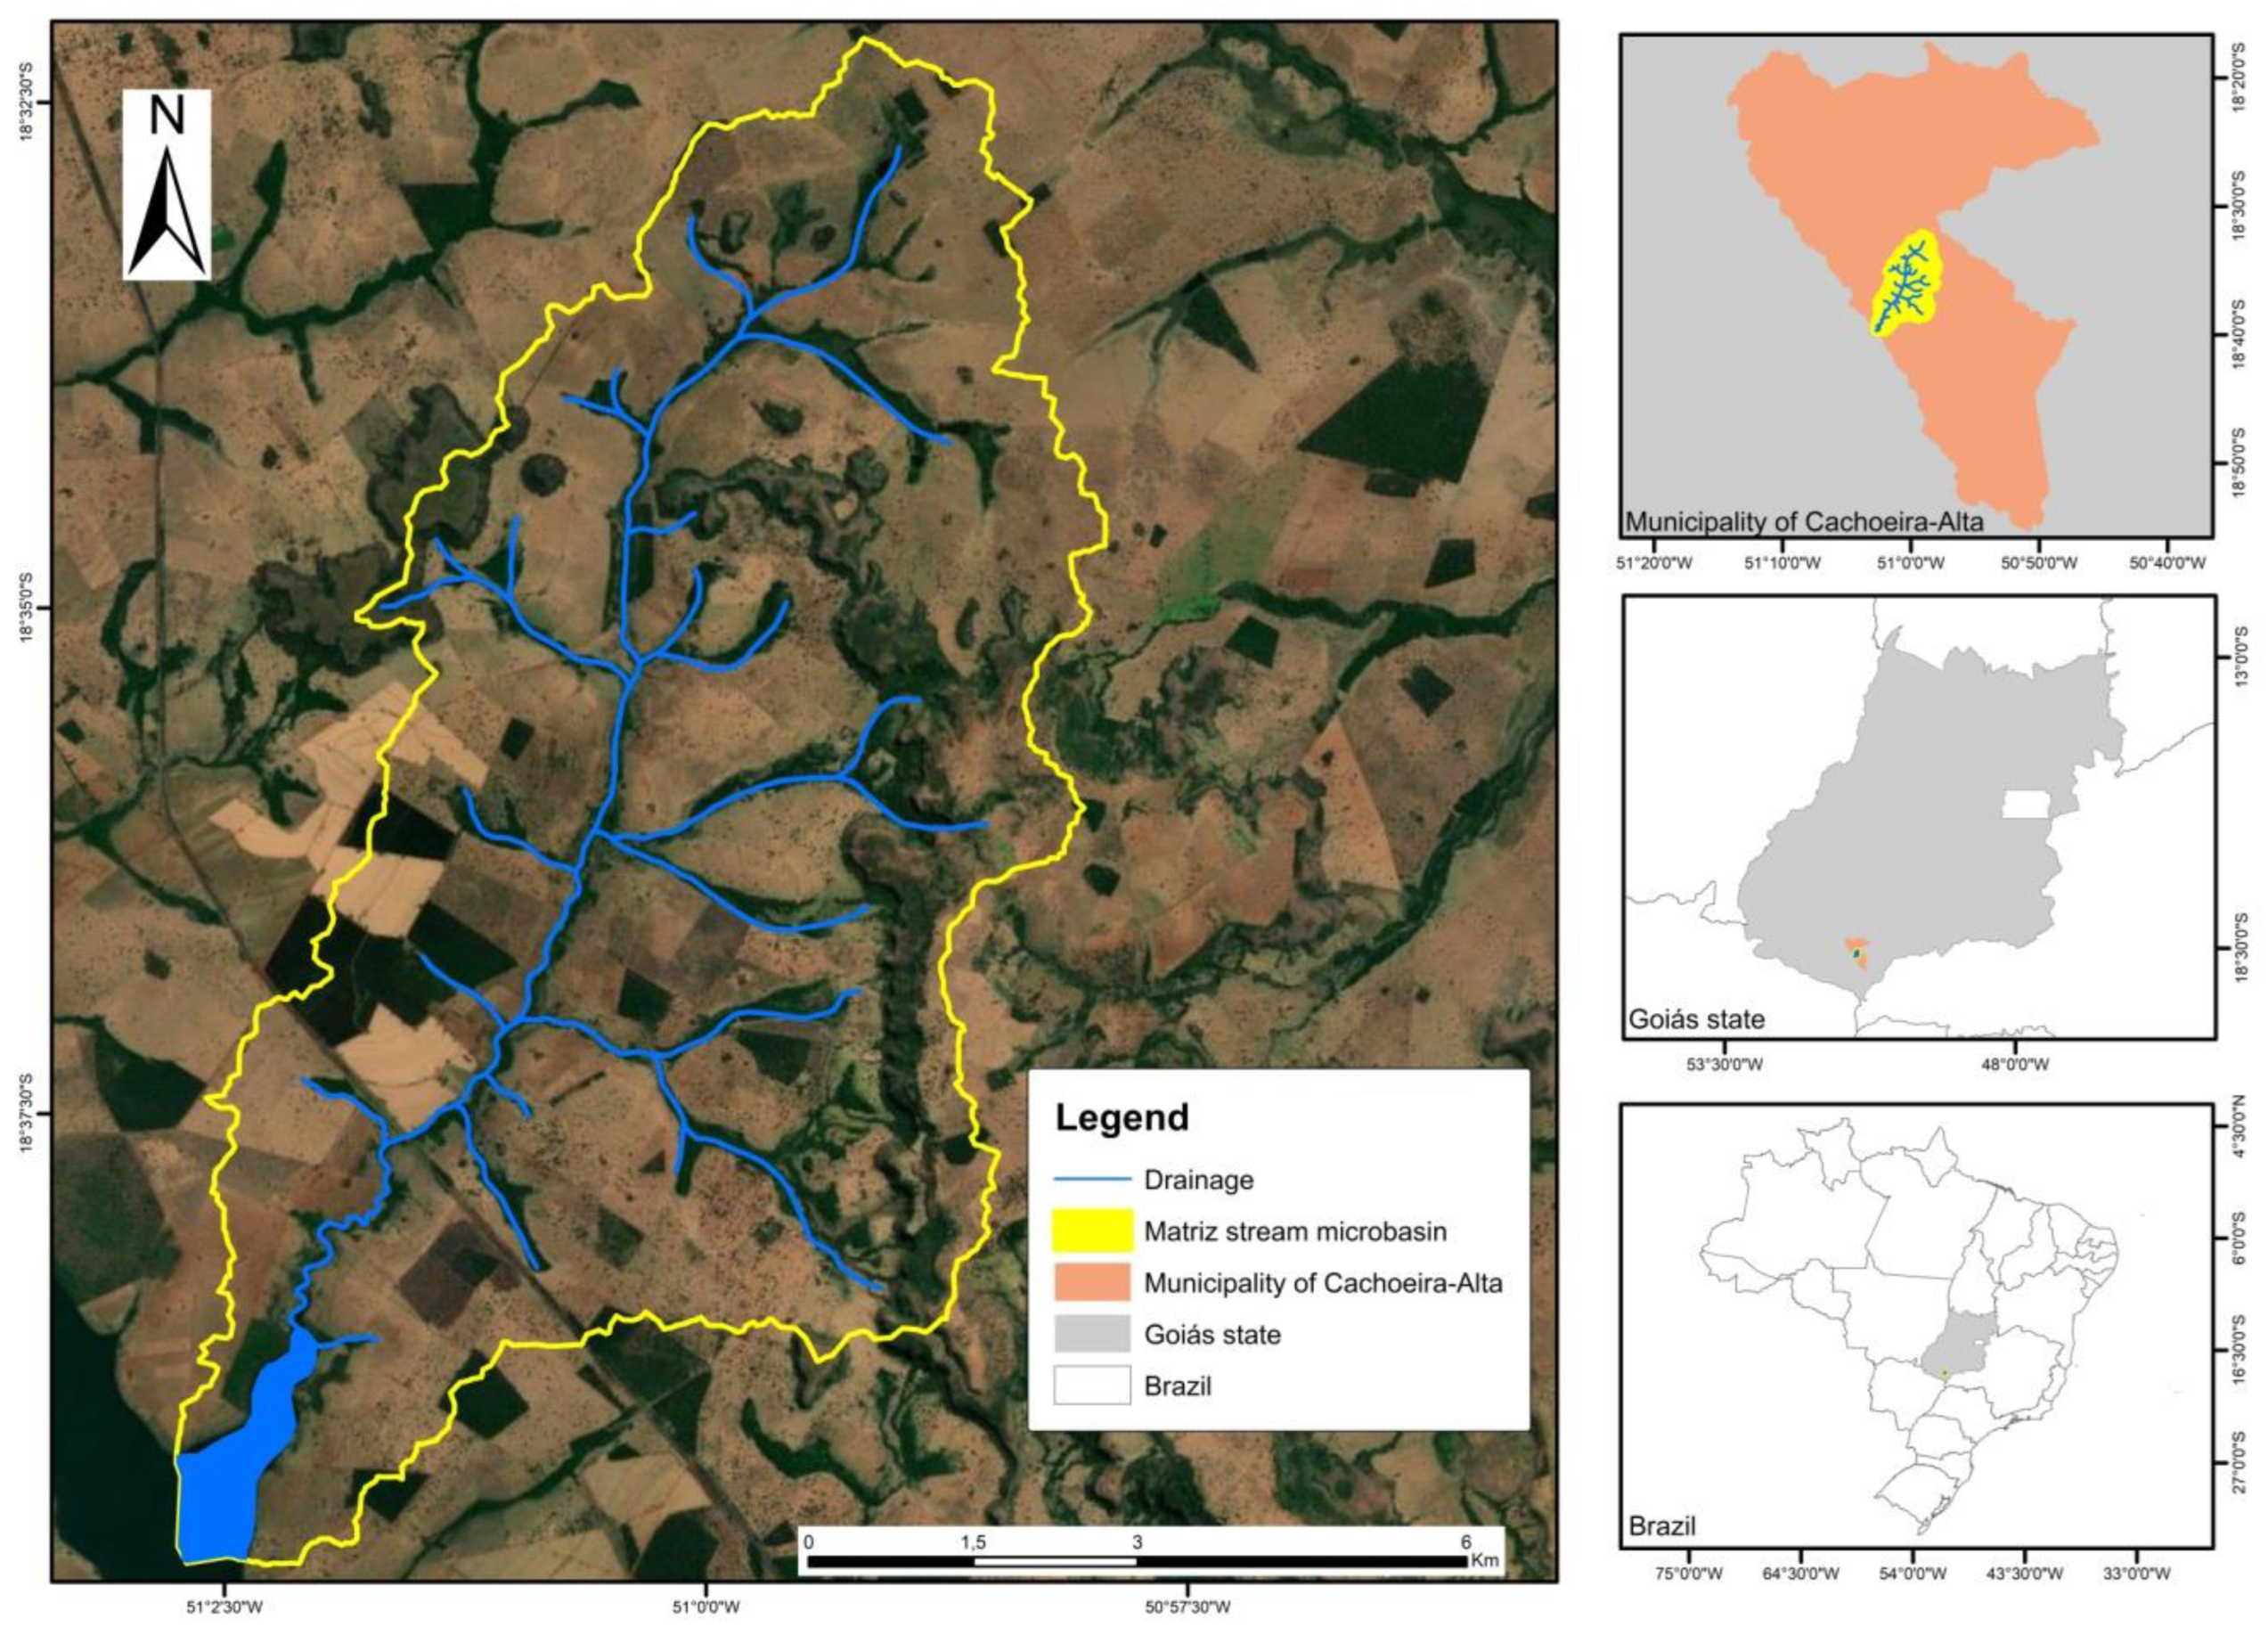
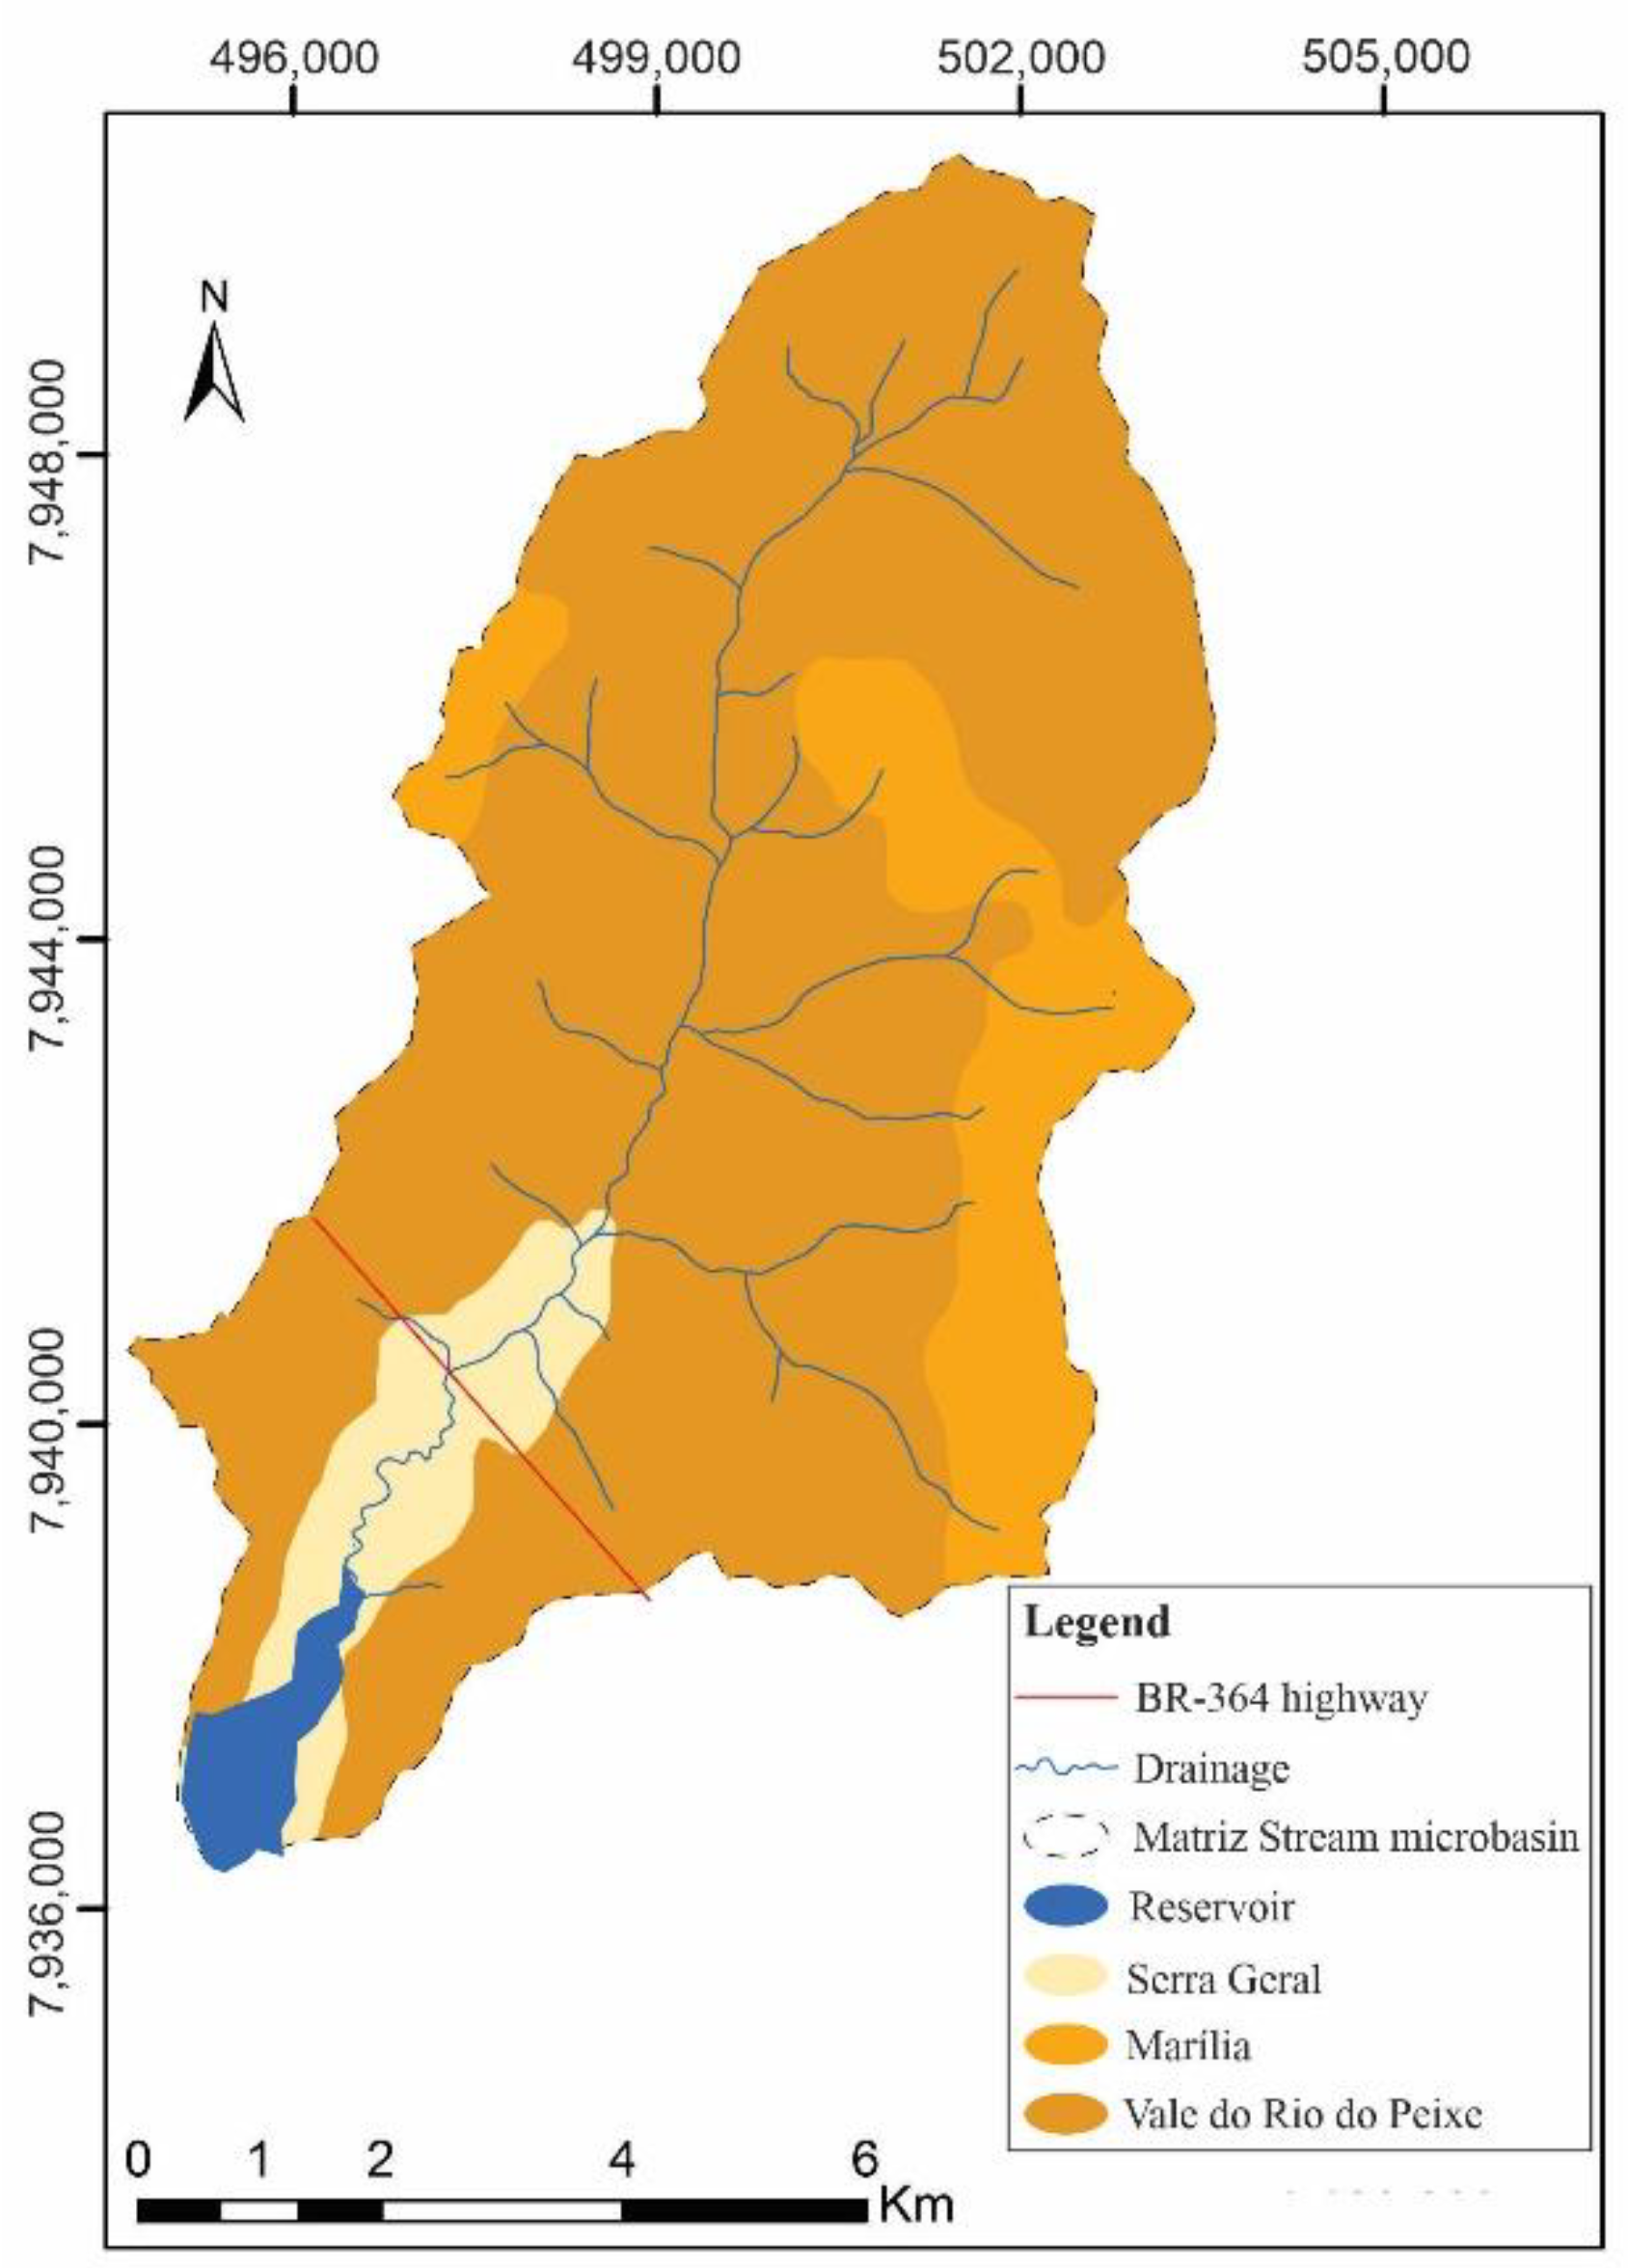
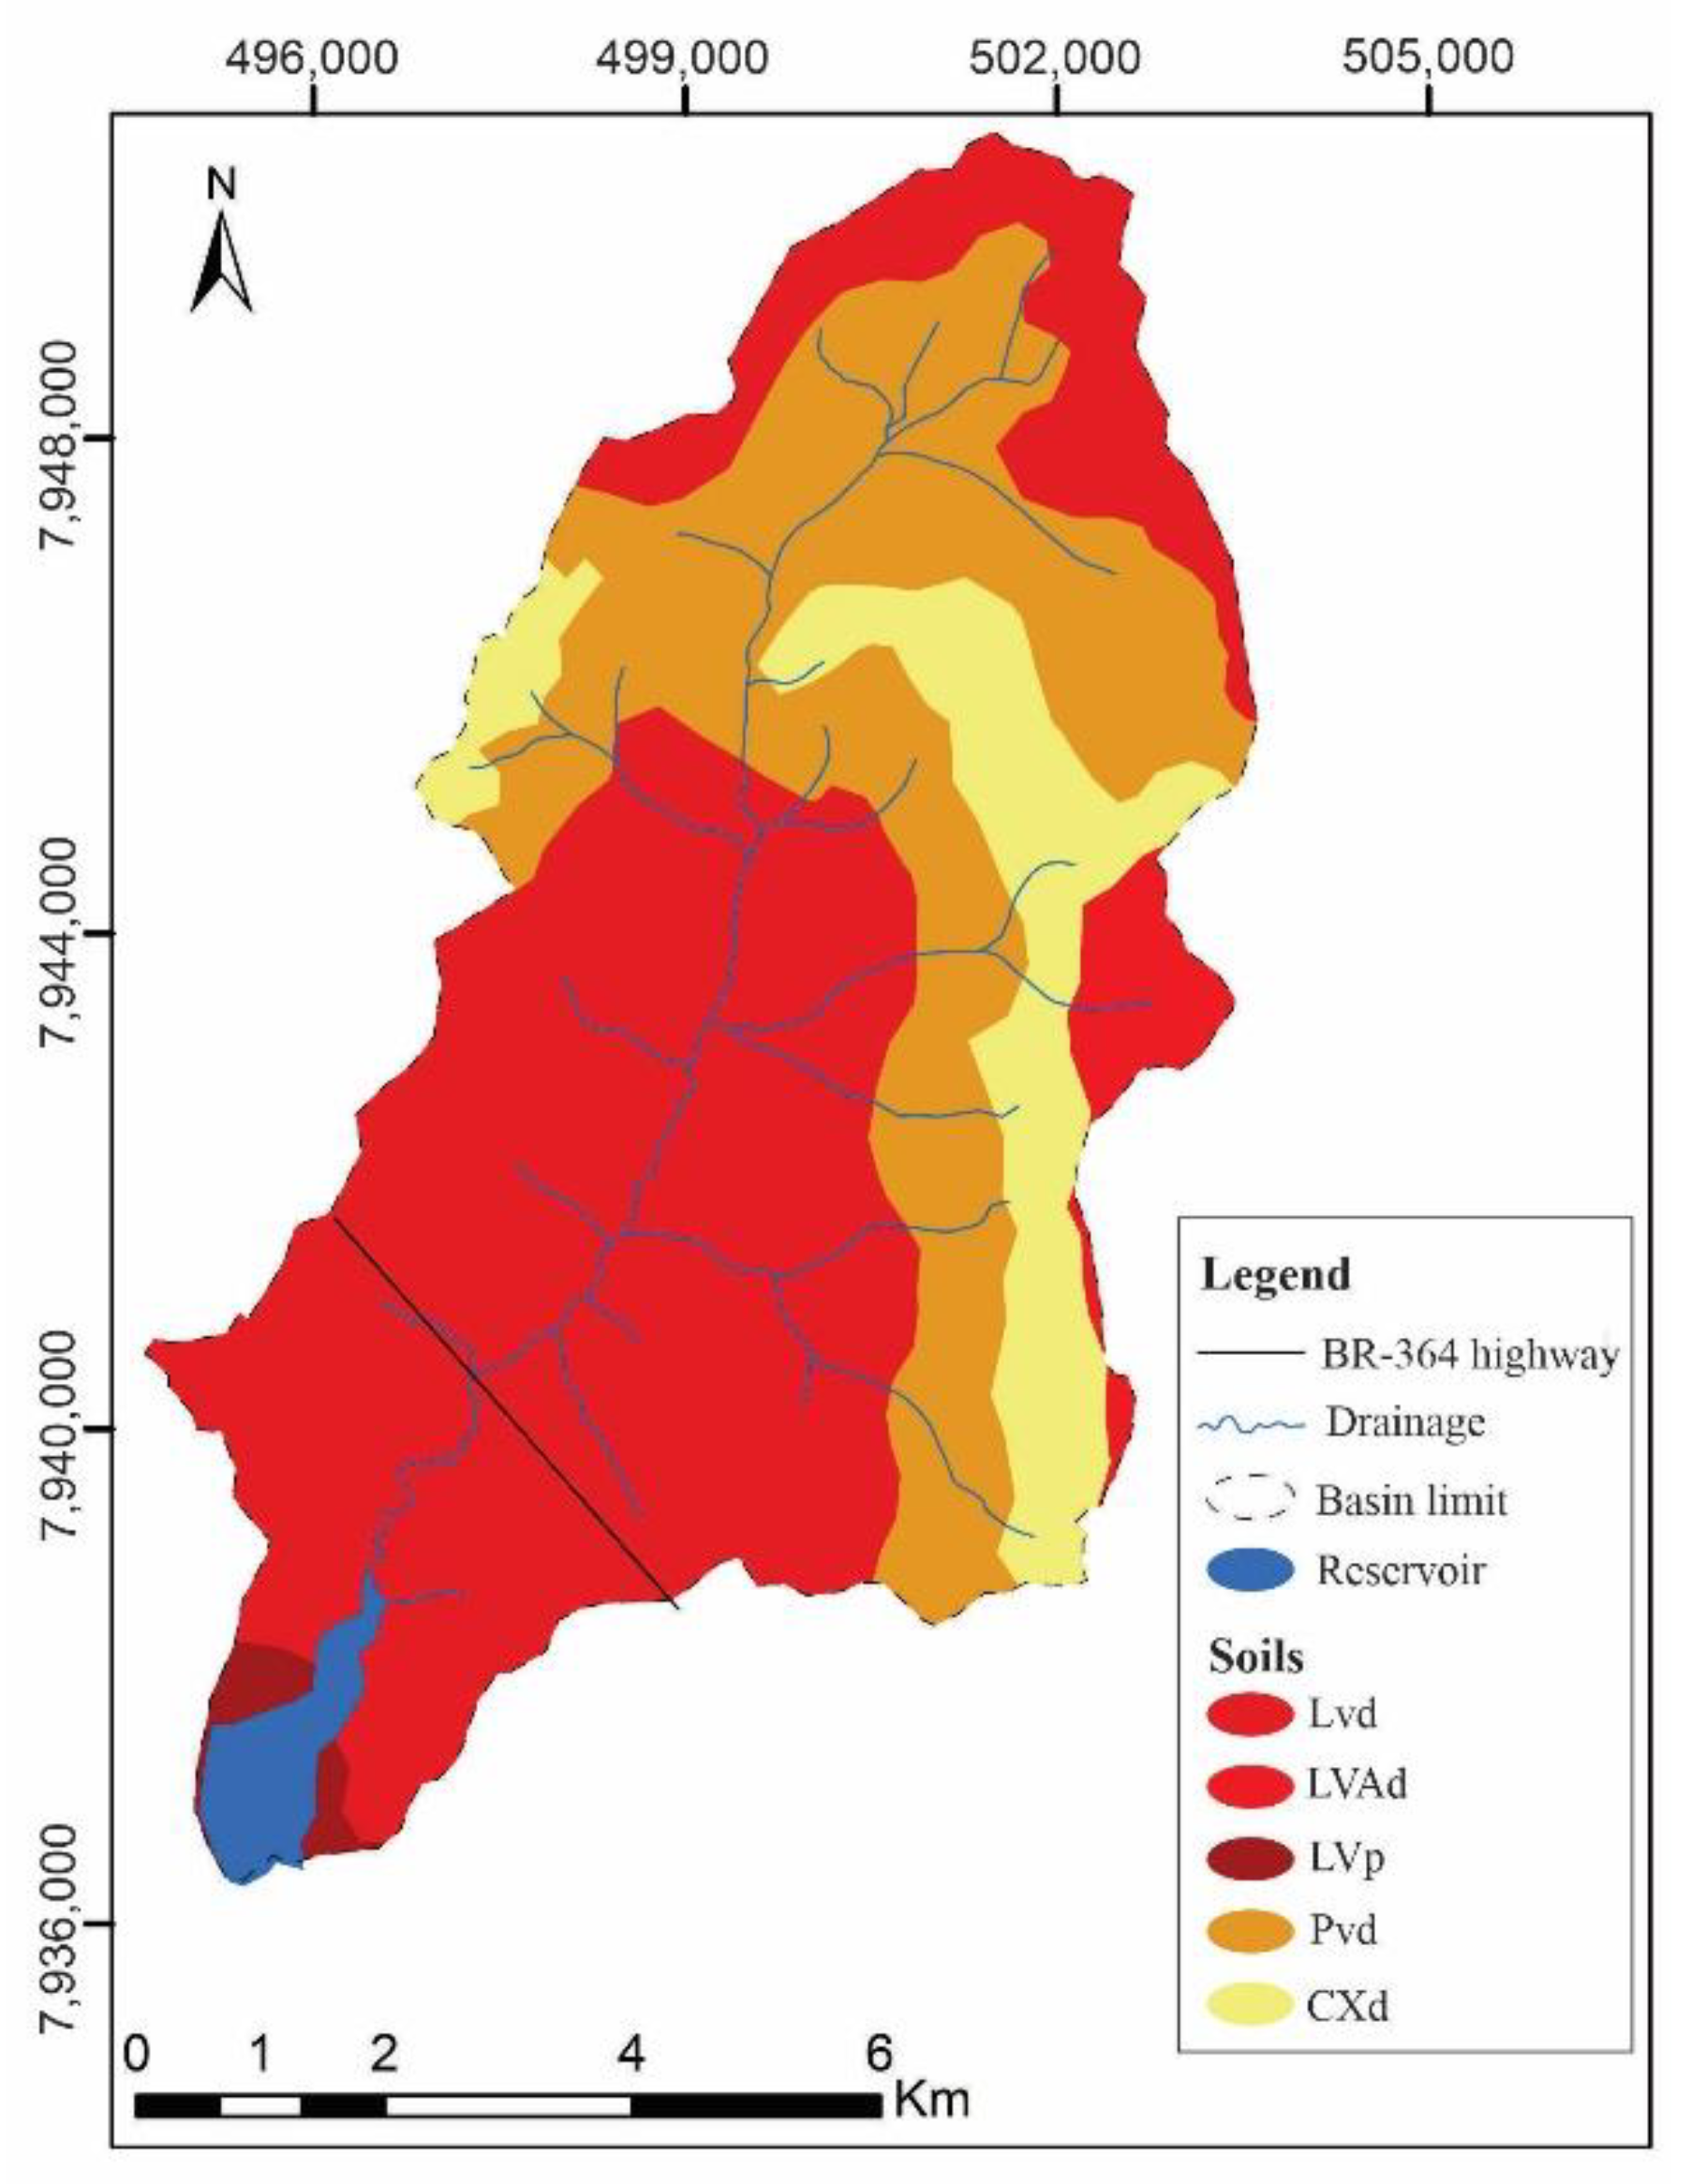
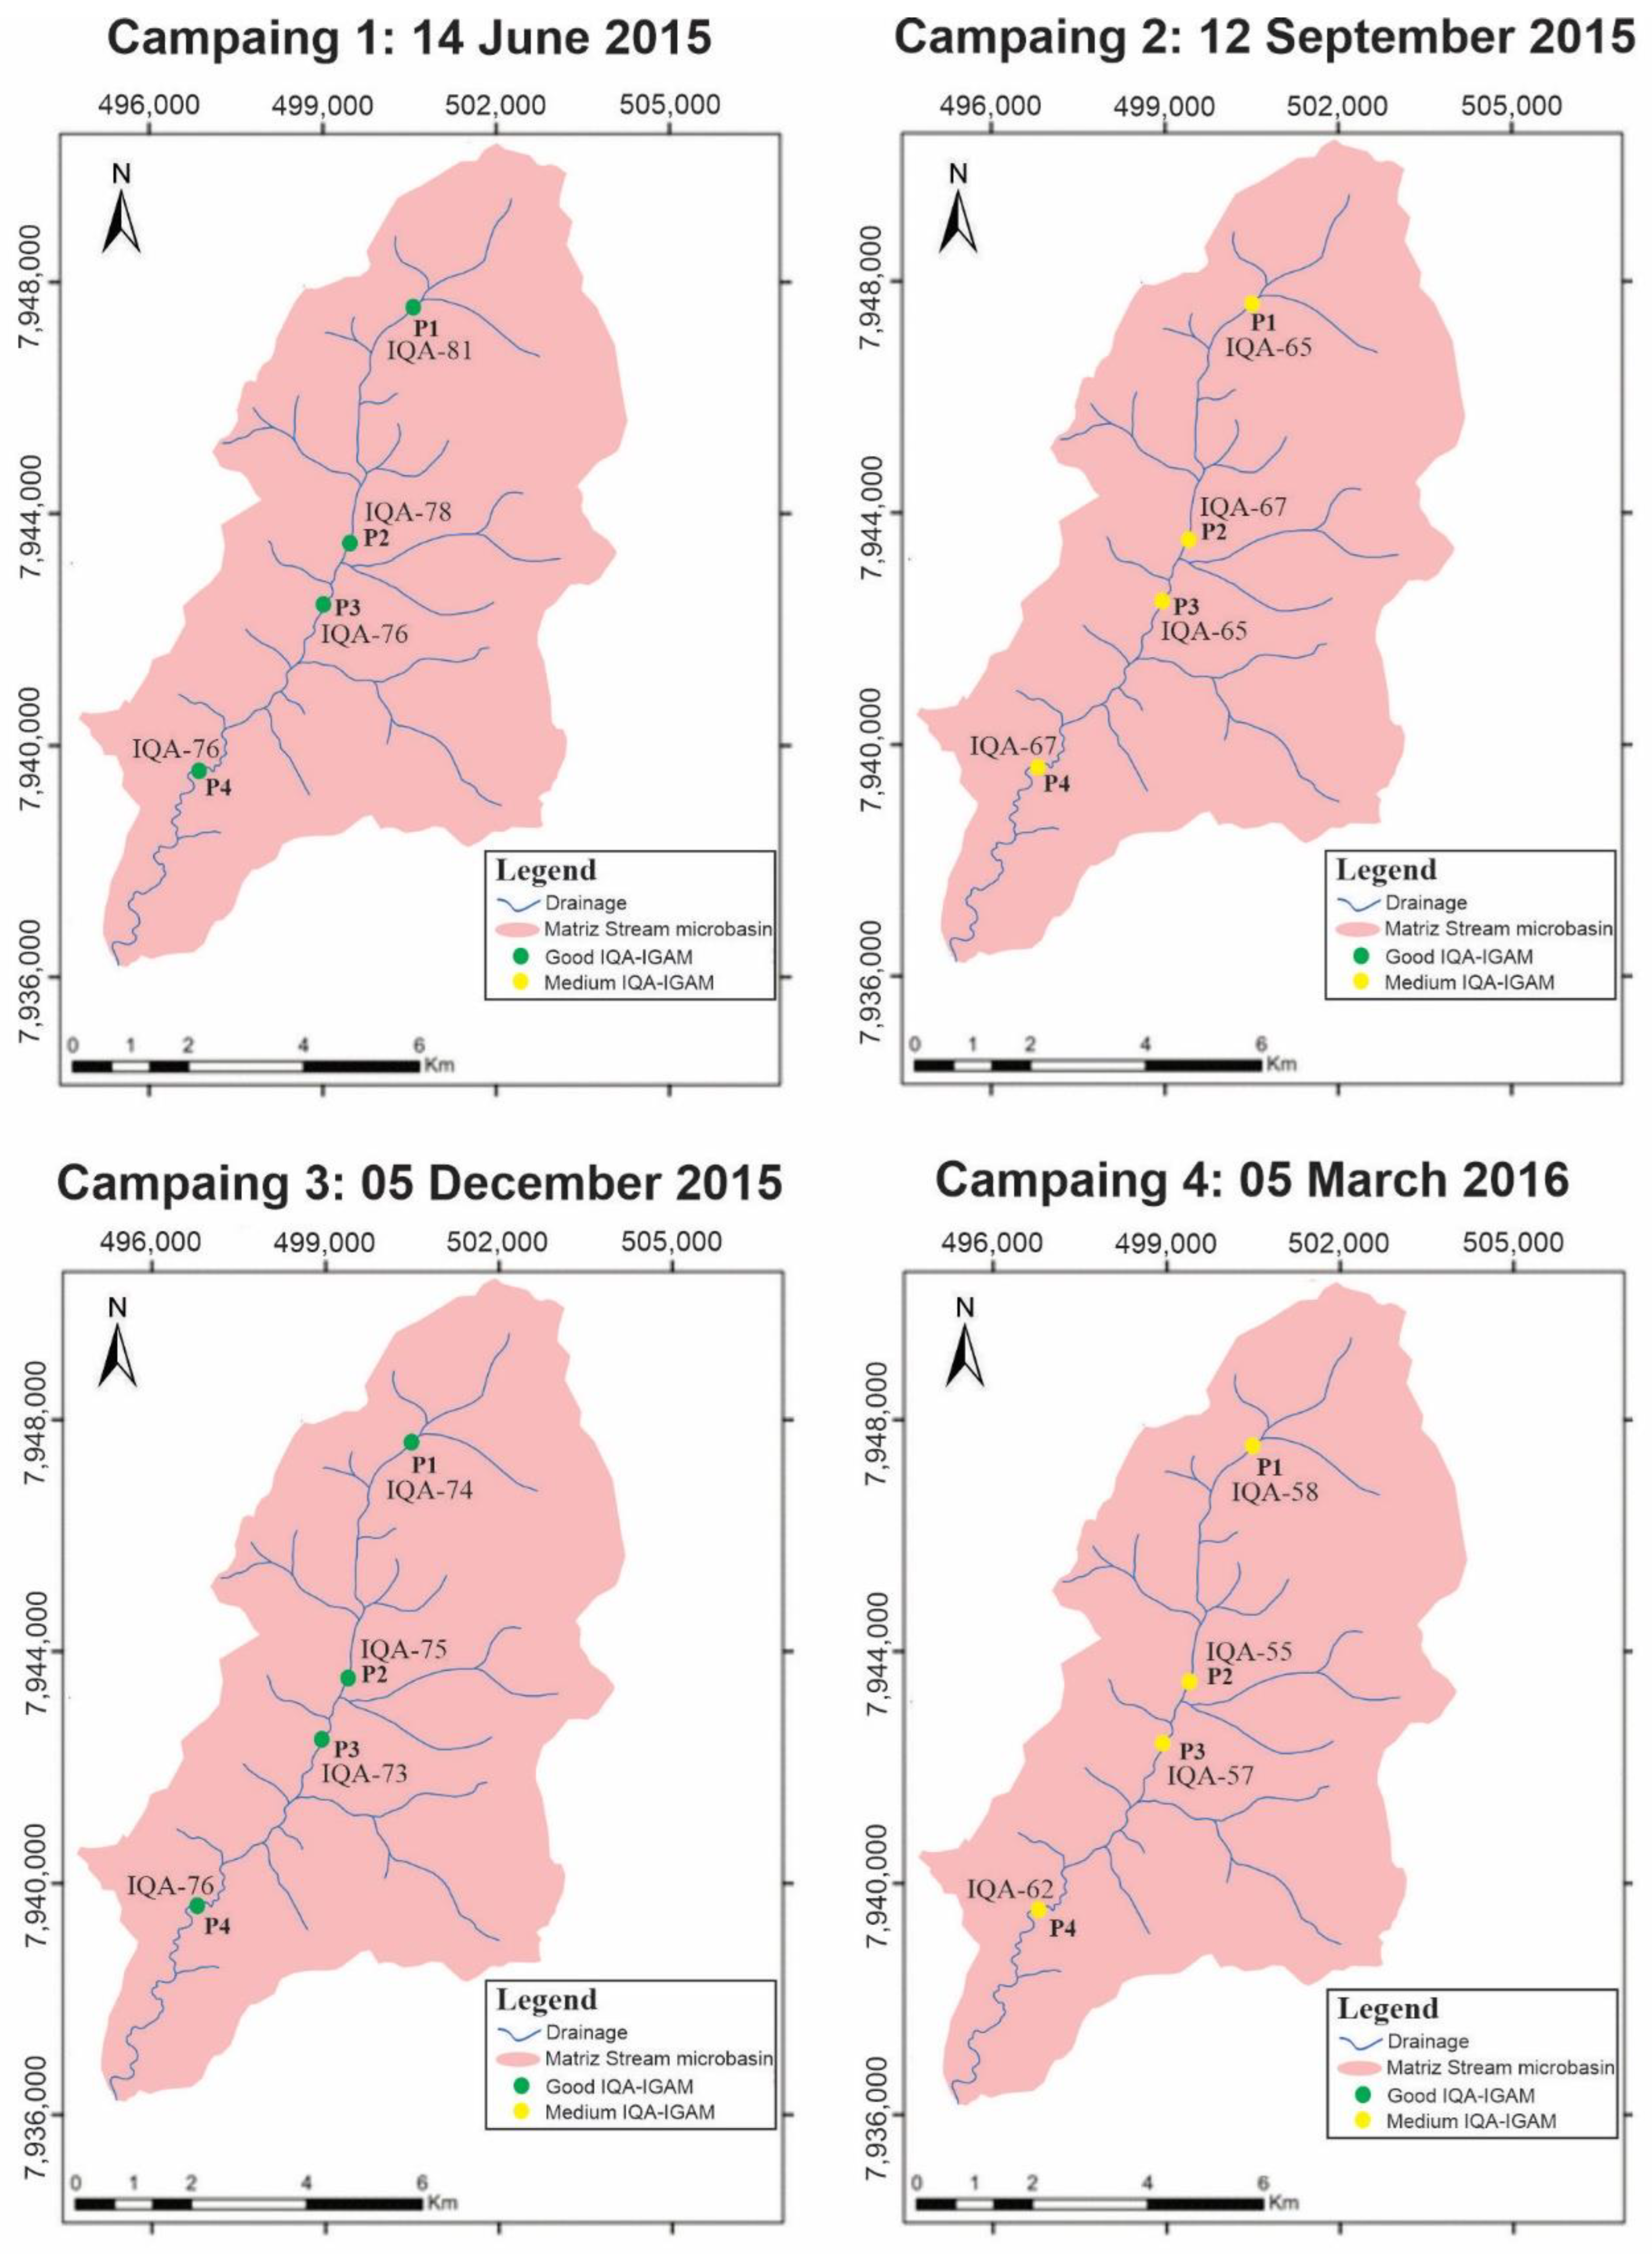
2.1. Area Description
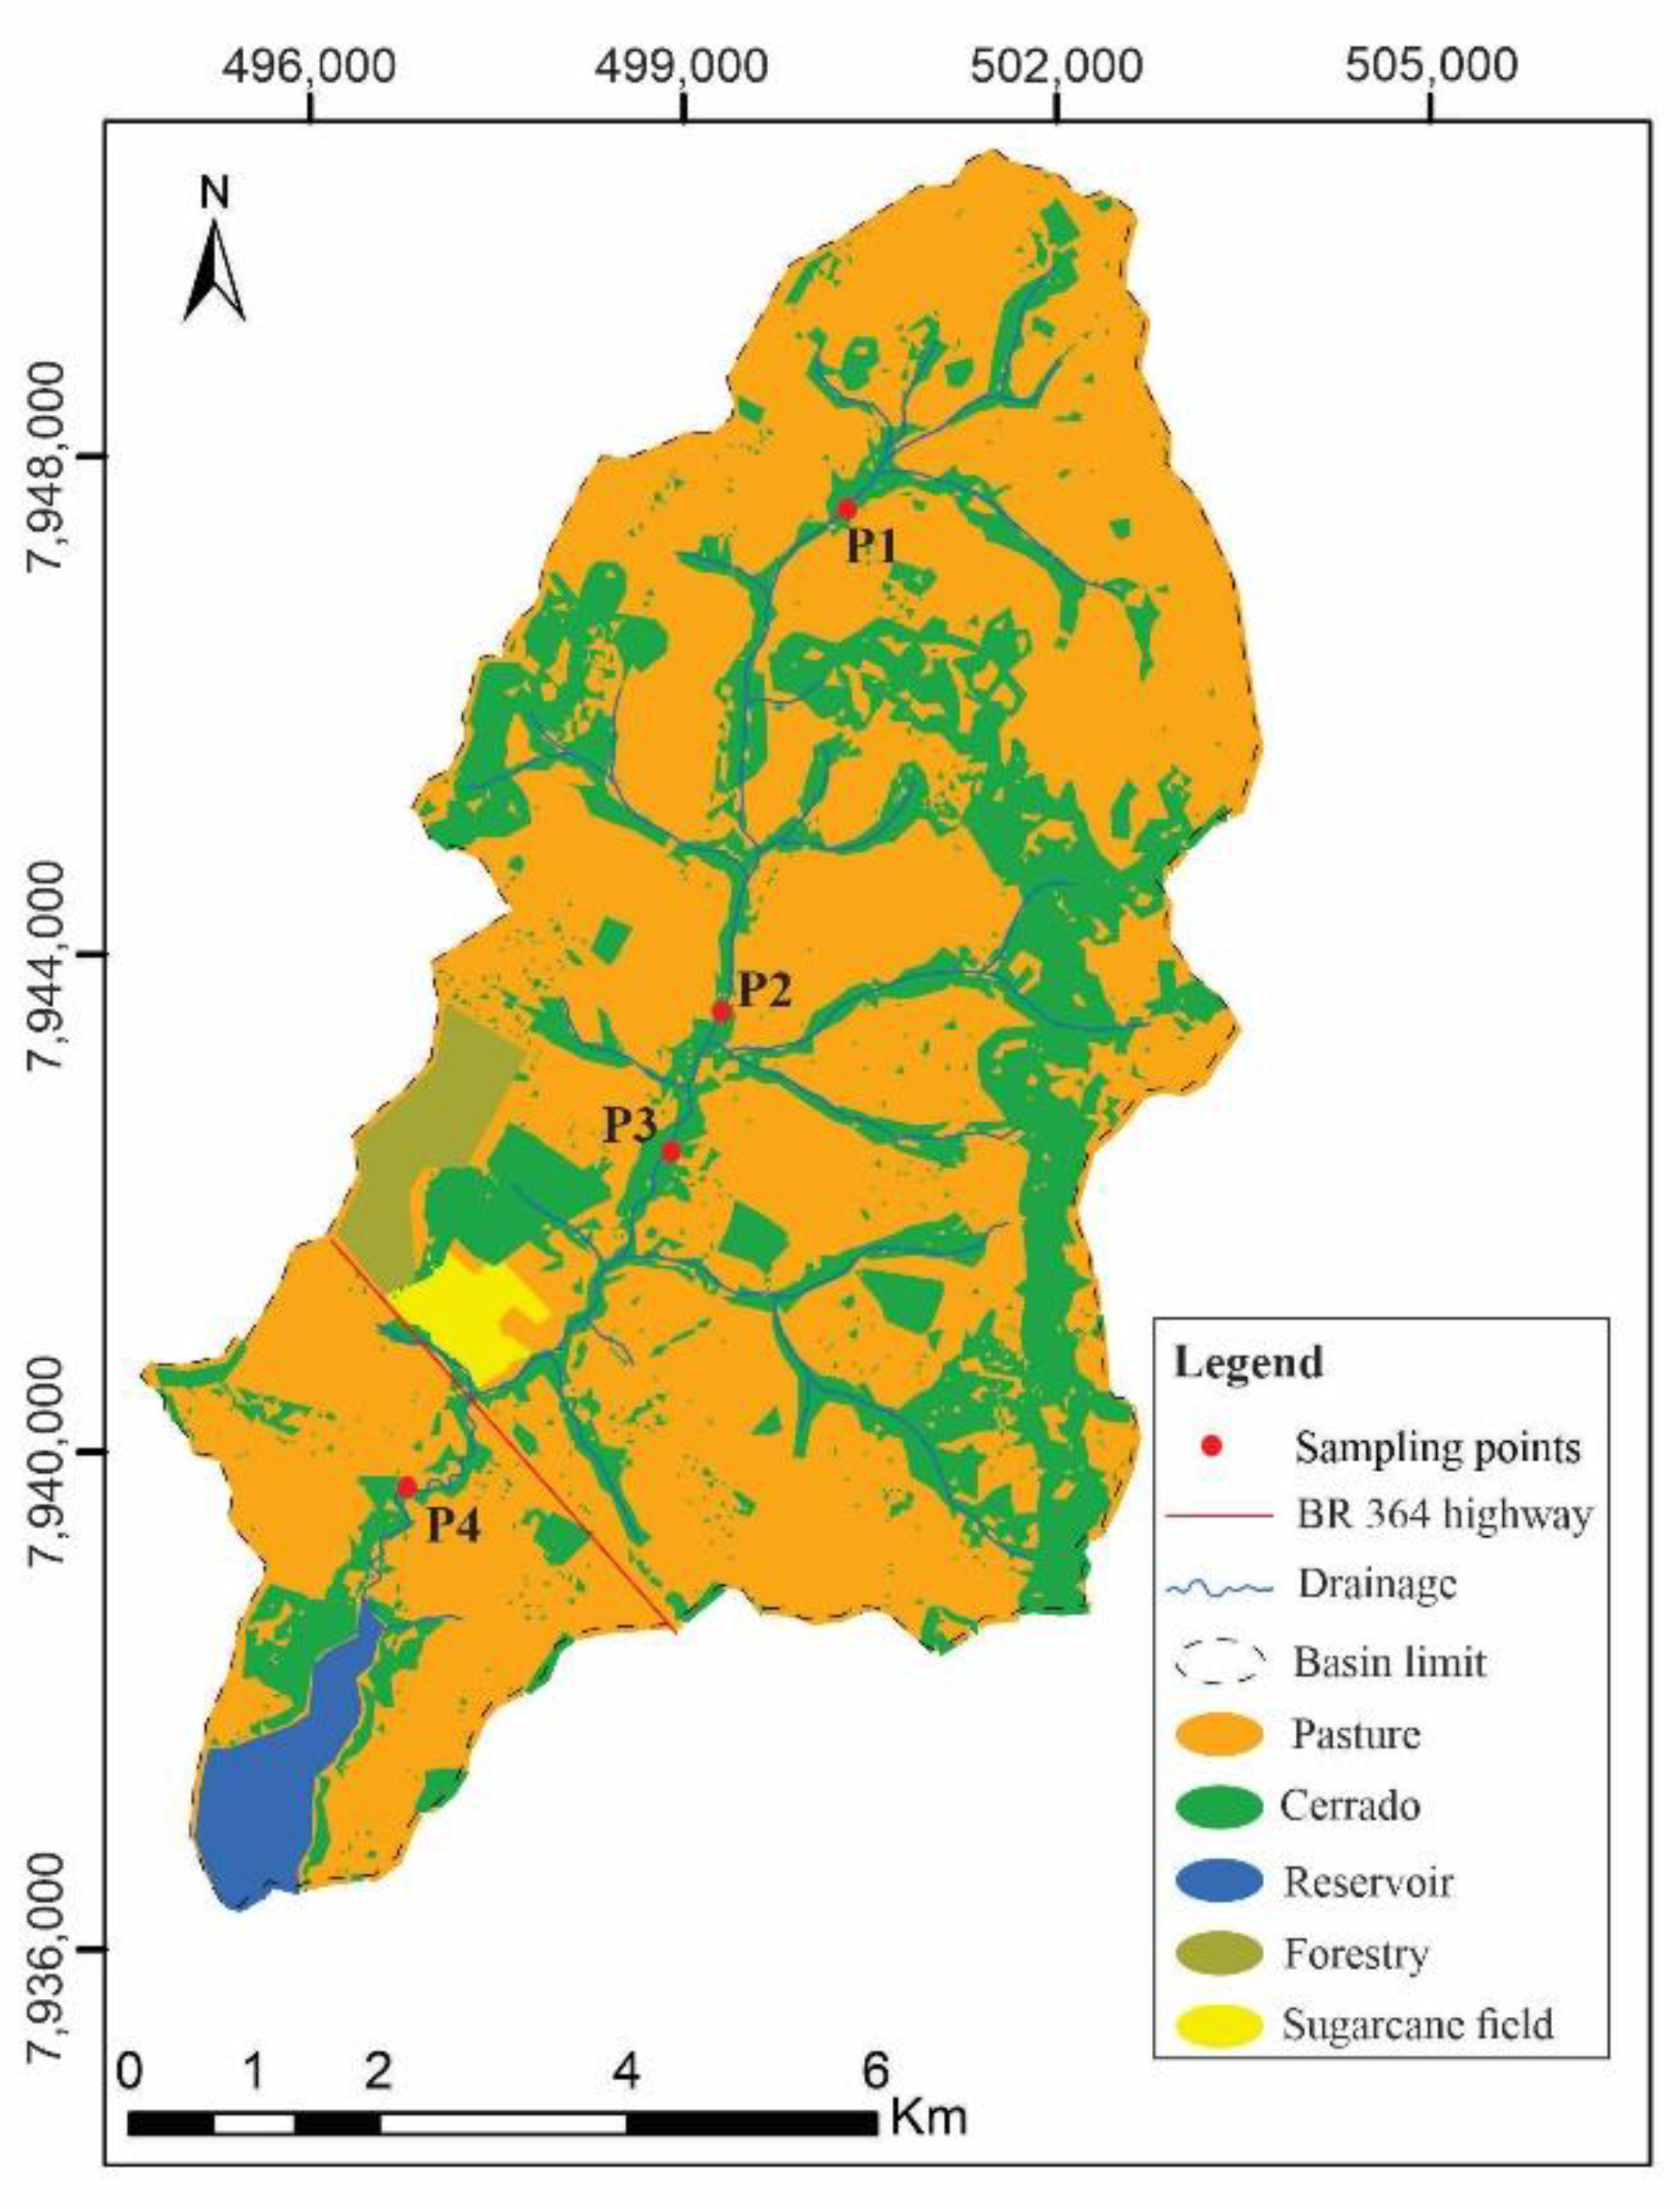
2.2. Definition of Sampling Points and Data Collection
2.3. Flow Measurement
2.4. Classification of the Waterbody
2.5. Calculation of Quality Indices
3. Results and Discussion
4. Conclusions
Author Contributions
Funding
Data Availability Statement
Acknowledgments
Conflicts of Interest
References
- Ustaoğlu, F.; Tepe, Y. Water quality and sediment contamination assessment of Pazarsuyu Stream, Turkey using multivariate statistical methods and pollution indicators. Int. Soil Water Conserv. Res. 2019, 7, 47–56. [Google Scholar] [CrossRef]
- Tundisi, J.G. Água No Século XXI: Enfrentando a Escassez, 2nd ed.; Rima: São Carlos, Brazil, 2005. [Google Scholar]
- Bordalo, C.A. O paradoxo da água na região das águas: O caso da Amazônia brasileira. GEOUSP Espaço Tempo (Online) 2017, 21, 120. [Google Scholar] [CrossRef] [Green Version]
- Morais, B.R.; Oliveira, B.A.S.; de Sousa Oliveira, P.; de Carvalho Teixeira, M. Implantação e uso na Educação Ambiental de um sistema para reutilização da água de refrigeração de destilador. Rev. Bras. De Educ. Ambient. (RevBEA) 2021, 16, 142–152. [Google Scholar] [CrossRef]
- Piazza, G.; Grott, S.; Goulart, J.; Kaufmann, V. Caracterização espaço-temporal da qualidade das águas superficiais dos mananciais de abastecimento de Blumenau/SC. Rev. De Gestão De Água Da América Lat. 2017, 14, 8. [Google Scholar]
- Assis, E.C.; Lopes, F.W.A. Avaliação Da Qualidade Das Águas Na Bacia Do Ribeirão Das Araras, Córrego Danta (Mg). Caminhos De Geogr. 2017, 18, 133–152. [Google Scholar] [CrossRef] [Green Version]
- Carvalho, G.S.; Oliveira, J.R.; Curi, N.; Schulze, D.G.; Marques, J.J. Selenium and mercury in Brazilian Cerrado soils and their relationships with physical and chemical soil characteristics. Chemosphere 2019, 218, 412–415. [Google Scholar] [CrossRef]
- Quinelato, R.V.; Farias, E.d.S.; de Brito, J.M.S.; Virgens, W.A.; Pires, L.C. Análise espaço temporal da qualidade da água dos rios Peruípe, Itanhém e Jucuruçu, Bahia. Sci. Plena 2020, 16, 1–12. [Google Scholar] [CrossRef]
- Cadore, J.S.; Tochetto, M. Recursos Hídricos: Panorama geral do setor e perspectivas ao atendimento da Agenda 2030. Rev. Bras. De Meio Ambiente 2021, 136, 122–136. [Google Scholar]
- Ustaoğlu, F.; Tepe, Y.; Taş, B. Assessment of stream quality and health risk in a subtropical Turkey river system: A combined approach using statistical analysis and water quality index. Ecol. Indic. 2020, 113, 105815. [Google Scholar] [CrossRef]
- da Silva, F.L.; Fushita, Â.T.; da Cunha-Santino, M.B.; Júnior, I.B.; Júnior, J.C.T.V. Gestão de recursos hídricos e manejo de bacias hidrográficas no Brasil: Elementos básicos, histórico e estratégias. Rev. Bras. De Geogr. Física 2021, 14, 1626–1653. [Google Scholar] [CrossRef]
- Gloria, L.P.; Horn, B.C.; Hilgemann, M. Avaliação Da Qualidade Da Água De Bacias Hidrográficas Através Da Ferramenta Do Índice De Qualidade Da Água—Iqa. Rev. Cad. Pedagógico 2017, 14, 103–119. [Google Scholar] [CrossRef] [Green Version]
- Agência Nacional De Águas—ANA. Caderno de Recursos Hídricos—1: Panorama da Qualidade das Águas Superficiais no Brasil; ANA: Brasília, Brazil, 2005.
- Andre, A.S.; Andreola, R.; Costa, A.R.D.; Ferrari, A.; Rocha, L.C. Estudo De Um Índice De Qualidade Da Água: Uma Proposição Para a Resolução Conjunta Ana/Aneel N° 03/2010 Study on a Water Quality Index: A Proposal for Joint Resolution Ana/Aneel N ° 03/2010 Estudio De Un Índice De Calidad Del Agua: Una Propuesta De Reso. Rev. Valore 2019, 4, 133–150. [Google Scholar]
- Esteve, F.D.A. Fundamentos de Limnologia, 3rd ed.; Interciência: Rio de Janeiro, Brazil, 2011. [Google Scholar]
- Perígolo, D.; Lima, W.L.; Oliveira, L.; Amaral, A. Qualidade físico-química e microbiológica da água de três corpos hídricos de simonésia, Minas Gerais. Enciclopédia Biosf. 2015, 11, 201–211. [Google Scholar]
- IGAM—Instituto Mineiro De Gestão Das Águas. Sistema de Cálculo da Qualidade da Água (SCQA): Estabelecimento das Equações do índice de Qualidade das Águas (IQA); Instituto Mineiro De Gestão Das Águas: Belo Horizonte, Brazil, 2005; p. 9.
- Latrubesse, E.; Carvalho, T. Resenhas. Bol. Goiano De Geogr. 2007, 27, 169–172. [Google Scholar]
- Fernandes, L.A. Mapa litoestratigráfico da parte oriental da Bacia Bauru (PR, SP, MG), escala 1:1.000.000. Bol. Parana. De Geosci. 2004, 55, 53–66. [Google Scholar] [CrossRef]
- Moreira, V.B.; Perez Filho, A. Das superfícies de aplainamento aos pulsos climáticos holocênicos: A evolução da paisagem em relevos de chapada. Soc. Nat. 2020, 32, 176–195. [Google Scholar] [CrossRef]
- CPRM-AGIM. Diagnóstico do Setor Mineral Goiano; Agência Goiana de Desenvolvimento Industrial e Mineral: Goiana, Brazil, 2002; p. 137.
- Embrapa. Sistema Brasileiro de Classificação de Solos, 5th ed.; Embrapa: Brasília, Brazil, 2018. [Google Scholar]
- de Lima, A.M.; Mariano, Z.D.F. Análise Microclimática No Interior E Fora Das Florestas Estacionais Semideciduais Na Área Da Bacia Da Usina Hidrelétrica De Caçu-Go. Geogr. Dep. Univ. Sao Paulo 2014, 27, 67. [Google Scholar] [CrossRef]
- Mastella, A.D.F.; Júnior, S.I.; Tres, A.; Tetto, A.F.; Wendling, W.T.; Soares, R.V. Classificação do estado de Goiás e do Distrito Federal segundo o sistema de zonas de vida de holdridge. Rev. Bras. Geogr. Física 2019, 12, 443–456. [Google Scholar] [CrossRef]
- do Nascimento, T.V.; Fernandes, L.L. Mapeamento Do Uso E Ocupação Do Solo Em Uma Pequena Bacia Hidrográfica Da Amazônia. Ciência E Nat. 2019, 39, 170. [Google Scholar] [CrossRef] [Green Version]
- Ramalho, F.L.; de Barcelos, A.A.; Cabral, J.B.P.; Birro, S.O.G. Diagnóstico ambiental do uso e ocupação das terras entre os anos de 2010 a 2015 no Córrego Matriz, Cachoeira-Alta, Goiás, Brasil. Geoambiente Online 2019, 33, 103–130. [Google Scholar] [CrossRef]
- APHA—American Public Hearth Association. Standard Methods for the Examination of Water and Wastewater; American Public Health Association: Washington, DC, USA, 1998. [Google Scholar]
- Palhares, J.C.P.; Ramos, C.; Klein, J.B.; de LIMA, J.C.M.M.; Muller, S.; Cestonaro, T. Medição da Vazão em Rios pelo Método do Flutuador. Comun. Técnico-EMBRAPA 2007, 455, 2–5. [Google Scholar]
- CONAMA No 357. Resolução CONAMA N° 357, De 17 De Março De 2005* (Retificada); Conselho Nacional do Meio Ambiente: Brasília, Brazil, 2005; p. 36.
- Cunha, C.D.L.D.N.; Ferreira, A.P. Critical analysis by comparison between water quality models applied to polluted rivers: Contributions to health, water and sanitation. Eng. Sanit. E Ambient. 2019, 24, 473–480. [Google Scholar] [CrossRef]
- Campos, S.G.; Santos, P.C.M.; da Silva, L.A.F.; Pimentel, D.M.; Amaral, I.B.C.; dos Reis, A.B. Estação Ecológica Mata dos Ausentes (EEMA), Senador Modestino Gonçalves/Minas Gerais, e seus desafios: Análise da vazão e qualidade dos corpos d’água na região do seu entorno. Geochim. Bras. 2019, 33, 165–174. [Google Scholar] [CrossRef]
- de Souza, D.F.; da Silva, L.D.O.S.; Pinto, A.L. Qualidade física, química e biológica sazonal das águas superficiais da bacia hidrográfica do córrego Moeda em Três Lagoas/MS. Rev. Bras. Geogr. Física 2020, 13, 196. [Google Scholar] [CrossRef]
- Buzelli, G.M.; Cunha-Santino, M.B. Análise e diagnóstico da qualidade da água e estado trófico do reservatório de Barra Bonita, SP. Rev. Ambiente Água 2013, 8, 186–205. [Google Scholar]
- Junior, A.; Gonçalves, E.A.P. Evaluation of the Una River Basin-Pernambuco: Water Quality Perspective after Construction of 4 Flooding Containment Dams. Rev. Bras. Geogr. Física 2018, 11, 612–627. [Google Scholar]
- Marques, L.O.D.A.; Taffarello, D.; Calijuri, M.D.C.; Mendiondo, E.M.; Ferreira, M.D.S.; Cunha, D.G.F. Phosphorus and thermotolerant coliforms’ loads in brazilian watersheds with limited data: Considerations on the integrated analysis of water quality and quantity. Rev. Bras. Recur. Hidr. 2019, 24, 1–13. [Google Scholar] [CrossRef] [Green Version]
- Cadoná, E.A.; Lourenzi, C.R.; de Souza, E.L.; Rampinelli, E.C.; dos Santos, M.L.; Sete, P.B.; Soares, C.R.F.S. Contaminação por nitrogênio e fósforo de Águas destinadas ao consumo humano em região com intensa atividade suinÍcola. Geociencias 2018, 37, 883–891. [Google Scholar] [CrossRef]
- Santos, E.D.O.S.; Medeiros, P.R.P.; Santos, R.S. Qualidade da Água e Fluxo de Fósforo e Nitrogênio no Rio Paraíba do Meio (AL). Rev. Bras. Geogr. Física 2021, 14, 1044–1057. [Google Scholar] [CrossRef]
- Batista, D.F.; Cabral, J.B.P.; Carvalho, C.B.; Nascimento, E.S. Caracterização e diagnostico das águas do Ribeirão Paraíso em Jataí-Goiás. Rev. Bras. Geogr. Física 2016, 9, 2132–2147. [Google Scholar]
- dos Santos, S.A.; Gastaldini, M.D.C.C.; Pivetta, G.G.; Schmidt, O. Qualidade da água na bacia hidrográfica urbana Cancela Tamandaí, Santa Maria/RS. Soc. Nat. 2018, 30, 23–44. [Google Scholar] [CrossRef]
- Freire, R.; Bonifácio, C.M.; de Freitas, F.H.; Schneider, R.M.; Tavares, C.R.G. Formas nitrogenadas e fósforo total em cursos d’água: Estudo de caso do ribeirão Maringá, Estado do Paraná. Acta Sci.-Technol. 2013, 35, 711–716. [Google Scholar]
- de Lima Sousa, R.; do Vale, J.B.; da Silva Barbosa, A.J.S.; da Silva, T.L.; Sousa, V.C. Diagnóstico do uso e cobertura de terra e a qualidade da água superficial da microbacia do Pau Amarelo em São Francisco do Pará. Res. Soc. Dev. 2021, 10, 5. [Google Scholar]
- Santos, R.C.L.; Lima, Á.S.; Cavalcanti, E.B.; Melo, C.M.D.; Marques, M.N. Application of indexes to assess the water quality of coastal basin of the sapucaia in sergipe. Eng. Sanit. E Ambient. 2018, 23, 33–46. [Google Scholar] [CrossRef] [Green Version]
- Girardi, R.; Pinheiro, A.; Garbossa, L.H.P.; Torres, É. Water quality change of rivers during rainy events in a watershed with different land uses in Southern Brazil. Rbrh 2016, 21, 514–524. [Google Scholar] [CrossRef] [Green Version]
- Alencar, V.E.S.A.; da Rocha, E.J.P.; Souza Júnior, J.A.; Carneiro, B.S. Análise de parâmetros de qualidade da água em decorrência de efeitos da precipitação na baia de Guajará—Belém—PA. Rev. Bras. Geogr. Física 2019, 12, 661–680. [Google Scholar] [CrossRef]
- Hee, Y.Y.; Suratman, S.; Aziz, A.A. Water Quality and Heavy Metals Distribution in Surface Water of the Kelantan River Basin (Malaysia). Orient. J. Chem. 2019, 35, 254–1264. [Google Scholar] [CrossRef] [Green Version]
- Peixoto, K.L.G.; Noguchi, H.S.; Pereira, A.R.; Marchetto, M.; de Almeida Santos, A. Avaliação das Características Quali-Quantitativa das Águas do Rio Beem, Município de Humaitá-Amazonas Evaluation of Qualitative and Quantitative Characteristics of the Beem River Water. Munic. Humaita-Amaz. 2014, 2, 1–13. [Google Scholar]
- Tucci, C.E. Urban Waters Initiative. Estud. Avançados 2008, 22, 97–112. [Google Scholar] [CrossRef]
- Amâncio, D.V.; Coelho, G.; Marques, R.F.D.P.V.; Viola, M.R.; de Mello, C.R. Qualidade Da Água Nas Sub-Bacias Hidrográficas Dos Rios Capivari E Mortes, Minas Gerais. Sci. Agrar. 2018, 19, 75. [Google Scholar] [CrossRef] [Green Version]
- Fraga, M.D.S.; Reis, G.B.; da Silva, D.D.; Guedes, H.A.S.; Elesbon, A.A.A. Use of multivariate statistical methods to analyze the monitoring of surface water quality in the Doce River basin, Minas Gerais, Brazil. Environ. Sci. Pollut. Res. 2020, 27, 35303–35318. [Google Scholar] [CrossRef] [PubMed]
- Okumura, A.T.R.; Da Silva, A.G.; Da Silva, N.R.S.; Lopes, E.R.D.N.; Bifano, R.B.A.; Viana, R.V.Q. Determinação da qualidade da água de um rio tropical sob a perspectiva do uso. Rev. Bras. De Geogr. Física 2020, 13, 1835–1850. [Google Scholar] [CrossRef]


| Water Quality Parameters | Limits (Class 1) | Limits (Class 2) | Limits (Class 3) | Limits (Class 4) |
|---|---|---|---|---|
| T (°C) | - | - | - | - |
| pH | 6 to 9 | 6 to 9 | 6 to 9 | 6 to 9 |
| Turb (NTU) | 40 | up to 100 | 100 | - |
| TR (mg/L) | 500 | 500 | 500 | - |
| BOD (mg/L) | 3 | 5 | 10 | - |
| TP (mg/L) | 0.1 | 0.1 | 0.15 | - |
| TN (mg/L) | 2.18 | 2.18 | - | - |
| DO (mg/L) | ≥ 6 | ≥ 5 | ≥ 4 | > 2 |
| TC (MPN/100 mL) * | 200 | 1000 | 4000 | - |
| Parameter | Weight |
|---|---|
| Dissolved Oxygen (mg/L) | 0.17 |
| Hydrogen Potential-pH | 0.12 |
| Biochemical Oxygen Demand (mg/L) | 0.10 |
| Nitrogen (mg/L) | 0.10 |
| Phosphorus (mg/L) | 0.10 |
| Temperature (°C) | 0.10 |
| Turbidity (NTU) | 0.08 |
| Total Residues (mg/L) | 0.08 |
| Thermotolerant Coliforms (MPN/100 mL)−1 | 0.15 |
| Quality Level | IQA Interval |
|---|---|
| Excellent | 91–100 |
| Good | 71–90 |
| Medium | 51–70 |
| Poor | 26–50 |
| Very Poor | 0–25 |
| June 2015 | September 2015 | December 2015 | March 2016 | Final Average | |
|---|---|---|---|---|---|
| Point 1 | 0.02 | 0.04 | 0.02 | 0.03 | 0.03 |
| Point 2 | 0.70 | 0.01 | 0.02 | 0.10 | 0.06 |
| Point 3 | 0.02 | 0.03 | 0.02 | 0.02 | 0.02 |
| Point 4 | 0.02 | 0.04 | 0.03 | 0.04 | 0.04 |
| Camp. Average | 0.02 | 0.04 | 0.02 | 0.04 | 0.03 |
| Variables | ||||||||||
|---|---|---|---|---|---|---|---|---|---|---|
| Chemical | Physical | Biological | ||||||||
| Data | DO (mg/L) | pH | BOD (mg/L) | TN (mg/L) | TP (mg/L) | T (°C) | Turb (NTU) | TR (mg/L) | TC (100 mL)−1 | |
| P1 | C1 | 7.39 | 7.05 | 1.59 | ND | 0.001 | 21.80 | 2.80 | 4.17 | 121 |
| C2 | 7.43 | 6.18 | 4.49 | ND | 0.54 | 21.20 | 3.29 | 14.17 | 273 | |
| C3 | 6.58 | 6.27 | 5.90 | 1.42 | 0.06 | 27.45 | 6.74 | 4.00 | 211 | |
| C4 | 6.74 | 7.44 | 3.40 | 0.29 | 2.66 | 26.40 | 10.03 | 6.33 | 194 | |
| Mean | 7.07 | 6.66 | 3.95 | 0.15 | 0.30 | 24.10 | 5.02 | 5.25 | 202.5 | |
| P2 | C1 | 7.66 | 7.65 | 1.86 | ND | 0.003 | 21.50 | 10.95 | 6.33 | 176 |
| C2 | 7.53 | 6.91 | 3.79 | 2.80 | 0.32 | 22.20 | 11.15 | 23.33 | 220 | |
| C3 | 6.84 | 7.12 | 6.3 | 0.53 | ND | 25.90 | 10.38 | 8.33 | 431 | |
| C4 | 6.81 | 6.94 | 3.30 | ND | 4.28 | 26.50 | 13.80 | 11.33 | 396 | |
| Mean | 7.19 | 7.03 | 3.55 | 0.26 | 0.16 | 24.05 | 11.05 | 9.83 | 308 | |
| P3 | C1 | 7.49 | 7.77 | 1.78 | ND | 0.001 | 22.10 | 12.60 | 2.50 | 286 |
| C2 | 7.47 | 7.03 | 3.82 | ND | 0.53 | 22.30 | 13.40 | 22.83 | 334 | |
| C3 | 6.77 | 7.25 | 6.10 | 1.26 | 0.10 | 26.10 | 11.15 | 10.50 | 343 | |
| C4 | 6.88 | 6.95 | 3.50 | 0.49 | 2.80 | 25.60 | 20.60 | 14.50 | 185 | |
| Mean | 7.18 | 7.14 | 3.66 | 0.25 | 0.32 | 23.95 | 13.00 | 12.50 | 310 | |
| P4 | C1 | 7.98 | 7.85 | 2.84 | ND | 0.001 | 22.10 | 13.45 | 1.50 | 198 |
| C2 | 7.28 | 6.45 | 3.63 | ND | 0.40 | 22.30 | 14.90 | 27.67 | 370 | |
| C3 | 6.92 | 7.34 | 6.20 | 1.24 | ND | 26.10 | 17.65 | 12.83 | 334 | |
| C4 | 7.07 | 6.99 | 4.80 | 0.14 | 1.05 | 25.60 | 27.80 | 23.67 | 141 | |
| Mean | 7.18 | 7.16 | 4.22 | 0.07 | 0.20 | 23.95 | 16.28 | 18.25 | 266 | |
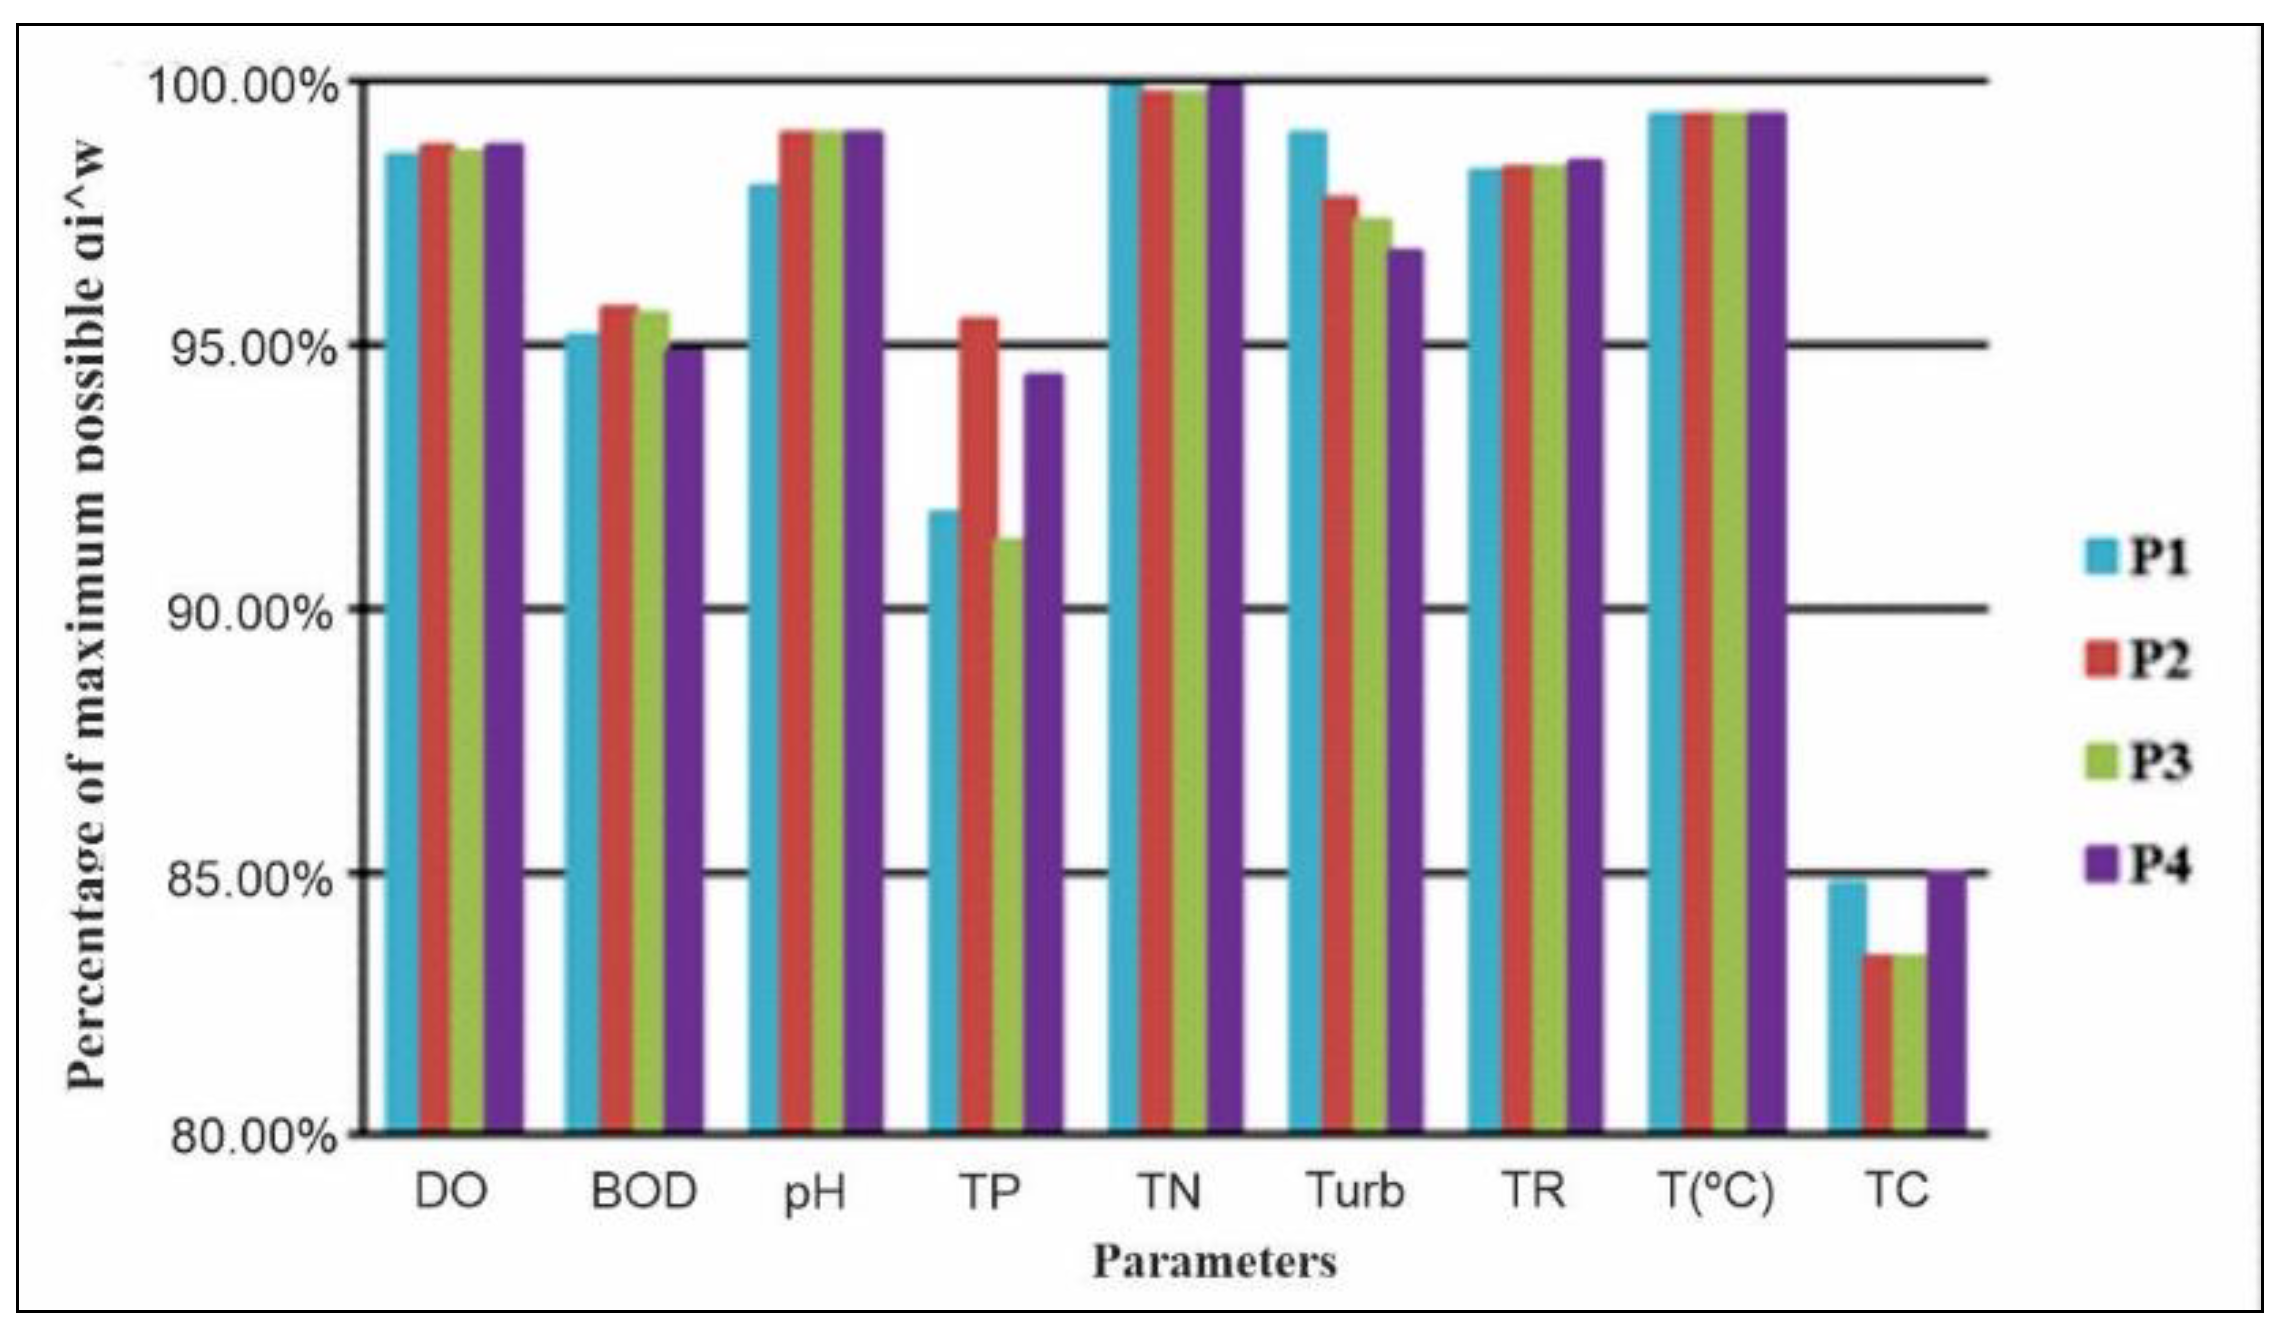
| qi | Weights | P1 | P2 | P3 | P4 | Mean |
|---|---|---|---|---|---|---|
| DO | 0.17 | 92.3 | 93.0 | 92.8 | 93.3 | 92.9 |
| BOD | 0.10 | 61.4 | 64.5 | 63.7 | 59.4 | 62.3 |
| pH | 0.12 | 84.4 | 91.7 | 92.2 | 92.3 | 90.2 |
| TP | 0.10 | 42.6 | 63.2 | 40.3 | 56.4 | 50.6 |
| TN | 0.10 | 98.8 | 97.8 | 98 | 99.4 | 98.5 |
| Turb | 0.08 | 87.9 | 75.4 | 71.8 | 66.8 | 75.5 |
| TR | 0.08 | 80.6 | 81.3 | 81.7 | 82.4 | 82.0 |
| T (°C) | 0.10 | 94.0 | 94.0 | 94.0 | 94.0 | 94.0 |
| TC | 0.15 | 33.4 | 29.8 | 29.7 | 33.9 | 31.7 |
| WQI | 69.0 | 71.0 | 68.0 | 71.0 | 69.8 |
Publisher’s Note: MDPI stays neutral with regard to jurisdictional claims in published maps and institutional affiliations. |
© 2022 by the authors. Licensee MDPI, Basel, Switzerland. This article is an open access article distributed under the terms and conditions of the Creative Commons Attribution (CC BY) license (https://creativecommons.org/licenses/by/4.0/).
Share and Cite
Ramalho, F.L.; Cabral, J.B.P.; Alves, W.d.S.; de Barcelos, A.A.; dos Santos, F.F.; Paulino, A.T. Spatial and Temporal Evaluation of Water Streams Using Quality Indexes: A Case Study. Water 2022, 14, 3526. https://doi.org/10.3390/w14213526
Ramalho FL, Cabral JBP, Alves WdS, de Barcelos AA, dos Santos FF, Paulino AT. Spatial and Temporal Evaluation of Water Streams Using Quality Indexes: A Case Study. Water. 2022; 14(21):3526. https://doi.org/10.3390/w14213526
Chicago/Turabian StyleRamalho, Fernanda Luisa, João Batista Pereira Cabral, Wellmo dos Santos Alves, Assunção Andrade de Barcelos, Francismário Ferreira dos Santos, and Alexandre Tadeu Paulino. 2022. "Spatial and Temporal Evaluation of Water Streams Using Quality Indexes: A Case Study" Water 14, no. 21: 3526. https://doi.org/10.3390/w14213526