Article

Highly Functionalized Microporous Activated Biochar from Syagrus coronata Waste: Production, Characterization, and Application in Adsorption Studies

by
Bruno Salarini Peixoto
1,2,
Larissa Silva de Oliveira Mota
1,
Pamella Christina Ortega de Oliveira
1,2,
Márcia Cristina da Cunha Veloso
2,
Gilberto Alves Romeiro
2 and
Marcela Cristina de Moraes
1,*
1
Laboratory of Bioaffinity Chromatography & Environmental Chemistry—BioCrom, Organic Chemistry Department, Institute of Chemistry, Fluminense Federal University, Niterói 24020-141, RJ, Brazil
2
Laboratory of Thermochemical Conversion, Organic Chemistry Department, Institute of Chemistry, Fluminense Federal University, Niterói 24020-141, RJ, Brazil
*
Author to whom correspondence should be addressed.
Water 2022, 14(21), 3525; https://doi.org/10.3390/w14213525
Submission received: 14 October 2022 / Revised: 29 October 2022 / Accepted: 31 October 2022 / Published: 3 November 2022
(This article belongs to the Special Issue Wastewater Treatment via the Adsorption Method)

Abstract

:
The presence of emerging contaminants in water can harm both the environment and human health. Traditional water and wastewater treatment cannot eliminate them, so different alternatives for their removal are being studied. The use of activated carbon as an adsorbent is emphasized due to its high adsorption capacity and lower cost, and to the possibility of obtaining it from biomass wastes. Thus, this study evaluated the use of Syagrus coronata waste to produce activated biochars and their adsorption capacity of isoniazid from an aqueous medium. For this, the biochar obtained through slow pyrolysis was chemically activated using two different agents, H2SO4 or KOH. The adsorbent’s acidic and textural properties were studied and correlated with adsorption behavior tested in batch and fixed-bed column systems, using commercial activated carbon as a comparison. The KOH activation process produced a predominantly microporous material (BAC), with a high surface area (1006 m2·g−1) and a high content of oxygenated functional groups (1.98 mmol·g−1). BAC outperformed all other materials tested and ones found in other works using isoniazid as a contaminant model, having a high adsorption capacity (712.42 mg·g−1). Thus, this work successfully obtained an efficient adsorbent produced from an agro-industrial waste, with superior performance.

Graphical Abstract

1. Introduction

Several substances resulting from human activity are frequently detected in water bodies close to cities. The organic compounds that are being found can be labeled as emerging organic contaminants (EOCs). This includes pharmaceuticals and personal care products (PPCPs), pesticides, hormones, and industrial chemicals [1,2,3].
Antibiotics, anti-inflammatories, analgesics, hormones, and psychoactive drugs should be highlighted among the pharmaceuticals frequently found in rivers around the world [4,5,6,7]. For instance, isoniazid (pyridine-4-carbohydrazide), a potent antibiotic and one of the most commonly used antituberculosis drugs, was found in traditional water and wastewater treatments plant (WWTPs) influents and effluents in Pretoria, South Africa [8]. The presence of EOCs in the environment represents an increasing threat to both human and natural ecosystems.
WWTPs are not effective in removing those pollutants from water. EOCs can potentially bypass water treatment facilities and, ultimately, turn back to the environment resulting in accumulation [9]. Besides new technologies that have been studied for the remediation of EOCs in water, adsorption is still one of the most used processes because of its efficiency and low cost. New adsorbent materials are being continuously studied, and, in this context, the use of renewable materials is of paramount importance. Particularly biomass wastes have been investigated as feedstock for producing more effective and less expensive adsorbent materials [10,11,12].
Pyrolysis is a thermal conversion technique historically used to obtain charcoal from biomass wastes, yielding a carbonaceous material with numerous applications, such as soil amendment [13], adsorbent for water contamination [14], catalyst [15], etc. [16]. More recent technological applications include chemical sensing [17], degradation of chemicals [18], and supercapacitor [19]. A simple way to describe this process lies in heating a feedstock under a low concentration of O2, preventing the material burn. Due to their major composition of lignin, cellulose, and hemicellulose, lignocellulosic biomass waste is a substantial source of feedstock for the pyrolysis process.
Syagrus coronata (Martius) Beccari, locally known as licuri, is a native palm tree from Brazil found in the Caatinga biome. Its fruits first caught attention because of their seed which is rich in oil and has different uses [20,21,22]. The licuri fruit husks (pericarp) are considered a waste of the harvesting process and are usually seen as a solid fuel for local communities. Specialists suggest that, depending on the soil conditions, a licuri plantation can produce annually 2–4 tons of fruit per hectare [23]. As a lignocellulosic agricultural residue, the licuri fruit pericarp has the desirable characteristics to be employed as feedstock in the pyrolysis process, resulting in the valorization of this material.
Therefore, this work aims to explore the use of licuri coconut husks as feedstock to produce biochar and investigate the best activation procedure to prepare an activated carbon with a high potential of isoniazid adsorption, as an EOC model, in batch and fixed-bed assays. This antibiotic can be considered an ideal model for studies of the performance of new adsorbent materials due to its importance, high water solubility, and extensive use since it is also used clinically to prevent active tuberculosis in people who may be infected with Mycobacterium tuberculosis. Equilibrium, kinetic, and desorption/regeneration studies were carried out to investigate the performance of the activated biochar, prepared using an agriculture residue, compared to a commercial activated carbon.

2. Materials and Methods

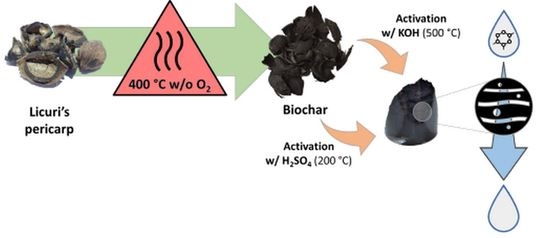
2.1. Adsorbent Preparation

The biomass waste (S. coronata fruit husks) used as feedstock for the adsorbent preparation was collected in the Northeast region of Brazil—Caldeirão Grande, Bahia, Brazil (11°0′32′′ S and 40°18′7′′ W). Once collected the feedstock was dried at 105 °C until constant weight, characterized, and used in the pyrolysis process without alteration of its granulometry. The characterization of the material involved the determination of soluble extractives, ash, and Klason’s lignin. Using these parameters, the holocellulose was estimated using the protocols for biomass characterization publicly available made by the US National Renewable Energy Laboratory (NREL) [24,25,26].
The slow pyrolysis process was performed under the following conditions: final temperature of 400 °C, the residence time of 2 h, a heating rate of 10 °C·min−1, the N2 flow rate of 500 mL·min−1, and batch loads of 250 g of feedstock. The char was removed from the reactor after the system cooled down and weighed t and then prepared for the activation process. All the adsorbents used in this work (biochars and commercial activated carbon) were crushed and sieved to 45–212 μm to maintain a controlled particle size distribution.

Biochar Activation

The biochar prepared from the licuri fruit husks (BC) was subjected to two different activation procedures to change its textural properties and surface chemistry aiming to increase the adsorption capacity of the material.
A fraction of the biochar was treated with concentrated sulfuric acid (H2SO4) in a ratio of 1:3 and heated up to 200 °C for 1 h and then cooled down to room temperature. The slurry formed was dispersed in ultrapure water and the solid was filtered and washed with ultrapure water until the effluent became neutral. This material was hereafter denominated AAC [27,28].
The other fraction of biochar was milled along potassium hydroxide (KOH) lentils using a mortar and a pestle in a way to produce a homogeneous solid mixture with the ratio of 3 g KOH to each 1 g of biochar. The solid mixture was transferred to a stainless-steel cylindrical flask and closed. The recipient was then put into a muffle furnace and heated until 500 °C for 2 h. After cooling down the solid was dispersed in ultrapure water, filtered, and washed until the effluent became neutral. Afterward the solid was treated with a solution of 3 mol·L−1 hydrochloric acid (HCl) for 1 h to leach away the remaining inorganic content, then filtered and washed with ultrapure water again until neutrality was reached. This activated carbon was henceforth named BAC [29,30]. A summary of the materials studied in this article can be seen in Table 1.

2.2. Adsorbent Characterization

A commercial activated carbon (CAC) from ISOFAR (Rio de Janeiro, Brazil) was used as a comparison point to the materials produced. All adsorbents passed through all the characterization and adsorption tests including analysis for specific surface area, determination of porous type and size, surface studies, point of zero charge, and Boehm titration.

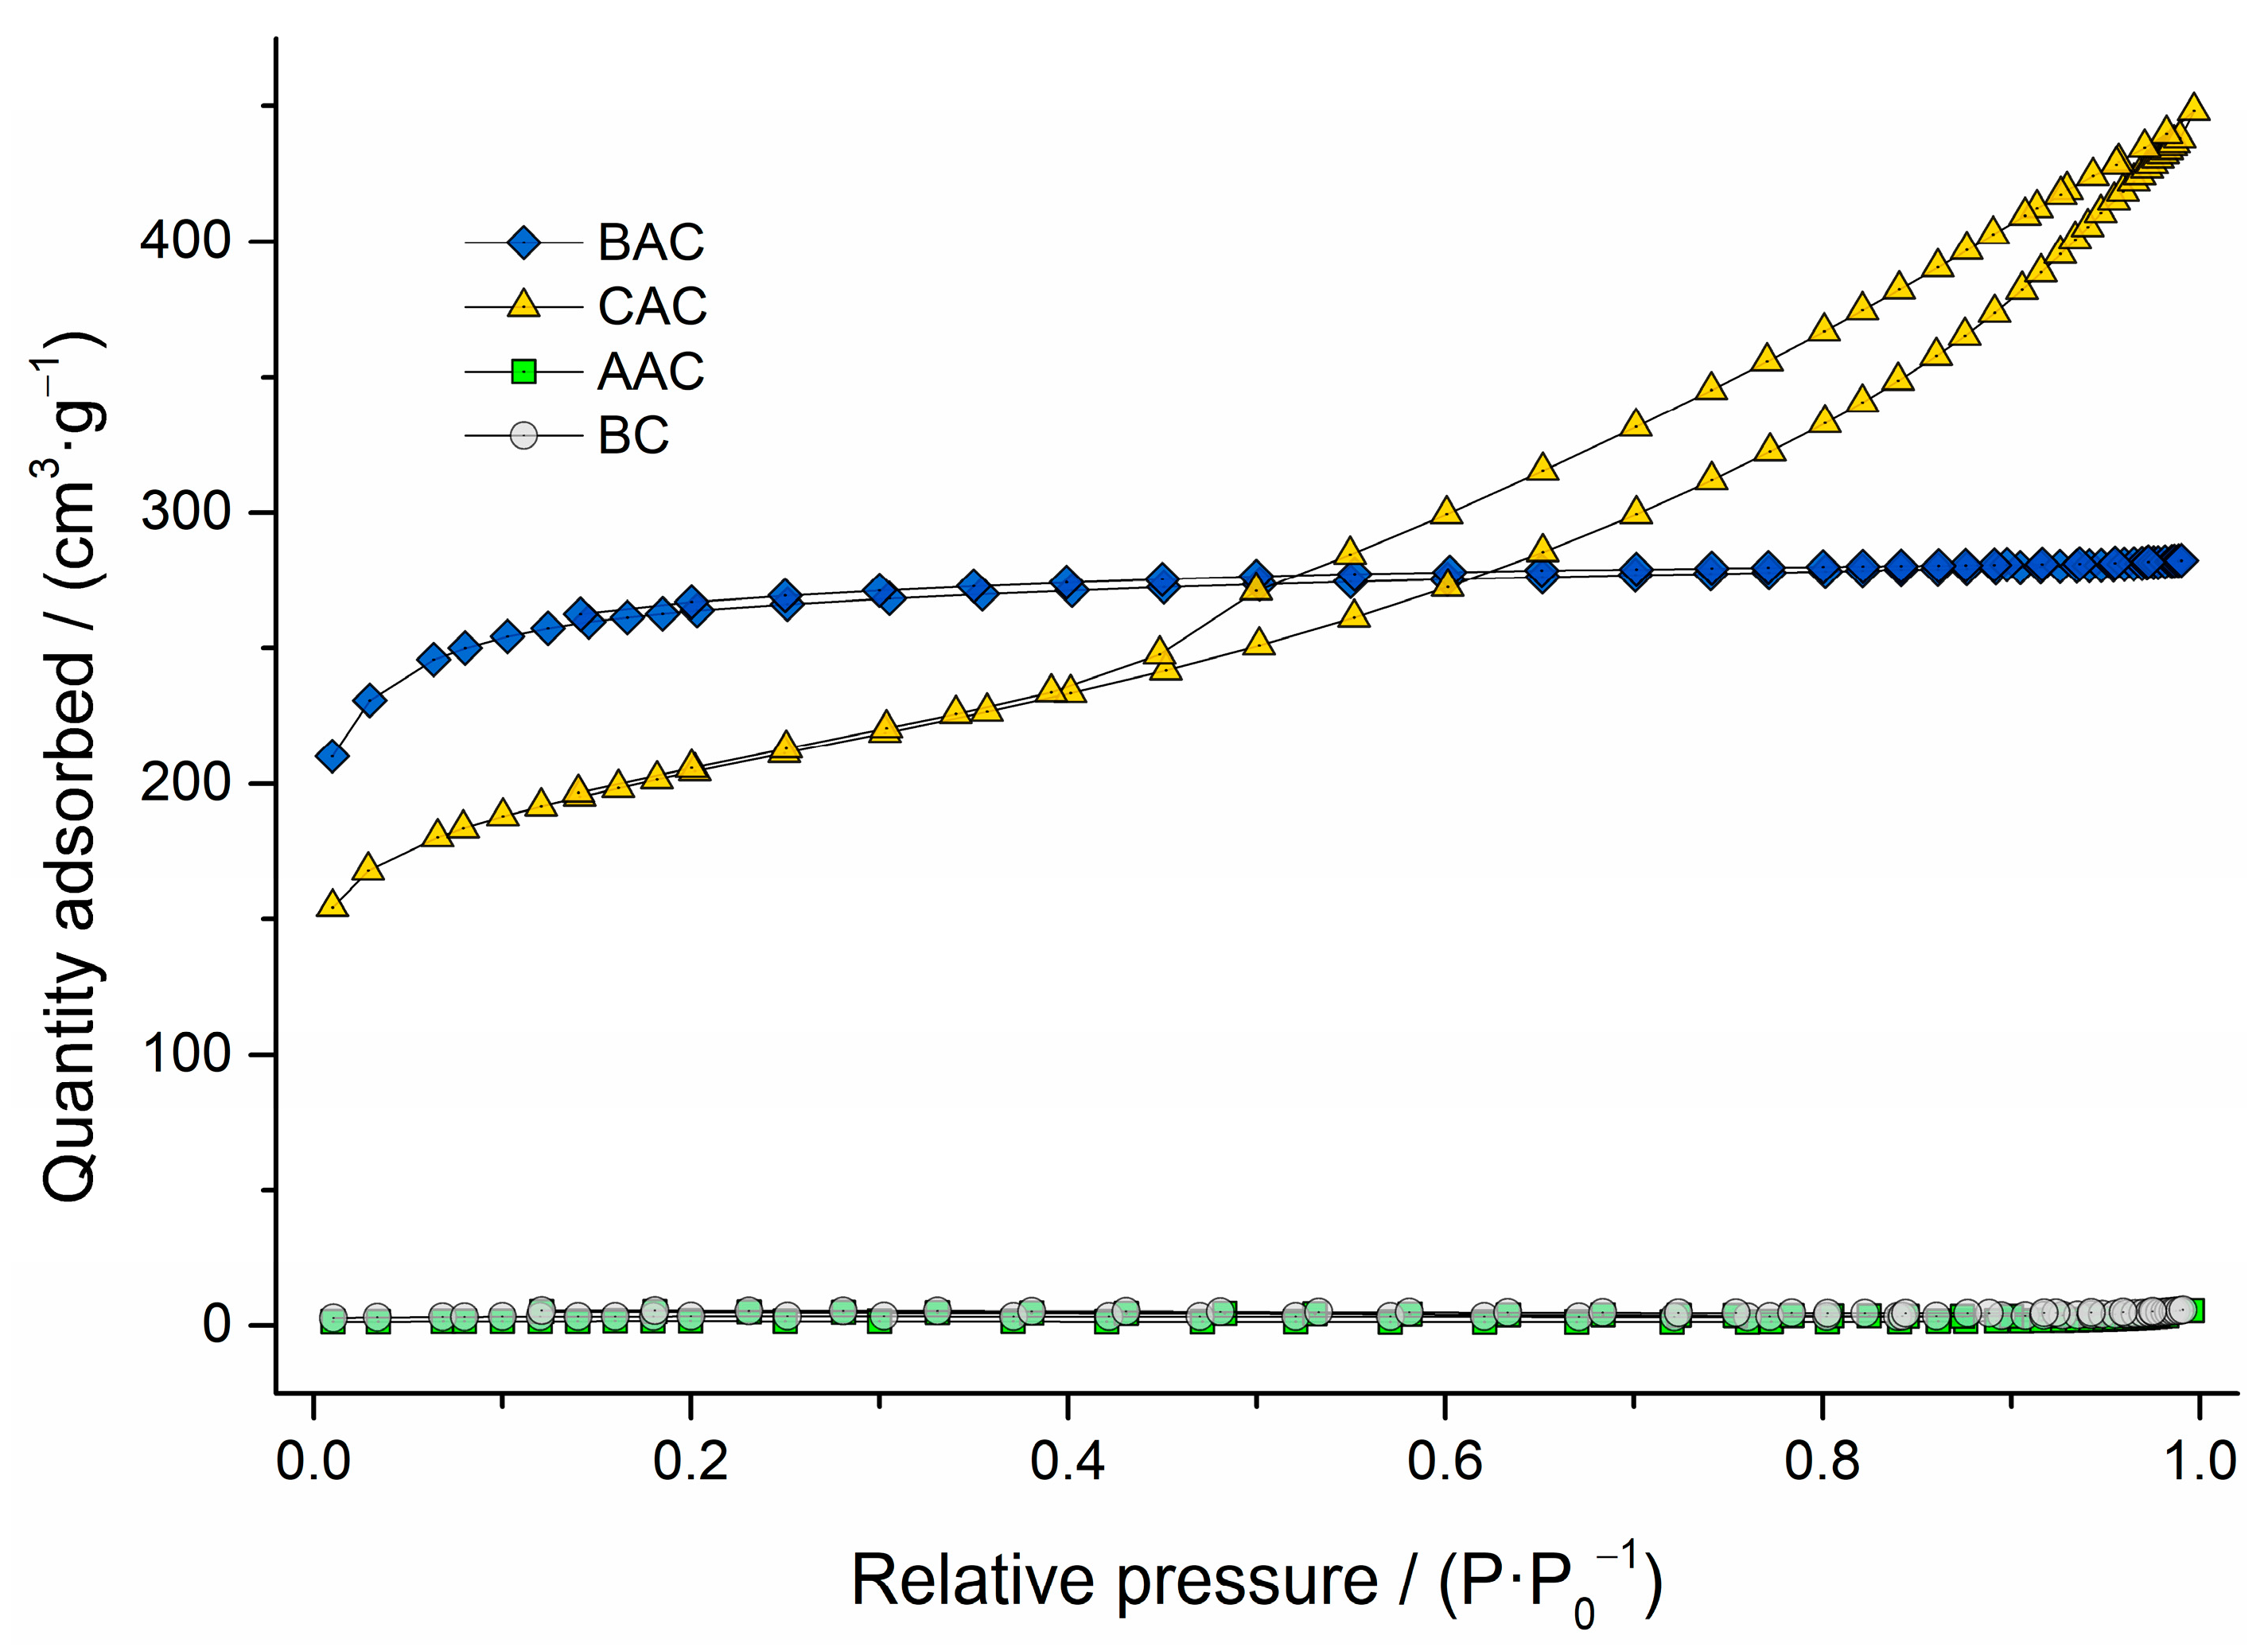
2.2.1. Textural Analysis

The textural analysis was examined through the adsorption of N2 at −196 °C using an ASAP 2020 porosity analyzer from Micromeritics (Micromeritics Instruments Corporation, Norcross, GA, USA). All the samples were heated to 105 °C for 72 h and afterward to 250 °C in vacuum prior to the analysis. The specific surface area was calculated using the BET equation [31], whilst the pore volumes and medium pore diameter were assessed by the BJH method (desorption) [32]. The micropore proportion was calculated using the micropore surface area obtained by the t-plot treatment [33].

2.2.2. Boehm Titration

The quantification of oxygenated groups on the surface of the carbon was done by titration of the acidic groups, usually referred to as Boehm titration. In short, 1.0 g of each biochar was added to 3 separate flasks and then 25 mL of aqueous solutions of sodium bicarbonate (NaHCO3 0.10 mol·L−1), sodium carbonate (Na2CO3 0.05 mol·L−1), and sodium hydroxide (NaOH 0.10 mol·L−1) was added. The flasks were sealed and stayed under agitation for 24 h using a horizontal shaker at 150 rpm. Afterward, the solutions were filtered, and 3 samples of 5.0 mL were collected and titrated against an aqueous solution of hydrochloric acid (HCl 0.10 mol·L−1) using methyl orange as a pH indicator. The quantification was done based on the hypothesis that NaHCO3 solution would react only with the carboxylic acid groups, the Na2CO3 would react with carboxylic and the lactonic, while the NaOH solution would react with the carboxylic, lactonic, and phenolic groups [34,35].

2.2.3. Point of Zero Charge

The Point of Zero Charge pH (PZC) was determined by the pH drift method, briefly described as follows. Samples of 10.0 mg of each carbon were added to 8 vials containing 30 mL of an aqueous solution of 0.01 mol·L−1 potassium chloride (KCl) with the pH value varying from 2 to 10, adjusted using a diluted aqueous solution of hydrochloric acid (HCl) and/or sodium hydroxide (NaOH). The vials were then sealed and put in a horizontal shaker for 72 h at 2.5 Hz. Afterward, the final pH was measured and the pHPZC was determined by plotting the data of the initial pH (pHi) against the final pH (pHf) and fitting the data with a 4th power equation. The point where the curve crosses the straight line of pHi = pHf is the pH of the point of zero charge of the material [36].

2.3. Analytical Method for Isoniazid Quantification

Isoniazid quantification in aqueous solution was conducted by employing a spectrophotometer Jasco V-730bio (Jasco Corporation, Tokyo, Japan) via absorbance measurements at 262 nm. An analytical curve was prepared for isoniazid quantification in the concentration range 4.0–64.0 mg·L−1. Solutions at 5.0; 24.0; and 48.0 mg·L−1 of isoniazid concentration were used as method quality controls.

2.4. Adsorption Assays

2.4.1. Adsorption Kinetics

10.0 mg of the activated carbons BAC and CAC were added to flasks containing 10.0 mL of a 200 mg·L−1 aqueous solution of isoniazid. In the AAC and BC assays, 10.0 mg of the adsorbent materials were added to 10.0 mL of a 60.0 mg·L−1 aqueous solution of isoniazid, due to their very distinct adsorption capacity. The containers were closed and kept under agitation (2.5 Hz) and constant temperature (20 °C) using a Dubnoff shaking water bath. To evaluate the adsorption capacity at a given contact time (qt) the solutions were filtered and then analyzed at the spectrophotometer. Assays were conducted in triplicate and compared to the initial isoniazid solution. A blank sample containing ultrapure water and the adsorbent passed through the same process and was analyzed as well to detect any possible interference on the UV-Vis measurement.
The variation of isoniazid concentration for each sample was determined using the calibration curve. The data produced in this study is represented in the quantity of isoniazid absorbed per mass of adsorbent (milligram of analyte per gram of adsorbent) using the Equation (1).
q t = C 0 C t m V
Considering m the adsorbent mass, in [g]; V the isoniazid solution volume, in [L]; C0 the initial isoniazid concentration, in [mg·L−1], and Ct the isoniazid concentration at the given time, in [mg·L−1]. The kinetic of isoniazid adsorption was determined for all 4 adsorbents using the qt values. Pseudo-first order [37] and pseudo-second order [38] models, indicated in the following Equations (2) and (3), respectively, were considered. The adjustment of the data to the nonlinear equations was done through the Levenberg-Marquardt approximation method using the software OriginPro 9.0. The fitting of the equations to the data was evaluated by their adjusted coefficient of determination (R2adj) and by the difference (Δqe) between the qe obtained experimentally (qeexp) and the one calculated by the equations (qecalc) according to the Equation (4).
q t = q e 1 e x p k 1 · t  
q t = q e 2 · k 2 · t 1 + q e · k 2 · t
Δ q e = q e e x p q e c a l c q e e x p
where, qe is the quantity adsorbed after the equilibrium, in [mg·g−1]; k1 and k2 are velocity constants with units in [min−1] and [g·mg−1·min−1], respectively and t is time, in [min].

2.4.2. Adsorption Isotherms

The adsorption isotherm assays were conducted at 20 °C with the purpose to find out the maximum adsorption capacity of each material prepared and compare it to the commercial sample (CAC). Samples containing 20 mL of isoniazid solution (50 to 1000 mg·L−1) and 10 mg of adsorbent were placed under agitation for 75 min at 2.5 Hz, each of them being afterward filtrated and analyzed at the spectrophotometer to detect the remaining isoniazid concentration at the samples. The assays were conducted in triplicate and the mean of the obtained values was used for the plot of qe versus Ce graphs. Langmuir [39], Freundlich [40], and Sips [41] models, shown in Equations (5)–(7), were considered to treat the data.
q e = Q m a x · K L · C e 1 + K L · C e
q e = K F · C e 1 n
q e = Q m a x · K S · C e m S 1 + K S · C e m S
where Qmax is the maximum adsorption capacity, in [mg·g−1]; KL is the Langmuir equilibrium adsorption constant, [L·mg−1]; n is the dimensionless intensity parameter; KF is the Freundlich adsorption capacity constant, in [mg·g−1·(mg·L−1)−1/n]; KS is the Sips equilibrium constant, in [(L·mg−1)mS]; and mS is the Sips model exponent.

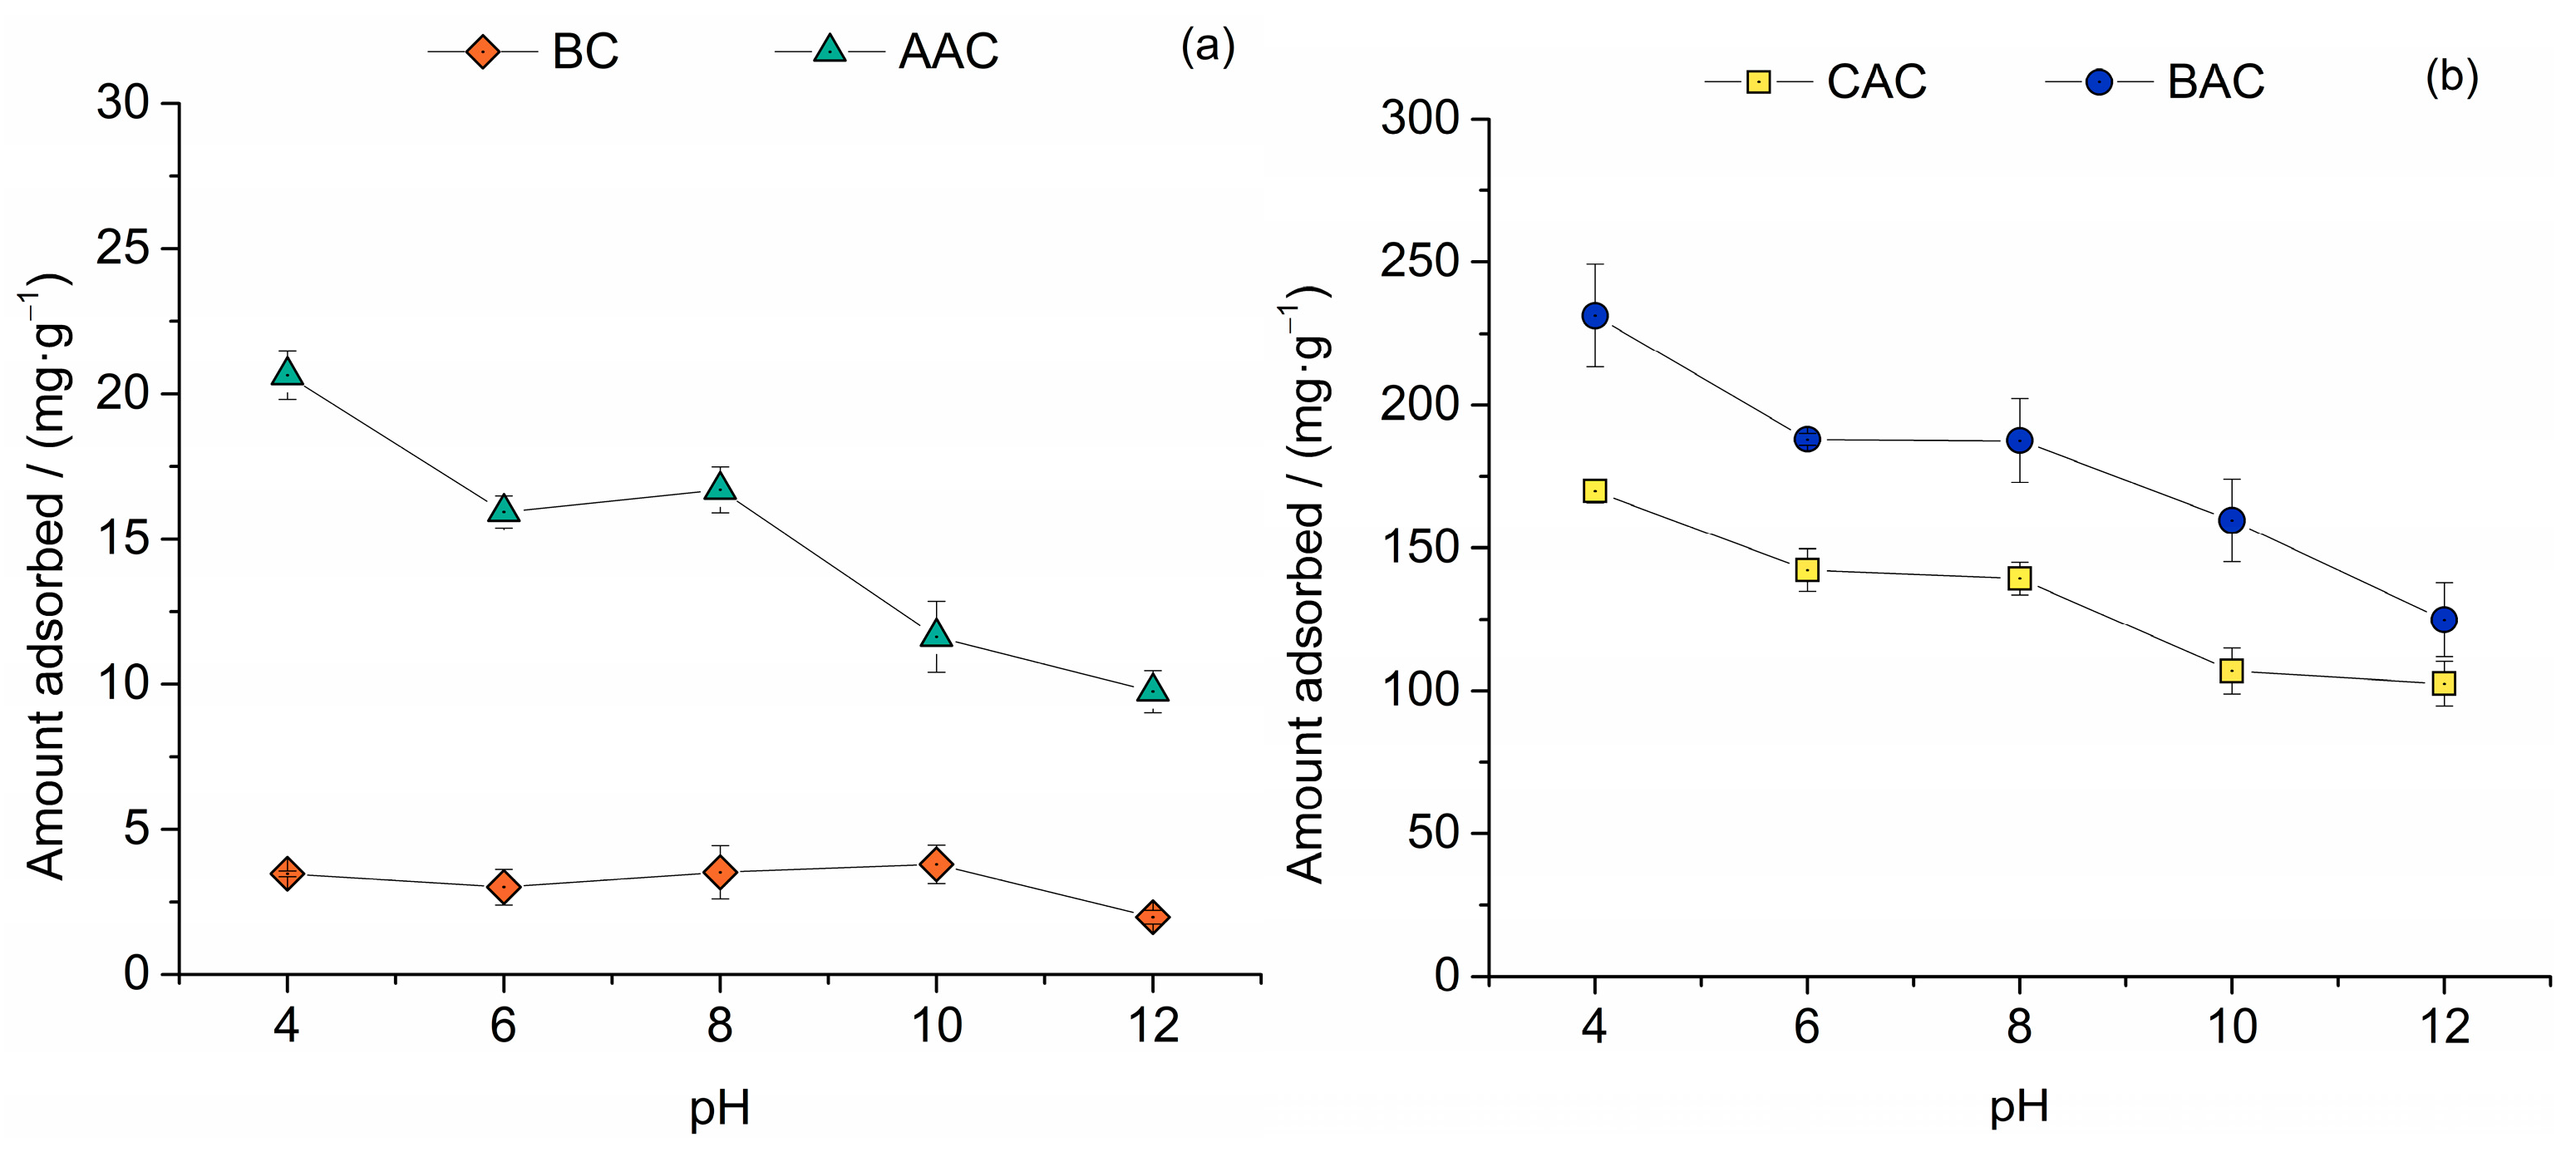
2.4.3. Influence of the pH on the Adsorption Capacity

Isoniazid UV spectra from pH 2 to 12 were registered to observe absorbance changes and certify the applicability of the constructed analytical curve for the selected pH range. Adsorption assays were performed for 75 min in a pH range of 4 to 12 under agitation at 2.5 Hz. Under the same conditions of kinetic study, the adsorption capacity assays were conducted using 10.0 mg of the adsorbent and 10 mL of an isoniazid solution (60 mg·L−1), for AAC and BC samples; or 2.5 mL of isoniazid solution (200 mg·L−1), for BAC and CAC samples. After agitation, all samples were filtered, and the isoniazid was quantified at 262 nm. Aqueous solutions from pH 4 to 12, that have been in contact with char for the same time, were used as blank samples.

2.4.4. Fixed-Bed Column Adsorption Assay

The adsorbent columns were prepared using 15 mg of the adsorbent. The solid was suspended in ultrapure water and transferred to an empty SPE (Solid Phase Extraction) cartridge with a polyethylene frit to prevent the adsorbent from passing through the column. The column was attached to an SPE manifold, and this system was connected to a vacuum pump. The pressure of the system was regulated so that the isoniazid solution (50.0 mg·L−1) would pass through the column with a flow rate of 3 mL·min−1. To monitor the adsorption process, the effluent was collected within constant volume intervals. During the tests using BAC and CAC, the isoniazid concentration was measured every 3 mL. While monitoring the adsorption of the columns filled with AAC and BC, the interval was shortened to every 1 mL of effluent because of the much smaller adsorption capacity of these two chars. The data obtained was then studied using Thomas [42], Yoon-Nelson [43], and Yan [44] models described in Equations (8), (9) and (10), respectively, to fit the adsorption behavior of samples in the on-flow assay.
C t C 0 = 1 1 + e x p K T Q q T · m C 0 · Q · t
C t C 0 = 1 1 + e x p K Y N · Z t
C t C 0 = 1 1 1 + C 0 · Q · t m · q Y a Y
C0, [mg·mL−1], is the concentration of sorbate in the original solution, Ct, [mg·mL−1], is the concentration of sorbate at the effluent, Q, [mL·min−1], is the flow rate of the effluent, m is the adsorbent mass in [g], t is the time of operation, in [min]. The other parameters for the Thomas equation, qT, [mg] of sorbate per [g] of adsorbent, is the theoretical adsorbent maximum adsorption capacity and KT is the kinetic constant of Thomas, [mL·min−1·mg−1]. For the Yoon-Nelson equation, Z, [min], is the time to achieve 50% of adsorption saturation, KYN is the kinetic constant, [min−1]. In the Yan model, qY is the theoretical maximum adsorbent capacity, in [mg·g−1], and aY is the empiric Yan model constant.

2.5. Desorption and Regeneration Studies

To investigate isoniazid desorption, 10 mg of saturated BAC was treated with 25 mL of basic water (pH 10), methanol, or ethanol for 1 h under stirring at 2.5 Hz, in triplicate. Then, the mixtures were filtered and the flasks containing the solvents were dried to dilute the residual isoniazid in water for further analysis in the spectrophotometer. The percentage of desorption (D%) was calculated using the Equation (11).
D % = a m o u n t   a d s o r b e d a m o u n t   d e s o r b e d · 100
A study was also conducted to evaluate BAC regeneration by thermal oxidation. The activated biochar was saturated with isoniazid, inserted in a capped ceramic crucible, and heated at 300 °C or 400 °C for 3 h. Then, batch adsorption tests were performed using the regenerated BAC and pristine BAC samples for performance comparison.

3. Results and Discussion

3.1. Adsorbent Preparation

The slow pyrolysis of the licuri coconut husks generated four different kinds of products with a mass distribution of 36%, 40%, and 24%, between solid, liquid, and gas phase products, respectively. Although this work only focuses on the solid product, known as biochar (BC), the other products, namely the gas phase and the two liquid phases (bio-oil and pyroligneous acid) were collected and investigated for different applications as a way to propose a zero-waste process [45,46].
The valorization of lignocellulosic biomass waste through the production of biochar has been studied in several previous studies, including with the waste of Syagrus coronata, a material that would be otherwise sent to waste disposal or combustion. Beyond that, its structure and composition show great potential for producing excellent activated carbons, helping replace the use of coal or charcoal. The resulting mass distribution of the major constituents of the lignocellulosic waste from the Syagrus coronata fruit (pericarp), after the extraction of its seed, shows a high content of lignin. The distribution of the macro components present in the feedstock is shown in Table 2.
The high lignin content displayed by the licuri waste demonstrates its potential for biochar production, as this is generally associated with high biochar yields, while high holocellulose (cellulose + hemicellulose) content generally results in a greater concentration of oxygen-containing groups but lower biochar yield [47,48].
Potassium hydroxide has been frequently used for its capacity of producing high specific area activated carbons, commonly producing materials with micropore content. On the other hand, the action of H2SO4 is more significant in the oxidation and increase of functional groups on the surface of the solid [49,50]. Therefore, the choice of these two activating agents aimed to modify each of these parameters (surface area and functional groups) separately so that their influence on the adsorption of isoniazid could be studied.
In one of the proposals available in the literature, the carbon surface will be oxidized in an alkaline medium containing KOH according to Equations (12)–(17).
2 KOH → K2O + H2O
C + H2O → H2 + CO
CO + H2O → H2 + CO2
K2O + CO2 → K2CO3
K2O + H2 → 2K + H2O
K2O + C → 2K + CO
However, the formation of metallic potassium due to carbonate decomposition is more predominant at very high temperatures (>700 °C), and it is more likely that in our process the reaction is interrupted with the formation of K2CO3 and K2O [51].
The mechanism of chemical activation with H2SO4 is shown in Equation (18) [52]:
[CnHxOy] + H2SO4 → H2O↑ + S + [CnHxOy+3]
The water vapor formed from the dehydration of H2SO4 reacts with the precursor carbon content via gasification to create internal porosities [52]. The proposed gasification reaction can be visualized in the Equation (19):
H2O + [CnHxOy] → H2↑ +CO↑ + [Cn−1HxOy]

3.2. Adsorbent Characterization

3.2.1. Textural Analysis

The results from the textural analysis of all four materials are presented in Table 3. The N2 isotherm adsorption demonstrated that the activation process using KOH was significantly more effective than the H2SO4-based activation in superficial area increase and pore formation. The activation using KOH promoted the formation of a micropore network on the carbon matrix, vastly increasing the specific surface area (from 13 to 1006 m2·g−1) while decreasing the medium pore diameter from 46.4 nm to 2.7 nm. The BAC is predominantly microporous, both in terms of surface area and pore volume. This is consistent with results from KOH melted salt activation of carbonaceous materials at that temperature range reported in other works [30,53]. The surface area of the CAC is considerably smaller than BAC although possessing a larger pore volume, due to the fact that the material is predominantly mesoporous, as can be observed by the N2 adsorption isotherm format (Figure 1).
However, activation with H2SO4 did not show the expected result, since the surface area of the resulting material was smaller than that of the precursor. The pore size distribution of the AAC is not centered on the same value as the average pore size of the BC (Table 3), indicating that the decrease in the surface area was caused by the formation of macropores in the oxidation process, due to the destruction of pore walls, which is usually associated with the use of oxidizing agents in high concentrations [52,54].

3.2.2. Boehm Titration and Point of Zero Charge

The surface chemistry characterization of materials was conducted by the calculation of the total acidity through Boehm titrations (Figure 2).
It can be seen that the BC, as expected because it was not activated, has a small number of oxygenated groups on its surface, which makes its PZC the highest of materials. On the other hand, the base activation process introduced a large number of oxygenated groups on its surface, also being superior to CAC in this regard. The greater presence of oxygenated groups makes BAC the most acidic material in this study, as evidenced by its lowest PZC of 1.63. Interestingly, the acid-activated material, even though it has a low surface area, contains a large number of oxygen groups in its composition. The material is even superior to the CAC evaluated in this study in this regard, having a more acidic character, as shown by its pHPZC of 3.14.

3.3. Batch Adsorption Studies

3.3.1. Adsorption Kinetics

Although several kinetic models have been applied to describe the adsorption of organic contaminants on activated carbon, in the vast majority of cases the pseudo-first-order and pseudo-second-order models, derived from the Langmuir adsorption model, fit well within the adsorption behavior of the experiments described in the literature. Therefore, these were the models used in this study. The kinetic parameters and the coefficients of determination obtained are presented in Table 4.
The determination coefficient (COD or R2) with values of 0.8 or above indicates an acceptable fit of the model to the data obtained [55]. Considering this, Table 4 shows that both the pseudo-first-order and the pseudo-second-order kinetic models could be applied to describe the behavior of the adsorption phenomenon in all the materials evaluated. Moreover, it can be noted that the comparison between the R2 value of both models is fairly similar. Therefore, one more criterion is needed to differentiate which model is more representative for the analyzed process, and the difference between the calculated and experimentally found values for the amount of isoniazid adsorbed at equilibrium (∆qe) can be used for that.
The values of ∆qe for the pseudo-first-order model are smaller than the pseudo-second-order for CAC, BAC, and AAC, indicating that the pseudo-first-order model is better to describe the kinetic data of adsorption of isoniazid in these materials. This means that the diffusion external or intraparticle diffusion is the kinetics-controlling step. On the other hand, the adsorption of isoniazid on BC better fitted the pseudo-second-order model, indicating that the adsorption kinetics is dominated by adsorption at the active site [56].

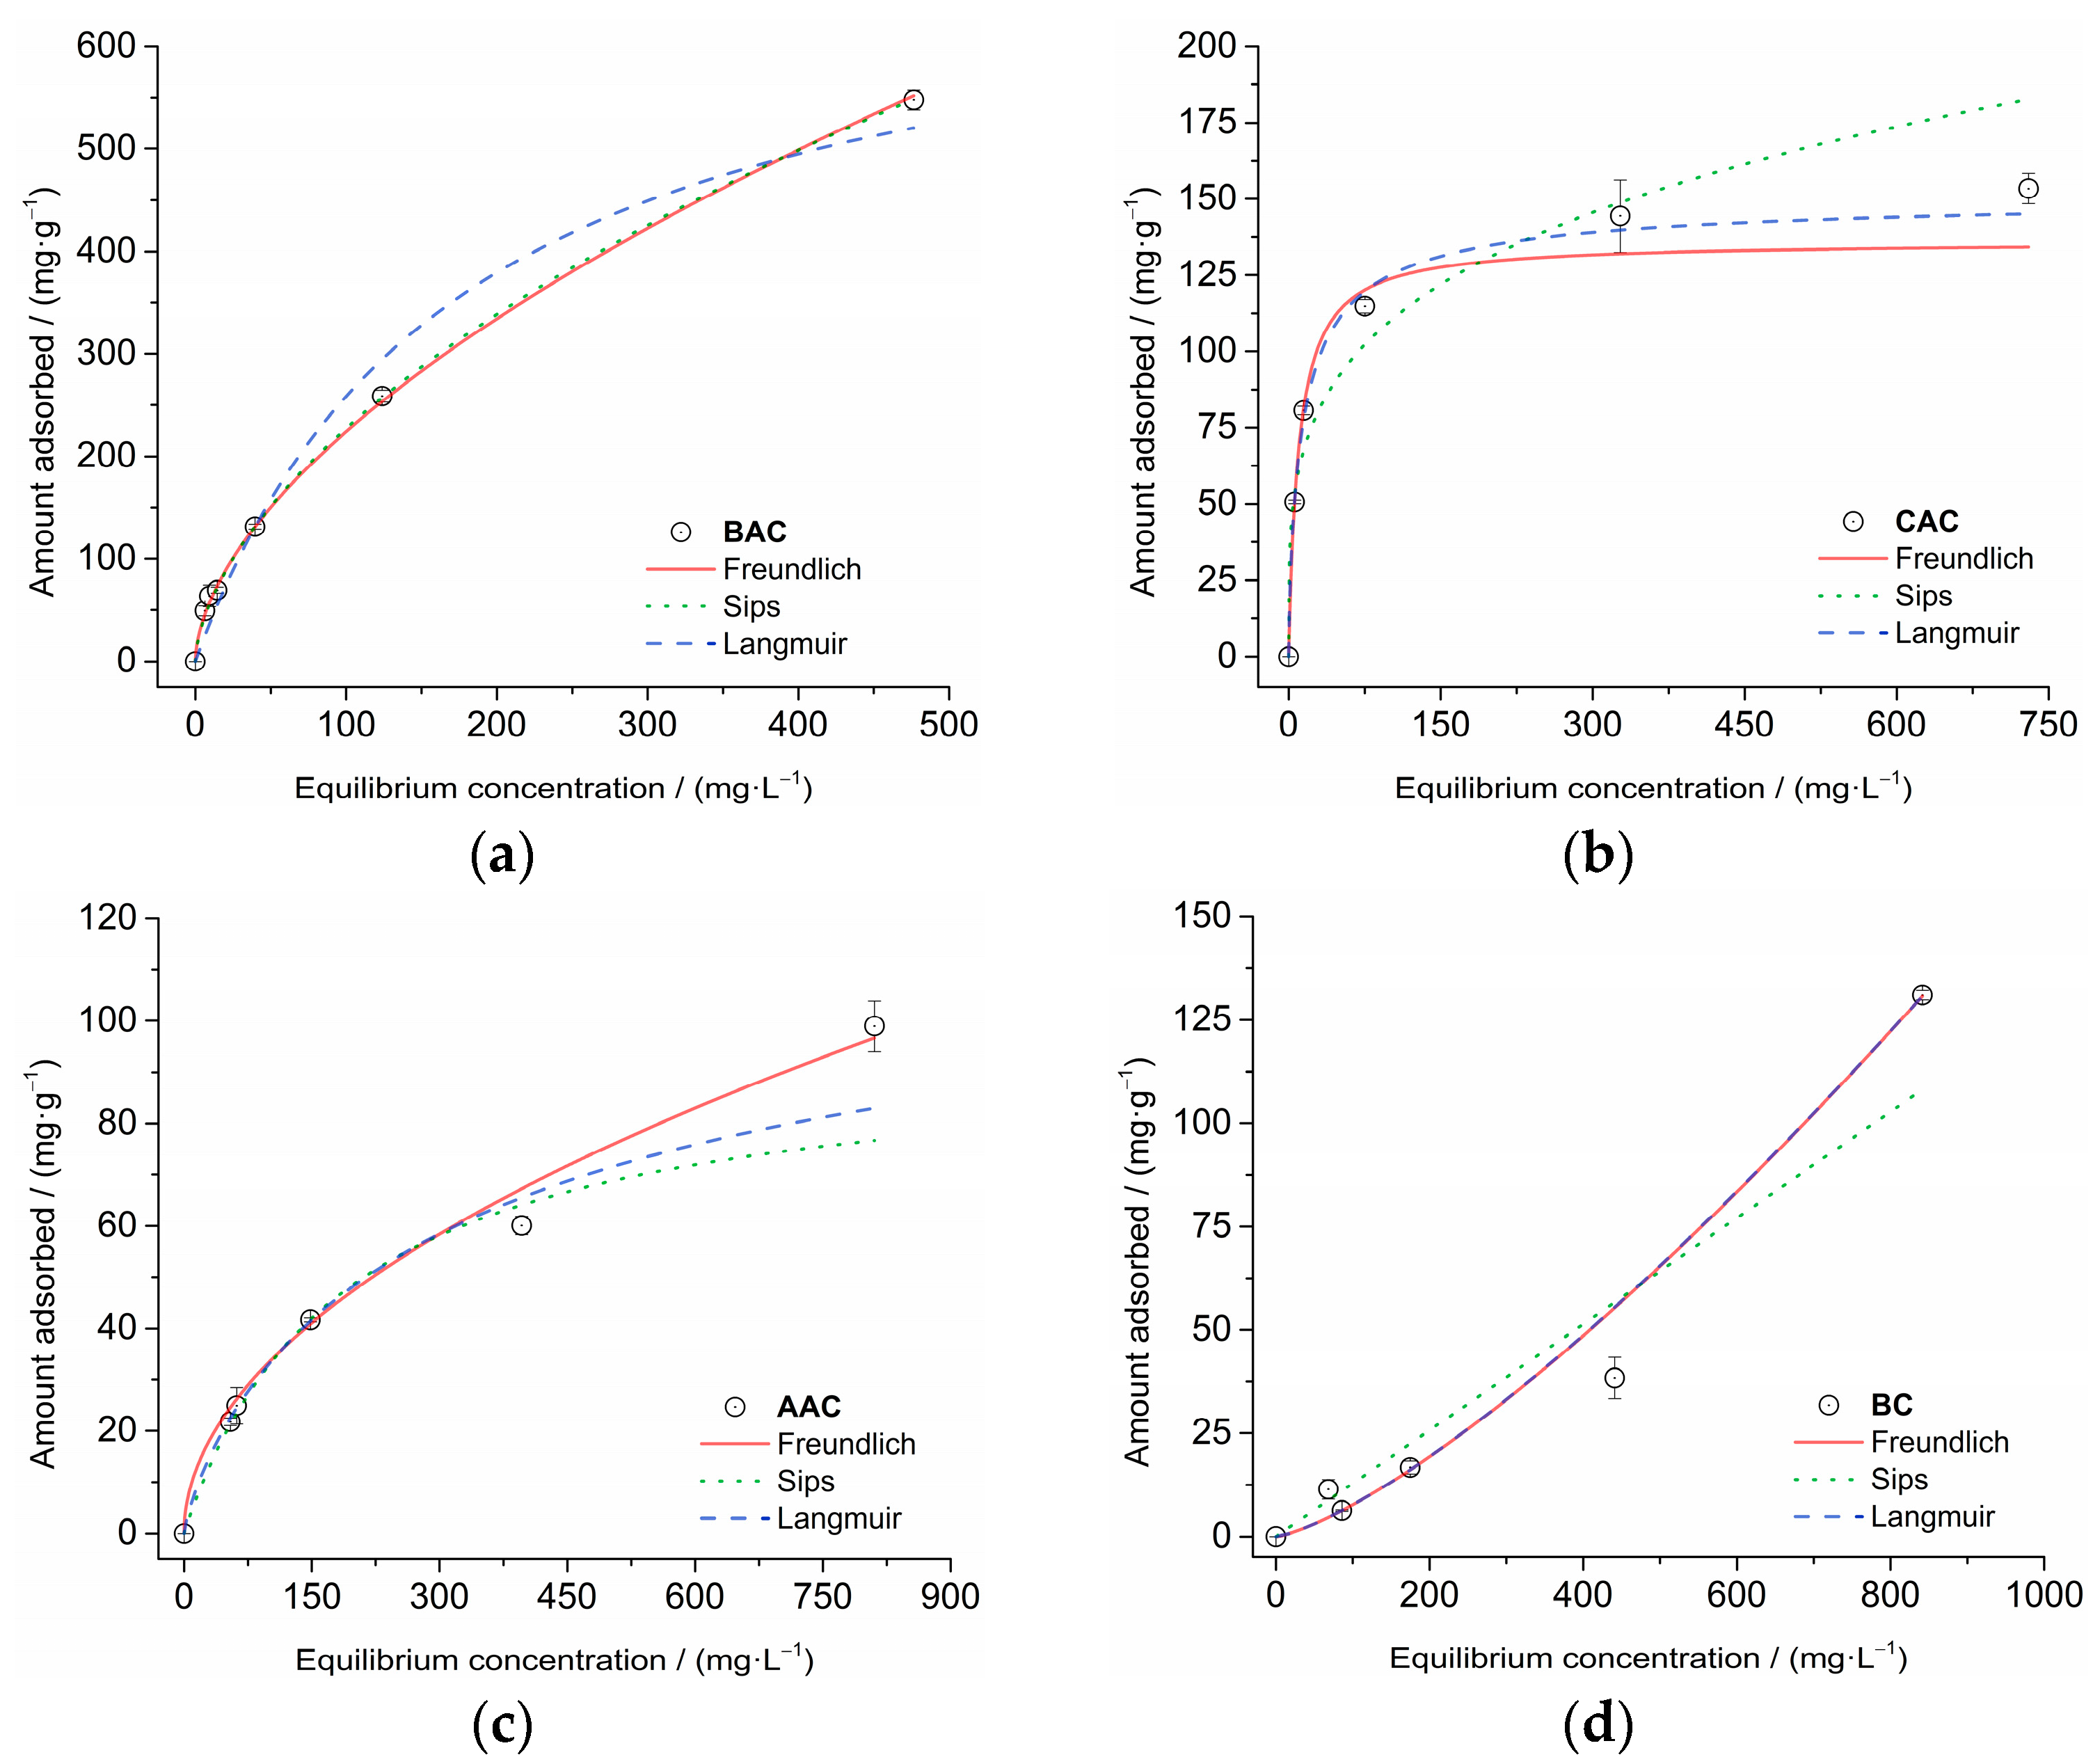
3.3.2. Isotherm Adsorption

The isoniazid adsorption isotherms were obtained at 293 K for all biochars, as depicted in Figure 3.
The analysis of Figure 3a shows that the base activation process, when introducing oxygenated groups on the surface of the biochar and increasing its surface area significantly, improved its adsorptive capacity, which was around 550 mg·g−1. The result corroborates the material characterization data, showing BAC as the most efficient material.
On the other hand, activation with H2SO4 also contributed to the adsorption of isoniazid by the material, mainly under conditions of low drug concentration, but not significantly. This is because, despite its extremely low surface area, it has a considerable amount of oxygenated groups on its surface, which allows a small amount of isoniazid to be adsorbed, as can be seen in Figure 3c.
Figure 3 shows that the adsorption process is favorable for CAC, BAC, and AAC since the curves are concave concerning the equilibrium concentration axis. This statement is confirmed by the parameter n of the Freundlich model (Table 5), where values greater than one also indicate favorable behavior [57]. Analyzing Figure 3d, it can be seen that the BC isotherm does not follow the traditional format of adsorption isotherms, it has a convex shape and an N value lesser than one. The reason for that is the combination of multilayer and cooperative adsorption present in the system, which means that interactions occur between the adsorbates that favor adsorption on the surface of the adsorbent [58,59]. Thus, it deviates from the ideality proposed by Langmuir, presenting a multilayer system, in which the adsorption increases as the amount of adsorbed drug increases, which can be proven by the lower value of R2adj. (0.8972) presented by this model. It also explains why the estimated Qmax values of Langmuir and Sips models were unrealistic values for BC, being disproportionately high.
The analysis of Table 5 shows that BAC, CAC, and AAC isoniazid adsorption adjusted well to the three theoretical models considered in this work. According to the Freundlich model, which establishes that there is no limit to the adsorption capacity as the solute concentration increases, the isotherm cannot form a plateau [60], as observed for AAC and BAC.
On the other hand, CAC shows a tendency to stabilize the adsorptive capacity. Thus, the Freundlich model is not suitable for this case, even presenting a good fit to the experimental data (R2adj = 0.9859). The formation of a plateau in the isotherm is properly explained by the Langmuir and Sips models, as both consider that adsorption occurs with the formation of a monolayer, whereas the Sips model considers that it forms only at high concentrations of the adsorbate [60].
To conclude which model best represents the system, it is necessary to evaluate the heterogeneity of the adsorbent surface, which is not considered by the Langmuir model and is considered by the Sips model. In this situation, the parameter ms of the Sips model can be used, as it indicates how much of the surface is heterogeneous as it deviates from one. The value of 0.78 obtained for CAC indicates that the material has a relatively heterogeneous surface, so the solid surface cannot be considered homogeneous, and the Langmuir equation is not adequate. Therefore, the Freundlich model is more representative of the adsorption by BAC, AAC, and BC, while the Sips model better represents the adsorption by the CAC.

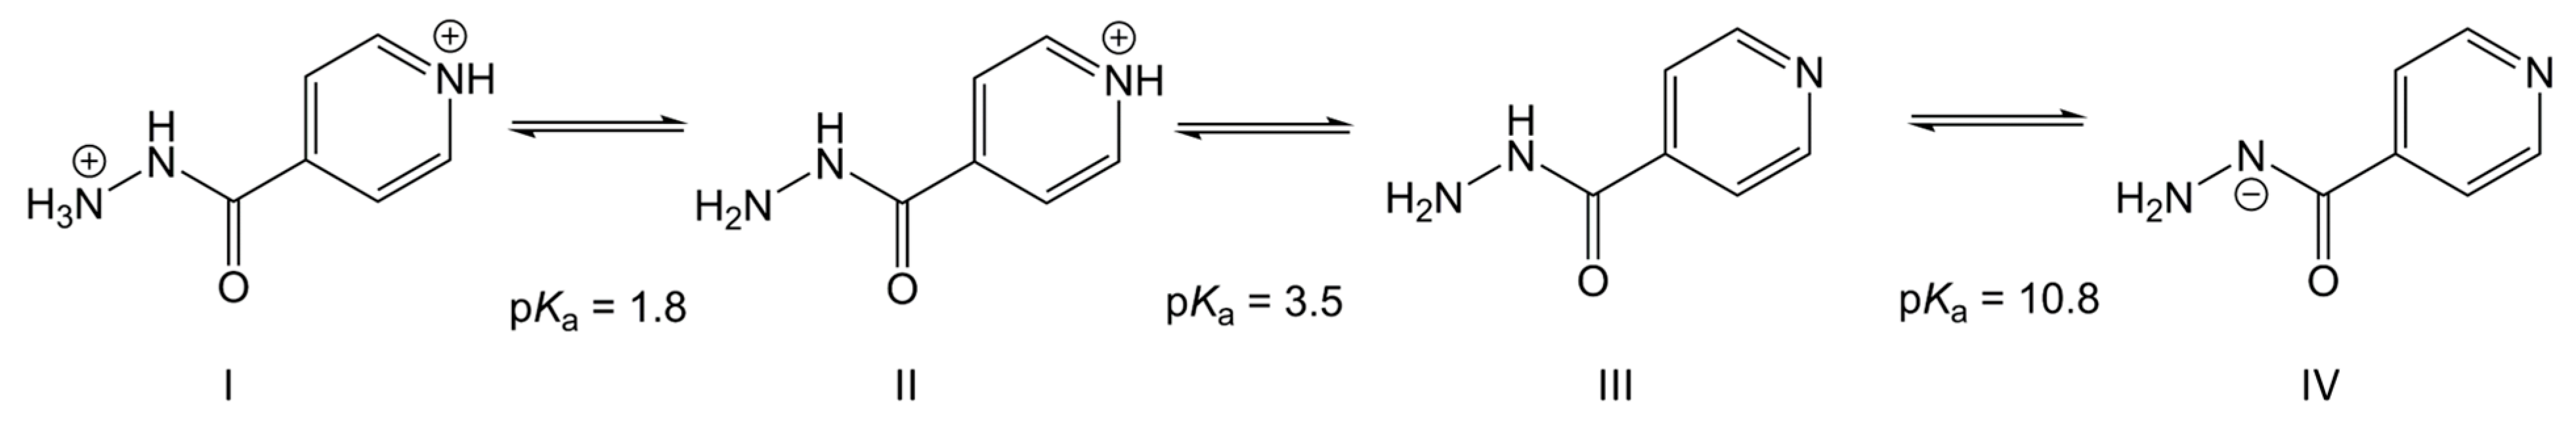
3.3.3. pH Variation Studies

Adsorption of organic compounds from aqueous solutions on activated carbons takes place mainly due to the interactions between the functional groups present in the adsorbate structure and the groups present on the adsorbent surface. Therefore, the medium pH directly influences the adsorption capacity of the carbons.
The influence of pH on isoniazid adsorption on the different carbons evaluated is illustrated in Figure 4. The distribution of chemical species of isoniazid according to the pH of the solution can be seen in Figure 5.
It can be seen in Figure 4 that changes in the pH of the medium cause significant changes in the adsorption of isoniazid by the materials BAC, CAC, and AAC.
The pHPZC determines the presence of charge at the carbon surface according to the solution pH since it represents the pH of the solution at which the net surface charge is neutral. At pH below this value, the carbon surface has an overall positive charge, while at a pH higher than the pHPZC, the material surface becomes negatively charged [61]. Therefore, throughout the evaluated pH range, activated carbons have a negative charge at their surface (Figure 2).
On the other hand, isoniazid has three ionization sites, with pKa 1.8; and pKa 3.5 referring to the protonation of the terminal nitrogen of the hydrazide and the pyridine ring, respectively. The pKa 10.8 is equivalent to the deprotonation of the secondary nitrogen of the hydrazide group. The concentration of conjugate depends on the solution pH and can be estimated by the Henderson-Hasselbalch equation [62].
All the activated carbons exhibited the highest isoniazid adsorption at pH 4.0, in which isoniazid is predominantly (76%) as the specie III, its neutral form; while 24% of the isoniazid is in its protonated form (II), presenting a positive charge. The presence of isoniazid in its cationic form (II) favors electrostatic interactions with activated carbons, which have negative charges on their surface.
At pH 6 and 8, isoniazid is present almost totally (99–100%) in its neutral form (III), and the adsorption takes place mainly due to other mechanisms, which do not include electrostatic interactions, such as the formation of hydrogen bonds and dispersive interactions by π electrons.
On the other hand, at pH 10 and 12, part of isoniazid molecules begins to present itself in the anionic form (IV), corresponding to 14% and 94% of their composition, respectively. The presence (pH 10) and increase in concentration (pH 12) of isoniazid in its anionic form impair the adsorption process of this pharmaceutical due to electrostatic repulsions between the activated carbon and the isoniazid, as shown in Figure 4.
However, other forms of interaction between adsorbate and adsorbent may be present in addition to electrostatic interactions. The higher adsorptive capacity of AAC concerning BC is possibly due to its greater ability to perform not only electrostatic interactions but also dipole-dipole interactions and hydrogen bonds due to the greater amount of oxygenated functional groups present in this material. In CAC and BAC, besides the interactions mentioned above, the increase in surface area increases the number of interactions between delocalized π electrons in the carbon basal planes and the aromatic rings in the adsorptive molecules.
Adsorption can also occur by the formation of covalent bonds, as the carbonyl group of the isoniazid molecule could serve as a target for a nucleophile and the amino group of the molecule can be a nucleophile [63]. Charcoal also can be a nucleophile or electrophile, depending on the reaction conditions. CAC, AAC, and BC are negatively charged under the reaction conditions used and their free electrons will attack the isoniazid carbonyl group, forming covalent bonds through carbonyl addition reactions [64].
As for BC, the dependence of adsorption on pH was less relevant, which may be related to the few oxygenated groups on its surface, making electrostatic interactions less relevant for the adsorption of isoniazid. Thus, adsorption in this material may occur predominantly through the formation of covalent bonds, which would corroborate the kinetic data that show that adsorption at the active site is limiting for the process. At pH values lower than 8.47, the covalent bond formation will occur with the material serving as an electrophile. On the other hand, at pH values greater than 8.47, the material will be the nucleophile of the reaction.

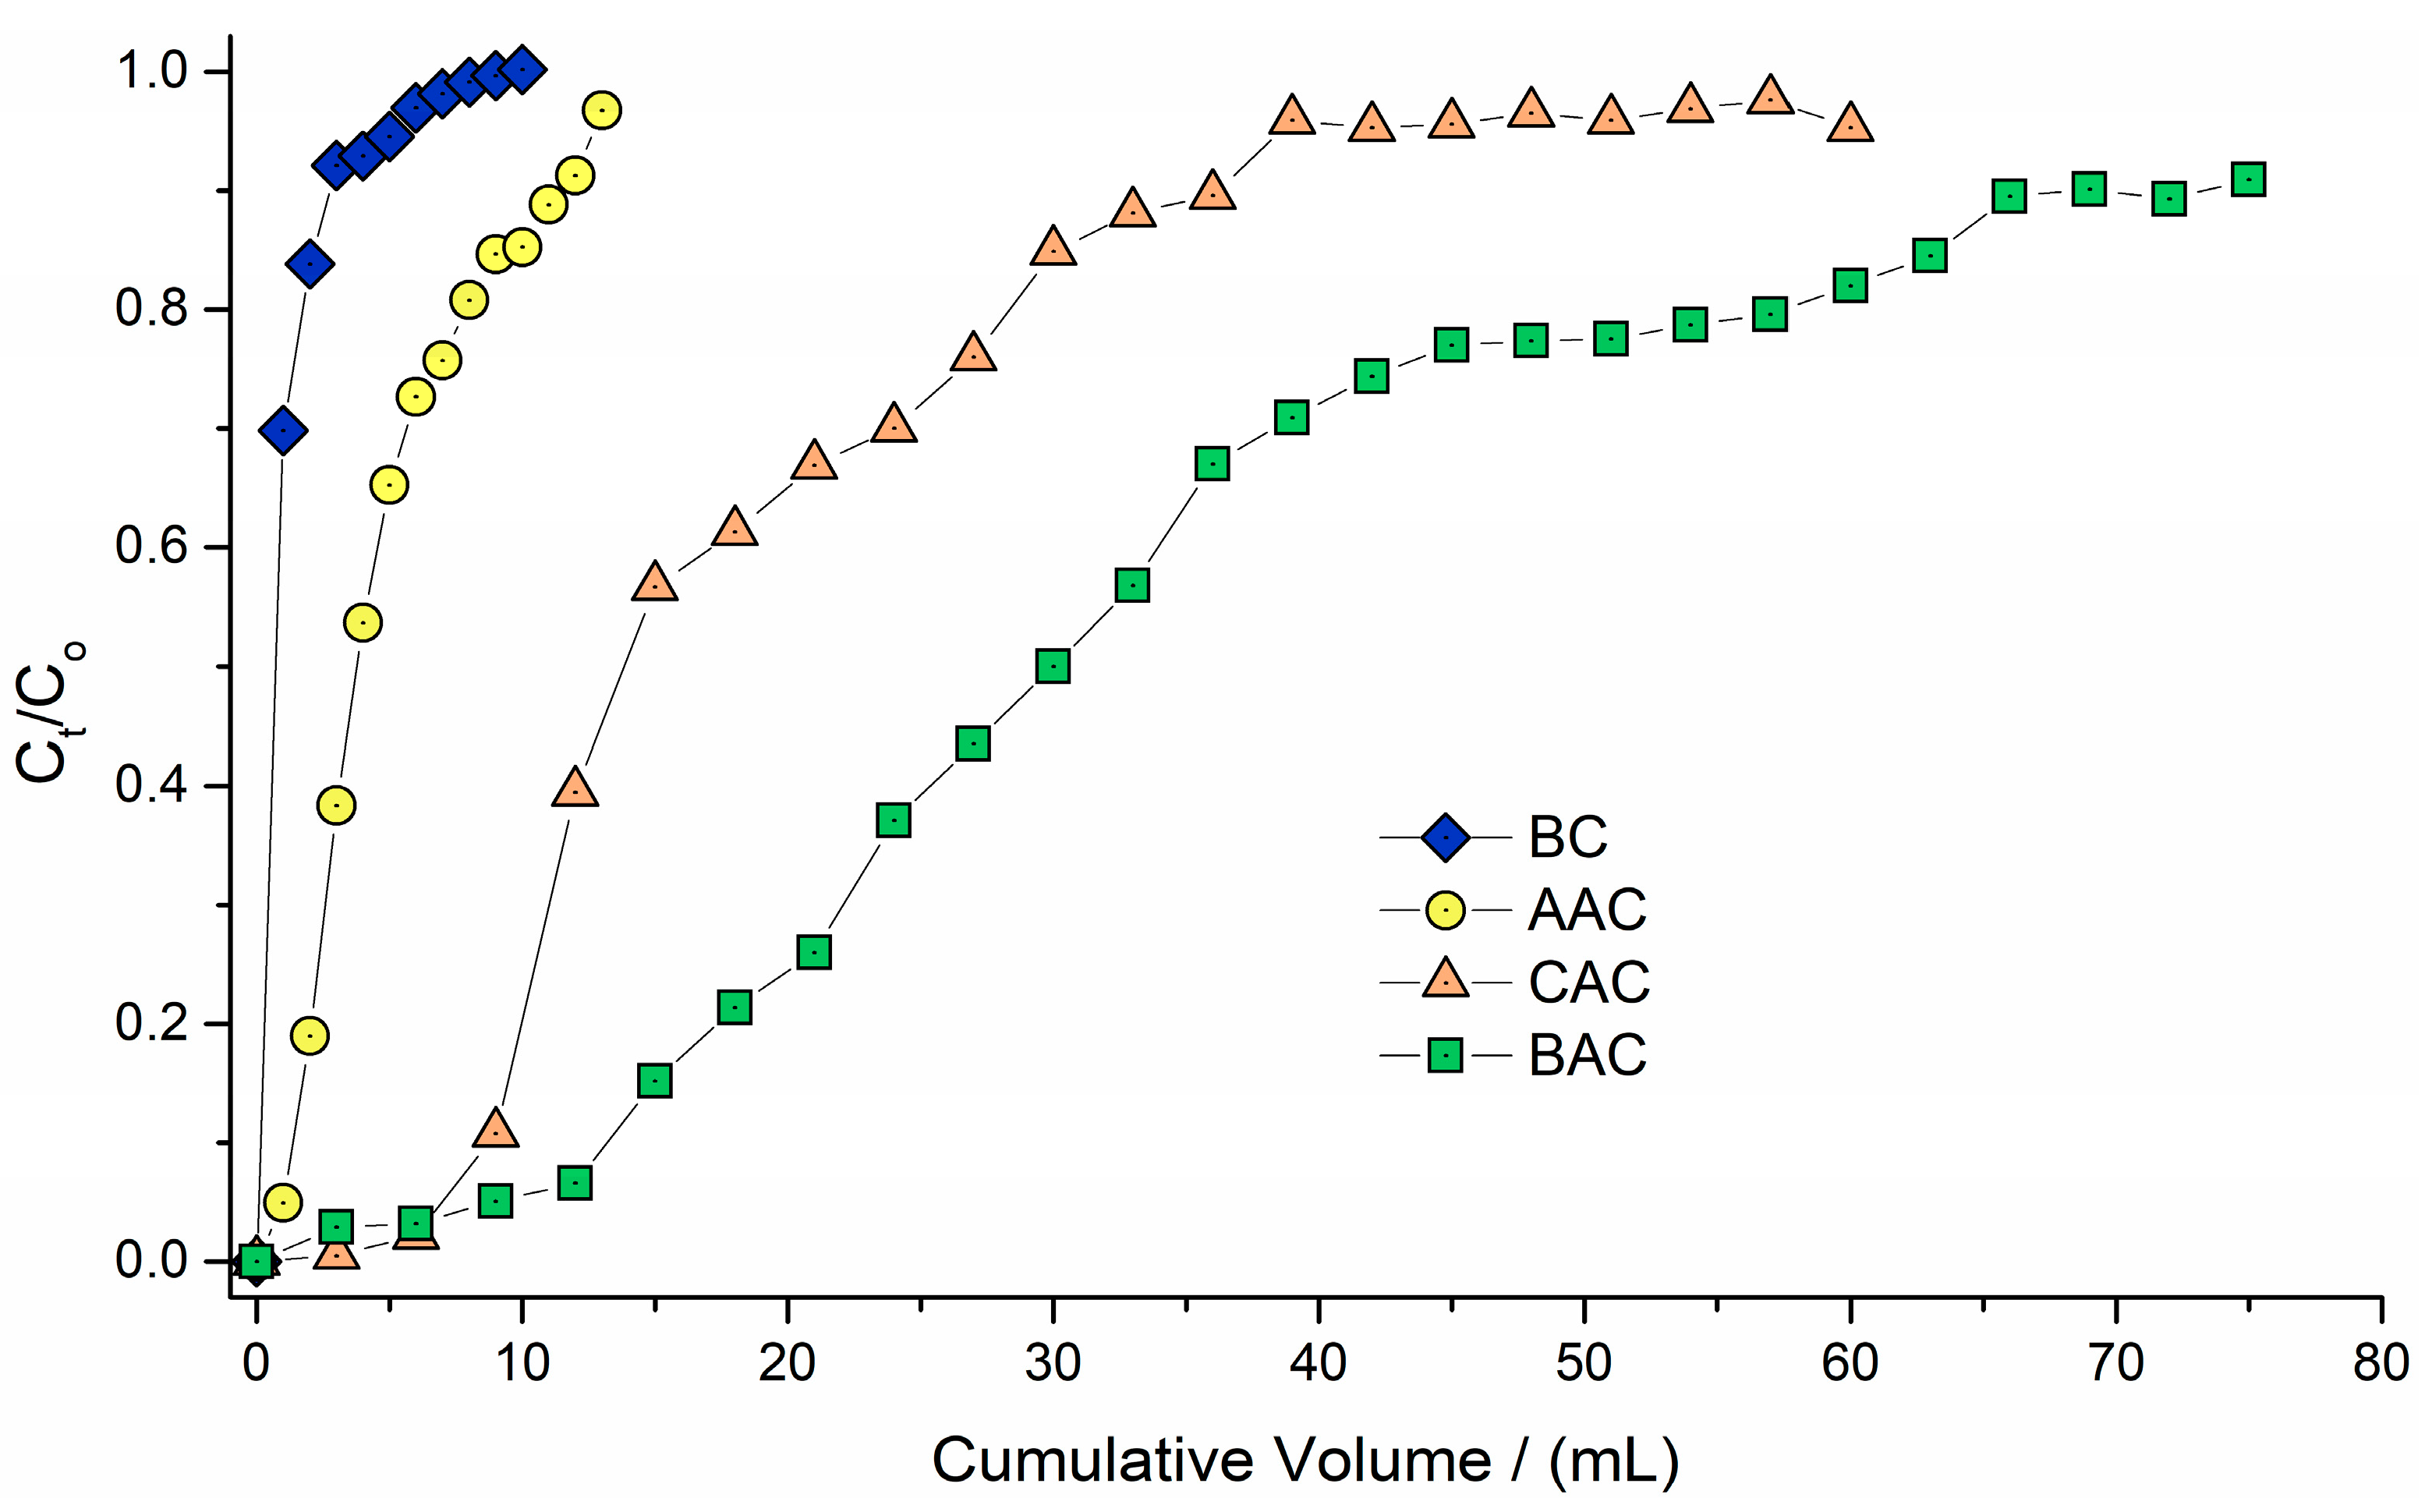
3.4. Fixed Bed Adsorption Studies

The results of the adsorption tests in the fixed bed system can be seen in Figure 6.
Figure 6 shows the adsorption in the fixed bed system exhibited the same trends observed in the batch tests, with BAC being the most efficient material in the removal of isoniazid. In this way, the fast kinetics of the material allows it to be used in both adsorption systems since even in a shorter time of contact with the drug, its removal capacity remains considerable. Table 6 presents the parameters obtained by the models and their respective coefficients of determination.
The Yoon-Nelson model is the simplest, as it does not require the characteristics of the adsorbent and the fixed bed column. Through this model, it is possible to calculate the time required to reach 50% of the initial concentration of the drug in the effluent [65]. Analyzing these values in Table 6 it can be seen that the column packed with BAC remains operational for longer.
The Thomas model is based on the Langmuir isotherm and the pseudo-second-order kinetic model. It is suitable for processes in which internal and external diffusion are negligible and it is useful to calculate the maximum adsorptive capacity of materials in the fixed bed adsorption system [65]. The qt values corroborate what was seen previously since BAC has the highest value, followed by CAC, AAC, and BC.
The Yan model is similar to the Thomas model, however, in some cases, it minimizes the errors associated with the Thomas model, particularly in very short or long operational times [66]. This model presented the best values of R2adj and the smallest ∆Qmax. Therefore, the values estimated by the Yan model are closer to reality.

3.5. Desorption and Regeneration Studies
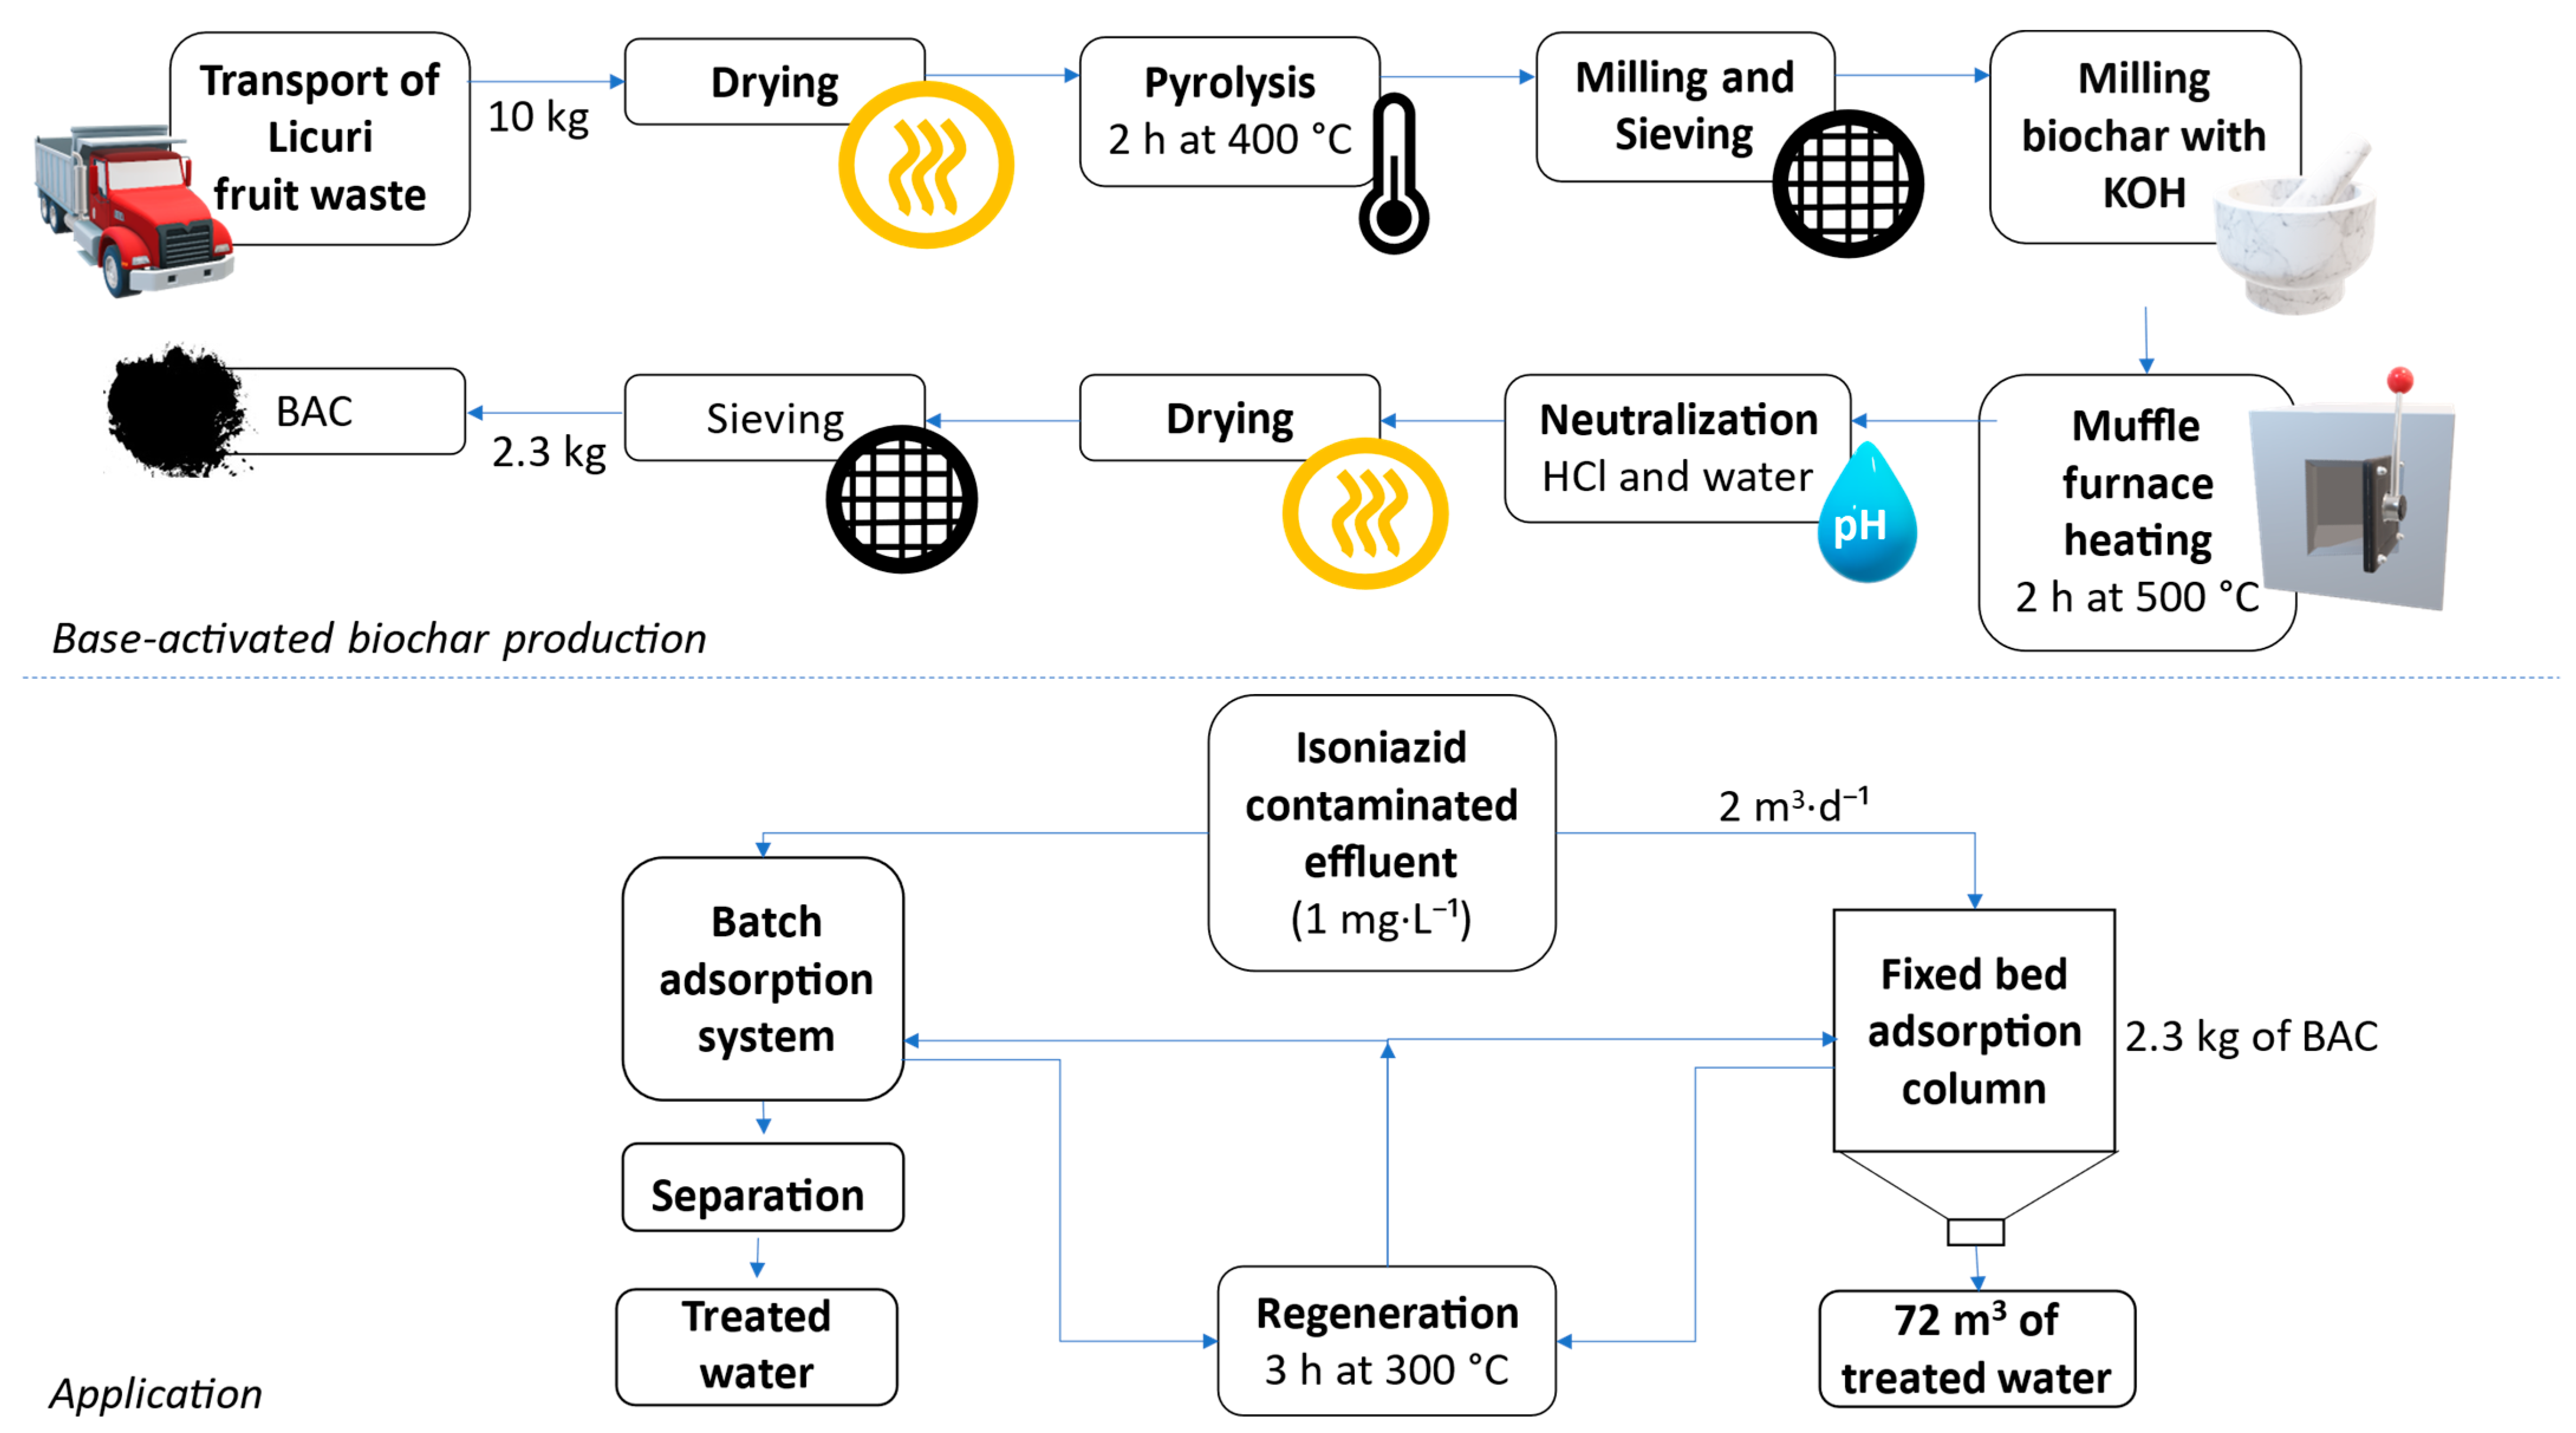
The reusability of the material is an important aspect of its application. Reactivation/regeneration of biochar allows its reuse for several cycles, reducing the operational and running cost of the wastewater treatment process. Besides, the regeneration process avoids biochar burning or its deposition in the environment, introducing another problem. Several regeneration techniques have been proposed to evaluate the potential reuse of new adsorbents, which can be classified as desorption and decomposition processes.
Regeneration by decomposition involves mineralizing the adsorbed pollutants or their transformation into less toxic compounds. Decomposition methods include oxidation using high thermal energy, so considered a thermal decomposition approach, restoring the adsorption capacity of the biochar [61].
Desorption regeneration methods depend on breaking the bonds/interaction between the biochar surface and the adsorbate by thermal or non-thermal methods. Chemical regeneration, a non-thermal desorption method, is one of the most investigated approaches to regenerating adsorbents. It depends mainly on adsorbate concentration and the adsorbate-adsorbent interaction forces. In this approach, chemical agents, such as solvents and chemical reagents, are employed to desorb the adsorbate from the biochar surface [61].
Therefore, an initial evaluation of the BAC regeneration potential was made by studying the isoniazid desorption by chemical regeneration, using three different solvents, and by decomposition, using thermal oxidation. The results are shown in Table 7.
The data obtained by the evaluation of one desorption cycle showed that methanol is the best solvent for isoniazid extraction, with a desorption efficiency of 38.8%. Ethanol and basic water were less promising, with efficiencies of 18.3% and 17.6%, respectively. These results are compatible with other desorption yields for different biochars described in the literature [61,67].
On the other hand, regeneration by thermal oxidation was more satisfactory, as 67% of the material original adsorption efficiency was recovered at 300 °C. The use of high temperatures can recover the adsorptive capacity of activated carbon through the oxidation of the adsorbed isoniazid or through the further oxidation of the carbon surface. Therefore, the regeneration temperature was increased to 400 °C to improve the efficiency of the process. However, at this temperature, the material turned to ash.

3.6. Applicability

Activated carbon is a highly efficient material in removing contaminants from water. However, its extensive use is limited due to the high cost of production. Thus, the use of licuri waste as raw material is a way to make production economically accessible. The yield of biochar production is an important aspect when considering its use under real conditions. As shown in, Table 8, the pyrolysis of 10 kg of licuri coconut husk results in the production of 3.6 kg of biochar (BC), which is comparable to other studies present in the literature [68]. Then, the biochar produced is activated with KOH, resulting in the production of 2.3 kg of BAC, but this value could be increased by further optimizing the production process.
In addition, material efficiency must also be considered. Table 9 compares the maximum adsorption capacity of isoniazid by BAC with other materials present in the literature. It can be noted that the material produced in this work is considerably better in removing the drug.
The laboratory scale data were used to simulate the performance of a large-scale column using the Yan model [74]. For this, the values of qy and ay obtained in the fixed-bed tests were fixed while the mass of BAC present in the adsorption column and the water flow were altered. We simulated a large-scale adsorption column containing 2.3 kg of BAC and that the effluent contaminated with isoniazid in a concentration of 60 mg·L−1 would pass through the column with a flow rate of 2 m3·d−1.
In this way, the adsorption column would be operable for about 14.63 h before reaching the breaking point (Ct/C0 = 0.05). That way, 1.22 m3 of wastewater could be treated. However, it should be considered that the concentration of isoniazid used in this study is much higher than the concentration of the drug that would be found in waterbodies under real conditions. The presence of isoniazid in effluents was reported in nanogram-scale concentrations [8].
The same calculation was made by changing the concentration of isoniazid present in the effluent to 1 mg·L−1. In this condition, the adsorption column would function for 36 days and treat 72 m3 of water until it reached the breaking point. This indicates that the material developed in this study has a great potential for applicability (Figure 7), although further studies are needed in this sense, since this is but a simple estimation, not considering the full complexity of a scale-up operation.

4. Conclusions

Licuri pericarp waste was used as feedstock to produce biochar (BC) and chemically-activated biochars (BAC and AAC). All the materials were characterized and used to remove isoniazid from aqueous solutions. KOH-activated biochar (BAC) is a highly functionalized microporous material with great surface area (1006 m2·g−1) and high adsorption capacity for isoniazid (712.42 mg·g−1). To the best of our knowledge, BAC has outperformed every other adsorbent tested for isoniazid adsorption. Adsorption kinetics of isoniazid on BAC followed the pseudo-first order model, while the equilibrium was best represented by the Freundlich model. The comparison with BC, AAC and CAC indicated that both the surface chemistry, acidity, and surface area play an important role at the adsorption for isoniazid. Fixed-bed adsorption studies the high potential of BAC-containing columns to remove isoniazid from aqueous solutions during extended operational times. Using the approach presented herein, it is possible to produce a highly functionalized microporous adsorbent from licuri pericarp waste to remove isoniazid from aqueous solutions.

Author Contributions

Conceptualization, B.S.P., M.C.d.C.V. and M.C.d.M.; methodology, B.S.P. and M.C.d.M.; investigation, B.S.P., L.S.d.O.M. and P.C.O.d.O.; formal analysis, B.S.P. and L.S.d.O.M.; resources, M.C.d.C.V., G.A.R. and M.C.d.M.; writing—original draft preparation, B.S.P., L.S.d.O.M. and P.C.O.d.O.; writing—review and editing, B.S.P., L.S.d.O.M., P.C.O.d.O., M.C.d.C.V., G.A.R. and M.C.d.M.; visualization, B.S.P. and L.S.d.O.M.; supervision, G.A.R. and M.C.d.M.; funding acquisition, M.C.d.M. All authors have read and agreed to the published version of the manuscript.

Funding

This study was financed in part by the National Council for Scientific and Technological Development (CNPq) and Coordenação de Aperfeiçoamento de Pessoal de Nível Superior—Brazil (CAPES) within the scope of the Capes-PrInt Program—Universidade Federal Fluminense—Financial Code 001, project numbers 88887.310269/2018-00; 88887.363009/2019-00; and 88887.571298/2020-00. M.C.d.M, B.S.P., and L.S.d.O.M. gratefully acknowledges Fundação Carlos Chagas Filho de Amparo à Pesquisa do Estado do Rio de Janeiro—FAPERJ (Grants E-26/200.584/2021; E26/010.000978/2019, E-26/200.285/2019, and SEI-260003/001167/2020).

Data Availability Statement

The data that support the findings of this study are available from the corresponding author upon reasonable request.

Acknowledgments

The authors wish to thank the staff members of the Multiuser Laboratory of Material Characterization for training and assistance pertaining to the MICROMERITICS ASAP 2020 porosimeter results included in this publication.

Conflicts of Interest

The authors declare no conflict of interest.

References

  1. Jurado, A.; Vàzquez-Suñé, E.; Carrera, J.; de Alda, M.L.; Pujades, E.; Barceló, D. Emerging Organic Contaminants in Groundwater in Spain: A Review of Sources, Recent Occurrence and Fate in a European Context. Sci. Total Environ. 2012, 440, 82–94. [Google Scholar] [CrossRef]
  2. Kapelewska, J.; Kotowska, U.; Karpińska, J.; Kowalczuk, D.; Arciszewska, A.; Świrydo, A. Occurrence, Removal, Mass Loading and Environmental Risk Assessment of Emerging Organic Contaminants in Leachates, Groundwaters and Wastewaters. Microchem. J. 2018, 137, 292–301. [Google Scholar] [CrossRef]
  3. Lapworth, D.J.; Baran, N.; Stuart, M.E.; Ward, R.S. Emerging Organic Contaminants in Groundwater: A Review of Sources, Fate and Occurrence. Environ. Pollut. 2012, 163, 287–303. [Google Scholar] [CrossRef] [Green Version]
  4. Abdallah, M.A.-E.; Nguyen, K.-H.; Ebele, A.J.; Atia, N.N.; Ali, H.R.H.; Harrad, S. A Single Run, Rapid Polarity Switching Method for Determination of 30 Pharmaceuticals and Personal Care Products in Waste Water Using Q-Exactive Orbitrap High Resolution Accurate Mass Spectrometry. J. Chromatogr. A 2019, 1588, 68–76. [Google Scholar] [CrossRef]
  5. de Santiago-Martín, A.; Meffe, R.; Teijón, G.; Hernández, V.M.; López-Heras, I.; Alonso, C.A.; Romasanta, M.A.; de Bustamante, I. Pharmaceuticals and Trace Metals in the Surface Water Used for Crop Irrigation: Risk to Health or Natural Attenuation? Sci. Total Environ. 2020, 705, 135825. [Google Scholar] [CrossRef]
  6. Mijangos, L.; Ziarrusta, H.; Ros, O.; Kortazar, L.; Fernández, L.A.; Olivares, M.; Zuloaga, O.; Prieto, A.; Etxebarria, N. Occurrence of Emerging Pollutants in Estuaries of the Basque Country: Analysis of Sources and Distribution, and Assessment of the Environmental Risk. Water Res. 2018, 147, 152–163. [Google Scholar] [CrossRef]
  7. Reis, E.O.; Foureaux, A.F.S.; Rodrigues, J.S.; Moreira, V.R.; Lebron, Y.A.R.; Santos, L.V.S.; Amaral, M.C.S.; Lange, L.C. Occurrence, Removal and Seasonal Variation of Pharmaceuticals in Brasilian Drinking Water Treatment Plants. Environ. Pollut. 2019, 250, 773–781. [Google Scholar] [CrossRef]
  8. Mhuka, V.; Dube, S.; Nindi, M.M. Occurrence of Pharmaceutical and Personal Care Products (PPCPs) in Wastewater and Receiving Waters in South Africa Using LC-OrbitrapTM MS. Emerg. Contam. 2020, 6, 250–258. [Google Scholar] [CrossRef]
  9. Borrull, J.; Colom, A.; Fabregas, J.; Borrull, F.; Pocurull, E. Presence, Behaviour and Removal of Selected Organic Micropollutants through Drinking Water Treatment. Chemosphere 2021, 276, 130023. [Google Scholar] [CrossRef]
  10. Ahmed, M.B.; Zhou, J.L.; Ngo, H.H.; Guo, W. Adsorptive Removal of Antibiotics from Water and Wastewater: Progress and Challenges. Sci. Total Environ. 2015, 532, 112–126. [Google Scholar] [CrossRef]
  11. Sophia, A.C.; Lima, E.C. Removal of Emerging Contaminants from the Environment by Adsorption. Ecotoxicol. Environ. Saf. 2018, 150, 1–17. [Google Scholar] [CrossRef]
  12. Watkinson, A.J.; Murby, E.J.; Costanzo, S.D. Removal of Antibiotics in Conventional and Advanced Wastewater Treatment: Implications for Environmental Discharge and Wastewater Recycling. Water Res. 2007, 41, 4164–4176. [Google Scholar] [CrossRef]
  13. Purkaystha, J.; Prasher, S.; Afzal, M.T.; Nzediegwu, C.; Dhiman, J. Wheat Straw Biochar Amendment Significantly Reduces Nutrient Leaching and Increases Green Pepper Yield in a Less Fertile Soil. Environ. Technol. Innov. 2022, 28, 102655. [Google Scholar] [CrossRef]
  14. Shi, D.; Yek, P.N.Y.; Ge, S.; Shi, Y.; Liew, R.K.; Peng, W.; Sonne, C.; Tabatabaei, M.; Aghbashlo, M.; Lam, S.S. Production of Highly Porous Biochar via Microwave Physiochemical Activation for Dechlorination in Water Treatment. Chemosphere 2022, 309, 136624. [Google Scholar] [CrossRef]
  15. Madriaga, V.G.C.; Mattos, J.P.R.; Rossa, V.; Ferreira, L.E.M.; Vasconcelos, S.C.; Silva, D.S.A.; Rocha, P.S.M.; dos Santos, R.D.; Silva, L.P.C.; Araujo, J.R.; et al. Metal-Contaminated Biochars as Cheap and More Sustainable Catalysts for Furfural Conversion to Value-Added Compounds. Mol. Catal. 2022, 531, 112692. [Google Scholar] [CrossRef]
  16. Seow, Y.X.; Tan, Y.H.; Mubarak, N.M.; Kansedo, J.; Khalid, M.; Ibrahim, M.L.; Ghasemi, M. A Review on Biochar Production from Different Biomass Wastes by Recent Carbonization Technologies and Its Sustainable Applications. J. Environ. Chem. Eng. 2022, 10, 107017. [Google Scholar] [CrossRef]
  17. Binda, G.; Faccini, D.; Zava, M.; Pozzi, A.; Dossi, C.; Monticelli, D.; Spanu, D. Exploring the Adsorption of Pb on Microalgae-Derived Biochar: A Versatile Material for Environmental Remediation and Electroanalytical Applications. Chemosensors 2022, 10, 168. [Google Scholar] [CrossRef]
  18. Han, R.; Fang, Y.; Sun, P.; Xie, K.; Zhai, Z.; Liu, H.; Liu, H. N-Doped Biochar as a New Metal-Free Activator of Peroxymonosulfate for Singlet Oxygen-Dominated Catalytic Degradation of Acid Orange 7. Nanomaterials 2021, 11, 2288. [Google Scholar] [CrossRef]
  19. Sakhiya, A.K.; Anand, A.; Kaushal, P. Production, Activation, and Applications of Biochar in Recent Times. Biochar 2020, 2, 253–285. [Google Scholar] [CrossRef]
  20. Araújo, P.H.M.; Maia, A.S.; Cordeiro, A.M.T.M.; Gondim, A.D.; Santos, N.A. Catalytic Deoxygenation of the Oil and Biodiesel of Licuri (Syagrus coronata) To Obtain n-Alkanes with Chains in the Range of Biojet Fuels. ACS Omega 2019, 4, 15849–15855. [Google Scholar] [CrossRef]
  21. Crepaldi, I.C.; Almeida-Muradian, L.B.D.; Rios, M.D.G.; Penteado, M.D.V.C.; Salatino, A. Composição Nutricional Do Fruto de Licuri (Syagrus coronata (Martius) Beccari). Rev. Bras. Bot. 2001, 24, 155–159. [Google Scholar] [CrossRef] [Green Version]
  22. dos Santos, B.S.; Filho, C.M.B.; Junior, J.A.A.D.N.; Brust, F.R.; Bezerra-Silva, P.C.; da Rocha, S.K.L.; Krogfelt, K.A.; Navarro, D.M.D.A.F.; Correia, M.T.D.S.; Napoleão, T.H.; et al. Anti-Staphylococcal Activity of Syagrus coronata Essential Oil: Biofilm Eradication and in Vivo Action on Galleria mellonela Infection Model. Microb. Pathog. 2019, 131, 150–157. [Google Scholar] [CrossRef]
  23. Aroucha, E.P.T.L.; Aroucha, M.L. Boas Práticas de Manejo para o Extrativismo Sustentável do Licuri; Instituto Sociedade, População e Natureza: Brasília, DF, Brazil, 2013; p. 92. Available online: https://ispn.org.br/licuri-boas-praticas-de-manejo-para-o-extrativismo-sustentavel/ (accessed on 25 October 2022).
  24. Sluiter, A.; Ruiz, R.; Scarlata, C.; Sluiter, J.; Templeton, D. Determination of Extractives in Biomass. NREL Technical Report, NREL/TP-210-42619, 2008, pp. 1–12. Available online: https://www.nrel.gov/docs/gen/fy08/42619.pdf (accessed on 27 October 2022).
  25. Sluiter, A.; Hames, B.; Ruiz, R.; Scarlata, C.; Sluiter, J.; Templeton, D. Determination of Ash in Biomass. NREL Technical Report, NREL/TP-510-42622, 2008, pp. 1–8. Available online: https://www.nrel.gov/docs/gen/fy08/42622.pdf (accessed on 27 October 2022).
  26. Sluiter, A.; Hames, B.; Ruiz, R.; Scarlata, C.; Sluiter, J.; Templeton, D.; Crocker, D. Determination of Structural Carbohydrates and Lignin in Biomass. NREL Technical Report, NREL/TP-510-42618, 2012, pp. 1–18. Available online: https://www.nrel.gov/docs/gen/fy13/42618.pdf (accessed on 27 October 2022).
  27. Al-Qodah, Z.; Shawabkah, R. Production and Characterization of Granular Activated Carbon from Activated Sludge. Braz. J. Chem. Eng. 2009, 26, 127–136. [Google Scholar] [CrossRef] [Green Version]
  28. Silva, R.V.S.; Gonçalves, A.D.; Vinhal, J.O.; Cassella, R.J.; Santos, R.C.; Sasso, M.A.D.; Peixoto, B.S.; Borba-Santos, L.P.; Rozental, S.; Azevedo, D.A.; et al. Bioproducts from the Pyrolysis of Castor Seed Cake: Basic Dye Adsorption Capacity of Biochar and Antifungal Activity of the Aqueous Phase. J. Environ. Chem. Eng. 2021, 9, 104825. [Google Scholar] [CrossRef]
  29. Ahmadpour, A.; Do, D.D. The Preparation of Activated Carbon from Macadamia Nutshell by Chemical Activation. Carbon 1997, 35, 1723–1732. [Google Scholar] [CrossRef]
  30. Dehkhoda, A.M.; Gyenge, E.; Ellis, N. A Novel Method to Tailor the Porous Structure of KOH-Activated Biochar and Its Application in Capacitive Deionization and Energy Storage. Biomass Bioenergy 2016, 87, 107–121. [Google Scholar] [CrossRef] [Green Version]
  31. Brunauer, S.; Emmett, P.H.; Teller, E. Adsorption of Gases in Multimolecular Layers. J. Am. Chem. Soc. 1938, 60, 309–319. [Google Scholar] [CrossRef]
  32. Barrett, E.P.; Joyner, L.G.; Halenda, P.P. The Determination of Pore Volume and Area Distributions in Porous Substances. I. Computations from Nitrogen Isotherms. J. Am. Chem. Soc. 1951, 73, 373–380. [Google Scholar] [CrossRef]
  33. Lippens, B. Studies on Pore Systems in Catalysts V. The t Method. J. Catal. 1965, 4, 319–323. [Google Scholar] [CrossRef]
  34. Boehm, H.P. Surface Oxides on Carbon and Their Analysis: A Critical Assessment. Carbon 2002, 40, 145–149. [Google Scholar] [CrossRef]
  35. Schönherr, J.; Buchheim, J.; Scholz, P.; Adelhelm, P. Boehm Titration Revisited (Part I): Practical Aspects for Achieving a High Precision in Quantifying Oxygen-Containing Surface Groups on Carbon Materials. C 2018, 4, 21. [Google Scholar] [CrossRef] [Green Version]
  36. Prahas, D.; Kartika, Y.; Indraswati, N.; Ismadji, S. Activated Carbon from Jackfruit Peel Waste by H3PO4 Chemical Activation: Pore Structure and Surface Chemistry Characterization. Chem. Eng. J. 2008, 140, 32–42. [Google Scholar] [CrossRef]
  37. Lagergren, S.K. About the Theory of So-Called Adsorption of Soluble Substances. Sven. Vetenskapsakad. Handingarl 1898, 24, 1–39. [Google Scholar]
  38. Blanchard, G.; Maunaye, M.; Martin, G. Removal of Heavy Metals from Waters by Means of Natural Zeolites. Water Res. 1984, 18, 1501–1507. [Google Scholar] [CrossRef]
  39. Langmuir, I. The adsorption of gases on plane surfaces of glass, mica and platinum. J. Am. Chem. Soc. 1918, 40, 1361–1403. [Google Scholar] [CrossRef] [Green Version]
  40. Freundlich, H. Über Die Adsorption in Lösungen. Z. Phys. Chem. 1907, 57, 385–470. [Google Scholar] [CrossRef]
  41. Sips, R. On the Structure of a Catalyst Surface. J. Chem. Phys. 1948, 16, 490–495. [Google Scholar] [CrossRef]
  42. Thomas, H.C. Heterogeneous Ion Exchange in a Flowing System. J. Am. Chem. Soc. 1944, 66, 1664–1666. [Google Scholar] [CrossRef]
  43. Yoon, Y.H.; Nelson, J.H. Application of Gas Adsorption Kinetics I. A Theoretical Model for Respirator Cartridge Service Life. Am. Ind. Hyg. Assoc. J. 1984, 45, 509–516. [Google Scholar] [CrossRef]
  44. Yan, G.; Viraraghavan, T.; Chen, M. A New Model for Heavy Metal Removal in a Biosorption Column. Adsorpt. Sci. Technol. 2001, 19, 25–43. [Google Scholar] [CrossRef]
  45. Fernandes, C.M.; de Oliveira, P.C.O.; Pina, V.G.S.S.; Peixoto, B.S.; Massante, F.F.; Veloso, M.C.C.; Romeiro, G.A.; de Moraes, M.C.; Ponzio, E.A. Pyrolysis of Syagrus coronata: Transforming Agroindustrial Waste into a New Environmentally Sustainable Corrosion Inhibitor. Sustain. Chem. Pharm. 2022, 29, 100751. [Google Scholar] [CrossRef]
  46. Mattos, C.; Andrade, J.; Oliveira, P.C.O.; Veloso, M.C.C.; Romeiro, G.A.; das Chagas, E.F. Fumigant Activity of Pyrolysis Fractions Derived from Waste Licuri’s Pericarp (Syagrus coronata—Arecaceae) in the Control the Red Flour Beetle Tribolium Castaneum (Herbst) (Coleoptera: Tenebrionidae). Environ. Chall. 2021, 5, 100294. [Google Scholar] [CrossRef]
  47. Hassan, M.; Liu, Y.; Naidu, R.; Parikh, S.J.; Du, J.; Qi, F.; Willett, I.R. Influences of Feedstock Sources and Pyrolysis Temperature on the Properties of Biochar and Functionality as Adsorbents: A Meta-Analysis. Sci. Total Environ. 2020, 744, 140714. [Google Scholar] [CrossRef]
  48. Bartoli, M.; Giorcelli, M.; Jagdale, P.; Rovere, M.; Tagliaferro, A. A Review of Non-Soil Biochar Applications. Materials 2020, 13, 261. [Google Scholar] [CrossRef] [PubMed] [Green Version]
  49. Cha, J.S.; Park, S.H.; Jung, S.-C.; Ryu, C.; Jeon, J.-K.; Shin, M.-C.; Park, Y.-K. Production and Utilization of Biochar: A Review. J. Ind. Eng. Chem. 2016, 40, 1–15. [Google Scholar] [CrossRef]
  50. Srivastava, A.; Gupta, B.; Majumder, A.; Gupta, A.K.; Nimbhorkar, S.K. A Comprehensive Review on the Synthesis, Performance, Modifications, and Regeneration of Activated Carbon for the Adsorptive Removal of Various Water Pollutants. J. Environ. Chem. Eng. 2021, 9, 106177. [Google Scholar] [CrossRef]
  51. Yang, T.; Lua, A.C. Characteristics of Activated Carbons Prepared from Pistachio-Nut Shells by Potassium Hydroxide Activation. Microporous Mesoporous Mater. 2003, 63, 113–124. [Google Scholar] [CrossRef]
  52. Guo, J.; Xu, W.S.; Chen, Y.L.; Lua, A.C. Adsorption of NH3 onto Activated Carbon Prepared from Palm Shells Impregnated with H2SO4. J. Colloid Interface Sci. 2005, 281, 285–290. [Google Scholar] [CrossRef]
  53. Shao, L.; Sang, Y.; Liu, N.; Liu, J.; Zhan, P.; Huang, J.; Chen, J. Selectable Microporous Carbons Derived from Poplar Wood by Three Preparation Routes for CO2 Capture. ACS Omega 2020, 5, 17450–17462. [Google Scholar] [CrossRef]
  54. Torrellas, S.Á.; Lovera, R.G.; Escalona, N.; Sepúlveda, C.; Sotelo, J.L.; García, J. Chemical-Activated Carbons from Peach Stones for the Adsorption of Emerging Contaminants in Aqueous Solutions. Chem. Eng. J. 2015, 279, 788–798. [Google Scholar] [CrossRef]
  55. Revellame, E.D.; Fortela, D.L.; Sharp, W.; Hernandez, R.; Zappi, M.E. Adsorption Kinetic Modeling Using Pseudo-First Order and Pseudo-Second Order Rate Laws: A Review. Clean. Eng. Technol. 2020, 1, 100032. [Google Scholar] [CrossRef]
  56. Wang, J.; Guo, X. Adsorption Kinetic Models: Physical Meanings, Applications, and Solving Methods. J. Hazard. Mater. 2020, 390, 122156. [Google Scholar] [CrossRef] [PubMed]
  57. Bedia, J.; Peñas-Garzón, M.; Gómez-Avilés, A.; Rodriguez, J.; Belver, C. A Review on the Synthesis and Characterization of Biomass-Derived Carbons for Adsorption of Emerging Contaminants from Water. C—J. Carbon Res. 2018, 4, 63. [Google Scholar] [CrossRef] [Green Version]
  58. Fungaro, D.A.; Bruno, M. Remoção de azul de metileno de solução aquosa usando zeólitas sintetizadas com amostras de cinzas de carvão diferentes. Quím. Nova 2009, 32, 955–959. [Google Scholar] [CrossRef]
  59. Liu, S. Cooperative Adsorption on Solid Surfaces. J. Colloid Interface Sci. 2015, 450, 224–238. [Google Scholar] [CrossRef] [PubMed]
  60. Portinho, R.; Zanella, O.; Féris, L.A. Grape Stalk Application for Caffeine Removal through Adsorption. J. Environ. Manag. 2017, 202, 178–187. [Google Scholar] [CrossRef]
  61. Alsawy, T.; Rashad, E.; El-Qelish, M.; Mohammed, R.H. A Comprehensive Review on the Chemical Regeneration of Biochar Adsorbent for Sustainable Wastewater Treatment. NPJ Clean Water 2022, 5, 29. [Google Scholar] [CrossRef]
  62. Aronson, J.N. The Henderson-Hasselbalch Equation Revisited. Biochem. Educ. 1983, 11, 68. [Google Scholar] [CrossRef]
  63. Lorand, L.; Campbell, L.K.; Robertson, B.J. Enzymic Coupling of Isoniazid to Proteins. Biochemistry 1972, 11, 434–438. [Google Scholar] [CrossRef]
  64. Bernal, V.; Erto, A.; Giraldo, L.; Moreno-Piraján, J. Effect of Solution pH on the Adsorption of Paracetamol on Chemically Modified Activated Carbons. Molecules 2017, 22, 1032. [Google Scholar] [CrossRef]
  65. Sotelo, J.L.; Ovejero, G.; Rodríguez, A.; Álvarez, S.; García, J. Removal of Atenolol and Isoproturon in Aqueous Solutions by Adsorption in a Fixed-Bed Column. Ind. Eng. Chem. Res. 2012, 51, 5045–5055. [Google Scholar] [CrossRef]
  66. Chiavola, A.; D’Amato, E.; Baciocchi, R. Ion Exchange Treatment of Groundwater Contaminated by Arsenic in the Presence of Sulphate. Breakthrough Experiments and Modeling. Water Air Soil Pollut 2012, 223, 2373–2386. [Google Scholar] [CrossRef]
  67. Sayin, F.; Akar, S.T.; Akar, T. From Green Biowaste to Water Treatment Applications: Utilization of Modified New Biochar for the Efficient Removal of Ciprofloxacin. Sustain. Chem. Pharm. 2021, 24, 100522. [Google Scholar] [CrossRef]
  68. Manyà, J.J. Pyrolysis for Biochar Purposes: A Review to Establish Current Knowledge Gaps and Research Needs. Environ. Sci. Technol. 2012, 46, 7939–7954. [Google Scholar] [CrossRef] [PubMed]
  69. Salihi, E.Ç.; Aydın, E. Adsorptive Characteristics of Isoniazid on Powdered Activated Carbon: π–π Dispersion Interactions at the Solid–Solution Interface. J. Dispers. Sci. Technol. 2017, 38, 457–462. [Google Scholar] [CrossRef]
  70. Salihi, E.Ç.; Gündüz, Z.; Baştuğ, A.S. Fast Retention of Isoniazid on Organobentonite Prepared Using Green Chemistry Approach: Contribution of the π Interactions. Sep. Sci. Technol. 2019, 54, 2695–2705. [Google Scholar] [CrossRef]
  71. Fan, Y.; Zheng, C.; Hou, H. Preparation of Granular Activated Carbon and Its Mechanism in the Removal of Isoniazid, Sulfamethoxazole, Thiamphenicol, and Doxycycline from Aqueous Solution. Environ. Eng. Sci. 2019, 36, 1027–1040. [Google Scholar] [CrossRef]
  72. Dube, C.; Tandlich, R.; Wilhelmi, B. Adsorptive Removal of Ciprofloxacin and Isoniazid from Aqueous Solution. Nova Biotechnol. Chim. 2018, 17, 16–28. [Google Scholar] [CrossRef]
  73. Salihi, E.Ç.; Wang, J.; Kabacaoğlu, G.; Kırkulak, S.; Šiller, L. Graphene Oxide as a New Generation Adsorbent for the Removal of Antibiotics from Waters. Sep. Sci. Technol. 2021, 56, 453–461. [Google Scholar] [CrossRef]
  74. de Franco, M.A.E.; de Carvalho, C.B.; Bonetto, M.M.; Soares, R.; Féris, L.A. Diclofenac Removal from Water by Adsorption Using Activated Carbon in Batch Mode and Fixed-Bed Column: Isotherms, Thermodynamic Study and Breakthrough Curves Modeling. J. Clean. Prod. 2018, 181, 145–154. [Google Scholar] [CrossRef]
Figure 1. N2 adsorption isotherm of the materials.
Water 14 03525 g001
Figure 2. Boehm titration and PZC.
Water 14 03525 g002
Figure 3. Comparison between predicted values by Langmuir, Freundlich, and Sips isotherm models and experimental data for isoniazid adsorption onto (a) BAC, (b) CAC, (c) AAC, and (d) BC.
Water 14 03525 g003
Figure 4. Isoniazid adsorption capacity according to solution pH for (a) BC and AAC and (b) CAC and BAC. Conditions: temperature of 25 °C, residence time of 60 min, (a) 4 g·L−1 and (b) 1 g·L−1 of adsorbent, and (a) 60 mg·L−1 and (b) 200 mg·L−1 of isoniazid concentration.
Water 14 03525 g004
Figure 5. Distribution of chemical species of isoniazid at different pHs (IIV).
Water 14 03525 g005
Figure 6. Fixed bed adsorption results for the four adsorbents. Conditions: 60 mg·L−1 of isoniazid concentration at pH 6.8; 15 mg of adsorbent in a reactor diameter 5.31 mm; reactor volume of 1.3 cm3 and 6.11 mm of biochar column height, flow rate of 3 mL·min−1; and with solution aliquots collected every 60 s for CAC and BAC and every 20 s for AAC and BC.
Water 14 03525 g006
Figure 7. Potential applicability of BAC.
Water 14 03525 g007
Table 1. Summary of the materials evaluated in this study.
AcronymMaterial Description
BCBiochar prepared from the S. coronata fruit husks
AACBiochar BC treated with H2SO4 at 200 °C
BACActivated biochar from BC treated with KOH at 500 °C
CACCommercial activated carbon
Table 2. Mass distribution of macro components of S. coronata pericarp.
MaterialsBiomass Components (Dry Basis)
ExtractivesLigninHolocelluloseInsoluble Ash
S. coronata waste3.3% ± 1.3%35.9% ± 0.9%60.2% ± 2.7%0.6% ± 0.5%
Table 3. Results of the textural analysis of the four materials.
Textural AnalysisAdsorbent
BCAACBACCAC
SBET [m2·g−1]1361006745
P.V. [cm3·g−1]0.0080.0080.4360.673
P.D. [Å]4647042759
µP Area79%17%79%51%
µP Volume50%24%72%23%
Note: SBET: Specific Surface Area; P.V.: Pore Volume; P.D.: Pore Diameter; µP: micropore/total.
Table 4. Parameters of the kinetic models used in this study and respective determination coefficients for the four adsorbents.
BACCACAACBC
Pseudo-first order
R2adj0.93040.99600.99540.9854
qe [mg·g−1]80.5558.748.552.47
k1 [min−1]0.180.280.0891.30
Δqe3.41%0.18%2.38%33.20%
Pseudo-second order
R2adj0.91780.99570.99650.9772
qe [mg·g−1]96.3162.689.262.57
k2 [g·mg−1·min−1]0.00160.00440.0170.70
Δqe15.48%6.51%5.56%30.54%
Table 5. Parameters of adsorption isotherm models used in this study and respective determination coefficients for the four adsorbents.
BACCACAACBC
Langmuir
R2adj0.98580.99820.99810.8972
Qmax [mg·g−1]712.42136.0294.361,337,202
Kl [L·mg−1]0.000570.10.00539.6 × 10−8
Freundlich
R2adj0.99950.98590.99730.9984
Kf [mg·g−1·(mg·L−1]−1/n]15.6533.893.230.017
n1.733.911.970.75
Sips
R2adj0.99950.99860.99790.9978
Qmax [mg·g−1]728.05151.39125.2915,350.18
Ks [(L·mg−1)ms]7.6 × 10−57.2 × 10−22.8 × 10−33.4 × 10−5
ms0.610.790.811.33
Table 6. Parameters of the fixed bed adsorption models used in this study and respective determination coefficients for the four adsorbents.
ModelBACCACAACBC
Thomas
R2adj0.95920.94750.9490.9474
Kt [mL·min−1·mg−1]0.00490.00490.030.25
qt [mg·g−1]107.3657.0214.542.67
ΔQmax−2.20%−6.30%−10.80%−38.70%
Yan
R2adj0.99350.98560.99670.9979
qY [mg·g−1]98.8251.7712.671.87
aY2.532.692.051.42
ΔQmax5.90%3.50%3.50%2.80%
Yoon & Nelson
R2 adj0.95920.95570.9490.9474
Z [min]10.745.71.450.27
KYN [min−1]0.250.491.4812.54
Table 7. BAC preliminary regeneration studies.
ConditionEfficiency
Methanol38.8% (isoniazid desorption)
Ethanol18.3% (isoniazid desorption)
Basic water (pH 10)17.6% (isoniazid desorption)
300 °C67% (recovery of adsorption capacity)
400 °C0% (material decomposition)
Table 8. Performance of the BAC production process.
ProductMass
Licuri fruit husk10 kg
Condensable gases4 kg
Non-condensable gases2.4 kg
Biochar (BC)3.6 kg
Biochar + KOH14.4 kg
Activated carbon (BAC)2.3 kg
Table 9. Maximum adsorption capacity of isoniazid by some adsorbents described in the literature.
MaterialQmax [mg·g−1]Reference
BAC712.42This study
Powdered activated carbon169.49–178.57[69]
Bentonite21.10[70]
Organobentonite33.90
Granular activated carbon from the cornstalk27.0172[71]
Kaolinite0.824[72]
Perlite0.130
Talc2.481
Vermiculite0.099
Coal fly ash7.092
Graphene oxide13.89[73]
Publisher’s Note: MDPI stays neutral with regard to jurisdictional claims in published maps and institutional affiliations.

