Article

Assessment and Optimization of Water Resources Regulation for River Networks in the Tidal Plain—A Case Study of the Qingsong Area in Shanghai

Nanjing Hydraulic Research Institute, Nanjing 210029, China
*
Author to whom correspondence should be addressed.
Water 2022, 14(21), 3523; https://doi.org/10.3390/w14213523
Submission received: 8 October 2022 / Revised: 29 October 2022 / Accepted: 31 October 2022 / Published: 3 November 2022
(This article belongs to the Section Water Resources Management, Policy and Governance)

Abstract

:
The plain river network area has a developed economy, a large population, a complex water system, and weak hydrodynamics. In order to improve the hydrodynamic conditions of the plain river network area, clean water sources are introduced through water resources regulation to supplement the ecological water quantity of the river and effectively improve the water environment of the river. In this paper, the Qingsong area in Shanghai is used as the research object. Prototype observation, numerical simulation, and other methods are used to build a hydrodynamic mathematical model of the river network in the Qingsong area, evaluate the water resources regulation effect of the Qingsong area, and put forward two optimization schemes. The results indicate that the overall flow of the Qingsong area is from north to south and west to east, with a maximum flow of 10–68 m3/s in the north–south backbone, exchange cycle between the backbone river, and the peripheral water bodies in the Qingsong area is 4.3 days. The largest amount of water is diverted along the Wusong River, accounting for 53% of the total water diversion; the drainage mainly relies on the gates along the Huangpu River and the Diandong Pumping Gate, accounting for 43% and 42%, respectively. In view of the lowering of the water level in the slice during the low tide period, an optimal regulation scheme has been developed for more diversion and less drainage along the Huangpu River, which can raise the water level in the slice by 0.05–0.10 m. Assessment and optimization of water resources scheduling in the Qingsong area can provide a reference for hydrodynamic enhancement in the river network area of the tidal plain.

1. Introduction

Deltas are densely populated with rivers and lakes, rich in biodiversity and natural resources, with a large population that accounts for about 7% of the world’s population and are often major contributors to national economies [1,2]. Well-developed river networks serve as primary pathways for transport of sediment, water, and other environmental fluxes and provide necessary ecosystems to a variety of ecologic and biotic activities [3]. The Mekong [4], Mississippi, Rhine, and Yangtze rivers are all typical of the delta river network. The Yangtze River Delta Plain Network Area is the most active region in China in terms of economic development, openness, and innovation. It is also the most complex plain river network area in the world, with complex regional water systems, dense river networks, numerous water conservancy projects, divided water networks, and poor water flow. As a result of urbanization, people and water are competing for land, pollution loads are increasing, and the water environment is gradually deteriorating. In the past few years, after vigorous interception and treatment of pollution and river training, the water environment management has achieved remarkable results, and the water quality of the river basin and regional river network has gradually improved. However, the water power of the river within the city is weak and the water environment still needs to be improved.
The regulation of river water resources is to use water conservancy projects to realize the reallocation of water resources in time and space to meet the needs of water use, flood control, and water environment improvement for national economic development [5,6]. In order to support the high-quality development of water conservancy in the new stage, the scientific and orderly implementation of water resource regulation is of considerable relevance. Experts at home and abroad have been working on water resources regulation to improve water quality in rivers since the 1960s [7,8,9,10,11]. Japan implemented inter-river regulation and brought clean water from other rivers between 1964 and 1975 to purify rivers such as the Nakagawa, Shinmachi, and Waka [12]. Shanghai started utilizing water conservancy projects to divert clean water for regulation in the middle of the 1980s [13], creating a precedent for water conservancy projects to enhance water quality in China; many scholars have conducted research on the scheduling of water resources in plain tidal networks in terms of scheduling methods and water diversion effects [14,15,16]. Later, several cities fully utilized the capacity of the water environment beyond the river basin to carry out water resources regulations for the enhancement of the ecological environment and river water quality [17,18,19,20,21].
The plain river network can be studied mainly through numerical simulation of the river network’s hydrodynamics with a well-developed water system and many gates and pumps. At present, various water management software tools, such as Infoworks, Delft 3D, DHI Mike, HEC-Ras, EFDC, WASP, Qual2K, etc., have been developed at home and abroad [22,23,24,25,26,27,28,29,30,31,32,33]; Tibebe Dessalegne and M.Sc., John W. Nicklow used Illinois waterways as an example to apply an evolutionary algorithm for the optimal control of multiple reservoirs on a river network [34]; Dessalegne and Nicklow investigated the use of artificial life algorithms for the optimal regulation of multiple reservoirs in a river system [35]; Marcinkevage and Herricks proposed a process-based ecological model for river network management in order to study the interaction between ecology and hydrology in integrated watershed management [36]; Zeng et al. proposed models such as TIWT, LWE, and TWT in terms of water environment carrying capacity, water ecology, and water resources allocation [37,38,39]; Zhuang et al. proposed an inexact joint probabilistic programming (IJPP) method for risk assessment and uncertainty reflection in water resources management systems [40]; Zeng et al. constructed an inexact-quadratic fuzzy water resources management model (IQT-WMMF) for floodplains that can be used for the sustainable development of Dahuangbaowa [41]. In summary, there is a lack of in situ observational studies combined with modelling of the flow processes in the internal river network for the sensitized multisource diversions, making it difficult to articulate the flow processes in the internal river channel under changing external diversion conditions.
The primary focus of this paper is the river network area of the tidal plain. Using the Qingsong area in Shanghai as an example, we analyze the process of flow rate change with tide level within the river network under the simultaneous action of the upstream stream and downstream tide. We can examine the characteristics of water allocation, and assess the effectiveness of the implementation of current water resources regulation by constructing a mathematical model of the hydrodynamics of the river network in the Qingsong area. Taking reducing the drainage volume of the Qingsong area during neap tide as the overall idea, we propose an optimization scheme to make up for the lack of scheduling in the Yangtze River Network area of the Yangtze River Delta sensitive plain in which the flow specific process of the internal river is measured in combination with the model, and provide technical guidance for the water resources regulation of the tidal plain river network, which is of great significance in improving the enhancement of the regional water environment.

2. Materials and Methods

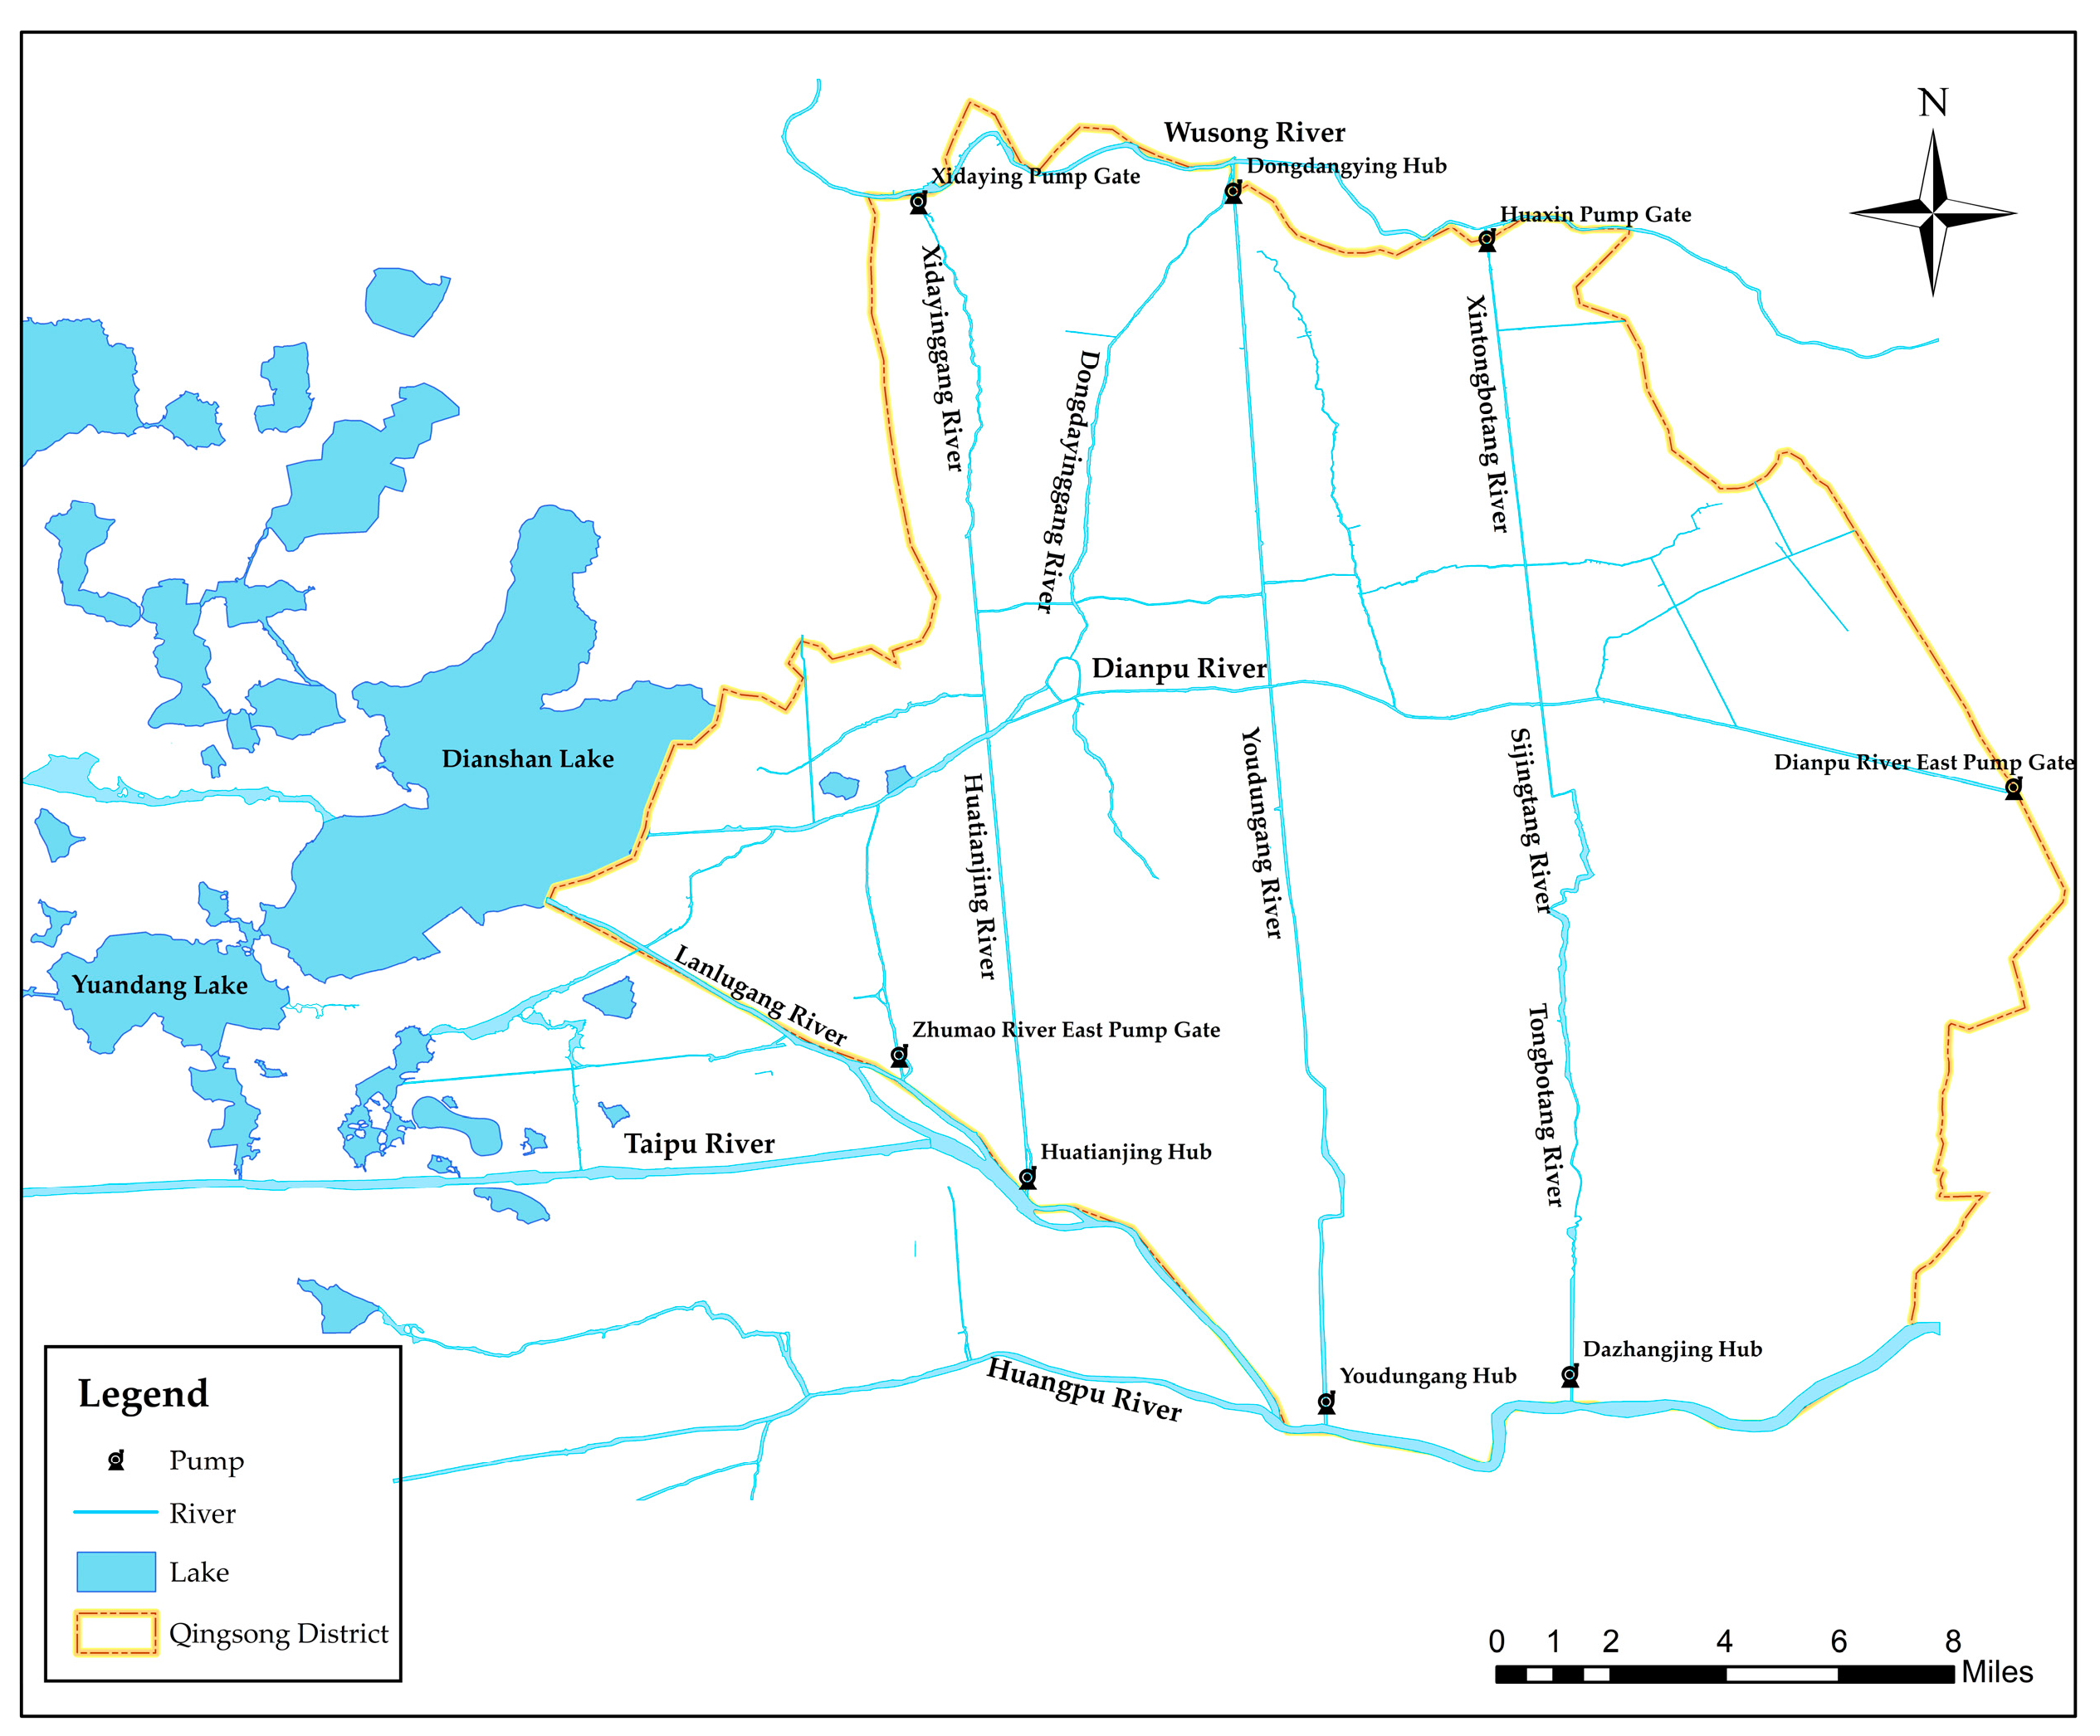
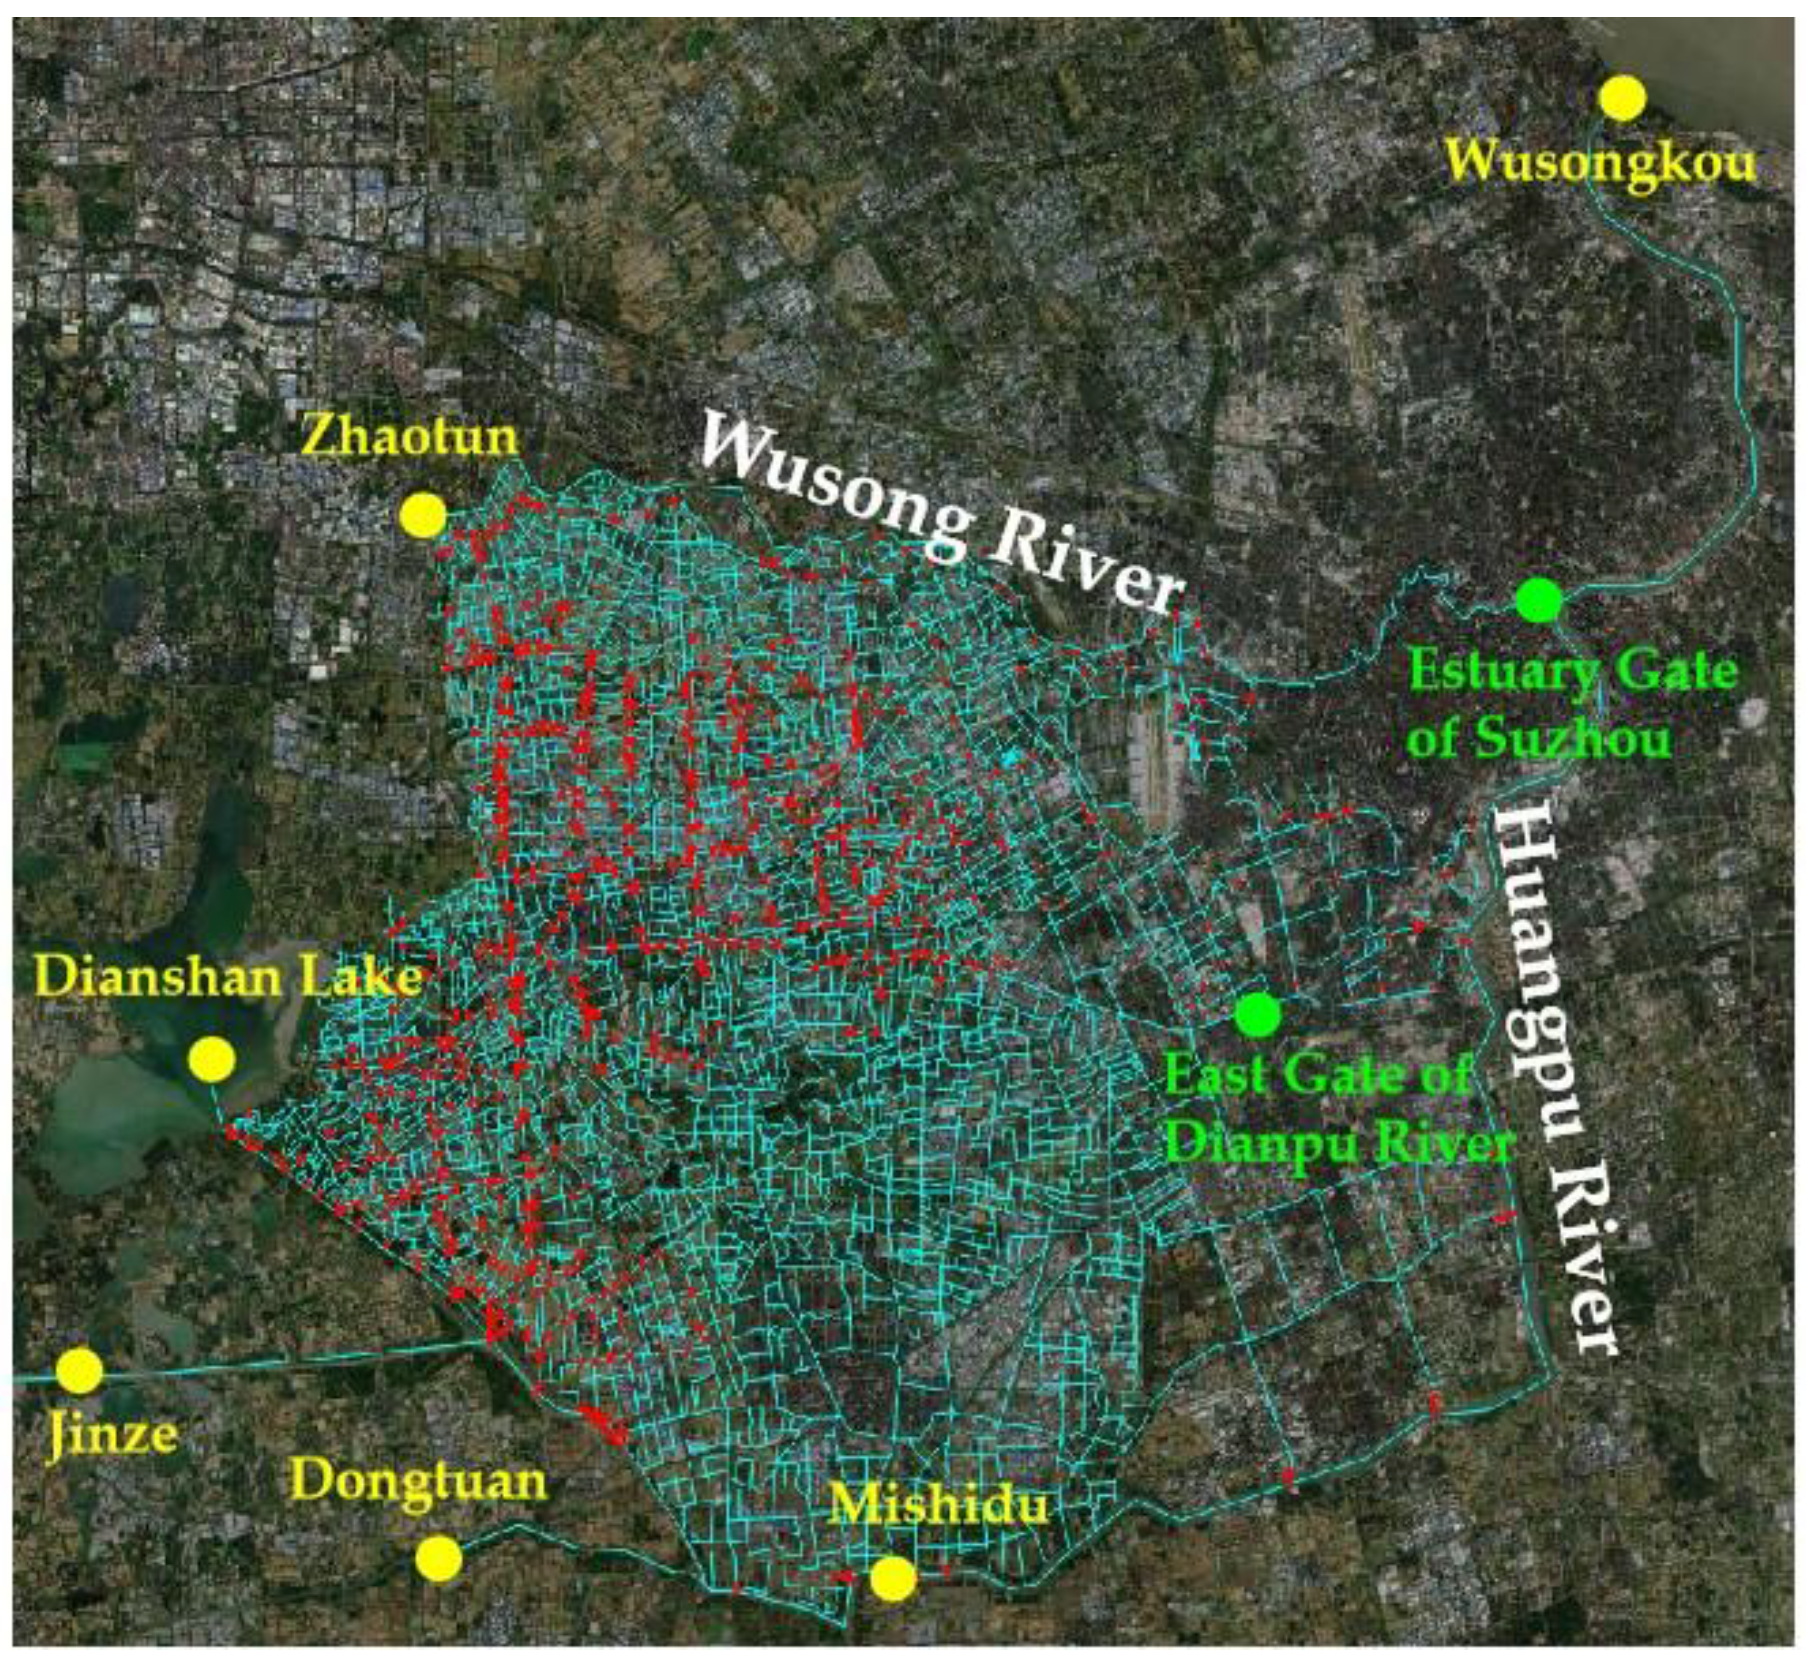
2.1. Regional Overview

The Qingsong area is one of the 14 water conservancy sections in Shanghai, located in the southwest of Shanghai, downstream of Taihu Lake and upstream of Huangpu River, and is a typical tidal plain with a dense network of rivers and lakes. With a total area of 758.23 km2, it features a substantial river network and a large number of lakes. The Qingsong Water Conservancy Area extends from Wusong River in the north to Huangpu River in the south, from the administrative boundary (Dianshan Lake–Lanlu Gang) in the west, and from the administrative boundary (Xiaolai Gang–Xipu Jing–Nu’er Jing) in the east [42,43], and the backbone rivers in the area are Xidaying Gang–Huatian Jing, Dongdaying Gang–Zheze Tang, Youdun Gang, Xintongbo Tang, Dianpu River, Shangda River, etc. The water level of Dianshan Lake is relatively low due to the low high-tide level and low difference in tide between the Lanlu Gang and the Mao River, and the high water level in the area, so the diversion of water from the Lanlu Gang to the Mao River and Dianshan Lake is very limited. In the northern part of the Qingsong area, the water level of the Wusong River is not very different from the water level within the area, so the portals along the Wusong River are often neither diverted nor discharged, and the hydrodynamic conditions in the area north of the Dianpu River are extremely poor. The whole Qingsong area is controlled by pump gates along the polder, forming a large polder area, upstream by the Wusong River along the Xidaying pump gates, Dongdaying hub, Huaxin pump gates, and other water conservancy projects; Lanlugang River along the Zhumao River pump gates, Huatianjing hub, and other water conservancy projects’ control; and downstream by the Huangpu River along the Youdungang hub, Dazhangjing hub, and other water conservancy projects’ control.
The current water resources regulation plan in the Qingsong area is implemented in accordance with the Implementation Rules for Qingpu District Water Resources Regulation (Trial) [44] in 2020. Based on the overall layout of “relying on the two rivers, scientific diversion and drainage, regulation in sections, and directional and orderly”, and on the premise of ensuring the regional flood control safety and smooth flow of flowing water, the water resources regulation is carried out by using gate engineering facilities “combining diversion and drainage, focusing on east drainage”, so that the water bodies of major rivers in the regional river network can flow in a directional and orderly manner, speeding up the renewal speed of water bodies and improving the water quality in inland rivers [45,46]. The Qingsong Water Conservancy Area of water system in Shanghai is shown in Figure 1.

2.2. Analysis of Prototype Observation Test

2.2.1. Introduction to Current Regulation

The principle of water gate operation: the sluice gates along the upstream area of Huangpu River and the northern bank of Xietang–Mao River–Lanlu Gang, the sluice gates along the southern bank of Wusong River, and the western sluice gates of Dianpu River have both drainage and discharge, while the eastern sluice gates of Dianpu River only have discharge but not drainage.
Average control water level of surface in the Qingsong area: 2.40–2.90 m in a flood season and 2.50–3.00 m in a non-flood season.
Representative station of average control water level of surface in the Qingsong area in Qingpu District: Qingpu south gate station.
The large control gate is along the Dianshan Lake in Qingpu District, along the north bank of the Lanlu Gang, along the Jiangsu border and along the south bank of the Wusong River. The gate is closed when the water level inside the gate is higher than the average control maximum level of the surface, and the gate is kept open for operation at other times. The Zhangma pumping station’s daily high-tide diversion has a cumulative single pump (15.0 m3/s) diversion of water not less than 4 h; when the water level in the gate is higher than the average control of the highest level of the Qingsong area of water, it stops diversion.

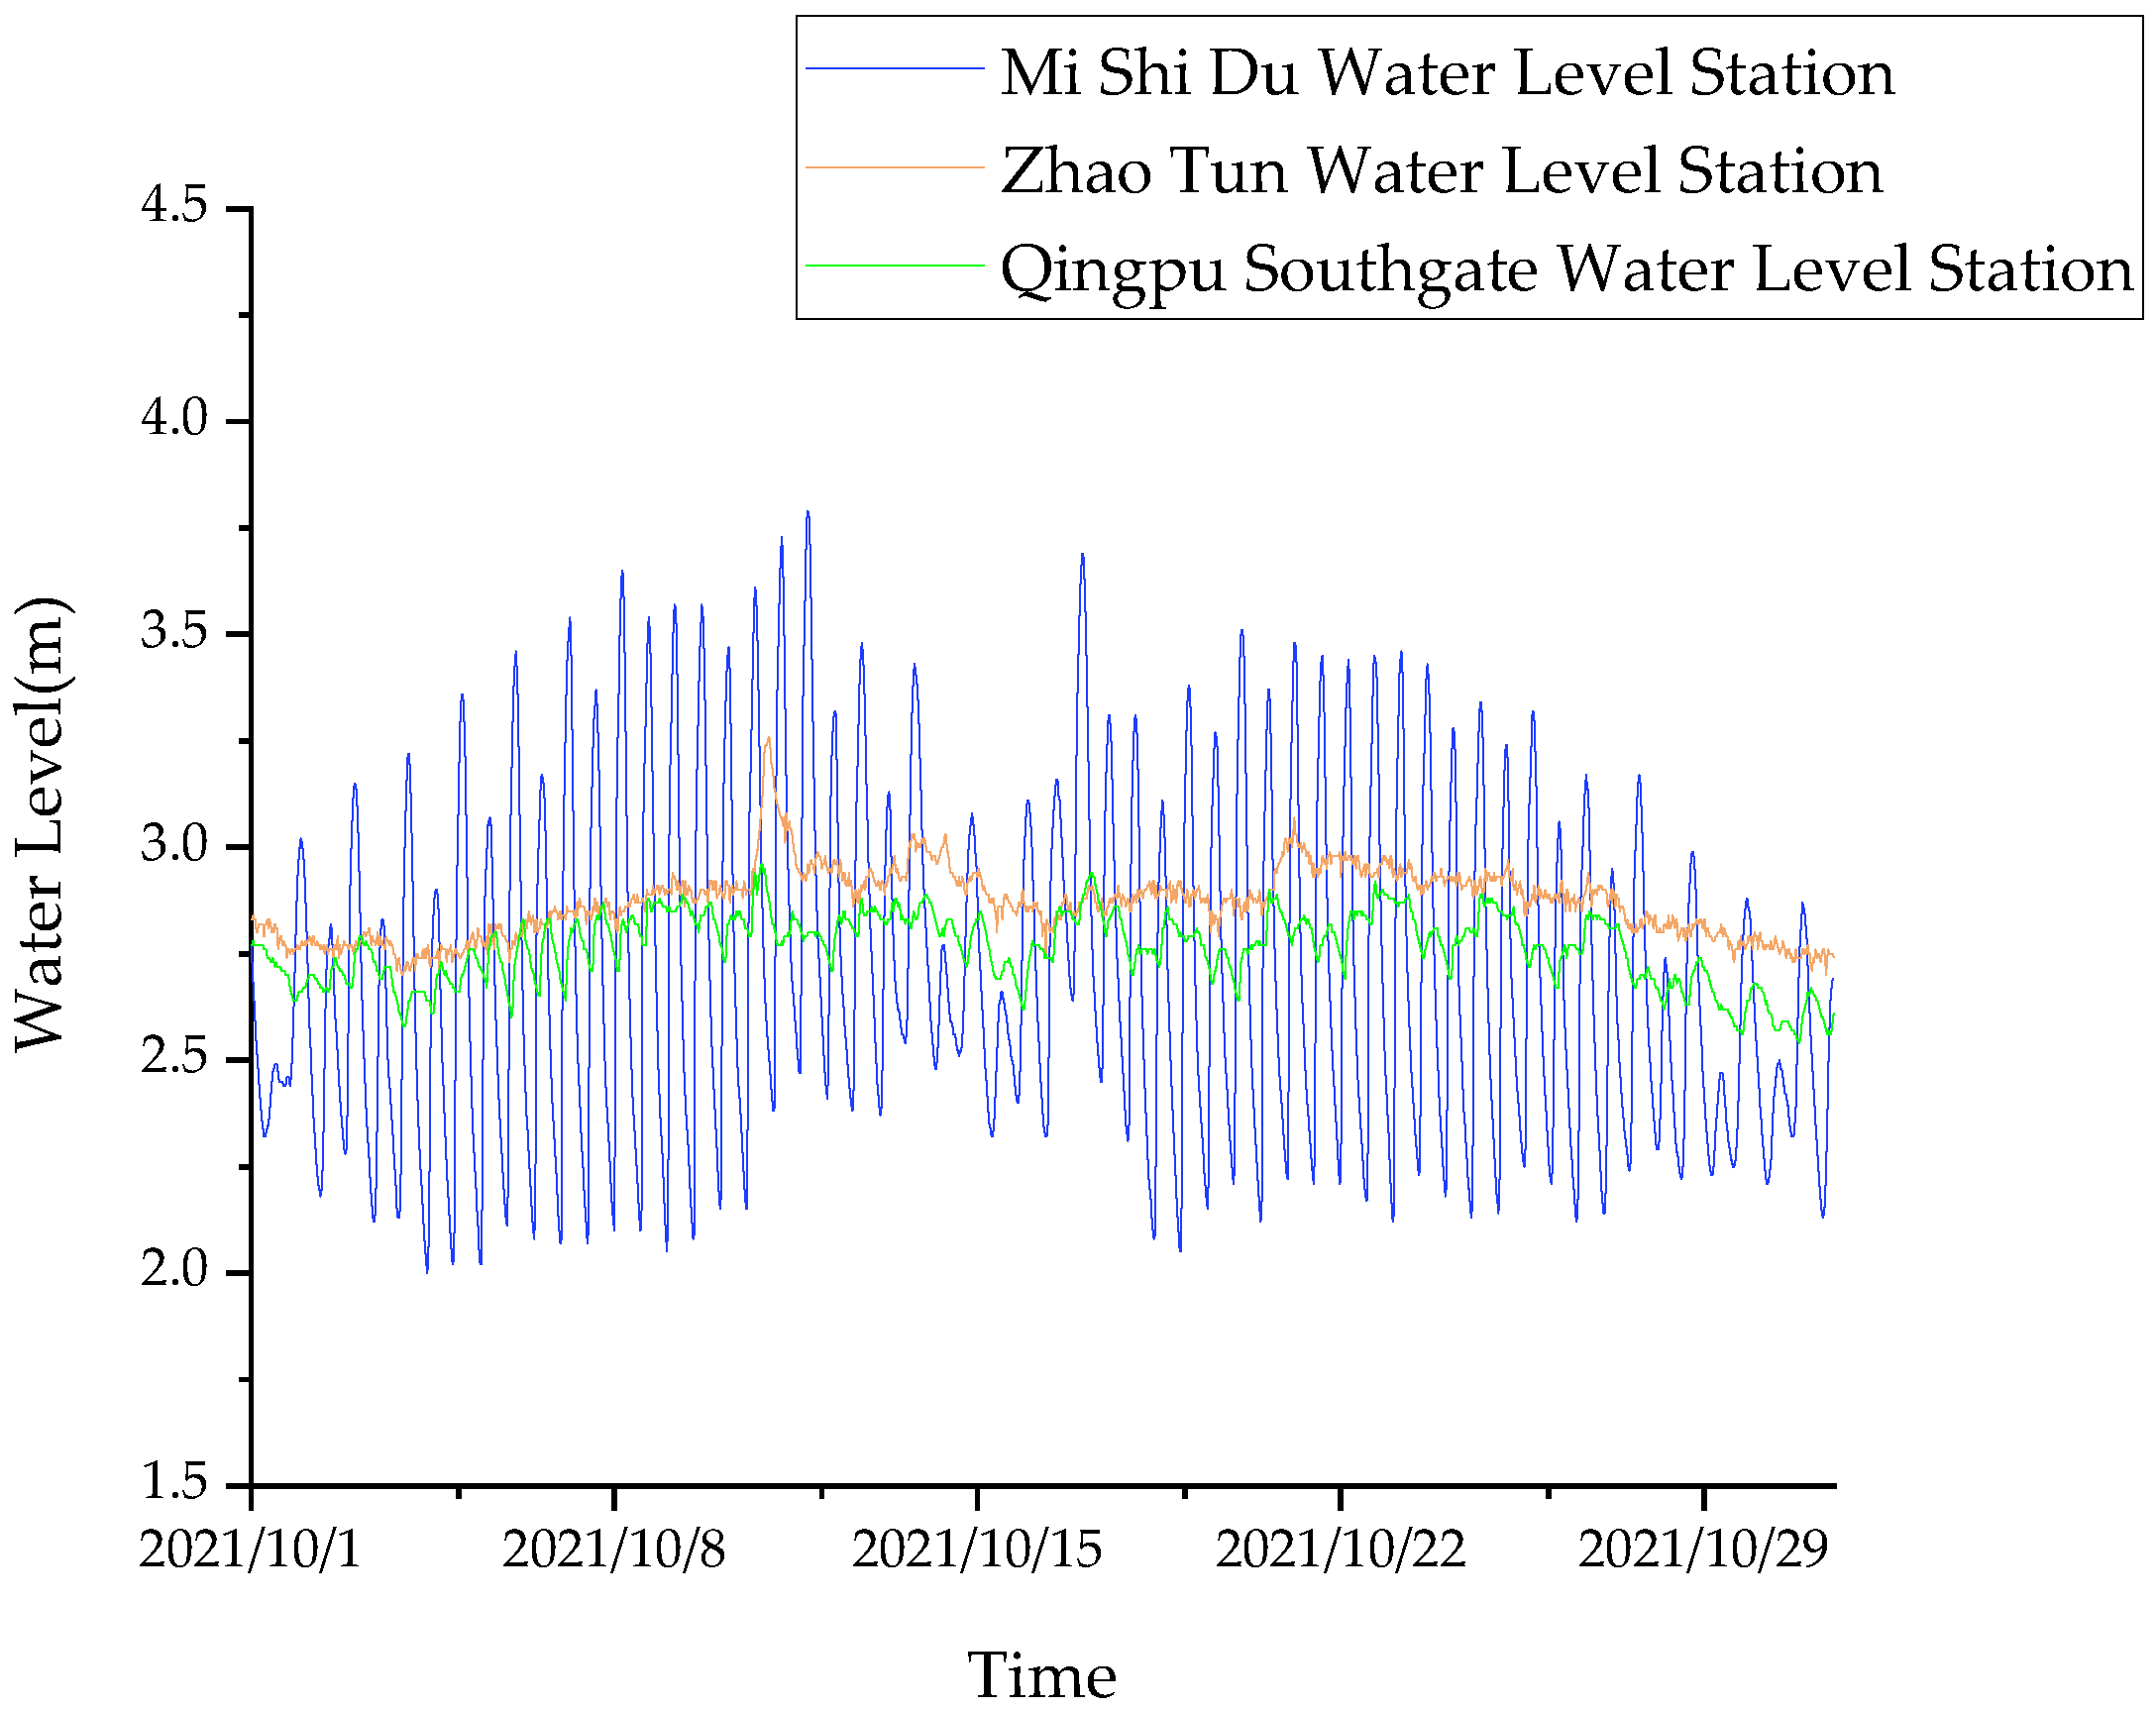
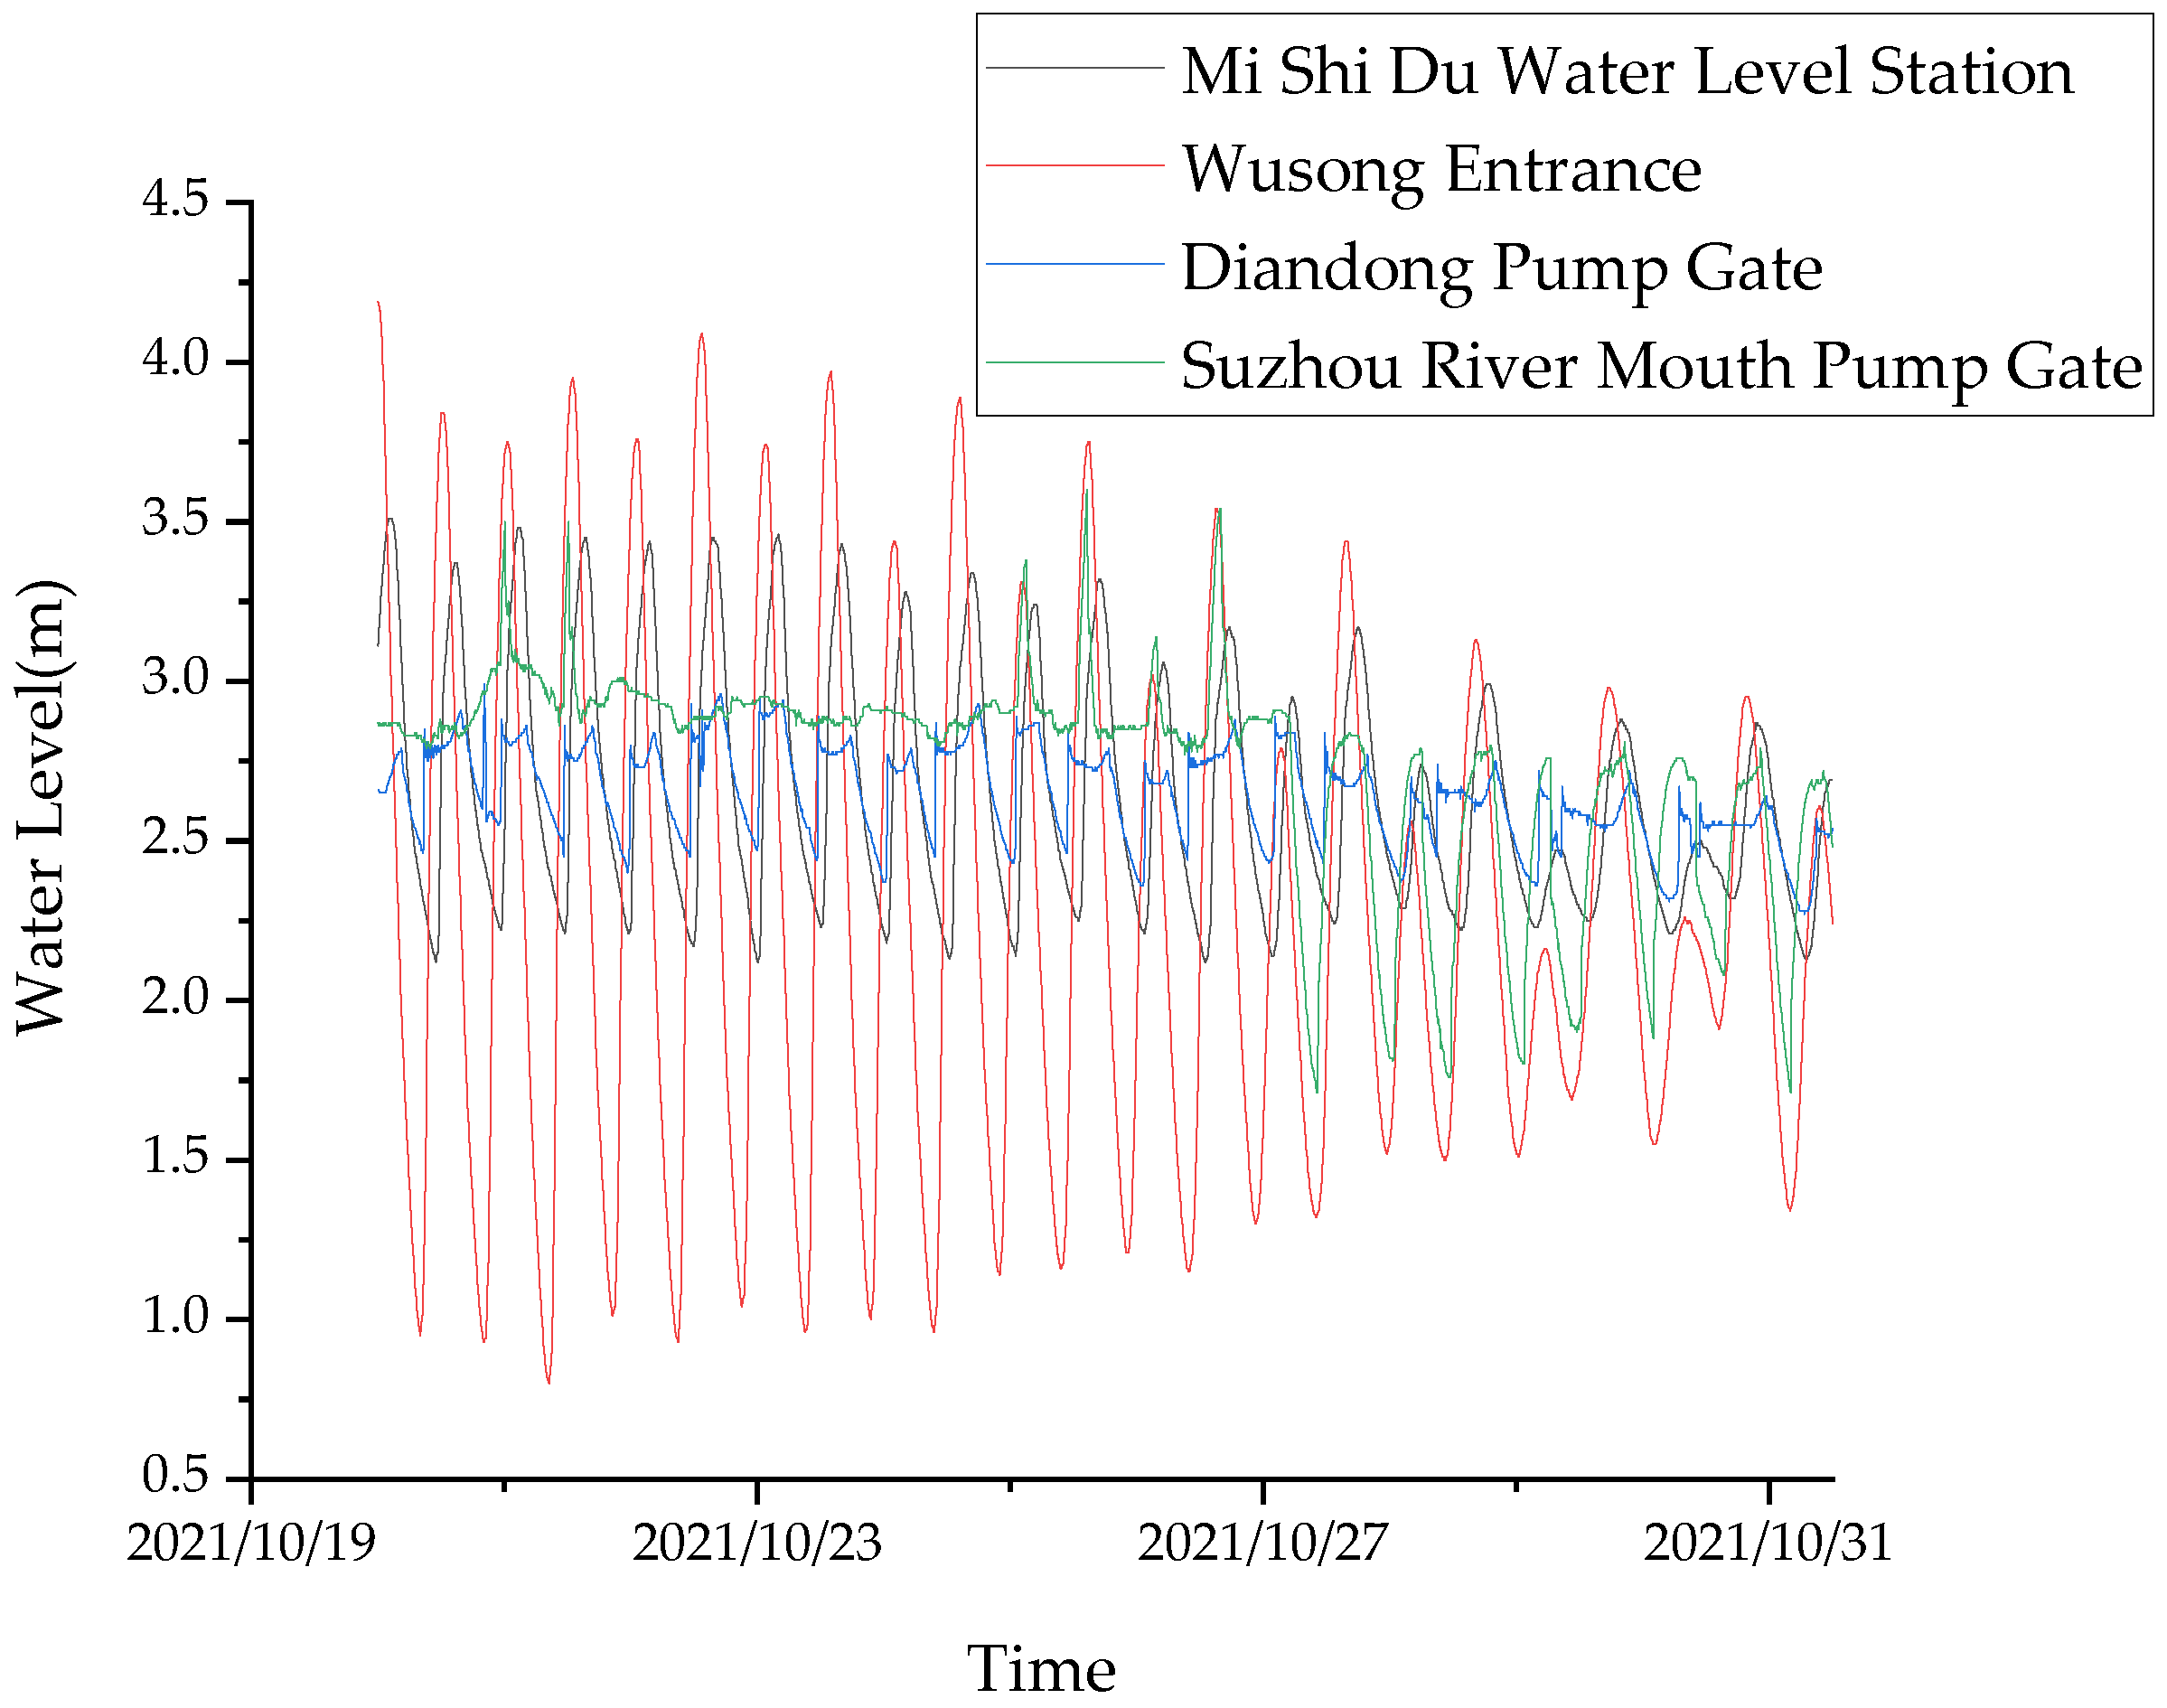
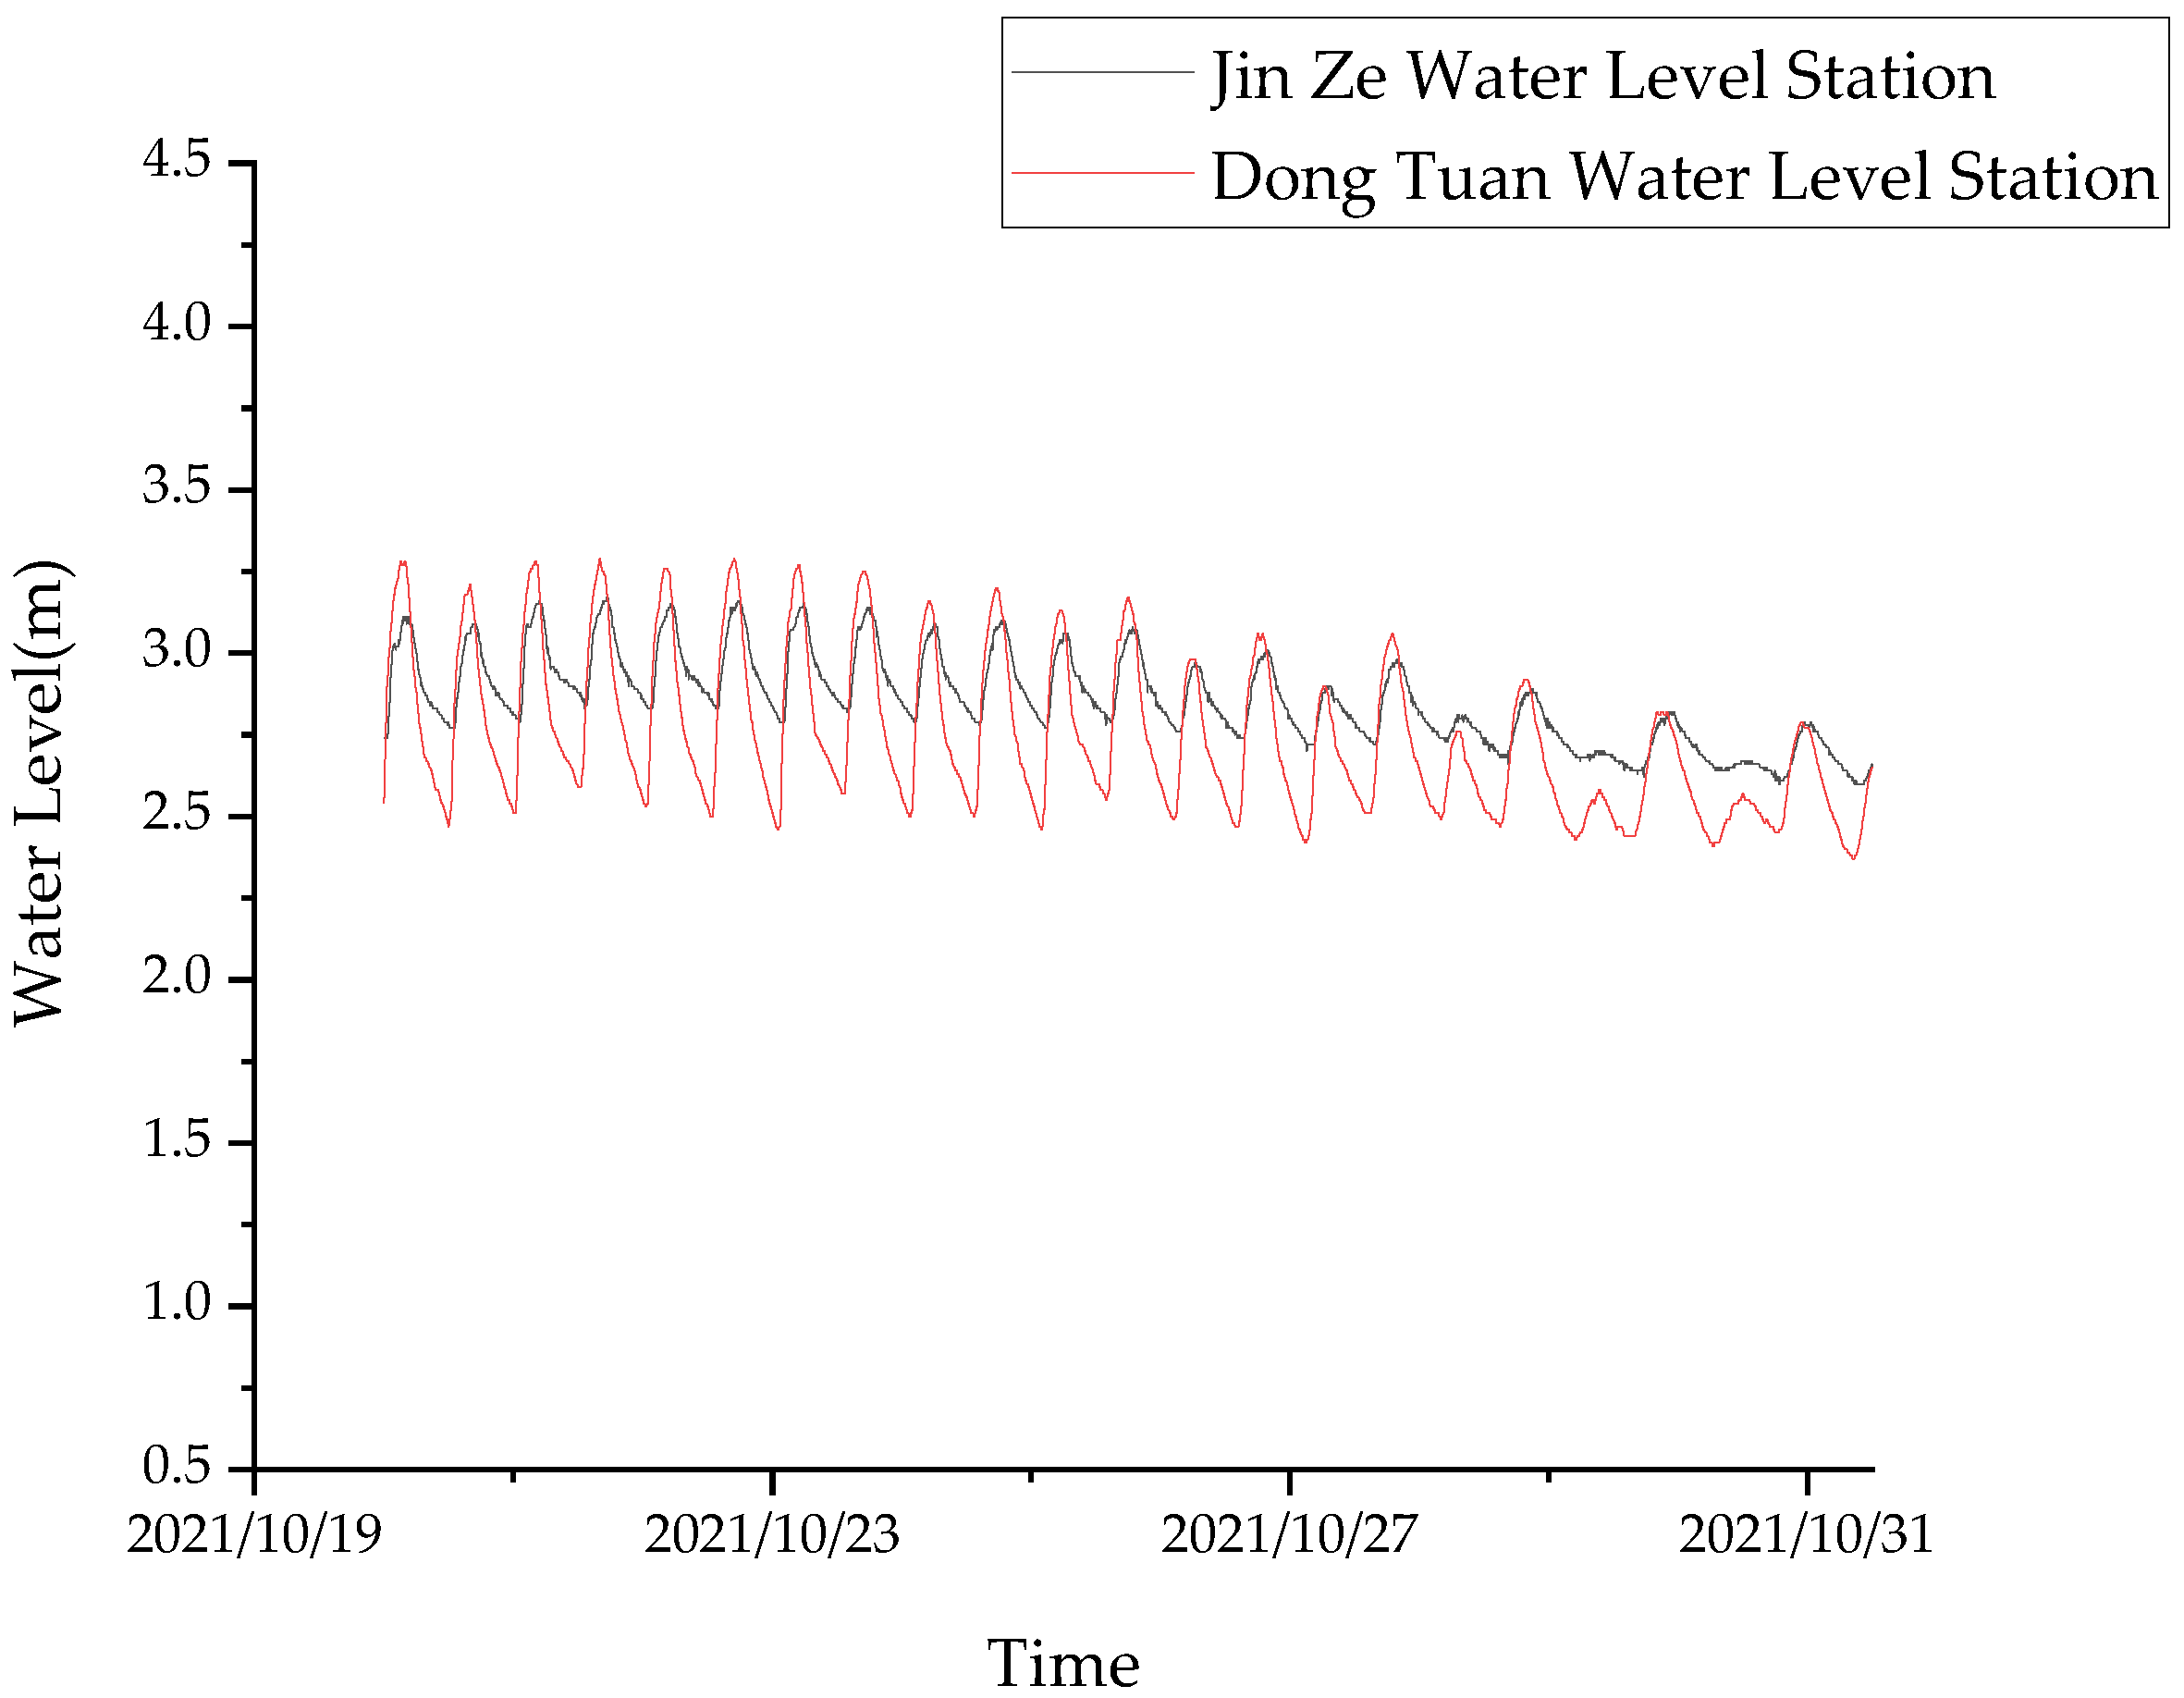
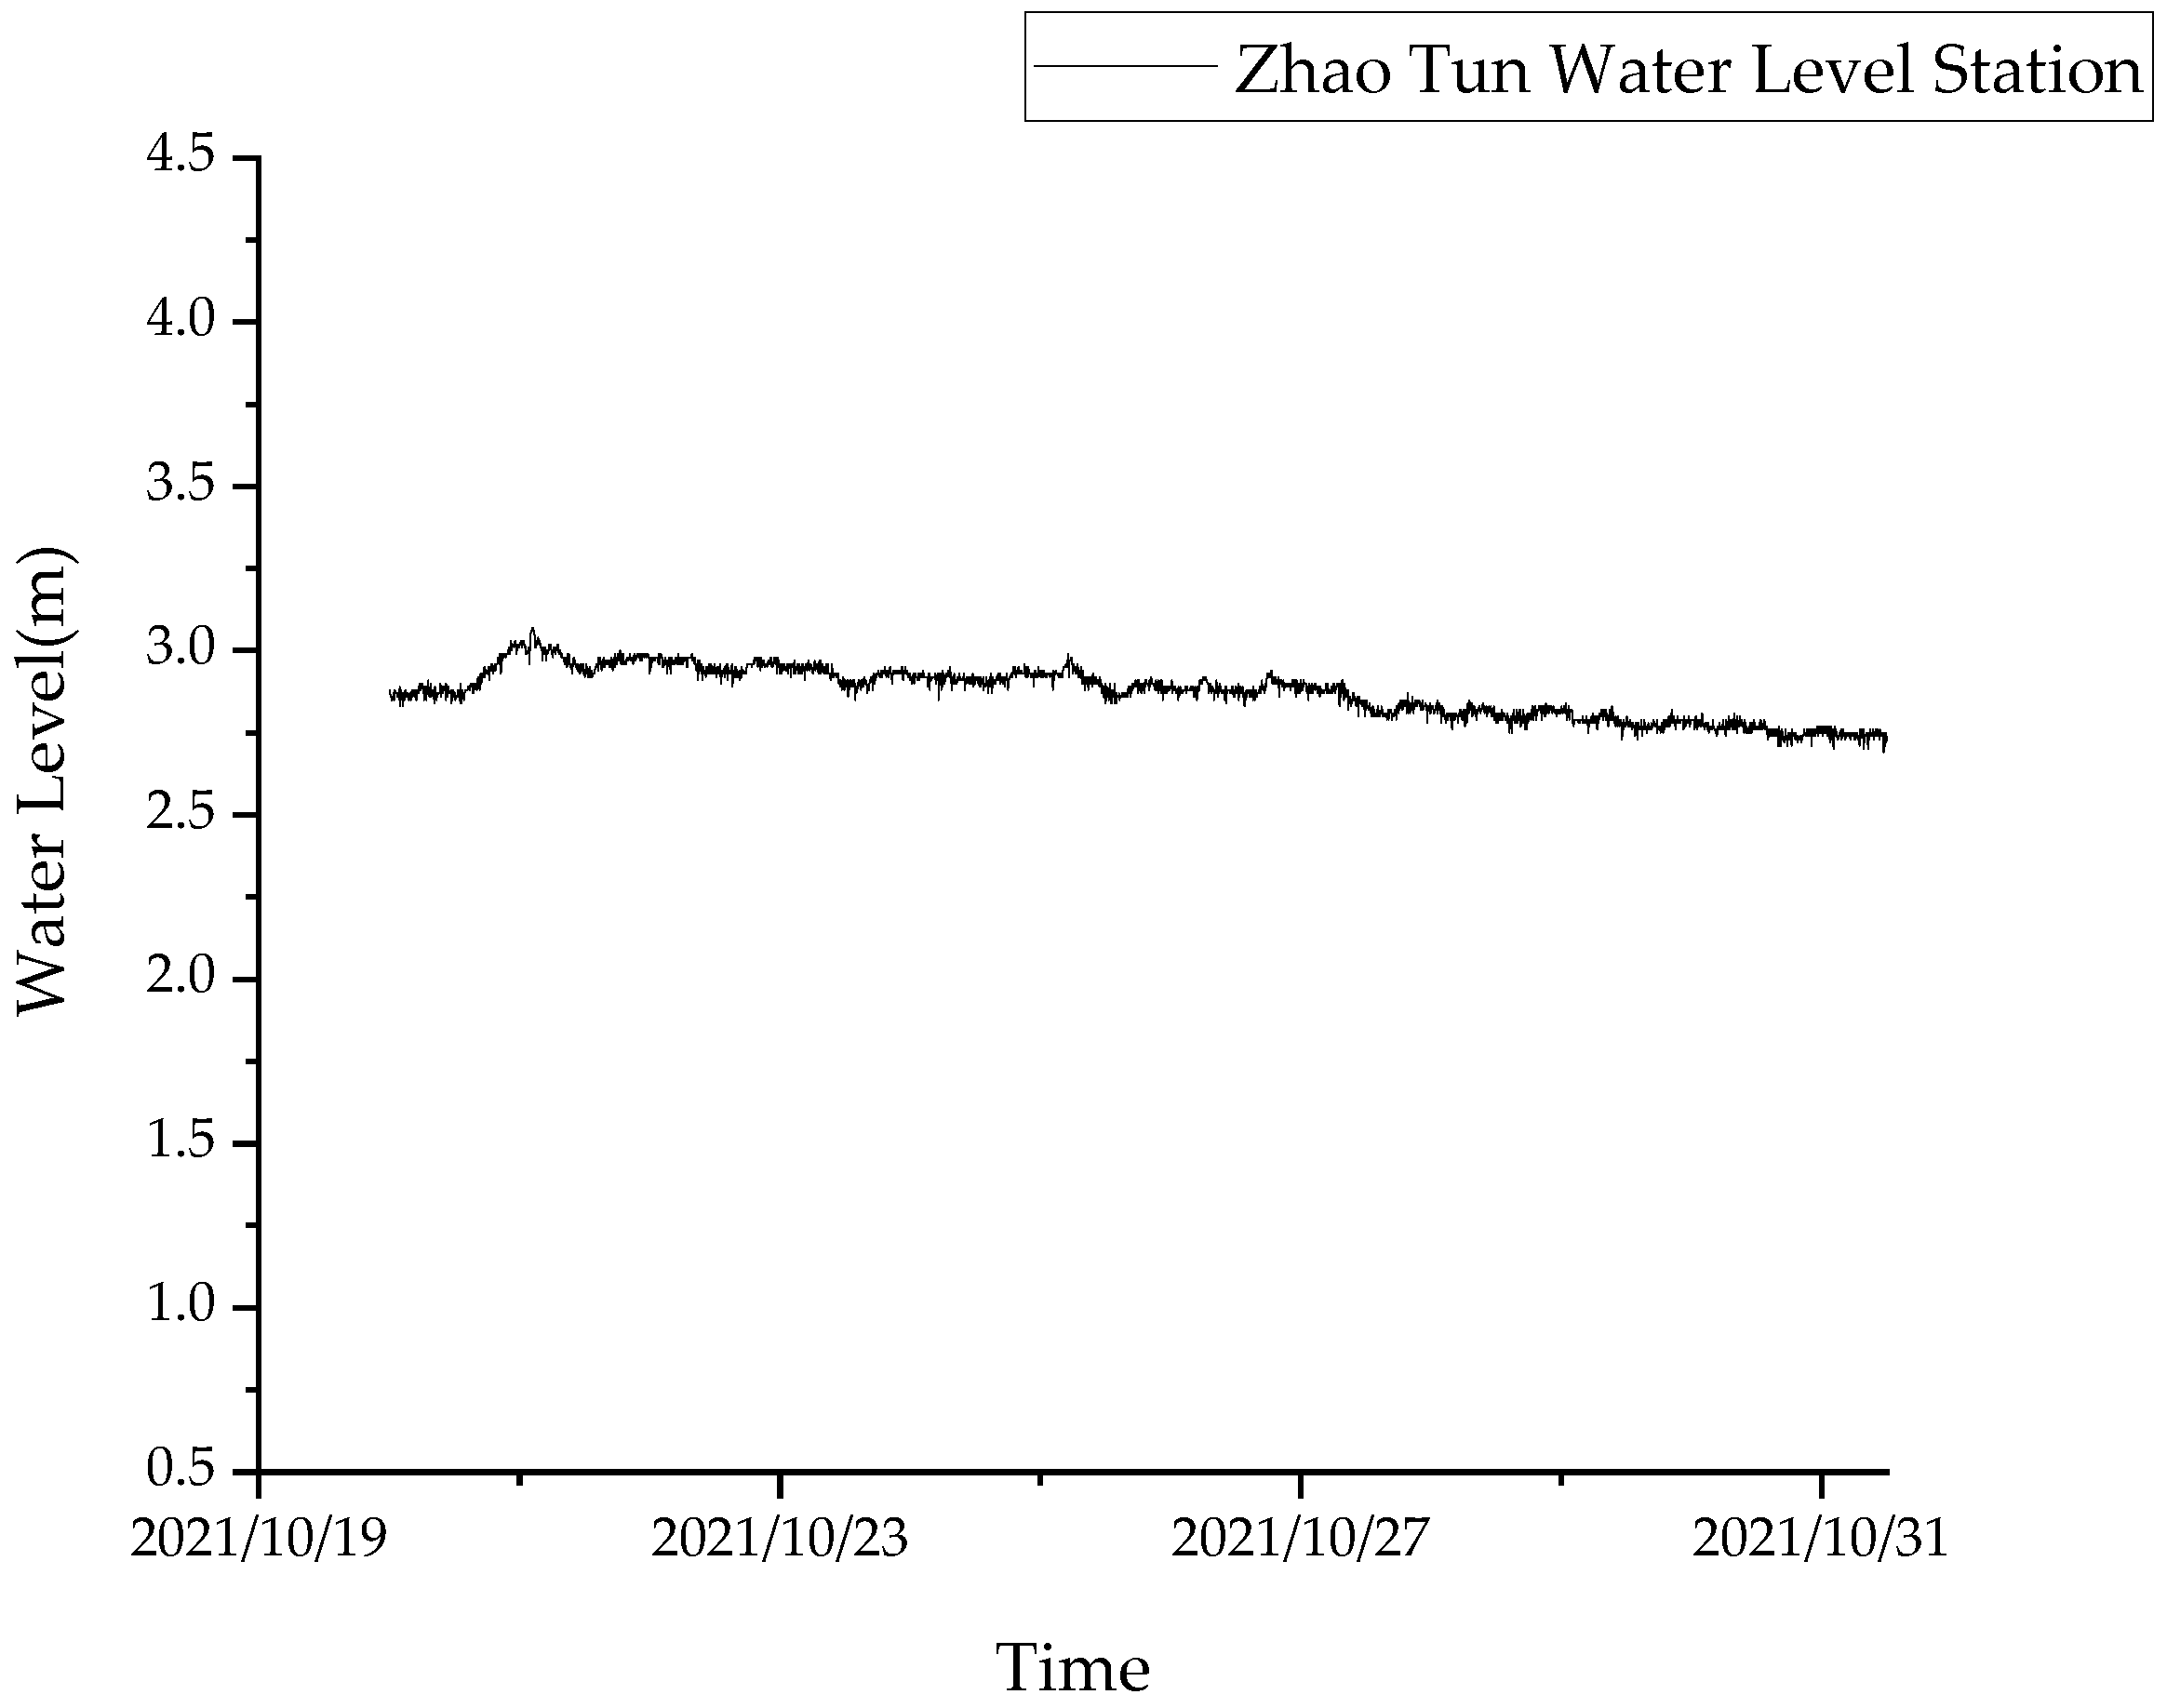
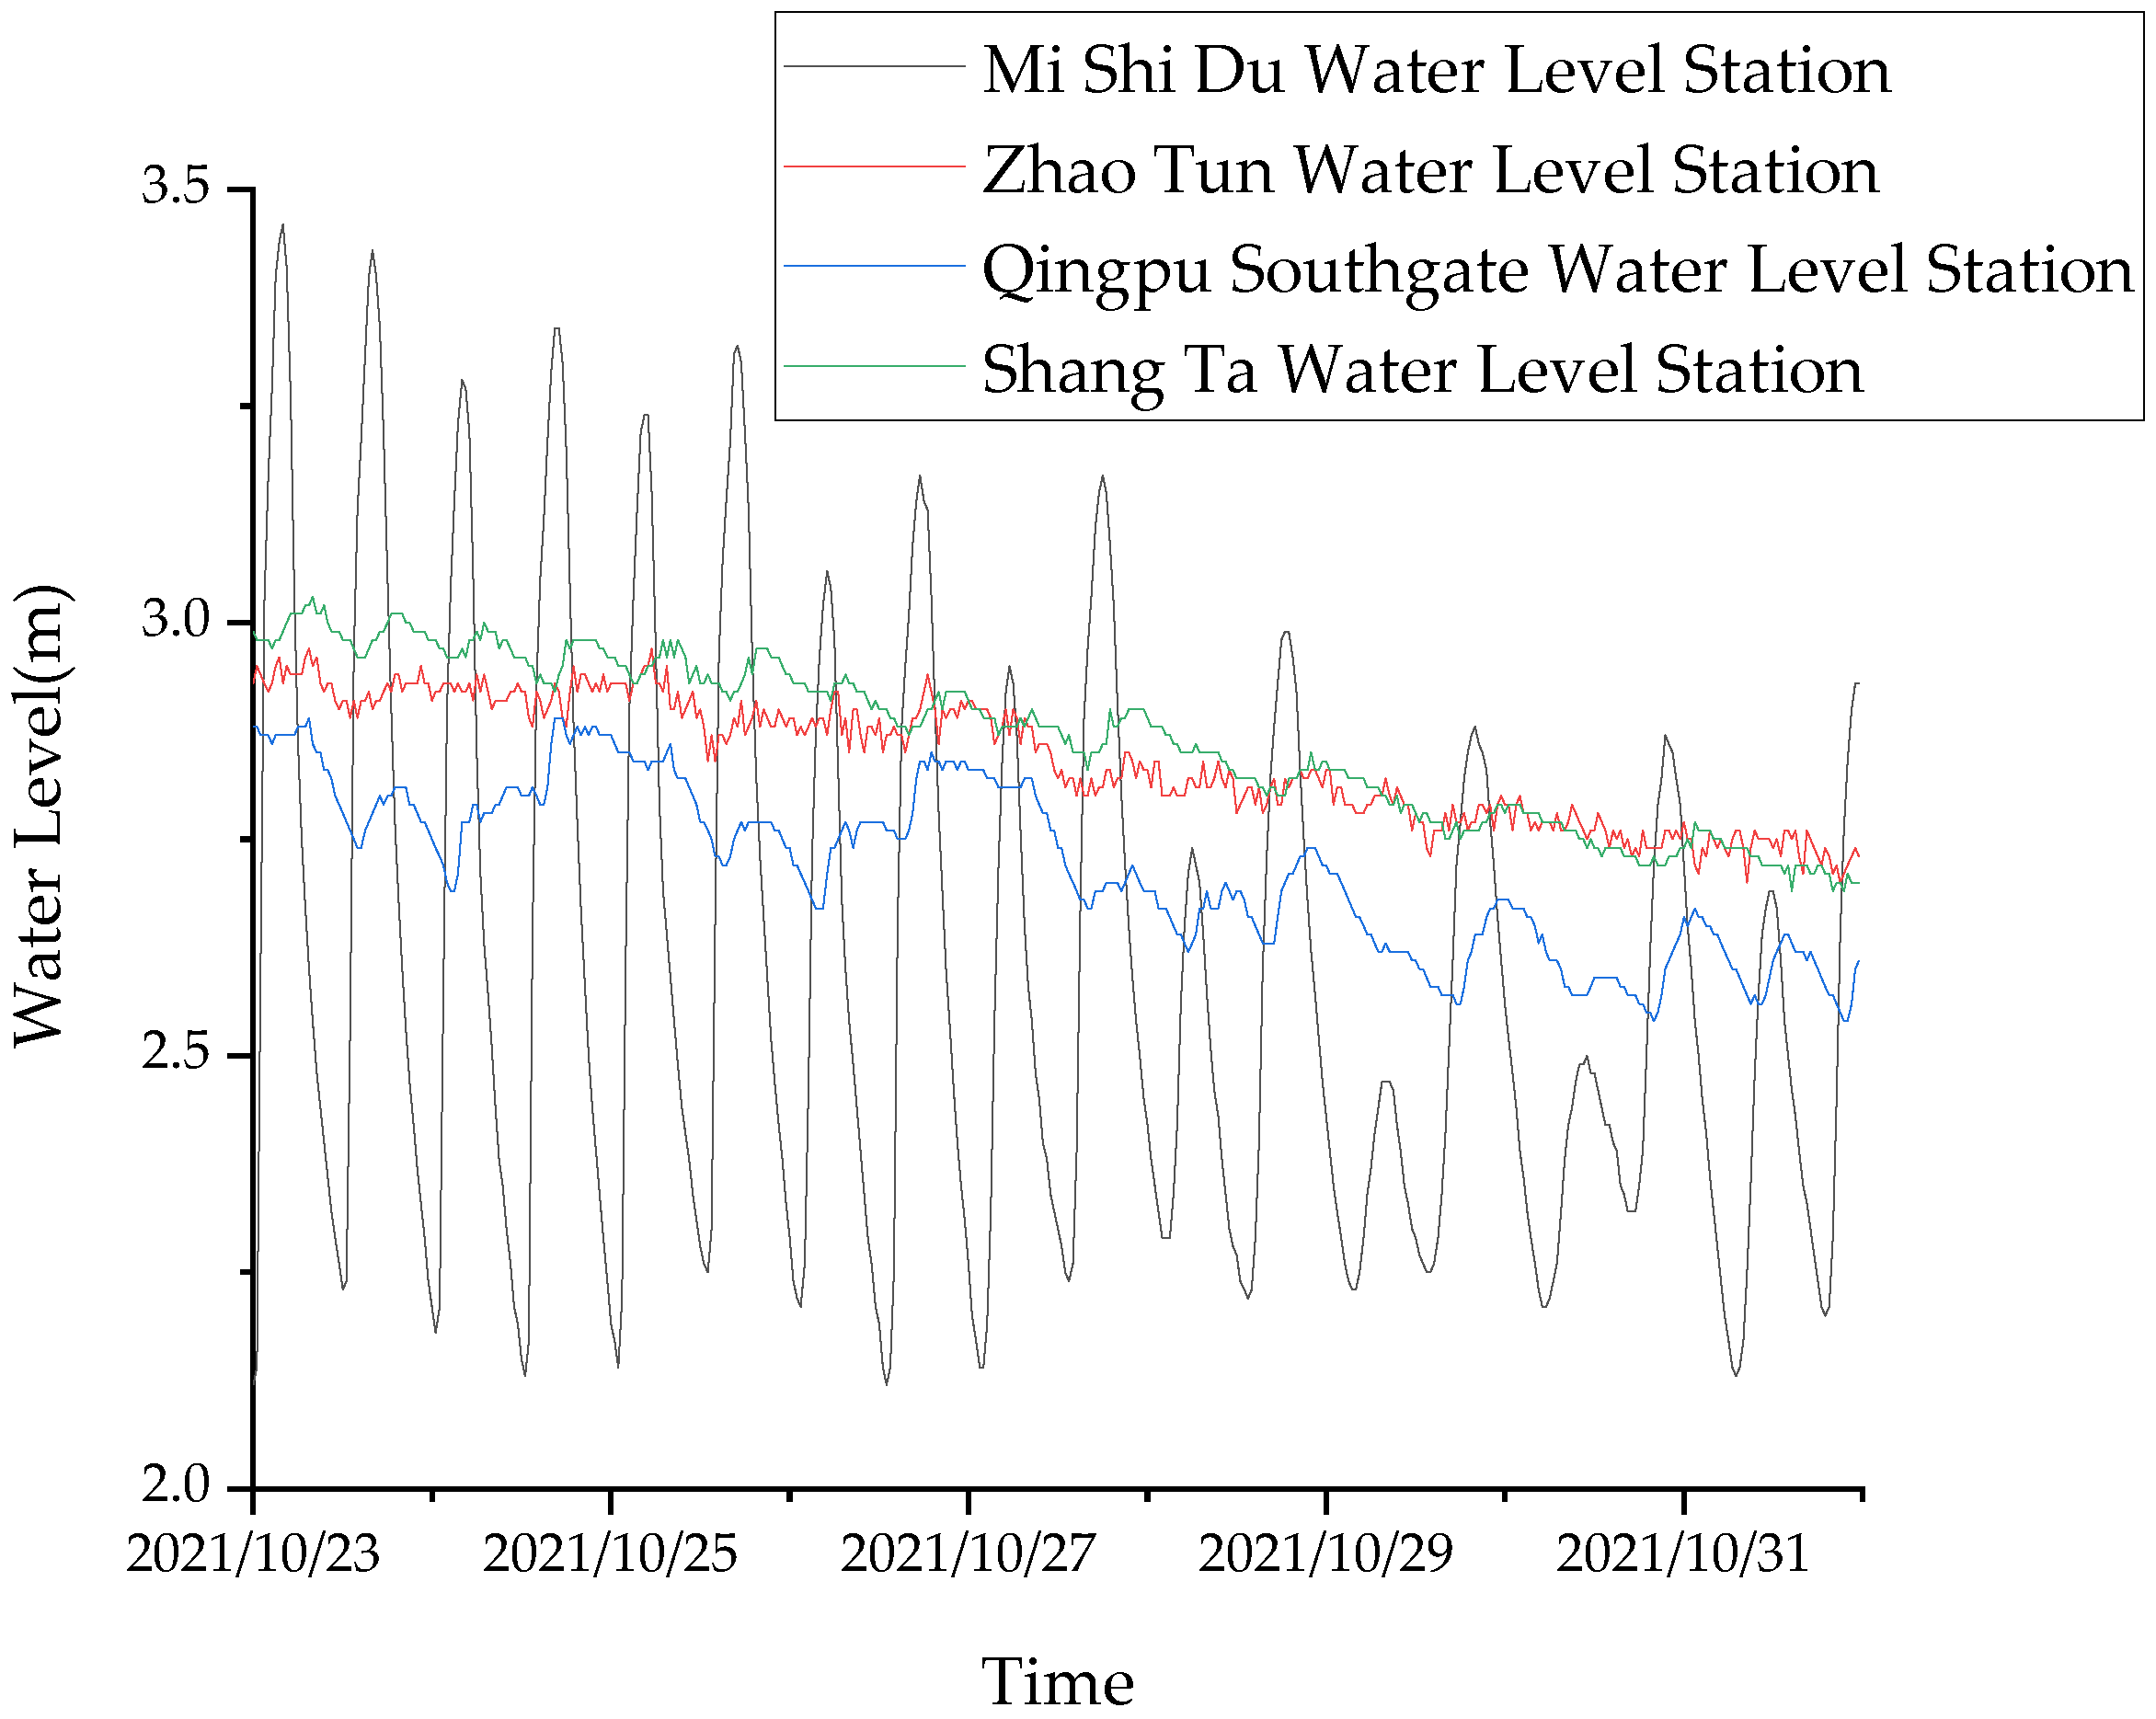
2.2.2. Water Level Analysis of Qingsong Area

A radar electronic water level meter is used to observe the water level of the Qingsong area, the peripheral water level points include Zhaotun, Shangta, East Gate of Dianpu River, and Mishidu, and the internal control points are the south gate of Qingpu and Sijing.
Inside the Qingsong area: the south gate of Qingpu and Sijing water level stations are selected to analyze their tidal-level characteristics, which are mainly affected by the regulation of the large control area. The water level changes in a small range and fluctuates between 2.52 and 2.96 m, which is relatively stable. The water level change process of the two water level stations is basically the same, and they have the natural conditions of west diversion and north diversion.
Huangpu River: The upstream Mishidu water level station is selected to analyze the characteristics of the tidal level upstream of the Huangpu River. The upstream area of the Huangpu River is greatly affected by the tidal level. It experiences two spring tides and two neap tides every month. At high tide, the water level upstream of the Huangpu River is much higher than that in the south gate of Qingpu, and the highest water level can reach 0.99 m; at low tide, it is far lower than the south gate of Qingpu, the lowest is 0.8 m, the water level fluctuates violently, and the difference between the water level and the south gate of Qingpu is large, so it has the natural condition of large diversion and large drainage.
Wusong River: Zhaotun water level station is selected to analyze the tidal-level characteristics of the upper reaches of the Wusong River. The water level the upstream of Wusong River has little change as a whole. The water level fluctuates within the range of 2.70–3.26 m, with a maximum daily variation of about 0.4 m, which is basically higher than the water level in the south gate of Qingpu. It has the natural conditions of west diversion and north diversion.
Dianshan Lake: The Shangta water level station is selected to analyze the tidal-level characteristics of Dianshan Lake. Dianshan Lake is weakly affected by the tidal level, and its water level changes in a small range. It fluctuates within the range of 2.69–3.14 m, with a maximum daily variation of about 0.15 m, which is always higher than the water level at the south gate of Qingpu. It has the natural conditions for the west diversion and north diversion.
The east pump gate of the Dianpu River: The water level station of the east pump gate of the Dianpu River is selected to analyze its tidal-level characteristics. The water level outside the east gate of the Dianpu River is greatly affected by the tidal level. It experiences spring and neap tides twice a month. The water level fluctuates violently and the tidal range changes more than that of the Huangpu River. During spring tide, the water level outside the gate fluctuates between 1.47 and 4.19 m, and the water level outside the Diandong gate is much higher than the south gate of Qingpu, reaching 1.4 m at the highest time; during neap tide, the water level outside the gate fluctuates between 1.75 and 4.03 m, which is far lower than the south gate of Qingpu, and the lowest is 1.3 m. In contrast, the water level in the gate is controlled by the regulation, and the water level changes in a small range, fluctuating between 2.28 and 2.98 m, which is relatively stable.
The water level change process of the south gate of Qingpu and Sijing water level station is basically the same, so the south gate of Qingpu is selected to represent the internal water level, and Mishidu, Shangta, and Zhaotun represent the boundary water level in the southeast and northwest of the Qingsong area. The overall water level process of the Qingsong area during the original observation period is shown in Figure 2.

2.2.3. River Flow Analysis of Qingsong Area

The ADCP (TRDI Corporation of America, San Diego, California) is used to focus on the prototype observation test of flow around the key rivers such as Xidaying Gang, Dongdaying Gang, Youdun Gang, and Xintong Botang within the Qingsong area. Focusing on analyzing the variation in river flow with the tidal process of the Huangpu River, the observation process was divided into four parts by combining the single-day drainage and double-day diversion at the mouth gates along the Huangpu River, namely, the single-day Huangpu River low-tide period, the single-day Huangpu River high-tide period, the double-day Huangpu River low-tide period, and the double-day Huangpu River high-tide period. See Figure 3 for the river flow direction under four conditions.
The single-day drainage of Huangpu River: During low tide, the mouth gates along the Huangpu River are opened for drainage and the mouth gates along the Wusong River are naturally open, and the overall flow direction of the north–south backbone river is from north to south at this time. The flow rate of the Xidaying Gang ranged from 7.73 to 25.98 m3/s, the flow rate of the Dongdaying Gang ranged from 3.90 to 15.49 m3/s, the flow rate of the Youdun Gang ranged from 20.90 to 68.42 m3/s, and the flow rate of the Xintong Botang ranged from 9.80 to 19.43 m3/s. Among the four north–south backbone rivers, the drainage flow of Youdun Gang is much larger than the other rivers. Taking the Dianpu River as the boundary, the river flow in the south area is greater than the river flow in the north area.
The single-day drainage of Huangpu River. During high tide, the gates along the Huangpu River remain closed, and the gates along the Wusong River naturally open. At this time, the north–south backbone river still flows from north to south, but the overall flow is reduced. The flow of Xidaying Gang is 4.52–11.93 m3/s, that of Dongdaying Gang is 7.73–11.57 m3/s, that of Youdun Gang is 19.30–40.83 m3/s, and that of Xintong Botang is 6.28–16.14 m3/s. Among the four backbone rivers, the overall flow of Youdun Gang is greater than that of the other three backbone rivers, and the flow of the river section near the Wusong River is significantly greater.
The double-day diversion of Huangpu River. During low tide, the gates along the Huangpu River remain closed, and the gates along the Wusong River naturally open. The Qingsong control area mainly diverts water through the gates along the Wusong River in the north. At this time, the overall flow direction of the north–south backbone river is from north to south. The flow of Xidaying Gang is 2.82–11.55 m3/s, that of Dongdaying Gang is 2.04–10.25 m3/s, that of the Youdun Gang is 6.15–21.23 m3/s, and that of Xintong Botang is 2.41–13.02 m3/s. Among the four backbone rivers, the overall flow of Youdun Gang is greater than that of the other three main rivers.
The double-day diversion of Huangpu River. During high tide, the gates along the Huangpu River open for water diversion, and the gates along the Wusong River open naturally. At this time, there are three water sources in Qingpu District, namely the Wusong River, Huangpu River, and Dianshan Lake. The two streams of water from the north and south converge in the area north of the Shangda River, with the north backbone river network flowing from north to south of the confluence area and south of the confluence area flowing from south to north. The flow of Xidaying Gang is 1.95–44.45 m3/s, the flow of Dongdaying Gang is 2.87–16.28 m3/s, that of Youdun Gang is 17.71–66.73 m3/s, and that of Xintong Botang is 5.73–22.32 m3/s. The water diversion flow in the south of the Xidaying Gang, Dongdaying Gang, and Youdun Gang confluence area is significantly greater than that in the north.
During prototype observation, the river flow direction of the Dianpu River is basically from west to east, with large water diversion and drainage overall. According to the change in tide level, the east gate of the Dianpu River drains water at two tides every day with the displacement between 19.96 and 48.79 m3/s; the Dianxi gate is opened for water diversion with the water diversion volume between 1.66 and 39.44 m3/s.
Concentrating on the observation of the middle section of the Shangda River (starting from Xidaying Gang and ending at Youdun Port), the flow direction is from west to east, the flow is 0.07–7.85 m3/s, and the hydrodynamic force is weak.

2.3. Hydrodynamic Model

2.3.1. Model Construction

The status quo of Qingpu District, which is dominated by the Qingsong area, is examined in this paper using a one-dimensional river network hydrodynamic model in the Qingsong area. The finite difference method is used to solve the one-dimensional river network hydrodynamic model, and the Preissman four-point implicit scheme is used to discrete the Saint Venant equations [47]. The function and derivative are replaced by the average of the weights of the four inflection points in (x,t) space, allowing for a smooth transition from free surface flow to the overloaded state in the pipe channel.
The flood movement of a one-dimensional river network is described by Saint Venant equations, and the upstream and downstream boundary conditions are generally water level, flow, flow–water level relationship, etc. Saint Venant equations consist of a continuity equation and momentum equation:
Q x + A t = q
Q t + x ( β Q 2 A ) + g A H x g A Q | Q | k 2 + q Q A cos α = 0
In the formula: x and t are the longitudinal coordinates and time of the river channel, respectively; N is the roughness coefficient; Q and Z refer to the section flow and water level, respectively; q is the side inflow per unit river length; A is the area of the discharge section; u and R are the average flow velocity and hydraulic radius of the discharge section, respectively; G is the acceleration of gravity.
Initial conditions: the velocity field is taken as the static field, and the water level is taken as the water level value of the control section. The marginal conditions of the model are mainly composed of initial conditions and boundary conditions. The initial conditions of the model do not take into account the difference between the internal control water level of different secondary polders and the control water level of regional main rivers under flood control conditions.
The simulation range starts from the Wusong River in the north, ends at the Huangpu River in the south, ends at Wusongkou in the east, and ends at Jinze in the west, covering an area of 1172 km2. There are about 5672 river sections with a total length of 2986.4 km, 12,325 cross sections created, and 990 gate pumping stations, and the model study area is shown in Figure 4.
The Qingsong area is one of the 14 water conservancy sections in Shanghai. Pump gates have been built around it to form a relatively closed hydraulic boundary. Inflow boundary conditions were adopted for the diversion gate. According to the pump gate operation and water level boundary control, the water level in Zhaotun, Dianshan Lake, Jinze, Dongtuan, Mishidu, Wusongkou, the east gate of the Dianpu River, and the estuary gate of Suzhou were selected as the water level boundary. The water level process of each border is shown in Figure 5, Figure 6 and Figure 7.

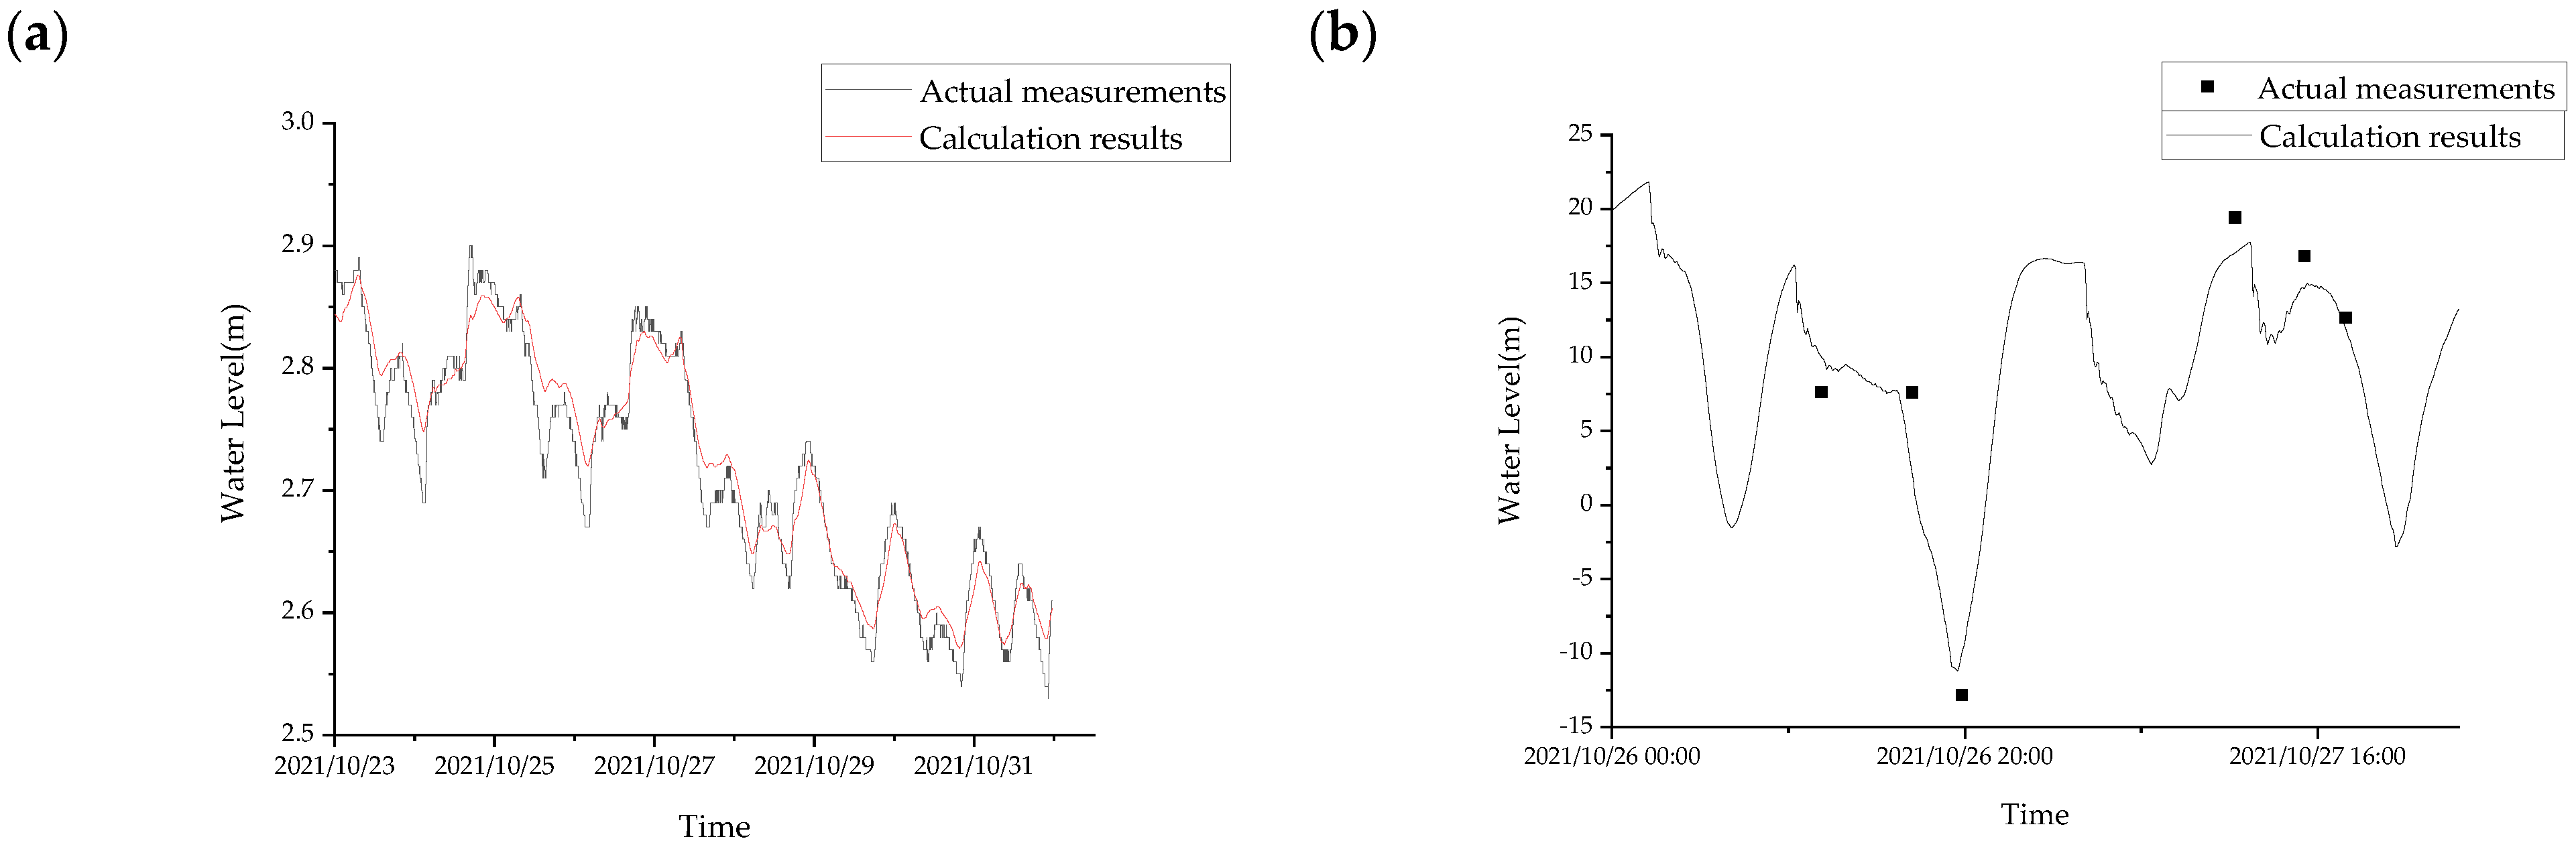
2.3.2. Calibration and Validation of the Model

The prototype observation data from June 3 to 12, 2021 were used to calibrate and validate the model. The selected internal stations are the south gate of Qingpu and Sijing. The final determination of the primary river channel is Huangpu River n = 0.018, Suzhou River n = 0.023, and Dianpu River with n = 0.025; the secondary river channel (Xinjing Gang, Longhua Gang, Puhuitang, etc.) with n is between 0.025 and 0.030, and the tertiary river channel (Xiaolai Gang, Beixiajiabang, etc.) with n is 0.03–0.04.
The prototype observation data from 23 October to 1 November 2021 were used for model verification. The results indicate that the maximum water level error was less than 5 cm when the water level sequence and monitoring water level sequence were calculated at the selected water level rate fixed point of the south gate of Qingpu, as shown in Figure 8; the flow rate in the north of Xintong Botang–Dianpu River was selected as the fixed point to calculate the measured flow value of the flow sequence river, and the average error was less than 20%.

3. Results and Discussion

3.1. Assessment of Current Regulation Scheme

During the prototype observation period (23rd to 31st October), the Qingsong area went through a spring tide and a neap tide. The hydrodynamic model of the river network of the Qingsong area was used for numerical simulation and calculation, and the water diversion and drainage along the periphery of the Qingsong area were counted during this period, as shown in Table 1.
During this period, the total water diversion volume of the Qingsong area was 51.82 million m3, and the entire drainage volume was 71.21 million m3, and the net water displacement (water displacement minus water diversion) was 19.39 million m3. Wusong River has a high water level, the gates along the river are open, and the water flows from north to south. The average daily water diversion was about 3.08 million m3, which is the main water diversion channel, accounting for 53% of the total. The water level of Dianshan Lake is high, and the west gate of Dianshan gate is open for operation. The water flow moves from west to east. The average daily water diversion volume is about 0.39 million m3. The water diversion is relatively smooth, accounting for 7%. The Diandong pump gate discharges water at two tides every day, with an average daily discharge of 3.28 million m3, which is the main drainage channel, accounting for 42% of the total. The Huangpu River has an extensive tidal range, and the entrances along the line are single-row and double diversion, which is the main water diversion and drainage channel of the Qingsong area, with the water diversion volume accounting for 21% and the drainage volume accounting for 44%. Along the Lanlu Gang is also an important diversion and drainage channel, with the diversion volume accounting for 19% and the drainage volume accounting for 13%.
As for the plain river network area, the water conservancy control area is used for flood control and drainage, but it is also easy to cause poor water body exchange inside and outside the area. The exchange of the river body not only improves the fluidity of the water body and enhances the reoxygenation of the river, but also increases the water environment capacity of the river. Therefore, the Qingsong area needs to maintain a certain water body exchange with the outside. To evaluate the exchange between the internal river channel and the surrounding water body of the Qingsong area, the concept of the water body exchange cycle is adopted. The water body exchange cycle is defined as:
T = W Q 86400
Among them, T is the water body exchange period (d), Q is the average diversion flow of the river network (m3/s), and W is the total tank storage of the river network (m3).
It is calculated that the exchange period between the backbone rivers of the Qingsong area and the surrounding water body is 4.3 days.
During the period from October 28 to 31, the Huangpu River experienced neap tides, and the daily high tide level continued to decrease. The water level in the inner river of the Qingsong area was higher than that of the Huangpu River for most of the time during this period, causing the water level in the Qingsong area to continue to decrease, as shown in Figure 9.

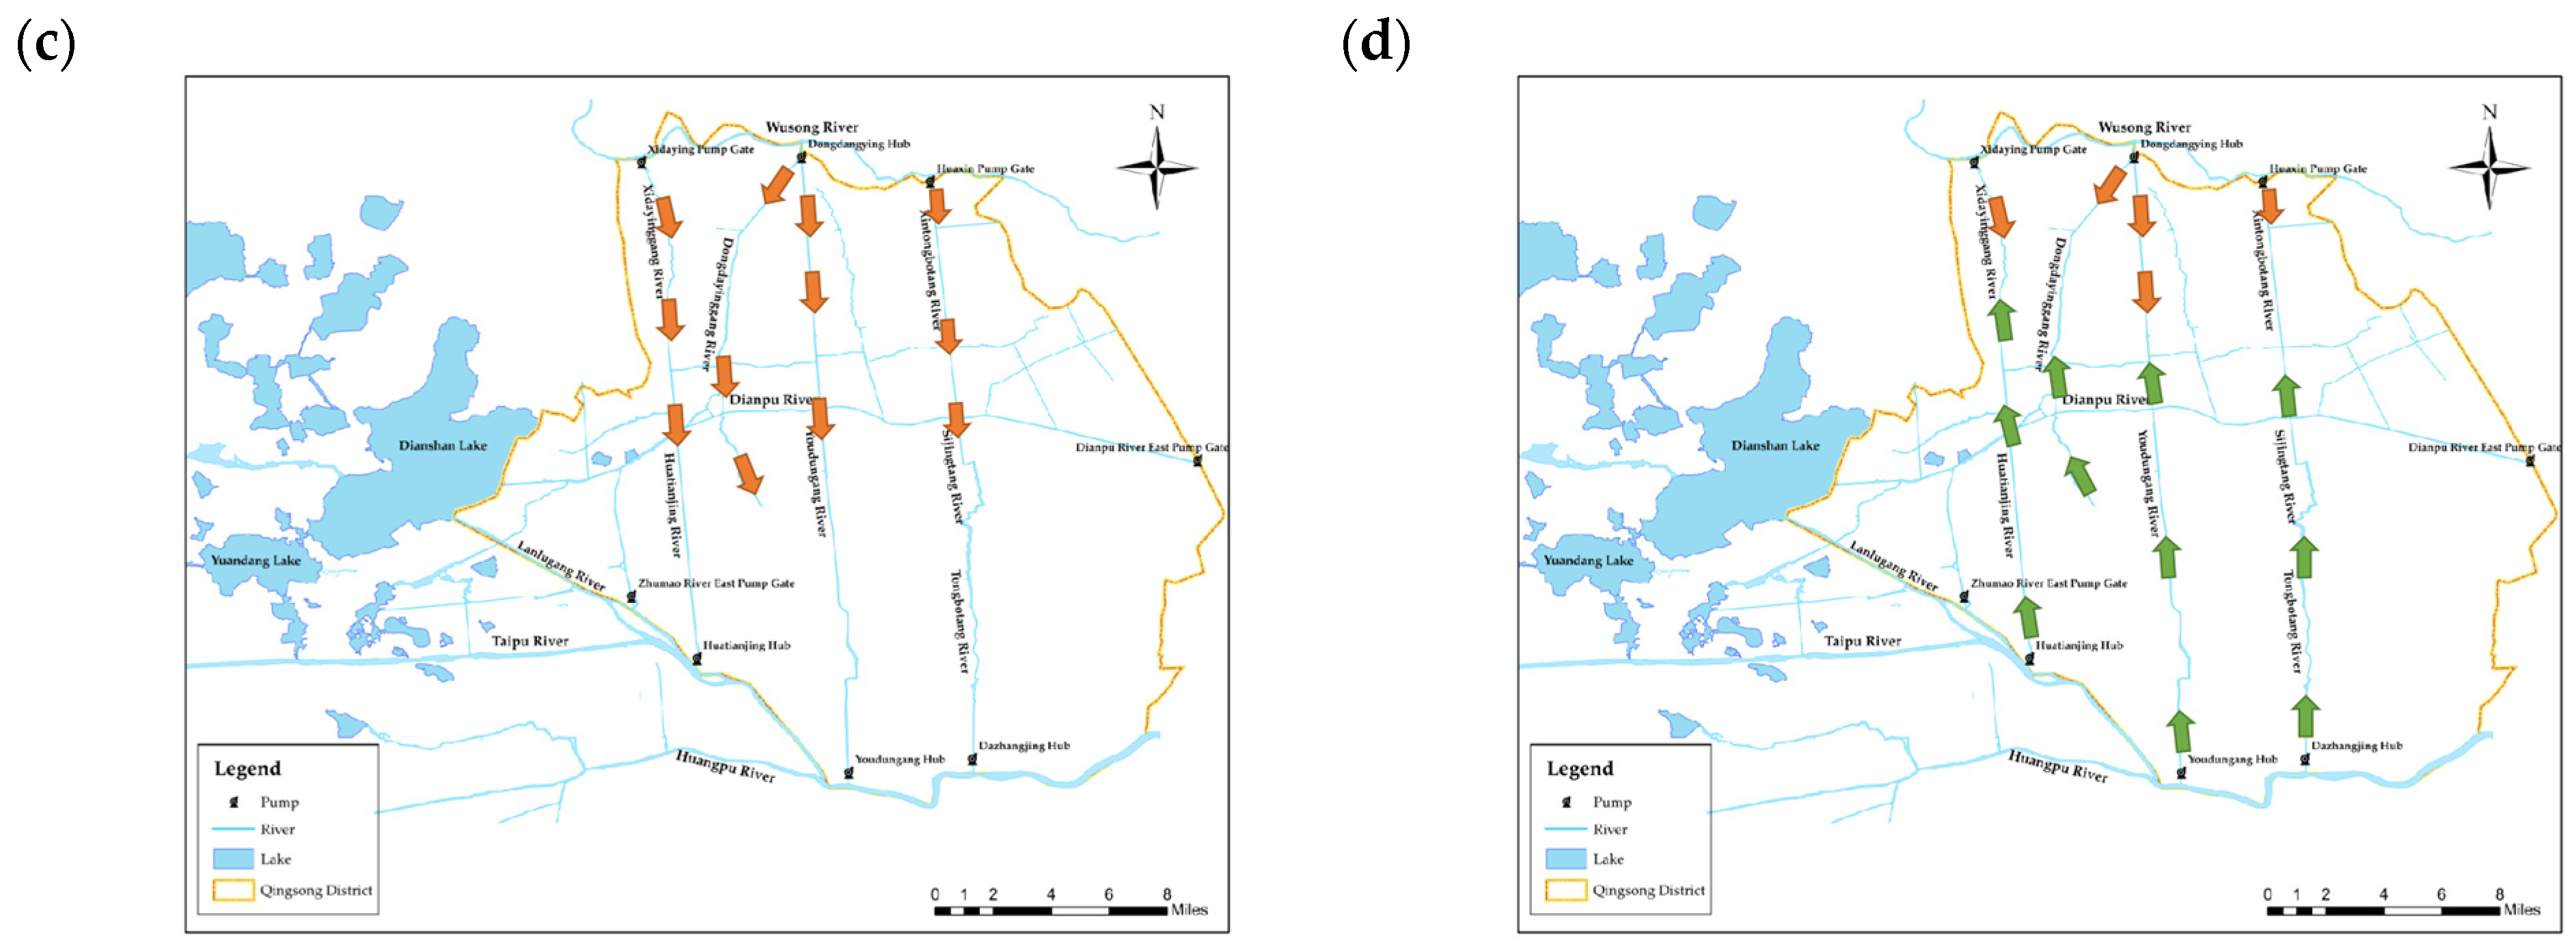
3.2. Optimal Regulation Scheme

During the neap tide, the water level of the Huangpu River decreased significantly, and the Qingsong area diverted less water from the Huangpu River and drained more water, resulting in the overall low water level in the area. The following two optimization schemes are proposed based on the general idea of reducing the drainage of the Qingsong area during neap tide.
Case 1: when the peripheral tide level is low, the regulation of Huatianjing hub along the Lanlu Gang and hubs along the Huangpu River will be changed to two tides and one tide every day.
Case 2: when the peripheral tide level is low, the regulation of Huatianjing hub along the Lanlu Gang and hubs along the Huangpu River will be changed to only diversion but not discharge.
The prototype observation data from 28th to 31st October were selected for a numerical simulation calculation, and the calculation results of the diversion and drainage flow of the Qingsong area under optimal regulation are shown in Table 2.
The results of case 1 show that the water diversion and drainage along the periphery of the Qingsong area have changed, while the water diversion along the Huangpu River has basically remained unchanged, and the water drainage has significantly decreased; the water diversion along the Lanlu Gang has increased and the drainage has decreased; the water diversion and drainage along the Wusong River have reduced; the water diversion of the west gate of the Dianpu River decreased, while the water discharge remained unchanged; and the water diversion of the east pump gate of the Dianpu River remained unchanged, while the drainage volume increased significantly.
The results of case 2 indicate that the water diversion and drainage along the peripheral areas of the Qingsong area have changed, and the water diversion and drainage along the Huangpu River, the Lanlu Gang–Mao River–Xietang, and Wusong River have decreased to zero; the water diversion of the west gate of the Dianpu River decreased, while the water drainage remained unchanged; and the water diversion of the east pump gate of the Dianpu River remained unchanged, and the drainage volume increased significantly.
Taking the south gate of Qingpu as an example, the process of water level in the internal riverway of the Qingsong area under the current regulation and the two optimization schemes is shown in Figure 10. Under the current scheme, the lowest water level of the south gate of Qingpu fluctuated between 2.54 and 2.64 m. After the optimization of case 1, the lowest water level of the south gate of Qingpu increased by 2.60–2.64 m, and the lowest water level increased by 0.06 m; after the optimization of case 2, the lowest water level at the south gate of Qingpu increased by 2.64–2.69 m, with about 0.05–0.10 m overall.
The regulation of water level rise during neap tide is based on the main idea of reducing the net drainage flow of the Qingsong area by means of optimizing the regulation along the Huangpu River and the Lanlu Gang; the assessment principle is to evaluate the effect of the water level rise in the internal river of the Qingsong area during the neap tide. Table 3 shows the comparison of the two optimal regulation schemes.
The results indicate that, for case 1, the water diversion and drainage of the Qingsong area in neap tide are reduced, the net water drainage is reduced, and the water level within the area is increased by about 0.02–0.06 m, but the water level is not increased significantly; for case 2, the net water drainage is significantly reduced, and the overall water level in the area is about 0.05–0.10 m higher, but the water diversion and drainage of the Qingsong area are significantly reduced, and the water body exchange capacity inside and outside the area is significantly reduced, which will reduce the water environment capacity of the Qingsong area.
It is worth exploring how to control water levels in the sensitive tidal plain river network. A relatively higher water level increases the capacity of the water environment and makes the landscape better, but discharges less water and reduces water exchange; therefore, in areas with better water quality, one should attempt to increase the water level and reduce water exchange to maintain a good landscape effect; for areas with poor water quality, increasing the exchange is the highest priority. The water quality of the Qingsong area is relatively good, of type III-IV (with reference to GB 3838–2002), and it is generally recommended that the original dispatching be maintained; for areas where the landscape water level is required, the optimal dispatching scheme of water level enhancement is adopted as appropriate.

4. Conclusions

In this paper, through prototype observation and river network hydrodynamic numerical simulation, we elaborated the river flow and flow velocity distribution of the backbone rivers in the tidal plain during large and small tides, assessed the water resources regulation effect of the Qingsong area, and proposed an optimization plan. The main conclusions are as follows:
  • A prototype hydrodynamic observation test in the Qingsong area was carried out. The water resources in Qingpu District are regulated to make full use of the tidal power, and the overall pattern of diversion and drainage is excellent. During the periphery spring tide, the tidal range in the upper reaches of the Huangpu River is large, the maximum daily tidal range is 1.55 m, and the water level difference with the south gate of Qingpu is large, so the natural conditions for large diversion and large drainage are available; the water level of the Wusong River and Dianshan Lake is generally slightly higher than that of the south gate of Qingpu, which has the natural condition of diverting water from the west and the north; and the tidal range outside the Diandong gate is large. The water level difference with the south gate of Qingpu is large, and the low-tide drainage is relatively smooth. The south–north backbone river course of the Qingsong area is generally from north to south, with a maximum flow of 10–68 m3/s. During the peak water diversion period of the Huangpu River on a two-day basis, the two water diversion streams from north to south meet in the north of the Shangda River, and the water diversion flow in the south of the junction area is greater than that in the north. The east–west channel flows from west to east as a whole. The flow of the Dianpu River is relatively large, with a maximum flow of about 48 m3/s, and the flow of the Shangda River is relatively small.
  • A water resources regulation assessment in Qingpu District was carried out. The water level of Wusong River is high and the gates along the river are open, with water flowing from north to south, diverting an average of 3.08 million cubic meters of water per day, accounting for 53% of the water diverted. The water level of Dianshan Lake is high, and the west gate of Dianshan Lake is open for operation. The average daily water diversion is about 0.39 million m3, accounting for 7%. The Diandong pumping gate drains water at two tides every day, with an average daily drainage of 3.28 million m3, accounting for 42% of the total. The Huangpu River has a large tidal range, and the entrances along the line are single-row and double diversion, which is the main water diversion and drainage channel of the Qingsong area, with the water diversion volume accounting for 21% and the drainage volume accounting for 43%. The exchange period between the backbone river of the Qingsong area and the surrounding water body is 4.3 days.
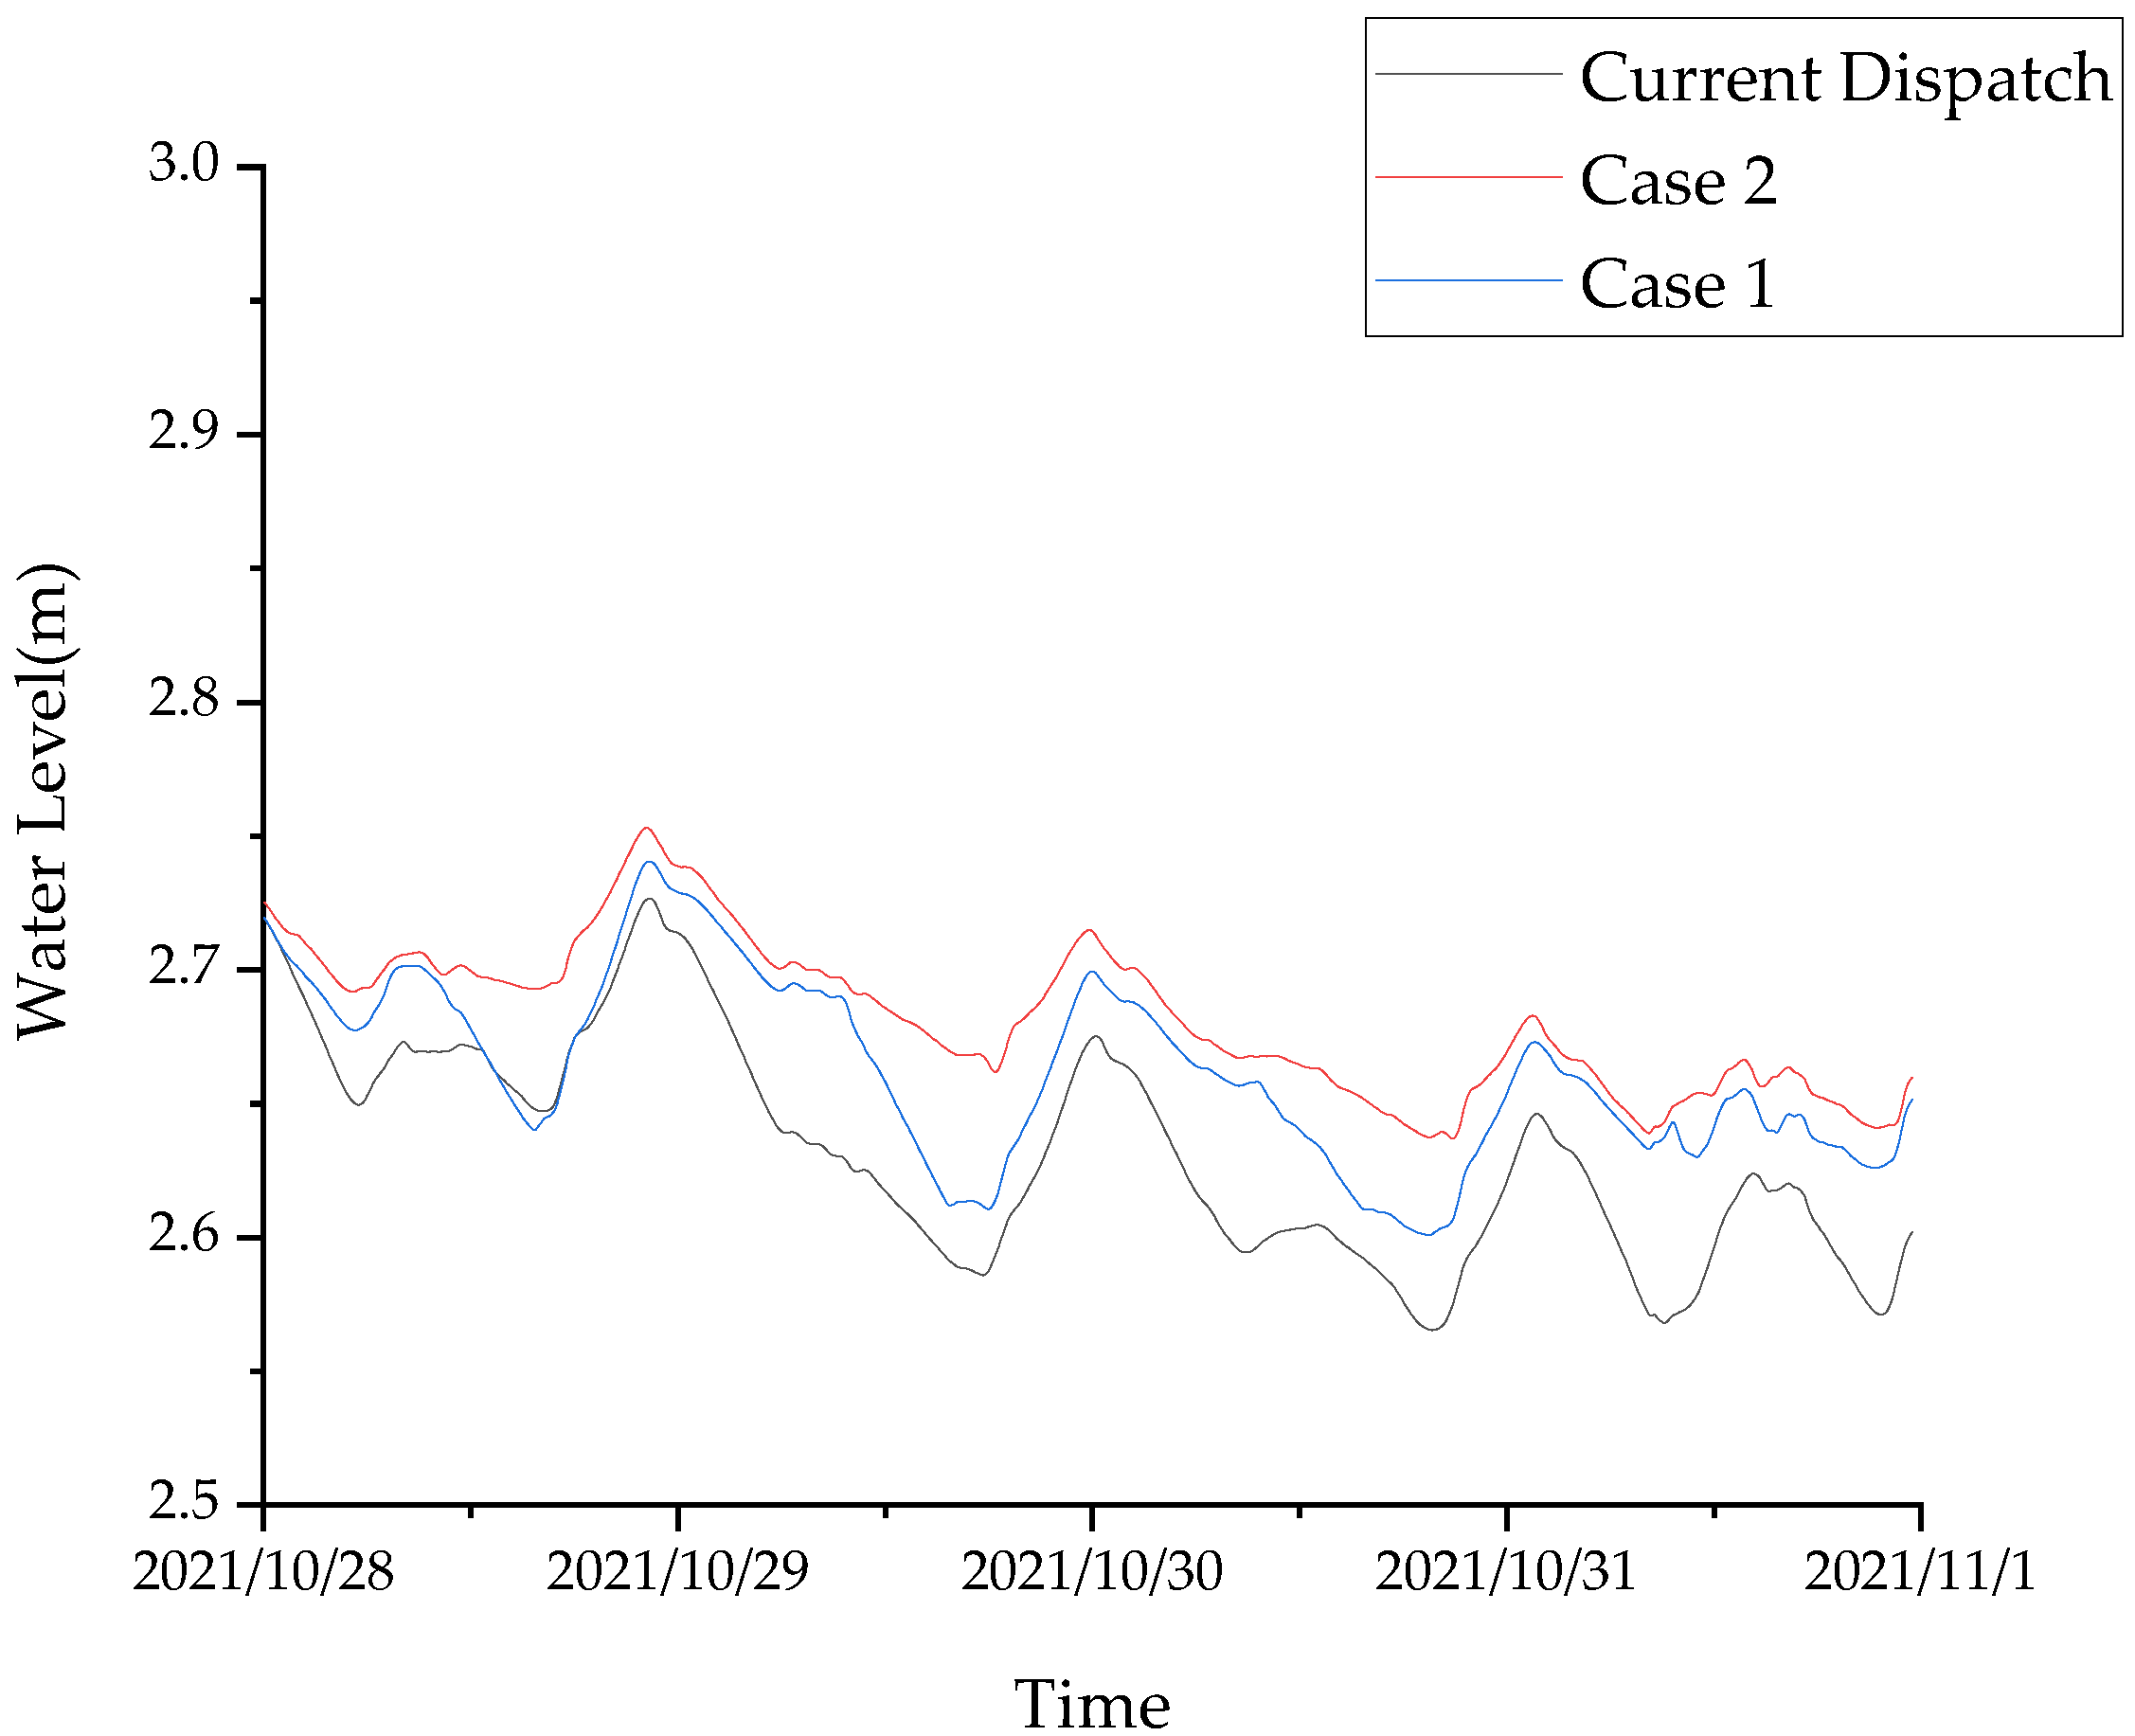
  • During the neap tide, the tidal power in the upper reaches of the Huangpu River is obviously weakened. The water level along the Huangpu River is mainly drained, and the water level in the area continues to decrease. Therefore, an optimal regulation scheme has been developed for more diversion and less drainage along the Huangpu River. The net drainage volume is significantly reduced, and the water level in the area can be increased by 0.05–0.10 m, but the water body exchange volume inside and outside the area is reduced, which will reduce the water environment capacity of the Qingsong area. The water quality of the Qingsong area is relatively good, and it is generally recommended that the original dispatching be maintained; for areas where the landscape water level is required, the optimal dispatching scheme of water level enhancement is adopted as appropriate.
  • The area of Qingsong is 758.23 km2; only Qingpu south gate is selected as a representative station for the model rate validation in this paper, and only Xintongbodang–Dianpu River is selected for the flow rate. In the future, more representative sites will be selected to enhance observations and increase the range of water level and flow rate validation to improve the accuracy of the model.

Author Contributions

Conceptualization, J.L. and R.D.; methodology, J.L.; validation, Z.F. and W.Z.; formal analysis, R.D.; investigation, Y.C. and J.M.; resources, R.D., Z.F., and J.L.; data curation, Y.C.; writing—original draft preparation, J.L.; writing—review and editing, R.D. and Z.F.; visualization, J.L.; supervision, R.D.; funding acquisition, Z.F. All authors have read and agreed to the published version of the manuscript.

Funding

This research was financially supported by the National Natural Science Foundation of China (51909167) and the National Key Research and Development Program of China (2019YFB2102004).

Data Availability Statement

Not applicable.

Conflicts of Interest

The authors declare no conflict of interest. The funders had no role in the design of the study; in the collection, analyses, or interpretation of data; in the writing of the manuscript; or in the decision to publish the results.

References

  1. Szabo, S.; Brondizio, E.; Renaud, F.G.; Hetrick, S.; Nicholls, R.J.; Matthews, Z.; Tessler, Z.; Tejedor, A.; Sebesvari, Z.; Foufoula-Georgiou, E.; et al. Population dynamics, delta vulnerability and environmental change: Comparison of the Mekong, Ganges–Brahmaputra and Amazon delta regions. Sustain. Sci. 2016, 11, 539–554. [Google Scholar] [CrossRef] [Green Version]
  2. Tejedor, A.; Longjas, A.; Zaliapin, I.; Foufoula-Georgiou, E. Delta channel networks: 1. A graph-theoretical approach for studying connectivity and steady state transport on deltaic surfaces. Water Resour. Res. 2015, 51, 3998–4018. [Google Scholar] [CrossRef]
  3. Sarker, S.; Veremyev, A.; Boginski, V.; Singh, A. Critical Nodes in River Networks. Sci. Rep. 2019, 9, 11178. [Google Scholar] [CrossRef] [Green Version]
  4. Gao, Y.; Sarker, S.; Sarker, T.; Leta, O.T. Analyzing the critical locations in response of constructed and planned dams on the Mekong River Basin for environmental integrity. Environ. Res. Commun. 2022, 4, 101001. [Google Scholar] [CrossRef]
  5. Shao, J.; Han, L.; Wu, S. Impact of Water Resources Regulation on River Water Environment. Adv. Hydraul. Hydroinf. 2009, 2009, 88–92. [Google Scholar]
  6. Huang, W.; Zhang, X.N.; Wang, J.Y. A Multi-Agent Simulation Model for Water Resources Allocation and Scheduling. Adv. Mater. Res. 2012, 1566, 1447–1452. [Google Scholar] [CrossRef]
  7. Li, H.; Qin, T.; Wang, X.; Wang, J.; Lei, X. Study on Water Resources Scheduling. IOP Conf. Ser. Earth Environ. Sci. 2018, 189, 052039. [Google Scholar] [CrossRef]
  8. Mortazavi-Naeini, M.; Kuczera, G.; Cui, L. Application of multiobjective optimization to scheduling capacity expansion of urban water resource systems. Water Resour. Res. 2014, 50, 4624–4642. [Google Scholar] [CrossRef]
  9. Wu, Y.; Wen, X. An Analysis and Scheduling Strategy for Water Resources. In Proceedings of the 2017 2nd International Conference on Electrical, Control and Automation Engineering (ECAE 2017), Xiamen, China, 24–25 December 2017. [Google Scholar]
  10. Yan, Y.X.; Yan, X. Research on Ecological Restoration of Qingtu Lake and Water Resources Scheduling in the Downstream of Shiyang River Basin. Appl. Mech. Mater. 2013, 2547, 973–976. [Google Scholar] [CrossRef]
  11. Zhou, Y. Study on Regional Water Resources Allocation Efficiency Based on Networking and Joint Scheduling of Reservoir Groups. Am. J. Water Sci. Eng. 2018, 4, 33–39. [Google Scholar] [CrossRef] [Green Version]
  12. Japan Land and Resources Agency. Japan’s National Comprehensive Water Resources Planning; China Water Resources and Hydropower Press: Beijing, China, 2002. [Google Scholar]
  13. Compilation Committee of Shanghai Water Conservancy Annals. Shanghai Water Conservancy Annals; Shanghai Academy of Social Sciences Press: Shanghai, China, 1997; pp. 142–144. [Google Scholar]
  14. Songbai, W.; Fengxin, Y.; Minghui, Y. Study on the optimal dispatching model of flood control system of the Plain Sensitive Tide River network gate group. Sedim. Res. 2014, 6, 57–63. [Google Scholar]
  15. Ji, R.; Li, S.; Hou, J. Energy dissipation and anti scour design for flood control (tide) drainage sluice in plain tidal river net-work area under special conditions: Taking Jiabao north area in Shanghai as an example. Water Resour. Hydropower Eng. 2020, 51 (Suppl. S1), 130–135. [Google Scholar]
  16. Tan, Q.; Zhang, J.; Xu, G.; Jia, W. Optimal scheduling of linkage operation of river pump gates and municipal pumping stations to cope with inundation. China Water Supply Drain. 2018, 34, 124–128. [Google Scholar]
  17. Zhu, X.; Li, Y.; Xu, Y.; Cheng, Y.; Zhu, X. Influence of time scale on the accuracy of hydrodynamic water quality simulation of plain sensing tidal river network. Water Resour. Conserv. 2020, 36, 67–75. [Google Scholar]
  18. Wang, S.R.; Gu, Y.C.; Yang, D.W.; Sun, J.H.; Hu, Q.F.; Zhang, X. Analysis of hydrodynamic enhancement of a typical plain city sensing tidal river network in the lower reaches of the Yangtze River. Adv. Water Sci. 2022, 33, 91–101. [Google Scholar]
  19. Zhang, W.; Fei, P. Research and Application of Water Resources Optimal Regulation in Zaozhuang City. Shandong Water Resour. Sci. Technol. 1994, 2, 48–53. [Google Scholar]
  20. Yang, M. Planning Model for Optimal Regulation of Urban Water Resources in Luoyang. Groundwater 2000, 22, 96–98. [Google Scholar]
  21. Tao, Y. Analysis on the Effect of Water Resources Regulation Project on the Improvement of Urban River Water Environment. Urban Road Bridge Flood Control. 2011, 5, 88–91. [Google Scholar]
  22. Yan, H.; Wang, F.; Wen, P. A review of distributed hydrological modeling research. Hydropower Energy Sci. 2008, 26, 1–4. [Google Scholar]
  23. Rui, X.-F.; Huang, G.-R. Current status and future of distributed hydrological models. Adv. Water Resour. Hydropower Sci. Technol. 2004, 24, 55–58. [Google Scholar]
  24. Bian, Z.; Zhou, L. An implicit characteristic line solution method for the system of Saint Venant equations. Hydrodyn. Res. Prog. 1991, 29–34. [Google Scholar]
  25. Hu, Q.Y.; Wang, F.H. Stability analysis of the 4-point linear hermitian form of the system of Saint Venant equations. J. Riverhead Univ. Nat. Sci. Ed. 2011, 39, 397–401. [Google Scholar]
  26. Bao, W.; Zhang, X.; Qu, S. Analysis and improvement of the application problem of St. Venant’s equation in tide-sensitive river sections. Hydrodyn. Res. Prog. 2010, 25, 359–366. [Google Scholar]
  27. Yuan, W.; Yang, K.; Wu, J.P. The characteristics of river structure and its classification in the urbanized plain river network. Geoscience 2007, 27, 401–407. [Google Scholar]
  28. Zuo, J.J.; Cai, Y.L. The method of classifying catchment areas in the plain river network area: Shanghai as an example. Adv. Water Sci. 2011, 22, 337–343. [Google Scholar]
  29. Yang, K. Study on the Characteristics of Water System Structure and Urbanization Response in the Plain River Network; East China Normal University: Shanghai, China, 2006. [Google Scholar]
  30. Xie, H.; Huang, J. Matching relationship between two levels of urban drainage standards in the plain river network area. J. Wuhan Univ. Eng. Ed. 2007, 40, 39–42. [Google Scholar]
  31. Yang, M.N.; Xu, Y.P.; Deng, X.J. Characteristics of river system changes in the urban centre of the plain river network. Soil Water Conserv. Bull. 2014, 34, 263–266. [Google Scholar]
  32. Dessalegne, T.; Nicklow, J.W. Evolutionary Algorithms for Optimal Control of the Illinois Waterway. In Proceedings of the World Water and Environmental Resources Congress 2003 and Related Symposia, Philadelphia, PA, USA, 23–26 June 2003. [Google Scholar]
  33. Dessalegne, T.; Nicklow, J.W. Optimal Operation of Multi-Reservoir River Systems Using an Artificial Life Algorithm. In Proceedings of the World Water and Environmental Resources Congress 2004, Salt Lake City, UT, USA, 27 June–1 July 2004. [Google Scholar]
  34. Marcinkevage, C.; Herricks, E.H. A Process-Based Ecological Model for River Network Management. In Proceedings of the World Water and Environmental Resources Congress 2005, Anchorage, AK, USA, 15–19 May 2005. [Google Scholar]
  35. Zeng, X.; Li, T.; Chen, C.; Si, Z.; Huang, G.; Guo, P.; Zhuang, X. A hybrid land-water-environment model for identification of ecological effect and risk under uncertain meteorological precipitation in an agroforestry ecosystem. Sci. Total Environ. 2018, 633, 1613–1628. [Google Scholar] [CrossRef]
  36. Zeng, X.T.; Li, Y.P.; Huang, G.H.; Liu, J. A two-stage interval-stochastic water trading model for allocating water resources of Kaidu-Kongque River in northwestern China. J. Hydroinf. 2015, 17, 551–569. [Google Scholar] [CrossRef]
  37. Zeng, X.T.; Xiang, H.; Xue, Y.; Su, Y.; Tong, Y.F.; Mao, Z.Y. A scenario-based optimization frame to adjust current strategy for population- economy-resource-environment harmony in an urban agglomeration. Sustain. Cities Soc. 2021, 67, 102710. [Google Scholar] [CrossRef]
  38. Zhuang, X.W.; Li, Y.P.; Huang, G.H.; Zeng, X.T. An inexact joint-probabilistic programming method for risk assessment in water resources allocation. CrossMark 2015, 29, 1287–1301. [Google Scholar] [CrossRef]
  39. Zeng, X.; Yang, X.; Yu, L.; Chen, H. A Mix Inexact-Quadratic Fuzzy Water Resources Management Model of Floodplain (IQT-WMMF) for Regional Sustainable Development of Dahuangbaowa, China. Water 2015, 7, 2771–2795. [Google Scholar] [CrossRef] [Green Version]
  40. Shanghai Water Affairs Planning, Design and Research Institute. Research on Key Technologies for Comprehensive Regulation of Huangpu River and Suzhou River Resources; Shanghai Water Affairs Planning, Design and Research Institute: Shanghai, China, 2007. [Google Scholar]
  41. Li, X.; Zhao, Y. Design and Result Analysis of the Qingsong Area Water Transfer Test in Qingpu District, Shanghai. Water Conserv. Eng. 2017, 28, 52–53. [Google Scholar]
  42. Qingpu District Water Affairs Bureau of Shanghai Municipality. Detailed Rules for the Implementation of Qingpu District Water Resources Regulation (Flood Control Dispatching) (Trial); Qingpu District Water Affairs Bureau of Shanghai Municipality: Shanghai, China, 2020. [Google Scholar]
  43. Ruan, R. Study on the Mechanism and Practice of Water Resources Regulation to Improve Water Quality in Plain River Network Areas—Taking the Regulation of Water Resources Diversion from Shanghai as an Example; East China Normal University: Shanghai, China, 2003. [Google Scholar]
  44. Chen, Q.; Ding, R.; Zhao, H. The Improvement Effect of Flowing Water in Plain River Network Area on Hydrodynamic Force and Water Quality. Prog. Water Resour. Hydropower Sci. Technol. 2020, 40, 8–13. [Google Scholar]
  45. Gao, C.; Chen, C.; Tang, Y. Study on the Scheme of Water Diversion from Qingsong Water Conservancy Project in Shanghai. Hydropower Energy Sci. 2012, 30, 115–119. [Google Scholar]
  46. Sarker, S. A Short Review on Computational Hydraulics in the Context of Water Resources Engineering. Open J. Model. Simul. 2022, 10, 1–31. [Google Scholar] [CrossRef]
  47. Chen, M.; Fan, Z.; Li, Y.; Wu, Y. River Simulation System Software and Application; Hehai University Press: Nanjing, China, 2010. [Google Scholar]
Figure 1. Map of the water system in Qingsong area, Shanghai.
Water 14 03523 g001
Figure 2. Overall water level process of the Qingsong Area during the original observation period.
Water 14 03523 g002
Figure 3. Flow direction of south–north backbone river, (a) single-day low tide, (b) single-day high tide, (c) double-day low tide, (d) double-day high tide (Orange arrows represent north to south flow, and green arrows represent south to north flow).
Water 14 03523 g003aWater 14 03523 g003b
Figure 4. Range of model study.
Water 14 03523 g004
Figure 5. Water level border along the Huangpu River.
Water 14 03523 g005
Figure 6. Water level process of Jinze and Dongtuan borders.
Water 14 03523 g006
Figure 7. Water level border along the Wusong River.
Water 14 03523 g007
Figure 8. Verification curve, (a) South Gate of Qingpu water Level, (b) Xintong Botang flow.
Water 14 03523 g008
Figure 9. Process of water level change at Qingpu south gate.
Water 14 03523 g009
Figure 10. The process of water level in the internal riverway of the Qingsong Area under the current regulation and the two optimization schemes.
Water 14 03523 g010
Table 1. The water diversion and drainage along the periphery of the Qingsong Area (23rd to 31st October).
The Surrounding RiverWater Diversion Volume (Million m3)Drainage Volume (Million m3)
Along the Huangpu River1071−3096
Along the Lanlu Gang985−903
Along the Wusong River2772−163
The west gate of the Dianshan River3540
Diandong pump gate0−2957
Total5182−7121
Table 2. The calculation results of the diversion and drainage flow of the Qingsong Area.
NameThe Current RegulationCase 1Case 2
Water Diversion Volume (Million m3)Drainage Volume (Million m3)Water Diversion Volume (Million m3)Drainage Volume (Million m3)Water Diversion Volume (Million m3)Drainage Volume (Million m3)
Along the Huangpu River692−1659637−7514820
Along the Lanlu Gang513−474601−3433570
Along the Wusong River1273−1311083−469860
The west gate of the Dianshan River17601370540
Diandong pump gate0−11540−17440−2115
Total2654−34182458−28841881−2155
Table 3. The comparison of the two optimal regulation schemes.
Regulation SchemesWater Diversion Volume (Million m3)Drainage Volume (Million m3)Net Water Drainage (Million m3)Minimum Daily Water Level (m)
The current regulation2654−3418−7642.54–2.64
Case 12458−2884−4262.60–2.64
Case 21881−2155−2742.64–2.69
Publisher’s Note: MDPI stays neutral with regard to jurisdictional claims in published maps and institutional affiliations.

