
Optimal Conditions to Quantify the Relationship between eDNA Concentration and Biomass in Acanthopagrus latus
by

Yi Xin
1,2,3,
Yu Guo
1,2,
Meijing Sun
1,2,
Gang Yu
1,2,
Zhenhua Ma
1,2,
Kun Pei
4 and
Chuanxin Qin
1,2,* 1
Key Laboratory of Efficient Utilization and Processing of Marine Fishery Resources of Hainan Province, Sanya Tropical Fisheries Research Institute, Sanya 572018, China
2
South China Sea Fisheries Research Institute, Chinese Academy of Fishery Sciences, Guangzhou 510300, China
3
School of Marine Science and Fisheries, Jiangsu Ocean University, Lianyungang 222005, China
4
Fangchenggang Fisheries Technology Extension Station, Fangchenggang 538001, China
*
Author to whom correspondence should be addressed.
Water 2022, 14(21), 3521; https://doi.org/10.3390/w14213521
Submission received: 26 September 2022
/
Revised: 27 October 2022
/
Accepted: 1 November 2022
/
Published: 3 November 2022
(This article belongs to the Special Issue Responses of Marine Life to Human Activity and Environmental Stress)
Abstract
:Environmental DNA (eDNA) analysis is a useful tool for monitoring the distributions of aquatic species. eDNA can produce quantitative estimates of fish abundance, but its accuracy depends on the species and system. Therefore, its performance must be evaluated and an investigation of how fish biomass affects eDNA dynamics must be conducted on a case-by-case basis. This study evaluates how the biomass of an ecologically and socioeconomically important fish, Acanthopagrus latus, relates to the eDNA concentration in aquariums. We conducted experiments using juvenile individuals and evaluated eDNA and biomass relationships at seven different time points using a previously developed TaqMan assay targeting the cytochrome oxidase I gene to understand the effect of environmental factors on eDNA concentrations. The results from A. latus showed a strong positive linear correlation between eDNA concentration and A. latus biomass (R2 = 0.72–0.93). The eDNA concentration was negatively correlated with time 20 d after removing A. latus. Salinity significantly affected the eDNA concentration of A. latus at 3 h, and temperature significantly affected the eDNA concentration from 3 to 14 d. The combinations of factors with the greatest effect on the yellowfin seabream eDNA concentration were 35‰/30 °C/8.5, 35‰/30 °C/8.0, and 35‰/25 °C/8.5 (salinity/temperature/pH). This study identified the conditions for detecting A. latus eDNA and provided environmental data to monitor and survey yellowfin seabream biomass resources.
1. Introduction
Surveys of fishery resources have become particularly important in recent years, as aquatic ecosystems are threatened by overfishing and the effects of extreme weather. A need to drive commercial fisheries towards sustainability and to improve the management of small-scale fisheries and aquaculture exists worldwide [1]. In the past decade, the survey of aquatic organisms mainly consisted of traditional methods, such as trawling, electrofishing, angling, and acoustic measurements. However, these conventional approaches are costly and time-consuming, requiring many years of taxonomy experience, and may cause some damage to the environment. Therefore, a reliable technique must be developed to assess fishery resources for ecosystem management and production [2,3].
The yellowfin seabream Acanthopagrus latus belongs to the Perciformes and Sparidae and is widely distributed along the Arabian Sea coast, Red Sea, India, Japan, Indonesia, the Philippines, Korea, Australia, and China. This pelagic fish species live in shallow inshore water [4,5]. Because of its delicious meat and rich nutritional value, it is frequently on the dinner table. Yellowfin seabream is an important reef-dwelling economic marine fish. In recent years, yellowfin seabream resources have substantially declined due to overfishing and habitat destruction. In addition, yellowfin seabream is also a popular target for many anglers. As a result, yellowfin seabream is vulnerable to overexploitation. Yellowfin seabream resources are in serious decline. Traditional methods of resource assessment may be ecologically damaging and biologically traumatic [6,7]. Monitoring with gillnets and other passive devices has produced long and valuable time series for most species of economic or socioeconomic interest, but abundance data for benthic fishes, including yellowfin seabream, are scarce. Currently, little is known about biomass assessments of yellowfin seabream in the ocean [8,9]. An efficient and accurate survey method must be developed to better monitor the spatial and temporal distribution and dynamic changes in yellowfin seabream, and to provide data supporting resource surveys and monitoring.
Environmental DNA (eDNA) refers to genetic material obtained directly from environmental samples, such as soil, sediment, excreta, air, and water, without any obvious biogenic material using an effective, non-invasive, and easily standardized method [10]. As its detection is both cost-effective and nonlethal, eDNA has attracted particular interest for monitoring rare and endangered species [11]. In addition, eDNA technology can detect very-low-abundance species or species that are undetected using other conventional methods [12,13,14]. Recently, eDNA has also been shown to be useful in estimating the abundance of aquatic species [15]. Estimating actual population abundance is critical for the sustainable management of marine species [16]. An increasing number of studies have linked the eDNA concentration to biomass [17,18,19]. Assuming that eDNA released into water by yellowfin seabream is correlated with its biomass, we could estimate the species biomass from the eDNA copy number. However, environmental factors affect the amount of eDNA detected. Several studies have reported observational or experimental results on the effects of environmental factors on eDNA decay [20,21]. Therefore, the environmental factors affecting eDNA concentration of yellowfin seabream must be investigated to better apply eDNA technology to the quantitative analysis of yellowfin seabream in the field. These uncertainties limit the spatiotemporal inferences that can be drawn from eDNA data, thus limiting its usefulness as a monitoring tool.
In this study, we aimed to detect the eDNA content in the water released by yellowfin seabream using quantitative fluorescence PCR (qPCR) and studied the relationship between the eDNA concentration and biomass. A factorial experiment was performed to explore the effects of temperature, salinity, and pH on the yellowfin seabream eDNA concentration. This study provides a reference for the assessment of yellowfin seabream resources and monitoring the distribution pattern of yellowfin sea bream resources in the field.
2. Materials and Methods
2.1. Experimental Materials
The yellowfin seabream used in the experiment came from Yangjiang, Guangdong, China. Fish were transported alive to the Tropical Aquatic Research and Development Center of the South China Sea Fisheries Research Institute, Chinese Academy of Fisheries Sciences, for temporary rearing. All experimental equipment was bleached with a 0.1% potassium permanganate solution and then rinsed with ddH2O several times. The experimental period was from May 2021 to September 2021.
2.2. Experimental Design
2.2.1. Biomass Experiment
The experiment was conducted at the Hainan Tropical Aquatic Research and Development Center. Three replicate groups were established in white 150-L plastic barrels; the volume of water in the barrels was 100 L. Five biomass gradients were generated, namely, 1, 3, 5, 7, and 10 yellowfin seabreams (50 ± 0.76 g). A blank control group without yellowfin seabream was also established. Aeration tubes were used for continuous aeration, and fish were not fed during the experiment. The other experimental conditions remained the same. Water samples were collected at 9:00 a.m. for 7 consecutive days, and all water quality parameters, including temperature, pH, dissolved oxygen content, and salinity, were measured. Three parallel samples of each water sample and one blank control water sample were collected for 7 consecutive days, and the samples were stored at −20 °C until DNA extraction.
Three yellowfin seabreams with an average weight of 60 g were placed in a 150-L culture tank (100 L water). Three replicate groups were established. At the end of 7 d, the fish were retrieved from the tank at 9:00 a.m. on the eighth day, and 1-L water samples were collected at 9:00 a.m. every day thereafter, with three parallel samples collected at each time point for 20 d. One litre of DNA-free distilled water prepared in the laboratory was used as a negative control, and samples were stored at −20 °C until DNA extraction.
2.2.2. Environmental Factor Experiments
This experiment used an orthogonal experimental design (Table 1 and Table 2). The treatment included three levels of temperature (20 °C, 25 °C and 30 °C), salinity (15‰, 25‰, and 35‰) and pH (7.5, 8.0, and 8.5). The temperature was controlled by SUNSUN heating bars, and the temperature levels represented the optimum temperature range for the native waters of yellowfin seabreams. The salinity levels were selected to represent the salinity range of the sea area in which the yellowfin seabreams were collected. Desalination was performed according to the initial salinity of seawater (35‰) in the Tropical Aquatic Center. The pH was adjusted with HCl and NaHCO3 three times a day (morning, noon, and evening) to stabilize it. The pH levels represented a reasonable range of pH values in the experimental sea area. The experiment was conducted in white 150-L plastic buckets with a volume of water of 100 L. Each bucket contained five yellowfin seabreams. Water samples (1 L) were collected at 3, 8, 16, 24, 72, 96, 120, 168, and 336 h (0.125, 0.3, 0.7, 1, 3, 4, 5, 7, and 14 d) after transferring the yellowfin seabream into the water. Water quality parameters—namely, temperature, pH, dissolved oxygen content, and salinity—were also measured. The samples were stored at −20 °C until DNA extraction. Nine treatments were designed by orthogonal testing, and each treatment was repeated three times for a total of 27 experimental groups. Three blank groups were established per treatment for a total of 27 blank groups.
2.3. Water Sample Collection and eDNA Extraction
Before collecting water samples, the water in the bucket was gently stirred with an aeration tube to ensure that the seawater was well mixed. Water samples (1 L) were collected into 250-mL sterile polyethylene plastic bottles. The water samples were immediately extracted to obtain eDNA using glass filters with Whatman nitrocellulose membranes (47 mm diameter, 0.45 μm pore size, Cytiva, Little Chalfont, Britain). The experimental setup was wiped with 75% ethanol between each sample and then rinsed with ddH2O. After filtration, the filter membranes were placed in sterilized 2-mL centrifuge tubes. Each membrane was wrapped separately in tinfoil after filtration, placed in a sealed bag, and marked for storage at −20 °C to avoid contamination of the samples [22].
eDNA was extracted using the DNeasy Blood and Tissue Kit (Qiagen, Dusseldorf, Germany) with the appropriate procedure. The concentration of all extracted samples was assayed after nucleic acid purification using a Nano-300 ultramicro spectrophotometer (Allsheng, Hangzhou, China) and stored in a −20 °C freezer.
2.4. Quantitative eDNA Analysis
The quantitative analysis was performed using a 2 × TaqMan Fast qPCR Master Mix (Low Rox) real-time fluorescent quantitative PCR kit (BBI, Shanghai, China) and a qTOWER3 fluorescence quantitative PCR instrument. The mitochondrial cytochrome c oxidative subunit I (mtDNA CO I) gene of yellowfin seabream was selected to design specific primers and probes (Table 3), which were synthesized by Biotech Bioengineering. The PCR volume was 20 µL, including 10 µL of 2 × TaqMan Fast qPCR Master Mix, 0.4 µL of the forward primer, and 0.4 µL of the reverse primer (10 µmol/L) and 0.4 µL of probe (10 µmol/L), 6.8 µL of ddH2O, and 2 µL of the template. The reaction started with pre-denaturation at 94 °C for 3 min, followed by 40 cycles of denaturation at 94 °C for 5 s and annealing at 60 °C for 35 s. Each sample plate contained three wells serving as a negative control. The experimental data were analysed using an absolute quantitative method. The plasmid DNA concentration was diluted from 108 copies/µL in a 10-fold gradient to 10 copies/µL, and the quantitative standard curve of the target gene was constructed.
All phases of molecular experiments were performed on a separate sterile ultraclean table, and the UV sterilization unit was turned on for at least 20 min before and after each use to avoid cross-contamination.
2.5. Data Analysis
The eDNA concentration in water samples was calculated to establish the relationship between the biomass and eDNA concentration and the relationship between the eDNA concentration and time. All data were processed using Origin 9.0 and R 3.6.3 software, and errors were controlled to be within the 95% confidence intervals.
The environmental factors affecting the eDNA concentration of yellowfin seabream were analysed using Excel for an extreme difference analysis and SPSS 25.0 for analysis of variance. The environmental factors affecting the concentration of yellowfin seabream eDNA were evaluated, and the best combination of factors and levels was identified by combining the advantages and disadvantages of the factors to verify whether a correlation existed between environmental factors and the eDNA concentration of yellowfin seabream. Least significant difference (LSD) analysis was performed using SPSS to compare the differences between different levels of environmental factors. An assessment of the effect of environmental factors on the eDNA concentration at different points was performed using the GAM model.
3. Results
3.1. Variation in eDNA Concentration in Yellowfin Seabream
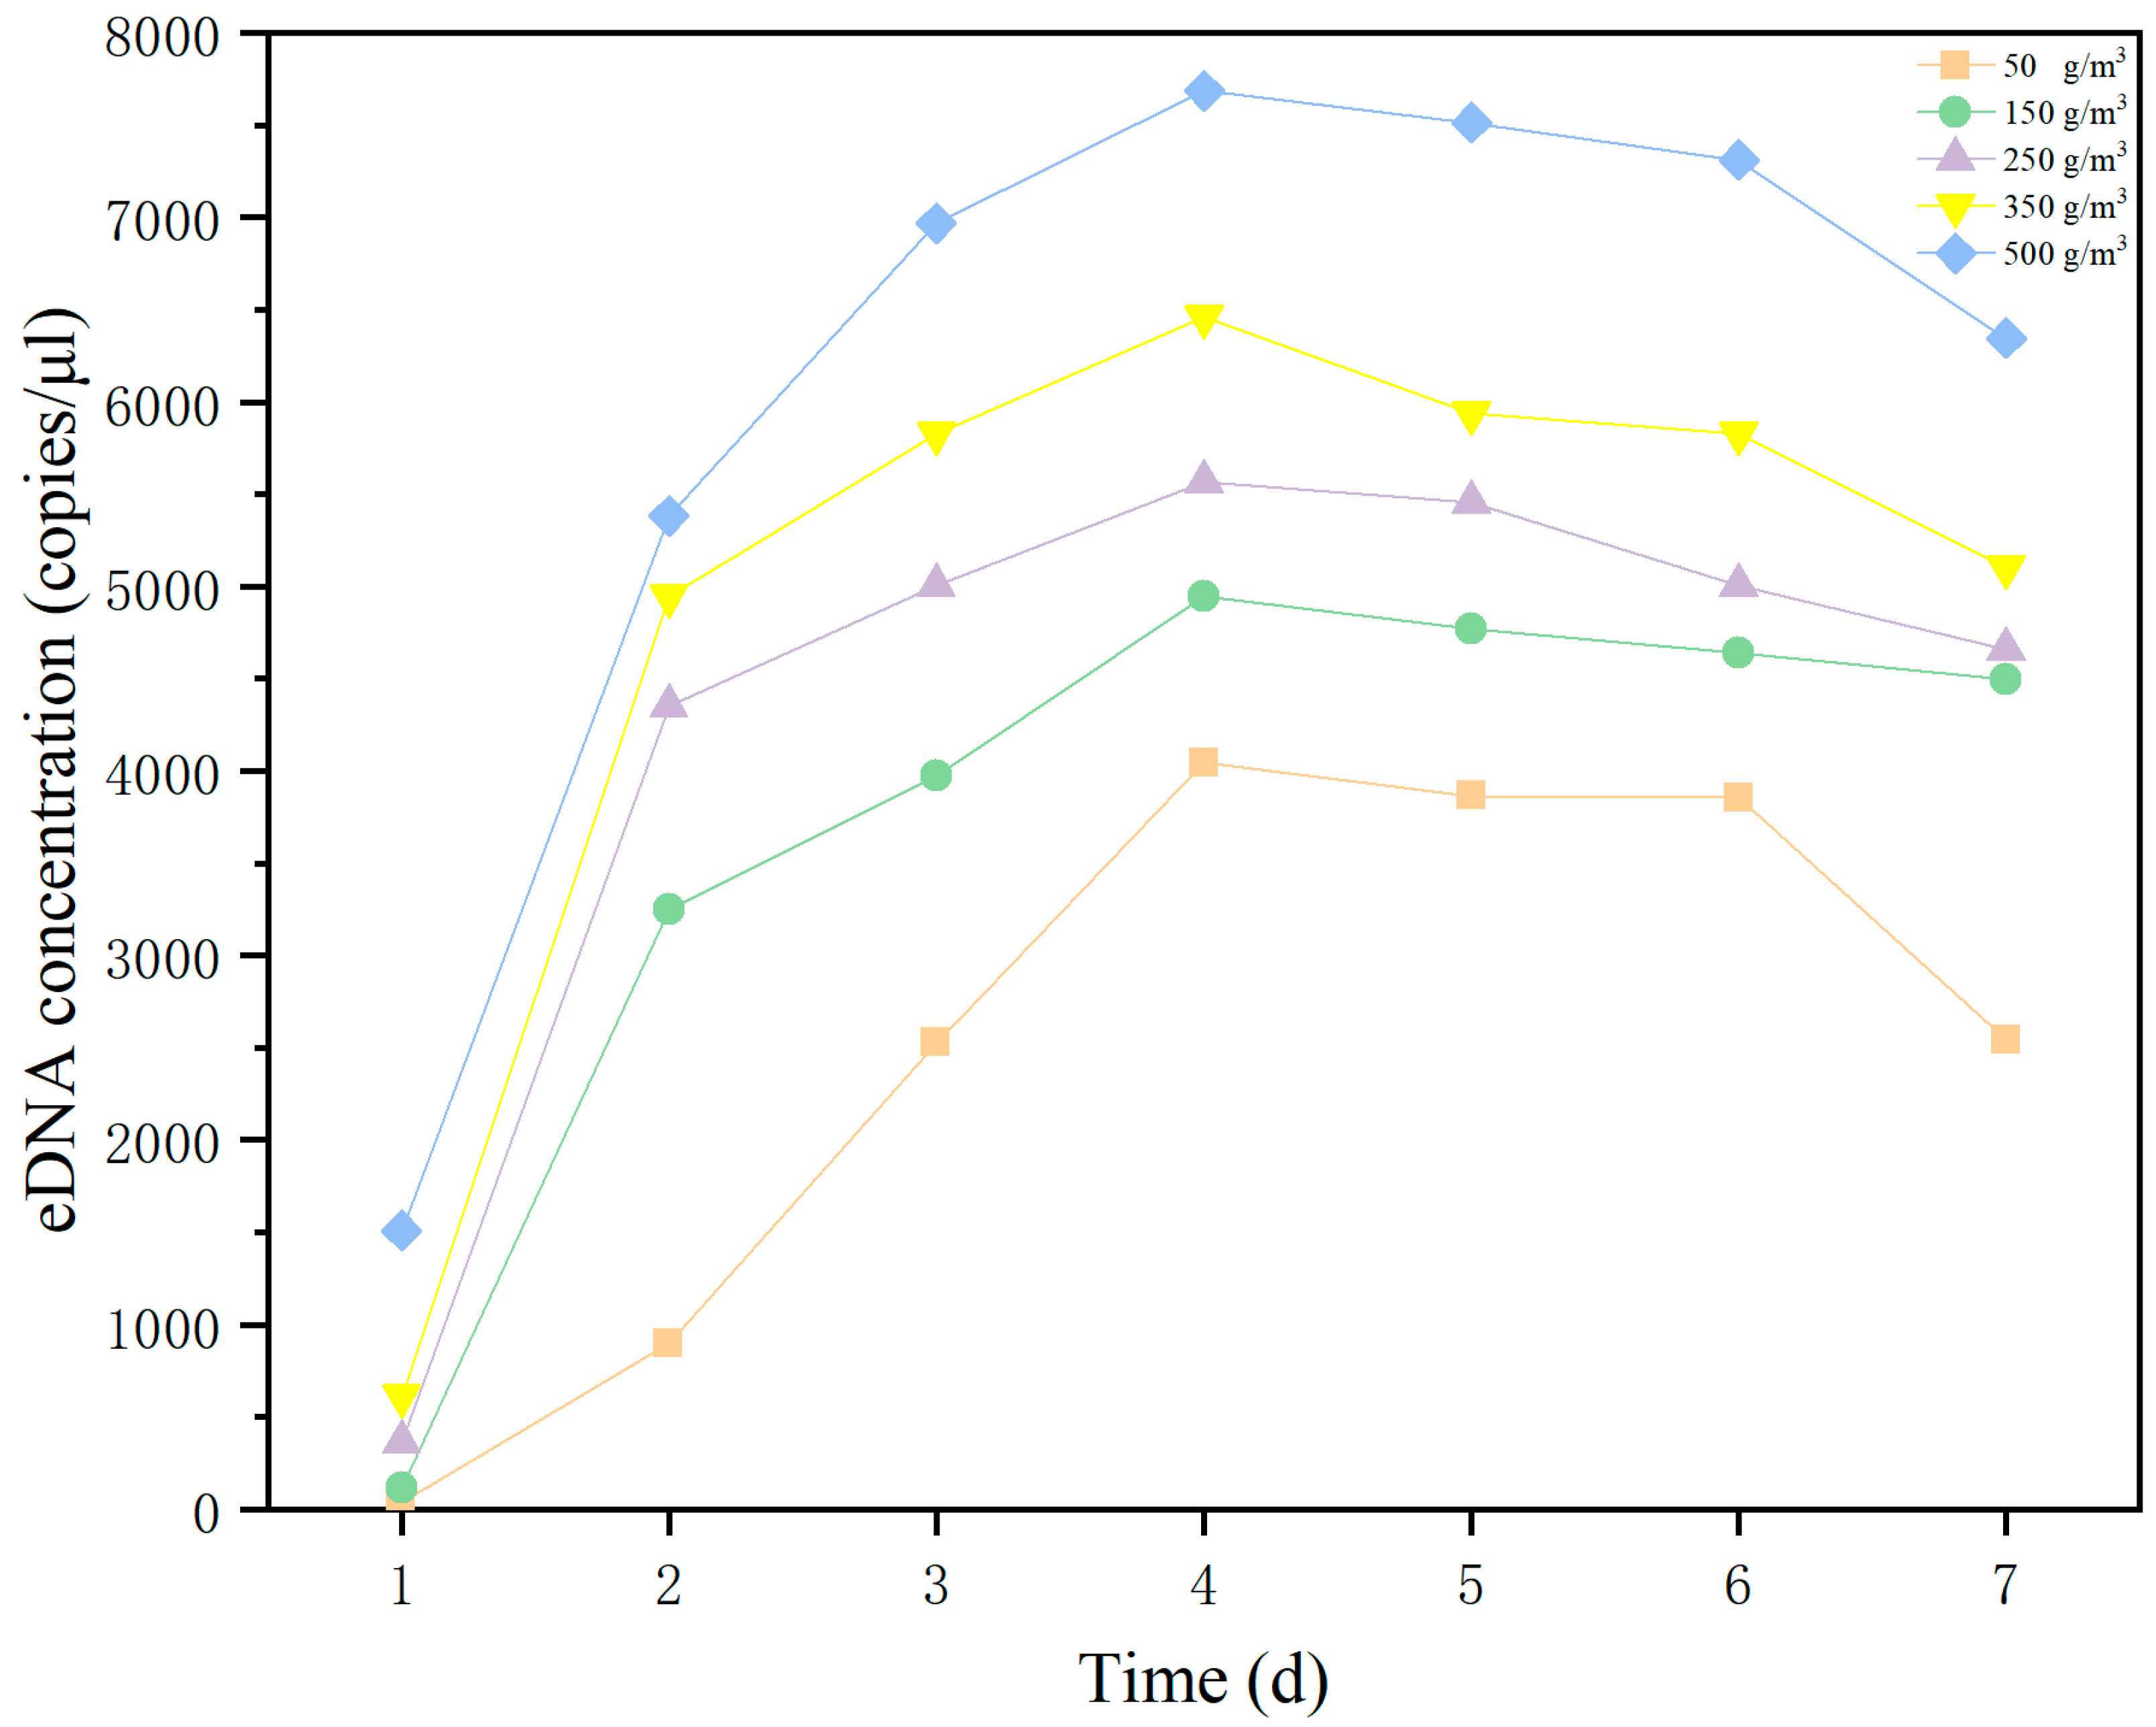
The yellowfin seabream eDNA concentrations measured at different time points after the fish were put in water are shown in Figure 1. The yellowfin seabream eDNA concentrations increased with increasing biomass. The yellowfin seabream eDNA concentration showed an increasing then decreasing trend with increasing time and reached a maximum on the 4th day with a concentration of 7686.10 ± 180.28 copies/μL. No eDNA was detected in the negative control that did not contain yellowfin seabream.
3.2. Correlation between the eDNA Concentration and Biomass of Yellowfin Seabream
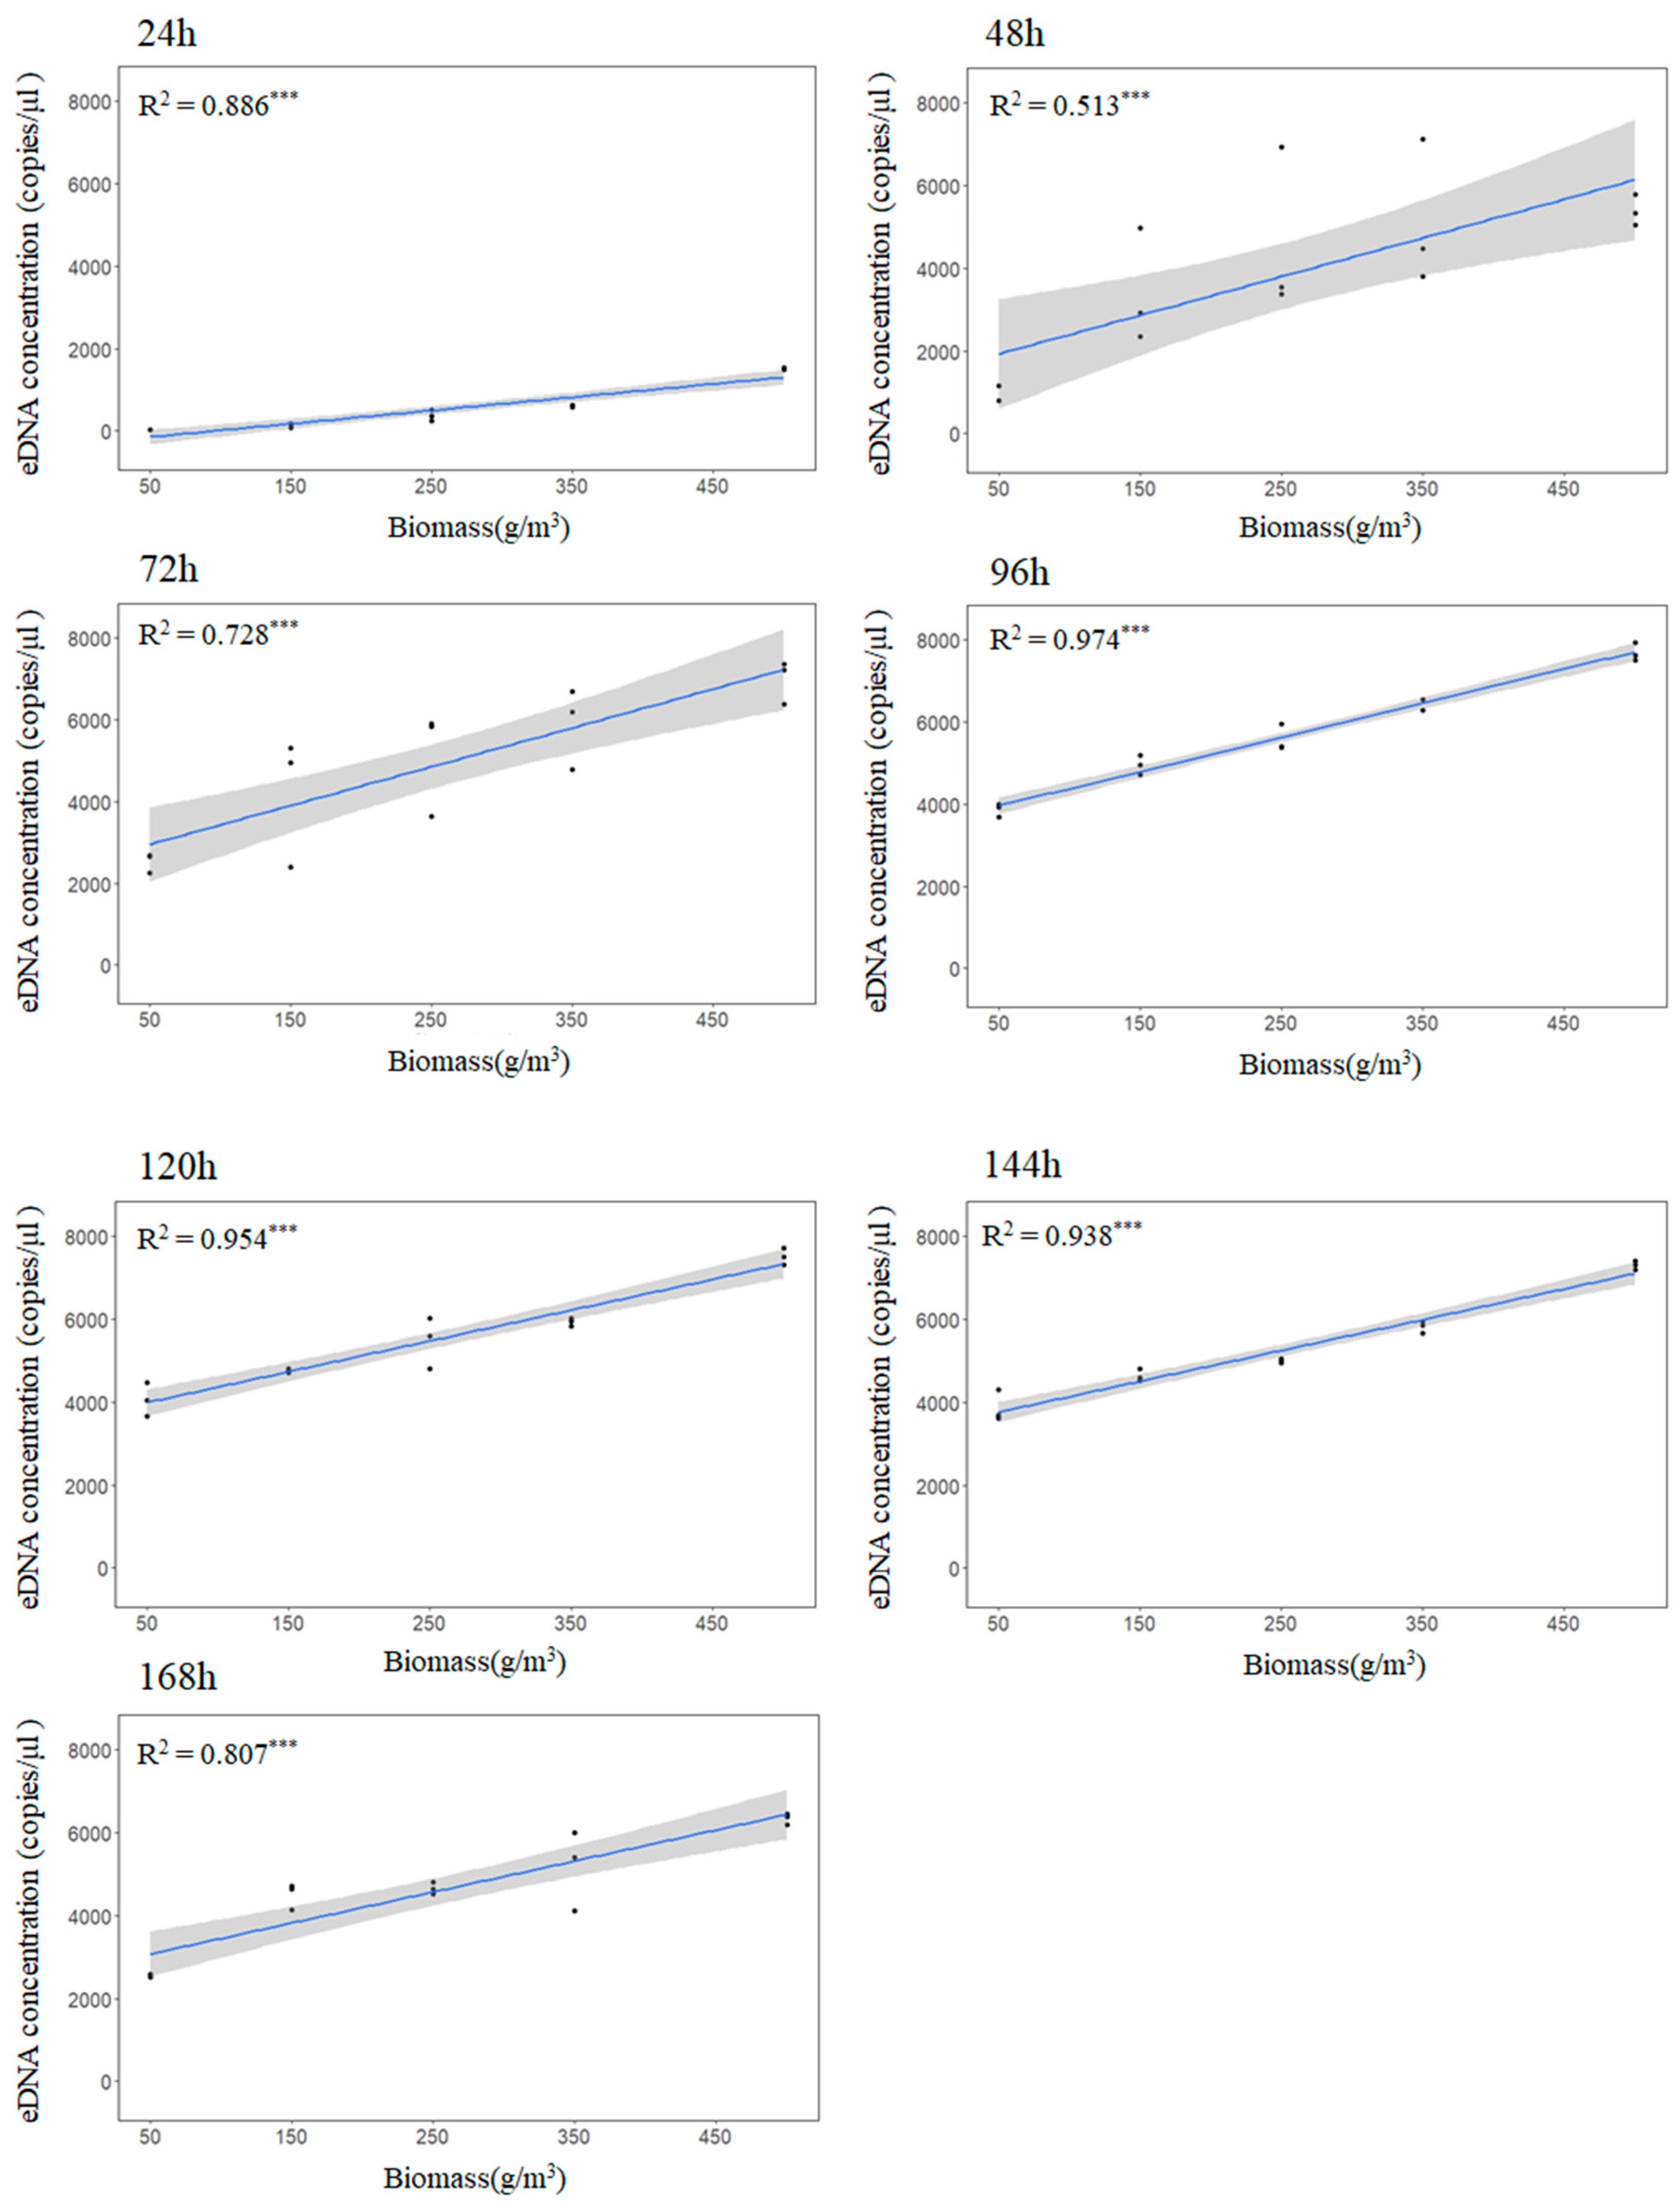
Based on the eDNA concentrations detected in the water samples from each treatment group in the experiment assessing the biomass-eDNA concentration relationship, we obtained the relationship between the biomass and eDNA concentrations of yellowfin seabream at different sampling times, as shown in Figure 2. A linear correlation was observed between the biomass and eDNA concentration of yellowfin seabream at the same sampling time (R2 = 0.72 − 0.97), and the correlation was slightly lower when the sampling time was 48 h (R2 = 0.51). The highest eDNA concentration was observed at a biomass of 500 g/m3, and the lowest eDNA concentration was detected at a biomass of 50 g/m3 during the same sampling time. The higher the biomass, the higher the eDNA concentration, which showed a linear increase.
3.3. eDNA Degradation
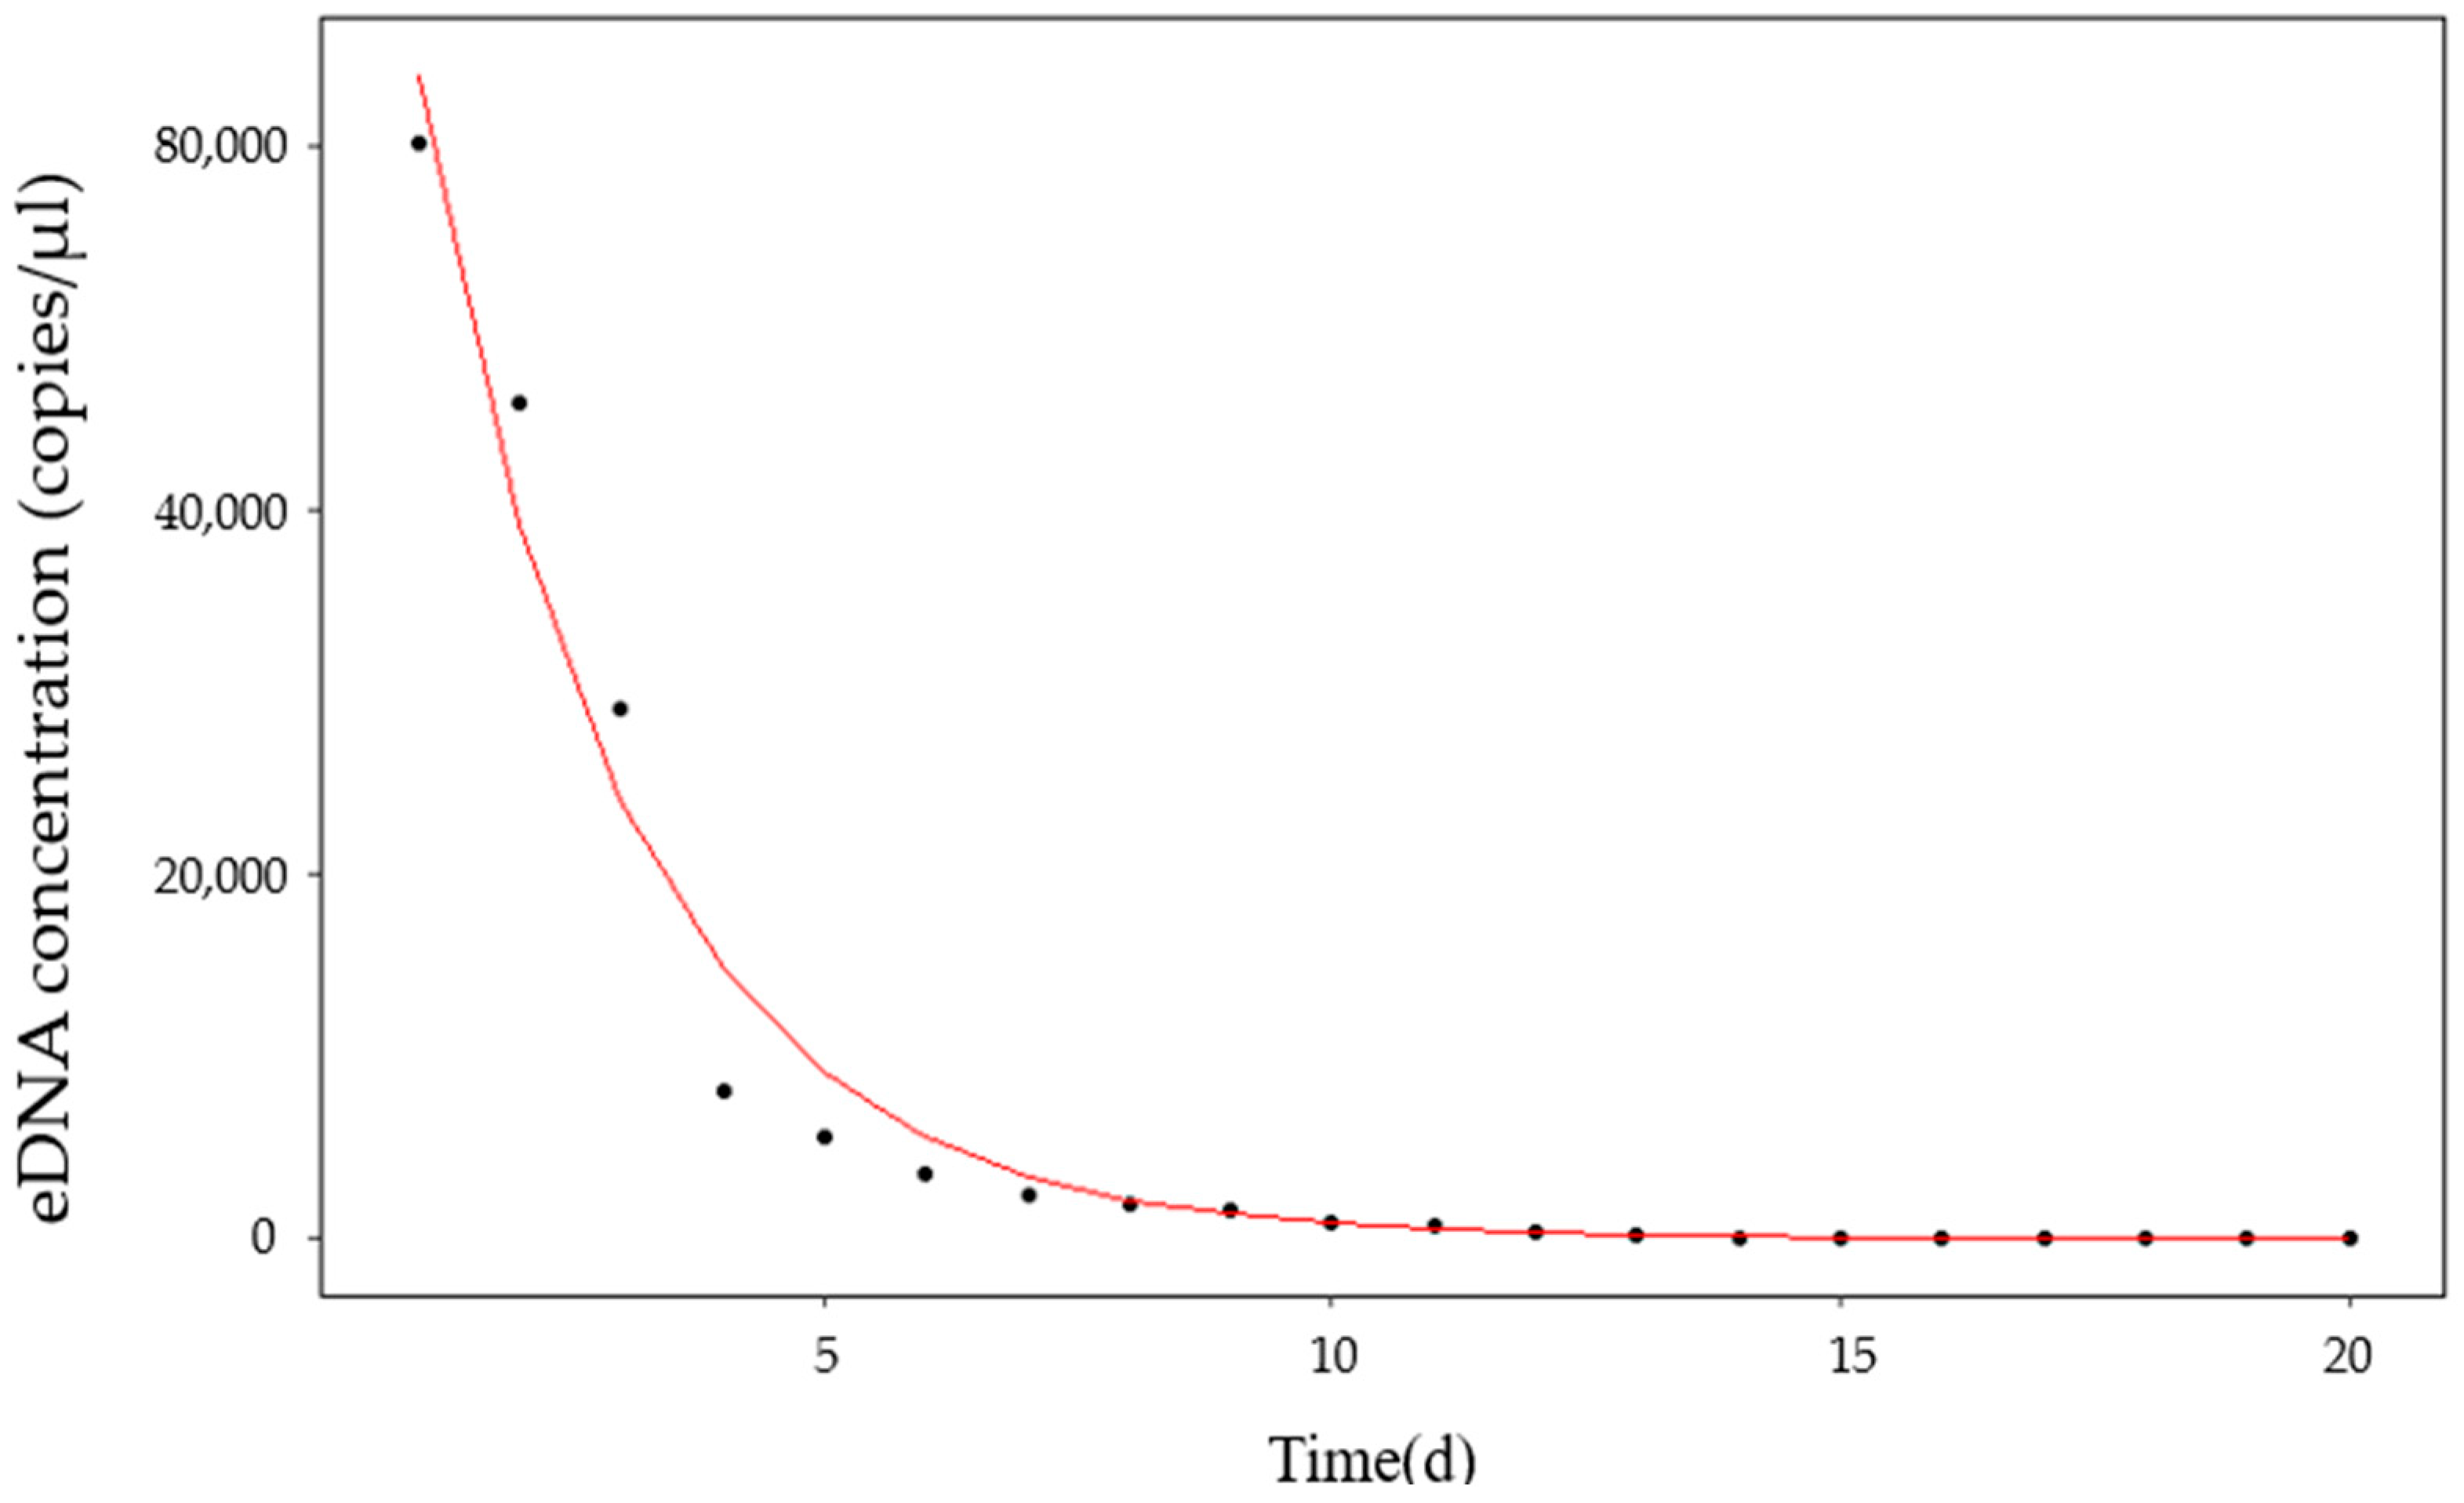
The test results showed that the level of eDNA in the water column was negatively correlated with time after the removal of yellowfin seabream. The aqueous eDNA concentration was 60,244.78 copies/μL on day 1. A low concentration of eDNA of 1.12 copies/μL was also detected on day 20. Fitting the curve between eDNA concentration degradation and time yielded the exponential function y = 1.042 × 10⁵ × e−0.49x with a correlation coefficient (R2) of 0.916 (Figure 3).
3.4. Analysis of Environmental Factor Experiments
3.4.1. Analysis of Extreme Differences in Orthogonal Experiments
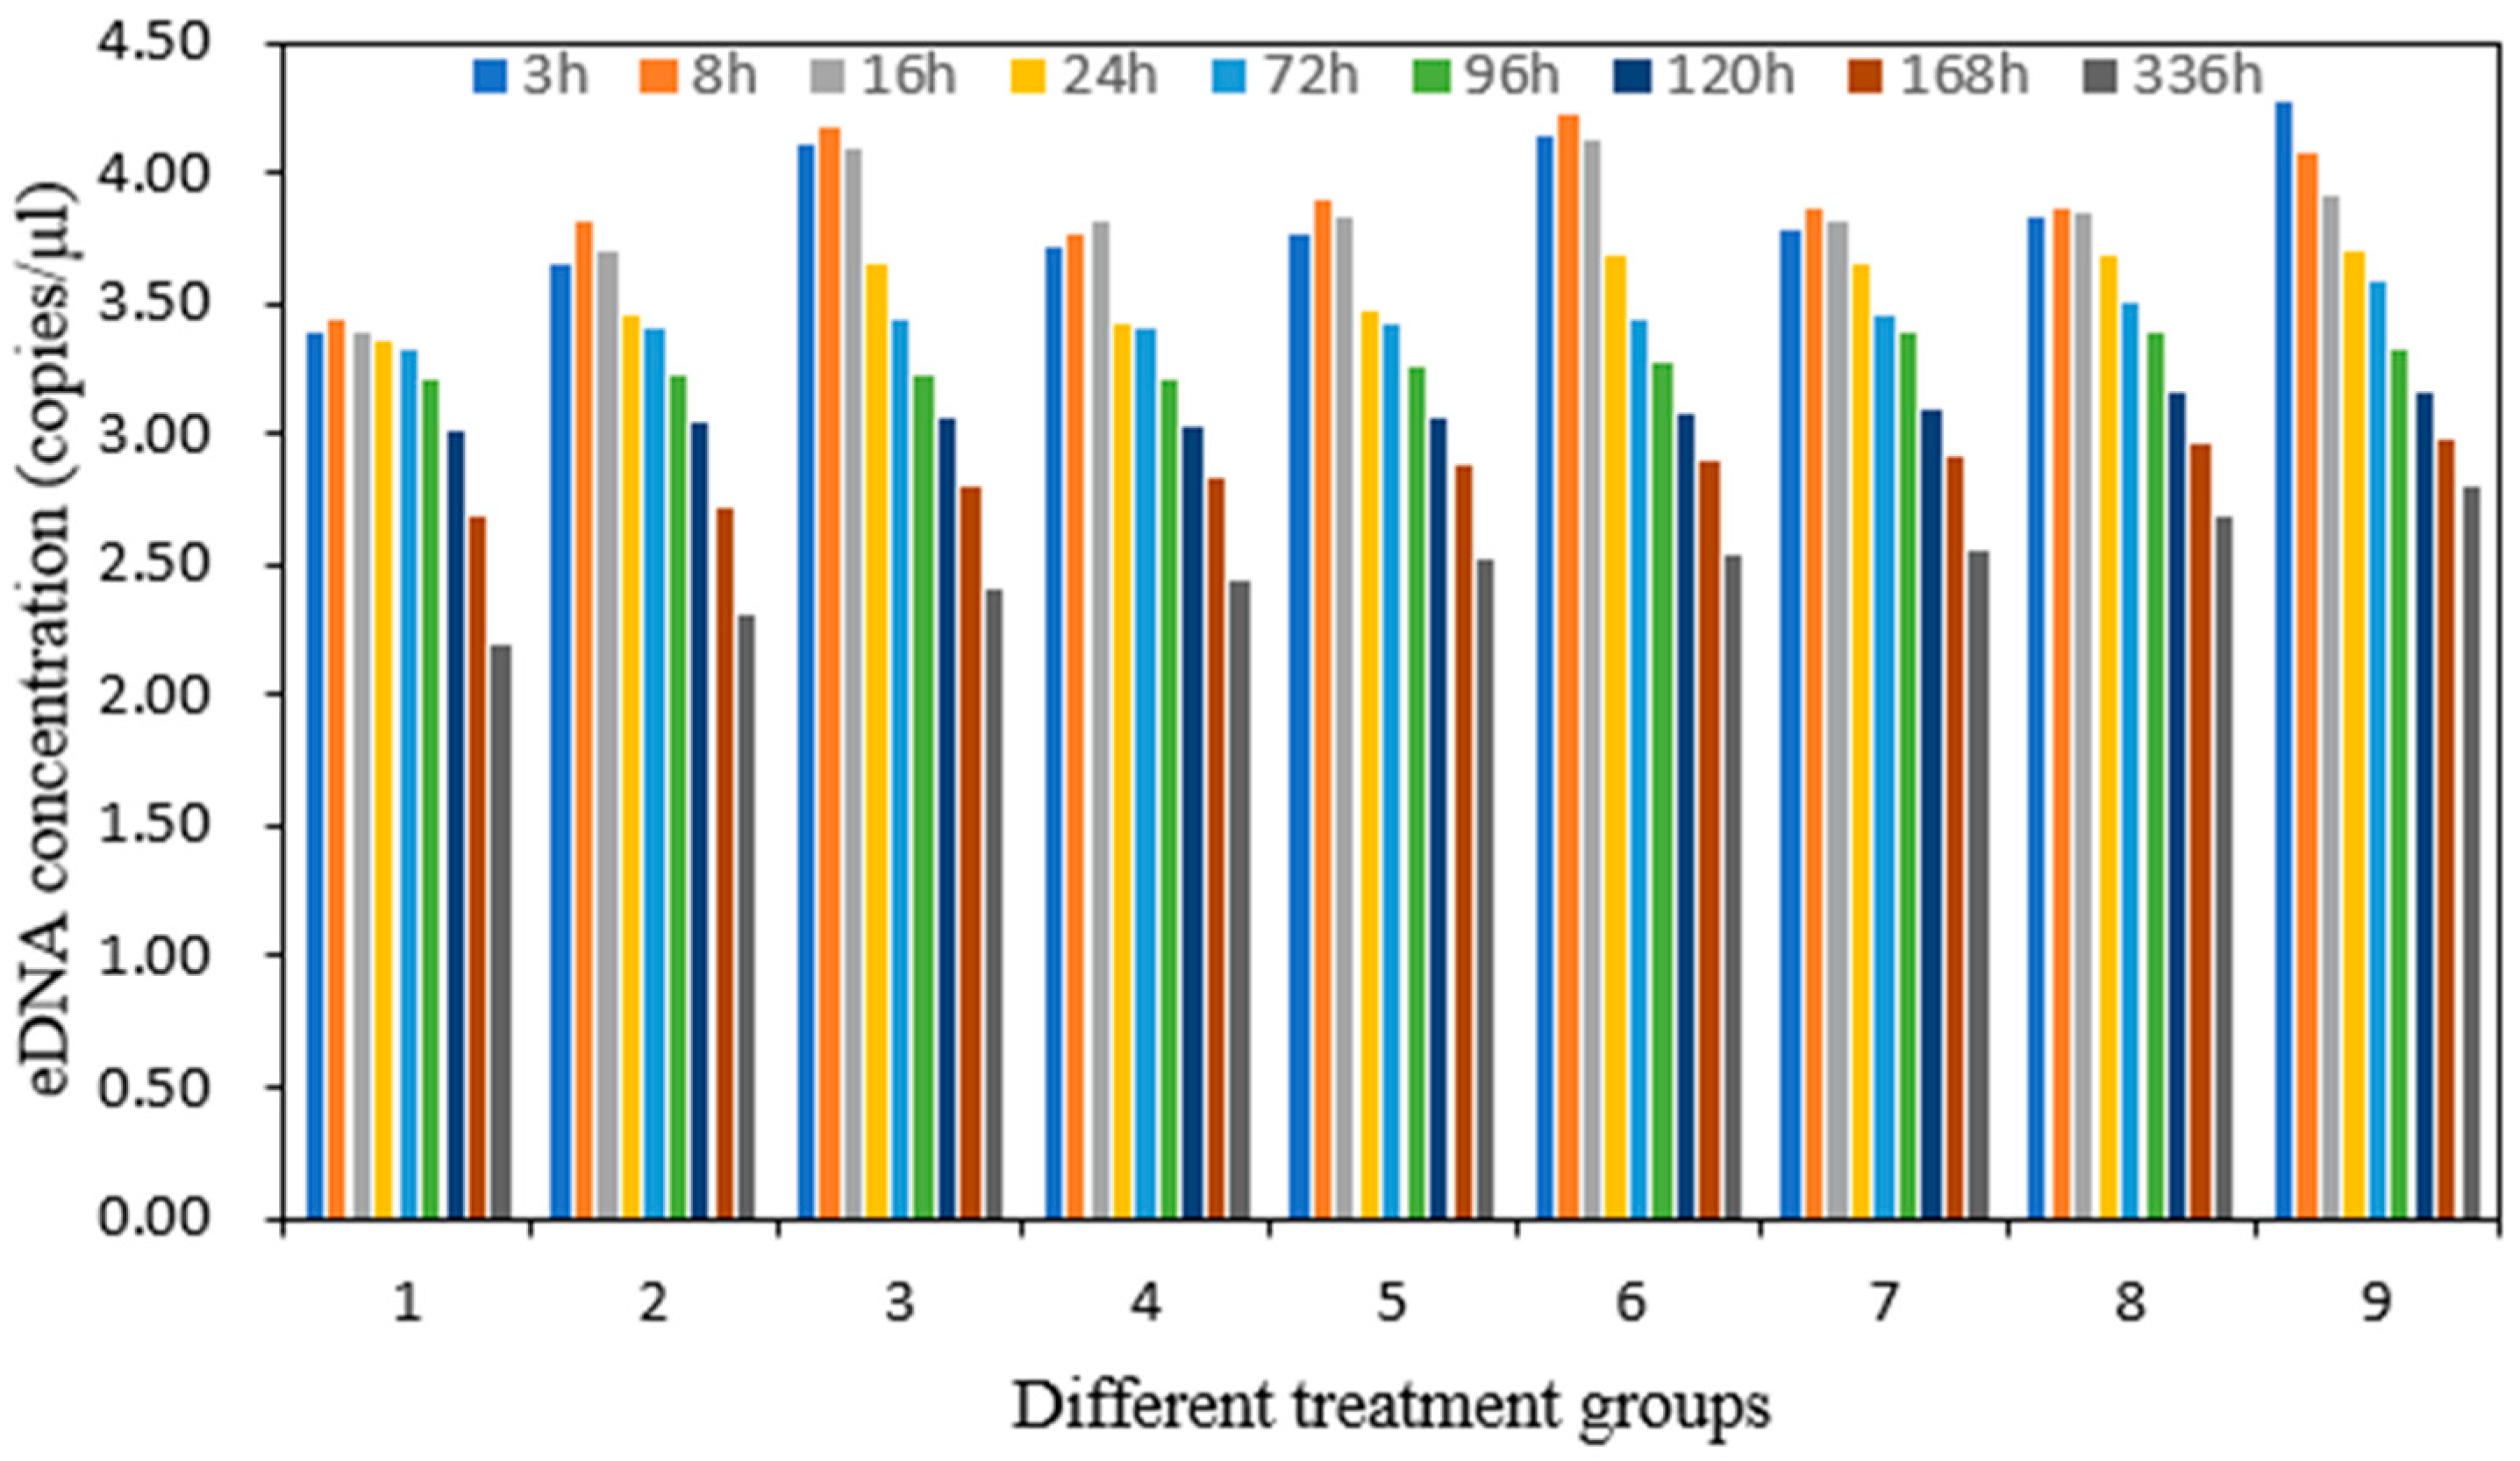
The eDNA concentrations of yellowfin seabream at different times of different treatments are shown in Figure 4. The eDNA concentration of yellowfin seabream showed an overall decreasing trend over time within the same treatment group. As shown in Table 4 and Table 5, the effect of each factor on the yellowfin seabream eDNA concentration was derived by performing an extreme difference analysis. Salinity was the main factor influencing the yellowfin seabream eDNA concentration from 3–24 h when yellowfin seabream were placed in water, and the most influential combinations of factors were 35‰ salinity/a temperature of 30 °C/a pH of 8.5 and 35‰ salinity/a temperature of 25 °C/a pH of 8.5. The main factor influencing the yellowfin seabream eDNA concentration from 3–14 d was temperature, and the most influential combinations of factors were 35‰/30 °C/8.5, 35‰/30 °C/8.0, and 35‰/25 °C/8.5 (salinity/temperature/pH).
3.4.2. Analysis of Variance for Orthogonal Experiments
According to the ANOVA results presented in Table 6 and Table 7, the F values of factor B (salinity) were greater than those of the other two factors (temperature and pH) within 3 h after the yellowfin seabream were placed in the water (p < 0.05). Thus, salinity exerted the greatest effect on the eDNA concentration of yellowfin seabream in the first 3 h. The F values of factor A (temperature) were greater than those of the other two factors (salinity and pH) from 3 d to 14 d (p < 0.05), indicating that temperature had the greatest effect on the eDNA concentration of yellowfin seabream from 3 d to 14 d. Post hoc multiple comparisons of environmental factors with main effects (Table 8) showed that salinity was the main effect factor within 3 h after the placement of the yellowfin seabream in the water, with high significance (p < 0.05) in the salinity (25–35‰) group based on post hoc multiple comparisons. Temperature was the main effect factor from 3 d to 14 d (Table 9). Significance was high for all temperature (25–30 °C) groups (p < 0.05); a post hoc multiple comparison analysis was not performed for the pH group because the results were not significant in the extreme difference analysis. Based on these results, high temperature (25–30 °C) and high salinity (25–30‰) exerted significant effects on the eDNA concentration of yellowfin seabream.
3.4.3. Correlation Analysis between Environmental Factors and the eDNA Concentration of Yellowfin Seabream
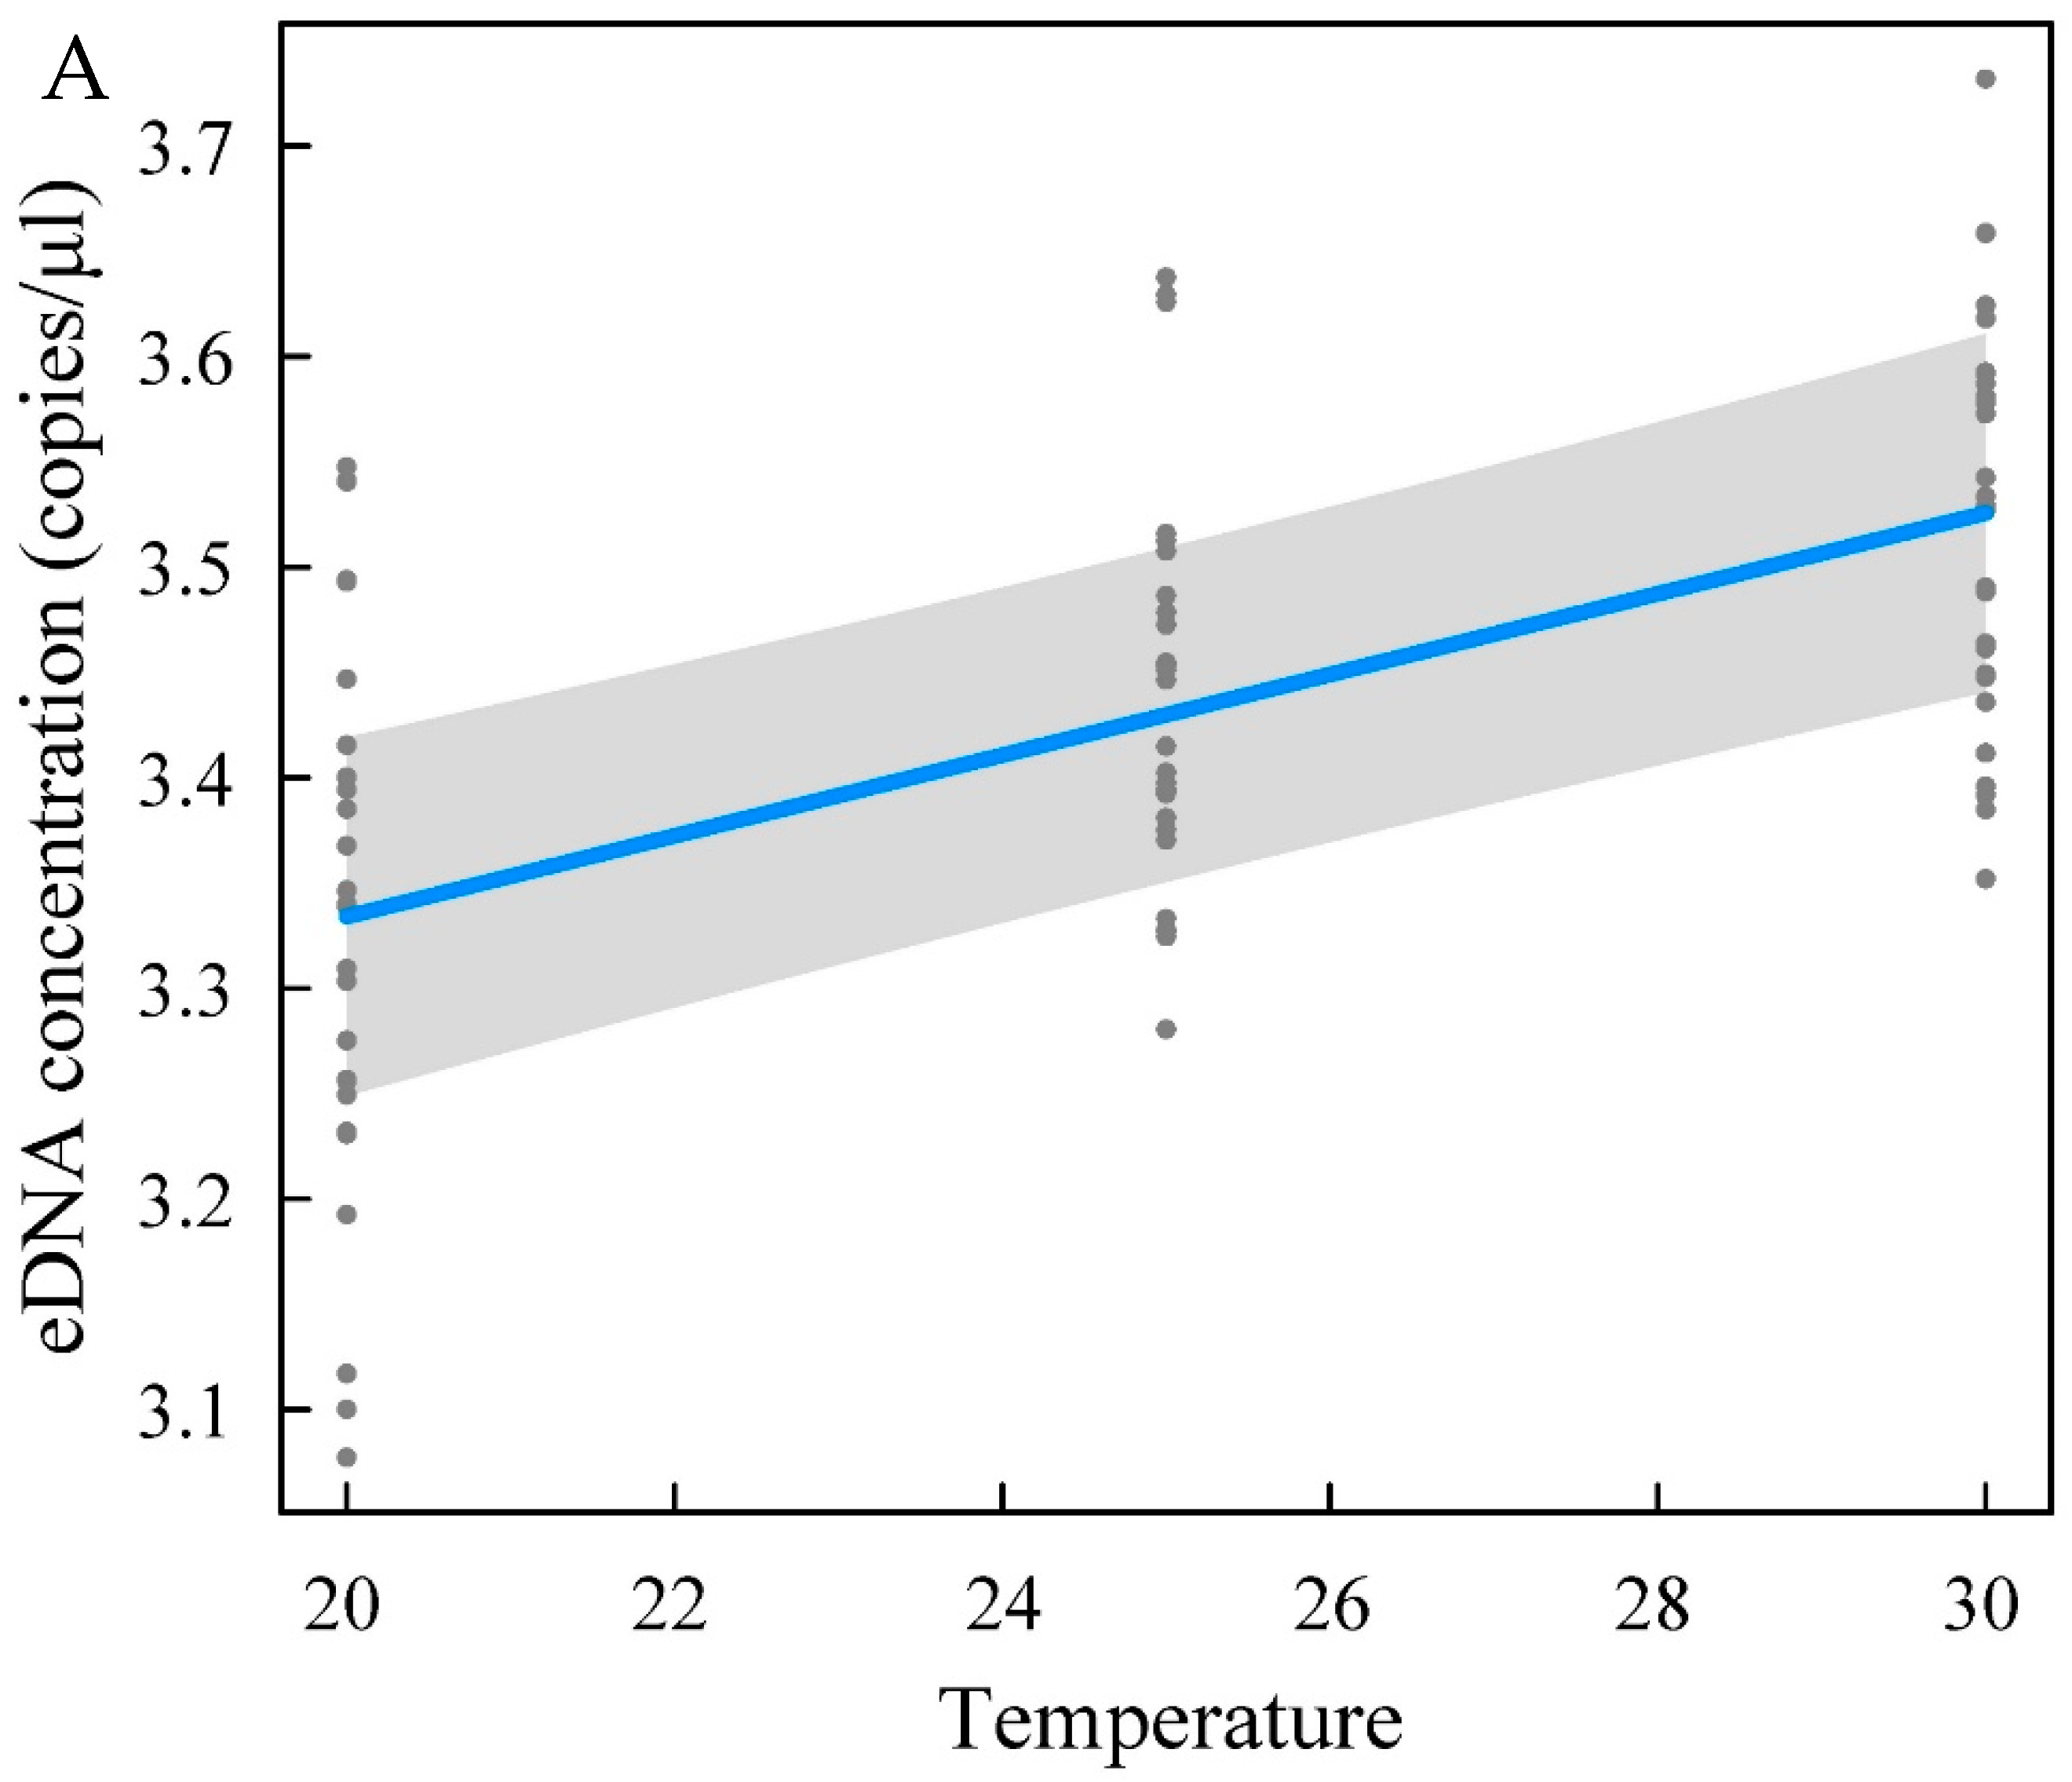
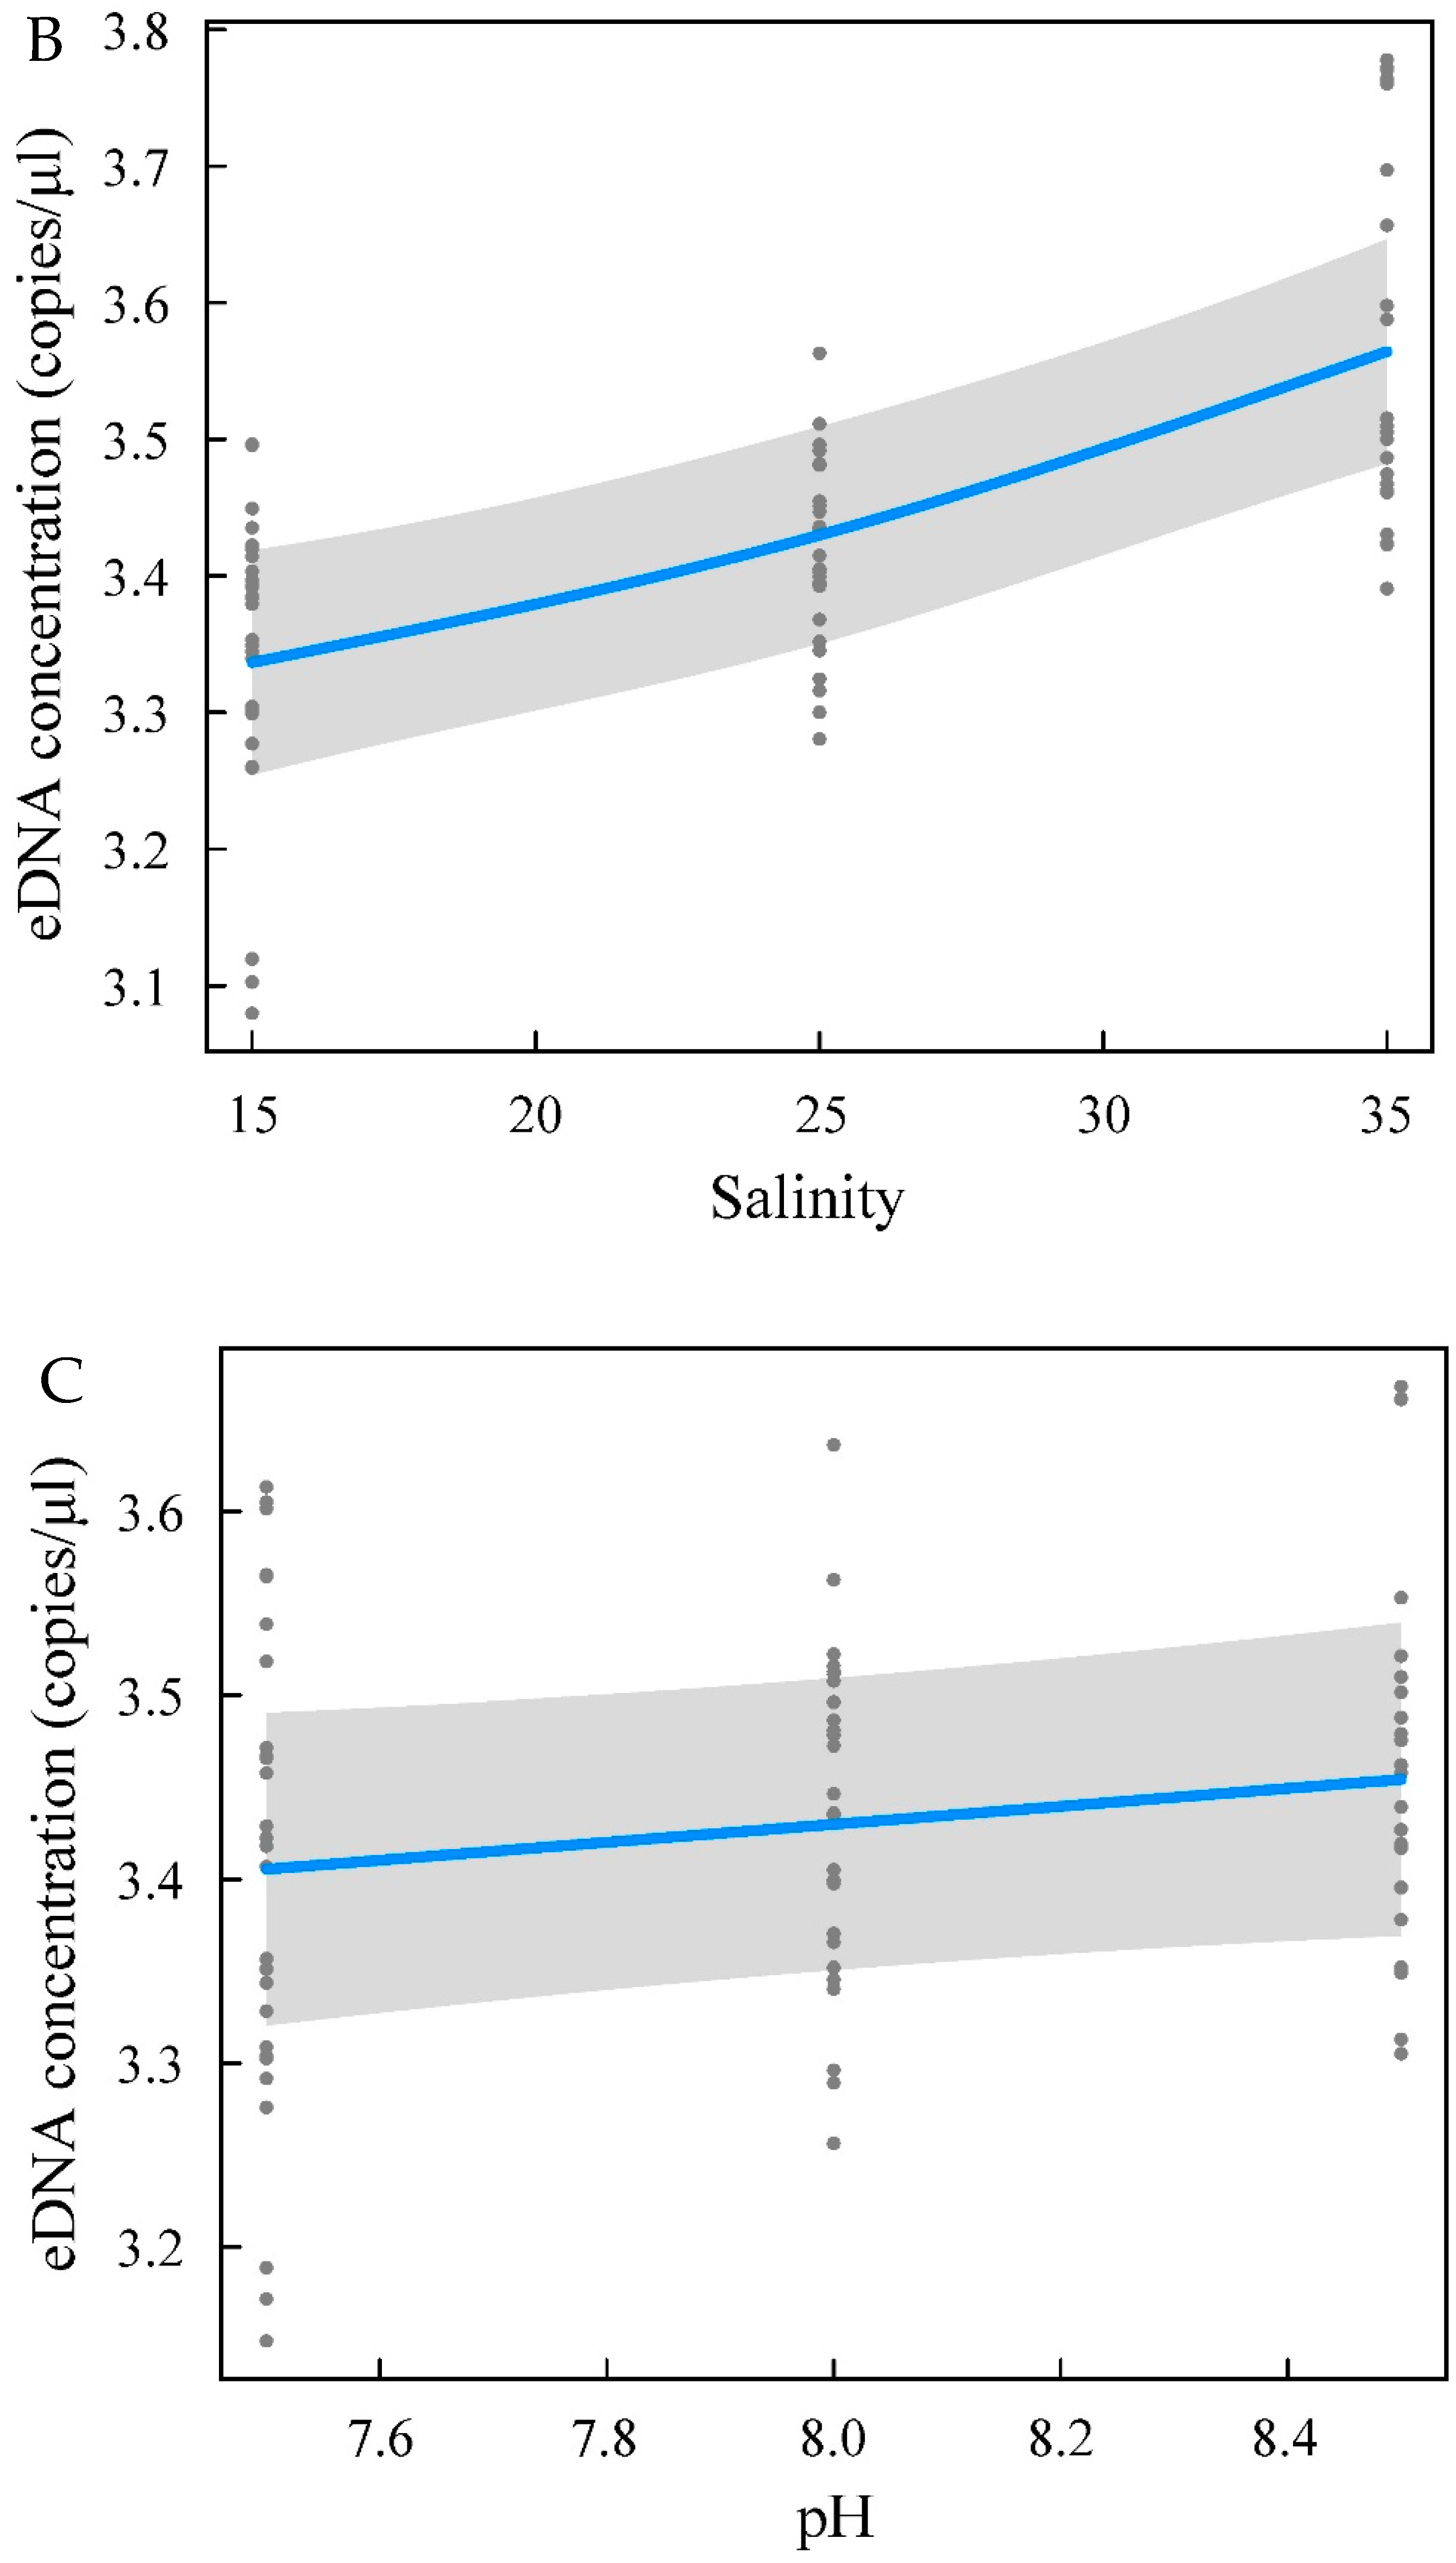
Based on the eDNA concentrations detected in water samples from each treatment group in the experimental factor experiment, we obtained the relationship between different environmental factors and eDNA concentrations, as shown in Figure 5. As shown in Figure 5A, the eDNA concentration of yellowfin seabream increased with increasing temperature (F = 37.253, p < 2 × 10⁻¹⁶). In Figure 5B, the eDNA concentration of yellowfin seabream increased with increasing salinity (F = 27.664, p < 2 × 10⁻¹⁶). As shown in Figure 5C, the relationship between pH and the eDNA concentration of yellowfin seabream was not significant (F = 2.422, p = 0.124 > 0.05).
4. Discussion
Our study shows a significant positive correlation between the yellowfin seabream eDNA concentration and biomass. Apparently, the low persistence of eDNA in the aquatic environment only allows the detection of species actually present in the ecosystem. The fact that A. latus eDNA was detected using PCR in all the experiments with different biomasses of yellowfin seabreams proves that the method is reliable. In recent years, eDNA has been used as a new tool for monitoring endangered species [23,24], invasive species [25,26], and economically valuable species [27]. Mauvisseau et al. [28] identified a significant positive correlation between octopus (Octopus vulgaris) biomass and the eDNA concentration. Salter et al. [29] quantified Atlantic cod (Gadus morhua) eDNA and compared it with the results of standardized bottom trawl surveys. eDNA detection in Atlantic cod was highly consistent with trawl catches, and a significant positive relationship was observed between the Atlantic cod eDNA concentration and biomass. Knudsen et al. [3] reported a correlation between the eDNA concentration and the main abundance of six Baltic Sea fish species but no significant correlation with the biomass caught in trawls. Tillotson et al. [30] observed a strong correlation between eDNA concentrations of salmonids in streams and their biomass. Yan Huiguo et al. [31] detected a positive linear correlation between the eDNA concentration and biomass in water bodies farmed with different numbers of rock carp (Procypris rabaudi). These results are analogous to our findings from biomass experiments. Linear correlations between fish biomass and eDNA concentrations are usually observed in small tanks, ponds, and streams. However, in large water bodies, these relationships become more complex and less certain [32]. In contrast, nonlinear relationships are usually described in lakes [33,34]. For shrimp and shellfish with hard shells, the relationship between the eDNA concentration and biomass is not significant [35]. Several studies have shown that eDNA technology is also feasible for biomass assessments under field conditions [36,37]. The concentration of eDNA in the water column was negatively correlated with the time since the removal of yellowfin seabream. eDNA has been shown to exponentially degrade over a long period [38,39].The retention time of yellowfin seabream eDNA in the environment was approximately 20 days. Because yellowfin seabream preferentially inhabits complex offshore structures on the seafloor, effective and accurate sampling has been a challenge to studying its biomass and habitat use. Confirming and describing the positive relationship for fish in controlled environments constitutes an important first step towards using eDNA for fish monitoring [40]. Further validation is needed for field applications.
Changes in the eDNA concentration are related to the rate of eDNA release from the organism itself and the rate of degradation in the environment, which results from a complex interplay [41]. In this study, the experiment was conducted by setting three levels of three environmental factors, namely, temperature, salinity, and pH. We performed experiments examining the effects of environmental factors on eDNA in the presence of fish, distinguishing our study from other experiments assessing the influence of environmental factors on eDNA degradation without target species [42,43]. The yellowfin seabream eDNA concentration increased with increasing temperature and salinity, and temperature and salinity exerted substantial effects on the eDNA concentration. The eDNA concentration in the high-temperature (30 °C) and high-salinity (35‰) groups was higher than that in the low-temperature and low-salinity groups. pH had little effect on the concentration of yellowfin seabream eDNA. An increase in water temperature within a certain range leads to an increase in the activity and metabolic rate of fish [44]. High activity and metabolism result in epidermal cell shedding and increased excretion. This property may be one explanation for the increase in eDNA concentration. Therefore, the eDNA concentration is most likely to be affected when a large change in water temperature occurs. Water temperature must be considered when assessing biomass with the eDNA technique. Strickler et al. [42] found that temperature differences affected eDNA decay to a greater extent than differences in UV-B exposure or pH, with the highest bullfrog eDNA concentrations detected at high temperatures (5 °C higher), low UV-B levels, and neutral pH conditions. Yellowfin seabream is a euryhaline fish. However, different salinities exert different effects on the growth performance, digestive and antioxidant enzymes, humoral immunity, and stress index of yellowfin seabream [45]. These changes may affect the release of eDNA by yellowfin seabream living in waters with different salinities. The main effects on the concentration of biological eDNA include biotic and abiotic factors [46,47,48,49]. At different stages of organism development, the eDNA release rate in the adult group was three to four times higher than that in the juvenile group [50]. When fish are engaged in activities such as feeding and spawning, eDNA concentrations may also change dramatically in a short period. Roussel et al. [41] showed that fish release more eDNA in warm water than in cold water. In contrast, Klymus et al. [27] found that although feeding increased eDNA shedding by 10-fold, water temperature had no effect. Collins et al. [51] reported that marine systems with higher salinity, ion concentrations, and pH and more stable temperature exert favourable effects on the release and preservation of eDNA. Many factors affect the concentration of eDNA, but the roles of these factors remain somewhat controversial, and the correlation between these factors must be further explored to inform biomass assessment efforts.
Most studies assessing the effects of environmental factors on eDNA concentrations used one-way ANOVA [16,27,42]. Orthogonal tests are indicators used to measure the effectiveness of an experiment [52], and most studies have used orthogonal experiments to optimize a particular process [53,54]. No studies have applied orthogonal experiments to detect eDNA of different species and more efficiently obtain a representative group of environmental factor impact levels. The analysis of selected experimental results may provide a comprehensive understanding of the experimental situation to determine the optimal combination of levels and avoid large, repetitive sampling efforts. The conservation of endangered species and the management of economic species are important components of sustainable fishery development. Compared with traditional direct trapping and other invasive monitoring methods, eDNA technology is a novel method for monitoring and surveying aquatic organisms and is widely used for target-species monitoring and biomass assessment. With low invasiveness, high sensitivity, and wide applicability, eDNA monitoring methods have been widely used in recent years for qualitative, quantitative, and species diversity studies and surveys of different species [55,56]. This study only detected eDNA from a single species in a limited environment, but it shows the potential of a quantitative eDNA assessment in monitoring populations. Future research on eDNA detection from multiple species and understanding the key factors controlling eDNA production and persistence will potentially help translate the relationship between the eDNA concentration and target-species bioabundance into a general tool for ecological research, natural resource management, and conservation [31].
5. Conclusions
We observed a strong linear relationship between the eDNA concentration and biomass in controlled environments for yellowfin seabream. Therefore, our study adds much-needed information to the field assessment of yellowfin seabream. Additionally, we highlight that high temperature and high salinity exerted strong effects on the eDNA concentration of yellowfin seabream. This finding enables a preliminary understanding of the effects of environmental factors (temperature, salinity, and pH) on the eDNA concentration. The methods and results outlined in this study provide a theoretical basis for the stock assessment of yellowfin seabream to improve our understanding of the population dynamics of reef-edge fish such as yellowfin seabream.
Author Contributions
C.Q. conceived the study and participated in its design; M.S. performed the field experiments; Y.X. drafted the manuscript; G.Y. and Z.M. provided scientific advice; and Y.G. and K.P. sorted the data. All authors have read and agreed to the published version of the manuscript.
Funding
This research was funded by Hainan Provincial Natural Science Foundation of China, grant number 321CXTD446; Fangchenggang Science and Technology Program, grant number AB21014021; and Central Public-interest Scientific Institution Basal Research Fund, South China Sea Fisheries Research Institute, Chinese Academy of Fishery Sciences, grant number 2020YJ04.
Institutional Review Board Statement
The animal study protocol was approved by the Institutional Review Board (or Ethics Committee) of the South China Sea Fisheries Research Institute, Chinese Academy of Fishery Sciences (NHDF2022-16).
Informed Consent Statement
Not applicable.
Data Availability Statement
All data are available from the corresponding author on reasonable request.
Conflicts of Interest
The authors declare no conflict of interest.
References
- Ludmila, d.M.A.D.; Macedo, L.P.F.; Grazia, P.M.; Rosa, C.A.; Rashid, S.U. Size matters: Fishing less and yielding more in smaller-scale fisheries. ICES J. Mar. Sci. 2016, 73, 1494–1502. [Google Scholar] [CrossRef] [Green Version]
- Hansen, B.K.; Bekkevold, D.; Clausen, L.W.; Nielsen, E.E. The sceptical optimist: Challenges and perspectives for the application of environmental DNA in marine fisheries. Fish Fish. 2018, 19, 751–768. [Google Scholar] [CrossRef]
- Knudsen, S.W.; Ebert, R.B.; Hesselse, M.; Kuntke, F.; Hassingboe, J.; Mortensen, P.B.; Thomsen, P.F.; Sigsgaard, E.E.; Hansen, B.K.; Nielsen, E.E.; et al. Species-specific detection and quantification of environmental DNA from marine fishes in the Baltic Sea. J. Exp. Mar. Biol. Ecol. 2018, 510, 31–45. [Google Scholar] [CrossRef]
- Hong, W.S.; Zhang, Q.Y. Review of captive bred species and fry production of marine fish in China. Aquaculture 2003, 227, 305–318. [Google Scholar] [CrossRef]
- Fan, J.R.; Wu, R.X.; Zhao, Y.J. Progresses on taxonomy and phylogeny of family Sparidae from China. J. Fish. Sci. China 2013, 18, 472–480. [Google Scholar] [CrossRef]
- Ding, J.H. Fly fishing for yellowfin snapper—Enjoy a more direct and intense exciting sensation than road fishing. Fishing 2017, 17, 26–33. [Google Scholar]
- Feng, R.Y.; Guo, Y.; Li, J.M. Study on fish stocking and release strategy based on EnhanceFish model: An example of yellowfin sea bream stocking and release in Nanlang waters of Zhongshan City. Prog. Fish. Sci. 2022, 43, 1–10. [Google Scholar] [CrossRef]
- Pan, C.; Gao, C.; Chen, T.; Chen, X.; Yang, C.; Zeng, D.; Feng, P.; Jiang, W.; Peng, M. The complete mitochondrial genome of yellowfin seabream, Acanthopagrus latus (Percoiformes, Sparidae) from Beibu Bay. Mitochondrial DNA B Resour. 2021, 6, 1313–1314. [Google Scholar] [CrossRef]
- lv, S.L.; Wang, X.F.; Lin, K. Evaluation and comparison of three tagging methods on Acanthopagrus latus. Mar. Fish. 2019, 41, 616–622. [Google Scholar] [CrossRef]
- Wang, S.; Yan, Z.G.; Hnfling, B. Methodology of fish eDNA and its applications in ecology and environment. Sci. Total Environ. 2021, 755, 142622. [Google Scholar] [CrossRef]
- Nevers, M.B.; Byappanahalli, M.N.; Morris, C.C.; Shively, D.; Przybyla-Kelly, K.; Spoljaric, A.M.; Dickey, J.; Roseman, E.F. Environmental DNA (eDNA): A tool for quantifying the abundant but elusive round goby (Neogobius melanostomus). PLoS ONE 2018, 13, e0191720. [Google Scholar] [CrossRef]
- Rheyda, H.; Mark, L.; Dianne, G.; Ben, B.; Elise, F. Performance of eDNA assays to detect and quantify an elusive benthic fish in upland streams. Biol. Invasions 2018, 20, 3079–3093. [Google Scholar] [CrossRef]
- Wilcox, T.M.; McKelvey, K.S.; Young, M.K.; Sepulveda, A.J.; Shepard, B.B.; Jane, S.F.; Whiteley, A.R.; Lowe, W.H.; Schwartz, M.K. Understanding environmental DNA detection probabilities: A case study using a stream-dwelling char Salvelinus fontinalis. Biol. Conserv. 2016, 194, 209–216. [Google Scholar] [CrossRef] [Green Version]
- Shaw, J.L.A.; Clarke, L.J.; Wedderburn, S.D.; Barnes, T.C.; Weyrich, L.S.; Cooper, A. Comparison of environmental DNA metabarcoding and conventional fish survey methods in a river system Biological Conservation. Biol. Conserv. 2016, 197, 131–138. [Google Scholar] [CrossRef]
- Spear, M.J.; Embke, H.S.; Krysan, P.J.; Zanden, M.J.V. Application of eDNA as a tool for assessing fish population abundance. Environ. DNA 2020, 3, 83–91. [Google Scholar] [CrossRef]
- Teruhiko, T.; Toshifumi, M.; Hiroki, Y.; Hideyuki, D.; Zen’ichiro, K. Estimation of fish biomass using environmental DNA. PLoS ONE 2012, 7, e35868. [Google Scholar] [CrossRef] [Green Version]
- Hideyuki, D.; Izumi, K.; Yusuke, S.; Rio, S.; Toshihiro, K.; Mariko, N.; Kousuke, I.; Koki, Y.; Koji, T. Detection of an endangered aquatic heteropteran using environmental DNA in a wetland ecosystem. R. Soc. Open Sci. 2017, 4, 170568. [Google Scholar] [CrossRef] [Green Version]
- Itakura, H.; Wakiya, R.; Yamamoto, S.; Kaifu, K.; Sato, T.; Minamoto, T. Environmental DNA analysis reveals the spatial distribution, abundance, and biomass of Japanese eels at the river-basin scale. Aquat. Conserv. Ecosyst. 2019, 29, 361–373. [Google Scholar] [CrossRef] [Green Version]
- Shogren, A.J.; Tank, J.L.; Egan, S.P.; Bolster, D.; Riis, T. Riverine distribution of mussel environmental DNA reflects a balance among density, transport, and removal processes. Freshw. Biol. 2019, 64, 1467–1479. [Google Scholar] [CrossRef]
- Matthew, B.; Cameron, T.; Christopher, J.; Mark, R.; Lindsay, C.W.; David, L. Environmental conditions influence eDNA persistence in aquatic systems. Environ. Sci. Technol. 2014, 48, 1819–1827. [Google Scholar] [CrossRef]
- Jessica, E.; Sendréa, B.; Peter, S. Effects of temperature and trophic state on degradation of environmental DNA in lake water. Environ. Sci. Technol. 2016, 50, 1859–1867. [Google Scholar] [CrossRef]
- Meijing, S.; Yu, G.; Naiqian, Z.; Shuo, Z.; Kun, P.; Chuanxin, Q. Fish eDNA detection and its technical optimization: A case study of Acanthopagrus latus. Mar. Environ. Res. 2022, 176, 105588. [Google Scholar] [CrossRef]
- Piggott, M.P. An environmental DNA assay for detecting Macquarie perch, Macquaria australasica. Conserv. Genet. Resour. 2017, 9, 257–259. [Google Scholar] [CrossRef]
- Sigsgaard, E.E.; Carl, H.; Mller, P.R.; Thomsen, P.F. Monitoring the near-extinct European weather loach in Denmark based on environmental DNA from water samples. Biol. Conserv. 2015, 183, 46–52. [Google Scholar] [CrossRef] [Green Version]
- Jerde, C.L.; Mahon, A.R.; Chadderton, W.L.; Lodge, D.M. “Sight-unseen” detection of rare aquatic species using environmental DNA. Conserv. Lett. 2011, 4, 150–157. [Google Scholar] [CrossRef]
- Tréguier, A.; Paillisson, J.M.; Dejean, T.; Valentini, A.; Schlaepfer, M.A.; Roussel, J.M. Environmental DNA surveillance for invertebrate species: Advantages and technical limitations to detect invasive crayfish "Procambarus clarkii" in freshwater ponds. J. Appl. Ecol. 2014, 51, 871–879. [Google Scholar] [CrossRef]
- Klymus, K.E.; Richter, C.A.; Chapman, D.C.; Paukert, C. Quantification of eDNA shedding rates from invasive bighead carp Hypophthalmichthys nobilis and silver carp Hypophthalmichthys molitrix. Biol. Conserv. 2015, 183, 77–84. [Google Scholar] [CrossRef]
- Mauvisseau, Q.; Parrondo, M.; Fernández, M.P.; García, L.; Martínez, J.L.; García-Vázquez, E.; Borrell, Y.J. On the way for detecting and quantifying elusive species in the sea: The Octopus vulgaris case study. Fish. Res. 2017, 191, 41–48. [Google Scholar] [CrossRef]
- Ian, S.; Mourits, J.; Regin, K.; Petur, S.; Poul, V. Environmental DNA concentrations are correlated with regional biomass of Atlantic cod in oceanic waters. Commun. Biol. 2019, 2, 461. [Google Scholar] [CrossRef] [Green Version]
- Tillotson, M.D.; Kelly, R.P.; Duda, J.J.; Hoy, M.; Kralj, J.; Quinn, T.P. Concentrations of environmental DNA (eDNA) reflect spawning salmon abundance at fine spatial and temporal scales. Biol. Conserv. 2018, 220, 1–11. [Google Scholar] [CrossRef]
- Yan, H.G.; Dong, Z.L.; Ma, T.T. Detection and biomass assessment of Procypris rabaudi based on environmental DNA. J. Fish. China 2022, 46, 1018–1026. [Google Scholar] [CrossRef]
- Coulter, D.P.; Wang, P.; Coulter, A.A.; Van Susteren, G.E.; Eichmiller, J.J.; Garvey, J.E.; Sorensen, P.W. Nonlinear relationship between Silver Carp density and their eDNA concentration in a large river. PLoS ONE 2019, 14, e0218823. [Google Scholar] [CrossRef] [PubMed]
- Eichmiller, J.J.; Bajer, P.G.; Sorensen, P.W. The relationship between the distribution of common carp and their environmental DNA in a small lake. PLoS ONE 2017, 9, e112611. [Google Scholar] [CrossRef] [PubMed] [Green Version]
- Ghosal, R.; Eichmiller, J.J.; Witthuhn, B.A.; Sorensen, P.W. Attracting Common Carp to a bait site with food reveals strong positive relationships between fish density, feeding activity, environmental DNA, and sex pheromone release that could be used in invasive fish management. Ecol. Evol. 2018, 8, 6714–6727. [Google Scholar] [CrossRef]
- Larson, E.R.; Renshaw, M.A.; Gantz, C.A.; Umek, J.; Chandra, S.; Lodge, D.M.; Egan, S.P. Environmental DNA (eDNA) detects the invasive crayfishes Orconectes rusticus and Pacifastacus leniusculus in large lakes of North America. Hydrobiologia 2017, 800, 173–185. [Google Scholar] [CrossRef] [Green Version]
- Baldigo, B.P.; Sporn, L.A.; George, S.D.; Ball, J.A. Efficacy of environmental DNA to detect and quantify brook trout populations in headwater streams of the Adirondack Mountains, New York. Trans. Am. Fish. Soc. 2017, 146, 99–111. [Google Scholar] [CrossRef] [Green Version]
- Yamamoto, S.; Minami, K.; Fukaya, K. Environmental DNA as a ’Snapshot’ of fishdistribution: A case study of Japanese Jack Mackerel in Maizuru Bay, sea of Japan. PLoS ONE 2017, 11, e0149786. [Google Scholar] [CrossRef] [Green Version]
- Willerslev, E.; Hansen, A.J.; Rønn, R.; Brand, T.B.; Barnes, I.; Wiuf, C.; Gilichinsky, D.; Mitchell, D.; Cooper, A. Long-term persistence of bacterial DNA. Curr. Biol. 2004, 14, 9–10. [Google Scholar] [CrossRef]
- Allentoft, M.E.; Collins, M.; Harker, D.; Haile, J.; Oskam, C.L.; Hale, M.L.; Campos, P.F.; Samaniego, J.A.; Gilbert, M.T.; Willerslev, E.; et al. The half-life of DNA in bone: Measuring decay kinetics in 158 dated fossils. Proc. Biol. Sci. 2012, 279, 4724–4733. [Google Scholar] [CrossRef] [Green Version]
- Erik, K.; Martin, O.; Göran, S.; Josefin, S.; Ofir, S.; Ilkka, N.; Anti, V. Strong positive relationships between eDNA concentrations and biomass in juvenile and adult pike (Esox lucius) under controlled conditions: Implications for monitoring. Environ. DNA 2022, 4, 881–893. [Google Scholar] [CrossRef]
- Lacoursiere-Roussel, A.; Rosabal, M.; Bernatchez, L. Estimating fish abundance and biomass from eDNA concentrations: Variability among capture methods and environmental conditions. Mol. Ecol. Resour. 2016, 16, 1401–1414. [Google Scholar] [CrossRef] [PubMed]
- Strickler, K.M.; Fremier, A.K.; Goldberg, C.S. Quantifying effects of UV-B, temperature, and pH on eDNA degradation in aquatic microcosms. Biol. Conserv. 2015, 183, 85–92. [Google Scholar] [CrossRef]
- Jianmin, Z.; Ruiyu, D.; Yurong, W.; Jiating, W. Experimental study on the response relationship between environmental DNA concentration and biomass of Schizothorax prenanti in still water. Front. Ecol. Evol. 2022, 10, 972680. [Google Scholar] [CrossRef]
- Xu, C.L.; Letcher, B.H.; Nislow, K.H. Size-dependent survival of brook trout Salvelinus fontinalis in summer: Effects of water temperature and stream flow. J. Fish Biol. 2010, 76, 2342–2369. [Google Scholar] [CrossRef]
- Torfi, M.M.; Omid, S.; Rahim, O.; Shapour, M.; Zabayeh, N.M.; Javad, H.S.; Hamid, S.; Javad, M. The effect of salinity on growth performance, digestive and antioxidant enzymes, humoral immunity and stress indices in two euryhaline fish species: Yellowfin seabream (Acanthopagrus latus) and Asian seabass (Lates calcarifer). Aquaculture 2021, 534, 736329. [Google Scholar]
- Dejean, T.; Valentini, A.; Duparc, A.; Pellier-Cuit, S.; Pompanon, F.; Taberlet, P.; Miaud, C. Persistence of environmental DNA in freshwater ecosystems. PLoS ONE 2017, 6, e23398. [Google Scholar] [CrossRef] [PubMed] [Green Version]
- Shogren, A.J.; Tank, J.L.; Egan, S.P.; August, O.; Rosi, E.J.; Hanrahan, B.R.; Renshaw, M.A.; Gantz, C.A.; Bolster, D. Water flow and biofilm cover influence environmental DNA detection in recirculating streams. Environ. Sci. Technol. 2018, 52, 8530–8537. [Google Scholar] [CrossRef] [PubMed]
- Merkes, C.M.; McCalla, S.G.; Jensen, N.R.; Gaikowski, M.P.; Amberg, J.J. Persistence of DNA in carcasses, slime and avian feces may affect interpretation of environmental DNA data. PLoS ONE 2017, 9, e113346. [Google Scholar] [CrossRef] [PubMed]
- Shan, Z.; Qi, L.; Yiyan, W. Assessment of fish communities using environmental DNA: Effect of spatial sampling design in lentic systems of different sizes. Mol. Ecol. Resour. 2020, 20, 242–255. [Google Scholar] [CrossRef]
- Maruyama, A.; Nakamura, K.; Yamanaka, H.; Kondoh, M.; Minamoto, T. The release rate of environmental DNA from juvenile and adult fish. PLoS ONE 2014, 9, e114639. [Google Scholar] [CrossRef] [Green Version]
- Collins, R.A.; Wangensteen, O.S.; O’Gorman, E.J.; Mariani, S.; Sims, D.W.; Genner, M.J. Persistence of environmental DNA in marine systems. Commun. Biol. 2018, 1, 185. [Google Scholar] [CrossRef] [PubMed] [Green Version]
- Peng, H.B. Orthogonal experimental design and data analysis methods. Metrol. Meas. Tech. 2009, 36, 39–42. [Google Scholar] [CrossRef]
- Guo, Z.G.; Wang, Y.D.; Chen, R.Y. Optimization of extraction technology of Fermented Cordyceps powder and preparation technology of Yi shen granules by orthogonal test. J. China Presc. Drug 2022, 20, 31–33. [Google Scholar]
- Huang, M.T.; Pang, X.L.; Yang, L.F. The adoption of Orthogonal test to optimize the processing to extract antibacterial active components of bitter leaves. South China Agricultur. 2021, 15, 84–91. [Google Scholar] [CrossRef]
- Li, M.; Yu, T.T.; Shi, B.Y. Biodiveeersity monitoring of freshwater benthic macroinvertebrates using eeenvironmental DNA. Biodivers. Sci. 2019, 27, 480–490. [Google Scholar]
- Shan, X.J.; Li, M.; wang, J.W. Establishment and optimization of environmental DNA detection techniques for assessmeent of fenneropenaeus chinensisbiomass. Prog. Fish. Sci. 2019, 40, 12–19. [Google Scholar] [CrossRef]
Figure 1.
Variation in the A. latus eDNA concentration. Different coloured shapes represent different yellowfin seabream biomasses. The x-axis represents the number of days, and the y-axis represents the eDNA concentrations (copies/μL).
Figure 1.
Variation in the A. latus eDNA concentration. Different coloured shapes represent different yellowfin seabream biomasses. The x-axis represents the number of days, and the y-axis represents the eDNA concentrations (copies/μL).

Figure 2.
Relationship between the biomass and eDNA concentration of A. latus. Points indicate the data (biomass: 50 g/m3, 150 g/m3, 250 g/m3, 350 g/m3, and 500 g/m3). The eDNA concentrations (copies/μL) as a function of yellowfin seabream biomass (g/m3) at seven sampling time points (24, 48, 72, 96, 120, 144, and 168 h after the yellowfin seabream were introduced to the tanks) are shown. Each data point represents the mean value from three replicates. The grey shaded areas around the regression lines show the 95% confidence interval. R2 values were calculated for each time point separately (*** = p < 0.001).

Figure 3.
Fitting of the relationship between A. latus eDNA degradation and time. The data points denote the mean eDNA concentration of three replicates. The line represents the exponential decay of eDNA concentration in water with time after the removal of yellowfin seabream.
Figure 3.
Fitting of the relationship between A. latus eDNA degradation and time. The data points denote the mean eDNA concentration of three replicates. The line represents the exponential decay of eDNA concentration in water with time after the removal of yellowfin seabream.

Figure 4.
Concentration of eDNA in different treatment groups of yellowfin seabream. The bars represent the mean values of eDNA concentrations, and different colours represent different times.
Figure 4.
Concentration of eDNA in different treatment groups of yellowfin seabream. The bars represent the mean values of eDNA concentrations, and different colours represent different times.

Figure 5.
Relationship between different environmental factors and the eDNA concentration of A. latus: (A) Temperature, (B) Salinity, and (C) pH. Each data point represents the mean value of three replicates. The grey shaded areas around the regression lines show the 95% confidence interval.
Figure 5.
Relationship between different environmental factors and the eDNA concentration of A. latus: (A) Temperature, (B) Salinity, and (C) pH. Each data point represents the mean value of three replicates. The grey shaded areas around the regression lines show the 95% confidence interval.


Table 1.
Test factor levels.
| Level | Temperature (°C) | Salinity (‰) | pH |
|---|---|---|---|
| A | B | C | |
| 1 | 20 | 15 | 7.5 |
| 2 | 25 | 25 | 8.0 |
| 3 | 30 | 35 | 8.5 |
Table 2.
Orthogonal experimental arrangement.
| Factors | ||||
|---|---|---|---|---|
| Level | Temperature (°C) | Salinity (‰) | pH | Empty Line |
| A | B | C | D | |
| 1 | 1 | 1 | 1 | 1 |
| 2 | 1 | 2 | 2 | 2 |
| 3 | 1 | 3 | 3 | 3 |
| 4 | 2 | 1 | 2 | 3 |
| 5 | 2 | 2 | 3 | 1 |
| 6 | 2 | 3 | 1 | 2 |
| 7 | 3 | 1 | 3 | 2 |
| 8 | 3 | 2 | 1 | 3 |
| 9 | 3 | 3 | 2 | 1 |
Table 3.
Primer pairs (QF-Forward, QR-Reverse) and probe used for the qPCR analysis of eDNA.
| Gene | Primer | Primer Sequence (5′-3′) | Temp (°C) | (bp) |
|---|---|---|---|---|
| COI | QF | AGTTCTTGCTGCCGGAATTA | 59.85 | 127 |
| COI | QR | TTCAGGGTGTCCGAAGAATC | 60.05 | 127 |
| Probe | CCAGGGTTCGGTATAATCTCCCACATC | 60.9 | 127 |
Table 4.
Analysis of the range of results from the orthogonal experiment (3–24 h).
| Test Number | A | B | C | D | Test Results (Indicators) | |||
|---|---|---|---|---|---|---|---|---|
| Temperature (°C) | Salinity (‰) | pH | Empty Line | 3 h | 8 h | 16 h | 24 h | |
| 1 | 1 (20) | 1(15) | 1 (7.5) | 1 | 3.39 | 3.44 | 3.40 | 3.35 |
| 2 | 1 | 2(25) | 2 (8.0) | 2 | 3.66 | 3.82 | 3.71 | 3.46 |
| 3 | 1 | 3(35) | 3 (8.5) | 3 | 4.11 | 4.18 | 4.10 | 3.65 |
| 4 | 2 (25) | 1 | 2 | 3 | 3.71 | 3.76 | 3.82 | 3.43 |
| 5 | 2 | 2 | 3 | 1 | 3.76 | 3.90 | 3.84 | 3.47 |
| 6 | 2 | 3 | 1 | 2 | 4.14 | 4.23 | 4.14 | 3.69 |
| 7 | 3 (30) | 1 | 3 | 2 | 3.78 | 3.86 | 3.82 | 3.65 |
| 8 | 3 | 2 | 1 | 3 | 3.83 | 3.87 | 3.84 | 3.69 |
| 9 | 3 | 3 | 2 | 1 | 4.27 | 4.08 | 3.92 | 3.71 |
| R3h | 0.24 | 0.55 | 0.10 | 0.08 | ||||
| R8h | 0.15 | 0.48 | 0.13 | 0.17 | ||||
| R16h | 0.20 | 0.37 | 0.13 | 0.20 | ||||
| R24h | 0.19 | 0.21 | 0.06 | 0.09 | ||||
| Primary and secondary factors | Salinity > Temperature > pH | |||||||
| Excellent level | B3 > A2 > C3, B3 > A3 > C3 | |||||||
| Excellent combination | B3A2C3, B3A3C3 | |||||||
Table 5.
Analysis of the range of results from the orthogonal experiment (3–14 d).
| Test Number | A | B | C | D | Test Results (Indicators) | ||||
|---|---|---|---|---|---|---|---|---|---|
| Temperature (°C) | Salinity (‰) | pH | Empty Line | 3 d | 4 d | 5 d | 7 d | 14 d | |
| 1 | 1 | 1 | 1 | 1 | 3.33 | 3.21 | 3.01 | 2.69 | 2.19 |
| 2 | 1 | 2 | 2 | 2 | 3.40 | 3.22 | 3.05 | 2.71 | 2.31 |
| 3 | 1 | 3 | 3 | 3 | 3.43 | 3.23 | 3.07 | 2.80 | 2.40 |
| 4 | 2 | 1 | 2 | 3 | 3.41 | 3.21 | 3.03 | 2.83 | 2.44 |
| 5 | 2 | 2 | 3 | 1 | 3.42 | 3.25 | 3.06 | 2.89 | 2.53 |
| 6 | 2 | 3 | 1 | 2 | 3.44 | 3.27 | 3.07 | 2.90 | 2.54 |
| 7 | 3 | 1 | 3 | 2 | 3.46 | 3.39 | 3.10 | 2.92 | 2.56 |
| 8 | 3 | 2 | 1 | 3 | 3.50 | 3.40 | 3.16 | 2.96 | 2.68 |
| 9 | 3 | 3 | 2 | 1 | 3.60 | 3.32 | 3.16 | 2.98 | 2.80 |
| R3d | 0.13 | 0.09 | 0.05 | 0.02 | |||||
| R4d | 0.15 | 0.02 | 0.04 | 0.03 | |||||
| R5d | 0.09 | 0.05 | 0.00 | 0.01 | |||||
| R7d | 0.22 | 0.08 | 0.03 | 0.02 | |||||
| R14d | 0.38 | 0.18 | 0.04 | 0.04 | |||||
| Primary and secondary factors | Temperature > Salinity > pH, Temperature > pH > Salinity | ||||||||
| Excellent level | A3 > B3 > C3, A3 > C3 > B2, A3 > B3 > C2 | ||||||||
| Excellent combination | A3B3C3, A3C3B2, A3B3C2 | ||||||||
Note: ‘Indicators’ represent the logarithmic concentration of eDNA. Kjm is the sum of the test indexes corresponding to the m levels of the factors in column j, and jm is the average of Kjm. The excellent level and excellent combination of factors in column j are judged by the magnitude of Kjm. R= Kjm(max) − Kjm(min). The magnitude of the R value determines the priority of this factor.
Table 6.
ANOVA results for the orthogonal experiment (3–24 h).
| 3 h Group | 8 h Group | 16 h Group | 24 h Group | |||||
|---|---|---|---|---|---|---|---|---|
| F | Sig. | F | Sig. | F | Sig. | F | Sig. | |
| Correction Model | 12.14 | 0.08 | 3.10 | 0.26 | 1.46 | 0.46 | 3.12 | 0.26 |
| Intercept | 16,401.947 | 0.00 | 6140.33 | 0.00 | 3809.20 | 0.00 | 15,683.562 | 0.00 |
| Temperature | 5.42 | 0.16 | 0.86 | 0.54 | 0.85 | 0.54 | 4.39 | 0.19 |
| Salinity | 29.22 | 0.03 | 7.80 | 0.11 | 3.14 | 0.24 | 4.61 | 0.18 |
| pH | 1.79 | 0.36 | 0.63 | 0.61 | 0.39 | 0.72 | 0.36 | 0.74 |
Table 7.
ANOVA results for the orthogonal experiment (3–14 d).
| 3 d Group | 4 d Group | 5 d Group | 7 d Group | 14 d Group | ||||||
|---|---|---|---|---|---|---|---|---|---|---|
| F | Sig. | F | Sig. | F | Sig. | F | Sig. | F | Sig. | |
| Correction Model | 31.52 | 0.03 | 8.54 | 0.11 | 25.15 | 0.04 | 47.44 | 0.02 | 33.64 | 0.03 |
| Intercept | 457,323.857 | 0.00 | 114,506.579 | 0.00 | 590,649.31 | 0.00 | 24,4245.33 | 0.00 | 41,653.10 | 0.00 |
| Temperature | 61.00 | 0.02 | 23.15 | 0.04 | 58.69 | 0.02 | 124.00 | 0.01 | 80.69 | 0.01 |
| Salinity | 26.14 | 0.04 | 0.41 | 0.71 | 16.69 | 0.06 | 16.00 | 0.06 | 19.00 | 0.05 |
| pH | 7.43 | 0.12 | 2.07 | 0.33 | 0.08 | 0.93 | 2.33 | 0.30 | 1.22 | 0.45 |
Table 8.
Post hoc multiple comparisons (salinity).
| 3 h Group | ||
|---|---|---|
| Range | t Value | p Value |
| 15–25 | −0.77 | 0.52 |
| 15–35 | −6.97 | 0.02 |
| 25–35 | −6.20 | 0.03 |
Table 9.
Post hoc multiple comparisons (temperature).
| 3 d Group | 4 d Group | 5 d Group | 7 d Group | 14 d Group | ||||||
|---|---|---|---|---|---|---|---|---|---|---|
| Range | t Value | p Value | t Value | p Value | t Value | p Value | t Value | p Value | t Value | p Value |
| 20–25 | 2.94 | 0.10 | 0.98 | 0.43 | 1.02 | 0.42 | −9.90 | 0.01 | 6.79 | 0.02 |
| 20–30 | 10.69 | 0.01 | 6.32 | 0.03 | −9.85 | 0.01 | 15.56 | 0.01 | 12.63 | 0.01 |
| 25–30 | −7.75 | 0.02 | 5.34 | 0.03 | −8.83 | 0.01 | −5.66 | 0.03 | −5.90 | 0.03 |
Publisher’s Note: MDPI stays neutral with regard to jurisdictional claims in published maps and institutional affiliations. |
© 2022 by the authors. Licensee MDPI, Basel, Switzerland. This article is an open access article distributed under the terms and conditions of the Creative Commons Attribution (CC BY) license (https://creativecommons.org/licenses/by/4.0/).
Share and Cite
MDPI and ACS Style
Xin, Y.; Guo, Y.; Sun, M.; Yu, G.; Ma, Z.; Pei, K.; Qin, C. Optimal Conditions to Quantify the Relationship between eDNA Concentration and Biomass in Acanthopagrus latus. Water 2022, 14, 3521. https://doi.org/10.3390/w14213521
AMA Style
Xin Y, Guo Y, Sun M, Yu G, Ma Z, Pei K, Qin C. Optimal Conditions to Quantify the Relationship between eDNA Concentration and Biomass in Acanthopagrus latus. Water. 2022; 14(21):3521. https://doi.org/10.3390/w14213521
Chicago/Turabian StyleXin, Yi, Yu Guo, Meijing Sun, Gang Yu, Zhenhua Ma, Kun Pei, and Chuanxin Qin. 2022. "Optimal Conditions to Quantify the Relationship between eDNA Concentration and Biomass in Acanthopagrus latus" Water 14, no. 21: 3521. https://doi.org/10.3390/w14213521
Note that from the first issue of 2016, this journal uses article numbers instead of page numbers. See further details here.