
Coupling Effects of Strain Rate and Low Temperature on the Dynamic Mechanical Properties of Frozen Water-Saturated Sandstone
1
State Key Laboratory of Disaster Prevention and Mitigation of Explosion & Impact, Army Engineering University of PLA, Nanjing 210007, China
2
State Key Laboratory for Geomechanics & Deep Underground Engineering, China University of Mining & Technology, Xuzhou 211116, China
*
Authors to whom correspondence should be addressed.
Water 2022, 14(21), 3513; https://doi.org/10.3390/w14213513
Submission received: 5 October 2022
/
Revised: 23 October 2022
/
Accepted: 26 October 2022
/
Published: 2 November 2022
(This article belongs to the Special Issue Research on Rock Mechanics under Freeze-Thaw Action)
Abstract
:The mechanical properties of water-rich rocks in a subzero temperature environment are quite different from those at room temperature, which introduces many unexpected engineering hazards. The dynamic compressive behaviors of frozen water-saturated sandstone are related to strain rate and temperature at different degrees. In this paper, quasi-static and dynamic tests were conducted on the saturated sandstone utilizing the MTS-816 apparatus and the modified split Hopkinson pressure bar (SHPB) device with a freezing module, which are constrained at a temperature range of −1 °C~−20 °C and a strain rate range of 10−5 s−1~200 s−1. The coupling effect of strain rate and temperature on the mechanical characteristics of saturated sandstone is systematically investigated. It is found that the quasi-static compressive strength of frozen saturated sandstone increases with the applied temperature from −1 °C to −5 °C and decreases with that from −5 °C to −20 °C, while the dynamic compressive strength exhibits an opposite trend. Different from the primary shear failure under quasi-static tests, the failure pattern of the frozen specimens becomes tensile failure under dynamic tests with an evident sensitivity to the applied temperature. Furthermore, the dissipated energy can be positively correlated with strain rate, while the growth rate of dissipated energy decreases with the applied temperature from −1 °C to −5 °C and increases with that from −5 °C to −20 °C. A new water-ice phase transition mechanism was further introduced, which divided the freezing process of water-saturated rock into the intensive stage and the stable water-ice phase transition stage. The underlying mechanism of water-ice phase transition governing the dynamic mechanical behavior of frozen saturated sandstone was also revealed.
1. Introduction
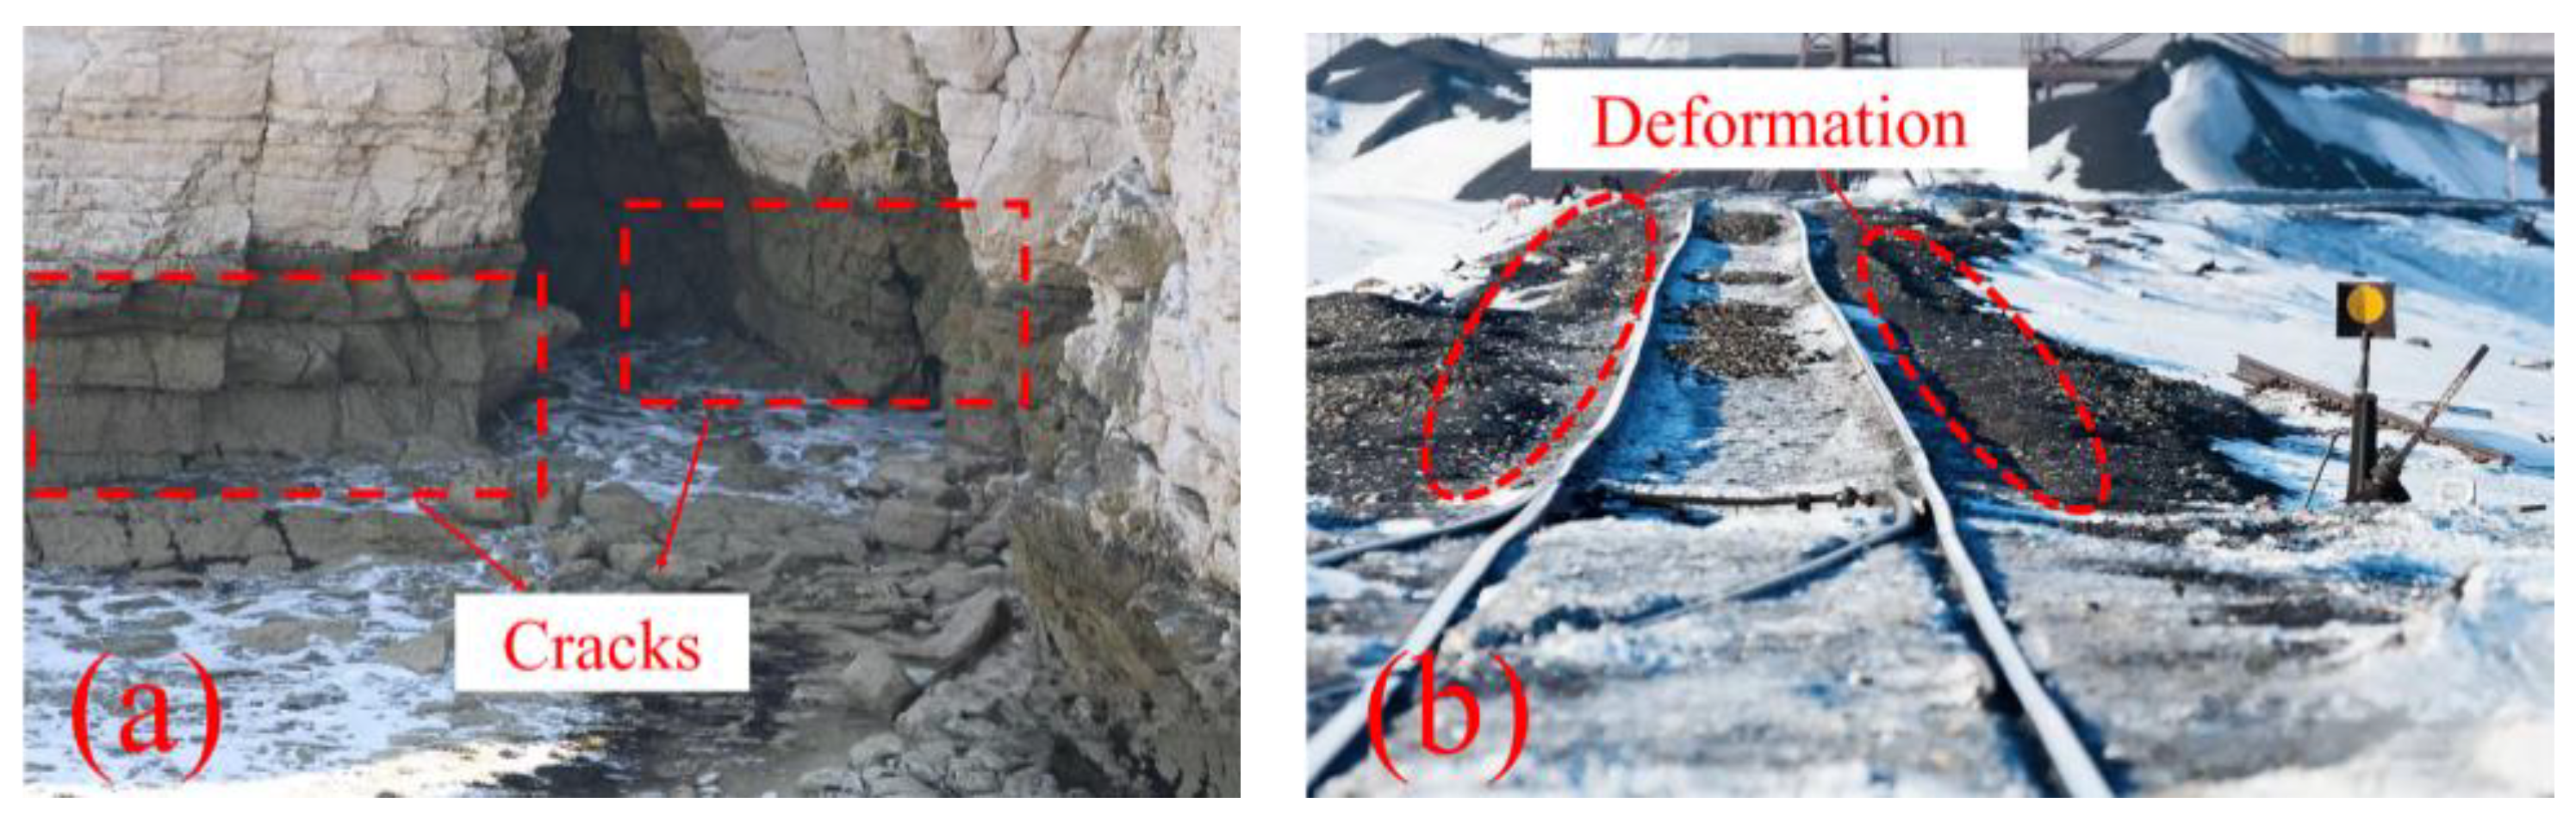
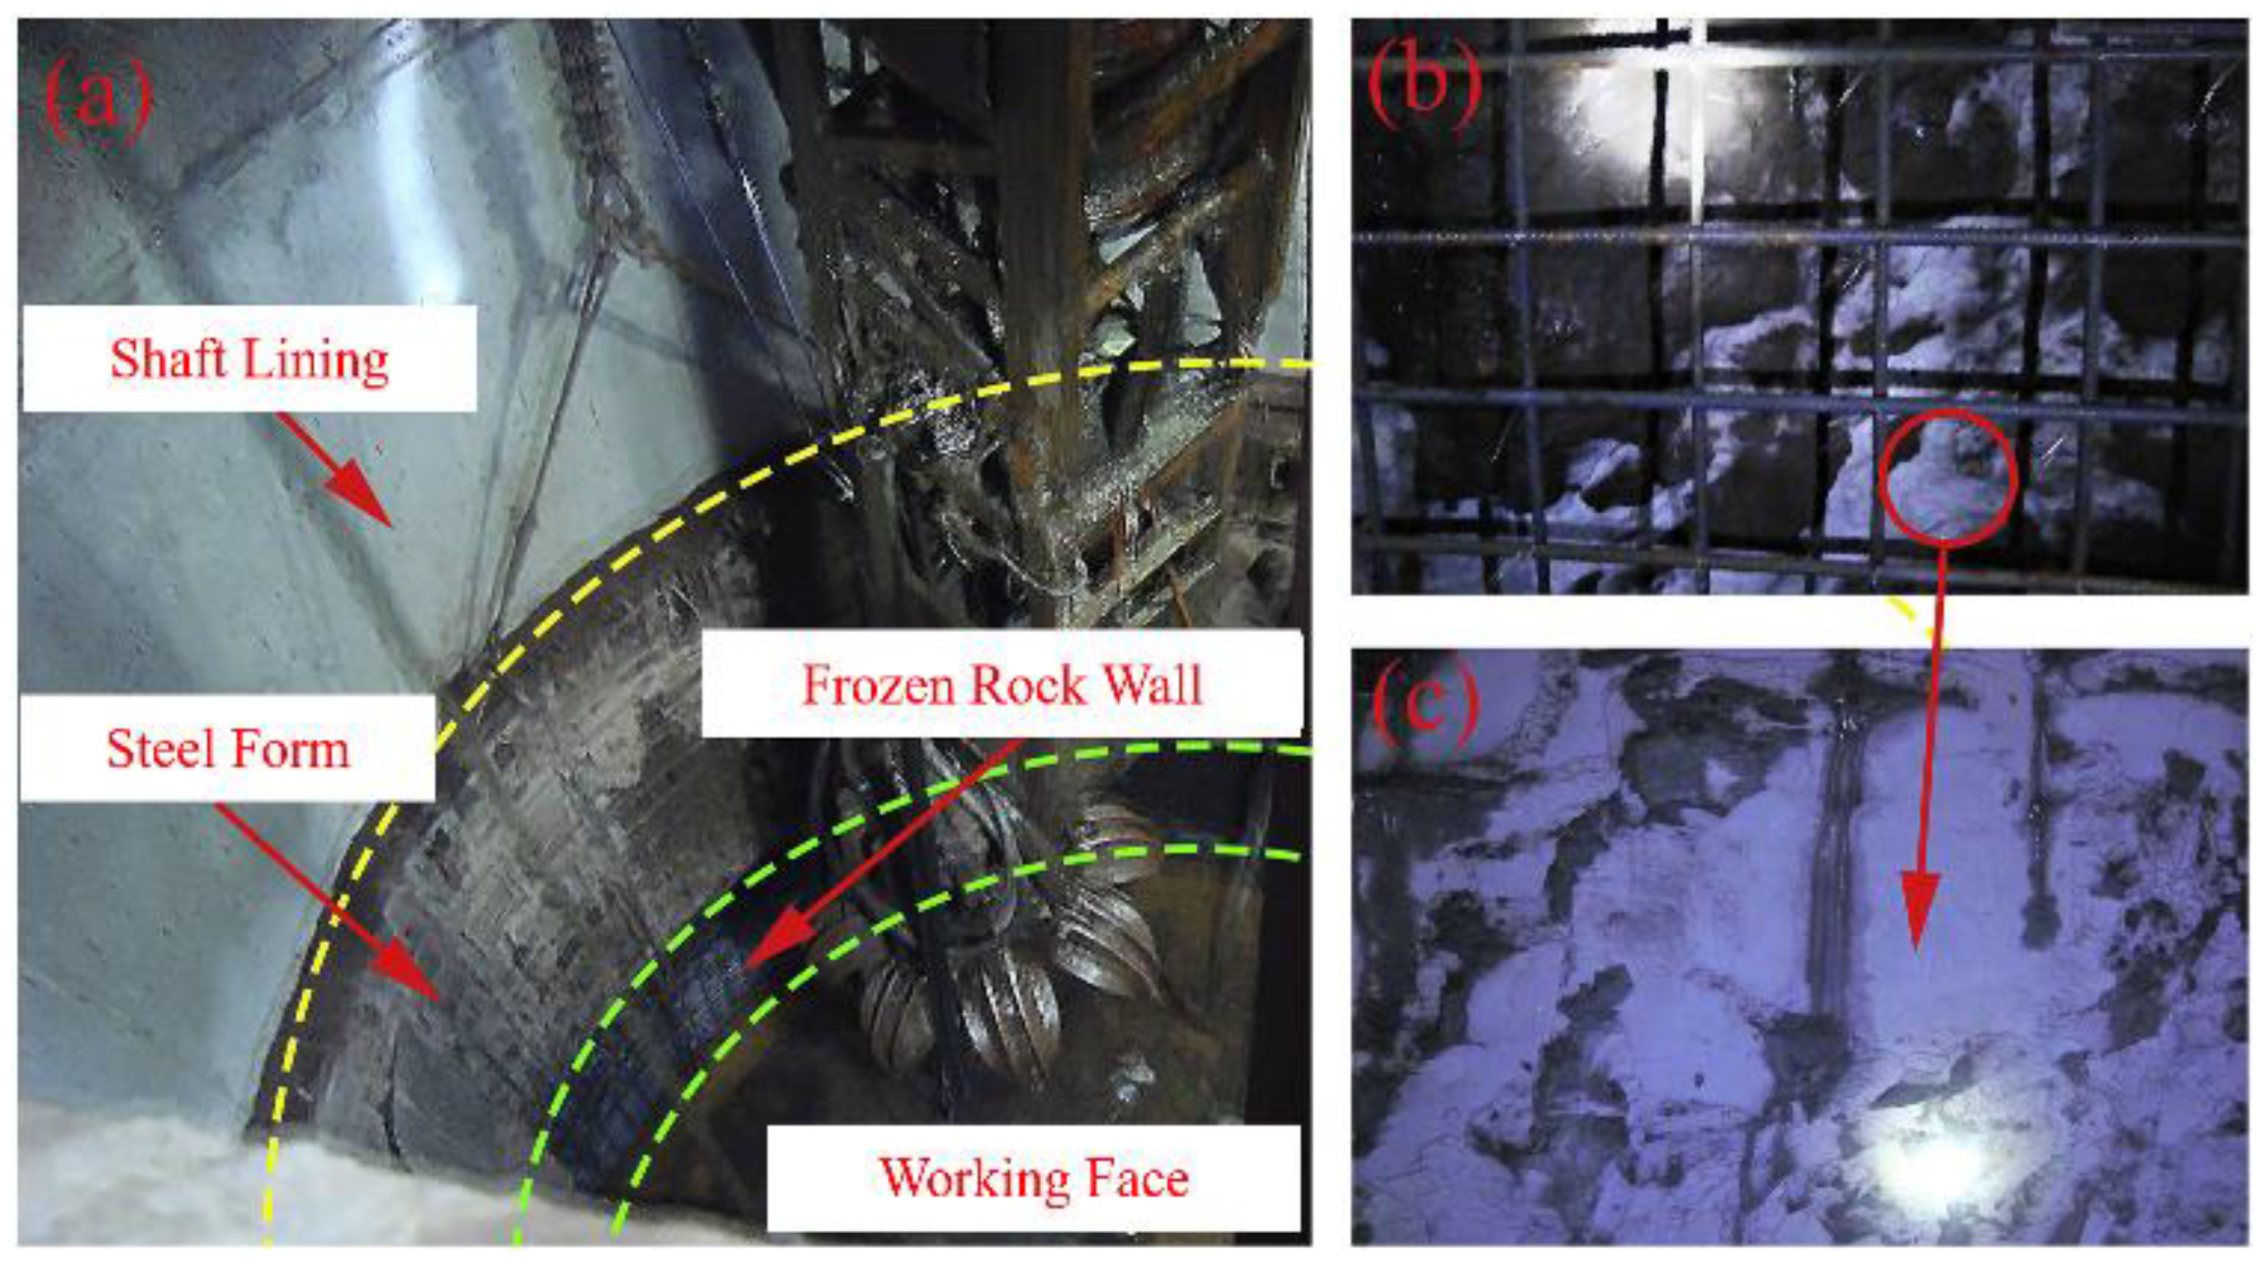
For underground rock engineering, the rock mass is rich in groundwater, which places the rock in a state of infiltration. Especially, the water-rock interaction mechanism changes the internal structure of the sandstone, resulting in the deterioration of mechanical properties [1,2]. On the other hand, cold area constructions have been extensively developing in recent years, such as the Qinghai-Tibet Railway, Siberian Railway, China-Russia Crude Oil Pipeline, and Osaka Mountain Highway Tunnel in cold regions. Cold regions are characterized by a long duration of a low-temperature environment throughout the year with relatively concentrated rainfall. The phase change from water to ice in the pore at subzero temperatures results in many disastrous problems such as cracks in the frozen rock by frost heaving force, subgrade deformation of highway and railway, and so on, as shown in Figure 1. Besides this, the freezing technique as shown in Figure 2 is widely used in engineering construction to stabilize the surrounding strata. It uses artificial refrigeration technology to turn natural rock into frozen rock, and thus increases the strength and stability of the rock, while the strength enhancement is still ambiguous.
The interior of water-saturated frozen rock is composed of water, ice, and mineral particles. The decreasing temperature leads to the water-to-ice phase transition in the pores of rock, which will greatly affect the physical and mechanical properties of the rock under static load. Up to now, many scholars have studied the basic physical and mechanical properties of frozen sandstone through quasi-static uniaxial and triaxial compression tests. The cementation of the whole rock is strengthened by the phase transition of water-ice in the rock as well as the shrinking of mineral particles [1]. It leads to a tighter pore space, which improves the capacity of frozen rock to bear external stress. The weakly frozen red sandstones were conducted by triaxial compression test and demonstrated that the elastic modulus, compressive strength, cohesion, and internal friction angle increased with the decreasing temperature of 20 °C~−30 °C under saturated conditions [2]. In addition, triaxial compression tests were applied to sandstone at different temperatures and showed that the increasing confining pressure reduced the freezing point and plasticity of sandstone, resulting in the decrease in the sensitivity to the temperature of elastic modulus [3,4,5]. Meanwhile, the compressive strength of sandstone increased linearly at low temperatures below a specific value, while the improvement in compressive strength decreased at temperatures beyond a certain value, which depended on the material properties [6]. This could be explained in that the frost heaving force produced by pore ice would offset the external load [7]. The dynamic mechanical properties of frozen rock showed different variation laws at a subzero temperature. Despite the low-temperature hardening effect that increased the strength of frozen rock, the dynamic strength of frozen rock decreased when the temperature was below a limit value [8,9,10]. The frozen sandstone was investigated by SHPB test with a comparison temperature scenario of 0 °C~−30 °C and 10 °C, illustrating that the dynamic peak strength of frozen sandstone at −30 °C is lower than that at −20 °C [11]. There was a frostbite effect at a low temperature, which deteriorated the mechanical properties. Several scholars gave the following explanations for the change law of strength. Owing to the large difference in the contraction of different phases at a low temperature, it would produce micro-cracks and micro-defects in the rock, thus affecting the overall strength [12,13]. On the other hand, the water-saturated sandstone was tested using an SHPB system with a low-temperature environmental device, indicating that the dynamic compressive strength at −10 °C was higher than that at −15 °C [14]. With the increase in strain rate, the failure pattern of frozen rock changed from large-sized fragments produced by annular spalling to small-sized granular fragments. With the decrease in temperature, the number of flaky and conical fragments of rock increased. The decreasing temperature improved the cementation of sandstone near zero temperature while the transition of the water-ice phase produced microcracks at a lower temperature [13]. In addition, the change in rock internal temperature with the duration of freezing and thawing was recorded and showed that there was a slow temperature change stage at 0 °C~−5 °C, which indicated that the phase change degree of water-ice was intense at this temperature [15]. However, the change law of mechanical properties in the temperature range of 0 °C~−5 °C has not been paid enough attention. Moreover, the influence of the temperature effect on strength variation and the interaction mechanism between water-ice and rock is far from comprehensive.
As aforementioned, the coupling effect of temperature and strain rate has a significant influence on the dynamic mechanical properties of frozen sandstone. Moreover, there are some controversies obtained between the test results by scholars. In addition, they seem to neglect the intensive water-ice phase transition in the temperature range of 0 °C~−5 °C, while the phase transition at this stage causes great changes in mechanical properties. Therefore, in this paper, the frozen water-saturated red sandstone samples were tested at a temperature scenario of −1 °C, −3 °C, −5 °C, −10 °C, and −20 °C. The dynamic mechanical properties of rock samples under different low temperature gradients were studied and analyzed by SHPB tests at strain rates ranging from 50 s−1 to 200 s−1. The effect of the low temperature and strain rate on the relationship of strain-stress, failure patterns, and energy evolution law were investigated. Beyond that, the water-ice phase transition mechanism was introduced herein to discuss the degree of water-ice transition under different temperatures, the strength change laws, as well as failure patterns under quasi-static and dynamic loads. The results could provide a scientific reference for engineering constructions in cold regions.
2. Sample Preparation and Test Procedures
2.1. Sample Preparation
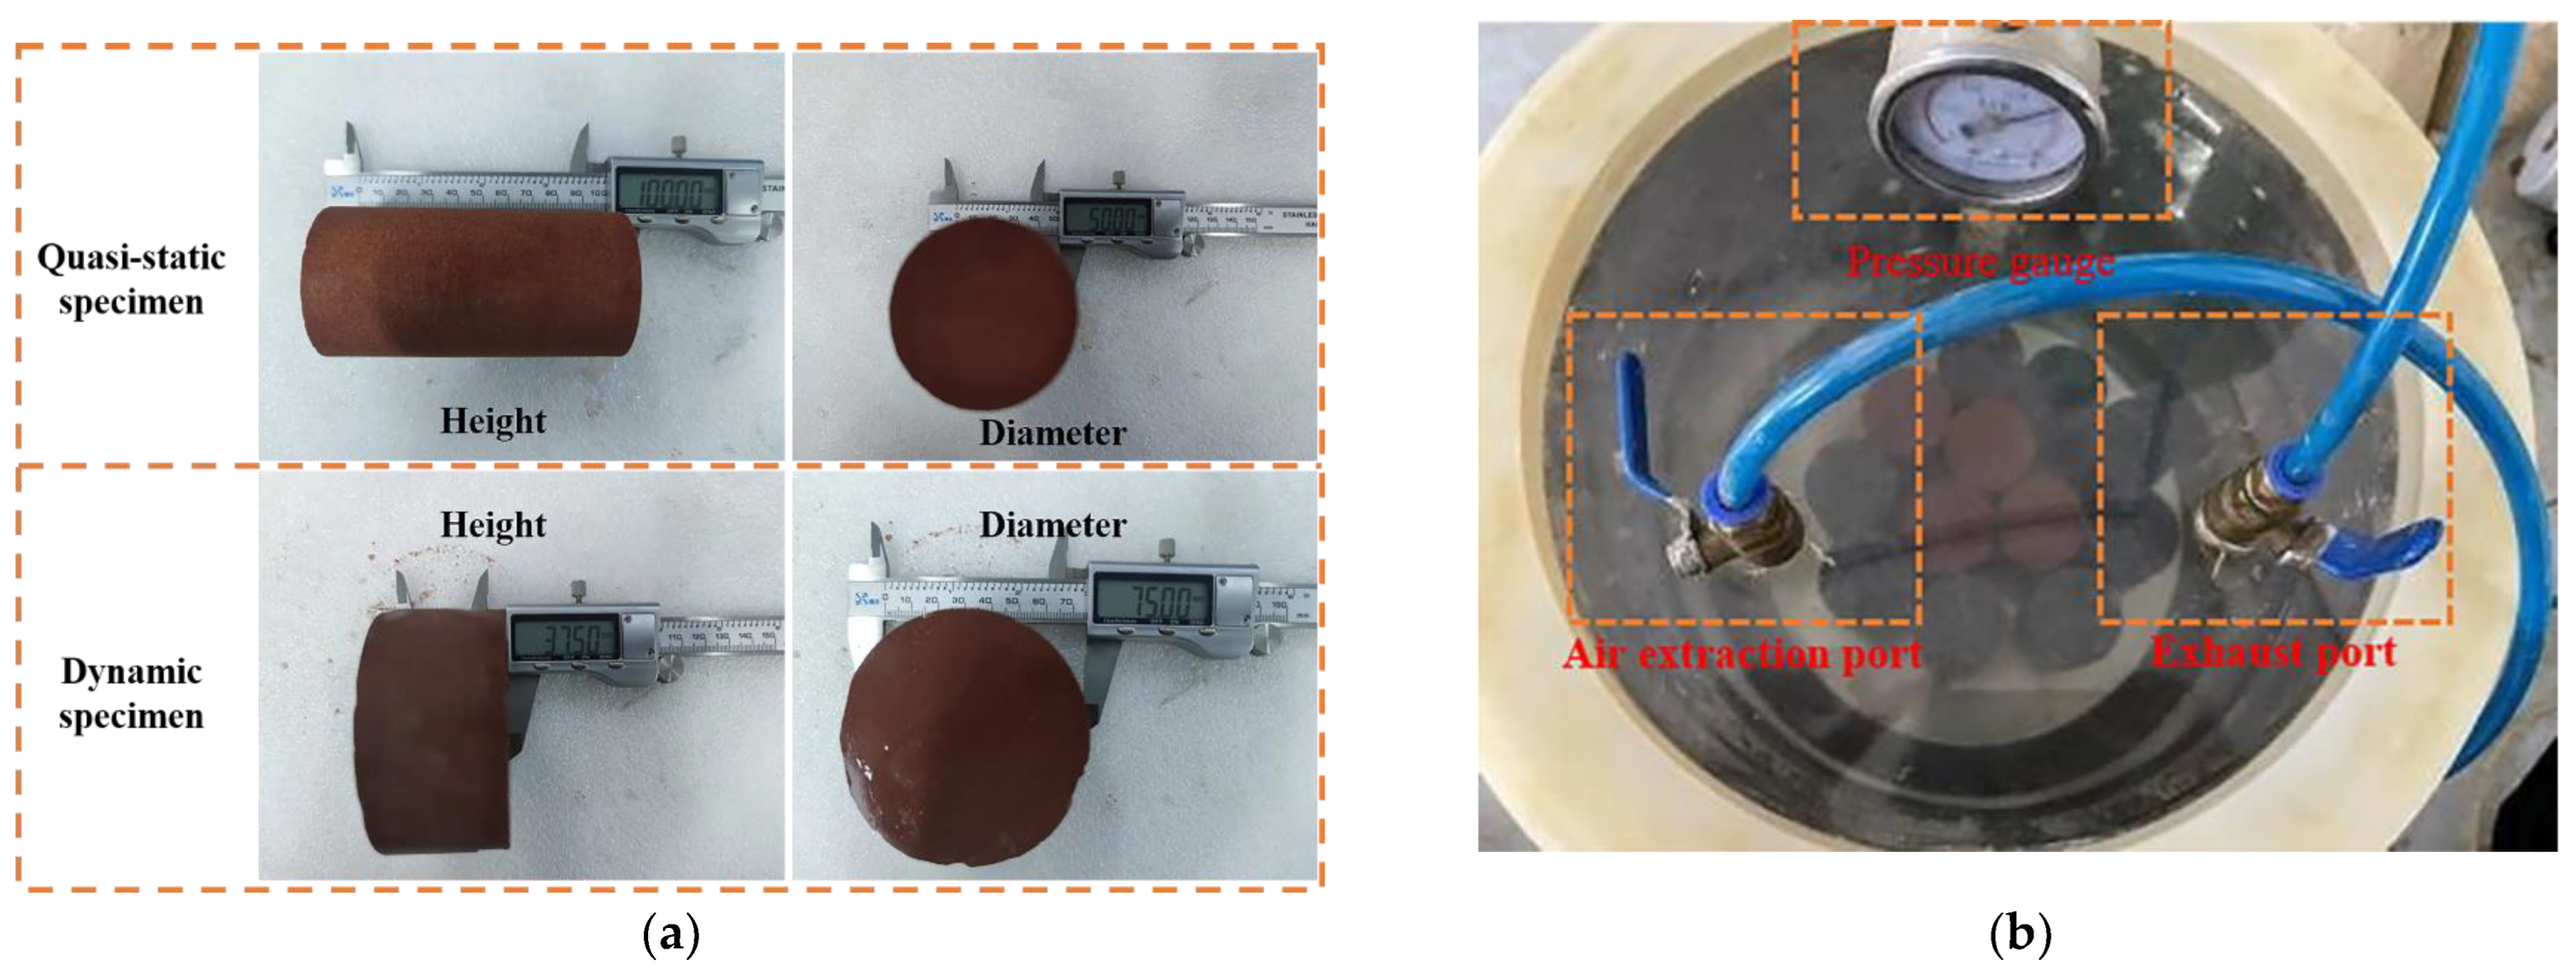
A rock block with good integrity was selected from the depth of −50 m in Shigatse, Tibet, with an average altitude of 4000 m. In order to meet the ISRM requirements for dynamic load test specimens, the specimens were fabricated into Φ75 mm × 37.5 mm after coring and polishing. The end face parallelism was controlled below 0.02 mm. Meanwhile, the specimens with the size of Φ50 mm × 100 mm were also prepared for static tests. The specimens were visually observed in brown-red color and the measured basic physical properties are listed in Table 1. To understand the mechanical properties of water-saturated rock in the subzero environment, the specimens were placed into a water-filling vacuum for saturation treatment at a negative pressure of 0.1 MPa for 24 h, as shown in Figure 3. The specimens could not be regarded as water-saturated samples until the mass of specimens did not change. Finally, the specimens were wrapped in sealed bags and stored in a low-temperature device with a freezing rate of 5 °C/min. The samples were frozen for 24 h when the environment of the box reached the set temperature of the test scenario.
2.2. Test Apparatus
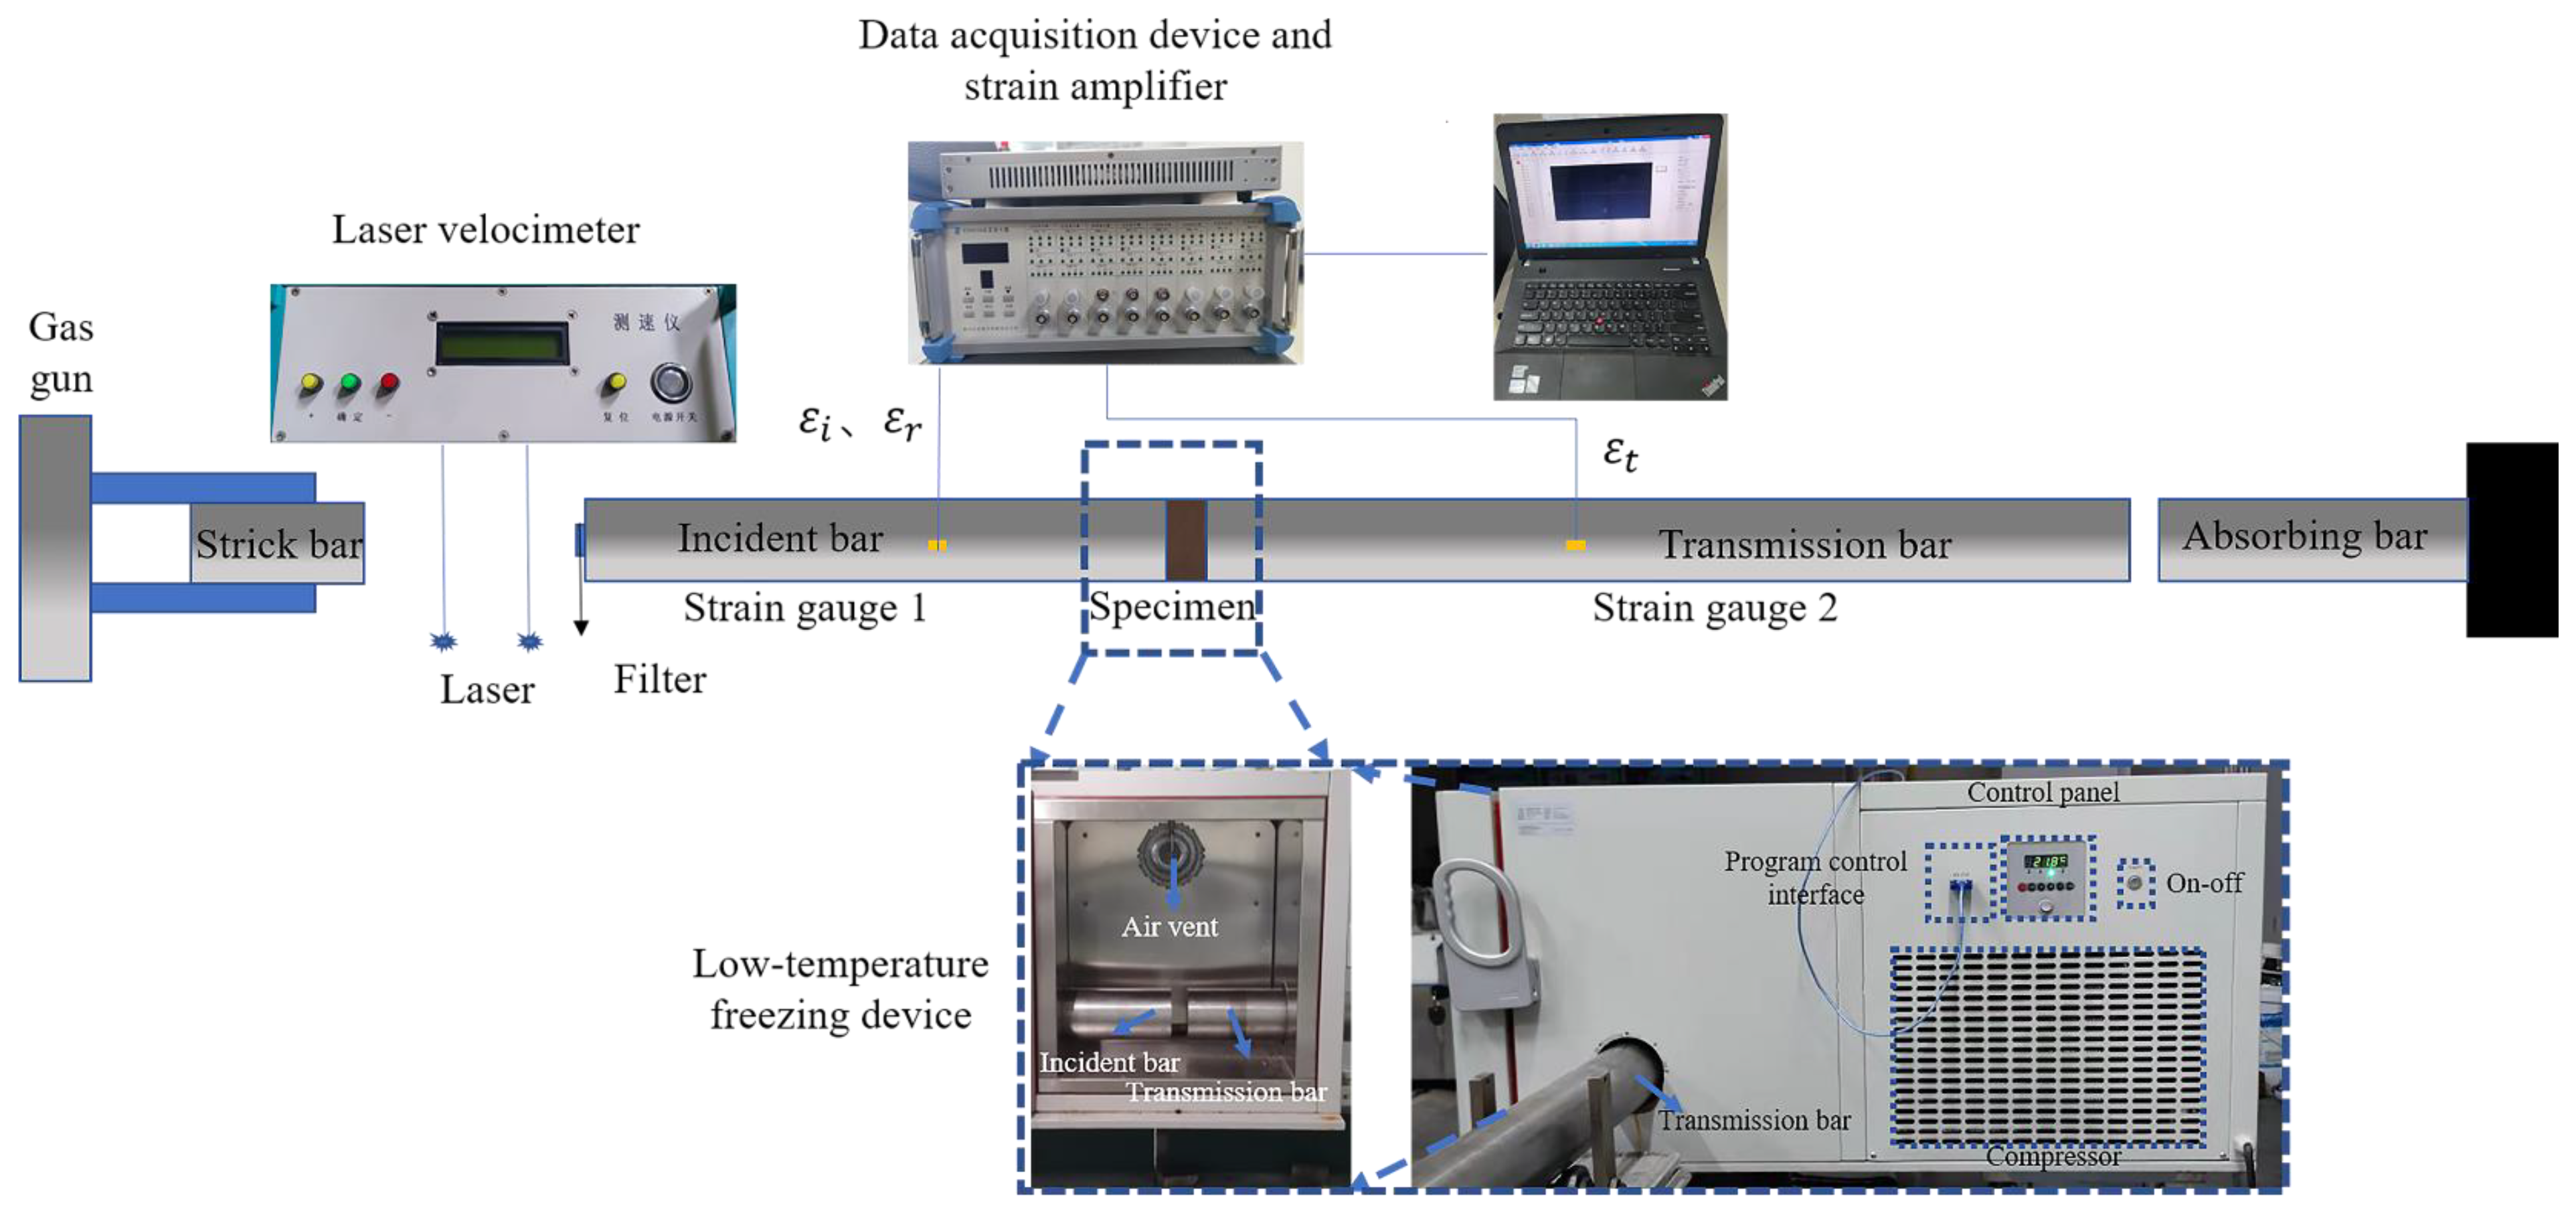
The quasi-static test was conducted using the MTS-816 experimental apparatus, while the impact compressive test was carried out in the laboratory of Army Engineering University with a split Hopkinson pressure bar (SHPB) testing system. As shown in Figure 4, the SHPB system is composed of a bar system and a signal processing system, with the bar system consisting of an incident bar, a transmission bar, and an absorbing bar. The distance of strain gauge 1 to the incident bar back end is 2010 mm and the distance of strain gauge 2 to the transmission bar front end is 1289 mm. The low-temperature environment device as shown in Figure 4 was composed of a compressor and a test chamber, which was equipped with an observation window to observe the crack propagation of the specimens through high-speed photography. It could provide an environment with a temperature range of ±90 °C and a PID control system was adopted to ensure the temperature accuracy of 0.1 °C for 24 h. The specimens were parceled between the incident bar and the transmission bar to simulate the environment temperature in the plateau cold area.
The SHPB system is based on the following two assumptions: (1) One-dimensional elastic wave hypothesis: there is no dispersion in the propagation of plane compression wave in linear cylindrical rods. (2) Stress uniformity hypothesis: the specimen deforms uniformly during the whole impact process and the stress and strain of the specimen are evenly distributed along its length. The impact of the strike bar on the incident bar produces an incident pulse, which is measured as the incident strain through gauge 1 on the incident bar. When the incident wave reaches the interface between the incident bar and the specimen, part of the pulse transmits to the specimen and part of the pulse reflects into the incident bar, which is measured by strain gauge 1 on the incident bar. Similarly, the pulse was transmitted to the specimen and passed through the specimen-transmission bar section, and a part of the pulse reflects into the specimens measured by strain gauge 2. Based on these hypotheses, formulas using the three-wave method are adopted to process the recorded signals and calculate the required dynamic mechanical parameters of , , and as follows:
where and are the section area of the bar and specimen, respectively; , , and are the incident strain, the reflect strain, and the transmission strain, respectively; (= 7800 kg/m3) are the elastic modulus and the wave velocity propagating in the bars, which are 2.06 GPa and 5145 m/s, respectively.
2.3. Test Methodology
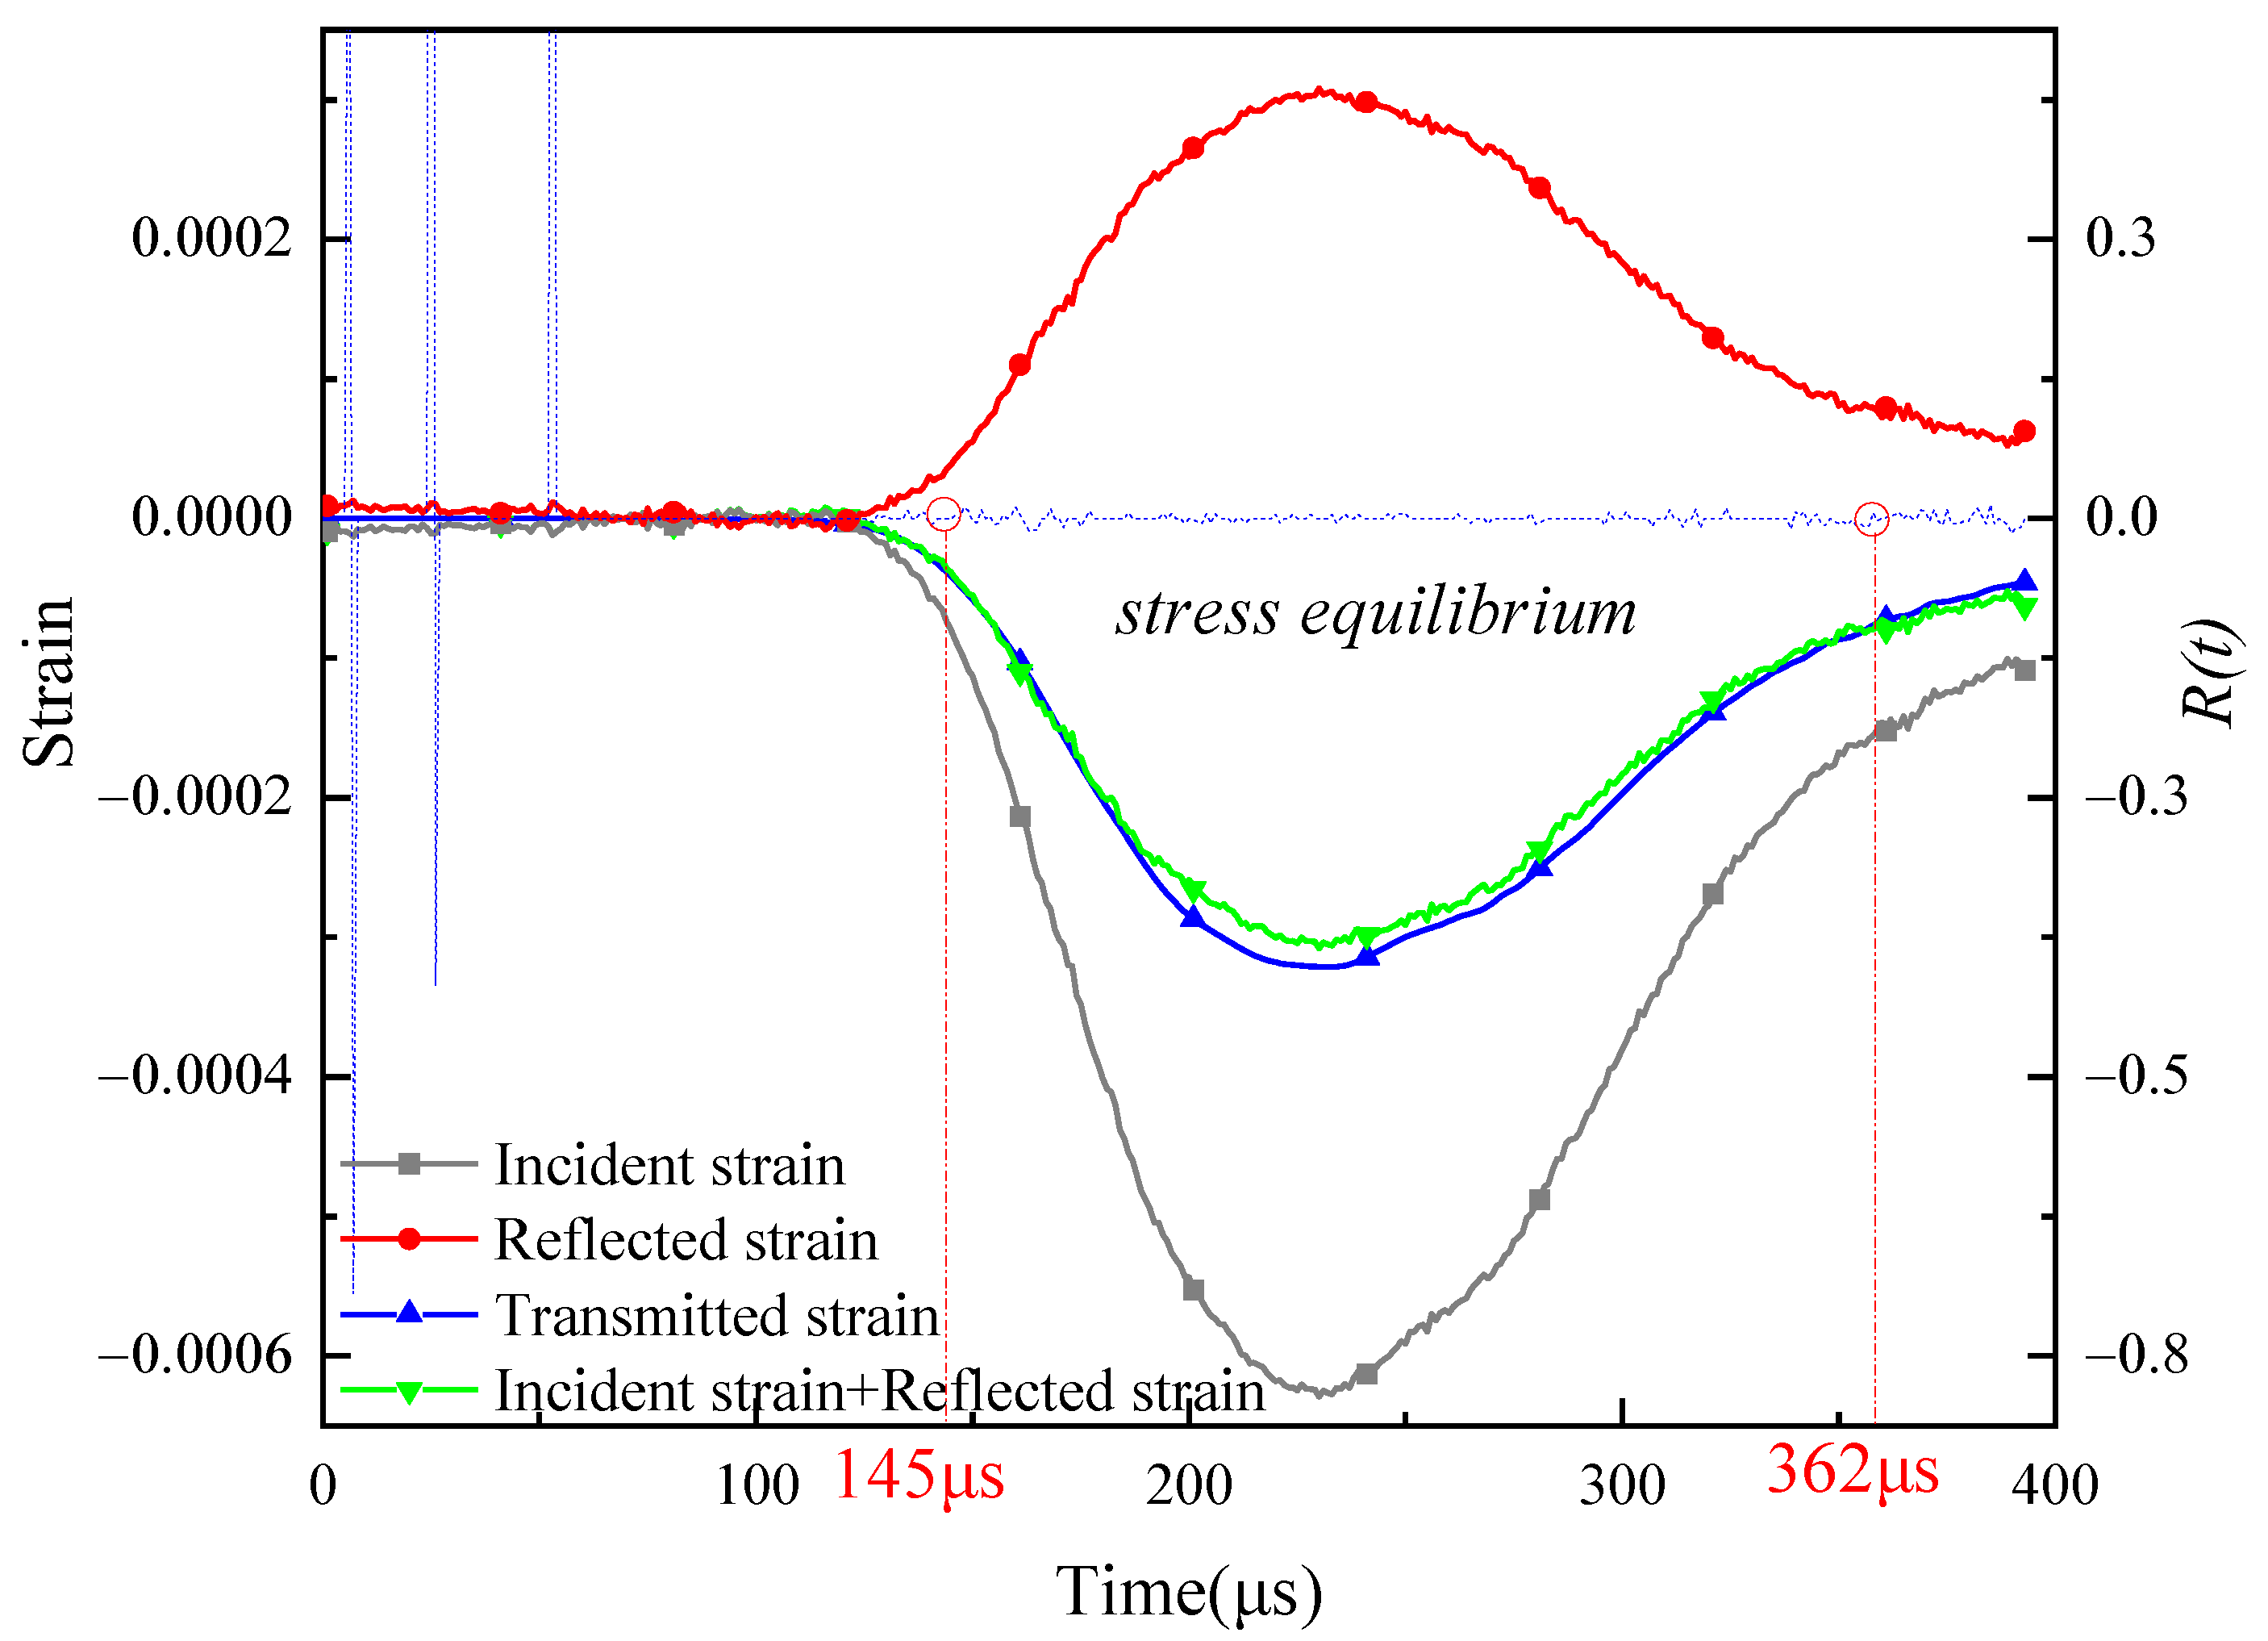
The MTS-816 testing machine was utilized to accomplish the uniaxial compression test of frozen sandstone at a displacement rate of 0.002 mm/s, i.e., 2 × 10⁻⁵ s−1. The dynamic mechanical experiment was at strain rate range of 101 s−1 to 103 s−1. Five samples were tested in dynamic compression tests at each temperature. Several preparations are made before dynamic tests in order to accomplish the aforementioned two basic assumptions: (1) In order to satisfy the one-dimensional elastic wave assumption, the transmission bar of the reaction between the incident bar needed to be adjusted and the alignment of the two bars required to be ensured, bringing close to 1. Besides, it was necessary to strike the incident bar against the transmission bar without placing a sample, which could also check the feasibility of the entire test system. (2) To ensure that the stress wave reached the stress equilibrium inside the specimens quickly, the slenderness ratio of the specimen should be 0.5~2.0. The dynamic uniaxial compression strain time curve is plotted in Figure 5 and the relative stress difference between the two ends of the specimen (stress balance factor) was introduced to measure the dynamic stress balance, which could be expressed as a dimensionless quantity as follows:
where is stress balance factor, is the stress difference between the two ends of the specimen, and is the average stress at the end face of the specimen. It could be observed that the equilibrium factor did not exceed 5% in the interval of 145 μs~362 μs, indicating that the specimen was in stress equilibrium during the loading interval.
3. Results and Analysis
3.1. Quasi-Static Compression Test
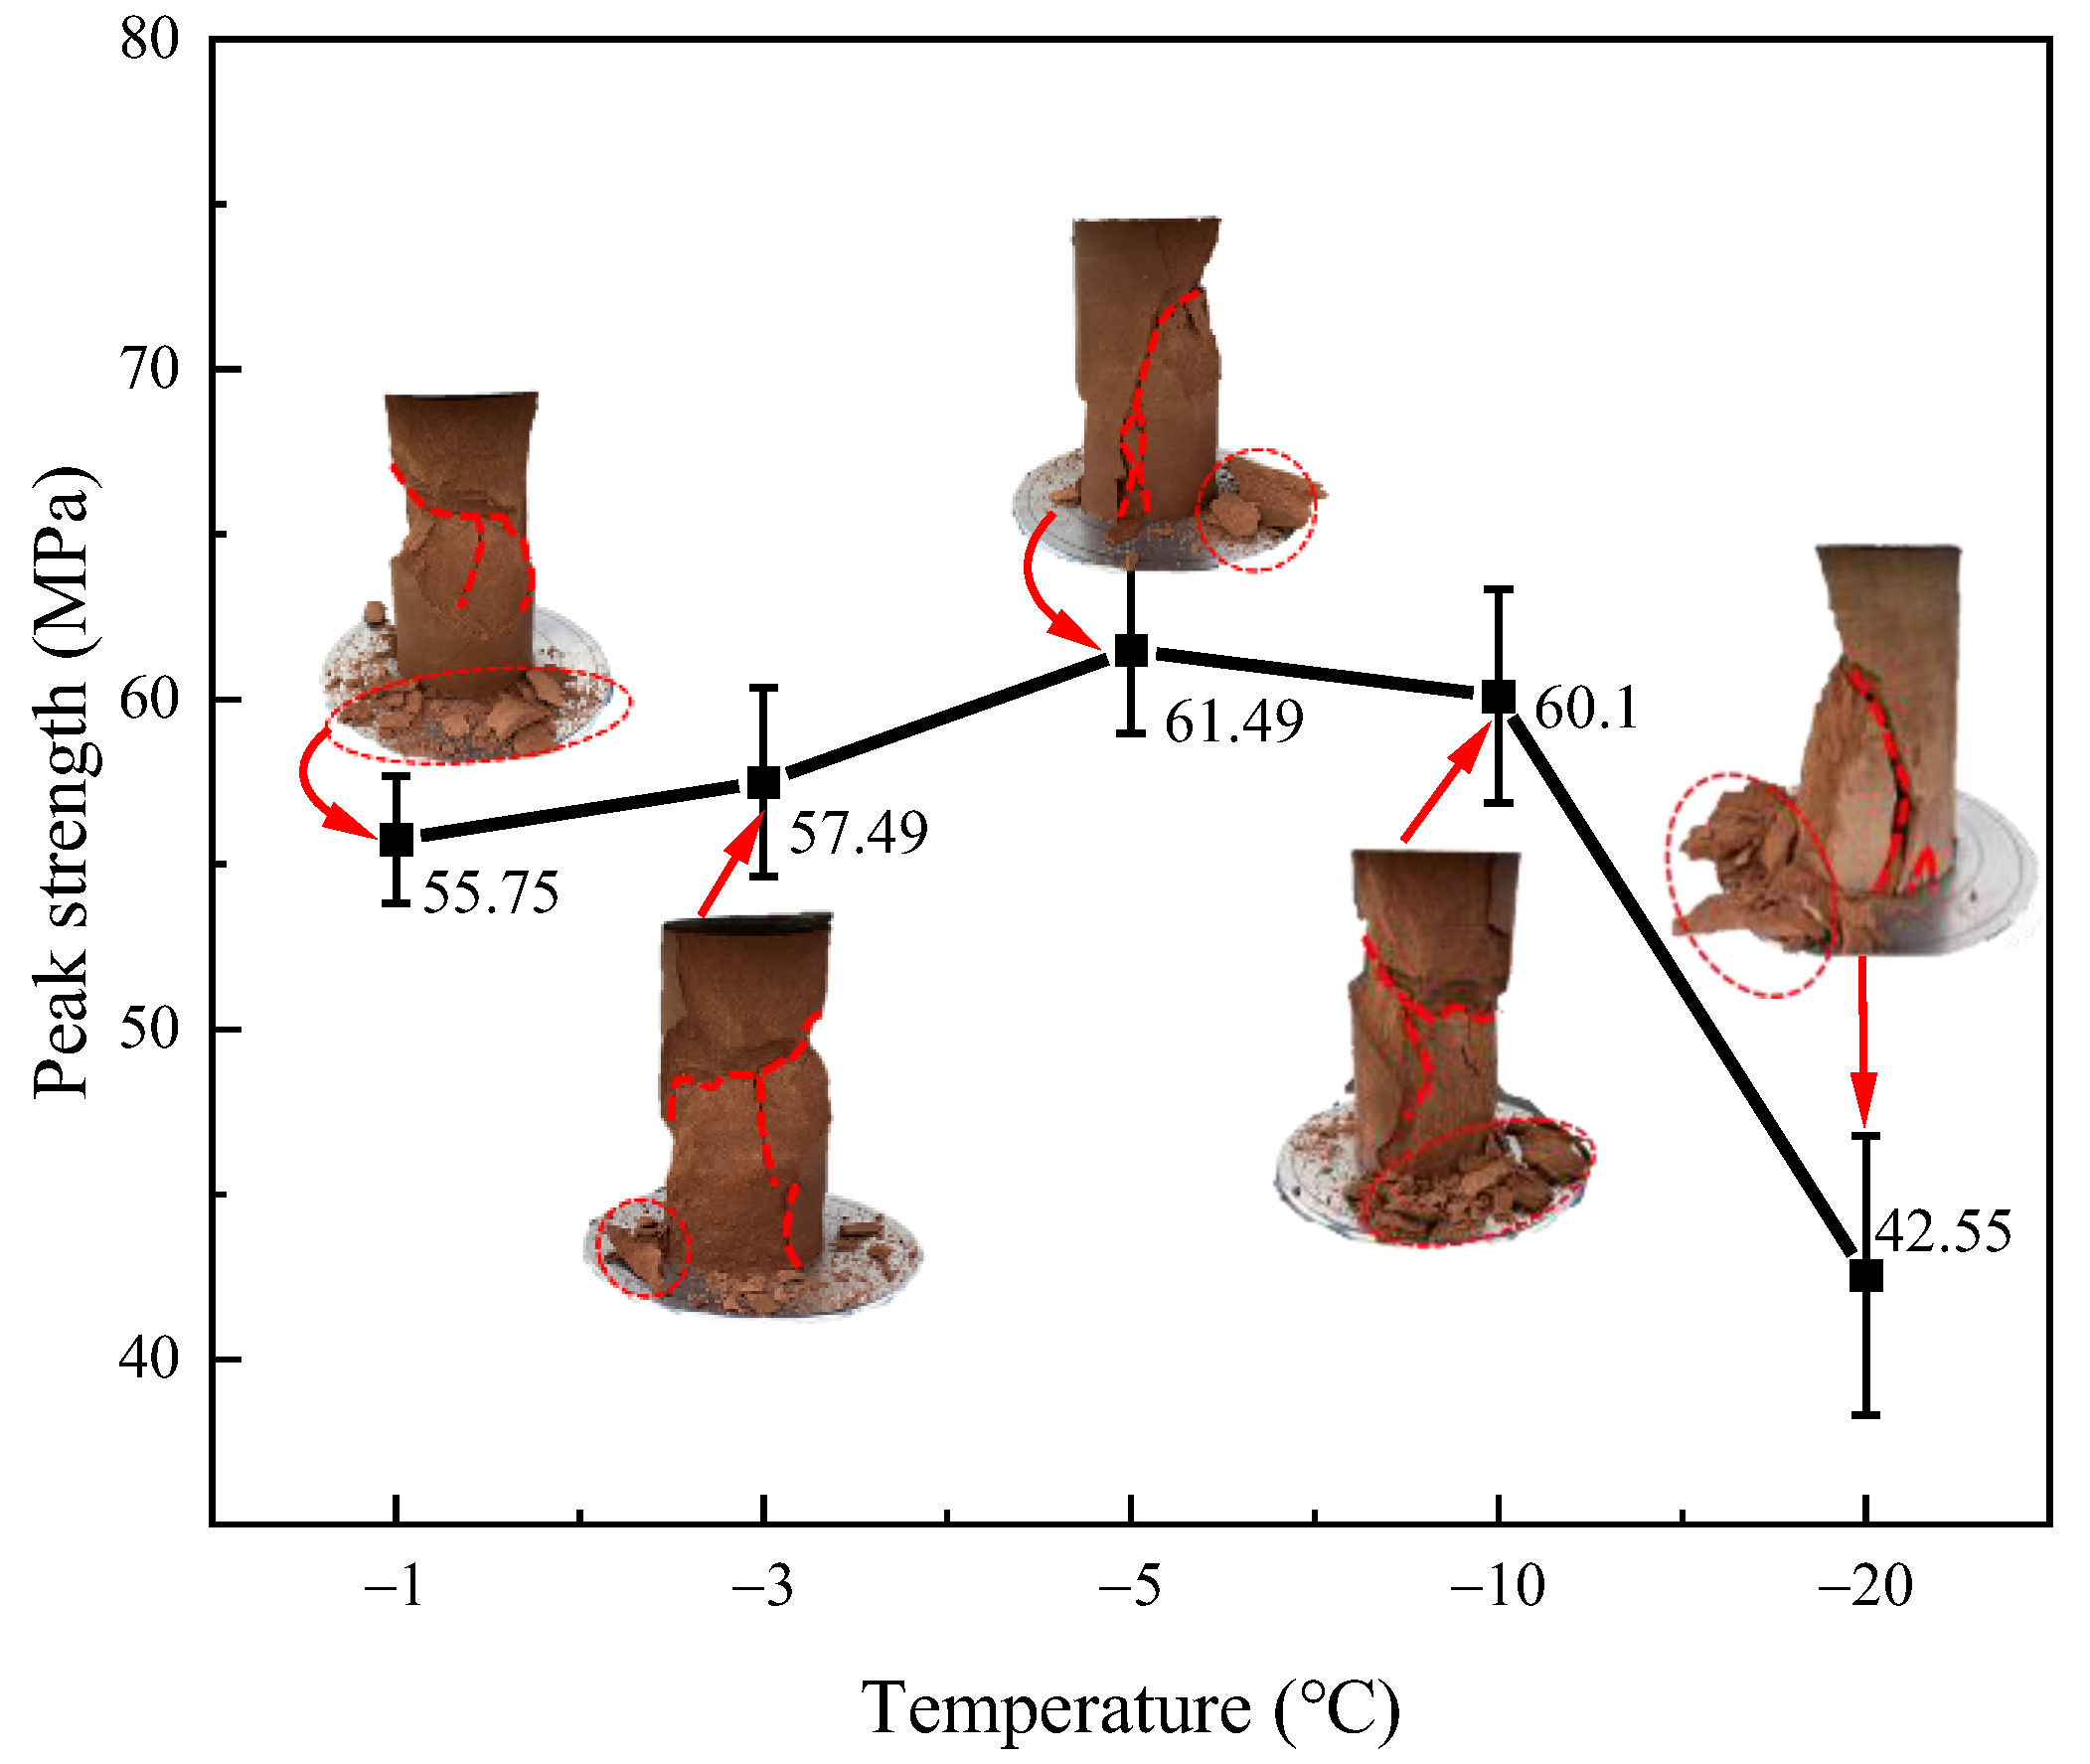
The curve of peak strength with temperatures under quasi-static uniaxial compression test is plotted in Figure 6. It could be seen that peak strength did not change monotonically with temperature. The strength of frozen sandstone increased by 10.30% at the temperature range of −1 °C~−5 °C, which reached the peak extreme at −5 °C. The peak strength declined by 2.26% in the temperature range of −5 °C~−10 °C. There was an obvious downward trend in the temperature range of −10 °C~−20 °C. The different water-ice transition processes in internal pores at different temperatures led to different failure modes of samples under quasi-static loading. In terms of the failure modes in Figure 6, it could be seen that the rock underwent shear failure, which existed as a shear crack. The number of fragments decreased significantly with the decreasing temperature of −1 °C~−5 °C, while the number of small fragments increased significantly with the decreasing temperature of −5 °C~−20 °C.
3.2. Dynamic Compression Test
3.2.1. Dynamic Stress-Strain Curve
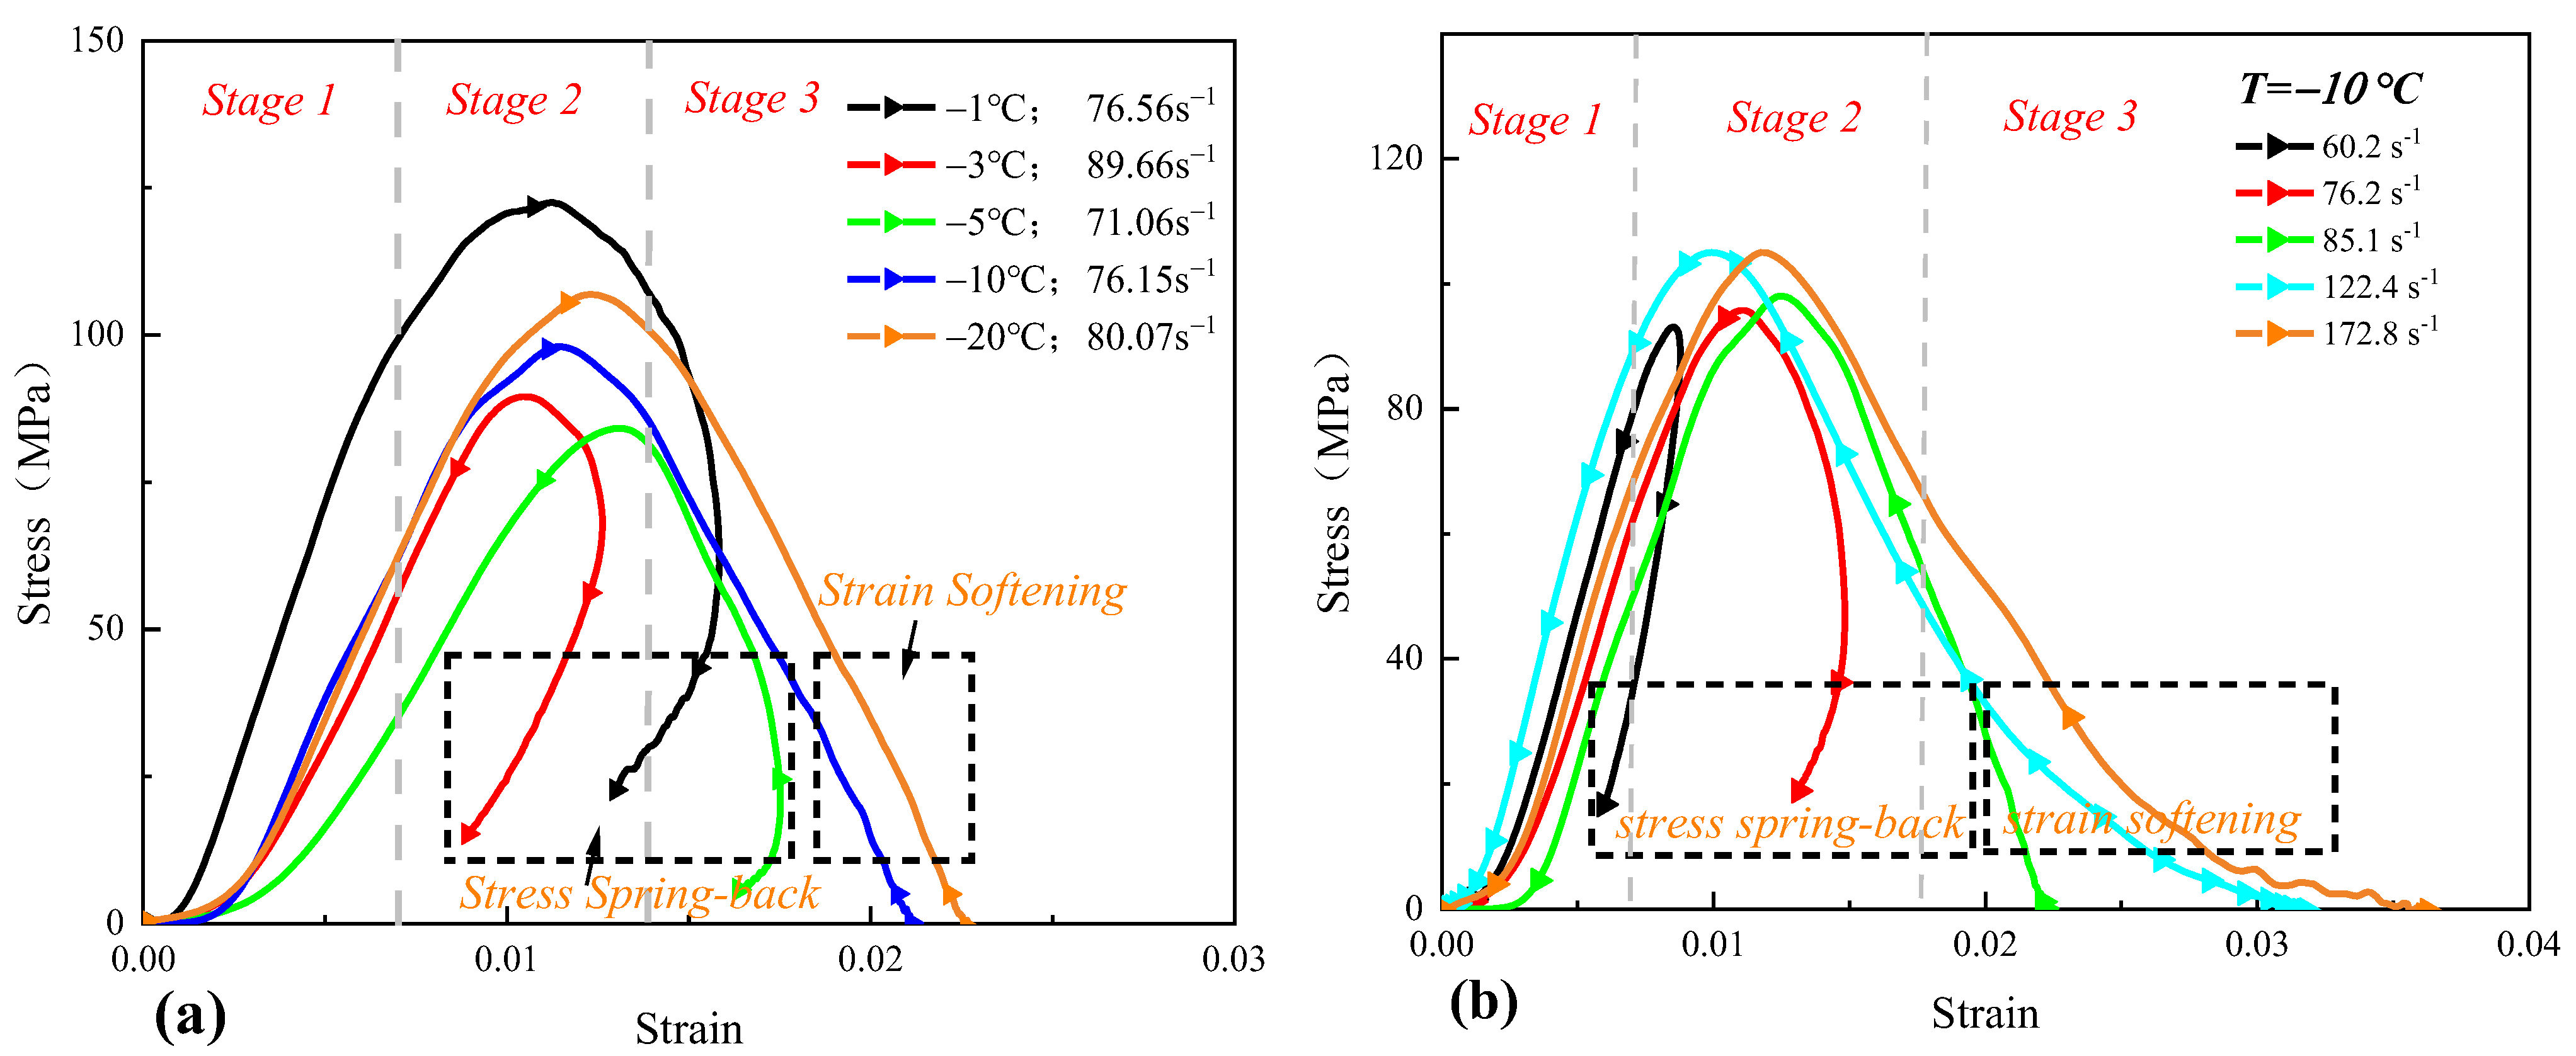
As shown in Figure 7a, the stress-strain curves under different temperatures at the strain rate of about 80 s−1 were plotted. It showed an obvious segmental character and could be divided into three stages: (1) The elastic-deformation stage: Owing to the short duration time of impact load and the internal pores filled with water or ice in water-saturated frozen sandstone, there was almost no space to be compacted [16,17]. Therefore, the specimen underwent a short compaction process and entered the elastic stage where the peak stress increased linearly with strain. (2) The plastic-yield stage: In this stage, the frozen rock reached the plastic state and had a non-linear growth stage. The slope of this stage gradually became smaller. (3) The post-peak stage: There were two phenomena in this stage: stress spring-back and strain softening. The stress spring-back occurred in the post-peak stage in the temperature range of −1~−5 °C, while strain softening occurred in the temperature range of −5 °C~−20 °C. Meanwhile, it was reported that stress spring-back occurred at a low strain rate while strain softening occurred at a high strain rate in Figure 7. This can be explained as the water–rock interaction mechanism with unique dynamic properties [18,19]. The pore water in the rock changed from the free water state to the pressure-bearing state under the impact load. This characteristic slightly decreased at the post-peak stage and resulted in stress spring-back. When the pore of sandstone was damaged, the pore water went from a pressure-bearing condition to a free state. Much unfrozen water in rock pores created pore water pressure under impact load in the temperature range of −1 °C~−5 °C. The pore water pressure could bear the external load, which caused the speed to decrease obviously, resulting in a viscous effect. Therefore, the stress spring-back phenomenon was shown in the dynamic stress-strain curve in the temperature range of −1 °C~−5 °C. The viscous effect disappeared when the pore water content was less in the temperature range of −5 °C~−20 °C, and the increasing decline speed in the post-peak range reflected the characteristics of strain softening. On the one hand, the stress-strain curve reflected the water-ice phase transition of pore water with a decreasing temperature. On the other hand, it reflected the effect of internal pore water pressure in frozen rock under impact load.
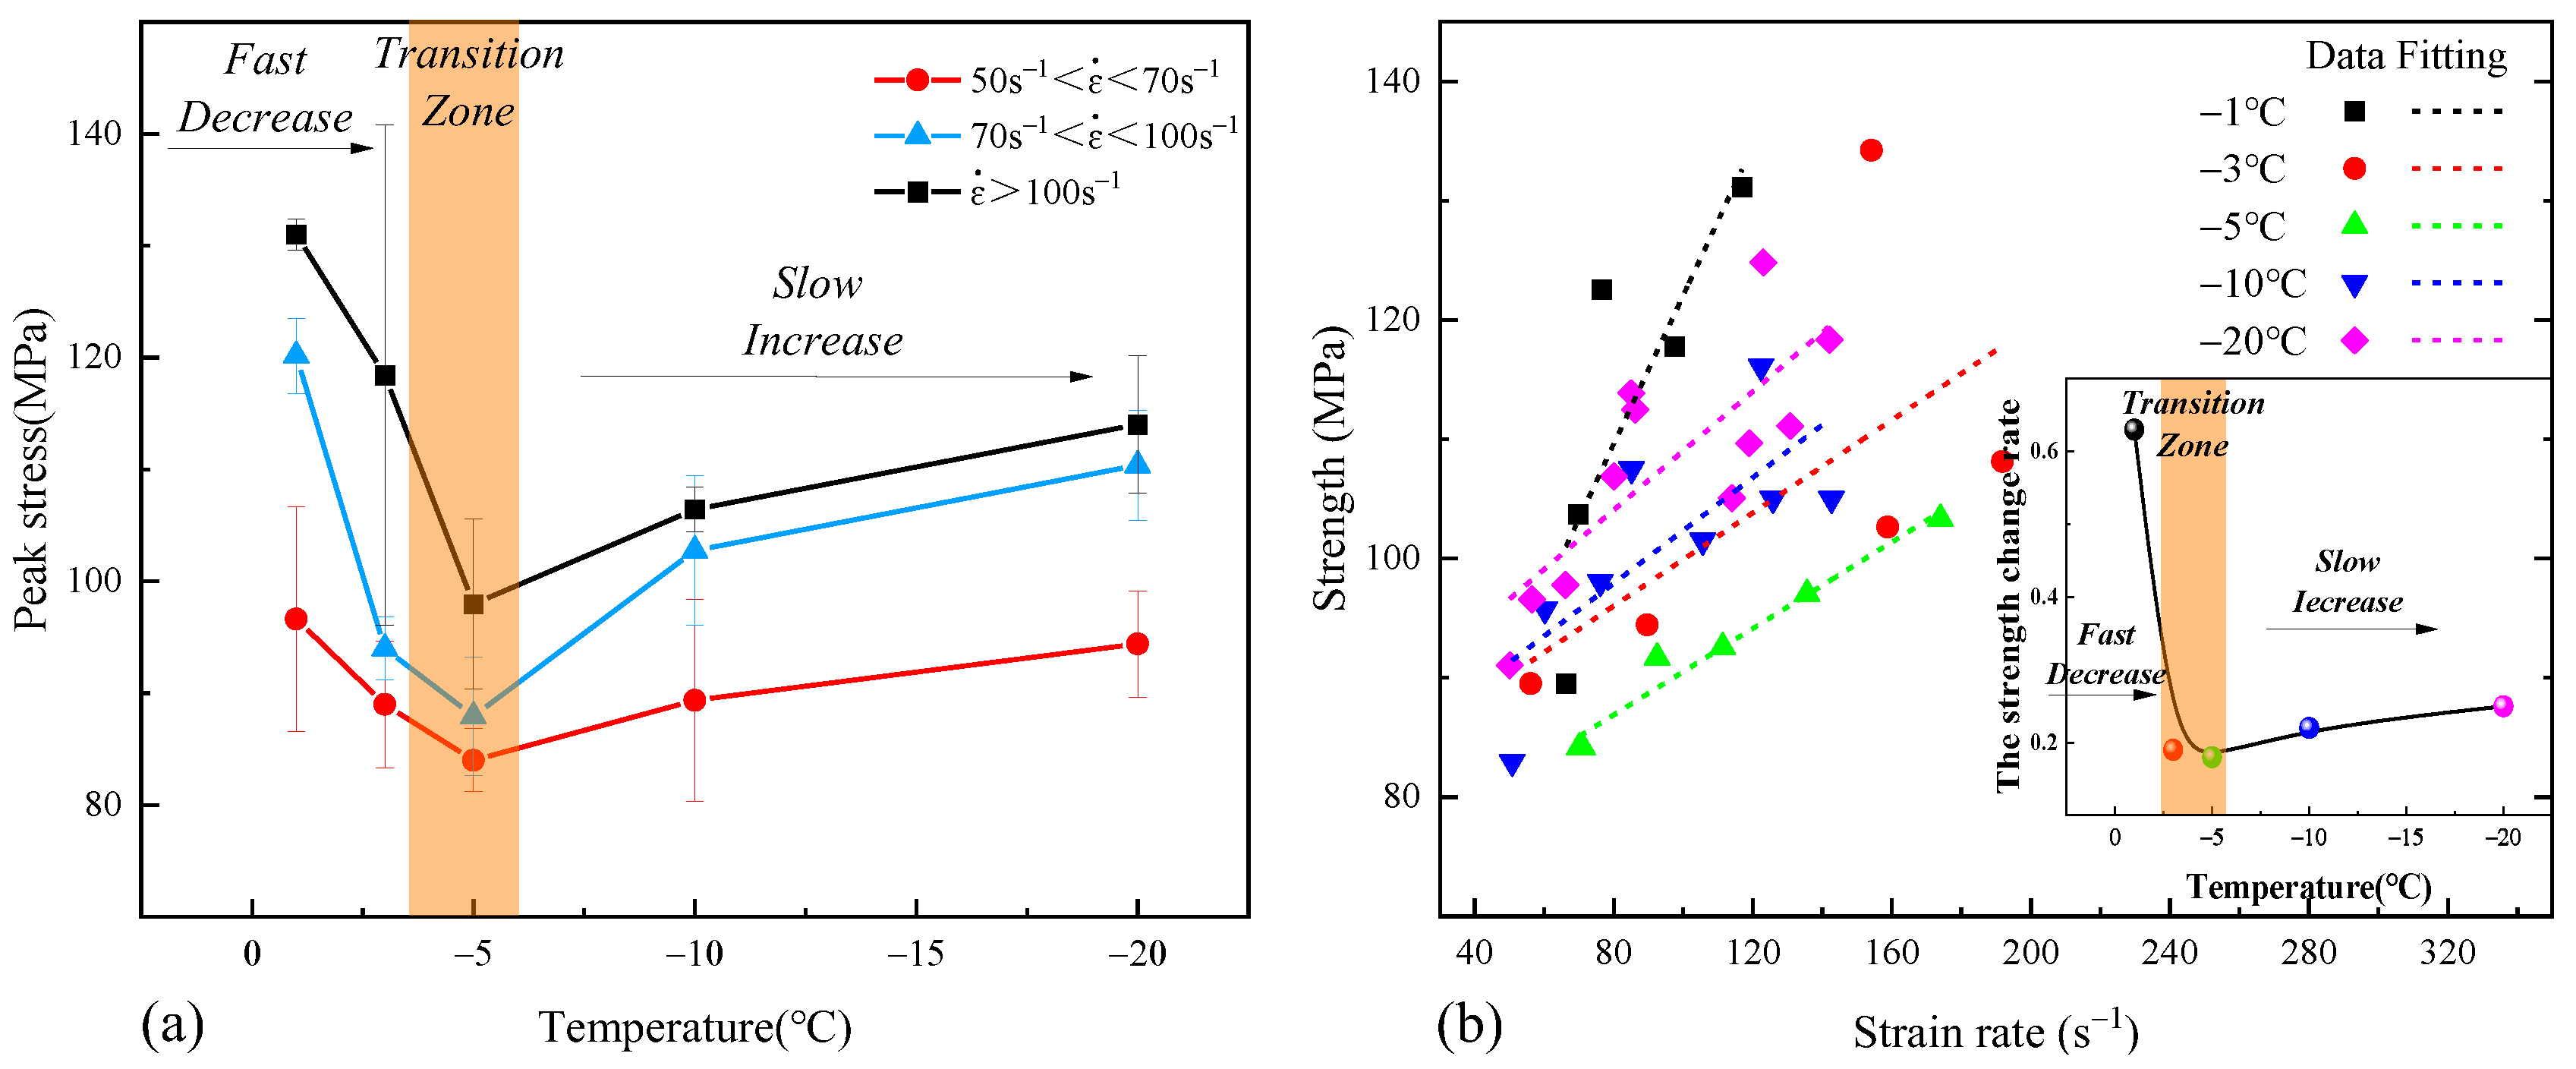
All data at each temperature are listed in Table 2 and the variation curves of strength with temperature of the three strain rate ranges are plotted in Figure 8a. It is noteworthy that the temperature effect had a significant effect on the compressive strength from quasi-static loading to high strain rate loading. The dynamic peak strength of water-saturated frozen sandstone decreased from −1 °C to −5 °C and increased from −5 °C to −20 °C under the same strain rate range. In addition, the relations between dynamic peak strength and strain rate at different temperatures are plotted in Figure 8b. Table 3 shows the fitting equations and the relationship between slope and temperatures is plotted in Figure 8b. It could be seen that −5 °C could be taken as the “transition zone”. The strength changed with strain rate more significantly from −1 °C to −5 °C and the change decreased from −5 to −20 °C. The microstructural effects of materials with high porosity were more pronounced and thus more sensitive to strain rate [20,21]. In the intensive phase transition stage of −1~−5 °C, the development of pore ice filled the pore space and reduced the porosity of sandstone, which resulted in the decreasing strength change rate. In the stable phase transition stage of −5~−20 °C, the increasing pore ice led to the generation of cracks and increasing rock porosity, thus resulting in the increasing strength change rate.
3.2.2. Failure Pattern
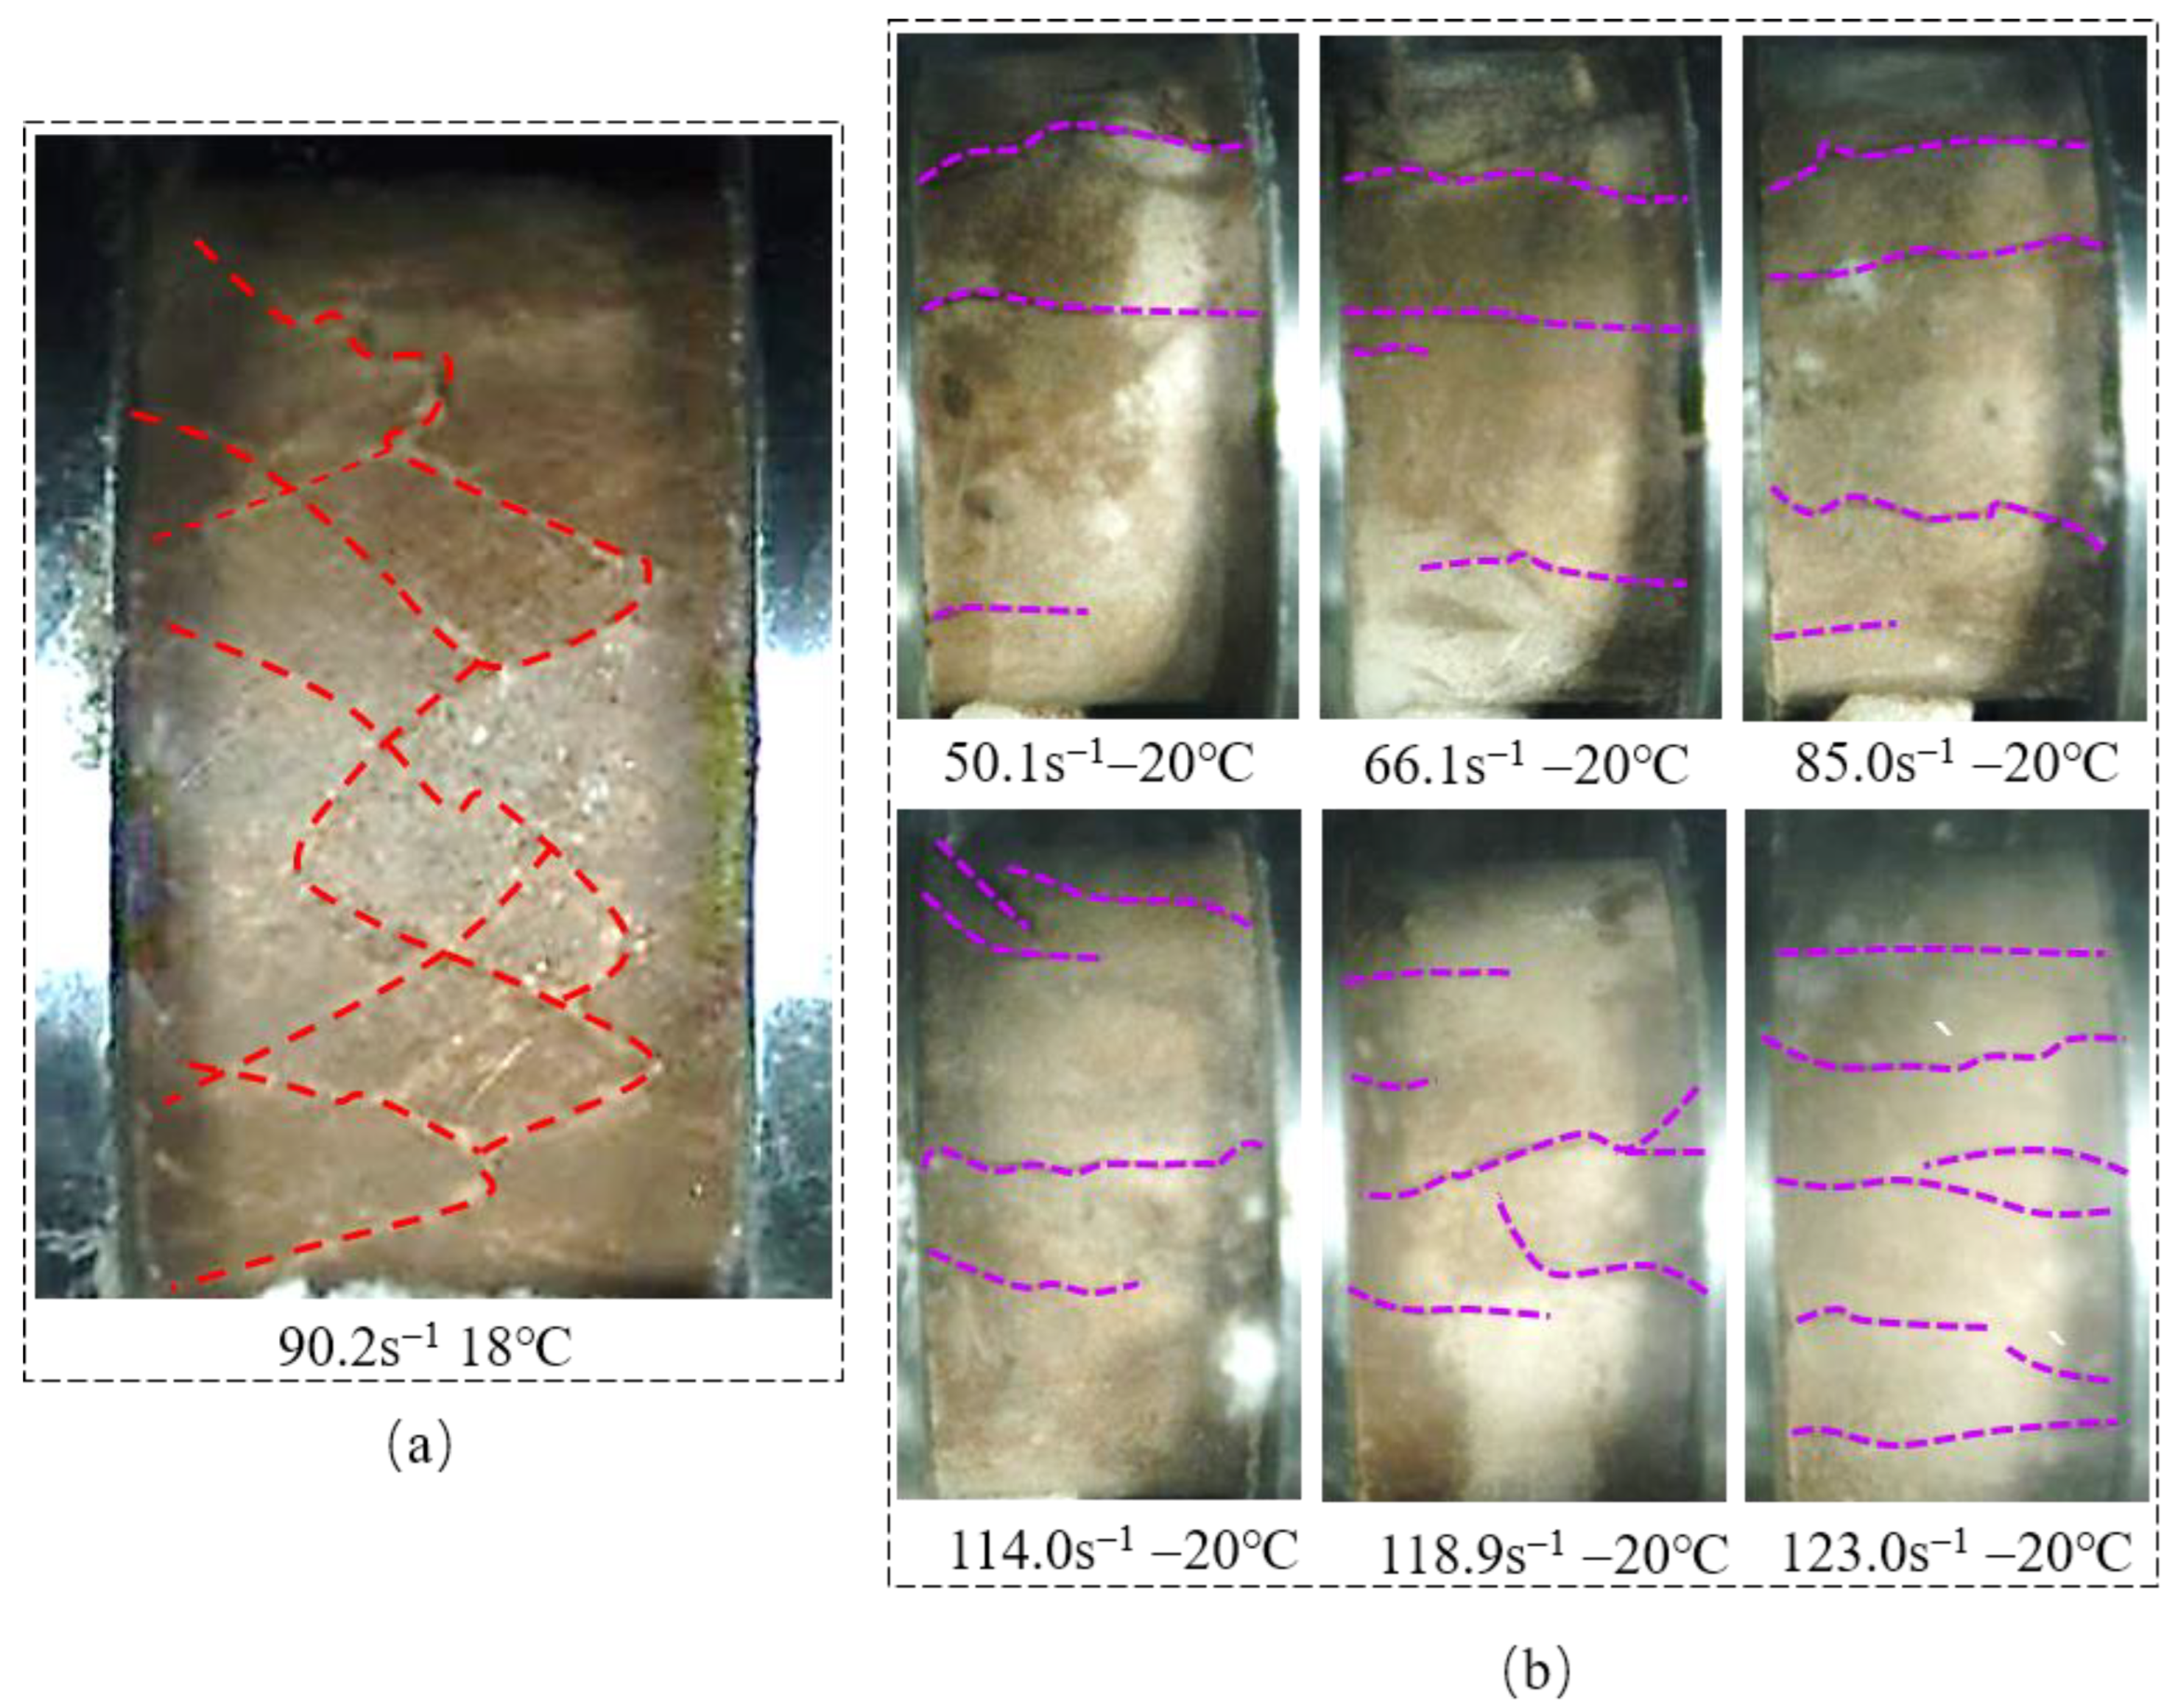
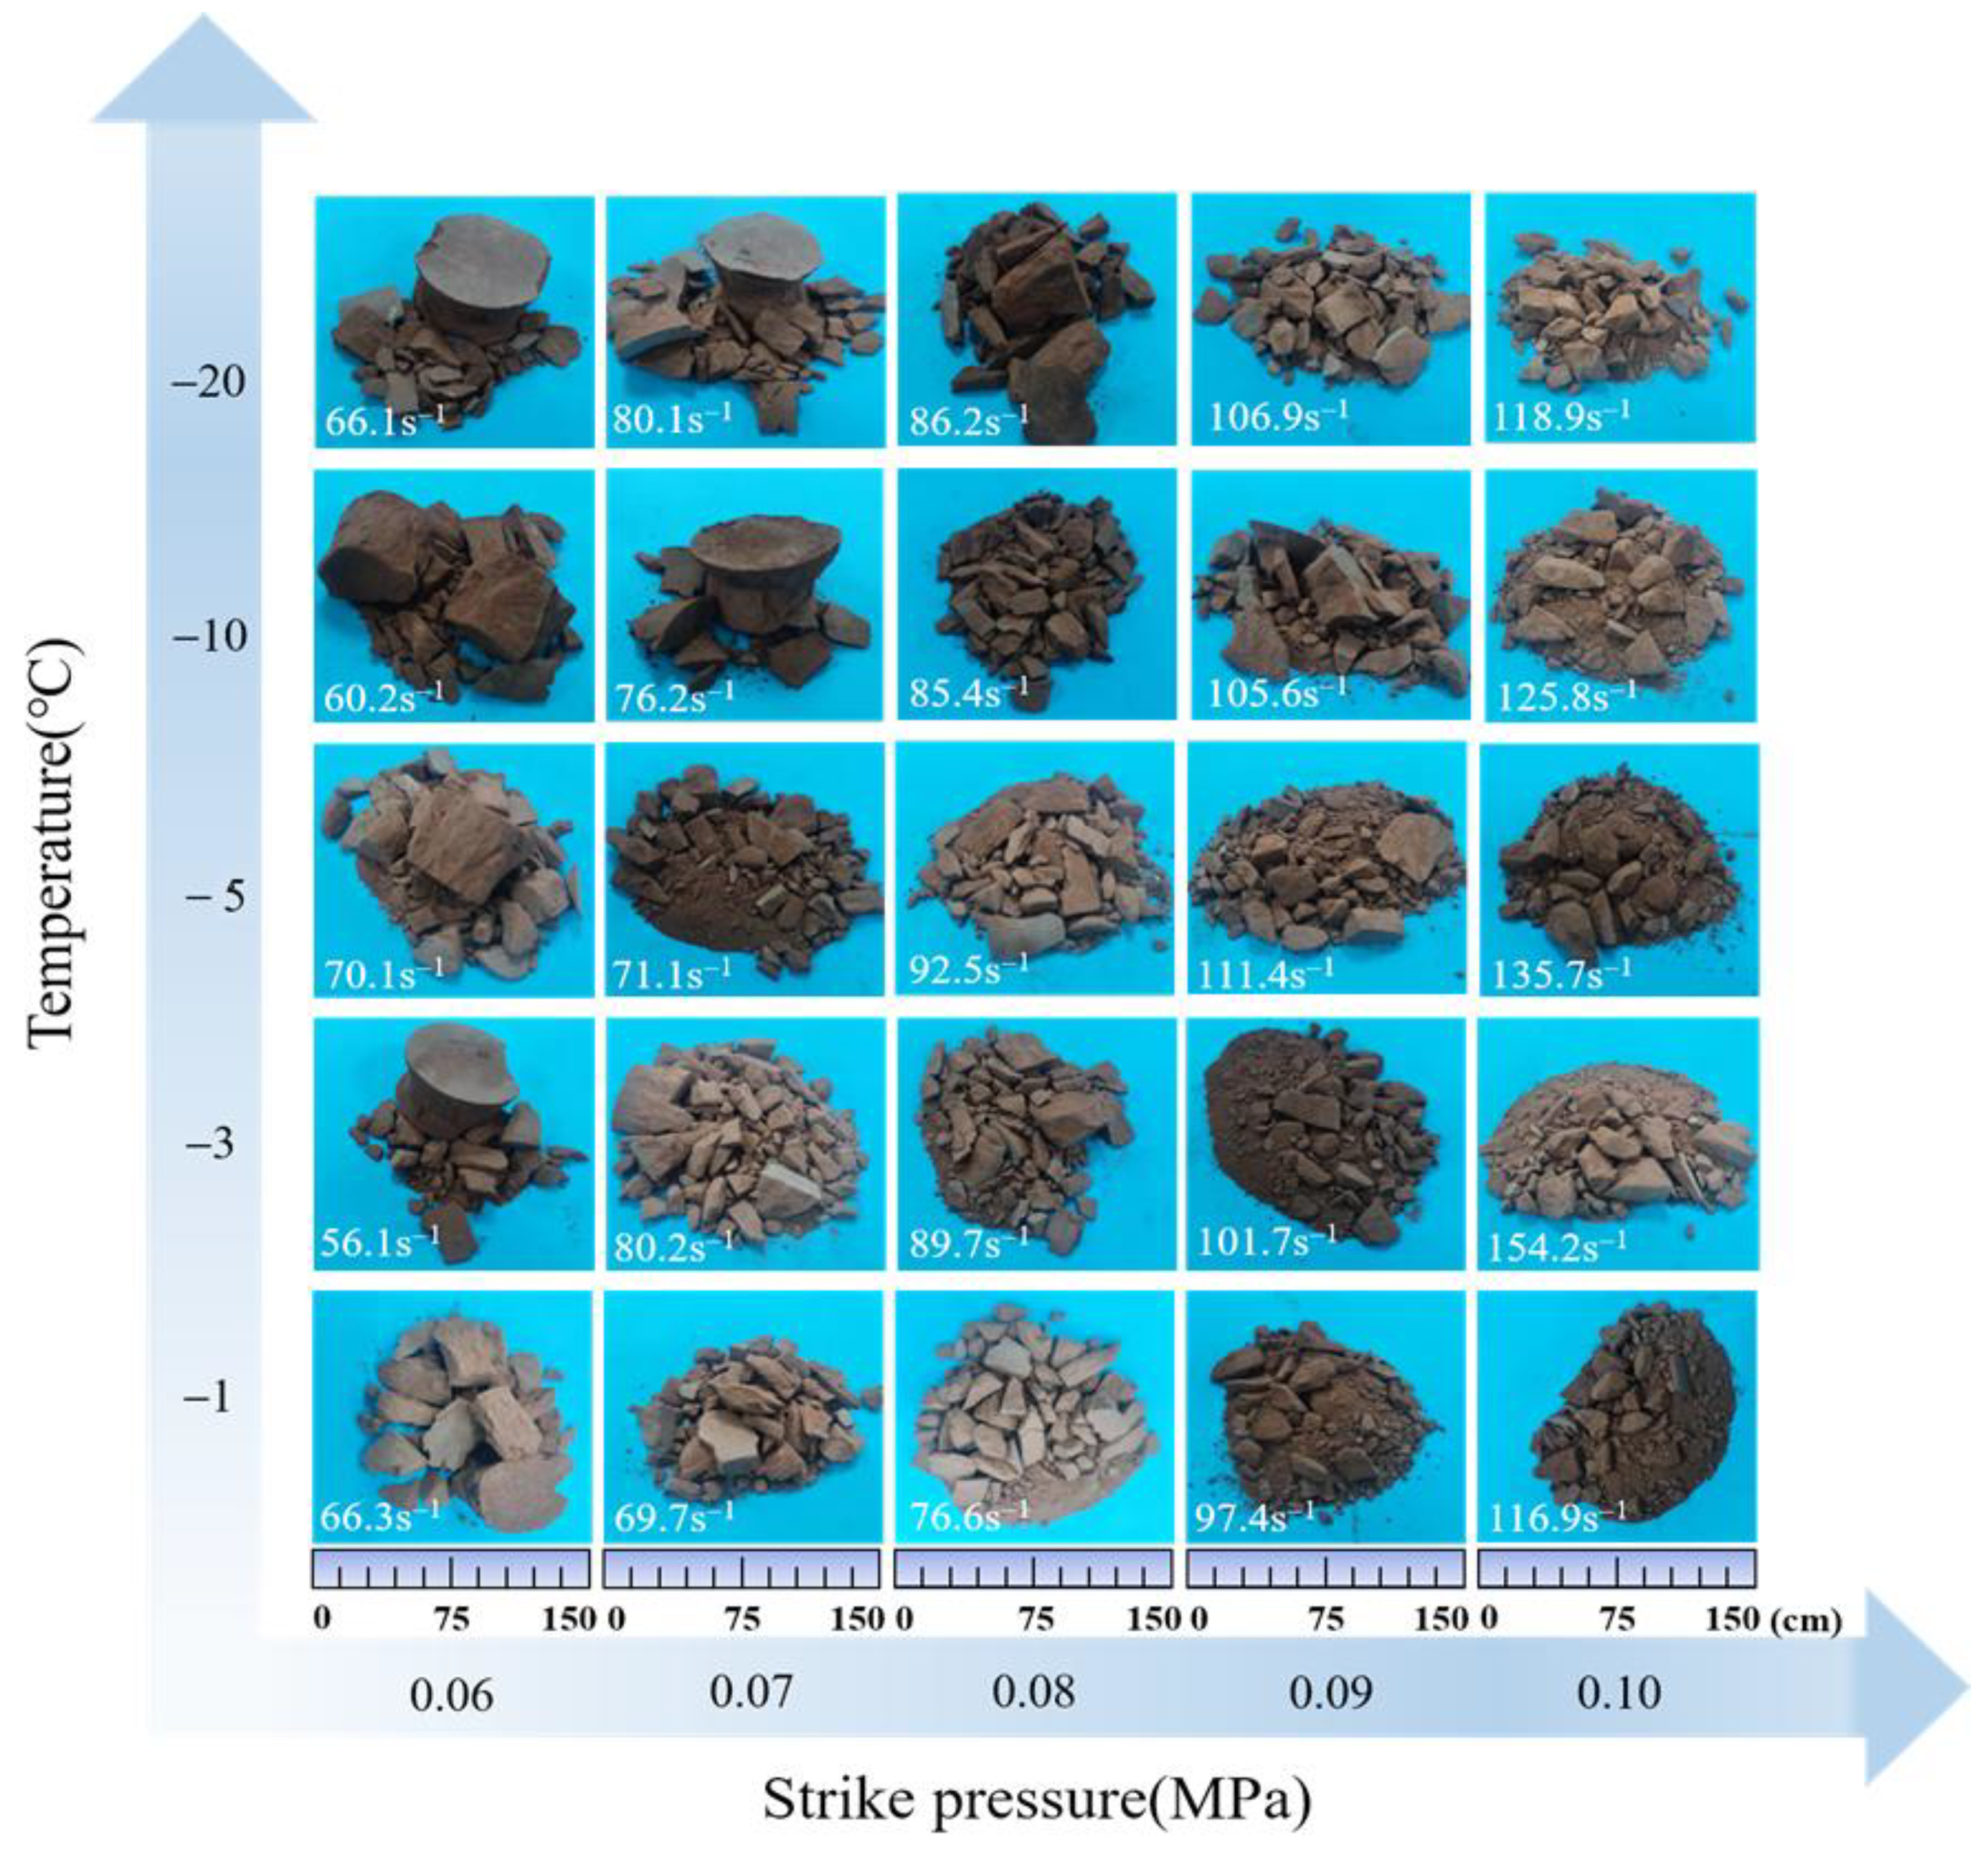
Under impact load, a high-speed camera was used to monitor the crack propagations. Figure 9 shows the crack propagations at −20 °C under different strain rates at the same moment from the beginning of impact. It could be seen that the number of cracks increased significantly with the increasing strain rate. Besides this, the crack propagations at room temperature were crossing cracks, while they were penetrating cracks at subzero temperature, which was similar to the failure patterns under different strain rate in [17]. As pointed out by Zhou et al. [22], it was caused by the interaction of internal micro-defects under impact loading. Owing to the influence of the water-ice phase transition and low-temperature shrinkage of mineral particles, the frozen sandstone at a subzero temperature generated longitudinal penetrating cracks. The coupling effects of strain rate and temperature on the dynamic failure patterns of frozen water-saturated sandstone are shown in Figure 10. It can be seen that the failure patterns of samples were significantly associated with strain rate and temperature, which were tensile failure of annular spalling at a low strain rate and shear failure at a high strain rate with producing particles and powder. According to the failure patterns under different temperatures, the powdery broken particles increased with the decreasing temperature of −1 °C~−5 °C, while large-sized fragments increased with the decreasing temperature of −5 °C~−20 °C. This phenomenon was more pronounced at low strain rates. Under static or quasi-static loading conditions, there was enough time for the internal micro-cracks to close and the crack development to be inhabited by a lower subzero temperature. Nevertheless, the phenomenon did not exist when the samples were tested under a high strain rate. The impact load acted upon the cement of particle-water-ice, causing local cracks, and then affected the dynamic strength of samples [23,24,25]. A large number of micro-cracks would be rapidly produced, affecting the failure of rock integrity. Although the strength of the rock was weakened at the temperature range of −5 °C~−20 °C, the pore ice filled the micro-cracks with the production of more large-sized fragments.
3.2.3. Energy Evolution Law
An energy evolution study is a feasible way to explain the dynamic failure mechanism of frozen rock. The stress wave generated by the strike bar transformed into strain energy, kinetic energy, and dissipated energy, while the specimens absorbed the strain energy to cause deformation. The energy carried by the stress wave could be calculated by the following formula:
where , , , and are incident energy, reflected energy, transmitted energy, and absorbed energy, respectively; , , and are the section area, elastic modulus, and wave velocity of the pressure bar, respectively.
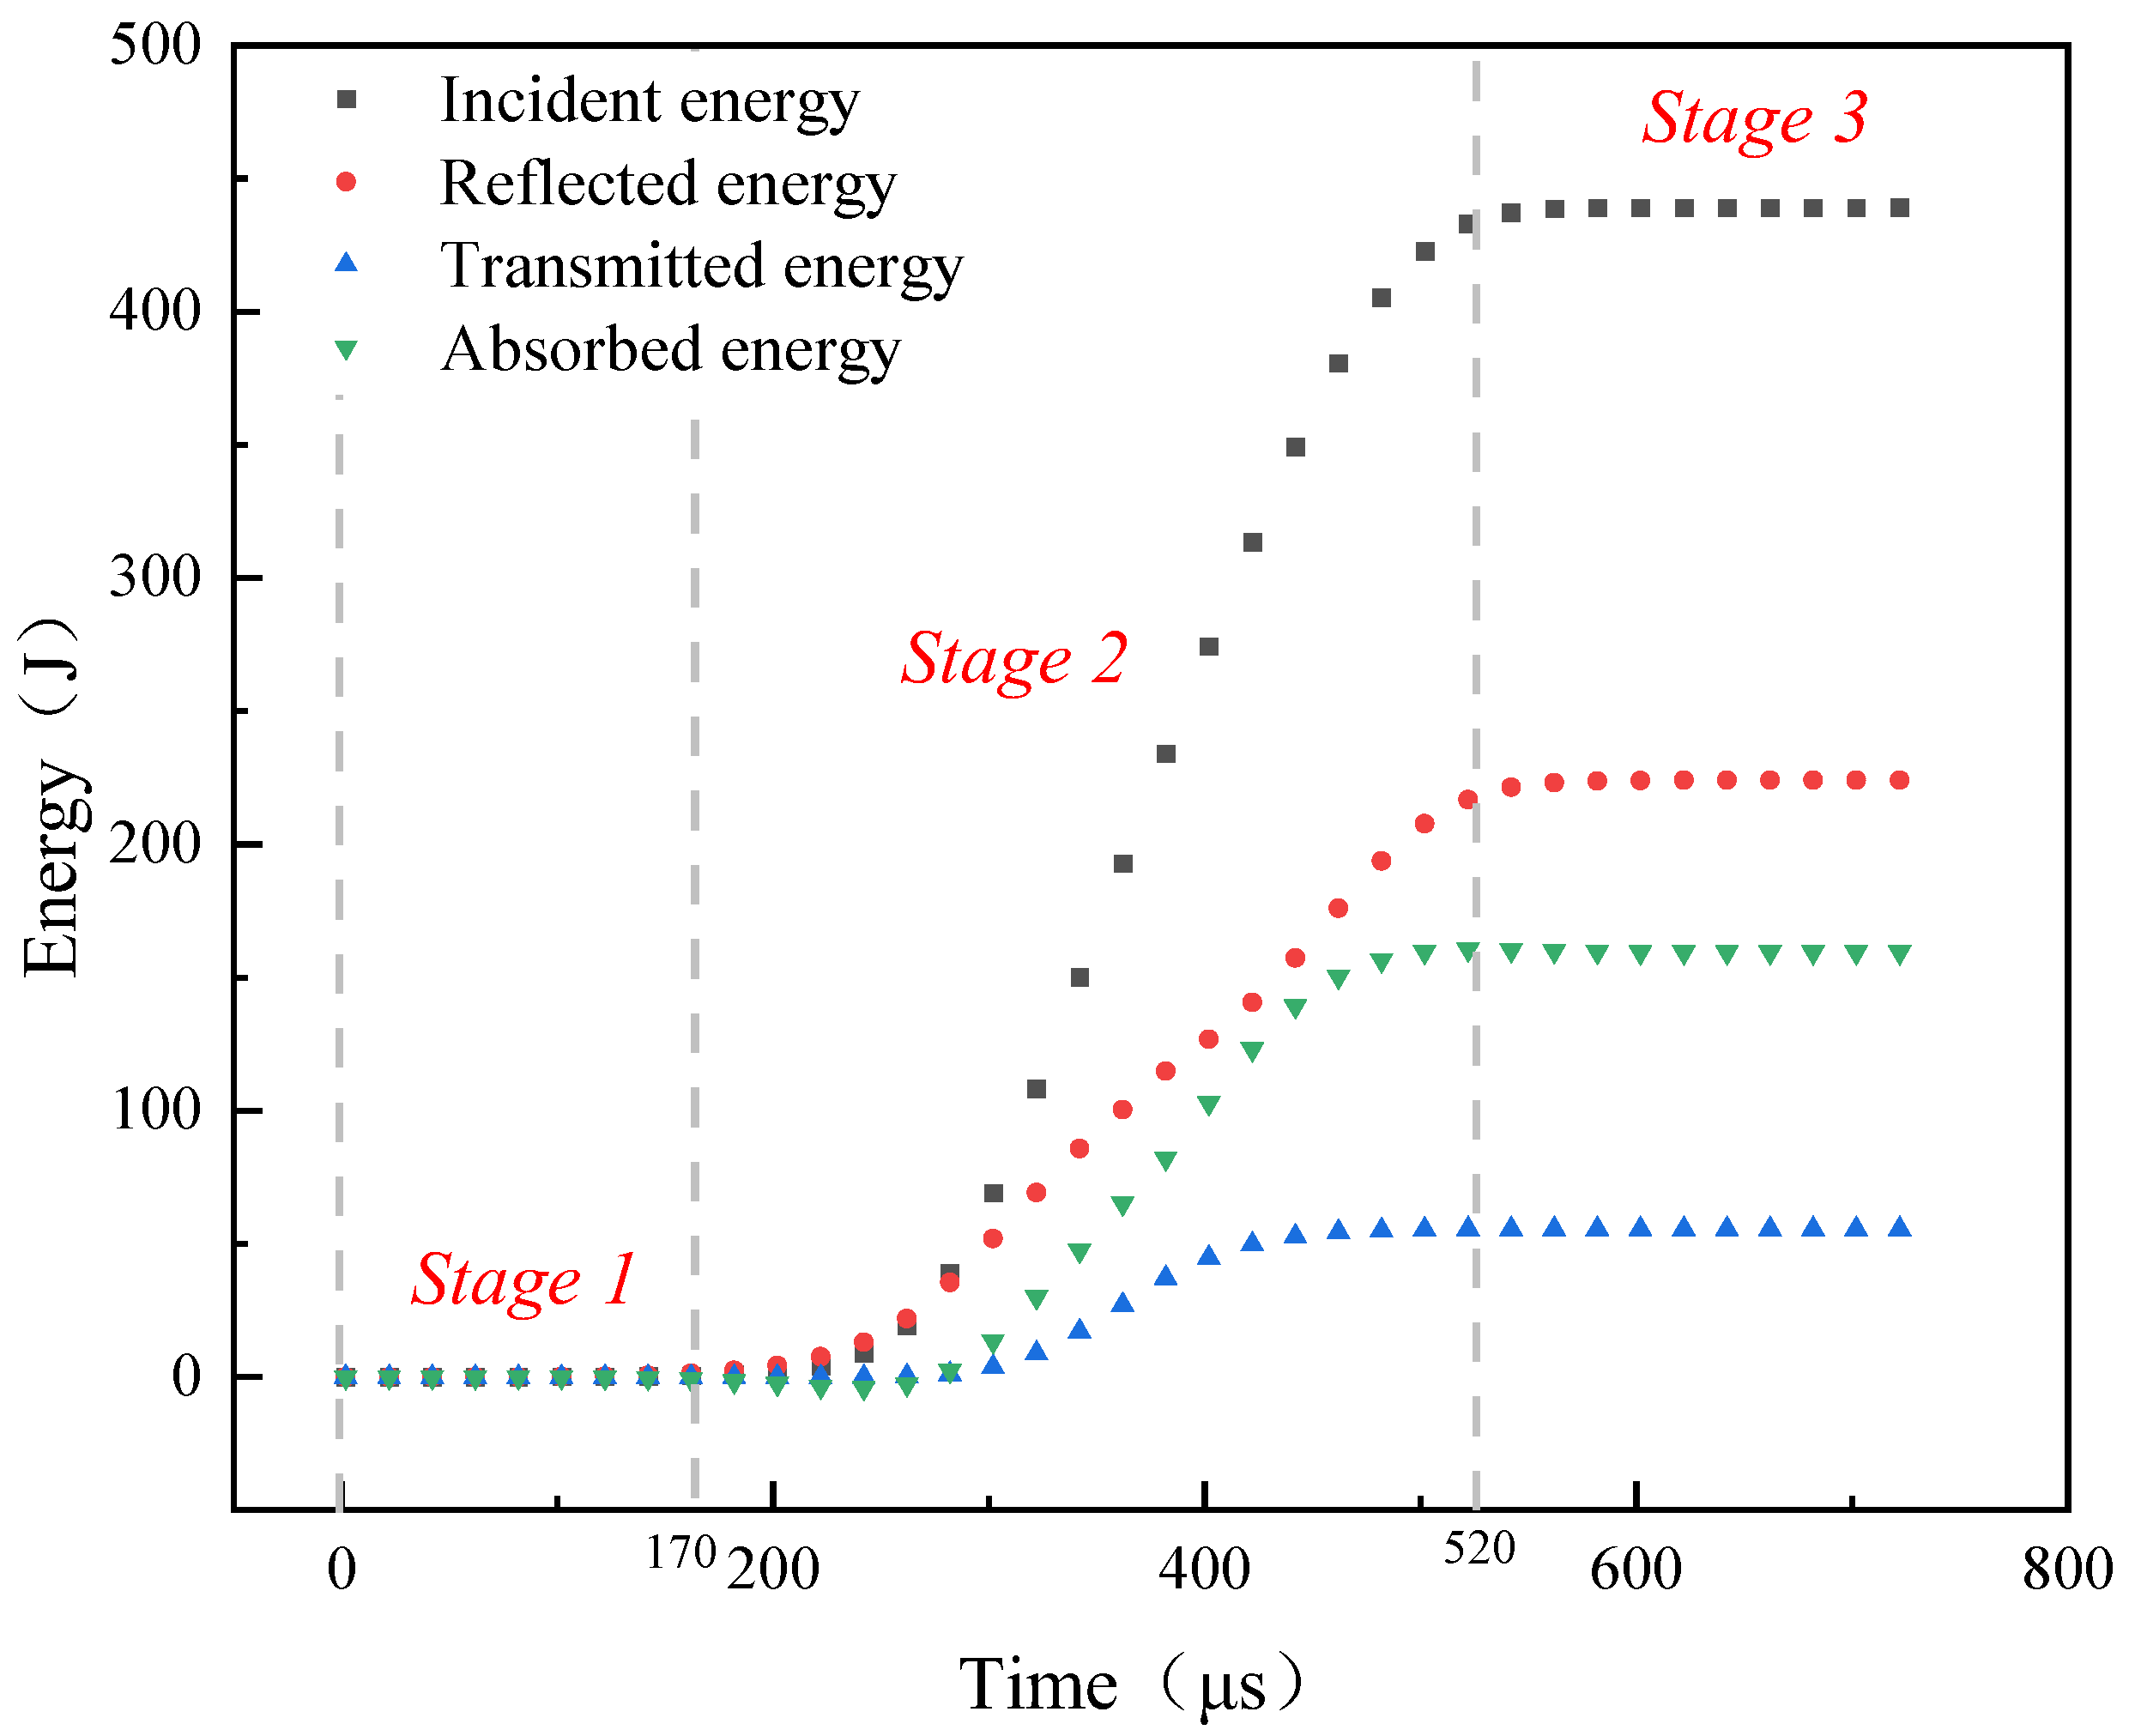
The energy evolution of the bar system is shown in Figure 11, which could be divided into three stages: (1) the initial stage (0 µs~170 µs): there was no transfer in energy at this stage; (2) the energy rising stage (170 µs~520 µs): each type of energy increased gradually with the increasing incident energy and the growth rate of reflected energy, and dissipated energy was greater than that of the transmitted energy; and (3) the energy stable stage (520 µs~800 µs): each type of energy tended to be in a horizontal line after all strain energies were released.
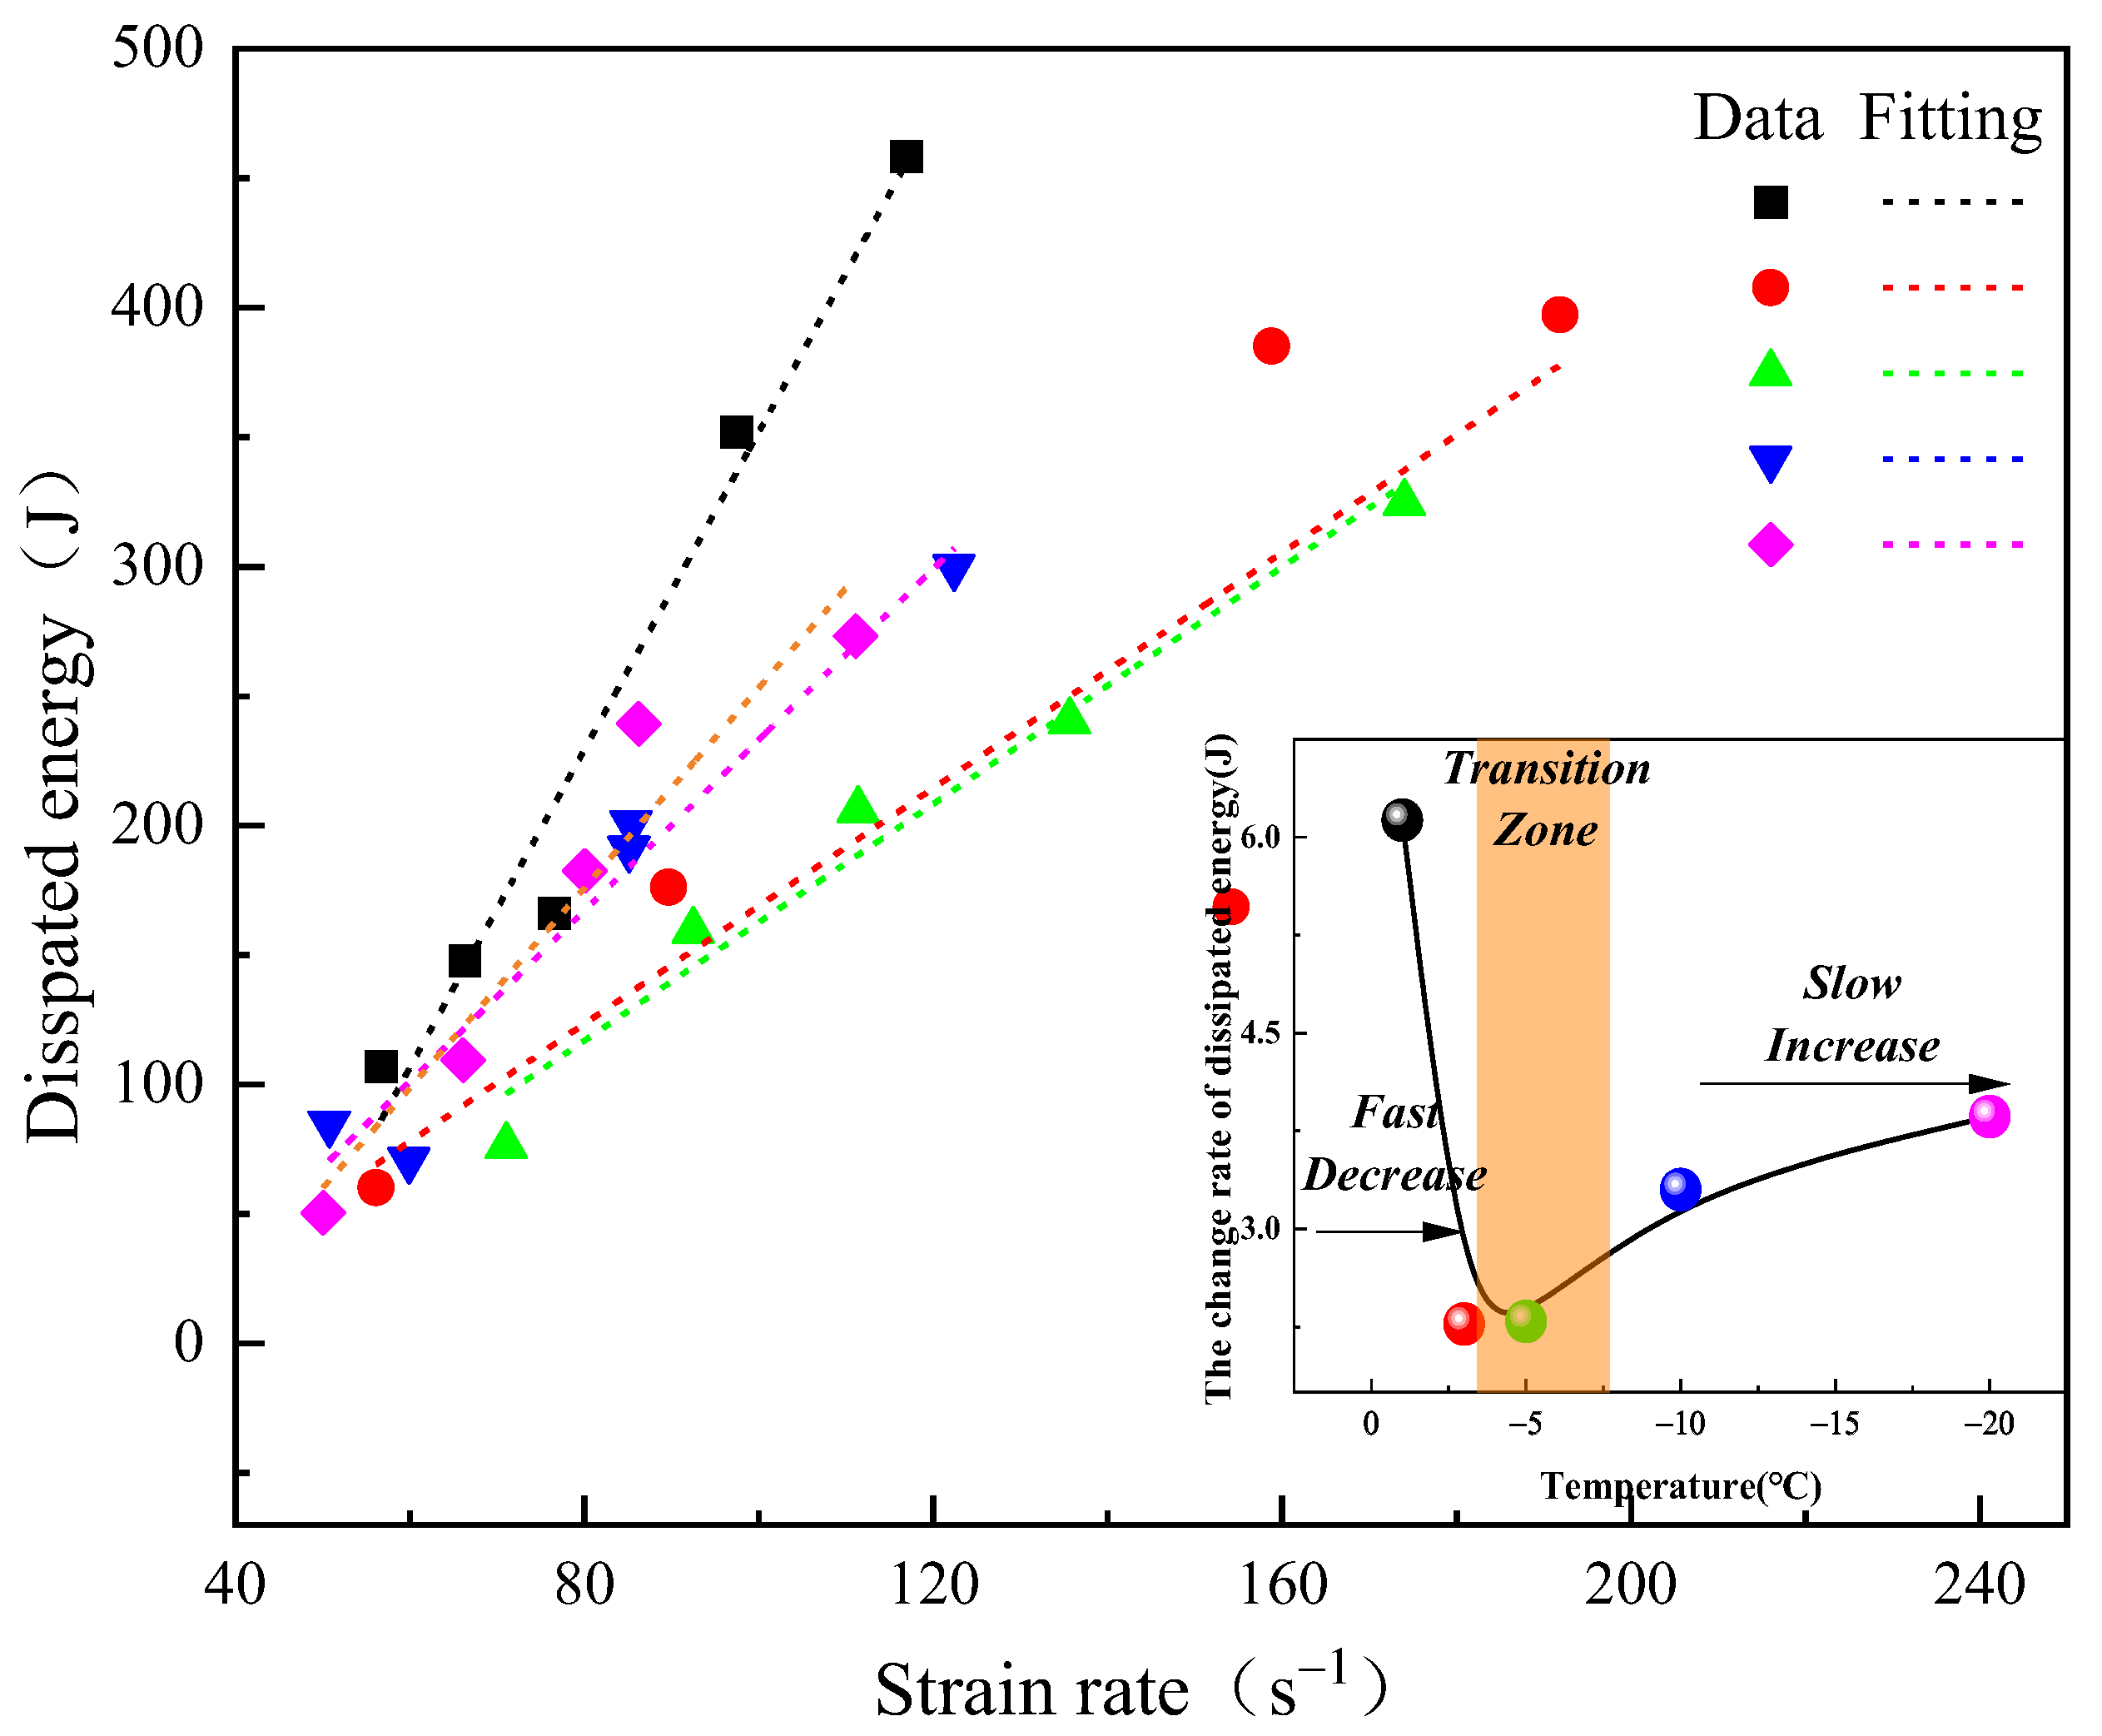
Absorbed energy was used for the fracture generation and extension [26]. Because of the short duration time under impact load, the water-ice phase transition caused by heat energy generated by impact load could be ignored. Owing to the small proportion of kinetic energy and other forms of energy (heat energy, luminous energy, and so on), it was reasonable to assume that the dissipated energy was the absorbed energy [27]. The relationships of strain rate and dissipated energy at different temperatures are plotted in Figure 12 and the equation of fitting curves were listed in Table 4, the fitting dispersion of −3 °C frozen sandstone is larger. However, it also had an obvious strain rate effect at other temperatures. Meanwhile, on the basis of the slope of the fitting equations, the growth rate of dissipated energy decreased significantly with the decreasing temperature of −1 °C~−5 °C and increased with the decreasing temperature of −5 °C~−20 °C. Owing to the lower content of pore water at −1 °C~−5 °C, the specimen absorbed less energy from the impact load. Therefore, the dissipated energy decreased in this freezing stage. The content of pore ice increased in the temperature range of −5 °C~−20 °C. As a result of the interaction of ice–rock, the increasing cementation of mineral particles by the low-temperature hardening effect and the new cracks caused by frost-heave force had little impact on the cementation of rock particles. Therefore, the dissipated energy increased with the decreasing temperature of −5 °C~−20 °C.
3.3. Water-Ice Phase Transition Mechanism of Frozen Saturated Sandstone
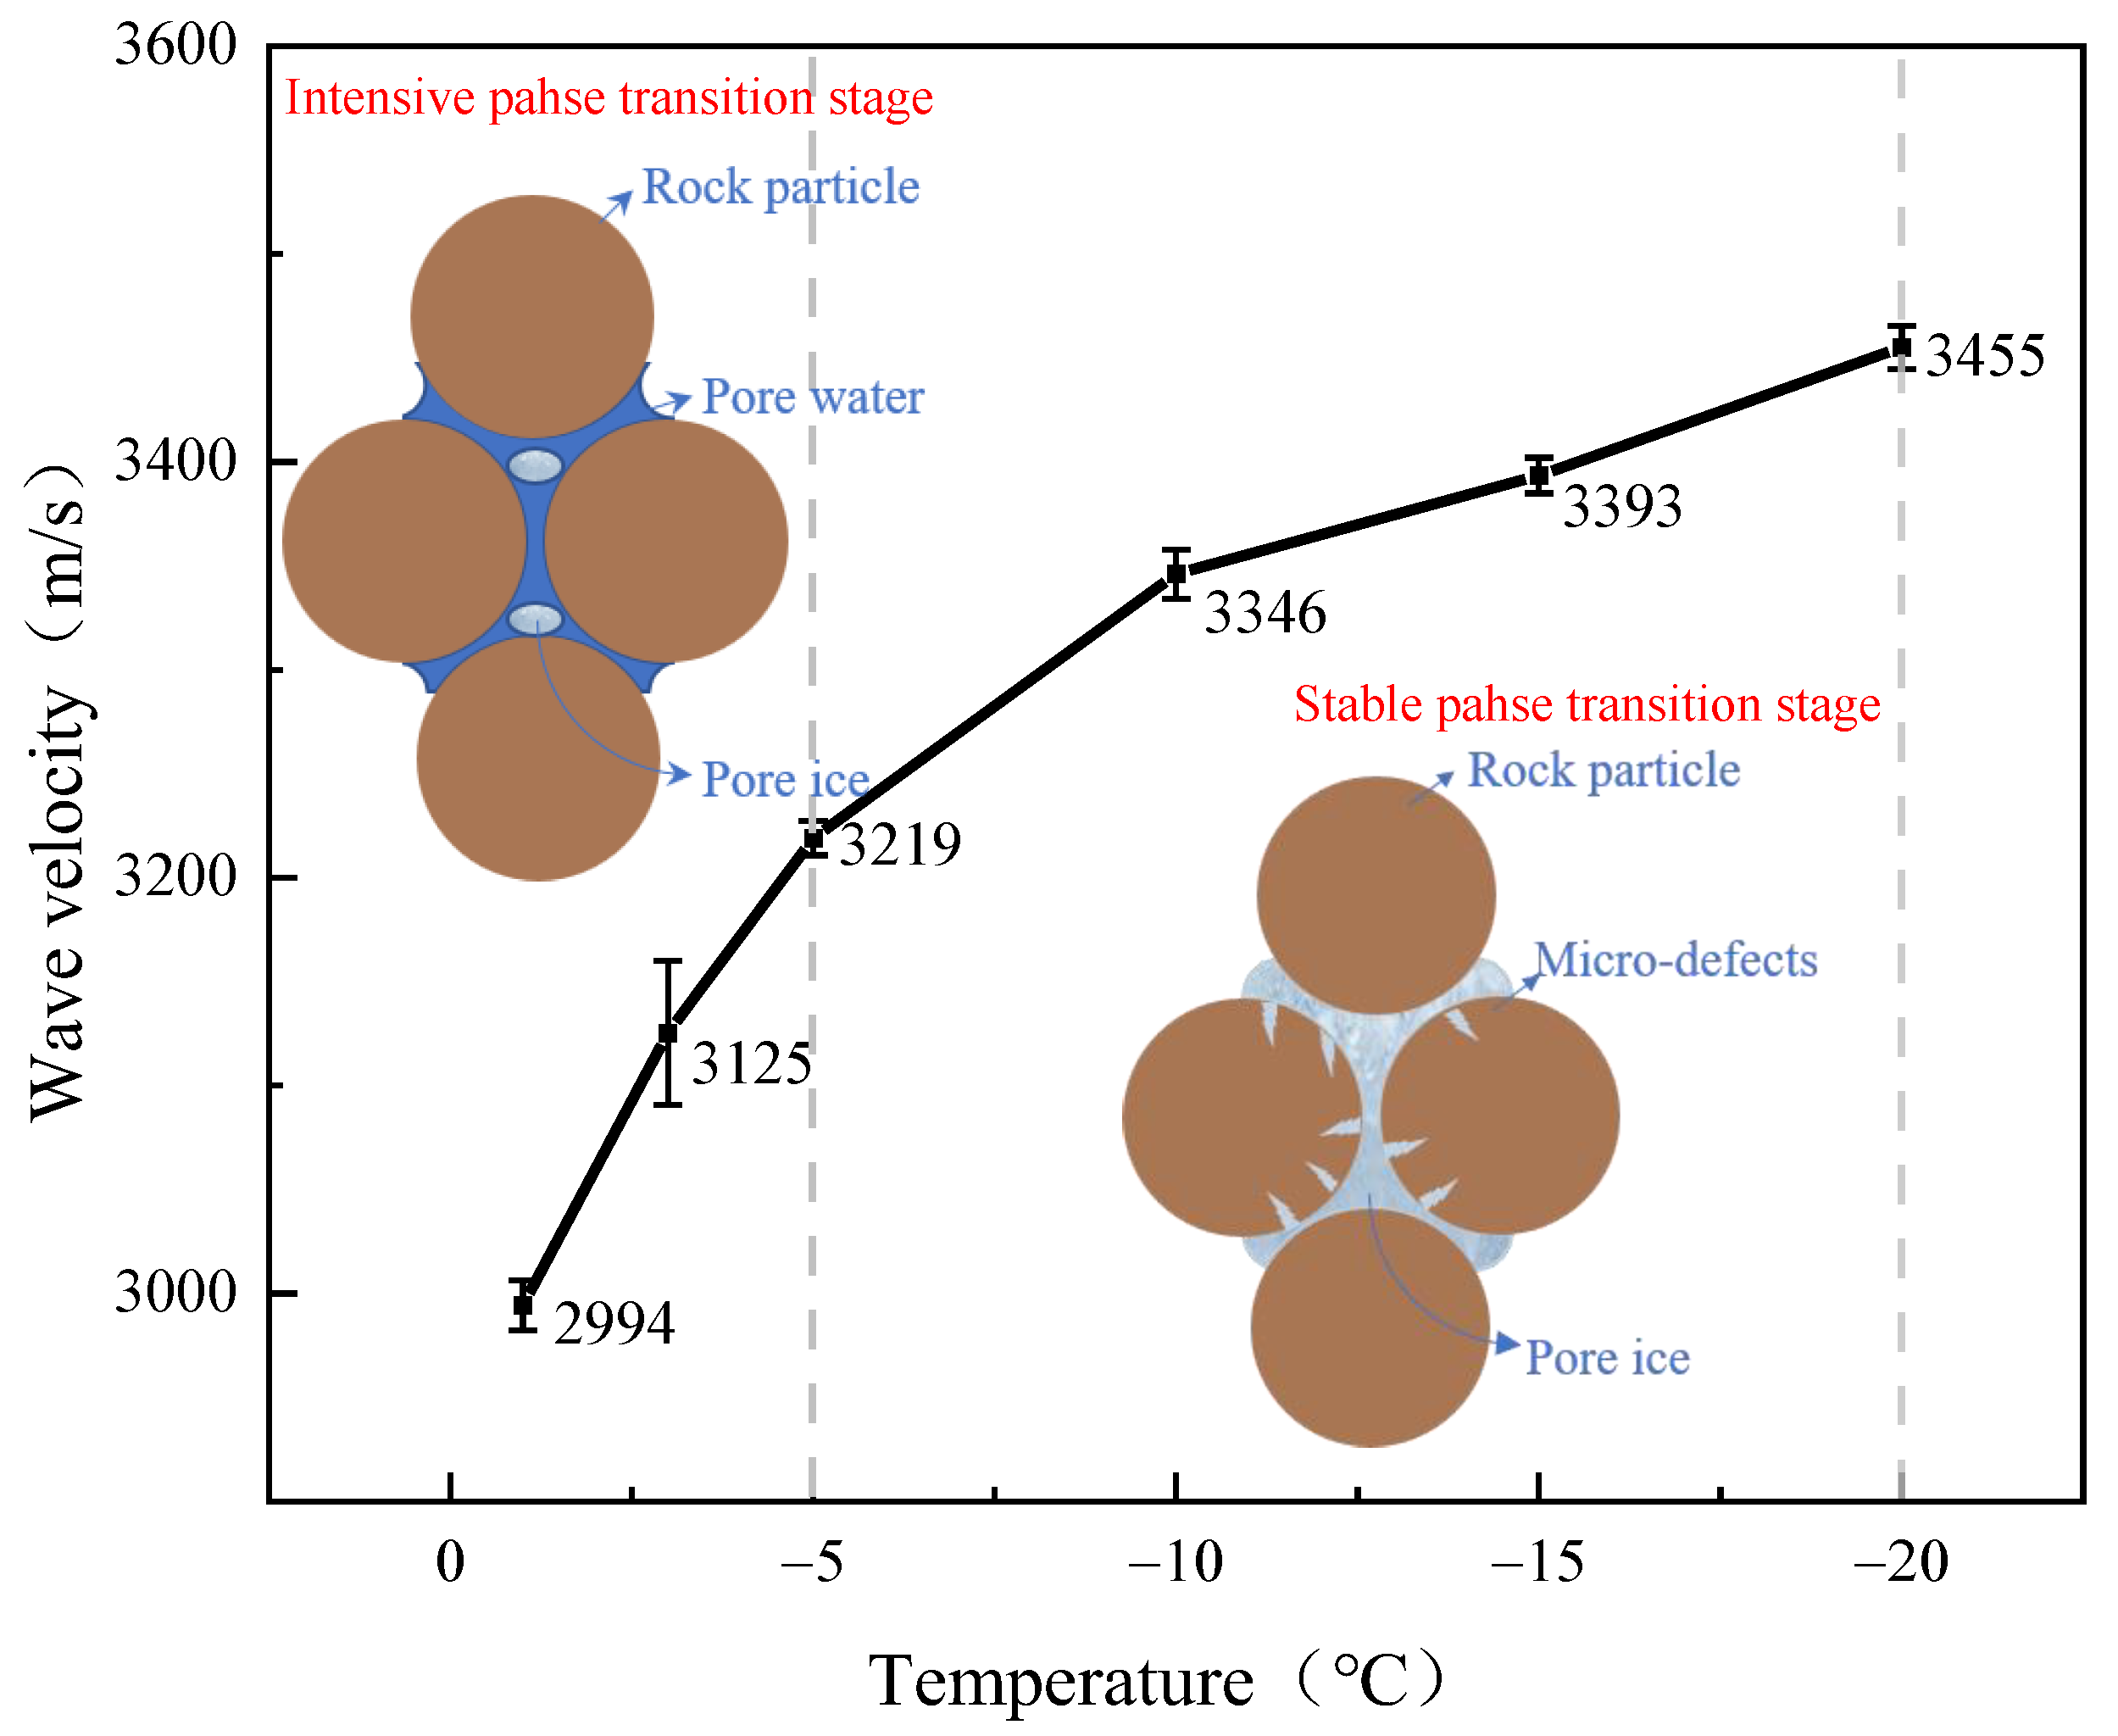
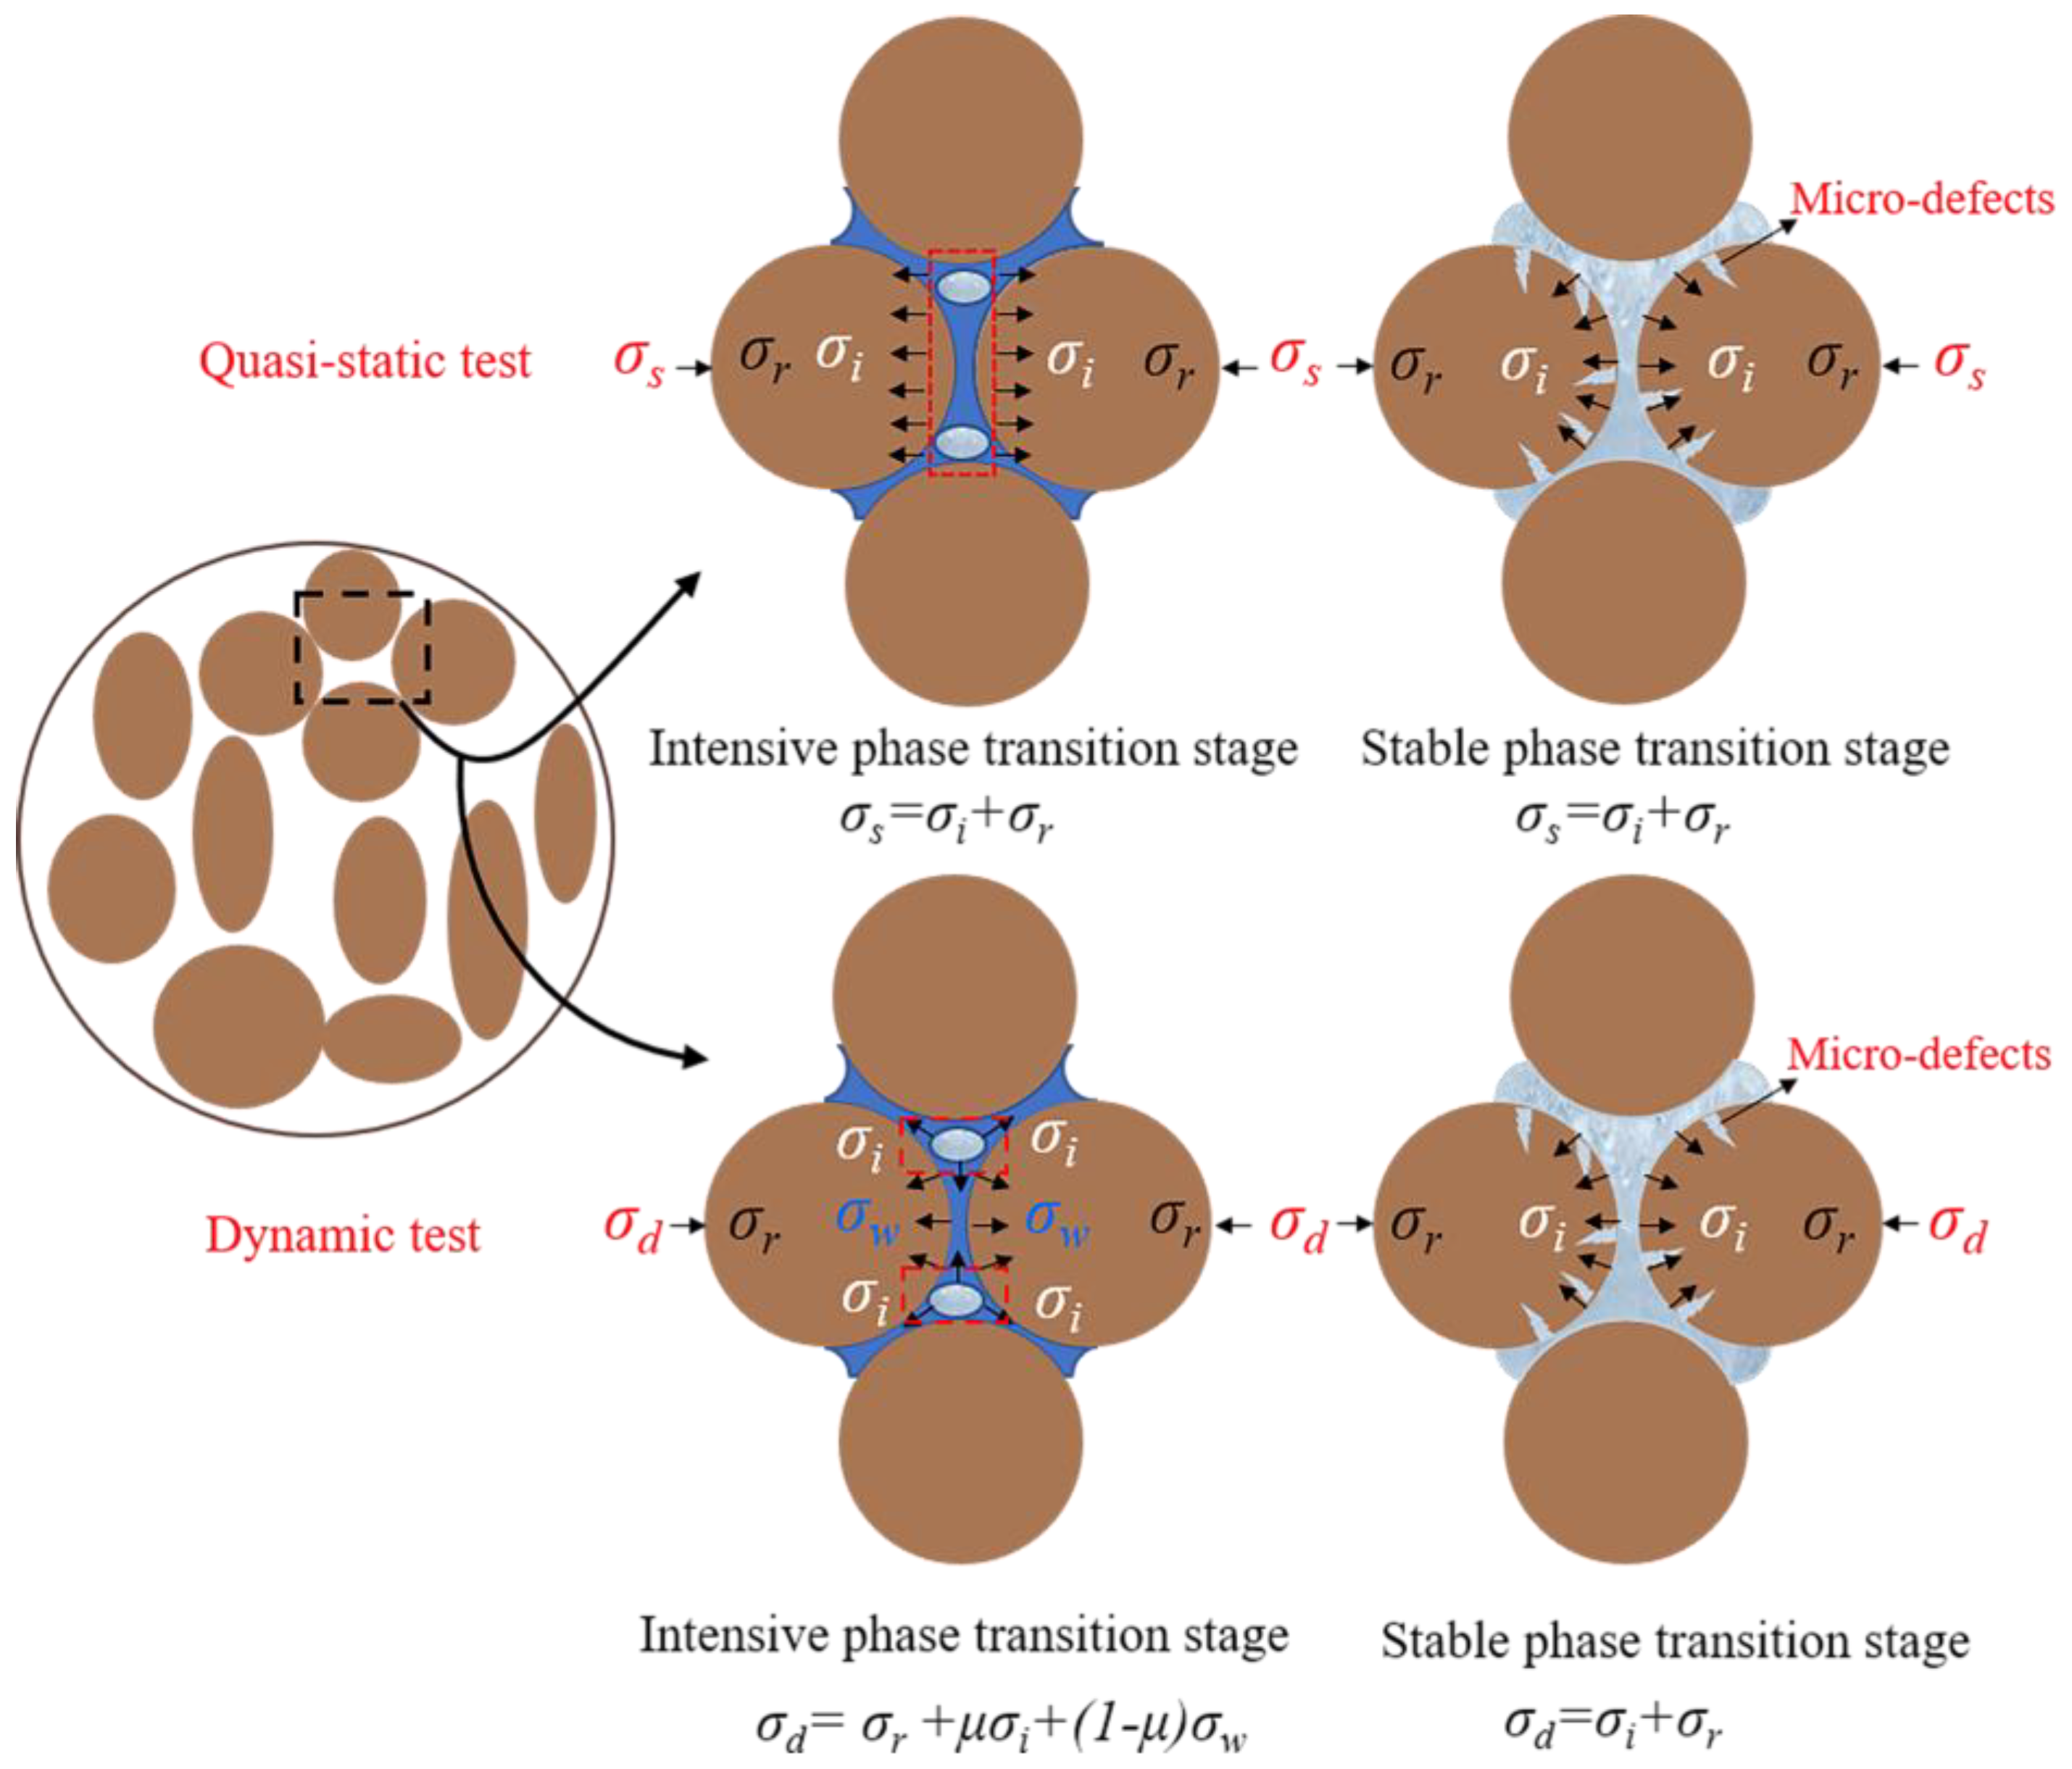
Many scholars have drawn consistent conclusions on the formation process of pore ice [28,29]. The higher external loads could be sustained by the mineral particles with the increasing pore ice pressure under subzero temperatures. When the pore ice pressure was greater than the sum of external load and tensile strength, the mineral particles separated and formed ice cores, thus the binding force caused by the external load was borne by the ice particles alone [7,28]. Despite that there were great diversities in different materials, the variation law of internal pore ice with temperature was consistent. Furthermore, as seen, the slope of frozen rock wave velocity changed with temperature in Figure 13. It could be seen that the wave velocity increased fastest at −1 °C~−5 °C and the growth rate became slow at −5 °C~−20 °C. As shown in Figure 14, the rate of water-ice phase transition in frozen rock could be divided into two stages: (1) The intensive phase transition stage (−1 °C~−5 °C). The increasing rate of the water-ice phase transition was fast and the external load was borne by pore water pressure, pore ice pressure, and the strength of the rock matrix; (2) The stable phase transition stage (−5 °C~−20 °C). The phase transition reached a stable rate and the water-ice transformation reached an equilibrium, which was a long duration process [29]. The results were consistent with the freezing process of pore water in sandstone by Jia et al. [30]. The stress expressions under quasi-static load and dynamic load are stated as Equations (4) and (5), which were based on the aforementioned analysis and the various features of the two loading modes.
where , ,, and are the static load stress, dynamic load stress, effective stress of rock matrix, pore water pressure, and pore ice pressure; is the empire coefficient, which represents the variation coefficient of pore water pressure and pore ice pressure with temperature; and , , and are areas of ice and pore, respectively.
As aforementioned, the phase in the frozen pores bore different loads under different temperatures owing to the mechanical balancing. Under quasi-static tests, the exterior load was borne by the pore ice and the rock matrix [31,32,33]. In the temperature range of −1 °C~−5 °C, owing to the long duration of quasi-static load, the pore water was discharged from the samples as free water with the destruction of sandstone pores [34], which did not play the role of pressure-bearing. With the decreasing temperature, the pore ice pressure increased with a greater ice content, which increased the ability to bear external loads. Therefore, the peak strength increased and the pore ice improved the internal cementation of ice–rock, and the small fragments decreased with the decreasing temperature of −1 °C~−5 °C. Nevertheless, the formation of ice cores weakened the strength of the rock matrix [35], which resulted in the decreasing strength with a decreasing temperature of −5 °C~−20 °C. Owing to the increasing micro-defects by the ice cores, the small fragments increased with the decreasing temperature of −5 °C~−20 °C.
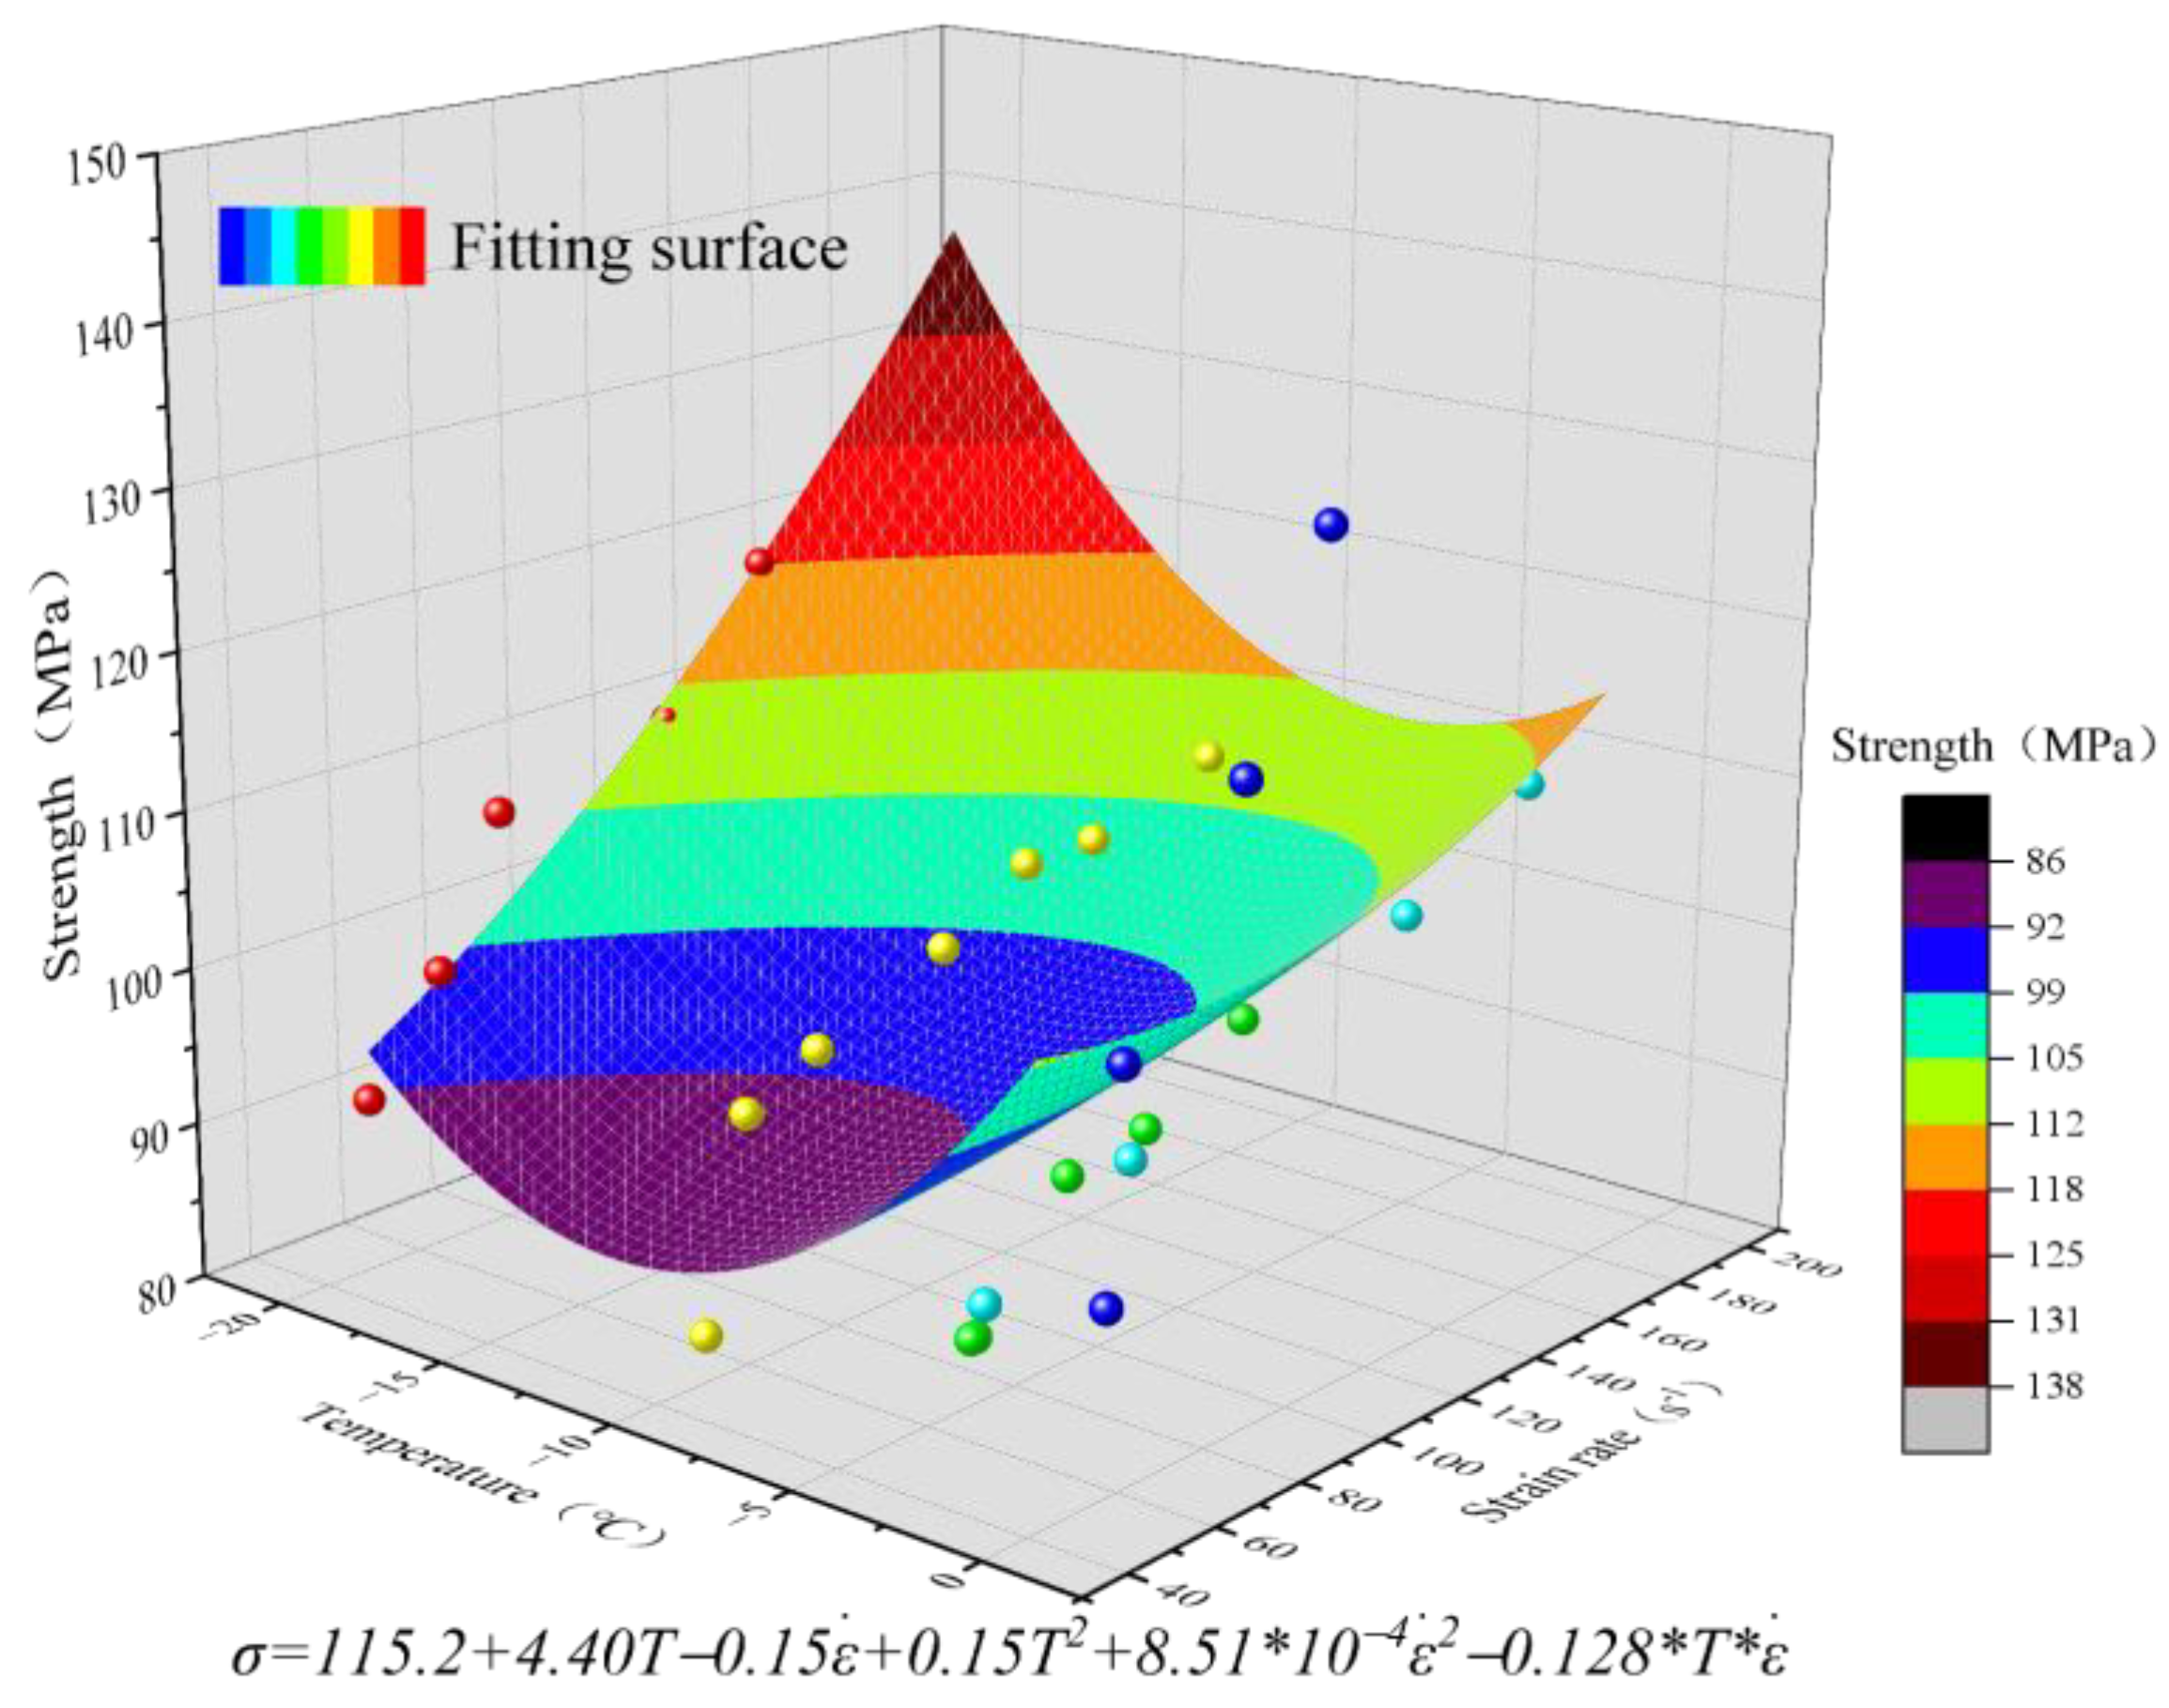
Figure 15 depicts the strength change in relation with the strain rate and temperature. Under dynamic tests, the exterior load was borne by the pore water, pore ice, and rock matrix in the temperature range of −1 °C~−5 °C, while it was borne by the pore ice and rock matrix in the temperature range of −5 °C~−20 °C. Owing to the short duration time and short action path under impact load, the damage destruction was characterized by layer propulsion [7], and the pore water could not be discharged from the samples in time as free water and played the role of pressure-bearing. Besides this, the pore water pressure decreased with the decrease in pore water content [27]. Similarly, the dynamic peak strength decreased as the pore water pressure decreased with the decreasing temperature of −1 °C~−5 °C, which increased the powdery fragments. The formation of ice cores in the temperature range of −5 °C~−20 °C would attenuate the strength of the rock matrix, while there was more pore ice at this stage and could bear higher external impact load. Besides this, the pore ice also had a temperature effect, i.e., the strength of pore ice increases under dynamic loading with the temperature decreases of −5 °C~−20 °C [36,37]. Therefore, the dynamic peak strength increased with the decreasing temperature of −5 °C~−20 °C, resulting in the increasing large fragments of failure patterns.
4. Conclusions
The dynamic mechanical properties of frozen water-saturated sandstone under different low temperatures and strain rates were experimentally investigated. The main concluding remarks are drawn as follows.
(1) The compressive strength was significantly affected by the temperature affect from quasi-static loading to high strain rate loading. The quasi-static strength of frozen saturated sandstone increased in the temperature range of −1 °C~−5 °C and then decreased in the temperature range of −5 °C~−20 °C, while the dynamic strength exhibited an opposite change law. It is evident that the stress spring-back and strain softening tend to occur in the post-peak stage of the stress-strain curve. Specifically, the stress spring-back behavior occurred in the temperature range of −1 °C~−5 °C or at low strain rates, while the strain softening behavior occurred in the temperature range of −5 °C~−20 °C or at high strain rates. The reason was that the pore water in frozen sandstone changed from the free water state to the pressure-bearing state under impact load, resulting in the stress spring-back. When the pore water content decreased from −5 °C to −20 °C, the increasing decline speed in the post-peak range reflected the characteristics of strain softening.
(2) The failure patterns of frozen sandstone were significantly associated with temperature and strain rate. The water-saturated sandstone generated penetration cracks at a subzero temperature and cross cracks at an ambient temperature. With an increase in the strain rate, more penetration cracks were produced and the frozen sandstone was severely damaged. In addition, the coupling effect of dissipated energy was analyzed for the failure pattern. A large number of micro-cracks were generated rapidly as a result of the water-ice phase transition, resulting in the increase in small-sized fragments during failure. In the temperature range of −5 °C to −20 °C, the pore ice filled the microcracks, leading to the increase in large-sized fragments. Specifically, the growth rate of dissipated energy with the strain rate decreased with the decreasing temperature of −1 °C~−5 °C and increased with the decreasing temperature of −5 °C~−20 °C. A reduction in the pore water content from −1 °C to −5 °C resulted in less energy being absorbed by the specimen, while the new cracks caused by frost-heave force from −5 °C~−20 °C increased the dissipated energy.
(3) The water-ice phase transition mechanism was introduced, which divided the freezing process into intensive and stable stages in the temperature range of −1 °C~−20 °C, with −5 °C as the transition point. In addition, owing to the divergence of loading duration time, pore water played a pressure-bearing role under dynamic loading conditions, while it was discharged from open pores under quasi-static loading. Different pressure-bearing mechanisms with multiphases of rock matrix, pore water, and pore ice resulted in the distinct mechanical properties of water-saturated rocks.
Author Contributions
Conceptualization, L.M. and Y.T.; methodology, Y.T.; software, Z.Y.; validation, Z.Y., Z.L. and H.L.; formal analysis, Z.Y.; investigation, Z.Y.; resources, L.Y.; data curation, Z.Y.; writing—original draft preparation, Z.Y.; writing—review and editing, Z.Y.; visualization, Z.Y.; supervision, Z.L.; project administration, Z.Y.; funding acquisition, L.M. All authors have read and agreed to the published version of the manuscript.
Funding
The work was supported by the Jiangsu Province Natural Science Foundation (Grant No. BK20211229) and the Chinese National Natural Science Foundation (Grant No. 52008391).
Data Availability Statement
Data available in a publicly accessible repository.
Acknowledgments
The work was supported by the Jiangsu Province Natural Science Foundation (Grant No. BK20211229) and the Chinese National Natural Science Foundation (Grant No. 52008391), which are greatly appreciated by the authors.
Conflicts of Interest
The authors declare no conflict of interest.
References
- Bai, Y.; Shan, R.; Ju, Y.; Wu, Y.; Sun, P.; Wang, Z. Study on the mechanical properties and damage constitutive model of frozen weakly cemented red sandstone. Cold Reg. Sci. Technol. 2020, 171, 102980. [Google Scholar] [CrossRef]
- Xi, G.M.; Yang, G.S.; Pang, L.; Lv, X.-T.; Liu, F.-L. Experimental study on basic mechanical behaviors of sandy mudstone under low freezing temperature. J. China Coal Soc. 2014, 39, 1262–1268. [Google Scholar]
- Shan, R.-L.; Bai, Y.; Ju, Y.; Han, T.-Y.; Dou, H.-Y.; Li, Z.-L. Study on the triaxial unloading creep mechanical properties and damage constitutive model of red sandstone containing a single ice-filled flaw. Rock Mech. 2021, 54, 833–855. [Google Scholar] [CrossRef]
- Wang, X.-H.; Zhang, S.-R.; Wang, C.; Song, R.; Shang, C.; Fang, X. Experimental investigation of the size effect of layered roller compacted concrete (RCC) under high-strain-rate loading. Constr. Build. Mater. 2018, 165, 45–57. [Google Scholar] [CrossRef]
- Yang, Y.; Lai, Y.; Li, J. Laboratory investigation on the strength characteristic of frozen sand considering effect of confining pressure. Cold Reg. Sci. Technol. 2009, 60, 245–250. [Google Scholar] [CrossRef]
- Yang, R.; Fang, S.; Li, W.; Yang, Y.; Yue, Z. Experimental Study on the Dynamic Properties of Three Types of Rock at Negative Temperature. Geotech. Geol. Eng. 2019, 37, 455–564. [Google Scholar] [CrossRef]
- Zhu, Z.; Kang, G.; Ma, Y.; Xie, Q.; Zhang, D.; Ning, J. Temperature damage and constitutive model of frozen soil under dynamic loading. Mech. Mater. 2016, 102, 108–116. [Google Scholar] [CrossRef]
- Wang, L.; Qin, Y.; Jia, H.; Su, H.; Chen, S. Study on Mechanical Properties and Energy Dissipation of Frozen Sandstone under Shock Loading. Shock. Vib. 2020, 2020, 8893128. [Google Scholar] [CrossRef]
- Xu, J.; Kang, Y.; Wang, Z.; Wang, X.; Zeng, D.; Su, D. Dynamic Mechanical Behavior of Granite under the Effects of Strain Rate and Temperature. Int. J. Geomech. 2020, 20, 04019177. [Google Scholar] [CrossRef]
- Wen, M.; Xu, J.Y.; Wang, H.Y.; Fang, X.; Zheng, G. Fractography analysis of sandstone failure under low temperature-dynamic loading coupling effects. Chin. J. Rock Mech. Eng. 2017, 36, 3822–3830. [Google Scholar]
- Yang, Y.; Wang, J.G.; Yang, R.S. Analysis of deformation and fracture of the saturated frozen red sandstone under high strain rate. J. Rock Mech. Eng. 2018, 37, 4016–4026. [Google Scholar]
- Liu, C.; Zhang, J.; Deng, H.; Lin, Y.; Li, P.; Ke, B. Energy Dissipation Characteristics and Failure Patterns of Freeze-Thawed Granite in Dynamic Flexural Tension. IEEE Access 2019, 7, 97793–97802. [Google Scholar] [CrossRef]
- Liu, B.; Sun, Y.; Wang, J.; Zhang, G. Characteristic Analysis of Crack Initiation and Crack Damage Stress of Sandstone and Mudstone under Low-Temperature Condition. J. Cold Reg. Eng. 2020, 34, 04020020. [Google Scholar] [CrossRef]
- Inada, Y.; Yokota, K. Some Studies of Low Temperature Rock Strength. Int. J. Rock Mech. Min. Sci. Geomech. Abstr. 1984, 21, 145–153. [Google Scholar] [CrossRef]
- Shen, Y.; Yang, G.; Wang, M.; Zhang, H.; Jia, H.; Rong, T. Experimental and theoretical study on thermal conductivity of rock under cyclic freezing and thawing. Chin. J. Rock Mech. Eng. 2016, 35, 2417–2425. [Google Scholar] [CrossRef]
- Kodama, J.; Goto, T.; Fujii, Y.; Hagan, P. The effects of water content, temperature and loading rate on strength and failure process of frozen rocks. Int. J. Rock Mech. Min. Sci. 2013, 62, 1–13. [Google Scholar] [CrossRef]
- Weng, L.; Wu, Z.; Liu, Q. Dynamic Mechanical Properties of Dry and Water-Saturated Siltstones Under Sub-Zero Temperatures. Rock Mech. 2020, 53, 4381–4401. [Google Scholar] [CrossRef]
- Xing, H.; Wang, M.; Ju, M.; Li, J.; Li, X. Measurement of ejection velocity of rock fragments under dynamic compression and insight into energy partitioning. Int. J. Rock Mech. Min. Sci. 2022, 149, 104992. [Google Scholar] [CrossRef]
- Gu, H.; Tao, M.; Li, X.; Cao, W.; Li, Q. Dynamic response and meso-deterioration mechanism of water-saturated sandstone under different porosities. Measurement 2021, 167, 108275. [Google Scholar] [CrossRef]
- Bischoff, P.H.; Perry, S.H. Compressive behaviour of concrete at high strain rates. Mater. Struct. 1991, 24, 425–450. [Google Scholar] [CrossRef]
- Fu, H.C.; Erki, M.A.; Seckin, M. Review of Effects of Loading Rate on Concrete in Compression. J. Struct. Eng. 1991, 117, 3645–3659. [Google Scholar] [CrossRef]
- Zhou, Z.; Cai, X.; Ma, D.; Du, X.; Chen, L.; Wang, H.; Zang, H. Water saturation effects on dynamic fracture behavior of sandstone. Int. J. Rock Mech. Min. Sci. 2018, 114, 46–61. [Google Scholar] [CrossRef]
- Ping, Q.; Sun, H.; Zhang, C.; Zhou, X. Physics and dynamics characteristics and energy analysis of freeze-thaw limestone. Adv. Civ. Eng. 2020, 2020, 1–12. [Google Scholar] [CrossRef]
- Niu, C.; Zhu, Z.; Zhou, L.; Li, X.; Ying, P.; Dong, Y.; Deng, S. Study on the microscopic damage evolution and dynamic fracture properties of sandstone under freeze-thaw cycles. Cold Reg. Sci. Technol. 2021, 191, 103328. [Google Scholar] [CrossRef]
- Wu, Z.; Zhang, J.; Yu, H.; Ma, H.; Chen, L.; Dong, W.; Huan, Y.; Zhang, Y. Coupling effect of strain rate and specimen size on the compressive properties of coral aggregate concrete: A 3D mesoscopic study. Compos. Part B Eng. 2020, 200, 108299. [Google Scholar] [CrossRef]
- Gao, F.; Cao, S.; Zhou, K.; Lin, Y.; Zhu, L. Damage characteristics and energy-dissipation mechanism of frozen-thawed sandstone subjected to loading. Cold Reg. Sci. 2020, 169, 102920.1–102920.9. [Google Scholar] [CrossRef]
- Weng, L.; Wu, Z.; Liu, Q.; Wang, Z. Energy dissipation and dynamic fragmentation of dry and water-saturated siltstones under sub-zero temperatures. Eng. Fract. Mech. 2019, 220, 106659. [Google Scholar] [CrossRef]
- Aksenov, V.I.; Bubnov, N.G.; Klinova, G.I.; Iospa, A.V.; Gevorkyan, S.G. Water phase transformations in frozen soil under the effect of cryopegs. Water Resour. 2011, 38, 934–943. [Google Scholar] [CrossRef]
- Mironov, V.L.; Savin, I.; Lukin, Y.; Karavaisky, A.Y. Phase transition analysis in freezing moist soils carried out on the basis of phase transitions characteristic to the different types of soil water. In Proceedings of the 2012 IEEE International Geoscience and Remote Sensing Symposium, Munich, Germany, 22–27 July 2012; IEEE: Piscataway, NJ, USA, 2012. [Google Scholar] [CrossRef]
- Jia, H.; Ding, S.; Wang, Y.; Zi, F.; Sun, Q.; Yang, G. An NMR-based investigation of pore water freezing process in sandstone. Cold Reg. Sci. Technol. 2019, 168, 102893. [Google Scholar] [CrossRef]
- Sheng, D.; Axelsson, K.; Knutsson, S. Frost Heave due to Ice Lens Formation in Freezing Soils. Hydrol. Res. 1995, 26, 147–168. [Google Scholar] [CrossRef]
- Thomas, H.R.; Cleall, P.; Li, Y.-C.; Harris, C.; Kern-Luetschg, M. Modelling of cryogenic processes in permafrost and seasonally frozen soils. Geotechnique 2009, 59, 173–184. [Google Scholar] [CrossRef]
- Fu, T.; Zhu, Z.; Ma, W.; Zhang, F. Damage model of unsaturated frozen soil while considering the influence of temperature rise under impact loading. Mech. Mater. 2021, 163, 104073. [Google Scholar] [CrossRef]
- Zhang, H.; Cheng, S.; Zhang, J.; Gao, Z.; Wang, H. Viscoelastic damage model of saturated rock mass based on water-rock co-loading mechanism. J. WUHAN Univ. Technol. 2019, 41, 6. [Google Scholar] [CrossRef]
- Winkler, E.M. Frost damage to stone and concrete geological considerations. Eng. Geol. 1968, 2, 315–323. [Google Scholar] [CrossRef]
- Potter, R.S.; Cammack, J.M.; Braithwaite, C.H.; Church, P.D.; Walley, S.M. Problems Associated with Making Mechanical Measurements on Water–Ice at Quasistatic and Dynamic Strain Rates. J. Dyn. Behav. Mater. 2019, 5, 198–211. [Google Scholar] [CrossRef] [Green Version]
- Potter, R.S.; Cammack, J.M.; Braithwaite, C.H.; Church, P.D.; Walley, S.M. A study of the compressive mechanical properties of defect-free, porous, and sintered water-ice at low and high strain rates. Icarus 2020, 351, 113940. [Google Scholar] [CrossRef]
Figure 1.
Engineering hazards: (a) cracks in frozen rock and (b) frost heave deformation of a railroad roadbed.
Figure 1.
Engineering hazards: (a) cracks in frozen rock and (b) frost heave deformation of a railroad roadbed.

Figure 2.
Application of the freezing method in construction [1]. (a) Freezing shafts of coal mine, (b) frozen rock wall and (c) ice on the frozen wall.
Figure 2.
Application of the freezing method in construction [1]. (a) Freezing shafts of coal mine, (b) frozen rock wall and (c) ice on the frozen wall.

Figure 3.
Sample saturation preparation. (a) The size of specimen, (b) saturation process of specimen.
Figure 3.
Sample saturation preparation. (a) The size of specimen, (b) saturation process of specimen.

Figure 4.
SHPB test device with a low-temperature freezing device.

Figure 5.
Stress equilibrium analysis.

Figure 6.
Quasi-static strength and failure patterns of frozen water-saturated sandstone under different temperatures. (The red line in the figure is the macroscopic crack of frozen sandstone failure, the red circle is the rock fragment, and the red arrow points to the quasi-static failure pattern at each temperature).

Figure 7.
Compressive stress-strain curves at different temperatures (a) and different strain rates (b).
Figure 7.
Compressive stress-strain curves at different temperatures (a) and different strain rates (b).

Figure 8.
The change in dynamic peak strength under different temperature (a) and strain rate (b).

Figure 9.
Crack propagations under (a) room temperature of 18 °C and (b) different strain rates at −20 °C.
Figure 9.
Crack propagations under (a) room temperature of 18 °C and (b) different strain rates at −20 °C.

Figure 10.
Coupling effect of strain rate and temperature on the dynamic failure patterns of frozen water-saturated sandstone.
Figure 10.
Coupling effect of strain rate and temperature on the dynamic failure patterns of frozen water-saturated sandstone.

Figure 11.
Typical energy evolution curves of frozen water-saturated sandstone in SHPB tests.

Figure 12.
Relations between dissipated energy and strain rate under different temperatures.

Figure 13.
Relations between the wave velocity and temperature of frozen water-saturated sandstone.

Figure 14.
Water-ice phase transition mechanism.

Figure 15.
Coupling effect of strain rate and temperature on the dynamic strength of frozen water-saturated sandstone.
Figure 15.
Coupling effect of strain rate and temperature on the dynamic strength of frozen water-saturated sandstone.


Table 1.
Basic physical properties of test specimens.
| P-Wave Velocity (m/s) | Saturated Density (g/cm3) | Elastic Modulus (GPa) | Moisture Content (%) |
|---|---|---|---|
| 3220 ± 230 | 2.475 ± 0.026 | 7.95 ± 0.95 | 3.53 ± 0.30 |
Table 2.
SHPB test data of frozen sandstone.
| Temperature (°C) | Strain Rate (s−1) | Peak Stress (MPa) | Peak Strain | Temperature (°C) | Strain Rate (s−1) | Peak Stress (MPa) | Peak Strain |
|---|---|---|---|---|---|---|---|
| −1 | 66.25 | 89.53 | 0.020 | −10 | 85.12 | 107.48 | 0.024 |
| −1 | 69.73 | 103.71 | 0.013 | −10 | 76.15 | 98.04 | 0.022 |
| −1 | 76.56 | 122.53 | 0.017 | −10 | 122.39 | 116.10 | 0.034 |
| −1 | 97.43 | 117.78 | 0.025 | −10 | 172.76 | 107.81 | 0.043 |
| −1 | 116.88 | 131.14 | 0.033 | −10 | 105.59 | 101.49 | 0.029 |
| −3 | 56.11 | 89.52 | 0.013 | −10 | 125.82 | 105.00 | 0.032 |
| −3 | 89.66 | 94.43 | 0.026 | −10 | 142.65 | 105.01 | 0.036 |
| −3 | 154.18 | 134.22 | 0.027 | −20 | 50.05 | 91.04 | 0.013 |
| −3 | 158.81 | 102.62 | 0.038 | −20 | 66.07 | 97.76 | 0.016 |
| −3 | 191.88 | 108.13 | 0.044 | −20 | 56.43 | 96.57 | 0.017 |
| −5 | 70.06 | 82.11 | 0.016 | −20 | 85.03 | 113.85 | 0.02 |
| −5 | 71.06 | 84.17 | 0.018 | −20 | 80.07 | 106.86 | 0.024 |
| −5 | 92.47 | 91.7 | 0.028 | −20 | 86.23 | 112.48 | 0.027 |
| −5 | 111.37 | 92.57 | 0.029 | −20 | 113.99 | 105.04 | 0.029 |
| −5 | 135.66 | 97.03 | 0.035 | −20 | 118.94 | 109.66 | 0.031 |
| −5 | 174.02 | 103.33 | 0.04 | −20 | 123.01 | 124.81 | 0.031 |
| −10 | 50.77 | 82.94 | 0.014 | −20 | 142.07 | 118.34 | 0.038 |
| −10 | 60.16 | 95.76 | 0.015 | −20 | 130.74 | 111.11 | 0.031 |
Table 3.
Fitting equation of strength with strain rate.
| Temperature (°C) | Fitting Equation | R2 |
|---|---|---|
| −1 | 0.75 | |
| −3 | 0.62 | |
| −5 | 0.98 | |
| −10 | 0.71 | |
| −20 | 0.79 |
Table 4.
Fitting equation of dissipated energy and strain rate.
| Temperature (°C) | Fitting Equation | R2 |
|---|---|---|
| −1 | 0.97 | |
| −3 | 0.73 | |
| −5 | 0.97 | |
| −10 | 0.96 | |
| −20 | 0.93 |
Publisher’s Note: MDPI stays neutral with regard to jurisdictional claims in published maps and institutional affiliations. |
© 2022 by the authors. Licensee MDPI, Basel, Switzerland. This article is an open access article distributed under the terms and conditions of the Creative Commons Attribution (CC BY) license (https://creativecommons.org/licenses/by/4.0/).
Share and Cite
MDPI and ACS Style
Yan, Z.; Li, Z.; Tan, Y.; Ma, L.; Yu, L.; Li, H. Coupling Effects of Strain Rate and Low Temperature on the Dynamic Mechanical Properties of Frozen Water-Saturated Sandstone. Water 2022, 14, 3513. https://doi.org/10.3390/w14213513
AMA Style
Yan Z, Li Z, Tan Y, Ma L, Yu L, Li H. Coupling Effects of Strain Rate and Low Temperature on the Dynamic Mechanical Properties of Frozen Water-Saturated Sandstone. Water. 2022; 14(21):3513. https://doi.org/10.3390/w14213513
Chicago/Turabian StyleYan, Zhiqiang, Zeng Li, Yizhong Tan, Linjian Ma, Liyuan Yu, and Hongya Li. 2022. "Coupling Effects of Strain Rate and Low Temperature on the Dynamic Mechanical Properties of Frozen Water-Saturated Sandstone" Water 14, no. 21: 3513. https://doi.org/10.3390/w14213513
Note that from the first issue of 2016, this journal uses article numbers instead of page numbers. See further details here.