Article

Efficiency of Adsorption and Photodegradation of Composite TiO2/Fe2O3 and Industrial Wastes in Cyanide Removal

by
Blanca Margarita Amaro-Medina
1,
Antonia Martinez-Luevanos
1,*,
Ma. de Jesus Soria-Aguilar
2,
Marco Antonio Sanchez-Castillo
3,
Sofia Estrada-Flores
1 and
Francisco Raul Carrillo-Pedroza
2,*
1
Facultad de Ciencias Químicas, Universidad Autónoma de Coahuila, Ing. J. Cárdenas Valdez S/N, República, Saltillo 25280, Coahuila, Mexico
2
Facultad de Metalurgia, Universidad Autónoma de Coahuila, Carretera 57 Km 5, Monclova 25710, Coahuila, Mexico
3
Facultad de Ciencias Químicas, Universidad Autónoma de San Luis Potosí, Manuel Nava 6, San Luis Potosí 78210, San Luis Potosí, Mexico
*
Authors to whom correspondence should be addressed.
Water 2022, 14(21), 3502; https://doi.org/10.3390/w14213502
Submission received: 29 September 2022 / Revised: 21 October 2022 / Accepted: 28 October 2022 / Published: 2 November 2022

Abstract

:
This research focused on the evaluation of the Fe2O3/TiO2 composite and two industrial wastes, a kaolin (Clay-K) and a blast furnace sludge (BFS), as adsorbents and/or photocatalytic materials to enhance the removal of cyanide from aqueous solutions. Cyanide adsorption tests were conducted in the absence of light. In contrast, cyanide photodegradation tests were conducted under three types of irradiations: visible light, ultraviolet (UV) light, and natural sunlight. For the latter case, two irradiance conditions were evaluated. Cyanide adsorption from aqueous phases was similar for Clay-K and TiO2/Fe2O3 materials, which adsorbed almost twice as much cyanide compared to the BFS sample. The differences observed in cyanide removal were explained in terms of the material’s surface area and chemical composition, and a complexation of cyanide ions with surface metals was suggested as the most feasible adsorption mechanism. The set of cyanide photodegradation experiments promoted, in general, higher cyanide removal from the aqueous solution compared to the adsorption processes. Under the conditions used in this study and when using Clay-K and BFS as promoters, cyanide photodegradation progressively enhanced with the following radiations: visible light < UV light ~ UV+solar ≤ Visible+solar. In the case of the TiO2/Fe2O3 composite, cyanide photodegradation increased in the following order: UV light < visible light < UV+solar ~ Visible+solar. Clearly, solar radiation had a significant effect on promoting cyanide removal. For experiments conducted with natural sunlight, the set with irradiance of 600–800 W/m2 exhibited the highest cyanide removal percentage, and the BFS had the best performance among the three tested samples over a period of 2 h. Results showed the benefit of using industrial wastes to remove cyanide from aqueous solutions and illustrates remediation of industrial effluents is potentially feasible within the framework of a circular economy.

1. Introduction

Cyanidation of gold and silver is an extraction process that has been used for more than a century to recover these precious metals from a wide variety of ores and concentrates. To date, cyanidation is recognized as a highly efficient extraction process that shows high stability and implies a low-cost operation [1,2]. In particular, gold extraction takes places through the formation of a cyanide complex, according to Elsner’s reaction [3]:
4   A u + 8   C N + O 2 + 2   H 2 O   4   A u ( C N ) 2   + 4   O H
As a result of the cyanidation process, soluble compounds, such as free cyanide and metal complexes, generate cyanide-containing industrial effluents in concentrations between 40 and 600 mg/L [2,4]. These kinds of industrial effluents are a major concern for the well-being of living ecosystems. Risks, such as accidents during operations, spills and/or filtration into waterways, formation of acid drains, and mobility of heavy metals contained in cyanide-contaminated effluents, cause both health and environmental issues that must be strictly solved [5]. For surface water, the upper limit of cyanide mean concentration is 2 μg/L, and for treated groundwater, it is 8 μg/L [6]. The lethal dose in humans, orally or inhaled, is approximately 1 to 3 mg of free cyanide per kg of body mass [7]. For this reason, several physical, chemical, and biological methods have been developed for removal and degradation of cyanide from aqueous phase effluents. Despite the significant improvements achieved to date, the need for novel, sustainable methods to decreased cyanide concentrations below the indicated limits is still an important task for metallurgical research and development groups.
Among the different alternatives to remove cyanide from aqueous solutions, cyanide adsorption is the preferred industrial option because it is easy to design, operate, and control [8,9]. Several materials have been used for cyanide adsorption, including activated carbon [10,11], iron-modified zeolites [9,12], zinc oxide [13], chitosan-polyacrylamide [14], pistachio-shell residues [15], and coke powder [16]. Cyanide adsorption has also been coupled with chemical oxidation methods to enhance cyanide removal from aqueous solutions. To this respect, heterogeneous photocatalysis seems to be a convenient alternative [17]. In this approach, a catalyst is activated by light absorption, and a photo-generation of electron-hole pairs occurs on the surface of the material. Then, the excited electrons are transferred to the reducible species, whereas the catalyst accepts the electrons of the oxidizable species occupying the gaps such that the flow of electrons is null, and it does not alter the catalyst performance [18]. This process is used when the species to be treated do not capture photons themselves; thus, when adding the catalyst, an energy change generates reactive species, such as hydroxyl radicals (OH*), which are very strong oxidizing species [19]. In this scenario, materials with photocatalytic activity may be beneficial to promote cyanide oxidation when they are properly excited by absorption of light of a specific wavelength. TiO2 is the most used semiconductor in photocatalysis because it is chemically and biologically inert. It shows stability to chemical and photochemical corrosion, and it has a gap of 3.2 eV that can be excited with ultraviolet light (λ < 387 nm). Photocatalysis with TiO2 has been widely used because it is a low-cost material with great stability under irradiation [20]. Several investigations have shown the beneficial effect of TiO2 on cyanide oxidation that takes place according to the following reaction [20]:
CN + 2H+ + 2OH → CNO + 2H2O
CNO + 4O2+ 2OH + 3H2O → CO32−+ NO3 + 4H2O2
Pavas et al. suggested the removal of cyanide from aqueous solutions by loading TiO2 in a tubular photo-reactor of 90–150 W with a recirculation time of 2 h. The removal process was further enhanced in some experiments using H2O2 as an oxidizing agent. In the case of the UV/H2O2 treatment system, the cyanide initial concentration of 400 mg/L decreased by 57%. In the case of the UV/TiO2/H2O2, the cyanide initial concentration reduced by 65.50%, showing the positive effect of TiO2 to remove cyanide [21]. Quispe et al. found similar results for cyanide removal with a UV/H2O2, using a photocatalytic reactor loaded with TiO2. Using a coupled TiO2-H2O2-UV treatment system, a degradation of 99.9% of the initial cyanide concentration was achieved after 1 h. It is noteworthy to point out that during this treatment, the initial pH of the solution, equal to 11.0, decreased to 9.54 [22]. Viña et al. also studied the simultaneous degradation of cyanides and thiocyanates using TiO2 as a catalyst and simulated sunlight and UV light; the best set of conditions, a 50% conversion of cyanide, was reached after 2 h in the presence of UV light [23].
It has also been suggested that iron oxides may add benefits when they are used in conjunction with TiO2 for cyanide removal [24,25,26]. The photocatalytic activity of iron oxides is well known, and they have been used to promote the oxidation of pollutants in ozonation processes, taking advantage of their stability and low cost [15]. Eskandari et al. conducted an experiment of cyanide adsorption and cyanide photo-degradation with UV light. In this study, two different materials based on TiO2 and Fe2O3 (TiO2/Fe2O3/zeolite and TiO2/Fe2O3/PAC) were used; the authors also used H2O2 as an additional oxidant. Under the best set of conditions of this study, cyanide degradation was higher than 90% for both catalysts, with the TiO2/Fe2O3/PAC catalyst showing a slightly better performance (97% cyanide removal) [27].
Contrastingly, kaolins with high iron content have also been reported as photocatalysts. Kaolins are aluminosilicate containing kaolinite (Al2O3·2SiO2·2H2O), with iron and titanium impurities in the form of oxides, oxyhydroxides, and carbonates [28]. Fe and Ti impurities can absorb light and promote the formation of reactive species, such as hydroxyl radical (OH*) [29]. In fact, Behnamfard et al. investigated the removal of free cyanide (CN) in aqueous solutions using kaolin as an adsorbent. Cyanide adsorption capacities were 2.5, 3, and 8 mg/g when using crude, calcined, and sulfuric acid-treated kaolin, respectively [9]. No specific studies of the comparison of the photocatalytic effect of TiO2 and Ti/Fe containing kaolin were found for the removal of cyanide from aqueous solutions. However, in the framework of a circular economy, it is relevant to evaluate and compare the photocatalytic performance of TiO2 with that of low-cost materials, such a as kaolin that may be found as industrial residues, for the removal of pollutants from aqueous solutions.
For the aforementioned reasons, the aim of this work was to investigate the efficiency of various Ti and Fe oxide composites as cyanide adsorbent materials and as photocatalysts for cyanide oxidation in aqueous solutions. The selected materials include a TiO2/Fe2O3 composite prepared by mechanosynthesis, as well as two industrial residues, a kaolin called Clay-K containing kaolinite, quartz, TiO2, and Fe2O3, and a blast furnace sludge (BFS) containing kaolinite, quartz, graphite, and various types of iron oxides. Adsorption experiments were carried out in the absence of light. The evaluation of these materials as photocatalysts of cyanide photo-oxidation was carried out under irradiation with visible light, UV light, and with natural sunlight.

2. Materials and Methods

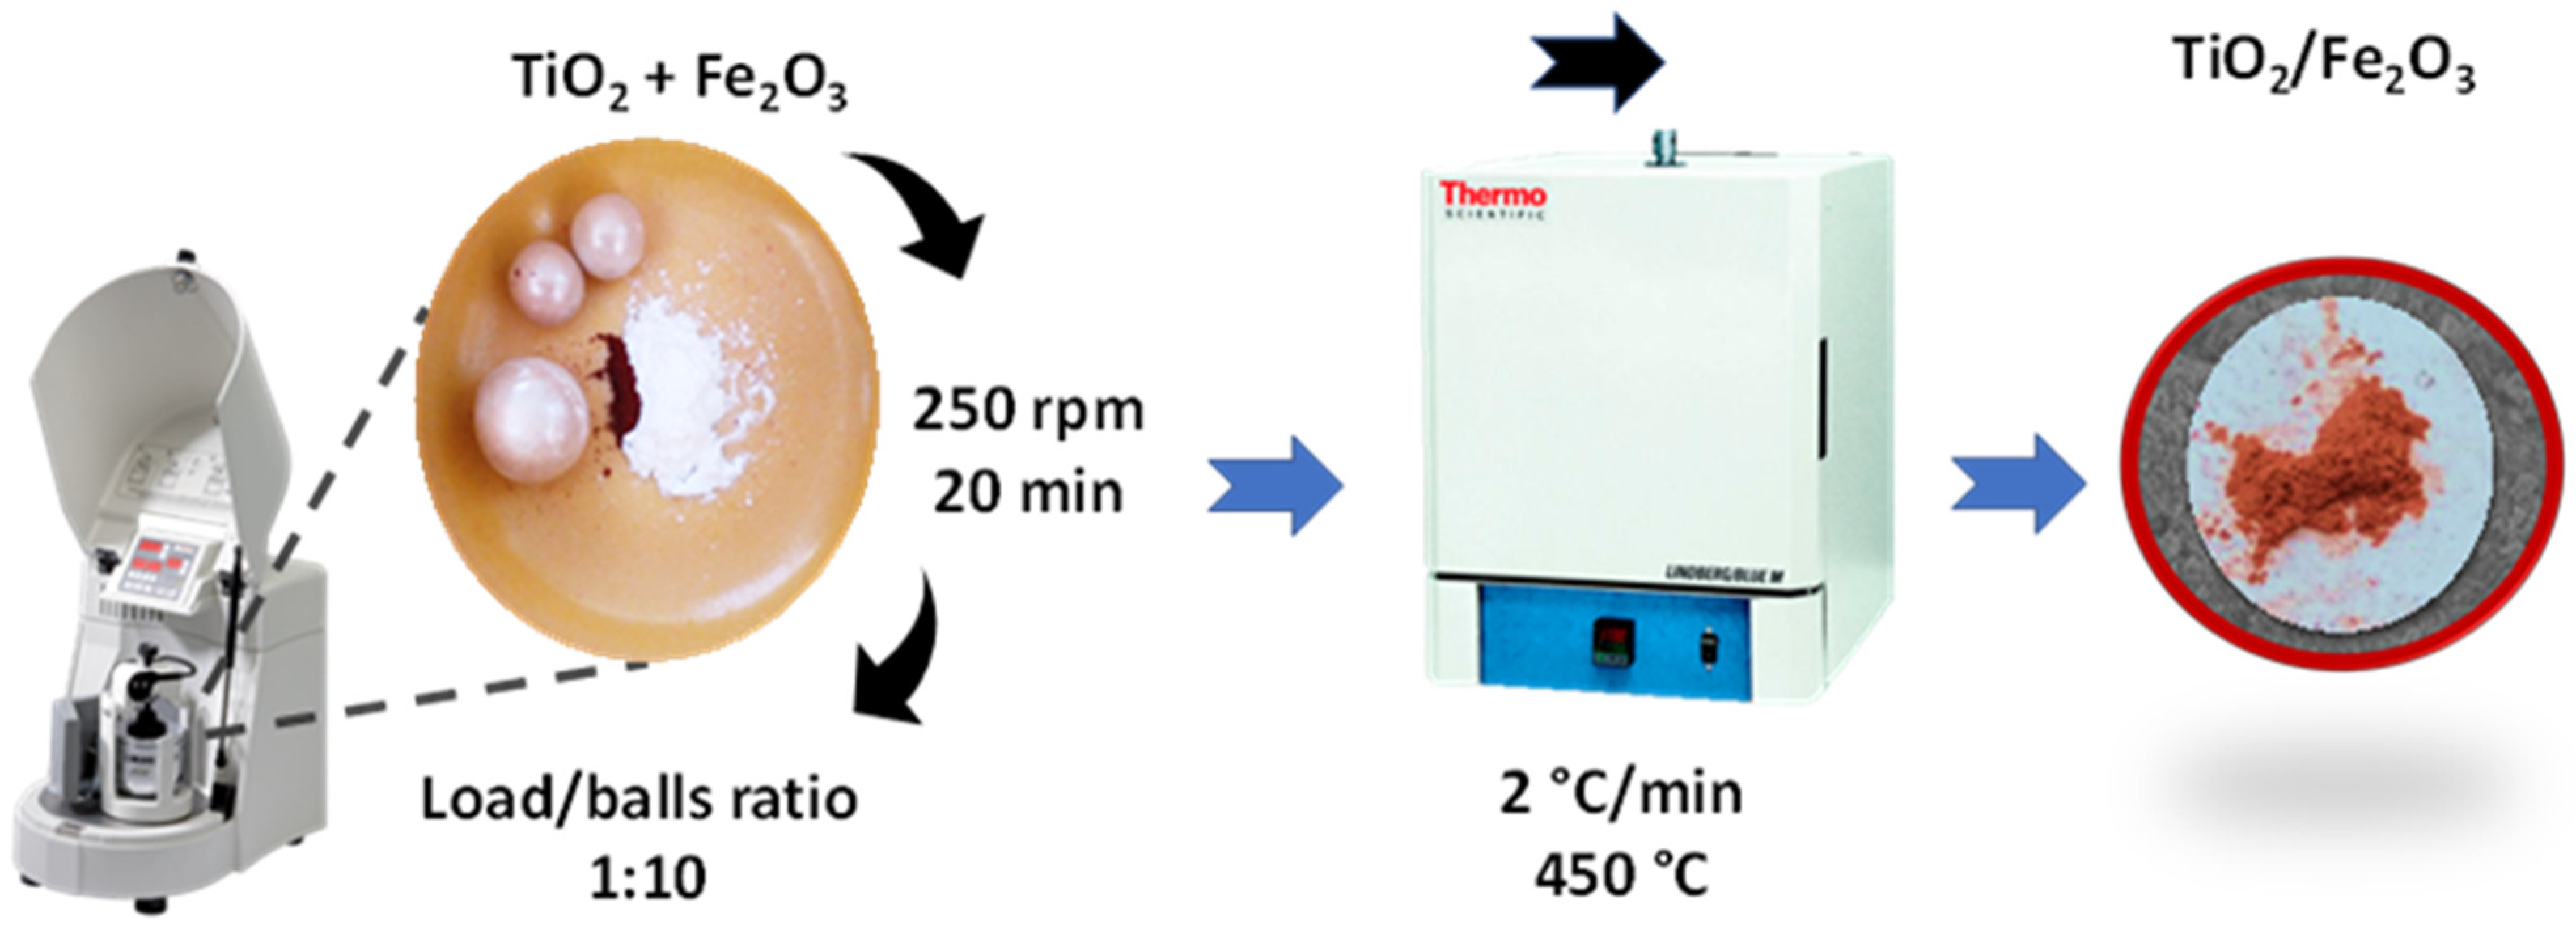
2.1. Adsorbent and Photocatalytic Materials

For the removal of cyanide by adsorption and photodegradation of aqueous solutions, three materials were selected. Two of these materials are industrial waste containing silica (quartz), kaolinite, iron and titanium oxides (Clay-K) and various types of iron oxides and graphite (BFS); the other material is the composite TiO2/Fe2O3, which was synthesized by the method of mechanosynthesis.
Pretreatment of Clay-K and BFS materials. The material called in this work, “Clay-K”, is an industrial waste, which was sieved, and the different size fractions were collected; for this study, the sample with particle size fraction −75/+45 μm was selected. Its main mineralogical composition is quartz and kaolinite; its chemical composition is mainly silicon and aluminum oxides, it also contains 1.27% and 0.1% of Fe2O3 and TiO2, respectively.
The material called “BFS” comes from the metallurgical industry, its main mineralogical composition is quartz, kaolinite, and graphite, its chemical composition is mainly based on silicon and aluminum oxides and carbon (6%), and it also contains various types of iron oxides in smaller quantities (2.4% Fe2O3 and 1.1% Fe3O4). This material was used in adsorption and photodegradation tests as received.
Synthesis of TiO2/Fe2O3 composites. The TiO2/Fe2O3 composite was obtained by mechanosynthesis; 0.1 mol of TiO2 phase anatase, previously obtained by the sol-gel method and according to a procedure reported by Estrada-Flores et al., was placed into a container of zirconia of 200 mL; then, it was mixed with 2% in mol of Fe2O3 [30]. The container was placed in a Fritsch planetary ball mill (model Pulverisette 6), and the mixture was left in stirring for 20 min at 250 rpm. After this time, a red powder was obtained, which was subjected to a thermal treatment at 450 °C, using a heating rate of 2 °C/min. The ball load ratio was 1:10. Figure 1 presents a diagram of this synthesis procedure.

2.2. Characterization

Chemical and structural characterization of samples was carried out by infrared spectroscopy using Thermo Scientific equipment, model Nicolet iS10; infrared spectra were acquired in the range of 4000 cm−1 to 400 cm−1 with a resolution of 4 cm−1, and the attenuated reflectance accessory (ATR) was used. X-ray diffractograms were obtained using Rigaku equipment, model Ultima IV with D/teX detector with a speed of passage of 0.05°. Clay-K and BFS samples were characterized by optical microscopy, whereas the TiO2/Fe2O3 sample was characterized by scanning electron microscopy (SEM); a JEOL microscope Model JSM-7800F was used. Absorption spectra of the sample were obtained using Perkin Elmer equipment, Lambda 35 model with integration sphere; Spectralon® white diffuse reflectance standard was used for calibration. The specific surface area of the three samples was determined by the BET (Brunauer—Emmett—Teller) adsorption isotherm using the data obtained with the Quantachrome Instrument l equipment and using nitrogen gas as an adsorbent. The isoelectric point (pHIEP) of the TiO2/Fe2O3 sample was determined through the measurement of zeta potential as a function of pH for which Anton Paar equipment, Litesizer 500 model, was used. Aqueous suspensions of Clay-K and BFS samples were prepared at a concentration of 1 mg/mL, and the pH was adjusted to 7 and the ionic strength to 1 mM with potassium chloride (99% KCl from Sigma-Aldrich, Mexico).

2.3. Preparation of NaCN Solutions

Two liters of deionized water were added in a two-liter glass, and sodium hydroxide (NaOH, Sigma-Aldrich, 98%) was added until reaching a pH = 11; pH was measured with a glass electrode (Orion) connected to a potentiometer (Orion, model 710A); the electrode-potentiometer system was previously calibrated with pH buffer solutions 4, 7, and 10 (J.T Baker). This alkaline solution was used to prepare one liter of stock sodium cyanide solution (NaCN, Sigma-Aldrich, 97%) of 1000 mg/L for which 1.03 g of NaCN was added in a volumetric one-liter flask, and the alkaline solution was added until calibrated. From this stock, solutions of 50, 100, 250, and 750 mg/L of NaCN were prepared.

2.4. Adsorption Experiments

NaCN initial concentration effect. Certain predefined amounts of TiO2/Fe2O3, Clay-K, and BFS materials were weighed and added to 15 mL glass tubes coated with aluminium foil, containing 10 mL of aqueous NaCN solution, at a predefined concentration (250 mg/L and 750 mg/L). The material was then dispersed into the cyanide solution using an ultrasound for one minute; subsequently, the tubes with the dispersions were kept for 2 h in an incubator at 25 ± 1 °C and in the absence of light. After this time, the solid/liquid separation was performed by centrifugation at 8000 rpm for 5 min, and the clarified liquid was collected for the quantification of cyanide by means of the titration technique with silver nitrate solution (AgNO3, Sigma-Aldrich, 99%) and using potassium iodide as an indicator (KI, Sigma-Aldrich, 99%).
Adsorption kinetics. These tests were performed in the absence of light at an initial cyanide concentration of 750 mg/L; a concentration of adsorbent material (TiO2/Fe2O3, Clay-K, and BFS) of 2 g/L was used. At a previously pre-established contact time, the solid–liquid separation was carried out by centrifugation at 8000 rpm for 5 min; the clarified liquid was collected and used for the quantification of the remaining cyanide in the titration solution. The temperature remained constant at 25 ± 1 °C.

2.5. Photodegradation Experiments

Catalyst addition and irradiation type effect. Amounts of 20 mg of each material were weighed and added to 15 mL glass tubes coated with aluminum foil and containing 10 mL of aqueous solution of NaCN at a concentration of 750 ppm. The material was then briefly dispersed into the cyanide solution using an ultrasound for one minute; subsequently, the tubes with the dispersions were kept for 2 h in an incubator at 25 °C (in the absence of light). After this time, the samples were moved to a system for photo-oxidation. This system consisted of a 50 mL quartz tube, a bath of water recirculation to keep the temperature constant, and a lamp with its source. The samples were irradiated for 2 h with UV light using a mercury lamp (Pen-Ray®, λ = 254 nm, irradiance = 4400 μW/cm2, 300 V); then, the solid–liquid separation was performed by centrifugation at 8000 rpm for 5 min; the clarified liquid was collected to quantify the cyanide present in the titration solution using a solution of AgNO3 0.01 M. This procedure was repeated but with visible irradiation for which a xenon lamp (Pen-Ray®, λ = 467 nm, 300 V) and natural sunlight were used.
Photodegradation kinetics. Amounts of 20 mg of each of the three samples were weighed and added to 10 mL of NaCN with an initial concentration of 750 mg/L in 15 mL glass tubes previously coated with aluminum foil. The material was then briefly dispersed in the ultrasound cyanide solution for one minute; subsequently, the scattered samples were kept for 2 h in the incubator at 25 °C and in the absence of light. The samples were then irradiated with natural sunlight. At a pre-established time, the solid–liquid separation was carried out by centrifugation at 8000 rpm for 5 min; the clarified liquid was collected to quantify the cyanide present in the titration solution with a solution of AgNO3. All photodegradation experiments were performed at 25 ± 1 °C.

3. Results and Discussion

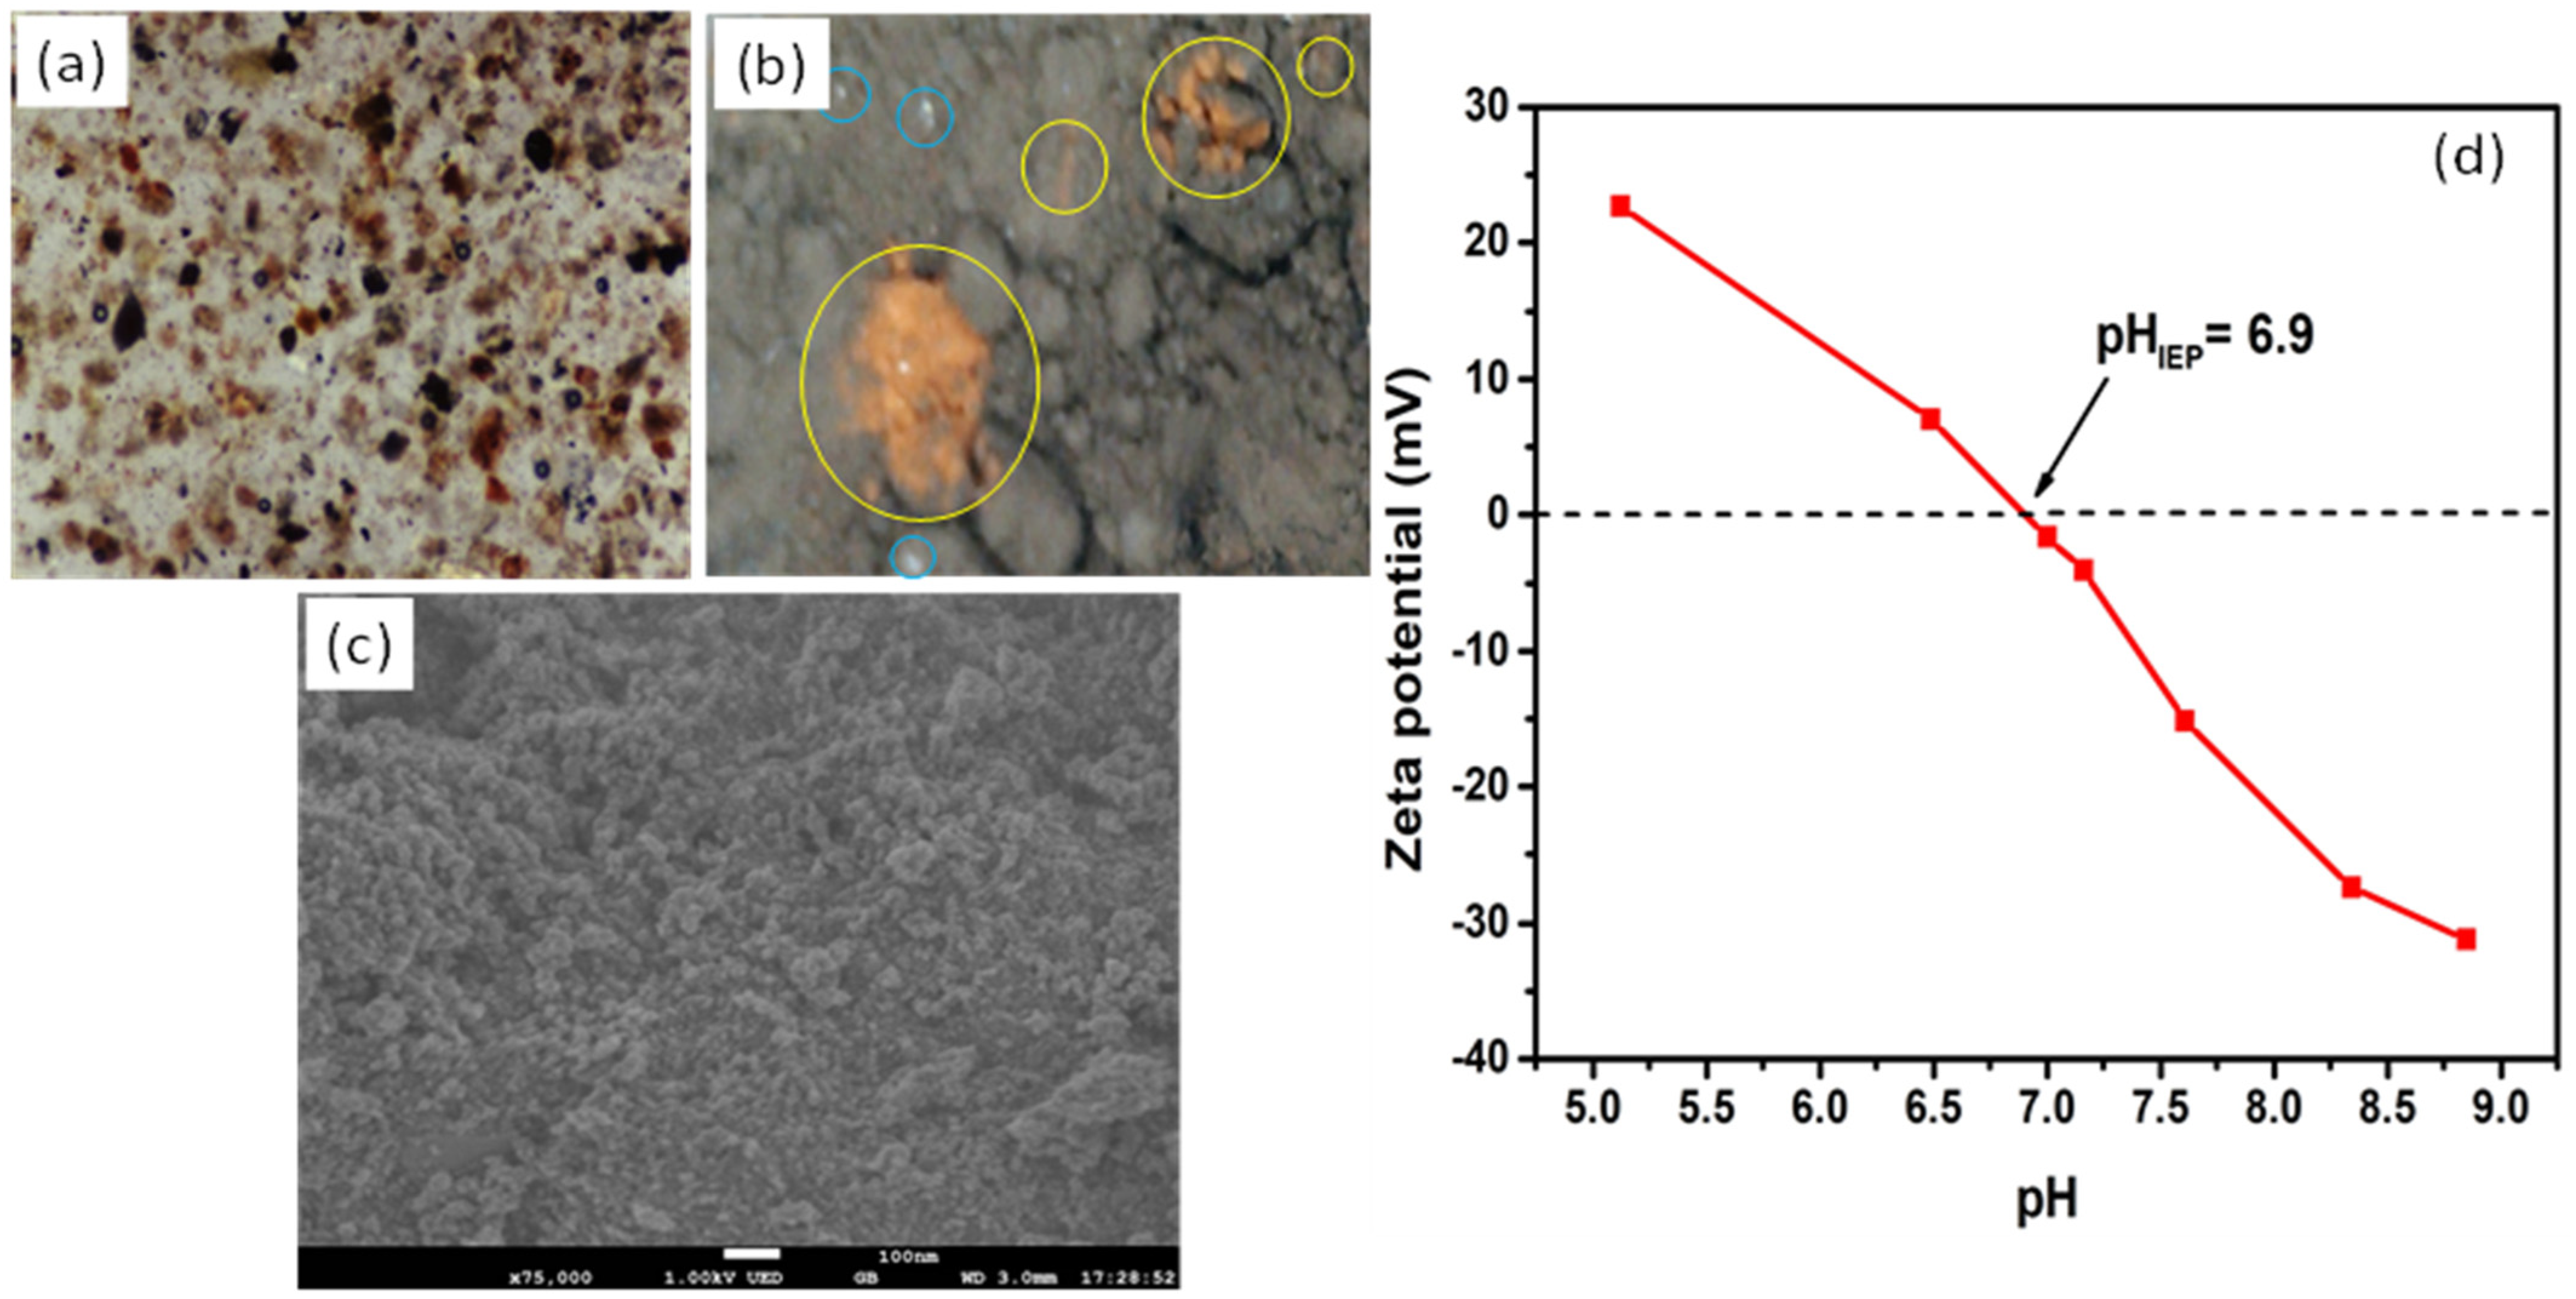
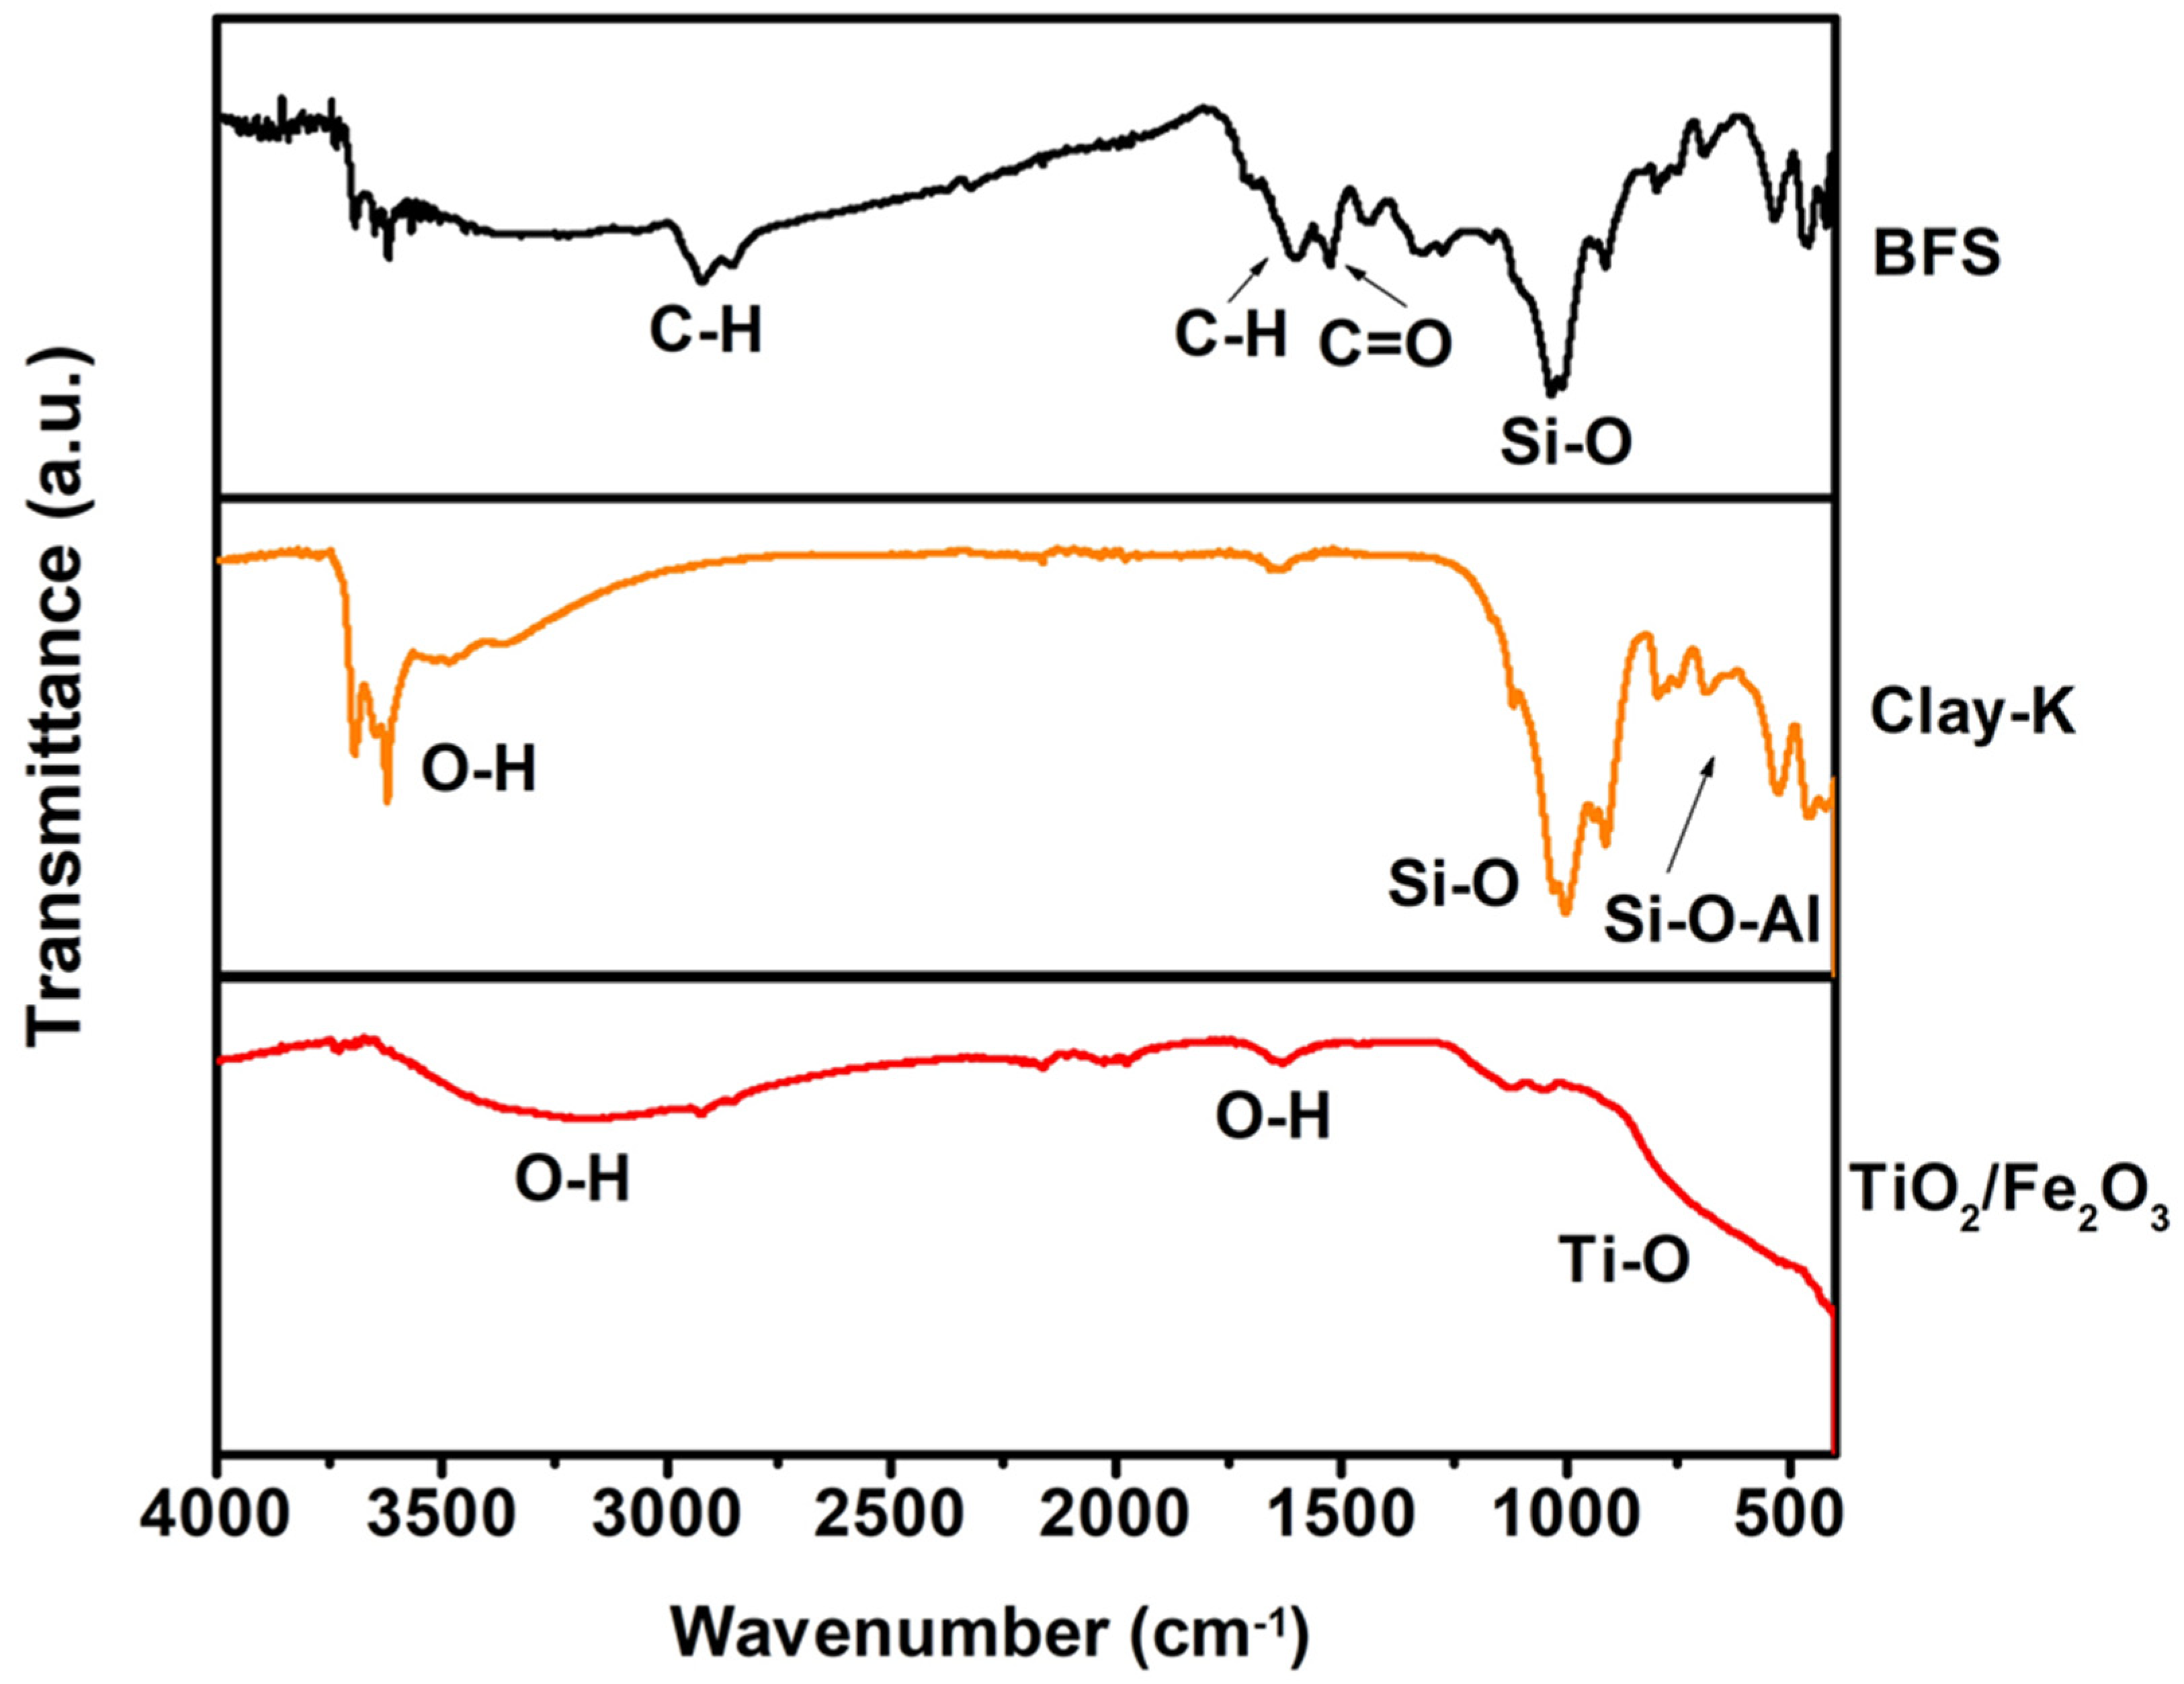
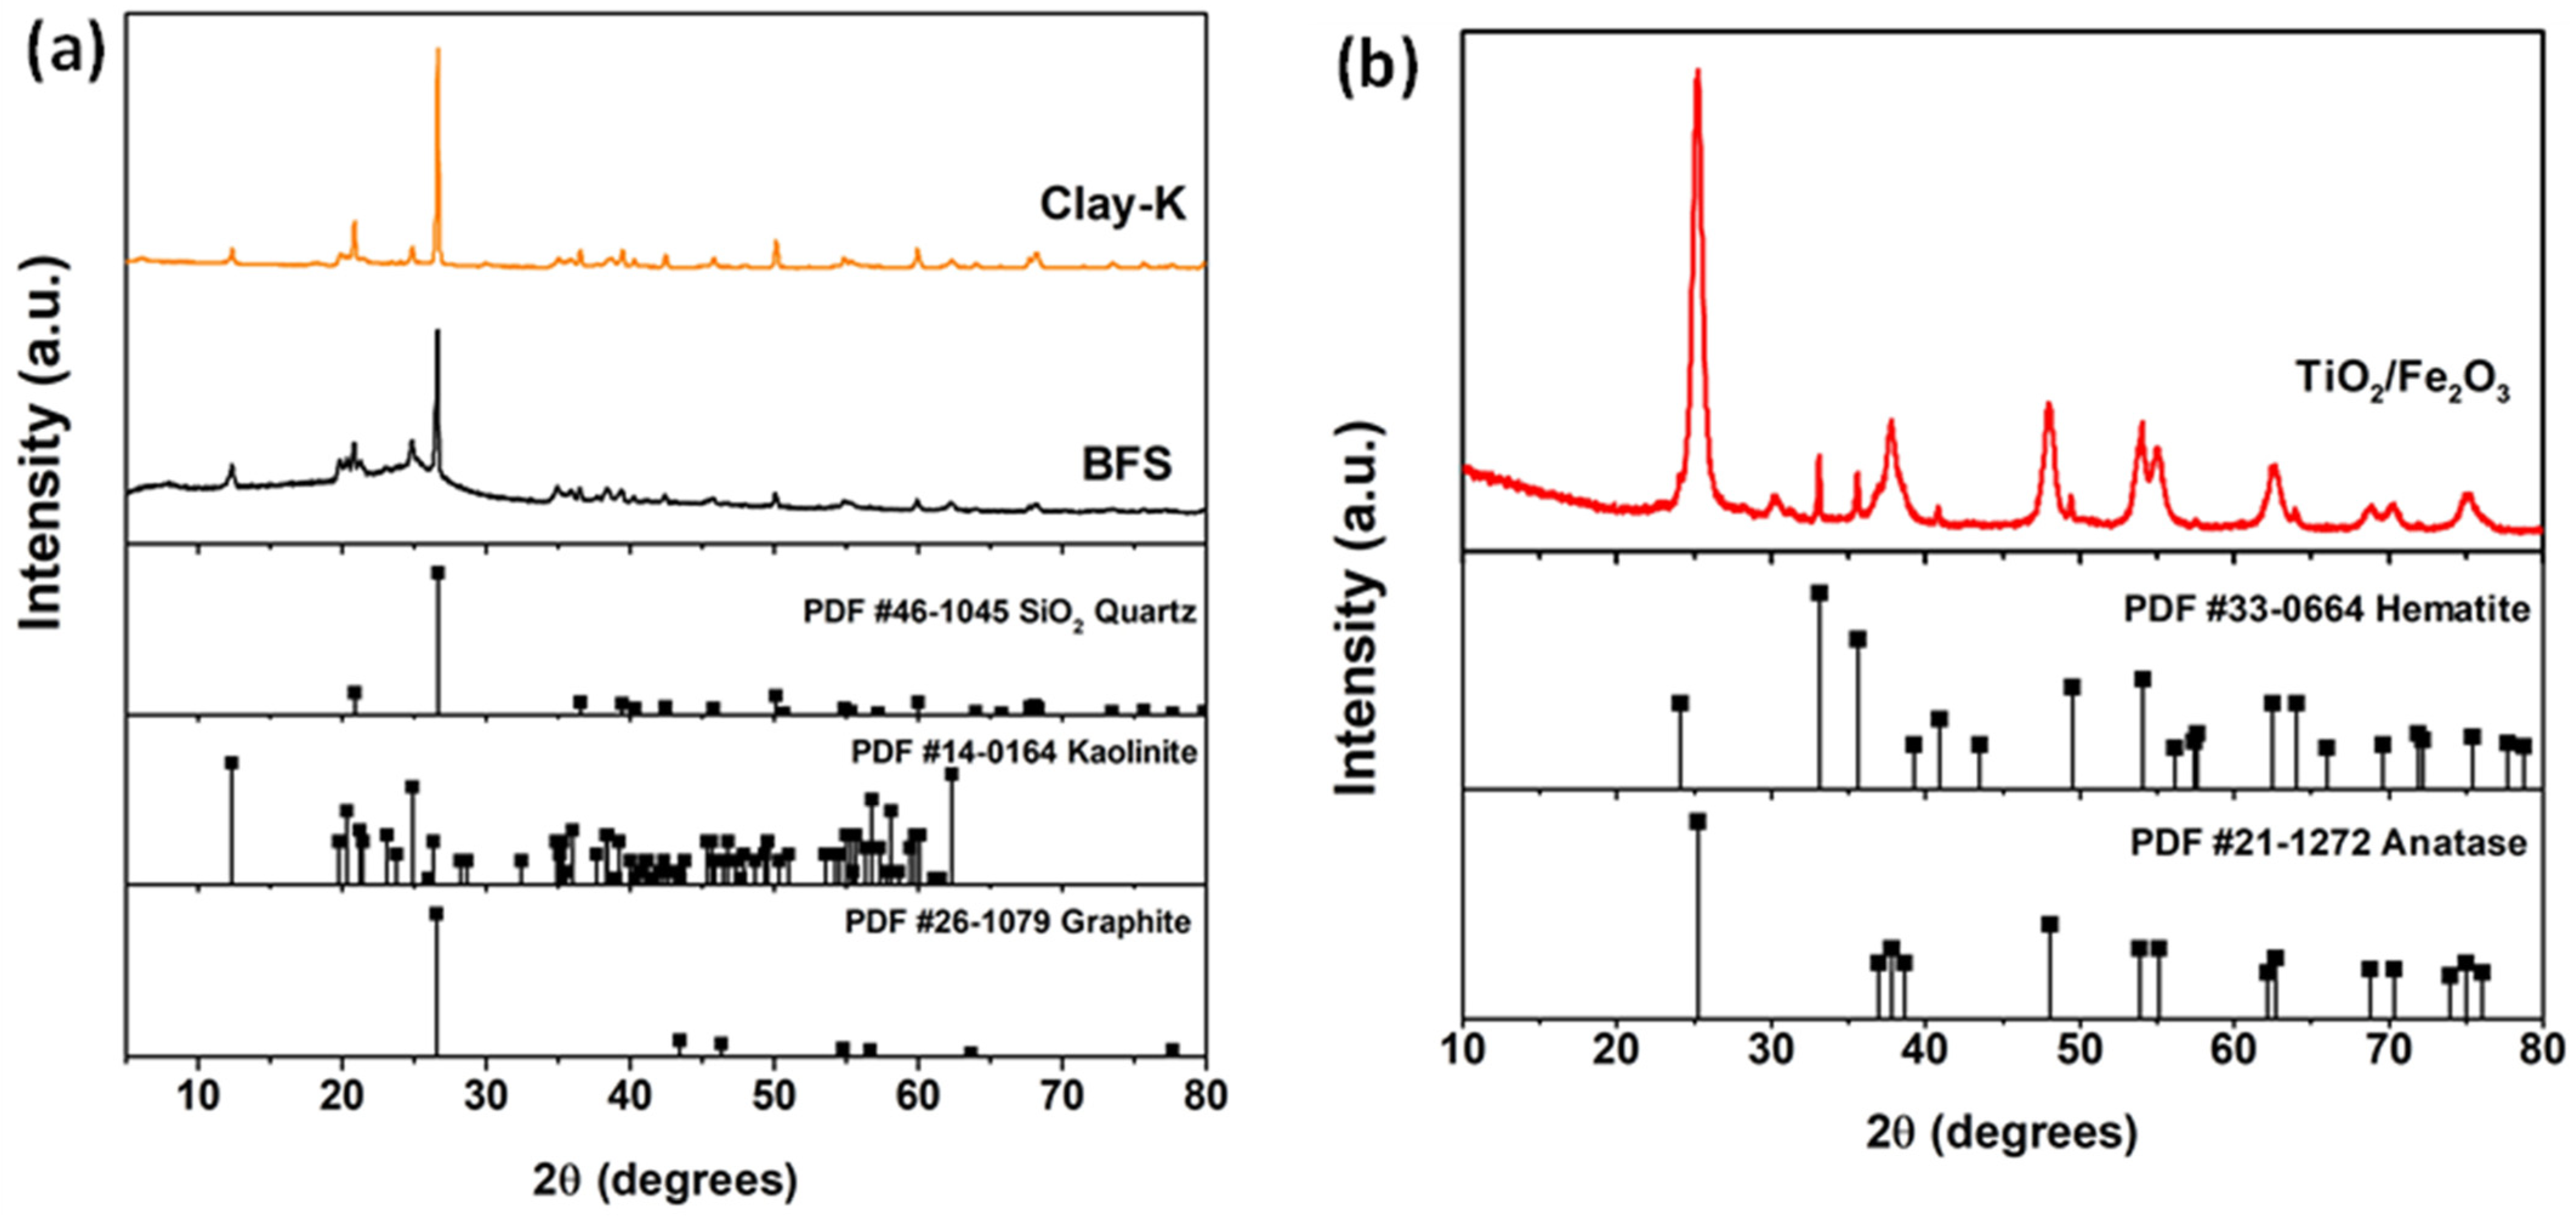
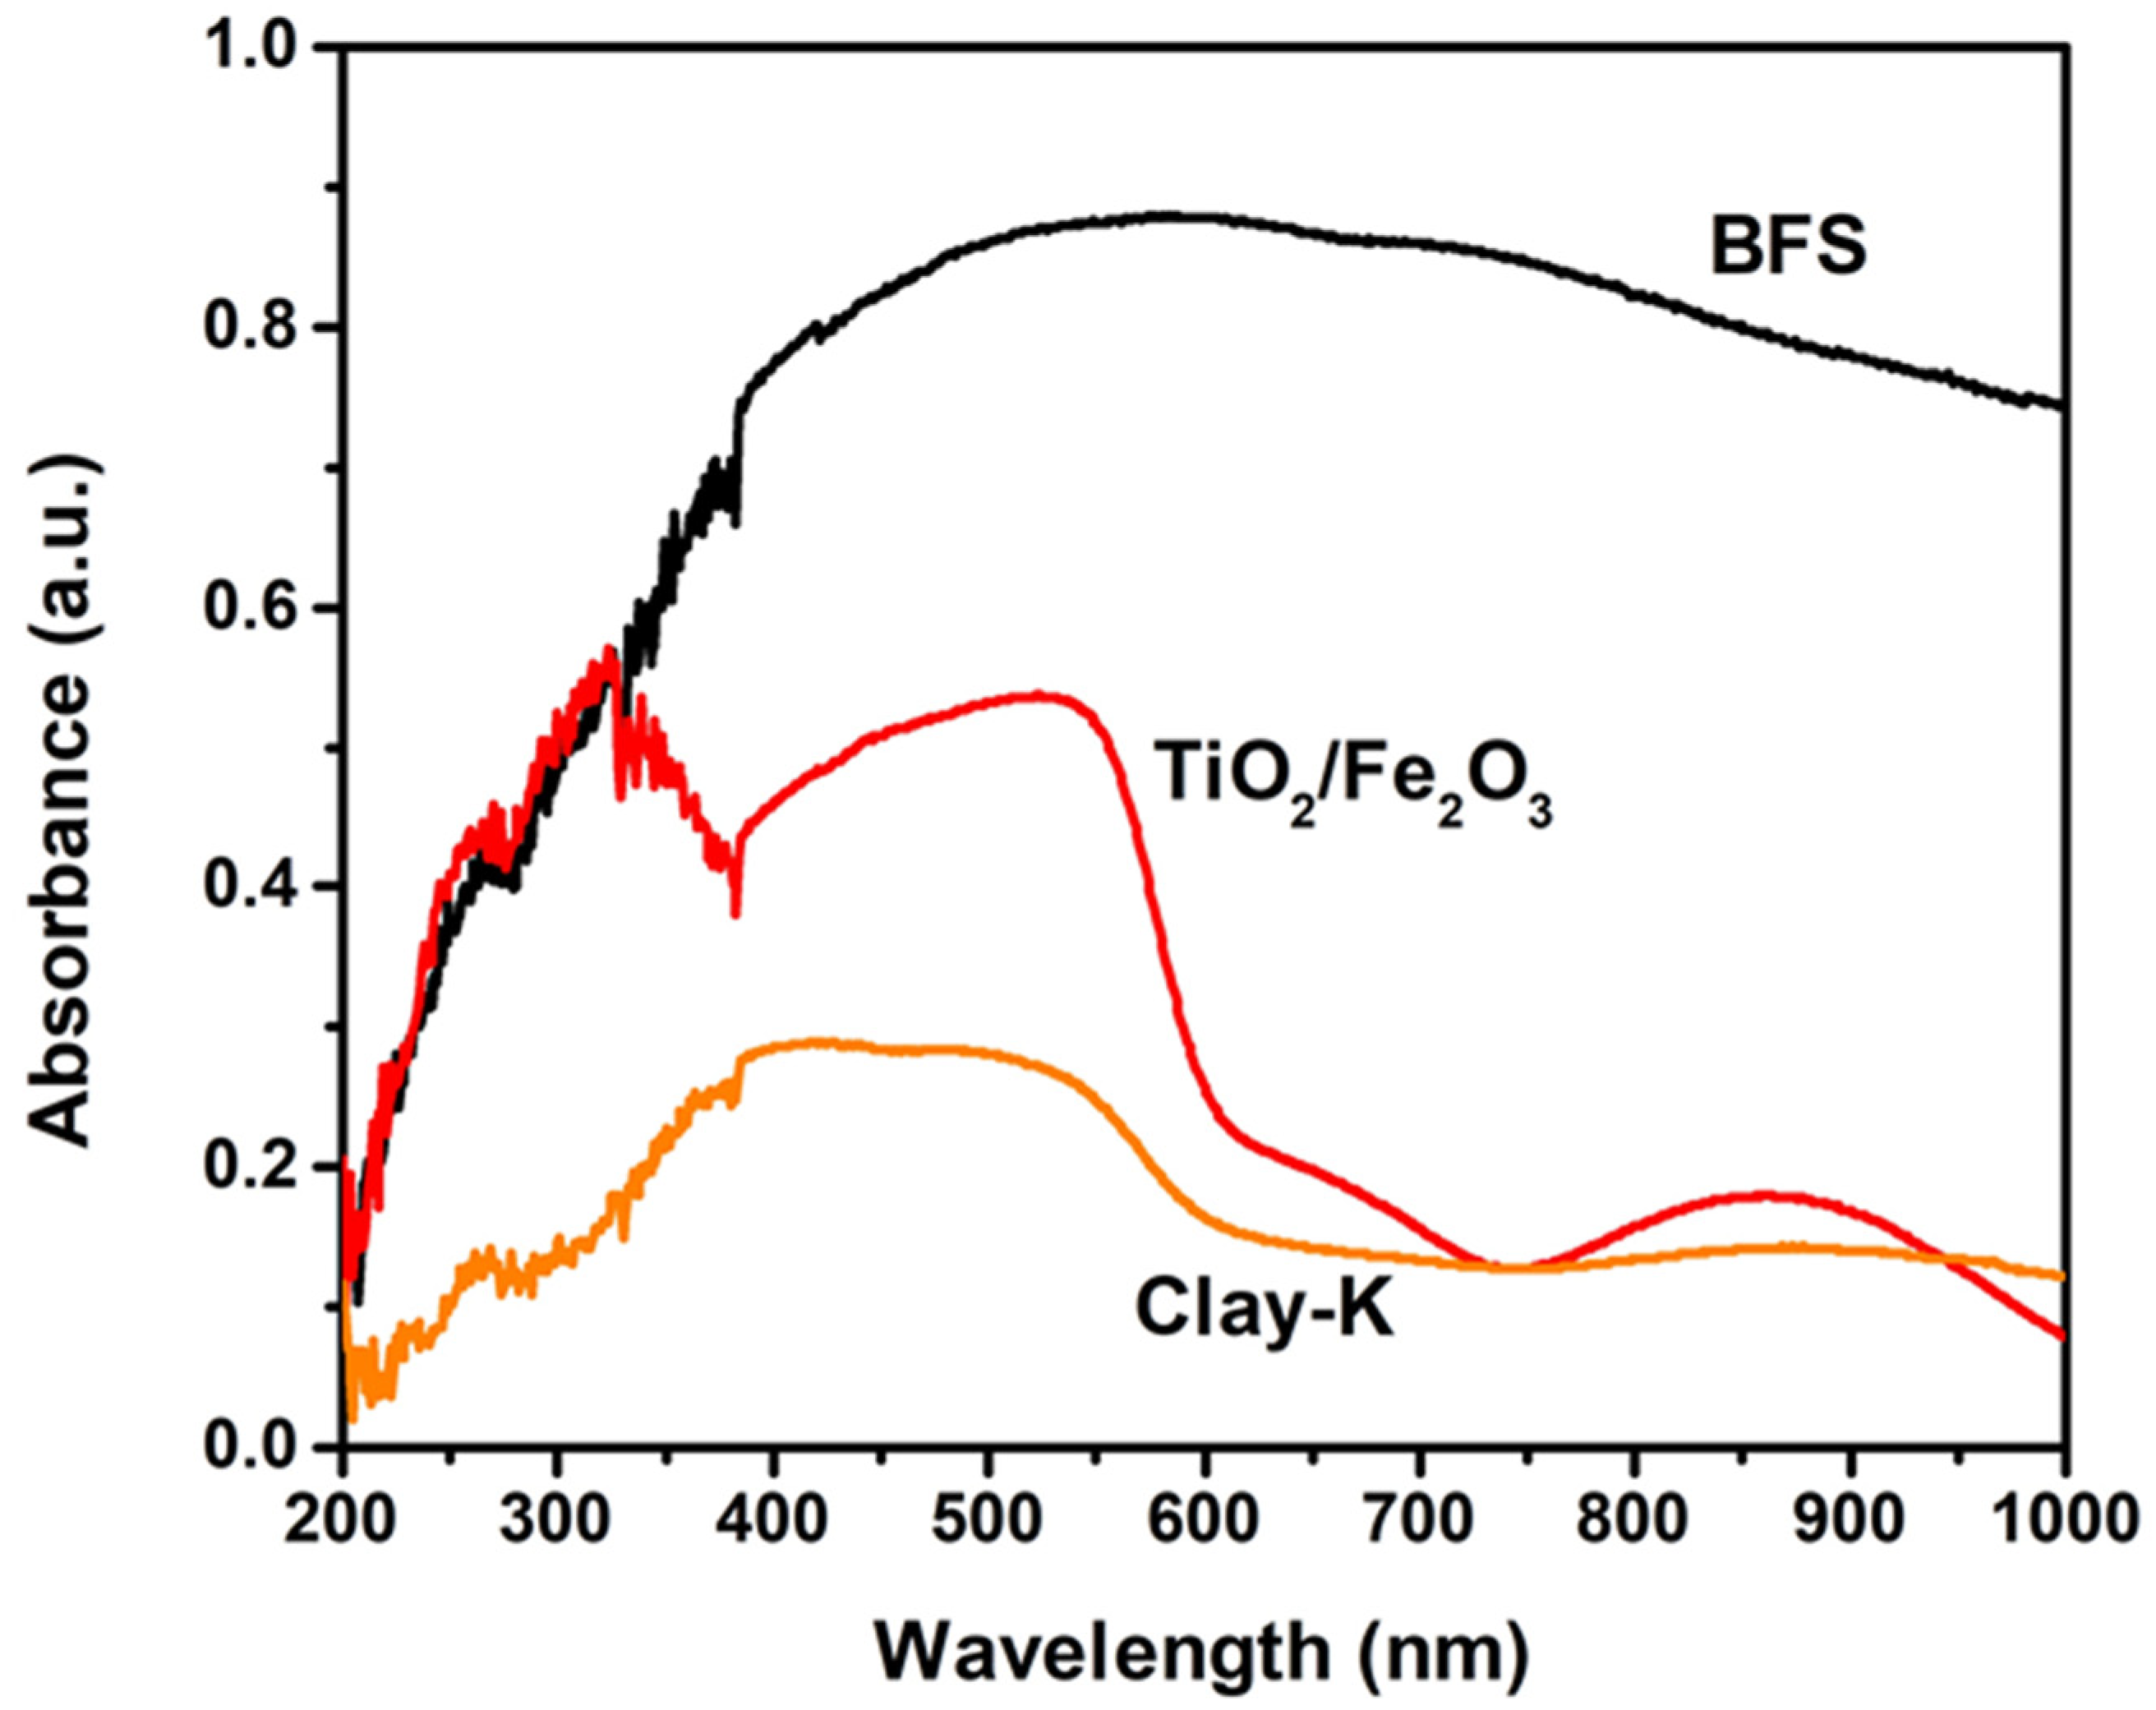
3.1. Characterization

Optical micrographs of Clay-K and BFS samples (Figure 2a,b) and micrograph (SEM) of the TiO2/Fe2O3 composite (Figure 2c) are provided. Particles of iron oxides are observed in Figure 2a; orange color particles correspond to Fe2O3 (red circle), and white color particles correspond to quartz or kaolinite (blue circle). In Figure 2c, it is observed that the TiO2/Fe2O3 sample was porous, and it was formed by nanoparticles. Average zeta potential values for BFS and Clay-K samples are shown in Table 1. The zeta potential of Clay-K is −29.9 mV at pH 7, whereas that of BFS is 27.13 mV; the surface charge of both materials is likely to be negative at pH 11. Figure 1d presents the variation of the zeta potential of the TiO2/Fe2O3 sample as a function of pH, and extrapolation yields the value of the isoelectric point of 6.9 (pHIEP); this implies that the surface of this sample has a positive charge at pH values lower than 6.9, whereas its surface is negatively charged at pH values higher than 6.9. It is important to note that cyanide solutions are usually prepared at pH equal to or close to 11; thus, it must be considered that the surface of clay and TiO2/Fe2O3 materials will have a negative surface charge at this pH value.
By contrast, the results of the characterization by the BET technique indicate that the values of the specific surface area (ABET) of Clay-K, BFS, and TiO2/Fe2O3 samples are 14.93 m2/g, 5.69 m2/g, and 66.59 m2/g, respectively.
The chemical and structural characterizations of the TiO2/Fe2O3, Clay-K, and BFS samples were performed by infrared spectroscopy and X-ray diffraction. Figure 3 shows the infrared spectra of each of the samples. The infrared spectrum of the BFS sample presents absorption bands characteristic of the C-H bond stretching, which are at 2900 cm−1 and the vibrations of the C-H and C=O bond at 1560 cm−1, respectively; these absorption bands may be associated with the carbon present in this sample. An absorption band is also observed at 1030 cm−1 corresponding to the Si-O stretch, as well as other less intense absorption bands at lower values, which may be associated with the vibration of the M-O bond where M represents Si and Fe since this sample contains mainly silicon oxide and iron oxides in lesser amounts. The absorption bands at values less than 999 cm−1 that have been associated with the Si-O-Al bond of aluminosilicates are also observed.
Alternatively, the infrared spectrum of the Clay-K sample presents an absorption band in 999 cm−1, which is associated with the stretching of the Si-O bond of siloxane; the absorption bands at values less than 999 cm−1 that have been associated with the Si-O-Al bond of aluminosilicates are also observed. At 3619 cm−1 an absorption band corresponding to the stretching of O-H from the water contained in the crystal structure of this clay is also present [31].
The FTIR-ATR spectrum of the TiO2/Fe2O3 sample has characteristic bands of absorption of TiO2; at values lower than 800 cm−1 the presence of an absorption broadband corresponding to the vibration of the Ti-O bond is observed; the absorption bands of the stretch and vibration of the O-H bond are presented in 3170 cm−1 and in 1630 cm−1, with both bands being associated with the hydroxylated surface of the TiO2/Fe2O3 sample. Wu et al. also observed the same peaks close to 1630 cm−1, which is attributed to the stretching vibration of the corresponding –OH derived from the hydroxyl radical or the adsorbed water on the TiO2 surface [32].
Figure 4a presents the diffractograms of the BFS and Clay-K samples. The diffractograms of both samples show the characteristic diffraction peaks of SiO2 in the crystalline form of quartz (PDF # 46-1045) and the characteristic diffraction pattern of kaolinite clay (PDF # 14-0164). Additionally, in the diffractogram of the BFS sample, the presence of diffraction peaks that correspond to carbon graphite (C) is observed (PDF # 26-1079).
In contrast, the diffractogram of the Sample TiO2/Fe2O3 presents the diffraction peaks characteristic of the TiO2 phase anatase (PDF # 21-1272) and of the Fe2O3 hematite phase (PDF # 33-0664) (Figure 4b); the diffraction peak of the plane (101) of the anatase presents a slight displacement to higher degrees, possibly due to a small change in the volume of the cell; this can also be associated with the formation of the TiO2/Fe2O3 composite.
Figure 5 shows the absorption spectra of the three samples; it is observed that the maximum absorption peaks of the TiO2/Fe2O3 composite are in the UV region (326 nm) and visible region (520 nm) indicating that it can be excited with UV and visible light. In general, in this figure, both the Clay-K and BFS samples as well as the TiO2/Fe2O3 composite absorb light over a wide region of the electromagnetic spectrum from 200 nm to 1000 nm so that UV, visible, and near infrared light can be used to photoactivate them.

3.2. Removal of Cyanide by Adsorption and Photocatalysis

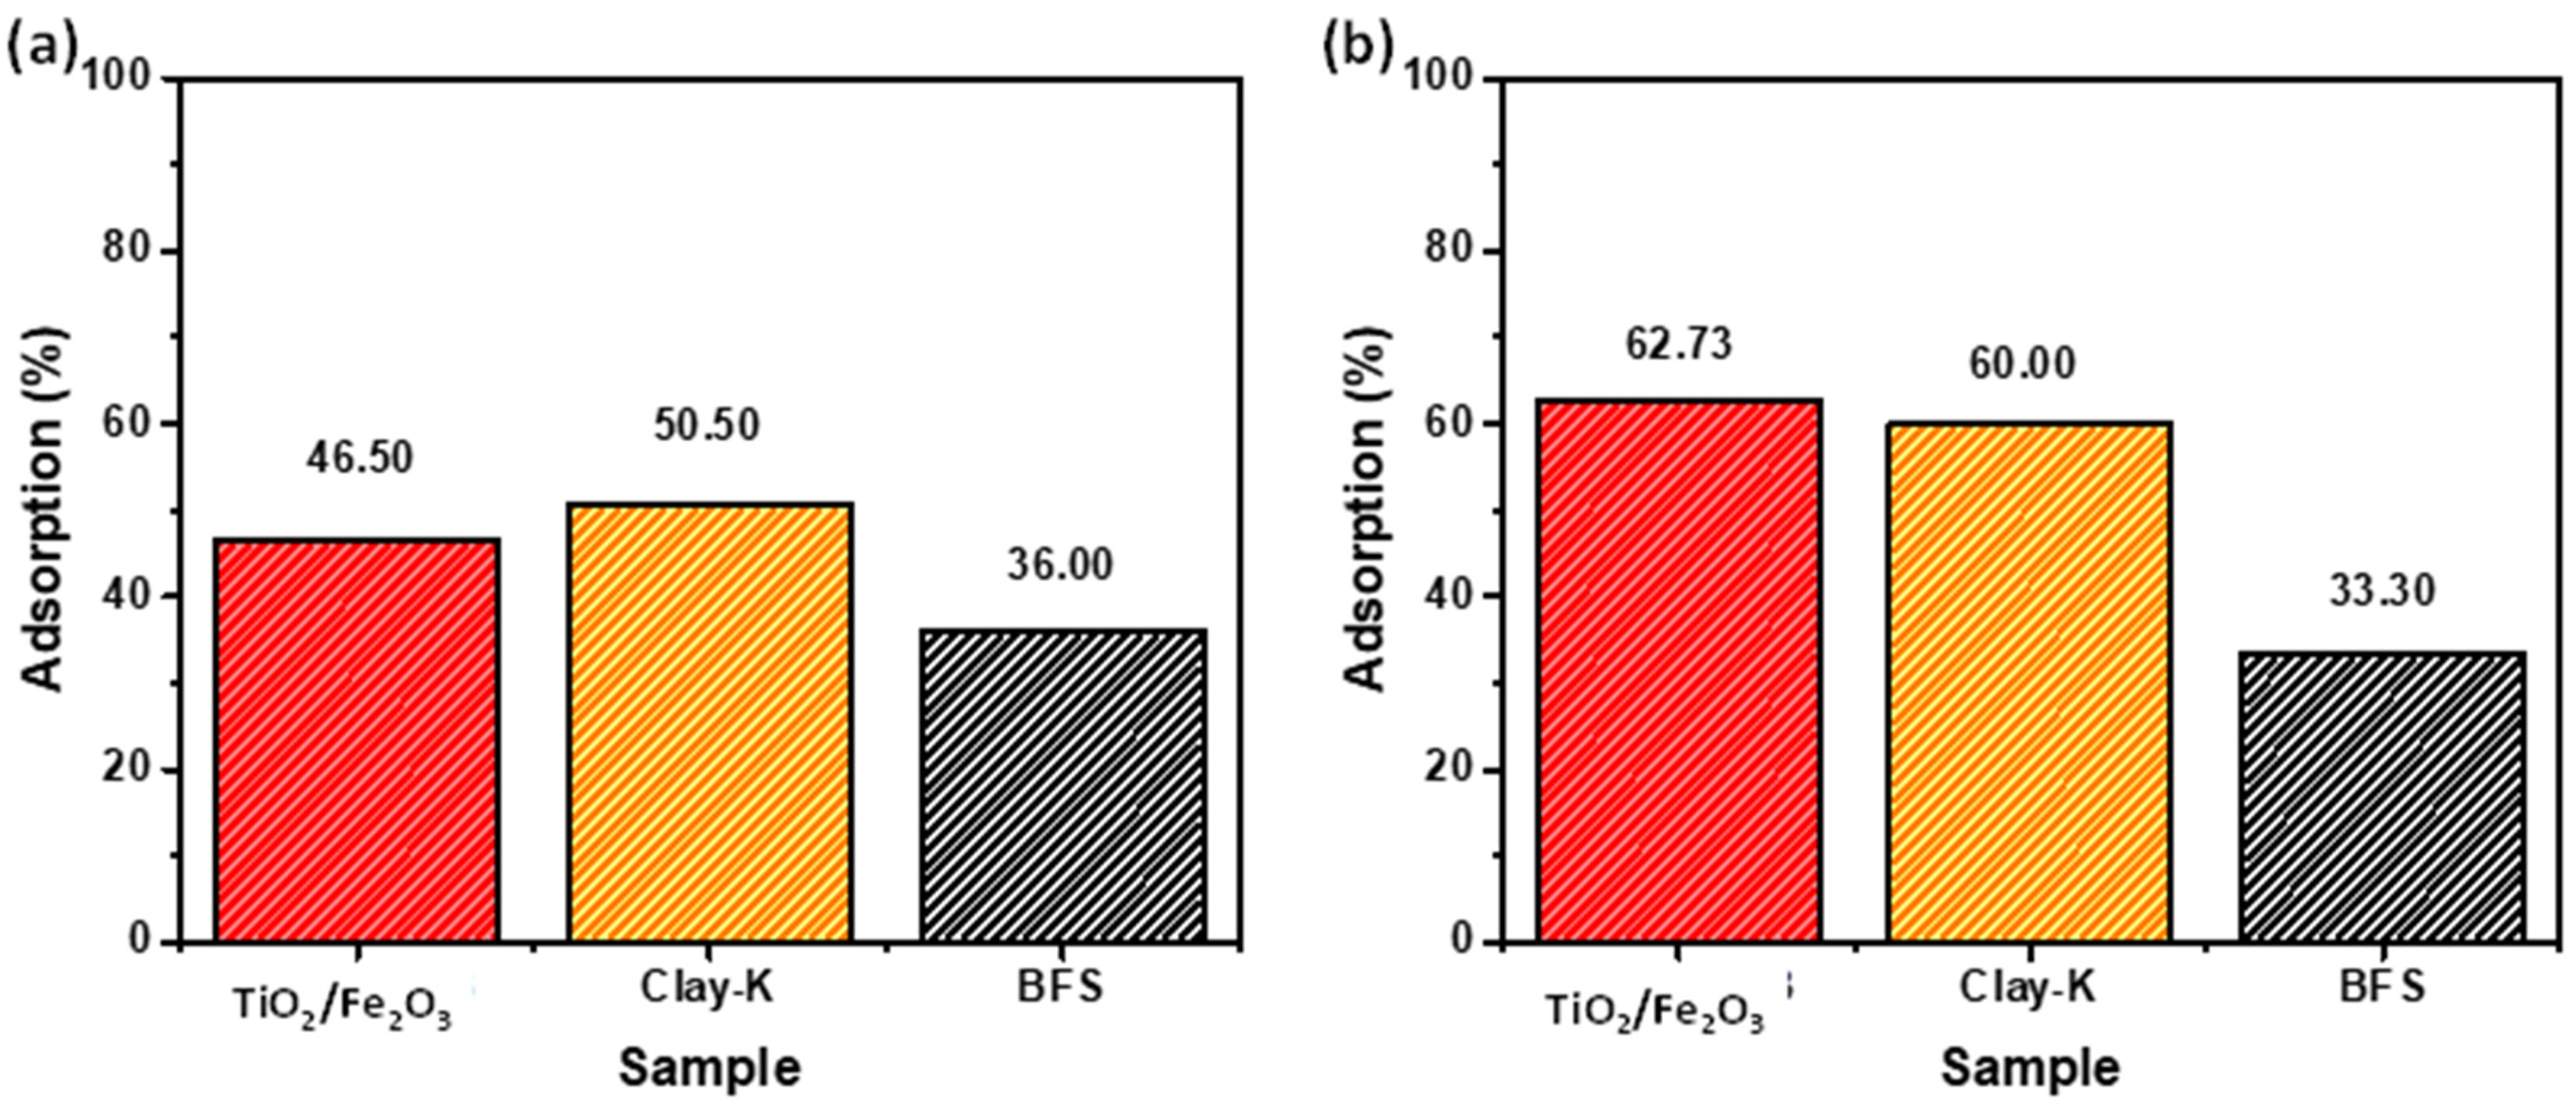
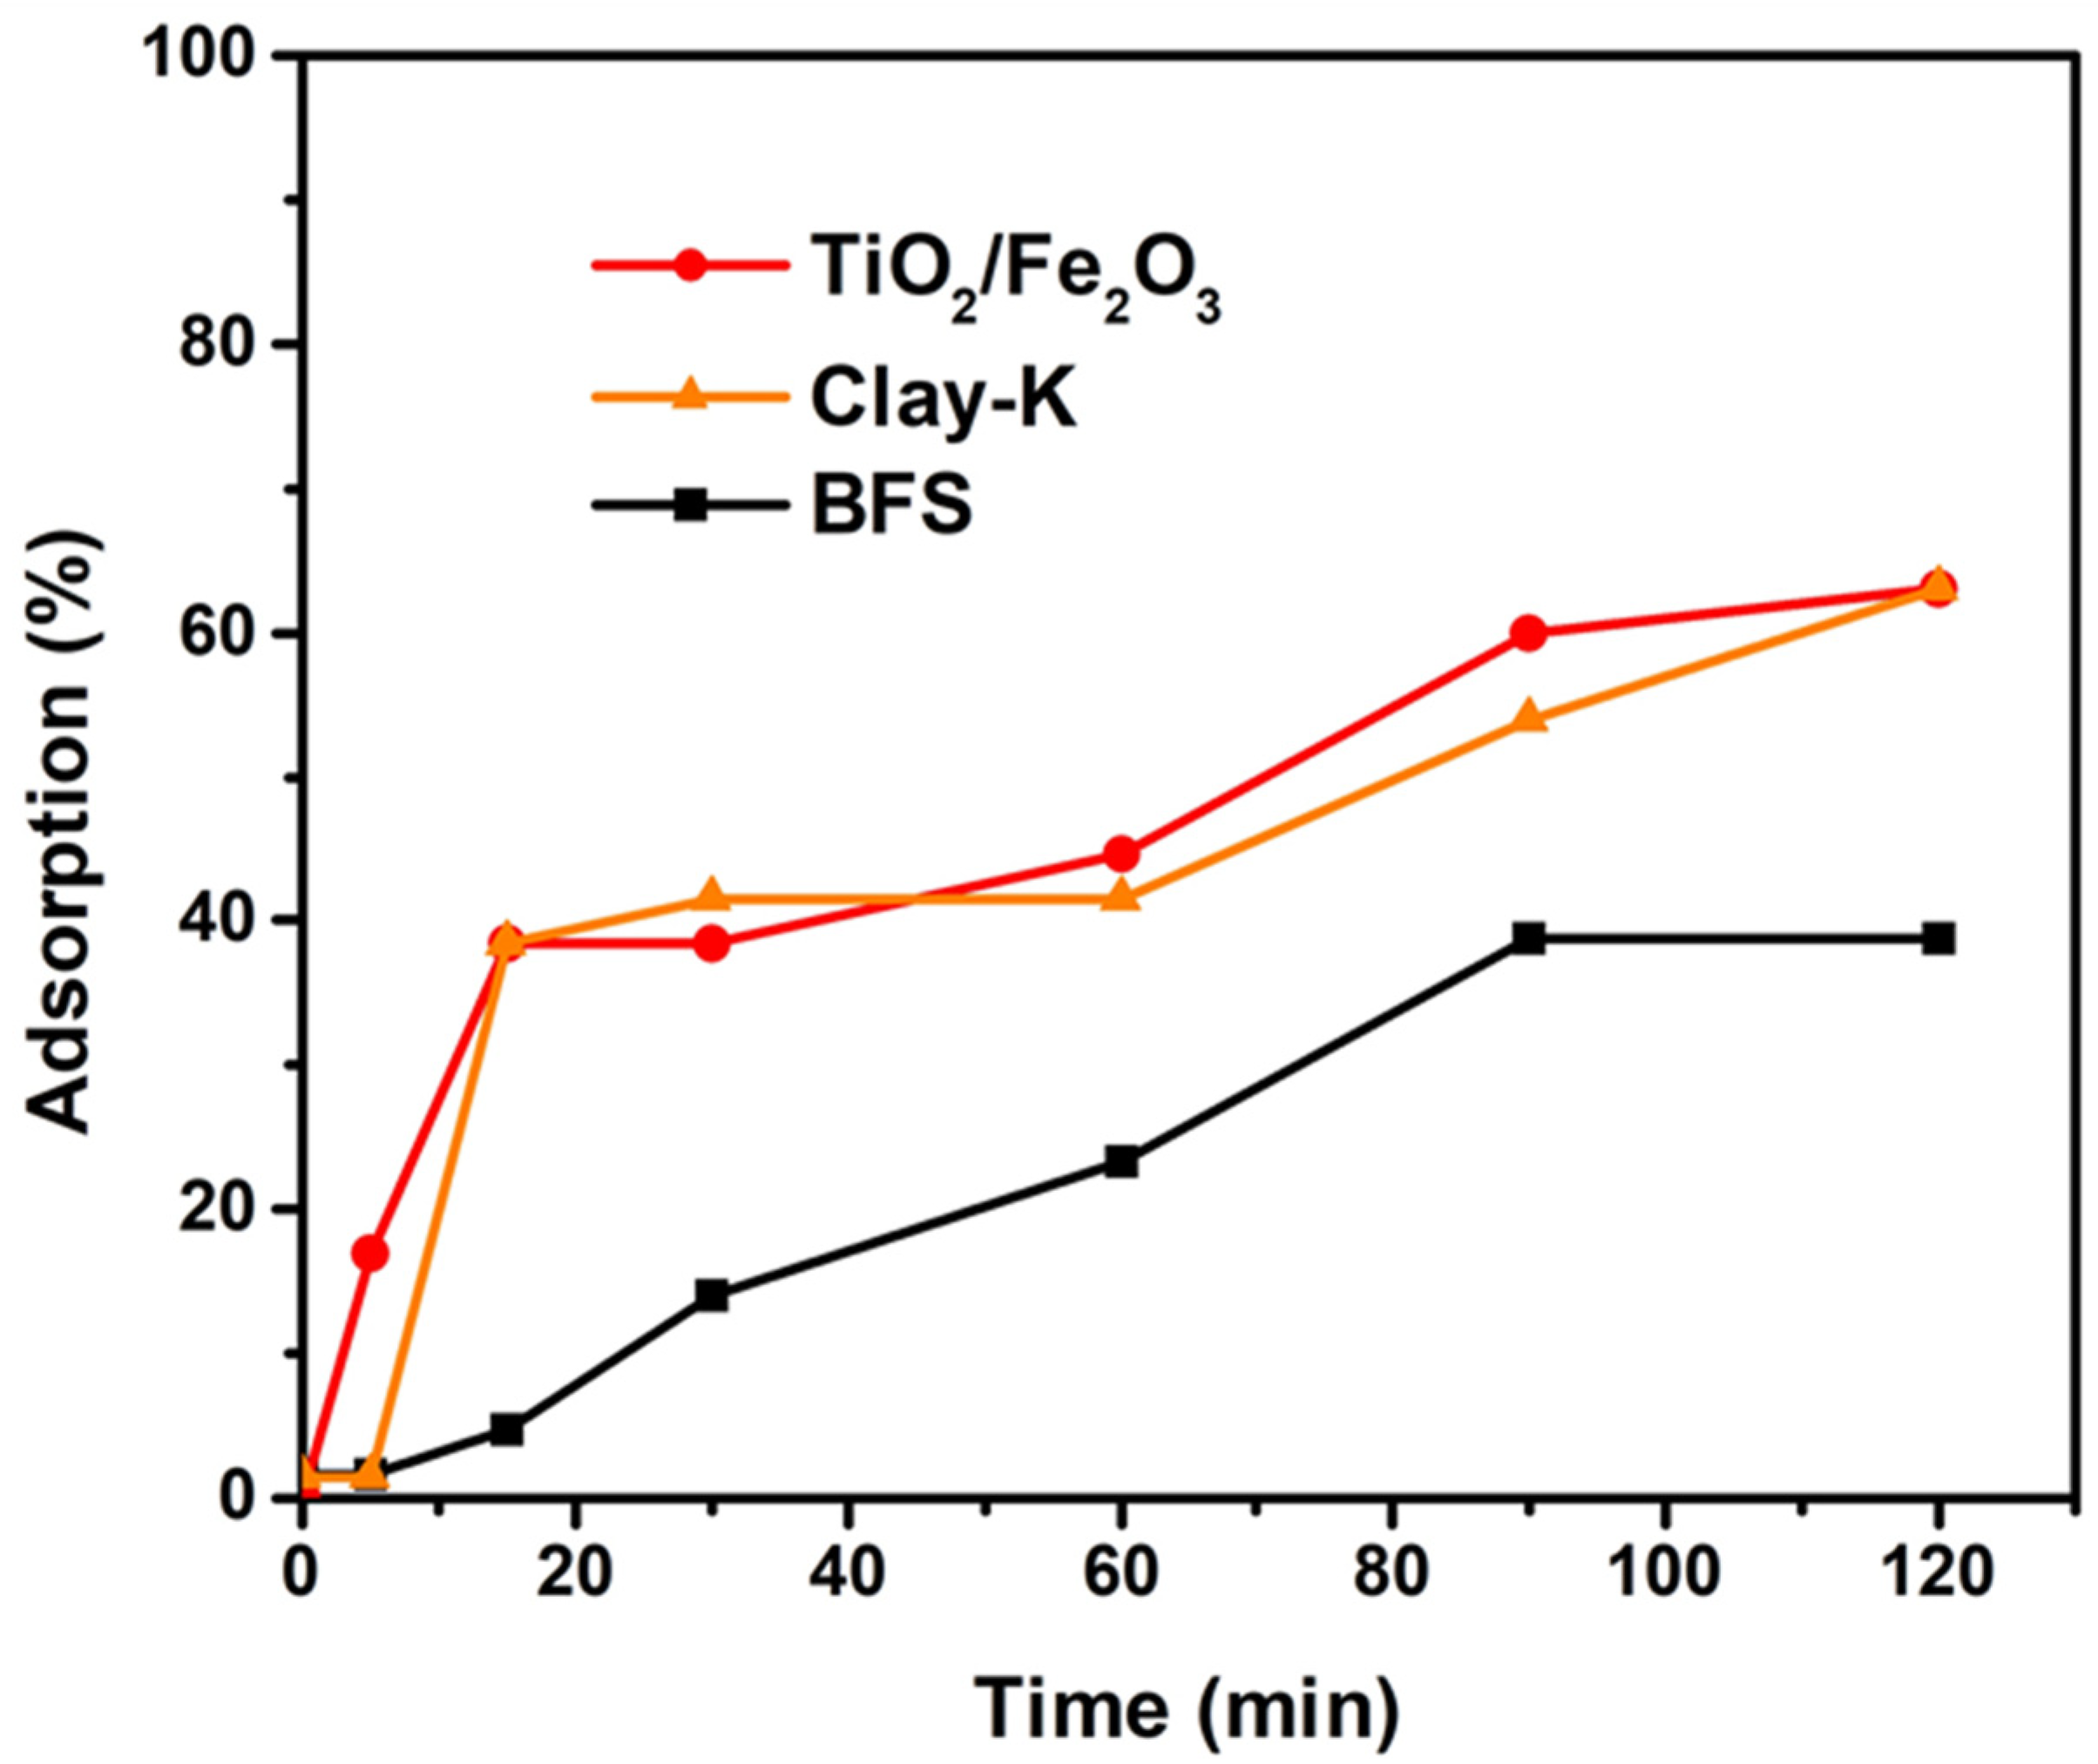
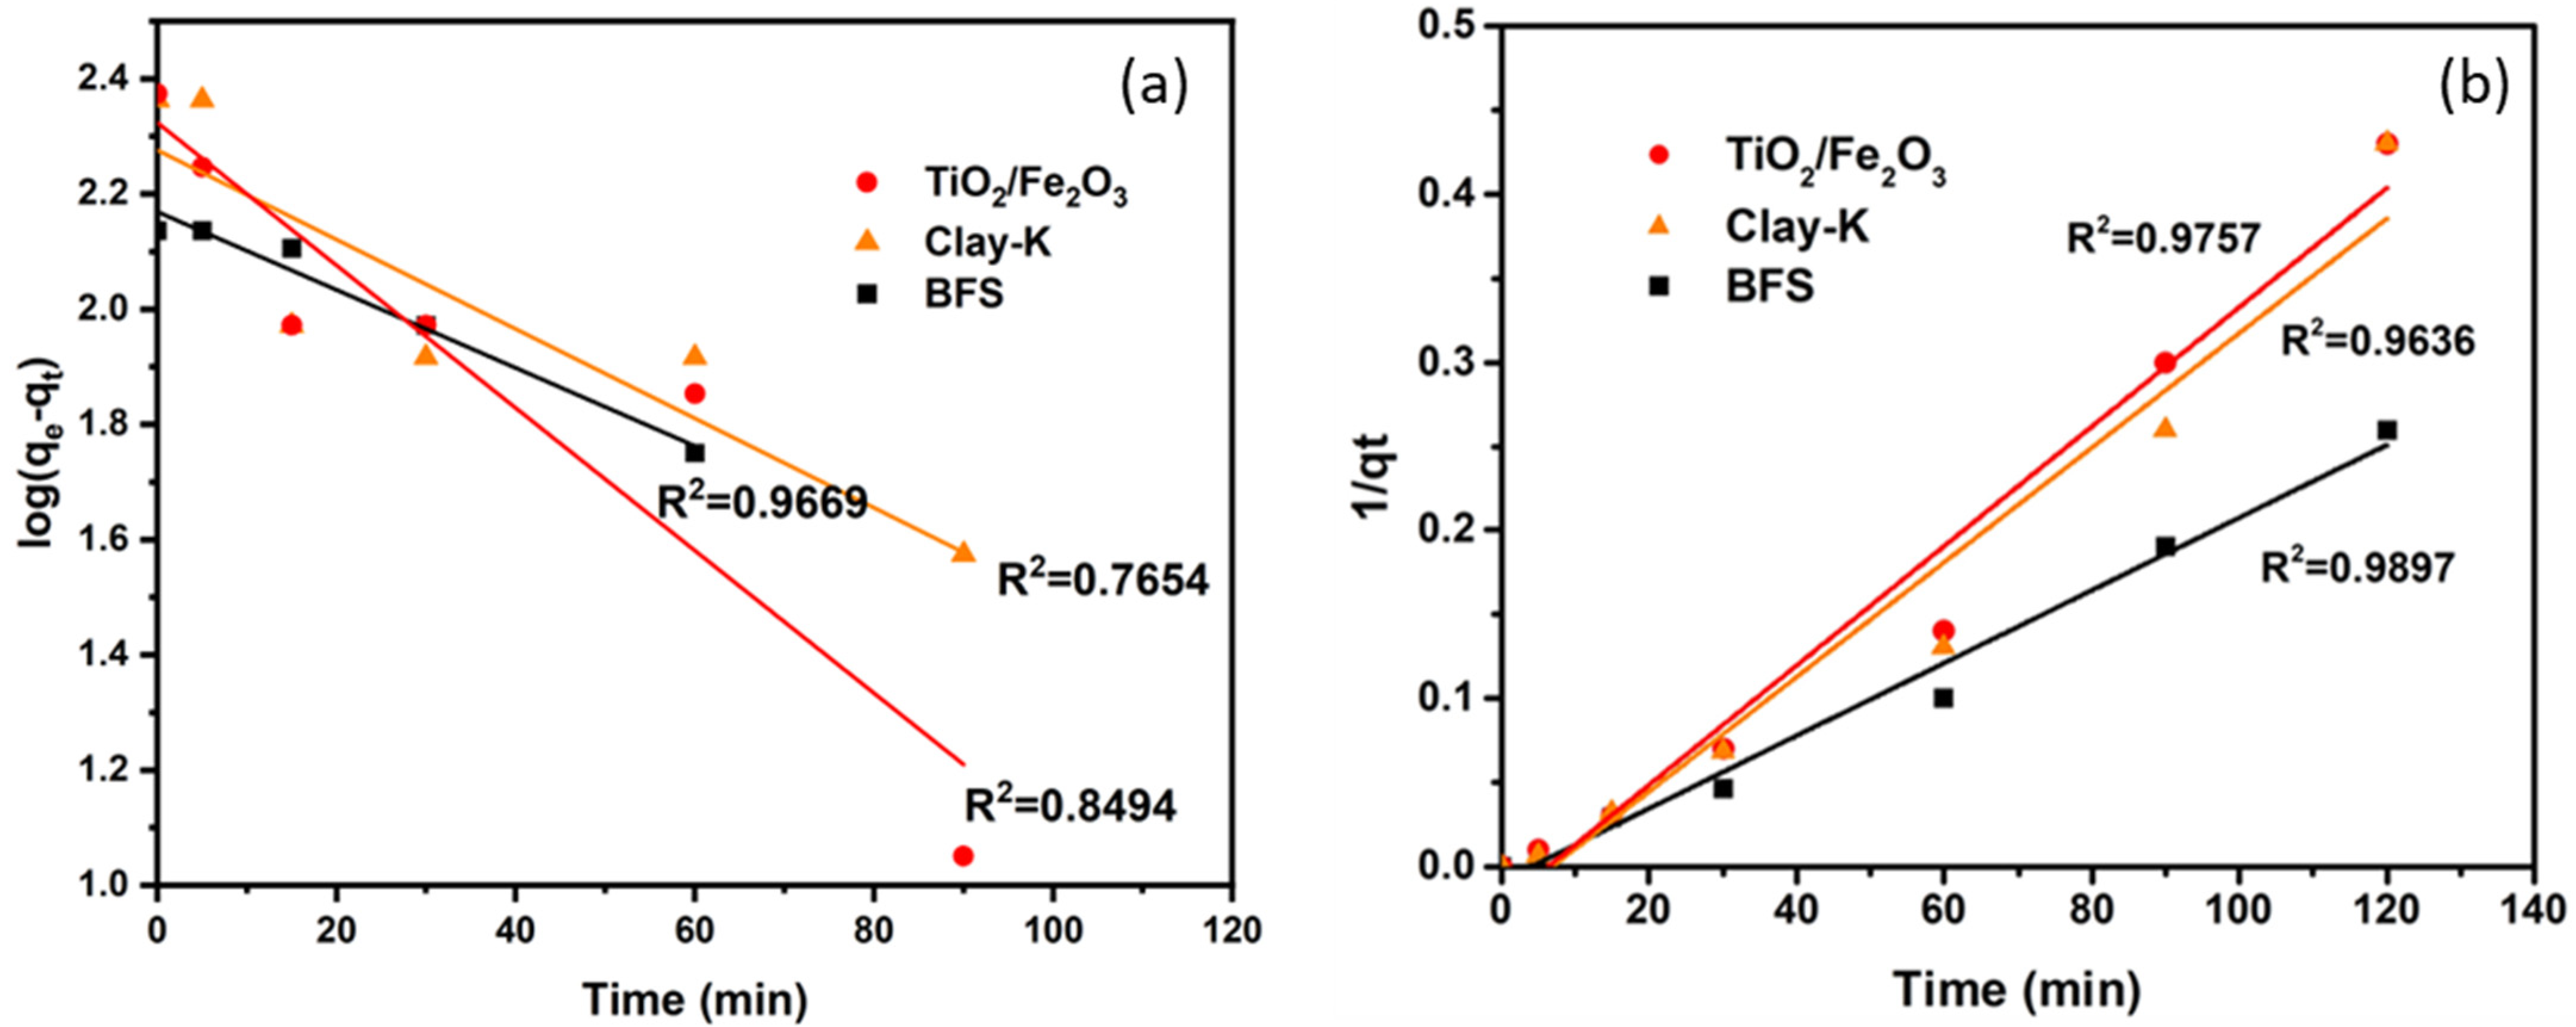
3.2.1. Cyanide Adsorption

Figure 6 shows the cyanide removal values for each sample at the initial NaCN concentrations of (a) 250 and (b) 750 mg/L. For an initial NaCN concentration of 250 ppm, the TiO2/Fe2O3 and Clay-K samples showed similar cyanide removal values, 46.5% (174.37 mg/g) and 50% (187.50 mg/g), respectively It is clear that the cyanide removal value of BFS was significantly lower with only 36% (135 mg/g). Similar trends in cyanide removal values were observed in Figure 6b for the three samples when the NaCN initial concentrations was 750 mg/L.
The extent of the cyanide adsorption process is determined, among other factors, by (a) the morphology of the materials, such as surface area and porosity, (b) the nature of the functional groups formed on the material surface when they come into contact with the solution, (c) the operating conditions, such as the cyanide initial concentration, the solution initial pH, and the temperature, and (d) the interface conditions that are established when the material is contacted with the cyanide aqueous solution. Based on the fact that the operating conditions used in the study were the same for all samples, the differences observed in cyanide removal values (or in the cyanide adsorption capacity) were due to processes dependent on the sample properties, both the morphology and chemical surface as well as in the interface conditions during the adsorption process. Results included in Table 1 indicate that the surface area of the samples BFS and Clay K, 5.69 and 14.93 m2/g, were relatively low for an adsorbent material. These surface area values also suggest that the samples were practically non-porous in such a way that the adsorption process in these materials only occurred in the external area. On the other hand, the TiO2/Fe2O3 sample exhibited an area of 66.59 m2/g, which was higher compared to the residue samples, and it also suggested the presence of pores in the structure. As a result, the TiO2/Fe2O3 sample had greater potential to promote physical phenomena associated with the availability of surface area. Results shown in Figure 6 indicated that the cyanide removal (or cyanide adsorption capacity) of the BFS sample (36%, 135 mg/g) was lower than that corresponding to the Clay-K sample (50.50 %, and 187.5 mg/g). This result was consistent with the relative surface areas of both samples, and it initially suggested the occurrence of a cyanide physisorption process. Thus, a noticeable increase in cyanide removal (or cyanide adsorption capacity) was expected for the TiO2/Fe2O3 sample (46.50%, 174.37 mg/g). However, Figure 6 shows that the removal of cyanide from the aqueous solution by the TiO2/Fe2O3 sample was even slightly lower than that of the Clay-K sample, which had a smaller surface area. Consequently, it was evident that the adsorption process involved processes of a chemical nature that do not necessarily scale with the surface area.
In this regard, the chemical adsorption process of cyanide in the materials used in this study can occur by different mechanisms. One of them is that adsorption is promoted by electrostatic type interactions that are established between the absorbent surface and the cyanide species in aqueous solution. It is well established that for the conditions of T and initial pH (pHo) used in this study, 25 C and pHo = 11, respectively, cyanide was found as a free anion in the solution. Conversely, the results of the zeta potential of the samples measured at pH = 7.0 (Table 1) suggested that the samples used in the study exhibited different types of surface groups when they are placed in contact with an aqueous solution of pHo = 11.0. The BFS sample showed a zeta potential of 27.13 mV, indicating that its isoelectric pint (pHIEP) is markedly greater than 7.0. Contrastingly, the TiO2/Fe2O3 sample showed a zeta potential of −1.60 mV, indicating that its pHIEP was slightly less than 7.0. Finally, the Clay K sample exhibited a zeta potential of −29.90 mV, indicating that its pHIEP was markedly lower than 7.0. Under these conditions, when the three samples used in this study were placed in contact with in a solution of pHo = 11.0, it was expected that their surface functional groups developed a preferentially negative charge. Consequently, electrostatic-type adsorption processes were not preferred for any of the three materials due to fact that the charge around the surface was of the same type as that of CN- in solution. In closer detail, depending on the results of Zeta potential and pHIEP, the relative magnitude of the negative charges developed around the surface of the materials increased in the following order: BFS < TiO2/Fe2O3 < Clay K. By For this reason, an electrostatic type of adsorption of CN- would be favored in the following order: BFS > TiO2/Fe2O3 > Clay K. Clearly, this expected trend was different from the experimentally observed one, suggesting that the CN- removal process in aqueous solution implied the occurrence of other types of surface chemical processes. Based on results from the literature, an alternative is that CN- in solution formed cyanide complexes on the material surface. Based on the results in Figure 6, the formation of these chemical complexes was less preferred in the BFS and took place to similar extents for TiO2/Fe2O3 and Clay-K. The chemical compositions of the Clay K and TiO2/Fe2O3 samples indicated the presence of metal oxides that may be responsible for metal cyanide complexes that, in turn, are responsible for the decrease of cyanide concentration in the aqueous solution. The extent of this is effect was much lower in the case of the BFS sample. Finally, it is worth mentioning that the amount of cyanide removed from the aqueous solution by the three adsorbent materials used in this study was higher than that reported by Behnamfard et al. who investigated the removal of free cyanide in aqueous solutions by adsorption using kaolin. They obtained adsorptions of 2.5, 3, and 8 mg/g using crude, calcined, and kaolin treated with sulfuric acid, respectively [9].
Contrastingly, the results of cyanide adsorption in the three materials as a function of time at the initial NaCN concentration of 750 ppm are shown in Figure 7; it is observed that within 15 min of being in contact with the Clay-K and TiO2/Fe2O3 materials into cyanide solution, 40% adsorption is reached, while the BFS material only adsorbs 4.6% cyanide. At 120 min this same sample only adsorbs 38.76%, whereas Clay-K and TiO2/Fe2O3 samples adsorb up to 63%.
Mathematical models of the first and pseudo-second orders were used to configure the adsorption kinetics (Figure 8a and Figure 8b, respectively), with the pseudo-second order being the one with the best correlation, as indicated by the values of R2 equal to 0.9692, 0.9529, and 0.9845 for the kinetics of cyanide adsorption in the TiO2/Fe2O3, Clay-K, and BFS samples, respectively. The values of the apparent rate constant of the pseudo first and second orders, K1 and K2, respectively, are also listed in Table 2; the constant rate of cyanide adsorption in BFS material was lower than in the other two materials.

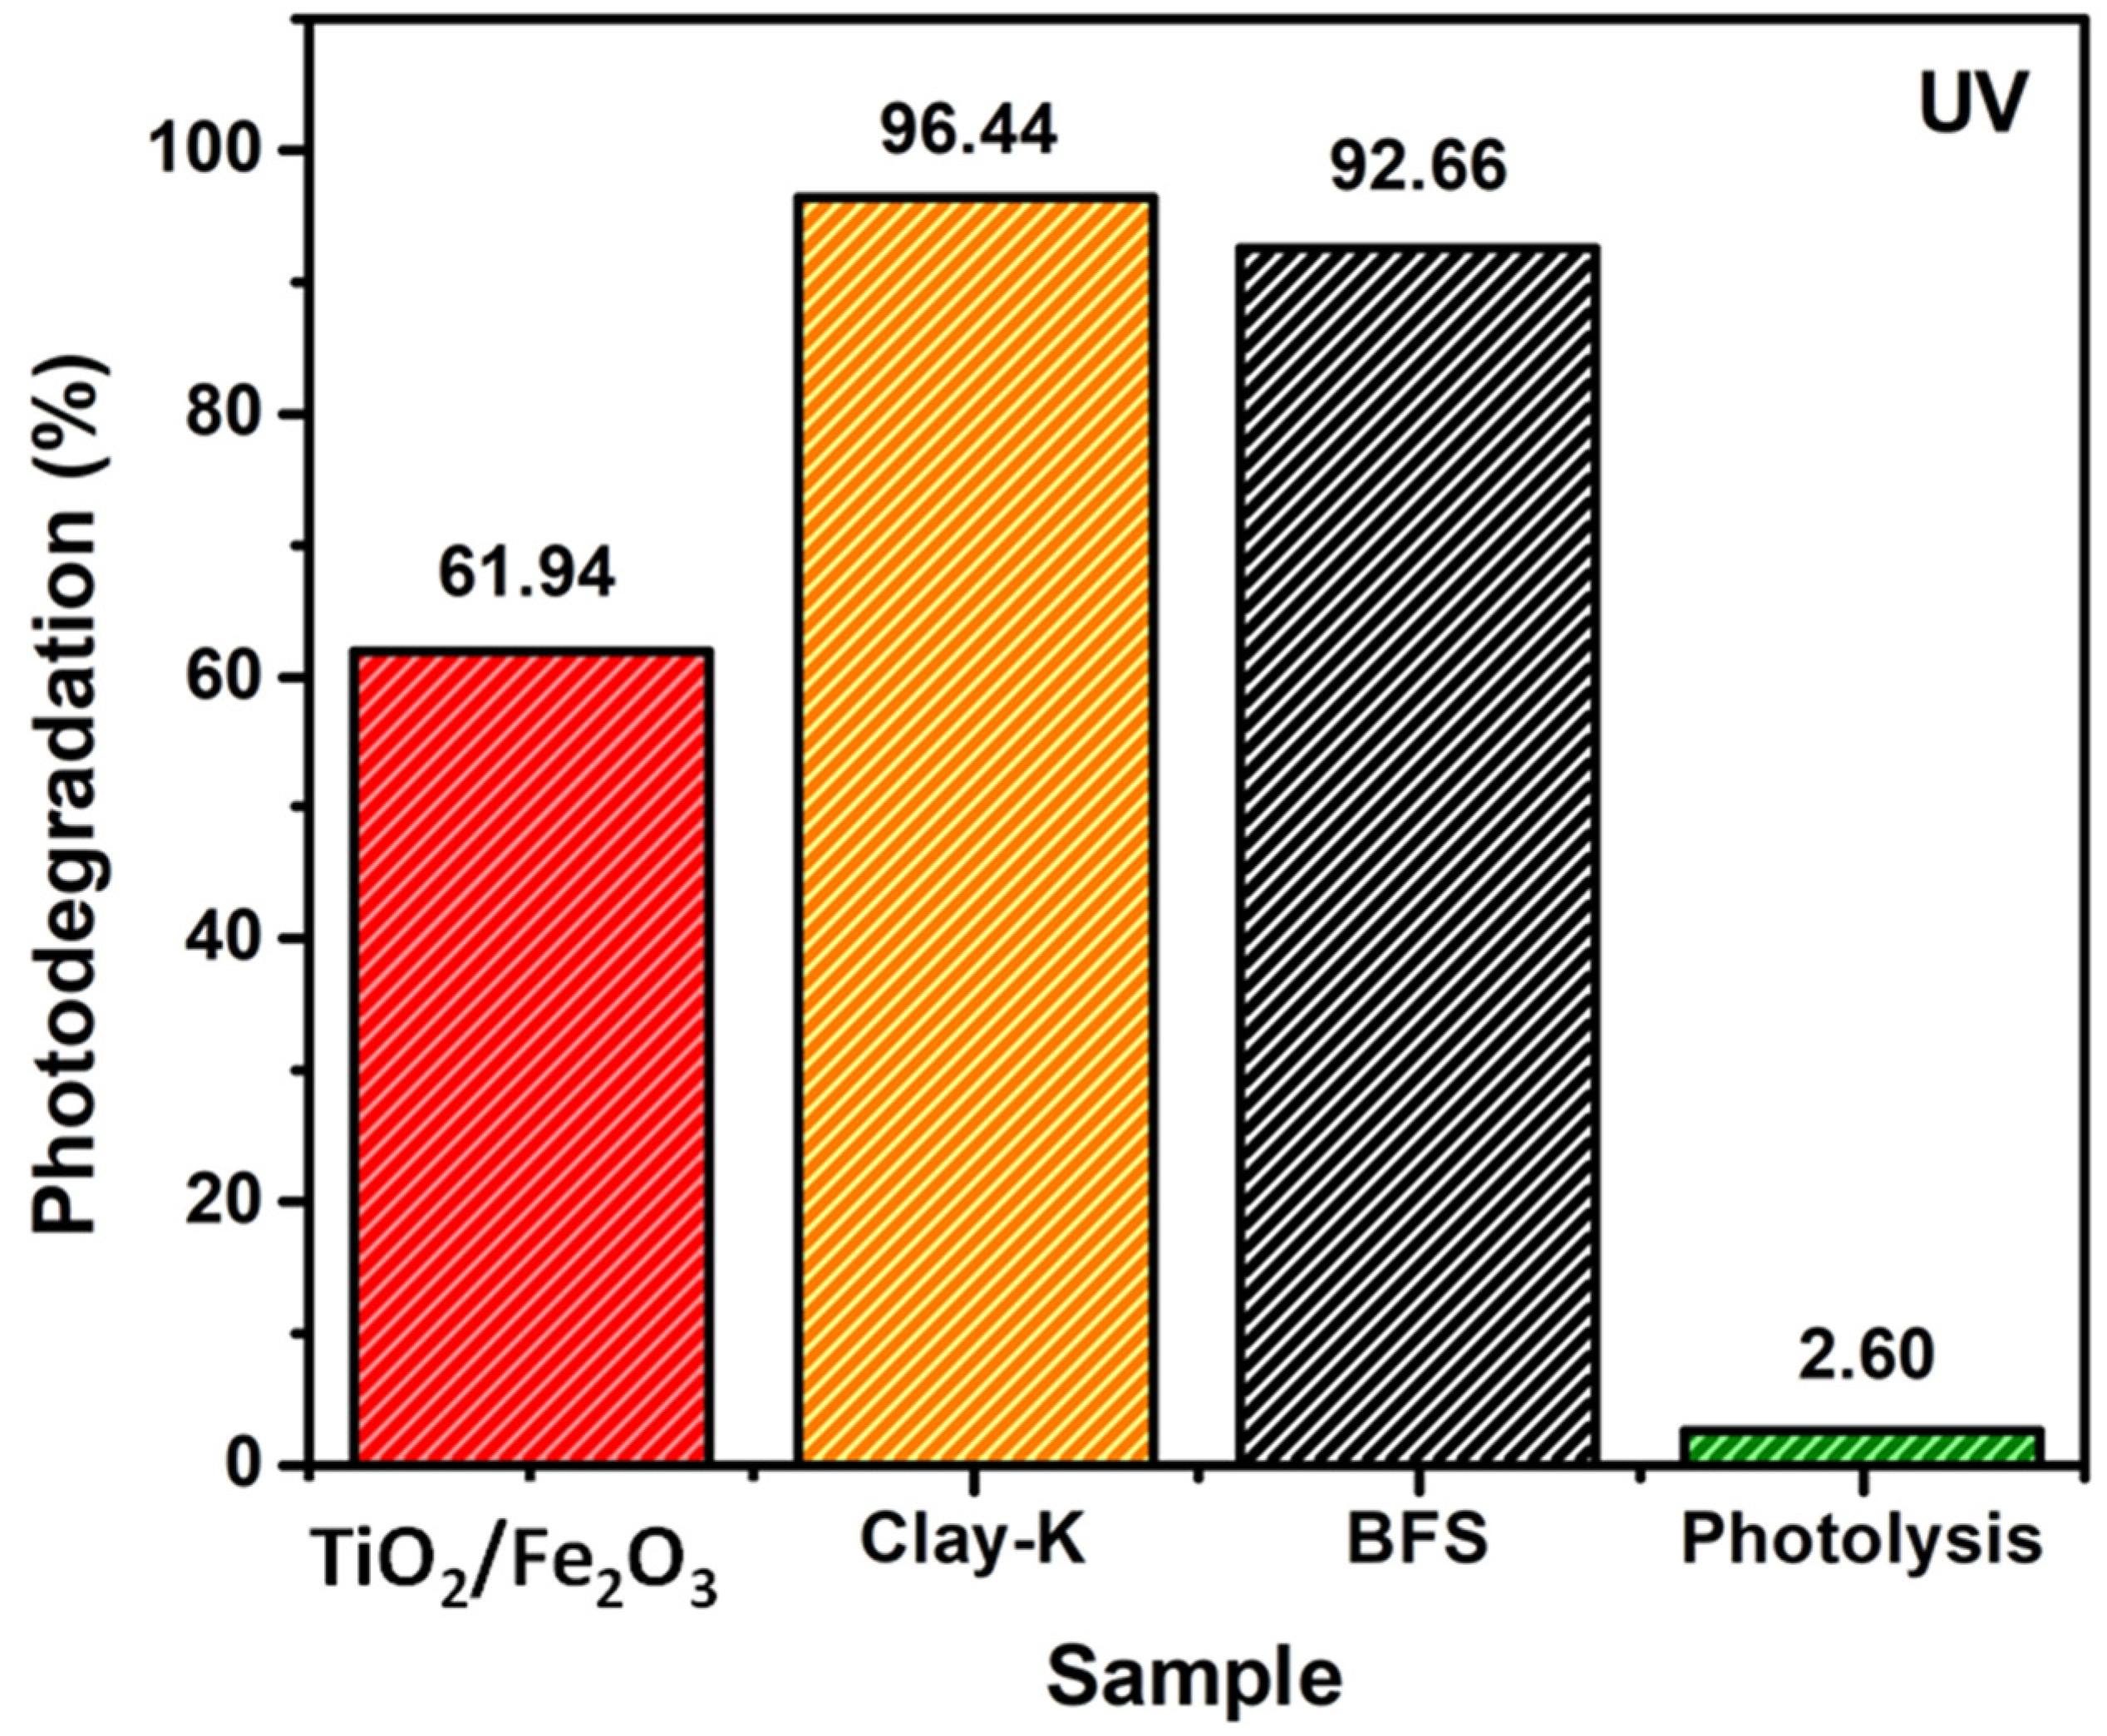
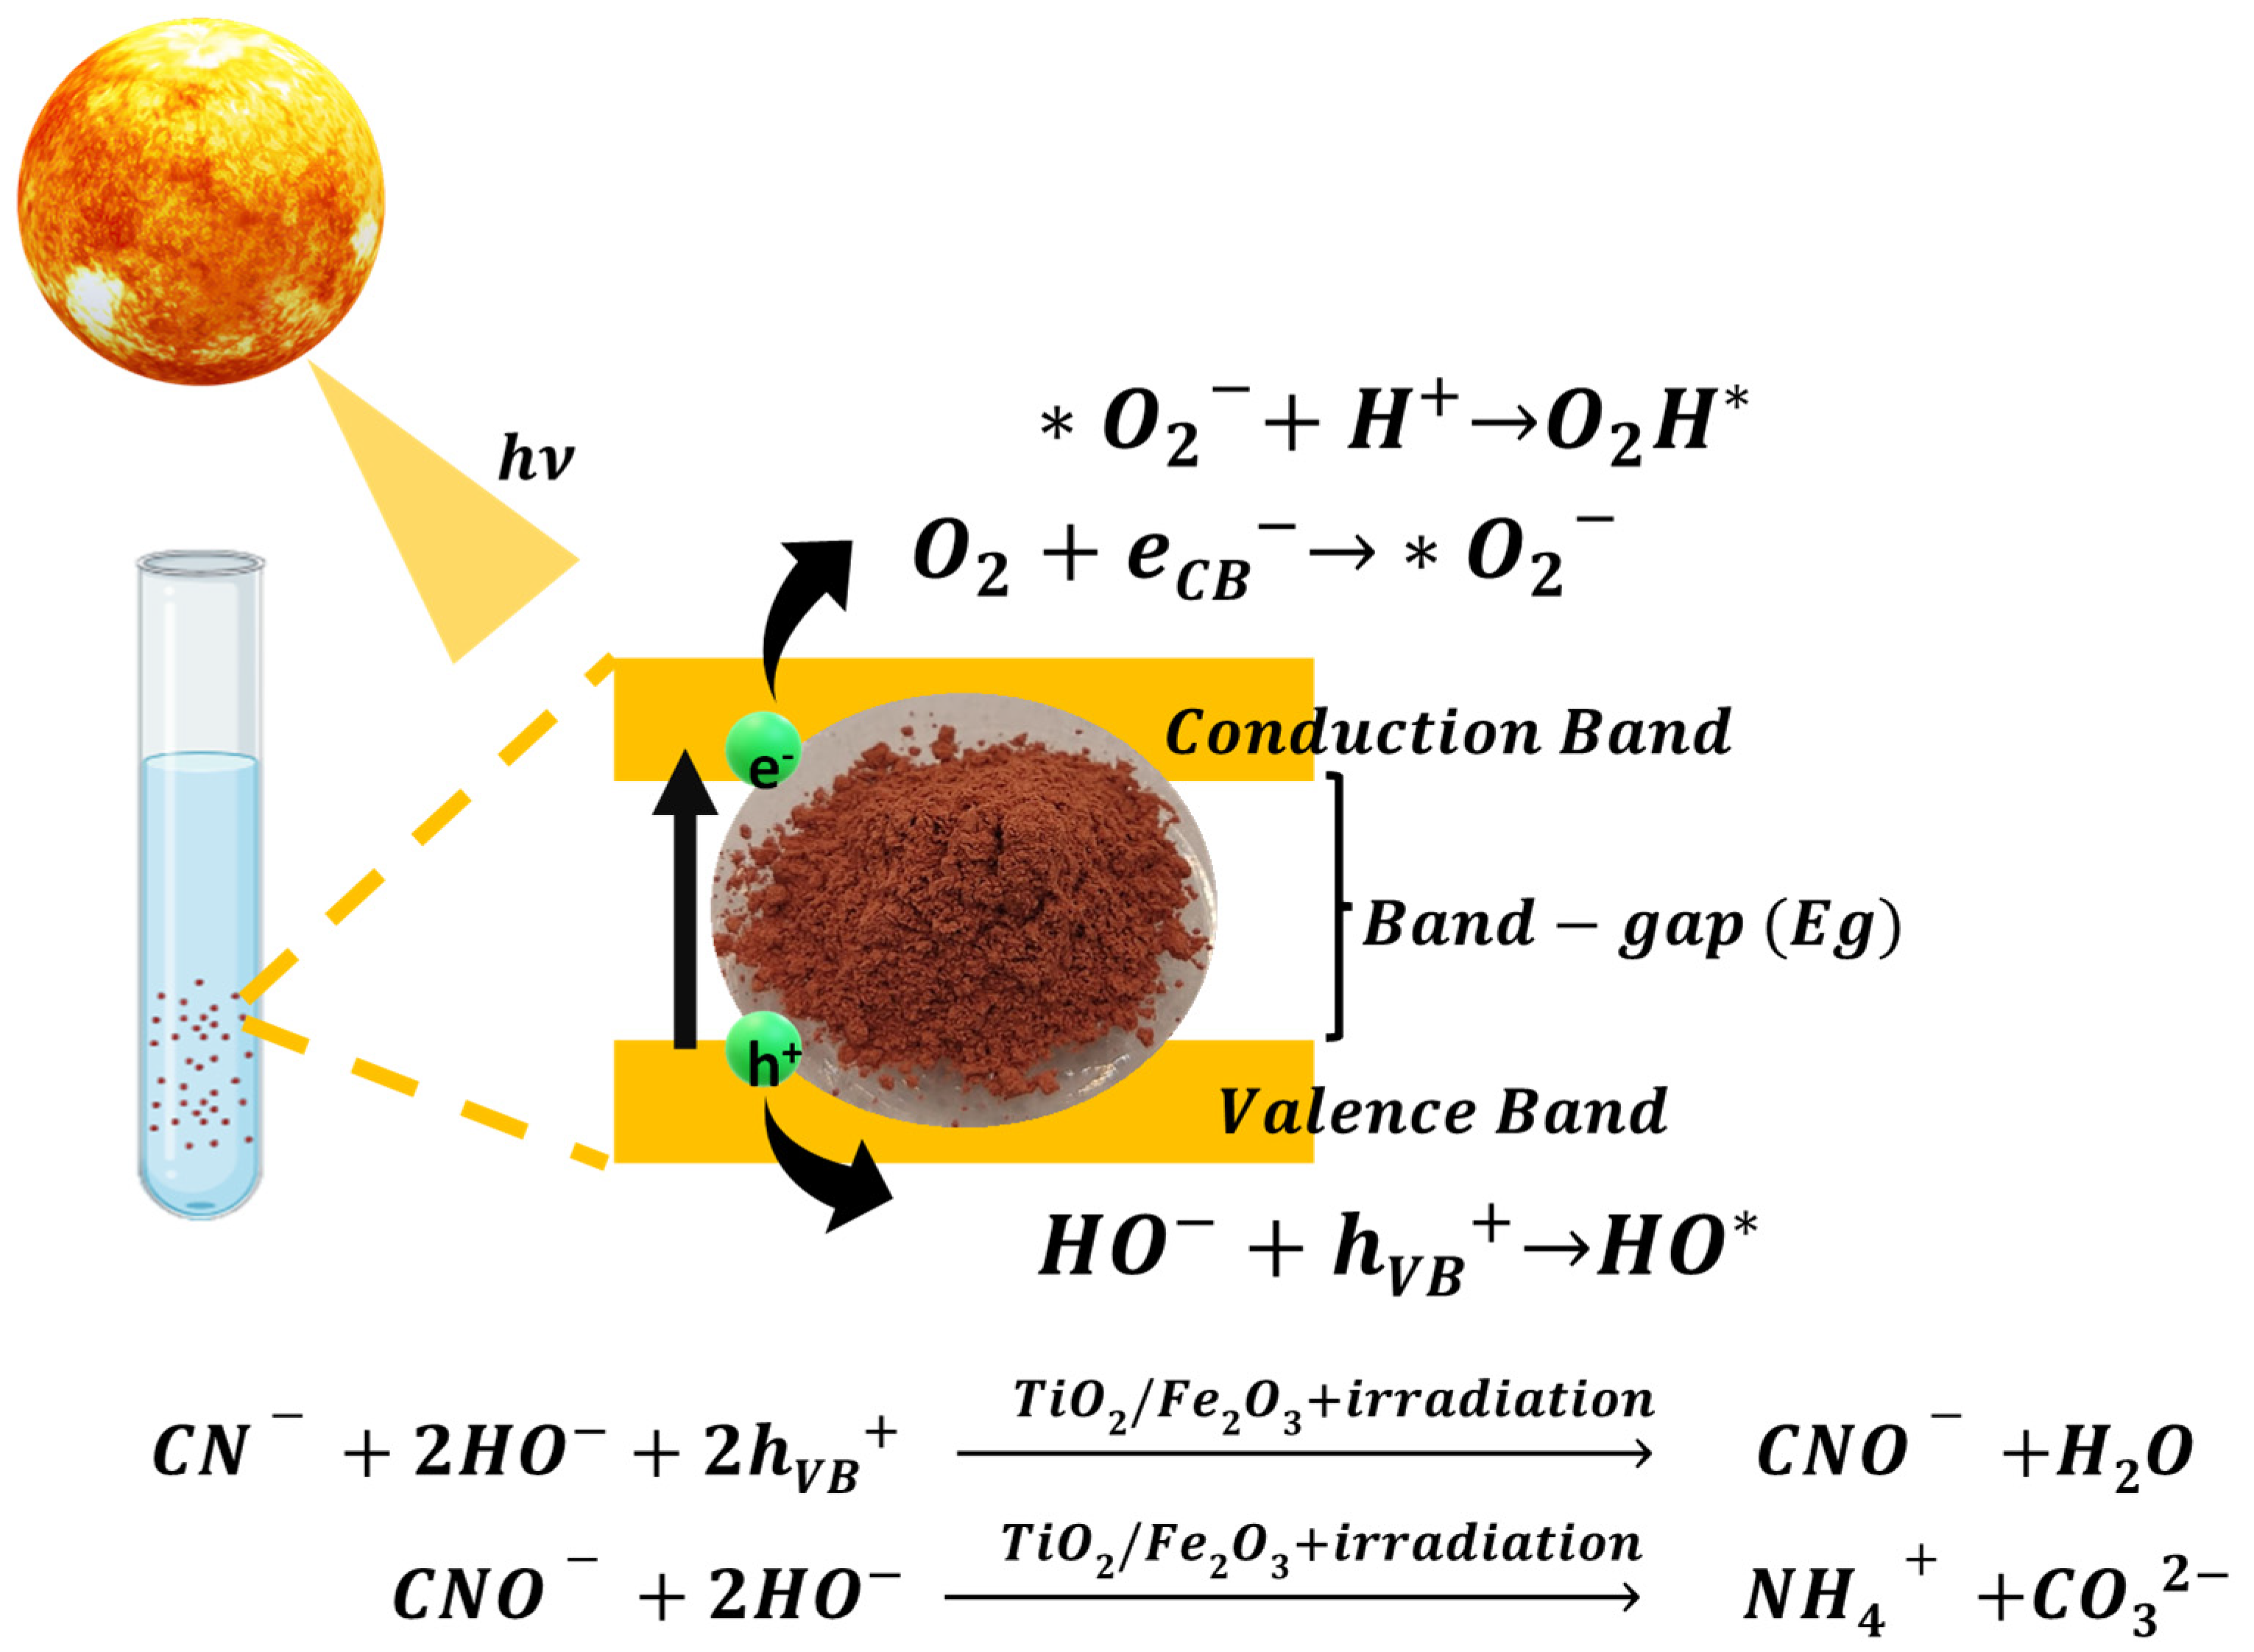
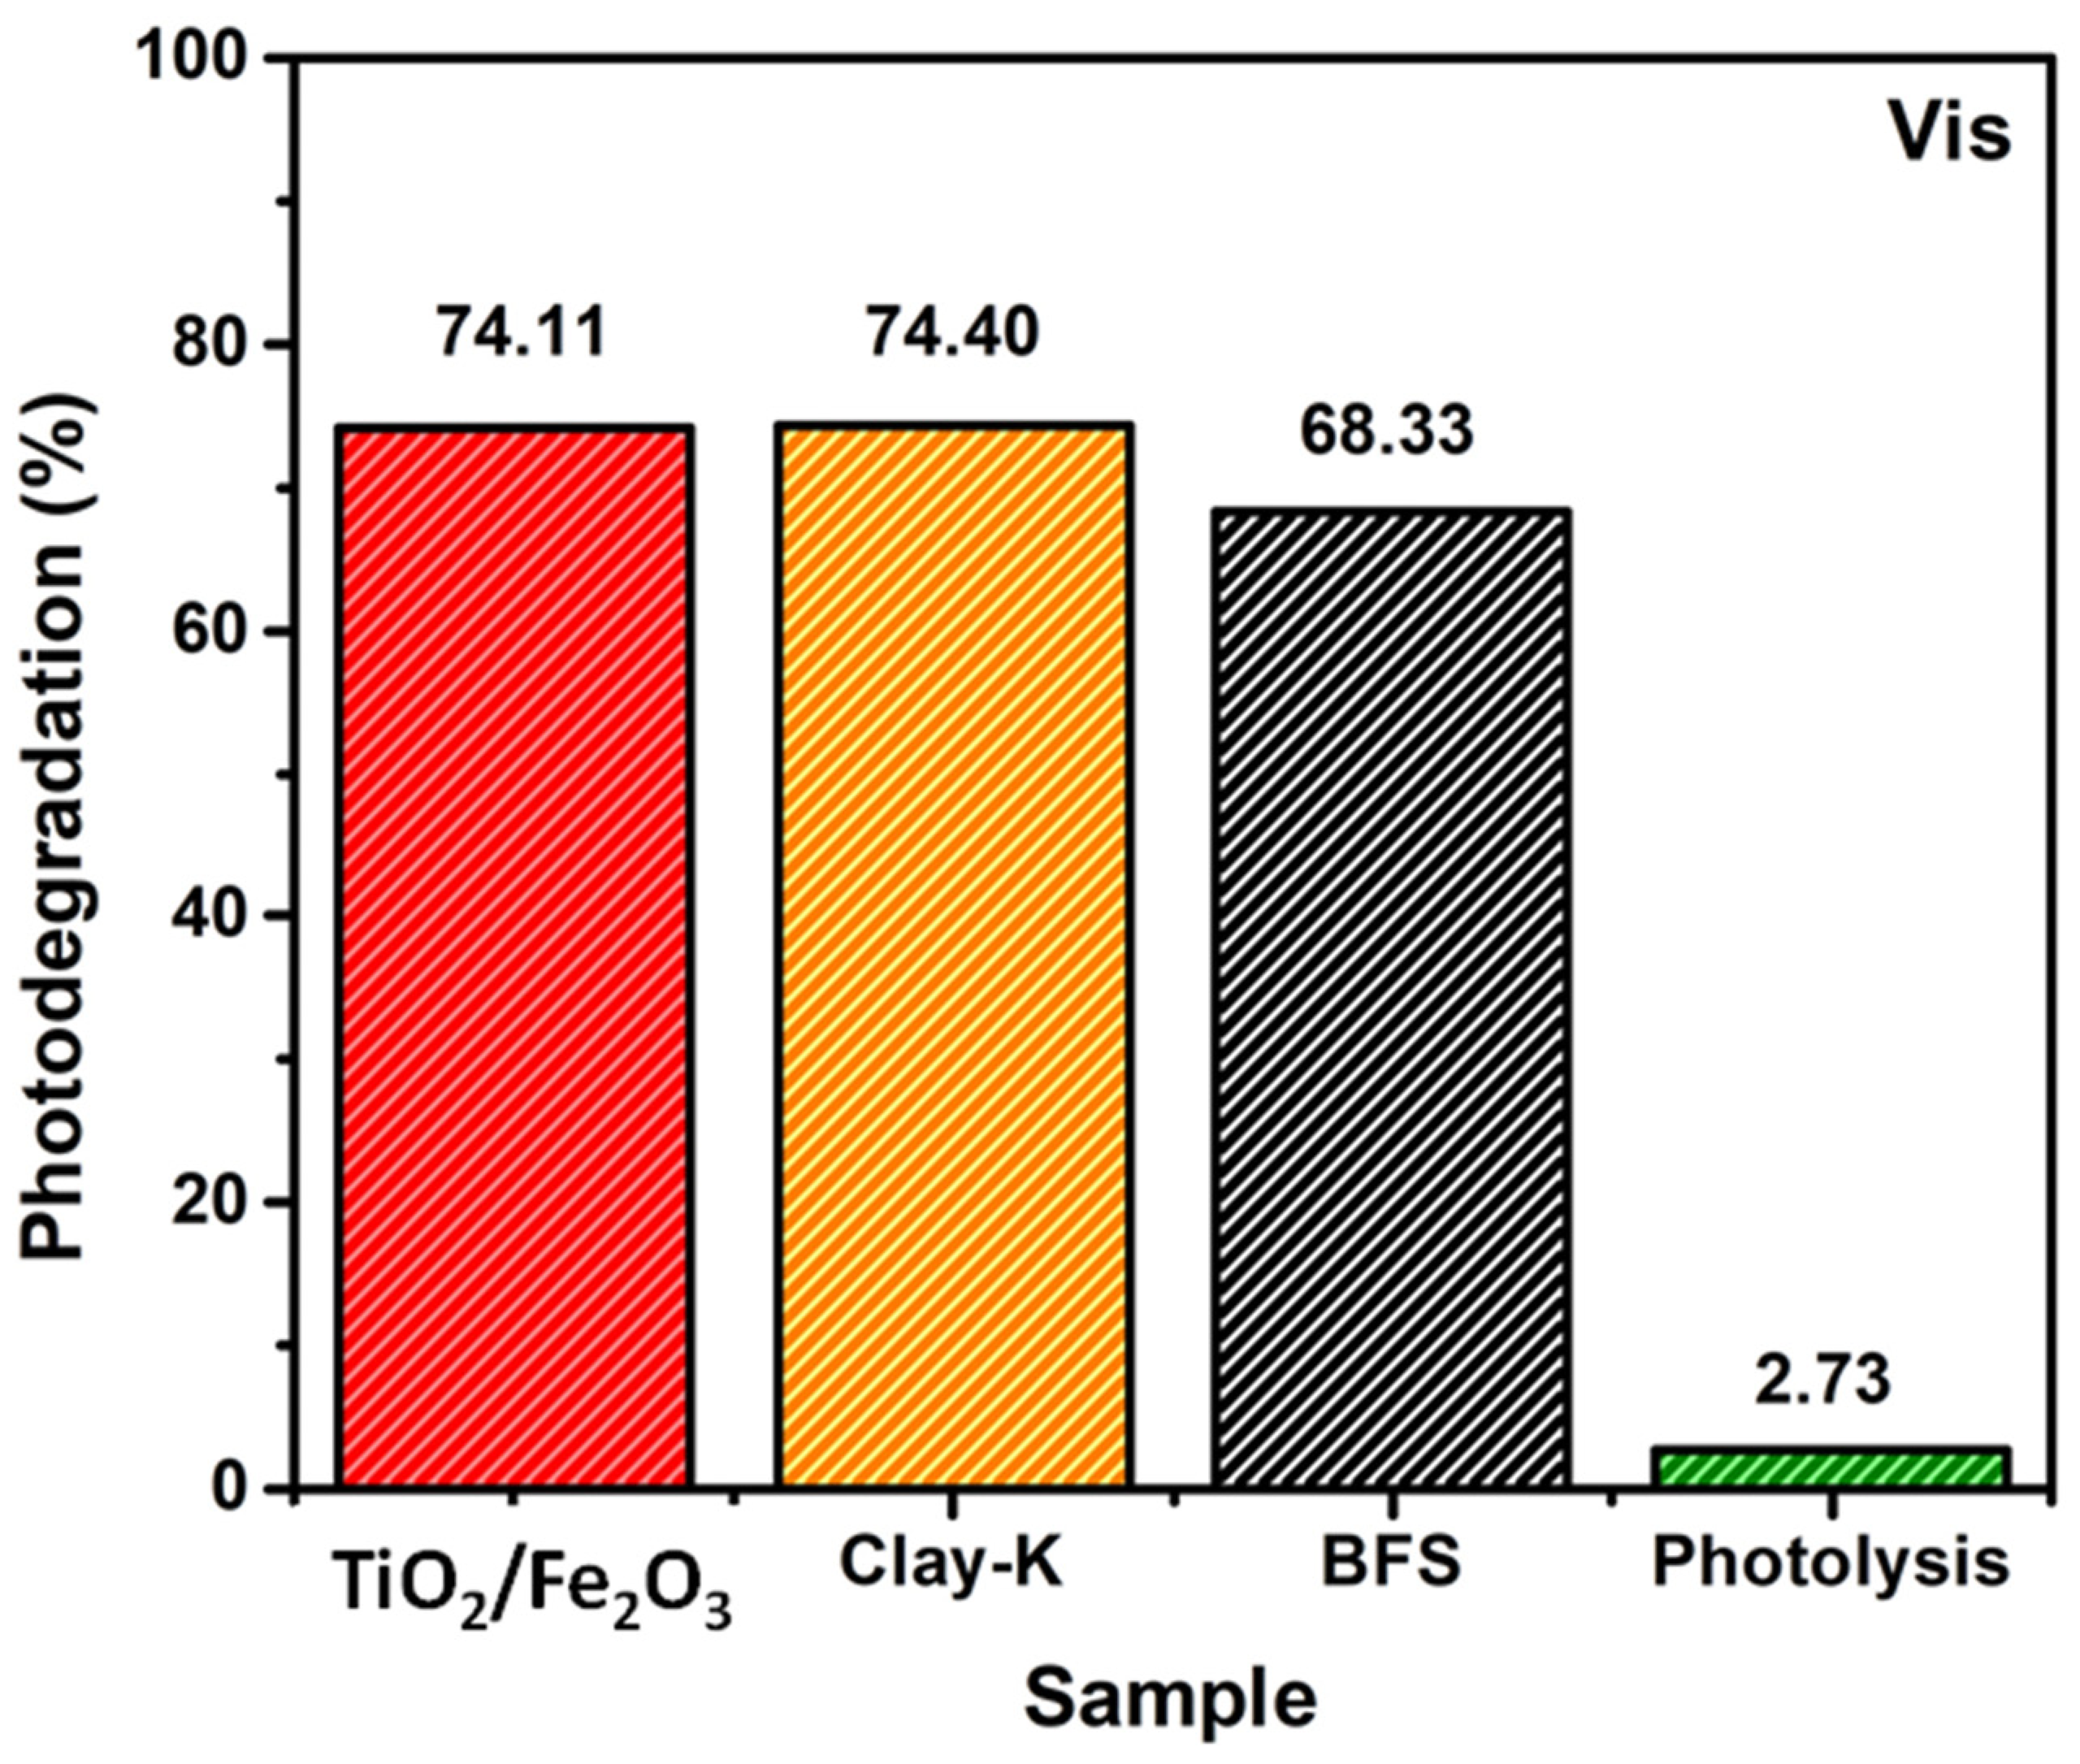
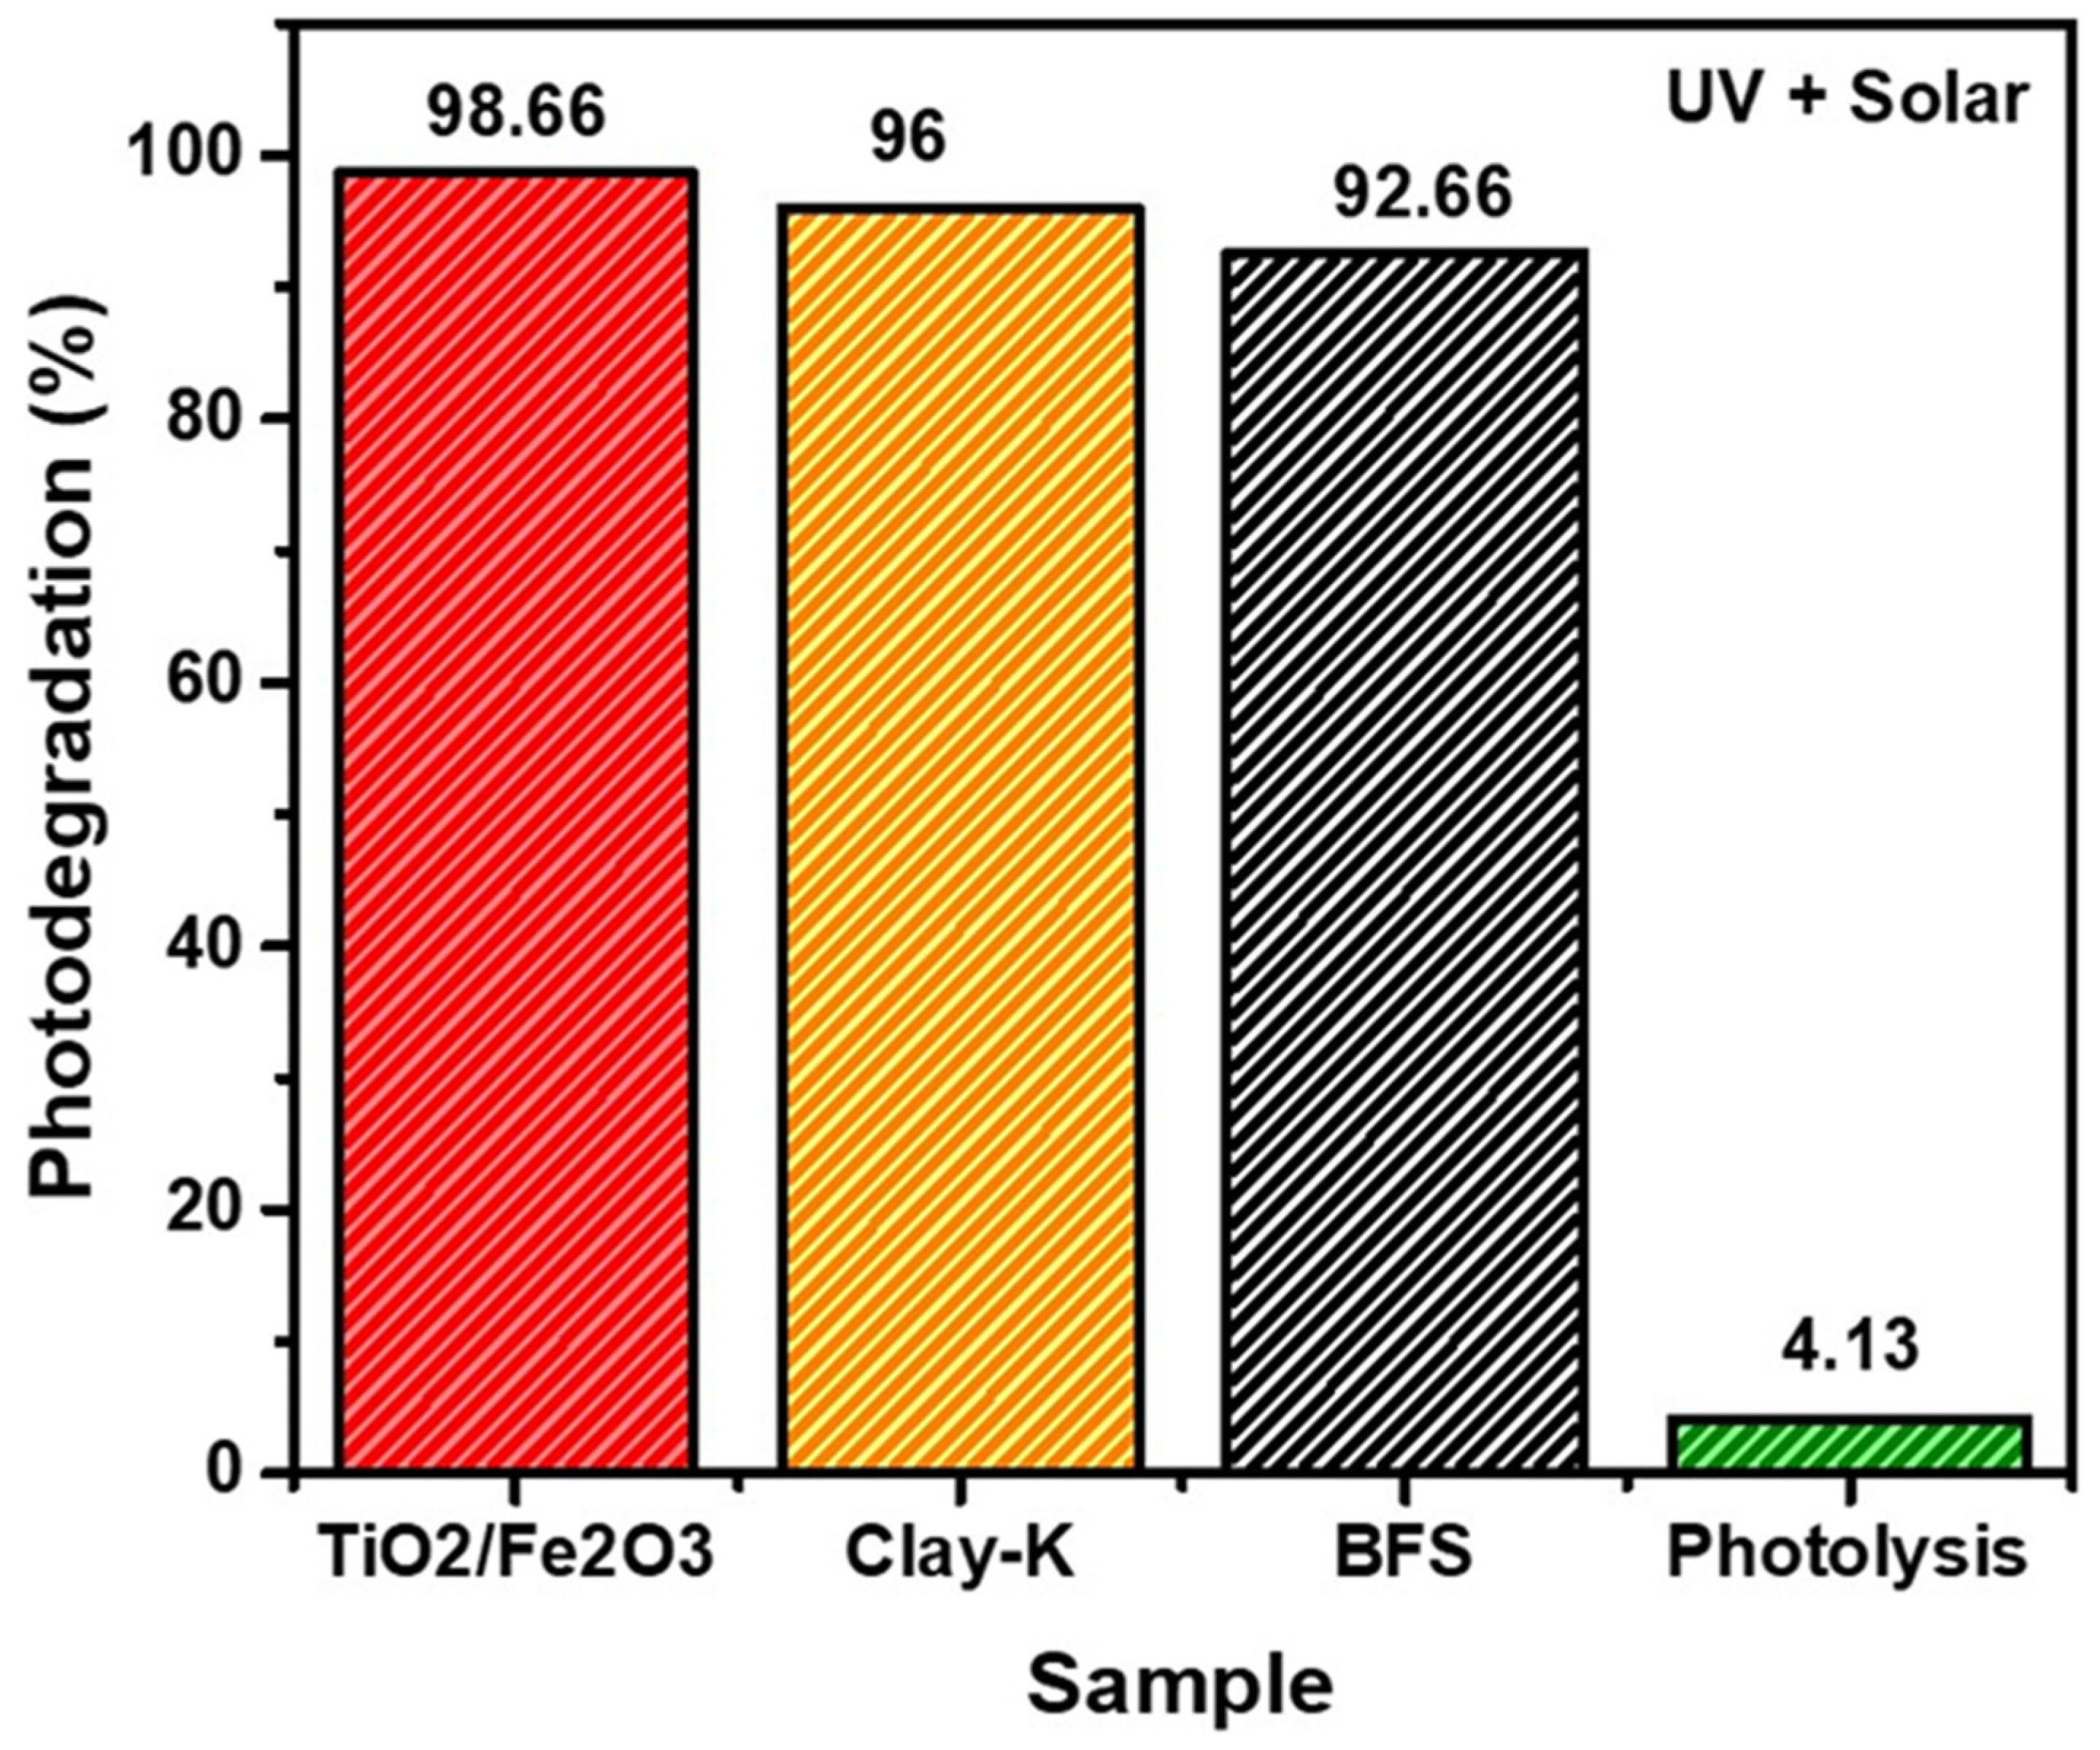
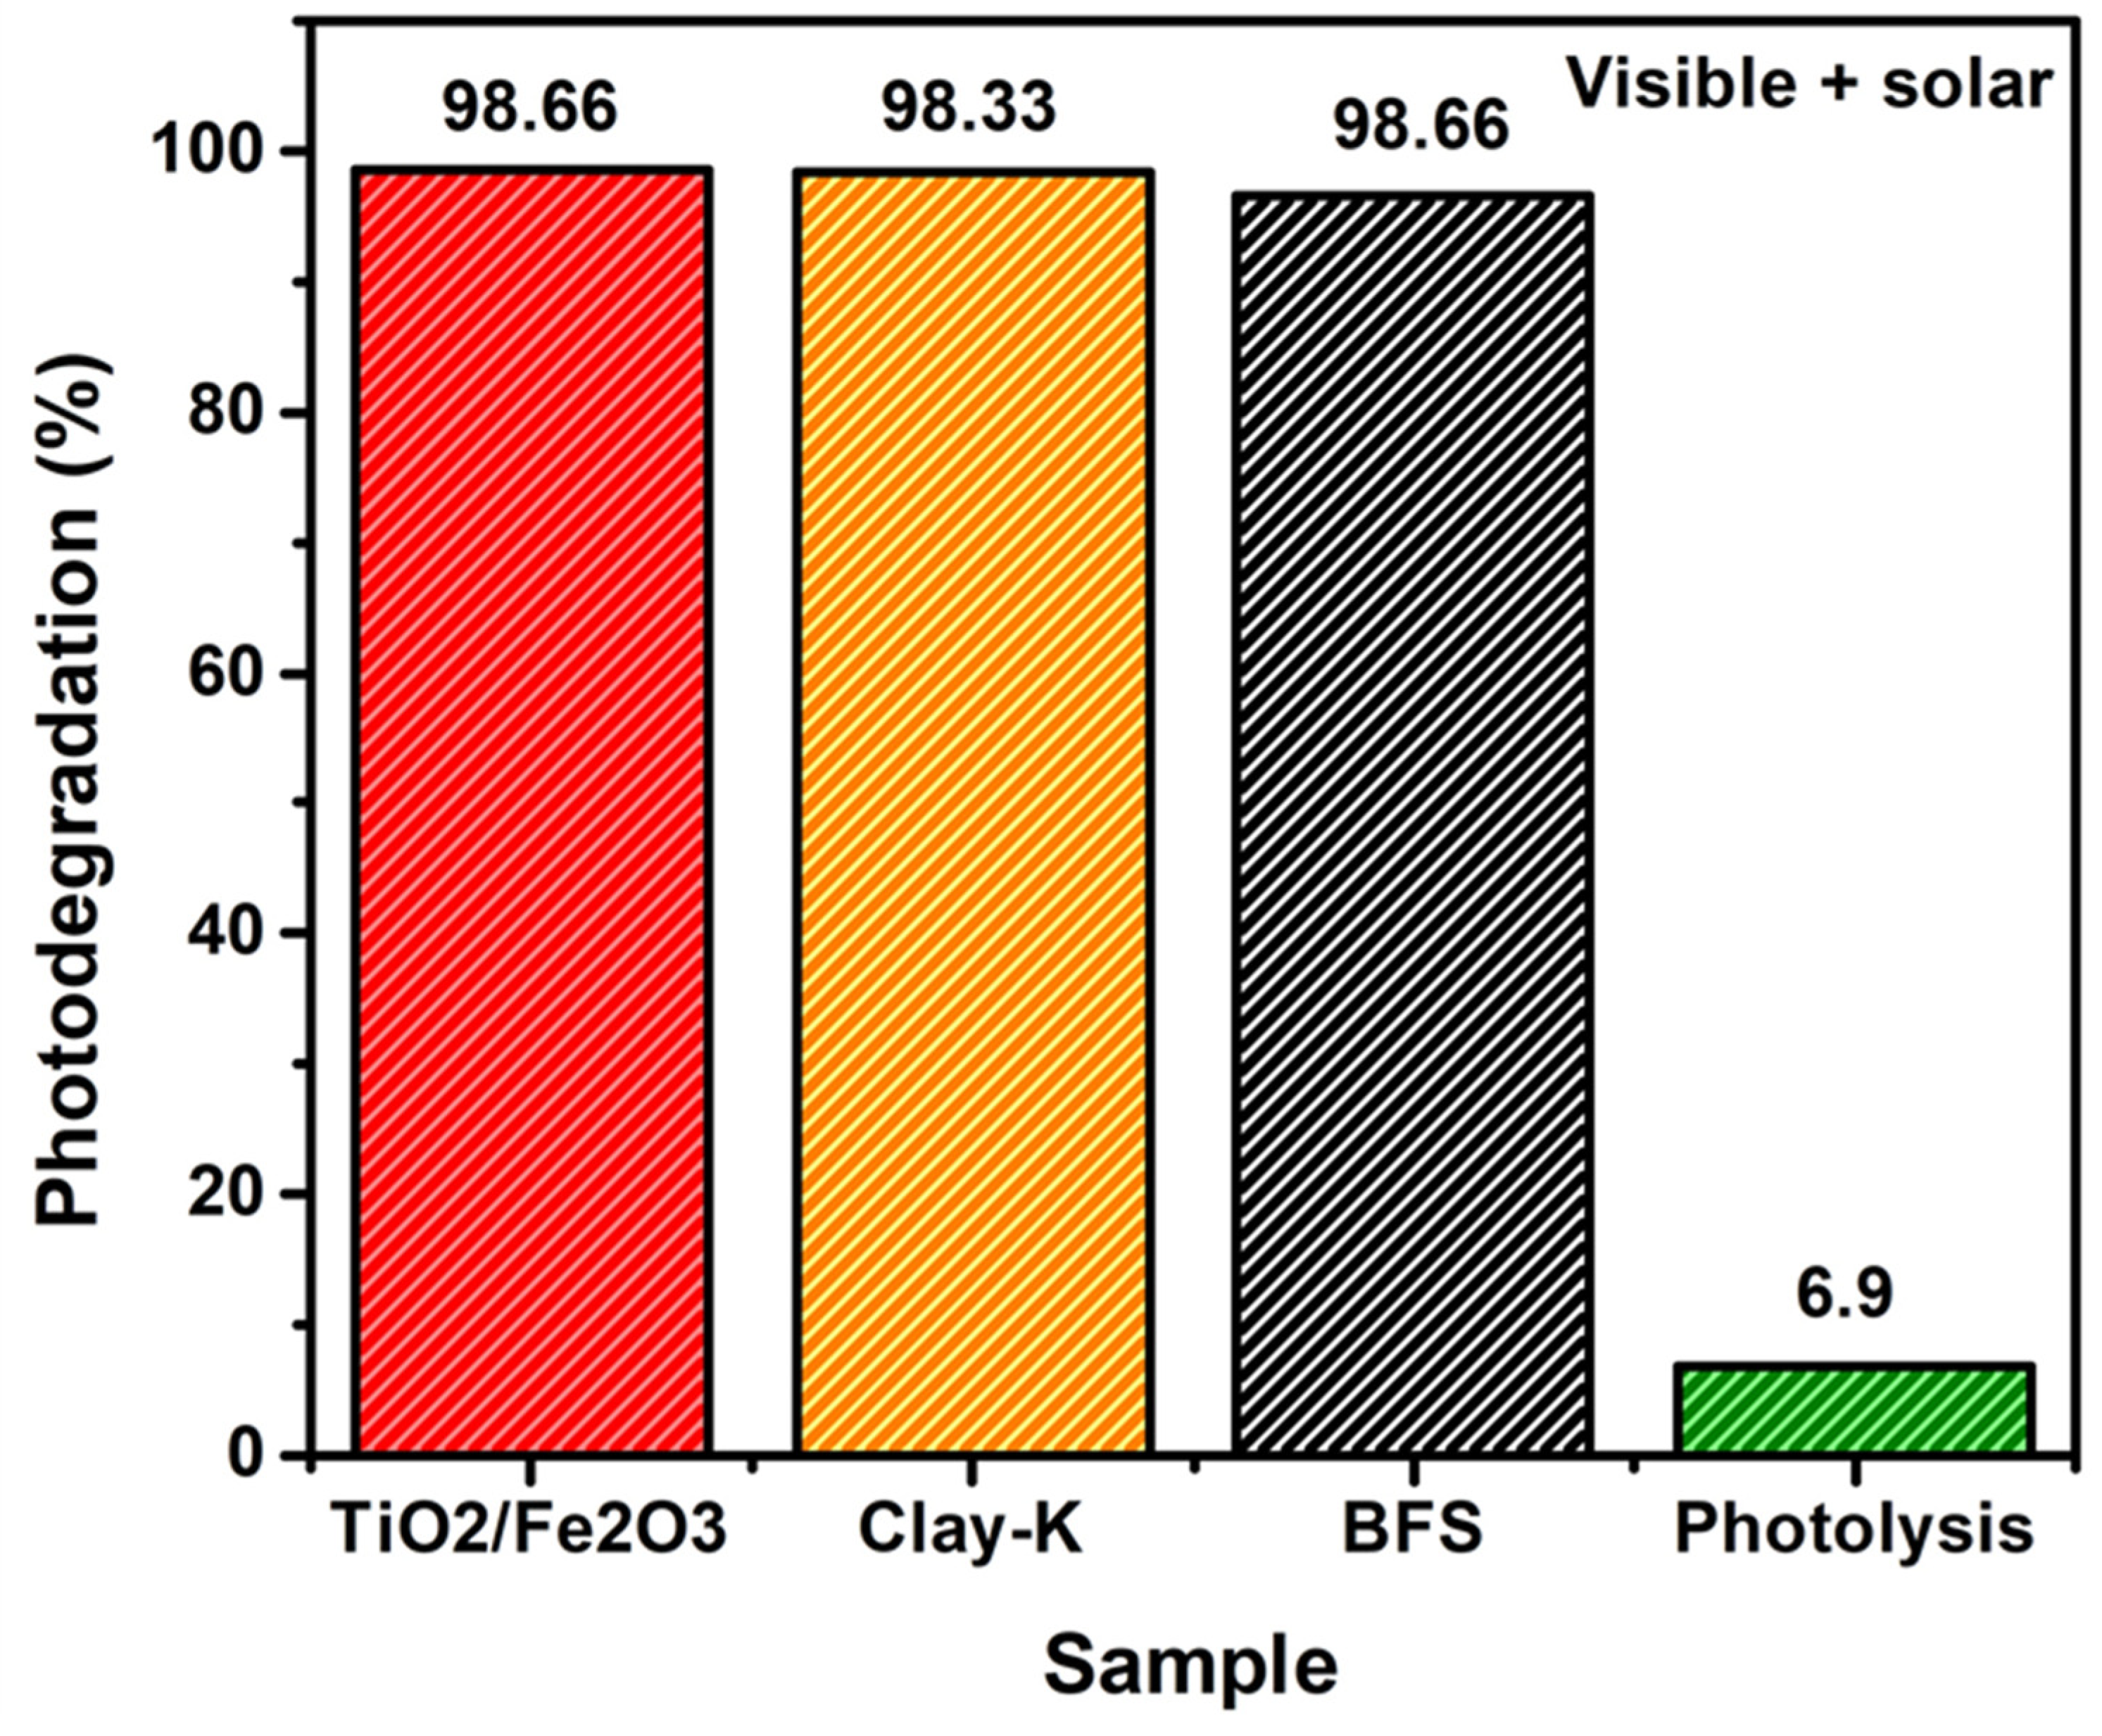
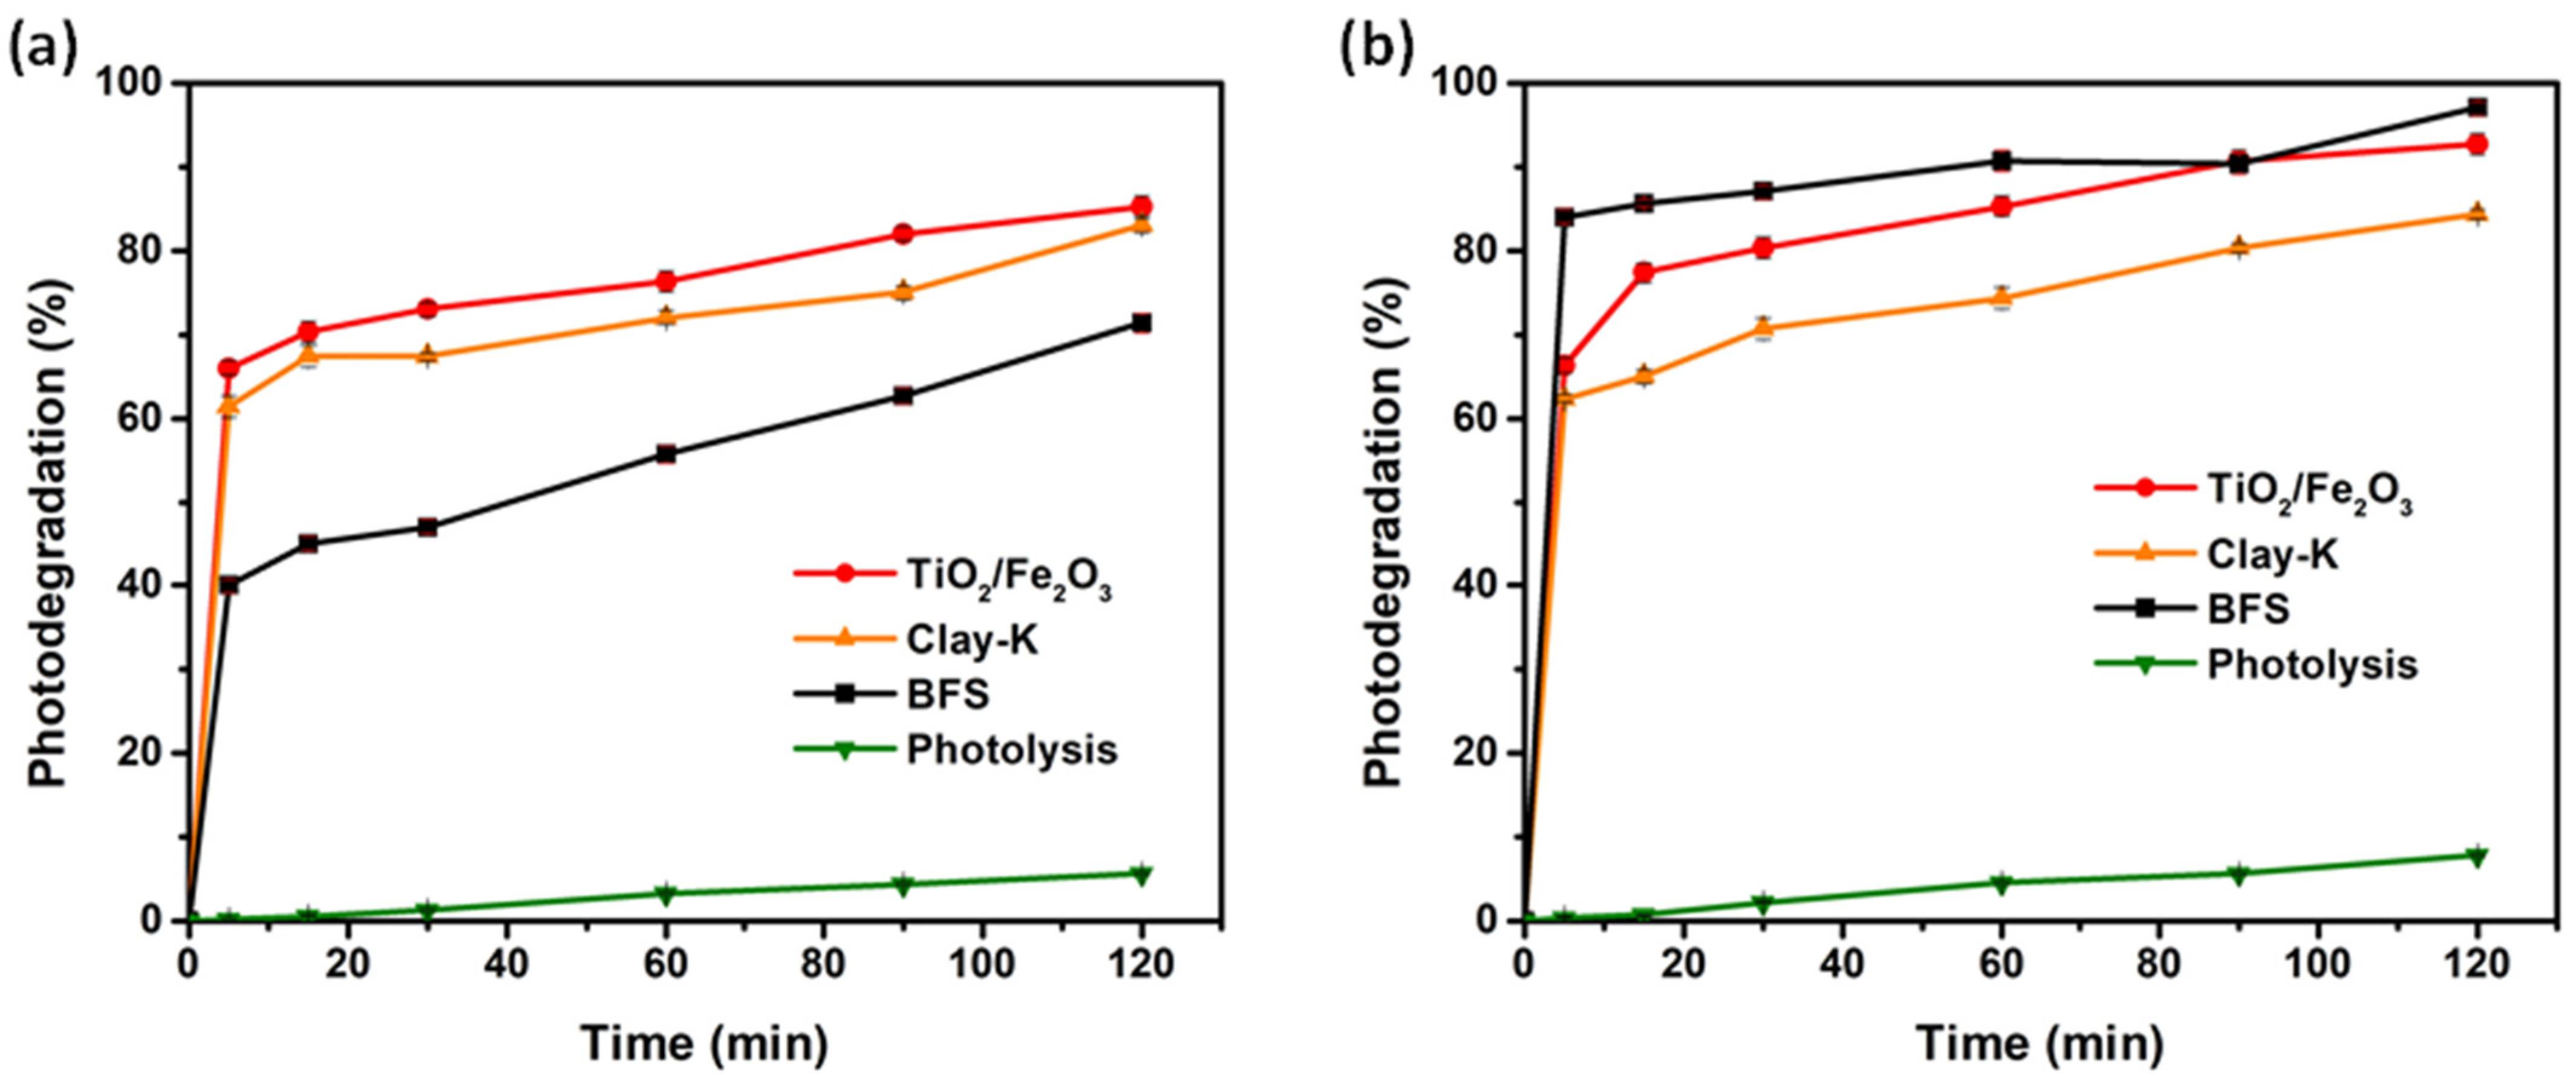
3.2.2. Cyanide Photodegradation

The results of the ultraviolet (UV) light photodegradation tests performed at an initial NaCN concentration of 750 mg/L (Figure 9) indicate that using Clay-K and BFS as catalysts for cyanide degradation, higher percentages of degradation are achieved, obtaining 96.44% and 92.66%, respectively.
The high percentages of cyanide photodegradation with the Clay-K and BFS indicate that these two catalysts are excited under UV irradiation efficiently, generating electron-hole pairs without recombining, to give rise to the formation of oxidizing species which react with the cyanide oxidizing them, as is showed schematically in Figure 10.
On the other hand, the TiO2/Fe2O3 catalyst photodegrades cyanide by 61.94%, which may be because it absorbs photons in a smaller proportion than the other two materials in this region (see Figure 5) or that there is electron-hole recombination. Figure 11 includes the photolysis of a cyanide solution of 750 mg/L irradiated with UV light for 2 h, obtaining 2.60% photodegradation.
Using visible light as an excitation source (Figure 11), TiO2/Fe2O3 material has a higher percentage of degradation (74.11%) compared to that obtained with UV irradiation (61.94%). In contrast, the BFS and Clay-K materials photodegraded in a smaller percentage to cyanide, obtaining values of 74.40% and 68.33%, respectively; compared to the results obtained using irradiation with UV light, these two materials have about 30% less catalytic action under irradiation with visible light. These results indicate that the TiO2/Fe2O3 material can be used as a catalyst for cyanide photo-oxidation under visible irradiation. This same Figure 10 includes the photolysis of a cyanide solution of 750 mg/L irradiated with visible light for 2 h, obtaining 2.73% of photodegradation.
Additionally, Figure 12 shows the exposure to natural solar irradiation from the above samples, for example, after exposure to UV or visible radiation, further potentiating the percentage of cyanide degradation with each material. When cyanide is exposed to irradiation with UV light plus natural sunlight, the percentage of cyanide degradation increased substantially with the TiO2/Fe2O3 sample, obtaining 98.66%. This figure also includes the photolysis of a cyanide solution of 750 mg / L irradiated with UV and natural sunlight for 2 h, obtaining 4.13% photodegradation.
The results obtained with visible radiation plus solar irradiation are shown in Figure 13. In this case, the cyanide photodegradation values with the three materials were 98.66%, 98.33%, and 98.66% with the materials TiO2/Fe2O3, Clay-K, and BFS, respectively. This indicates that natural sunlight composed of different types of radiation (visible, UV, and infrared) allows to generate different levels of excitation; according to Mathew et al. (2021), infrared (IR) irradiating over oxide catalysts permit to improve or facilitate the evolution of gases as O2 [33] that contribute to the oxidation of cyanide. All three materials are highly efficient to photodegrading cyanide under this irradiation scheme. This same figure includes the photolysis of a cyanide solution of 750 mg/L irradiated with visible and natural sunlight for 2 h, obtaining 6.9% photodegradation.
Cyanide photodegradation kinetics were performed with the three materials, irradiating with natural sunlight a 750 ppm NaCN solution, over a period of 2 h; previously, the suspensions were brought to the adsorption balance under absence of irradiation conditions. The results obtained are shown in Figure 14a,b at solar irradiance values from 400 to 600 W/m2 and from 600 to 800 W/m2, respectively. As shown in Figure 12b, the most efficient material to remove cyanide using a solar irradiation range of 600 to 800 Wh/m2 was the BFS sample, although the adsorption of cyanide was 33.30%; the total removal obtained is 97% in two hours of irradiation and 87% in just 30 min. Alternatively, with the TiO2/Fe2O3 sample, which has greater cyanide adsorption than the BFS sample (62.73%), it removes less cyanide by photodegradation; even so, the amount of total cyanide removed with this material is not despicable, reaching up to 92.66% in two hours of irradiation and 80% in just 30 min of natural sunlight irradiation. In contrast, the Clay-K sample allows photodegradation up to 84.33% in two hours.
Figure 14a presents the photodegradation results obtained by subjecting the cyanide-catalyst suspensions with a solar irradiance of 400 to 600 W/m2 for two hours. At two hours of irradiation, the samples of TiO2/Fe2O3 and Clay-K allow 84% and 82% of cyanide photodegradation, respectively, while the BFS sample photodegrades 72%. Comparing these results with those obtained with greater irradiation, it can be said that the greater the irradiation the photocatalytic activity of the three catalysts increases and that the photocatalytic activity of the residue is more dependent on the intensity of irradiation than the Clay-K and TiO2/Fe2O3 samples. As for the effect of solar irradiation time on cyanide photodegradation with the three catalysts and for both solar irradiation ranges, it is observed that the photodegradation rate is considerably higher in the first 30 min; even more, after this time, photodegradation continues to increase but at a lower rate, meaning that it is less dependent on irradiation time. Eskandari et al. reported that the longer the irradiation time the system has, the more reaction time there will be between the photocatalyst and cyanide, achieving a greater photodegradation of contaminants [27].
Chiang and Amal stated that the cyanide rate of degradation is a function of the concentration of the catalyst due to the volumetric absorption of photons, and if the optimal value of the catalyst is exceeded, the percentages of degradation decrease due to the increased opacity in the solution, and there is a greater scattering of light [20]. Otherwise, Pavas et al. reported that the concentration of the catalyst does not influence degradation, rather that its characteristics are what make this possible, having a high surface area distribution of uniform size and the absence of internal porosity [21].
Eskandari et al. indicated that the higher the initial concentration of cyanide, the lower the efficiency of degradation; this is because there is a higher content of cyanide on the active surface of the catalyst; thus, the photons do not fully penetrate the photocatalyst, which decreases the generation of oxidizing species because there is no direct reaction between the cyanide molecules and the photonic cavities [27].
In contrast, it is well known that the pH of the solution affects the surface load of adsorbent and catalytic materials. Hence, it is recommended to work at a pH different from that of the zero charge point or the isoelectric point so these remain stable, that is, well dispersed in the solution to be treated; for TiO2, the isoelectric point occurs at pH 7. Chiang et al. states that the surface of TiO2 adsorbs and interacts only with cyanide under alkaline conditions; this is confirmed by a change in its zeta potential [20].
At a pH below 9.2, cyanide dissociates and forms HCN. At a pH between 9.5 and 12, the photocatalytic degradation is more favorable for cyanide; at pH 9.5, the percentage of degradation is higher. This is consistent with Yngard et al. who concluded that at pH greater than 11, the velocity constant decreases when using Fe(VI) as a catalyst [26] compared to high pH above 12, where an unfavorable adsorption of CN- ions occurs on the negatively charged surface of TiO2.
Considering and comparing the results of adsorption and photodegradation obtained in this work at pH 11 with what is reported in the literature cited above and considering that the zeta potential values of the samples, TiO2/Fe2O3, Clay-K, and BFS, at this pH value is negative, that is, its surface is negatively charged; it is proposed that the adsorption of the cyanide anion is not governed by interactions of electrostatic attraction but by the very possible formation of complexes by coordinated covalent bonds, followed by photooxidation from the surface of the oxides when the oxidizing species are generated when the aqueous suspensions containing the catalyst particles are exposed to different light sources. In relation to the products obtained from the degradation of cyanide, Chiang et al. (2003) concludes that the oxidation of cyanate was insignificant since the concentration of nitrates was almost undetectable with cyanate being the only species obtained from the oxidation of cyanide, agreeing with Yngard et al. that the conversion of cyanide was complete to cyanate [26].

4. Conclusions

For cyanide adsorption, using an initial NaCN concentration of 750 ppm, the Clay-K and TiO2/Fe2O3 samples adsorb approximately twice as much cyanide (67.73%; 253.98 mg/g) compared to the BFS sample, which only adsorbs 33.3% (124.87 mg/g). This is due to their smaller specific surface area (5.69 m2/g) compared with the other two materials. The first and pseudo-second order mathematical models were used to model the kinetics of cyanide adsorption, with the pseudo-second order being the one with the best correlation with the experimental data.
For cyanide photodegradation using irradiation with UV light, the Clay-K and BFS samples act as excellent catalysts; values of 96.44% and 92.66% were obtained, respectively. On the other hand, the highest percentage of cyanide photodegradation using UV irradiation plus natural sunlight was obtained with the TiO2/Fe2O3 sample with 98.66% degradation. The most efficient catalytic material to photodegrade cyanide under irradiation with natural sunlight, with an irradiance range of 600 to 800 W/m2, is the BFS sample, reaching up to 97% (363.75 mg/g) cyanide removal in two hours of irradiation and 87% (326.25 mg/g) in just 30 min.
Finally, a potential synergistic effect when using low-cost industrial residue and the use of solar energy as a lighting source in the process of cyanide removal from aqueous solutions will have beneficial effects for the environment, the consumption of energy, and the cost of the overall remediation process, contributing to the development of sustainable processes.

Author Contributions

Conceptualization, F.R.C.-P. and M.A.S.-C.; methodology, A.M.-L.; validation, A.M.-L., F.R.C.-P. and B.M.A.-M.; formal analysis, A.M.-L. and M.d.J.S.-A.; investigation, B.M.A.-M.; data curation, F.R.C.-P.; writing—original draft preparation, B.M.A.-M. and A.M.-L.; writing—review and editing, S.E.-F., M.d.J.S.-A. and M.A.S.-C.; funding acquisition and technical project manager, F.R.C.-P. All authors have read and agreed to the published version of the manuscript.

Funding

This research was funded by Consejo Nacional de Ciencia y Tecnología (National Council of Science and Technology—Mexico; abbreviated CONACYT), grant number A1-S-15832.

Acknowledgments

The authors appreciate the support of CONACYT for the development of this project. BMAM appreciates the scholarship granted by CONACYT for her postgraduate studies.

Conflicts of Interest

The authors declare no conflict of interest.

References

  1. Medina, D.; Anderson, C. A review of the cyanidation treatment of copper-gold ores and concentrates. Metals 2020, 10, 897. [Google Scholar] [CrossRef]
  2. Vargas, C.; Navarro, P.; Araya, E.; Pavez, F.; Alguacil, F. Recovery of gold from solutions with ammonia and thiosulfate using activated carbon. Rev. De Metal. 2006, 42, 222–233. [Google Scholar] [CrossRef] [Green Version]
  3. Kalombo, J.; Simonsen, H.; Ndlovu, S. Improving the gold leaching process of refractory ores using the Jetleach reactor. Miner. Eng. 2019, 134, 300–308. [Google Scholar]
  4. Serquén, Y. Influence of Ozone and Copper on Cyanide Degradation of Mining Effluents. Bachelor’s Thesis, Universidad Nacional Pedro Ruiz Gallo, Lambayeque, Peru, 2 March 2020. [Google Scholar]
  5. Lottermoser, B. Cyanidation wastes of gold-silver ores. In Mine Wastes; Lottermoser, B., Ed.; Springer: Berlin/Heidelberg, Germany, 2003; pp. 171–184. [Google Scholar]
  6. U.S. Environmental Protection Agency. IRIS Toxicological Review of Hydrogen Cyanide and Cyanide Salts (Final Report); EPA/635/R-08/016F; U.S. Environmental Protection Agency: Washington, DC, USA, 2010. [Google Scholar]
  7. Rice, N.; Rauscher, N.; Langston, J.; Myers, T. Behavioral toxicity of sodium cyanide following oral ingestion in rats: Dose-dependent onset, severity, survival, and recovery. Food Chem. Toxicol. 2018, 114, 145–154. [Google Scholar] [CrossRef]
  8. Maulana, I.; Takahashi, F. Cyanide removal study by raw and iron-modified synthetic zeolites in adsorption experiments. J. Water Process Eng. 2018, 22, 80–86. [Google Scholar] [CrossRef]
  9. Behnamfard, A.; Chegni, K.; Alaei, R.; Veglio, F. The effect of thermal and acid treatment of kaolin on its ability for cyanide removal from aqueous solutions. Environ. Earth. Sci. 2019, 78, 408. [Google Scholar] [CrossRef]
  10. Nafaâ, A.; Lotfi, M. Removal of cyanide from aqueous solution using impregnated activated carbon. Chem. Eng. Process. 2002, 41, 17–21. [Google Scholar]
  11. Aliprandini, P.; Veiga, M.; Marshall, B.; Scarazzato, T.; Espinosa, D. Investigation of mercury cyanide adsorption from synthetic wastewater aqueous solution on granular activated carbon. J. Water Process Eng. 2020, 34, 101154. [Google Scholar] [CrossRef]
  12. Noroozifar, M.; Khorasani-Motlagh, M.; Ahmadzadeh, P. Cyanide uptake from wastewater by modified natrolite zeolite-iron oxyhydroxide system: Application of isotherm and kinetic models. J. Hazard. Mater. 2009, 166, 1060–1066. [Google Scholar] [CrossRef]
  13. Pirmoradi, M.; Hashemian, S.; Shayesteh, M. Kinetics and thermodynamics of cyanide removal by ZnO@ NiO nanocrystals. Trans. Nonferrous Met. Soc. China 2017, 27, 1394–1403. [Google Scholar] [CrossRef]
  14. Swantomo, D.; Faturrahman, I.; Basuki, K.; Wongsawaeng, D. Chitosan-polyacrylamide graft copolymers prepared with gamma irradiation for gold cyanide adsorption. Polym. Technol. Mater. 2020, 59, 1284–1291. [Google Scholar] [CrossRef]
  15. Moussavi, G.; Khosravi, R.; Omran, N. Development of an efficient catalyst from magnetite ore: Characterization and catalytic potential in the ozonation of wáter toxic contaminants. Appl. Catal. A-Gen. 2012, 445–446, 42–49. [Google Scholar] [CrossRef]
  16. Mondal, M.; Mukherjee, R.; Sinha, A.; Sarkar, S.; De, S. Removal of cyanide from steel plant effluent using coke breeze, a waste product of steel industry. J. Water Process Eng. 2019, 28, 135–143. [Google Scholar] [CrossRef]
  17. Zhang, L.; Jaroniec, M. Fundamentals of adsorption for photocatalysis. Surface Science of Photocalalysis. In Interface Science and Technology; Elsevier: Amsterdam, The Netherlands, 2020; Volume 31, pp. 39–60. [Google Scholar]
  18. Coronel, S.; Endara, D.; Lozada, A.B.; Manangón-Perugachi, L.E.; de la Torre, E. Photocatalytic study of cyanide oxidation using titanium dioxide (TiO2)-Activated carbon composites in a continuous flow photo-reactor. Catalysts 2021, 11, 924. [Google Scholar] [CrossRef]
  19. Sivaraman, C.; Vijayalakshmi, S.; Leonard, E.; Sagadevan, S.; Jambulingam, R. Current developments in the effective removal of environmental pollutants through photocatalytic degradation using nanomaterials. Catalysts 2022, 12, 544. [Google Scholar] [CrossRef]
  20. Chiang, K.; Amal, R.; Tran, T. Photocatalytic oxidation of cyanide: Kinetic and mechanistic studies. J. Mol. Catal. A Chem. 2003, 193, 285–297. [Google Scholar] [CrossRef]
  21. Pavas, E.; Camargo, P.; Castro, C.; Pineda, T. Oxidación Fotocatalitica del Cianuro; Pavas, E., Ed.; Universidad Eafit: Medellin, Colombia, 2005; pp. 1–55. [Google Scholar]
  22. Quispe, L.; Arteaga, M.; Cardenas, E.; Lopez, L.; Santelices, C.; Palenque, E.; Cabrera, S. Removal of cyanide by combined UV/H2O2/TiO2 system. Rev. Boliv. Quim. 2011, 28, 113–118. [Google Scholar]
  23. Viña, J.; Fernandez, B.; Fernandez, M.; Ayala, J.; Ania, C. Photochemical degradation of cyanides and thiocyanates from an industrial wastewater. Molecules 2019, 24, 1373. [Google Scholar]
  24. Caicedo, D.; Schadach, I.; Betancourt, L. Photocatalytic degradation of ferricyanide as synthetic gold mining wastewater using TiO2 assisted by H2O2. REM Int. Eng. J. 2020, 73, 99–107. [Google Scholar] [CrossRef] [Green Version]
  25. Seung-Monk, L.; Diwakar, T. Application of ferrate (VI) in the treatment of industrial wastes containing metal-complexed cyanides: A green treatment. J. Environ. Sci. 2009, 21, 1347–1352. [Google Scholar] [CrossRef]
  26. Yngard, R.; Damrongsiri, S.; Osathaphan, K.; Sharma, V. Ferrate(VI) oxidation of zinc-cyanide complex. Chemosphere 2007, 69, 729–773. [Google Scholar] [CrossRef] [PubMed]
  27. Eskandari, P.; Farhadian, M.; Solaimany, A.; Jeon, B. Adsorption and photodegradation efficiency of TiO2/Fe2O3/PAC and TiO2/Fe2O3/Zeolite Nanophotocatalysts for the removal of cyanide. Ind. Eng. Chem. Res. 2019, 58, 2099–2112. [Google Scholar] [CrossRef]
  28. Győrfi, K.; Vágvölgyi, V.; Zsirka, B.; Horváth, E.; Szilágyi, R.; Baán, K.; Balogh, S.; Kristóf, J. Kaolins of high iron-content as photocatalysts: Challenges of acidic surface modifications and mechanistic insights. Appl. Clay Sci. 2002, 195, 105722. [Google Scholar] [CrossRef]
  29. Szczepanik, B. Photocatalytic degradation of organic contaminants over clay-TiO2 nanocomposites: A review. Appl. Clay Sci. 2017, 141, 227–239. [Google Scholar] [CrossRef]
  30. Estrada-Flores, S.; Martínez-Luévanos, A.; Perez-Berumen, C.; García-Cerda, L.; Flores-Guia, T. Relationship between morphology, porosity, and the photocatalytic activity of TiO2 obtained by sol–gel method assisted with ionic and nonionic surfactants. Bol. Soc. Esp. Ceram. Vidr. 2020, 59, 209–218. [Google Scholar] [CrossRef]
  31. Dewi, R.; Agusnar, H.; Alfian, Z.; Tamrin. Characterization of technical kaolin using XRF, SEM, XRD, FTIR and its potentials as industrial raw materials. J. Phys. Conf. Ser. 2018, 1116, 042010. [Google Scholar] [CrossRef]
  32. Wu, L.; Yan, H.; Xiaoc, J.; Li, X.; Wang, X.; Zhao, T. Characterization and photocatalytic properties of nano-Fe2O3–TiO2 composites prepared through the gaseous detonation method. Ceram. Int. 2017, 43, 14334–14339. [Google Scholar] [CrossRef]
  33. Mathew, S.; Lim, C.Y.; Kim, M.; Kim, K.; Chung, W.; Cho, Y. Effect of Infrared Oxide Catalysts on Water Splitting for Green Energy. ChemElectroChem 2021, 8, 2944–2949. [Google Scholar] [CrossRef]
Figure 1. Diagram showing the synthesis of TiO2/Fe2O3 composite by the mechanosynthesis method.
Water 14 03502 g001
Figure 2. (a) and (b) Optical micrographs at 500 X of Clay-K and BFS samples, respectively; (c) micrograph (SEM) at 75000X of the TiO2/Fe2O3 sample. (d) Zeta potential of the TiO2/Fe2O3 sample as a function of pH.
Water 14 03502 g002
Figure 3. FTIR-ATR spectra of BFS, Clay-K, and TiO2/Fe2O3 samples.
Water 14 03502 g003
Figure 4. X-ray diffractograms of (a) BFS and Clay-K samples and of (b) TiO2/Fe2O3 sample. Diffraction patterns of quartz (PDF # 46-1045), (kaolinite (PDF # 14-0164), graphite (PDF # 26-1079), anatase (PDF 21-1272), and hematite (PDF 33-0664) are included.
Water 14 03502 g004
Figure 5. Absorption spectra of Clay-K, BFS, and TiO2/Fe2O3 materials.
Water 14 03502 g005
Figure 6. Percentage of cyanide adsorption in TiO2/Fe2O3, Clay-K, and BFS materials at initial concentrations of (a) 250 mg/L and (b) 750 mg/L NaCN. Adsorption time of 2 h.
Water 14 03502 g006
Figure 7. Cyanide adsorption kinetics in TiO2/Fe2O3, Clay-K, and BFS samples.
Water 14 03502 g007
Figure 8. Modeling of cyanide adsorption kinetics in TiO2/Fe2O3, Clay-K, and BFS samples. (a) Pseudo first order and (b) Pseudo second order model.
Water 14 03502 g008
Figure 9. Percentages of cyanide photodegradation with Clay-K, BFS, and Fe2O3/TiO2 materials using UV irradiation for 2 h. Initial concentration of NaCN of 750 mg/L.
Water 14 03502 g009
Figure 10. Scheme of cyanide photodegradation using natural sunlight.
Water 14 03502 g010
Figure 11. Percentages of cyanide photodegradation with Clay-K, BFS, and Fe2O3/TiO2 materials using irradiation with visible light for 2 h. Initial concentration of NaCN of 750 mg/L.
Water 14 03502 g011
Figure 12. Percentages of cyanide photodegradation with Clay-K, BFS, and Fe2O3/TiO2 materials using UV and solar irradiation for 2 h. Initial concentration of NaCN of 750 mg/L.
Water 14 03502 g012
Figure 13. Percentages of cyanide photodegradation with Clay-K, BFS, and Fe2O3/TiO2 materials using visible and solar irradiation for 2 h. Initial concentration of NaCN of 750 mg/L.
Water 14 03502 g013
Figure 14. Cyanide degradation kinetics: (a) 400–600 Wh/m2 and (b) 600–800 Wh/m2. Effect of solar irradiance; 2 g/L catalyst.
Water 14 03502 g014
Table 1. Zeta potential, pHIEP, and specific surface area (ABET) of Clay-K, BFS, and TiO2/Fe2O3 materials.
MaterialAverage Zeta Potential (mV) apHIEPABET
(m2/g)
TiO2/Fe2O3−1.606.9066.59
Clay-K−29.90-14.93
BFS+27.13-5.69
a Zeta Potential measured at pH = 7.
Table 2. Adsorption kinetics constants of pseudo second order model and R square constant.
SampleK1 (min−1)K2(mg·g−1·min−1)
TiO2/Fe2O31.24 × 10−23.55 × 10⁻³
Clay-K7.76 × 10−33.41 × 10⁻³
BFS6.76 × 10−32.16 × 10⁻³
Publisher’s Note: MDPI stays neutral with regard to jurisdictional claims in published maps and institutional affiliations.

