Article

Water Accounting Using Satellite Products and Water Accounting Plus Framework in a Semi-Arid Betwa River Basin, India

1
K. Banerjee Centre for Atmospheric and Ocean Studies, University of Allahabad, Prayagraj 211002, Uttar Pradesh, India
2
Institute for Global Environmental Strategies, 2108-11 Kamiyamaguchi, Hayama 240-0115, Kanagawa, Japan
3
WRS Division, National Institute of Hydrology, Roorkee 247667, Uttrakhand, India
4
Chair of Photogrammetry and Remote Sensing, Faculty of Geodesy, University of Zagreb, Kačićeva 26, 10 000 Zagreb, Croatia
5
College of Agriculture and Human Sciences, Prairie View A&M University, Prairie View, TX 77446, USA
*
Author to whom correspondence should be addressed.
Water 2022, 14(21), 3473; https://doi.org/10.3390/w14213473
Submission received: 29 September 2022 / Revised: 23 October 2022 / Accepted: 27 October 2022 / Published: 30 October 2022

Abstract

:
The emerging water crisis in India can be preempted by improving watershed management. The data scare regions need open access satellite observations to mitigate watershed problems. The water accounting plus (WA+) and open access earth observation datasets were applied to quantify the beneficial and non-beneficial water consumption in the Betwa River basin, Central India. The PERSIANN and CHIRPS precipitations were evaluated. Based on significant statistical relations with IMD rainfall, CHIRPS was found to be the best precipitation product. The seasonal water yield from PERSIANN depicts that the high water yield in the basin is associated with the July and August months of the monsoon season, with water yields of 240 mm/month and 120 mm/month, respectively, while CHIRPS showed higher water yields during the monsoon season, especially in July and August, with water yield amounts of 290 mm/month and 200 mm/month, respectively. The largest water consuming land use class is irrigated crops–cereals, which cover 62.06% of the total area of the basin. The amount of non-beneficial ET is almost twice the beneficial ET. The outcomes of this research will be helpful for sustainable water management, strategy development, and policy making.

1. Introduction

Water is a vital and finite natural resource. The water demand for different sectors, such as agriculture, domestic, industry, and energy, is continuously rising to meet the needs of the growing population [1]. Within the last 100 years, global water demand has escalated by 600% [2]. The shrinking supply and expanding demand of fresh water, due to rapid growth in population, changing consumption patterns, and socio-economic development around the world, poses formidable threats to the global fresh water systems [3]. Hence, managing water resources is essential for sustaining lives on earth, socio-economic development, a healthy environment, and the well-being of humans [4,5].
Water accounting opts for the water balance approach; hence, various domains of inflows and outflows must be specified, according to the mass conservation approach [6]. It also helps recognize the intrinsic causes of problems pertinent to the water and provides viable data and information for resolving obstacles in a particular area over time [7]. River basins are natural, unique, hydrologically self-contained, and fundamental entities of water resource planning and management [8,9,10]. They can be used to estimate the water budget (water supply, demand, and storage) of regional water systems. Among the different water budgeting approaches, as described by Godfrey and Chalmers [11] and Karimi [12], nowadays, a new framework, namely water accounting plus (WA+), is being widely used [13] for water accounting in river basins. The International Water Management Institute (IWMI)-based WA tool, developed by Molden and Sakthivadivel [6], and the recently designed WA+ framework replaced Molden [14]. IHE-Delft has developed the WA+ framework in partnership with the World Water Assessment Program (WWAP), IWMI and FAO. It works based on the method introduced by the IWMI [14]. WA+ is a novel water accounting framework that relies on remote sensing data and combines the depletion method (e.g., IWMI Water Accounting) of water accounting with the flow method (e.g., UN SEEA-WATER) of water accounting [13]. The WA+ works on the water balance principle [15] and has been specifically designed and built to exploit remote sensing measurements of hydrological variables and land use in a spatio-temporally distributed manner. WA+ summarizes the status of water resources in a basin using easily understandable spatial maps, tables, and sheets. WA+ describes the water resource of river basins based on eight fact sheets [13].
Bastiaanssen and Chandrapala [16], Simons et al. [17], Karimi et al. [12], Shilpakar et al. [18], Dost et al. [19], and Karimi et al. [13] used earth observation data to estimate the water accounts of river basins in Sri Lanka, Okavango basin, Nile basin, East Rapti basin, Awash basin, and Indus basin, respectively. The IHE Delft Institute with FAO has employed WA+ over the Nile River basin for a water accounting study using remotely sensed datasets [20], and evapotranspiration (ETa) at the basin level was often recorded higher than the precipitation from 2009 to 2019. The study also unveils that, from the water resource perspective, the potential for agricultural expansion is limited in the Nile basin. The FAO and IHE Delft [20] have also used WA+ in the Niger River basin and found a balanced water budget throughout 2009–2015, despite the variability in the amount and distribution of the evapotranspiration and precipitation at the basin level. FAO and IHE Delft [20] have used WA+ in the basin of Awash River, Ethiopia. Analysis revealed that the spatial pattern of actual evapotranspiration was almost consistent for the whole basin, except at the highlands, where actual evapotranspiration exceeds precipitation in the basin. FAO and IHE Delft [20] have employed WA+ for a water accounting study in the Jordan River basin, Jordan. It was found that the Water Productivity (WaPOR) database of FAO was not uniformly applicable and showed a noticeable discrepancy in the estimation of the water balance for the Jordan River basin.
India has the highest freshwater demand, led by its burgeoning population, agricultural expansion, socio-economic progress, rapid urban sprawl, and industrial developments [21]. According to World Resources Institute [22], 54% of India’s total geographical area faces high to extremely high water stress. The water availability, in terms of per year per capita in India, declined from 5177 m3 in 1951 to 1567 m3 in 2011 and is projected to further dwindle to about 1140 m3 in 2050 [23,24]. Globally, the agriculture sector consumes a major chunk of fresh water [25] and more so in India [26]. A study by National Bank for Agriculture and Rural Development (NABARD) [27] revealed that the agriculture sector ingests about 78% of the available fresh water resources of India. Despite this, till now, only 48% of the net sown area, i.e., 68.6 million hectares of the country, gets irrigated and the rest is rainfed [28]. Further, groundwater accounts for about 62% of the total fresh water used for irrigation in India, contributing to the significant groundwater depletion rate [29]. The Central Groundwater Board (CGWB) of India reported a sharp decline in the groundwater tables between the years 2007 to 2017, especially in the northern region [29]. Sharma et al. [27] have reported that water availability would be the primary limiting factor in Indian agriculture, rather than land. A recent study by the State of Food Security and Nutrition in the World [30], released jointly by five UN organizations, states that India still suffers from food and nutrition insecurity. In the Indian context, Amarasinghe et al. [31] have analyzed the trends and patterns of important water demand drivers of India in the recent past. Their study reveals that, with the current water use pattern of the country, meeting future food demands will lead to a severe water crisis. By the end of 2050, physical water scarcity will be a common phenomenon in various river basins of India. Sakthivadivel et al. [32] have evaluated the performance of the Bhakra canal system in Haryana, India and found that the practice of Warabandi principle-based allocation and distribution of the canal water leads to high water productivity. Singh et al. [33] have employed WA+ to estimate the total water consumption in the Subarnarekha basin, India, using open source earth observation datasets.
A data scarce, semi-arid river basin has a challenge in accounting for the total water depletion. The study area is a semi-arid river basin and will link with Ken River, India. Hence, this study aimed to use the open access satellite precipitation products and to assess the total water consumption and seasonal water yield in the basin using the WA+ framework, which is the novelty of this study.

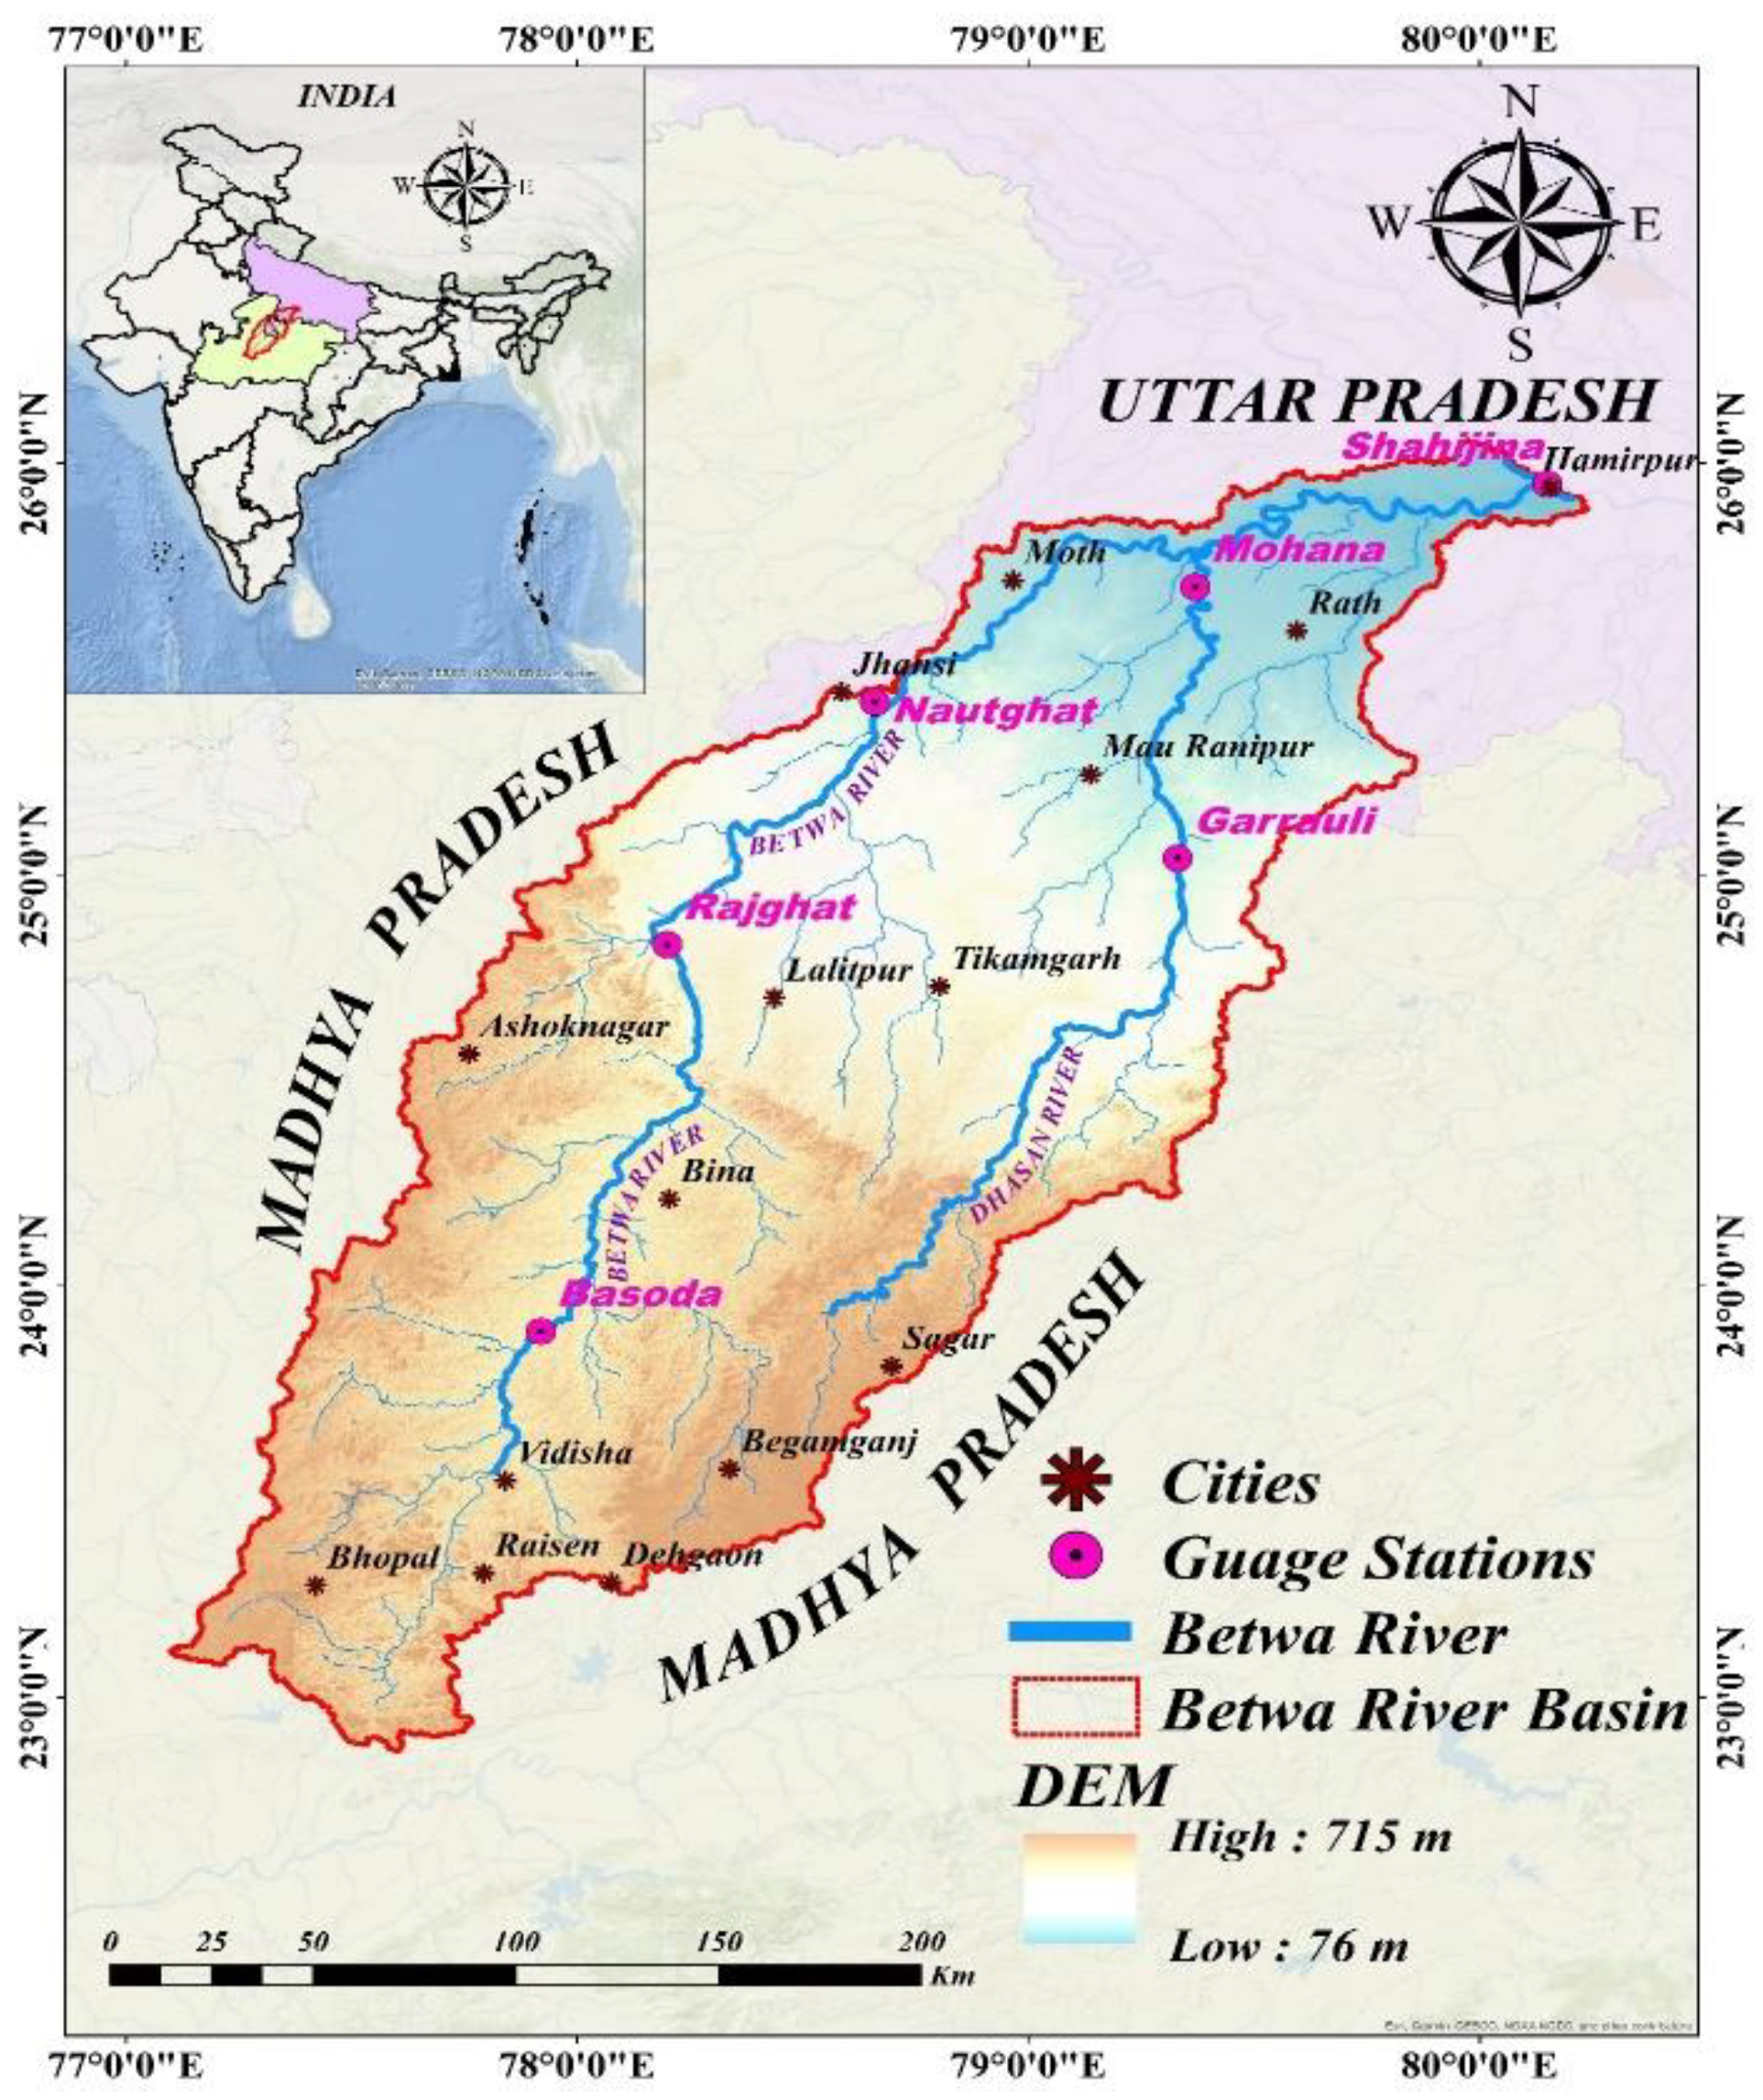
2. Study Area Description

2.1. Location

The Betwa River basin (BRB) is an active segment of the Ganges river system. It is spread between latitude 23°5′ to 25°55′ E and longitude 77°15′ to 79°45′ N in central India (Figure 1). It originates from Dehgaon Bamori Forest Range of the Raisen district in Madhya Pradesh, India. It is about 475 m above mean sea level (a.m.s.l.). It flows in a southwest to northeast direction for 590 km and drains into river Yamuna at about 106 m a.m.s.l. in district Hamirpur of Uttar Pradesh. It has a total drainage area of about 43,346 km2, out of which 68.84% area is in Madhya Pradesh, and the rest of 32.16% area lies in Uttar Pradesh. The sub-tributaries, namely Kaliasot, Sagar, Halali, and Bina, are located upstream, Narain, Jamni, and Orr, are located midstream, and Dhasan and Birma are located downstream of the Betwa River. The strike ridges of Vindhyan hills and Malwa Plateau are situated, respectively, in the southwest and south margin of the basin, separating the Betwa River basin from Narmada valley. The urban settlements, hills, industries, and forests dominate the upstream regions of the basin, whereas the middle and downstream regions are covered by agricultural activities, rural settlements, stone mining, rocky outcrops and stone crushing industries, thermal power plants, and dams.

2.2. Geology, Soil Types, and Climate
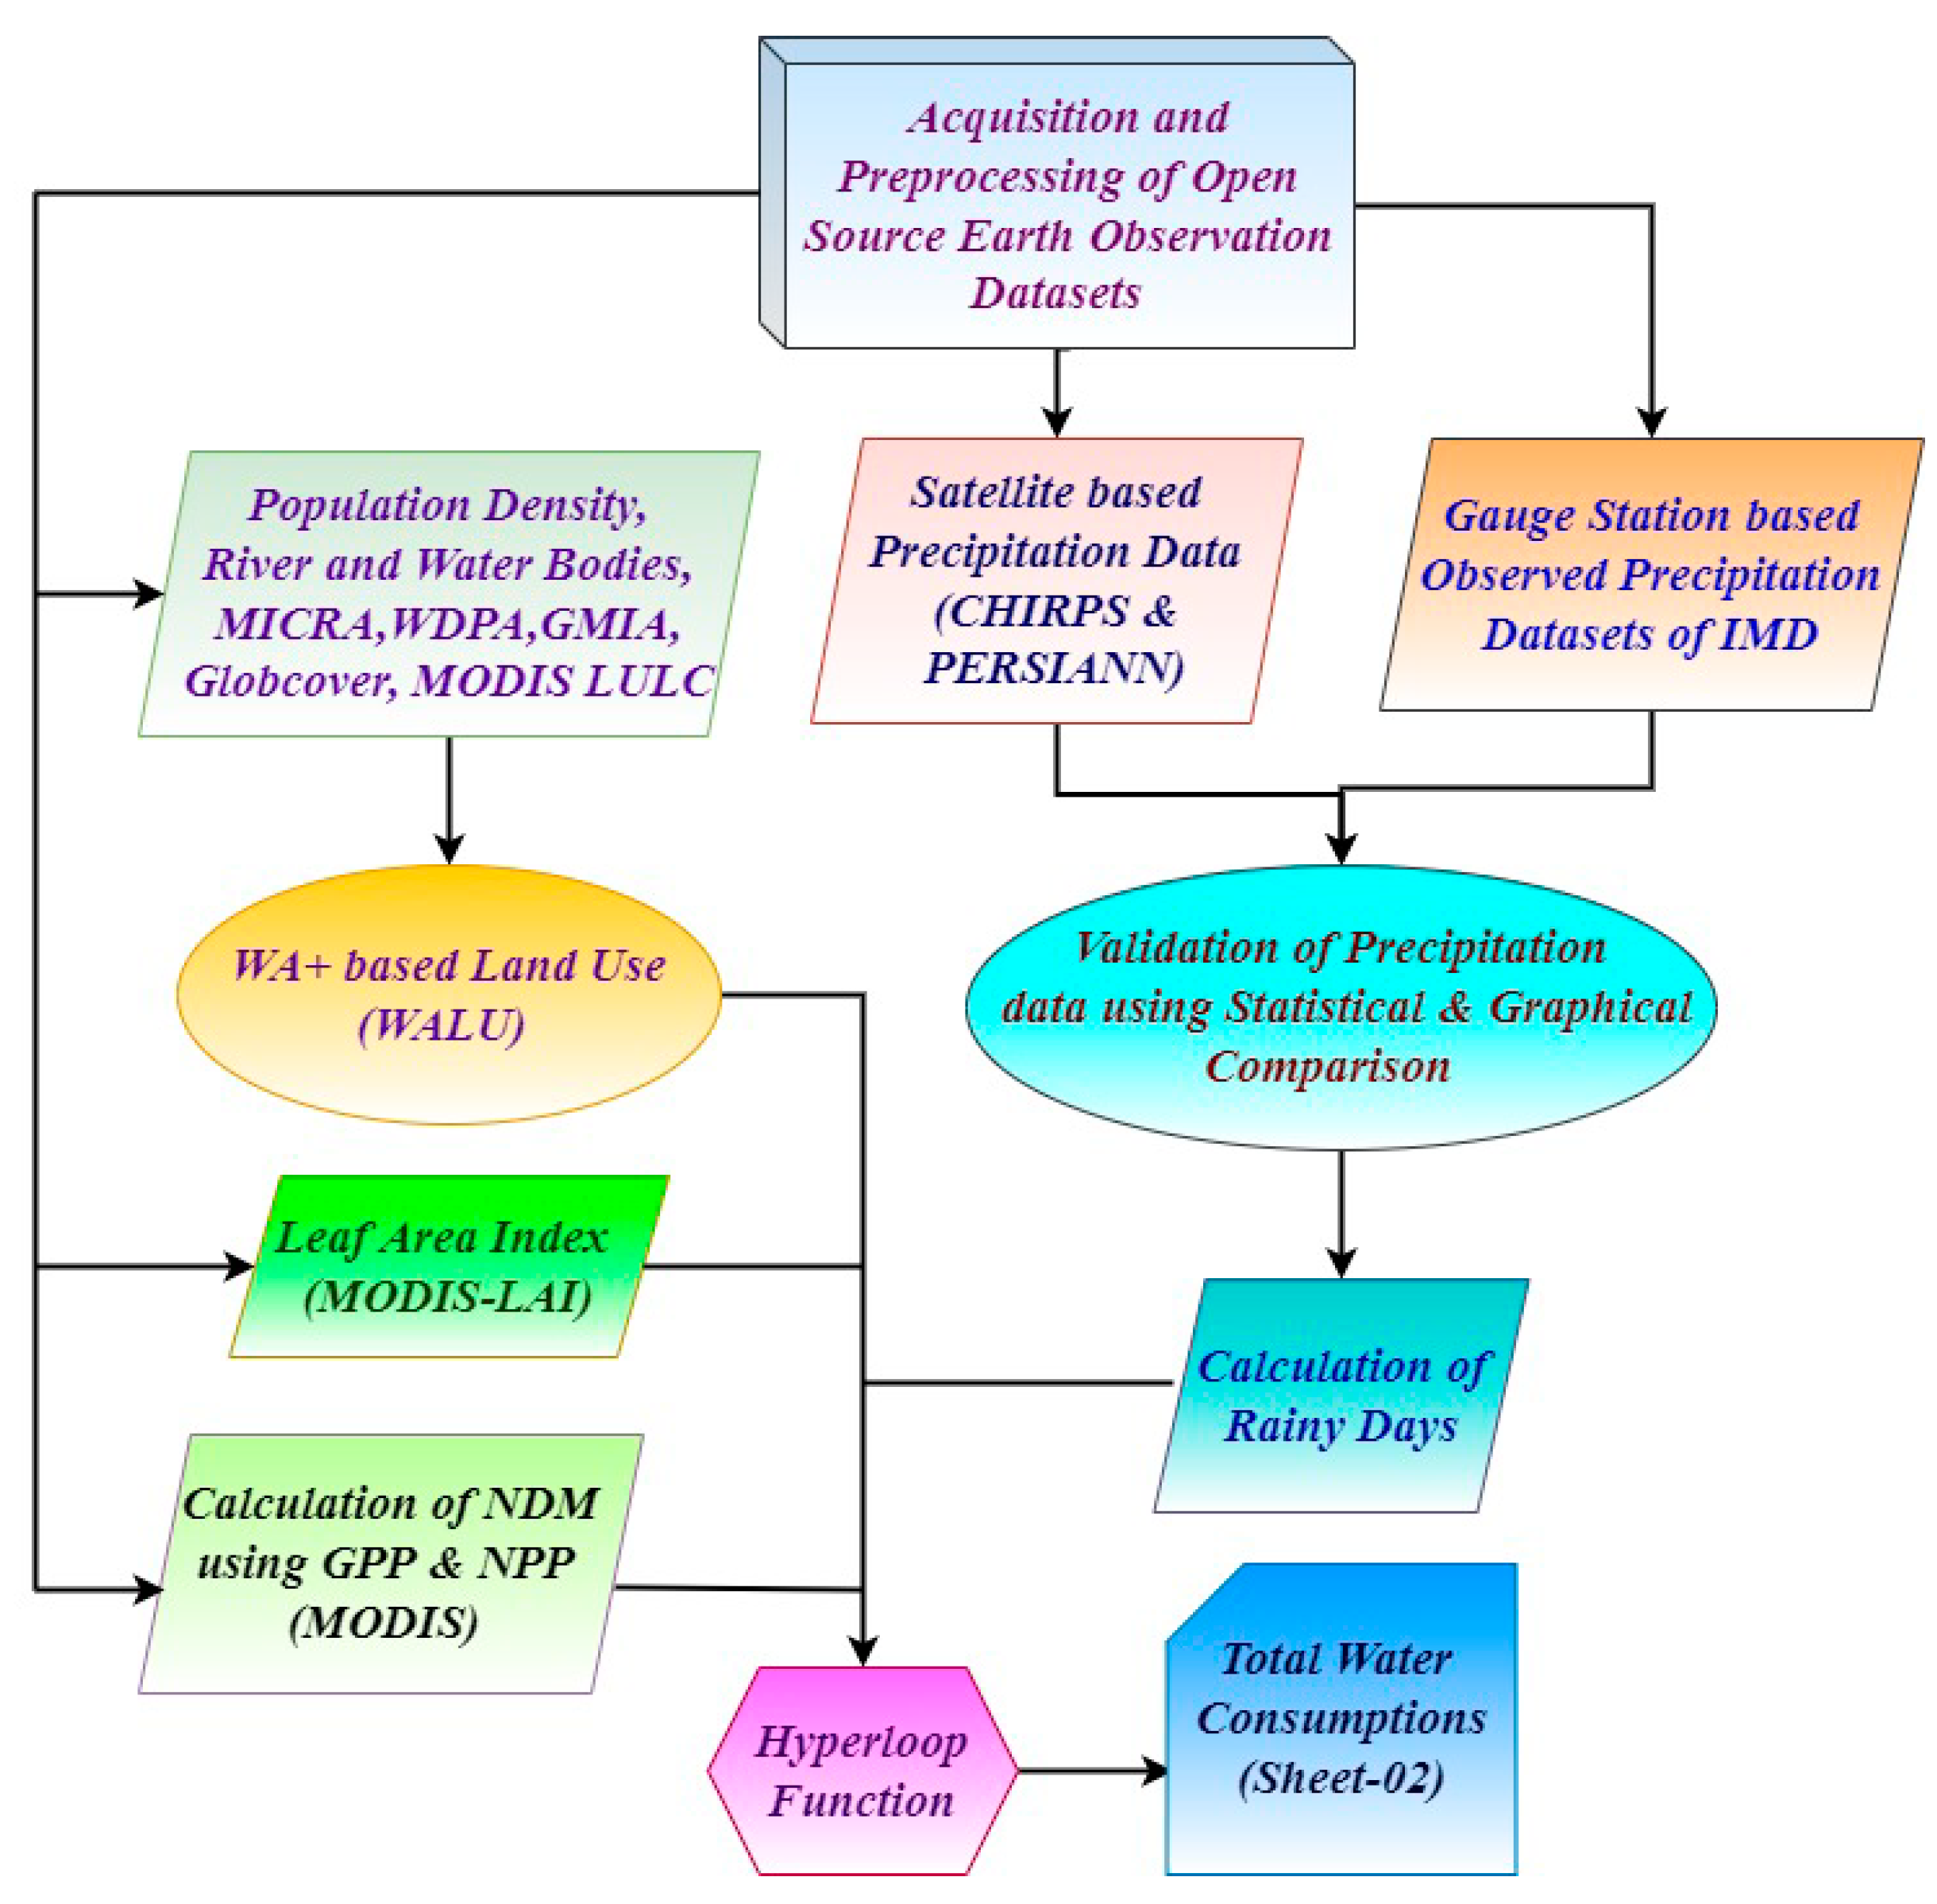
It drains through the hard rock terrain, comprising amphibolites, banded iron formation, calc-silicate rocks, granitoid, gneisses, syenites, tonalite–trondhjemite–granodiorite, pillow lavas, basaltic metasediments, quartzites and Bundelkhand craton’s massive quartz veins, terrigenous sediments of the Vindhyan Super Group, and the Deccan Trap’s basaltic rocks [34,35]. The medium black cotton soil with abundant Kankar (montmorillonite and yellow clay containing carbonate fragments) dominates over the areas in the upper Vindhyan reaches of the southern BRB. The middle reaches are dominated by mixed red and black soil. Alluvial soil forms linear quartz reefs that dominate the northern lower part. As per the National Bureau of Soil Survey and Land Use Planning (NBSSLUP), Nagpur, India, the dominant soil types are clay, clay loam, sandy loam, and silty clay soils [36]. It receives about 918 mm of average annual rainfall. During the monsoon months (July–September), it receives 80% of the total rainfall. The basin’s average minimum and maximum temperatures were recorded as 6.7 °C (mild winter) and 44.2 °C (hot summer), respectively. The basin has an average population density of 295.9 people/km2, with a total population of 20.20 million [37,38].

3. Modeling

The WA+ is a python based framework that facilitates Water Management Classes (WMC)-based estimations of the total water depletion (ET) from any region. The detailed information about the WA+ tool can be acquired from the website: https://www.wateraccounting.org/ (accessed on 3 January 2022) [39]. It is an open-access tool compatible with various open-source earth observation data sets. Several open sources of freely accessible earth observation data sets at different spatio-temporal resolutions are available; a few of them have been used in this study (Table 1).

3.1. Satellte Products

Different satellite products, namely MODIS land use/land cover (LULC), Global Map of Irrigation Areas (GMIA), and GlobCover LC v2, monthly irrigated and rainfed crop areas (MIRCA), World Database on Protected Areas (WDPA) from (UNEP-WCMC), world data on permanent water bodies (perWB), and population density data derived from Indian census, were used for the analysis. The MODIS 8_daily LAI products (MOD15A2H, version 6) were used to estimate LAI. Remotely sensed information using artificial neural networks (PERSIANN) and Climate Hazards Group Infrared Precipitation with Stations (CHIRPS) for the period of 15 years (2003–2019) were used for the estimation of the number of rainy days. The CHIRPS is also free-of-cost, quasi-global rainfall data, which covers 50° S to 50° N and has been available from 1981 to the near-present. CHIRPS was developed by the United States Geological Survey (USGS) to support the United States Agency for International Development Famine Early Warning Systems Network (FEWS NET). The MODIS satellite 8_daily GPP and NPP products were converted into monthly data. Further, monthly GPP and NPP data were used to derive the yearly net dry matter (NDM).

3.2. WA+ Modeling

The total water consumptions (km3/year) of BRB were evaluated as evapotranspiration (ET), evaporation (E), transpiration (T), and interception (I) using the water accounting plus (WA+) framework. We have used five python scripts as WALU map, LAI, rainy days, NDM, and hyperloop in the study for the generation of sheet2, in the form of total water consumption in the basin for four different water management classes [12,13,40,41,42]. The hyperloop function evaluates water consumption based on WALU map, LAI, rainy days, and NDM data. After successfully executing the hyperloop function, the WA+ tool provides sheet 02 with land use categories (protected, utilized, modified, and managed land use), based on details of the total evapotranspiration (ET) and the beneficial and non-beneficial water components. WA+ quantifies total ET in the form of sheet 02 for any region using steps viz., i.e., (i) generating water accounting and land use (WALU) map, (ii) estimating monthly leaf area index (LAI), (iii) estimating the number of rainy days, (iv) calculating net dry matter (NDM) using net primary product (NPP) and gross primary product (GPP), and finally, generates Sheet 02 having detailed of total ET. The adopted methodology of this study is shown in the schematic diagram (Appendix A).

4. Results and Discussion

This research aims to assess the WA+ based total water consumption (beneficial and non-beneficial consumption) by estimating the total evapotranspiration from all types of land use classes in the basin.

4.1. Generation of WA+ Based LULC Map (WALU-Water Accounting and Land Use)

The impact of land use and land cover (LULC) on the water balance, environment, and regional climate and ecosystem services of a basin is significant. Land cover denotes a biophysical state of earth’s ground surface, while land use refers to the way or manner in which the land is being used [43]. Thus, the information of accurate and up-to-date land use maps is explicitly required to run the WA+ water accounts. The WA+ framework classifies LULC into broad groups of 80 possible classes. These LULC classes are further arranged into four major water management categories (WMC), namely “Protected/Conserved Land Use” (PLU), “Utilized Land Use” (ULU), “Modified Land Use” (MLU), and “Managed Water Use” (MWU) (Table 2). These four WMC classes were developed based on common management characteristics of LULC classes and their degree of influence on natural ‘hydrologic cycle’. PLU corresponds to protected areas, viz. reserved forest areas, RAMSAR sites, national parks, wildlife sanctuaries, and coastal protection zones, where anthropogenic interventions are prohibited. The class ULU represents the area with minimal human intervention and low to moderate resource utilization, such as woodlands, natural pastures, savannahs, mountainous shrubs, riparian corridors, wetlands, etc. The water flow is essentially natural. The ‘MLU’ relates to the anthropogenic modification of land use to improved usages, such as the land use that has been changed for livelihood, including urban encroachment, biofuel crops, rainfed cropland, and timber plantations, etc. Water is not detoured, but land use affects all physical processes in the unsaturated zone, including infiltration, storage, percolation, and root hydration, affecting the soil water balance. The ‘MWU’ corresponds to the elements of the landscape that are accountable to withdrawals using anthropogenic infrastructure, such as dams, weirs, canals, irrigated agriculture, ditches, gates, pipes, pumping stations, etc., to manage the water resources.
The WMC-based LULC map for the WA+ tool has been prepared (Table 3). A total of 14 LULC types were incorporated in the WALU map of the BRB. PLU shares 3 WMC-based LULC types (protected forest, protected shrubland, and protected natural water bodies) out of the total 14 LULC types, covering 0.2% of the total basin area. The ULU also accounts for 3 WMC-based LULC types (closed deciduous forest, shrubland and mesquite and brooks, rivers and waterfalls) out of the total 14 LULC types, occupying 25.25% of the total area of BRB. The MLU shares a maximum of 5 WMC-based LULC types (forest plantation, rainfed crops–cereals, rainfed crops-vegetables and melons, fallow and idle land, rainfed industry parks, and outdoor) out of the total 14 LULC types, holding 11.1% of the total area of the basin. The MWU shares 3 WMC-based LULC types out of the total 14 LULC types (irrigated crops–cereals, irrigated homesteads and gardens (urban cities)–outdoor, and irrigated homesteads and gardens (rural villages)–outdoor) and accounts for the 63.46% of the total area of the basin. Among all the WMC-based LULC types, the irrigated crops–cereals LULC-type accounts for the highest of 62.06% of the total area of the basin, followed by shrubland and mesquite LULC-type with 17.87% and rainfed crops –cereals LULC types with 8.25% of the total area of the basin. Singh et al. [33] have also reported agricultural land as the dominant LULC class of the BRB.

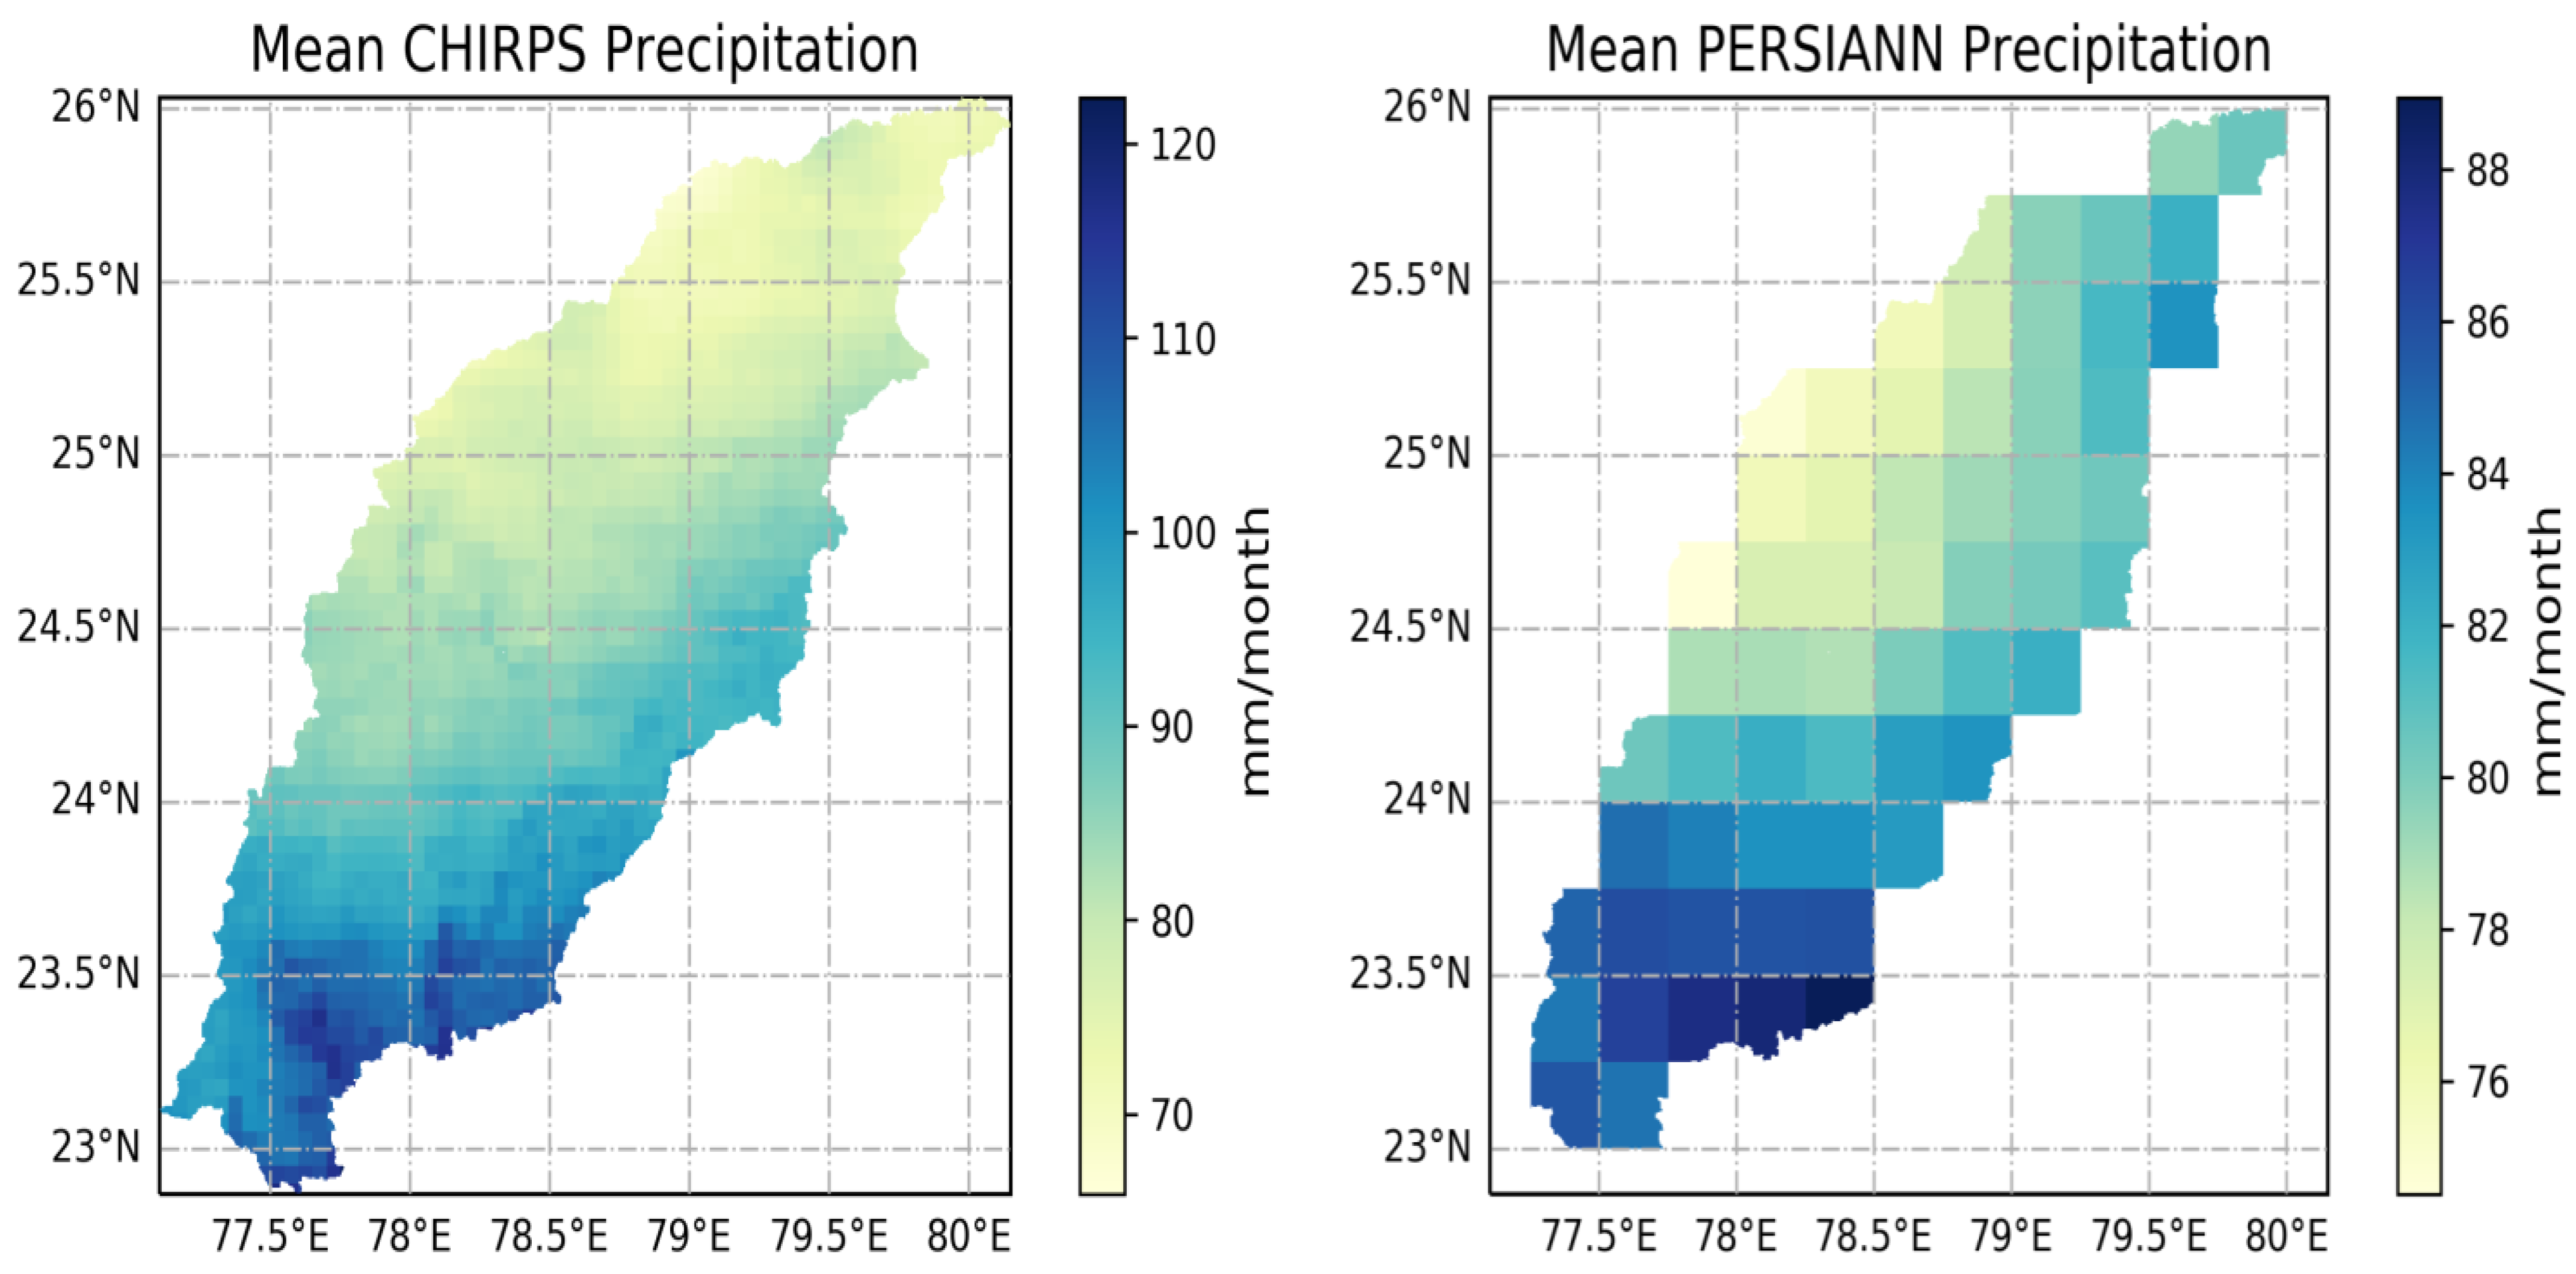
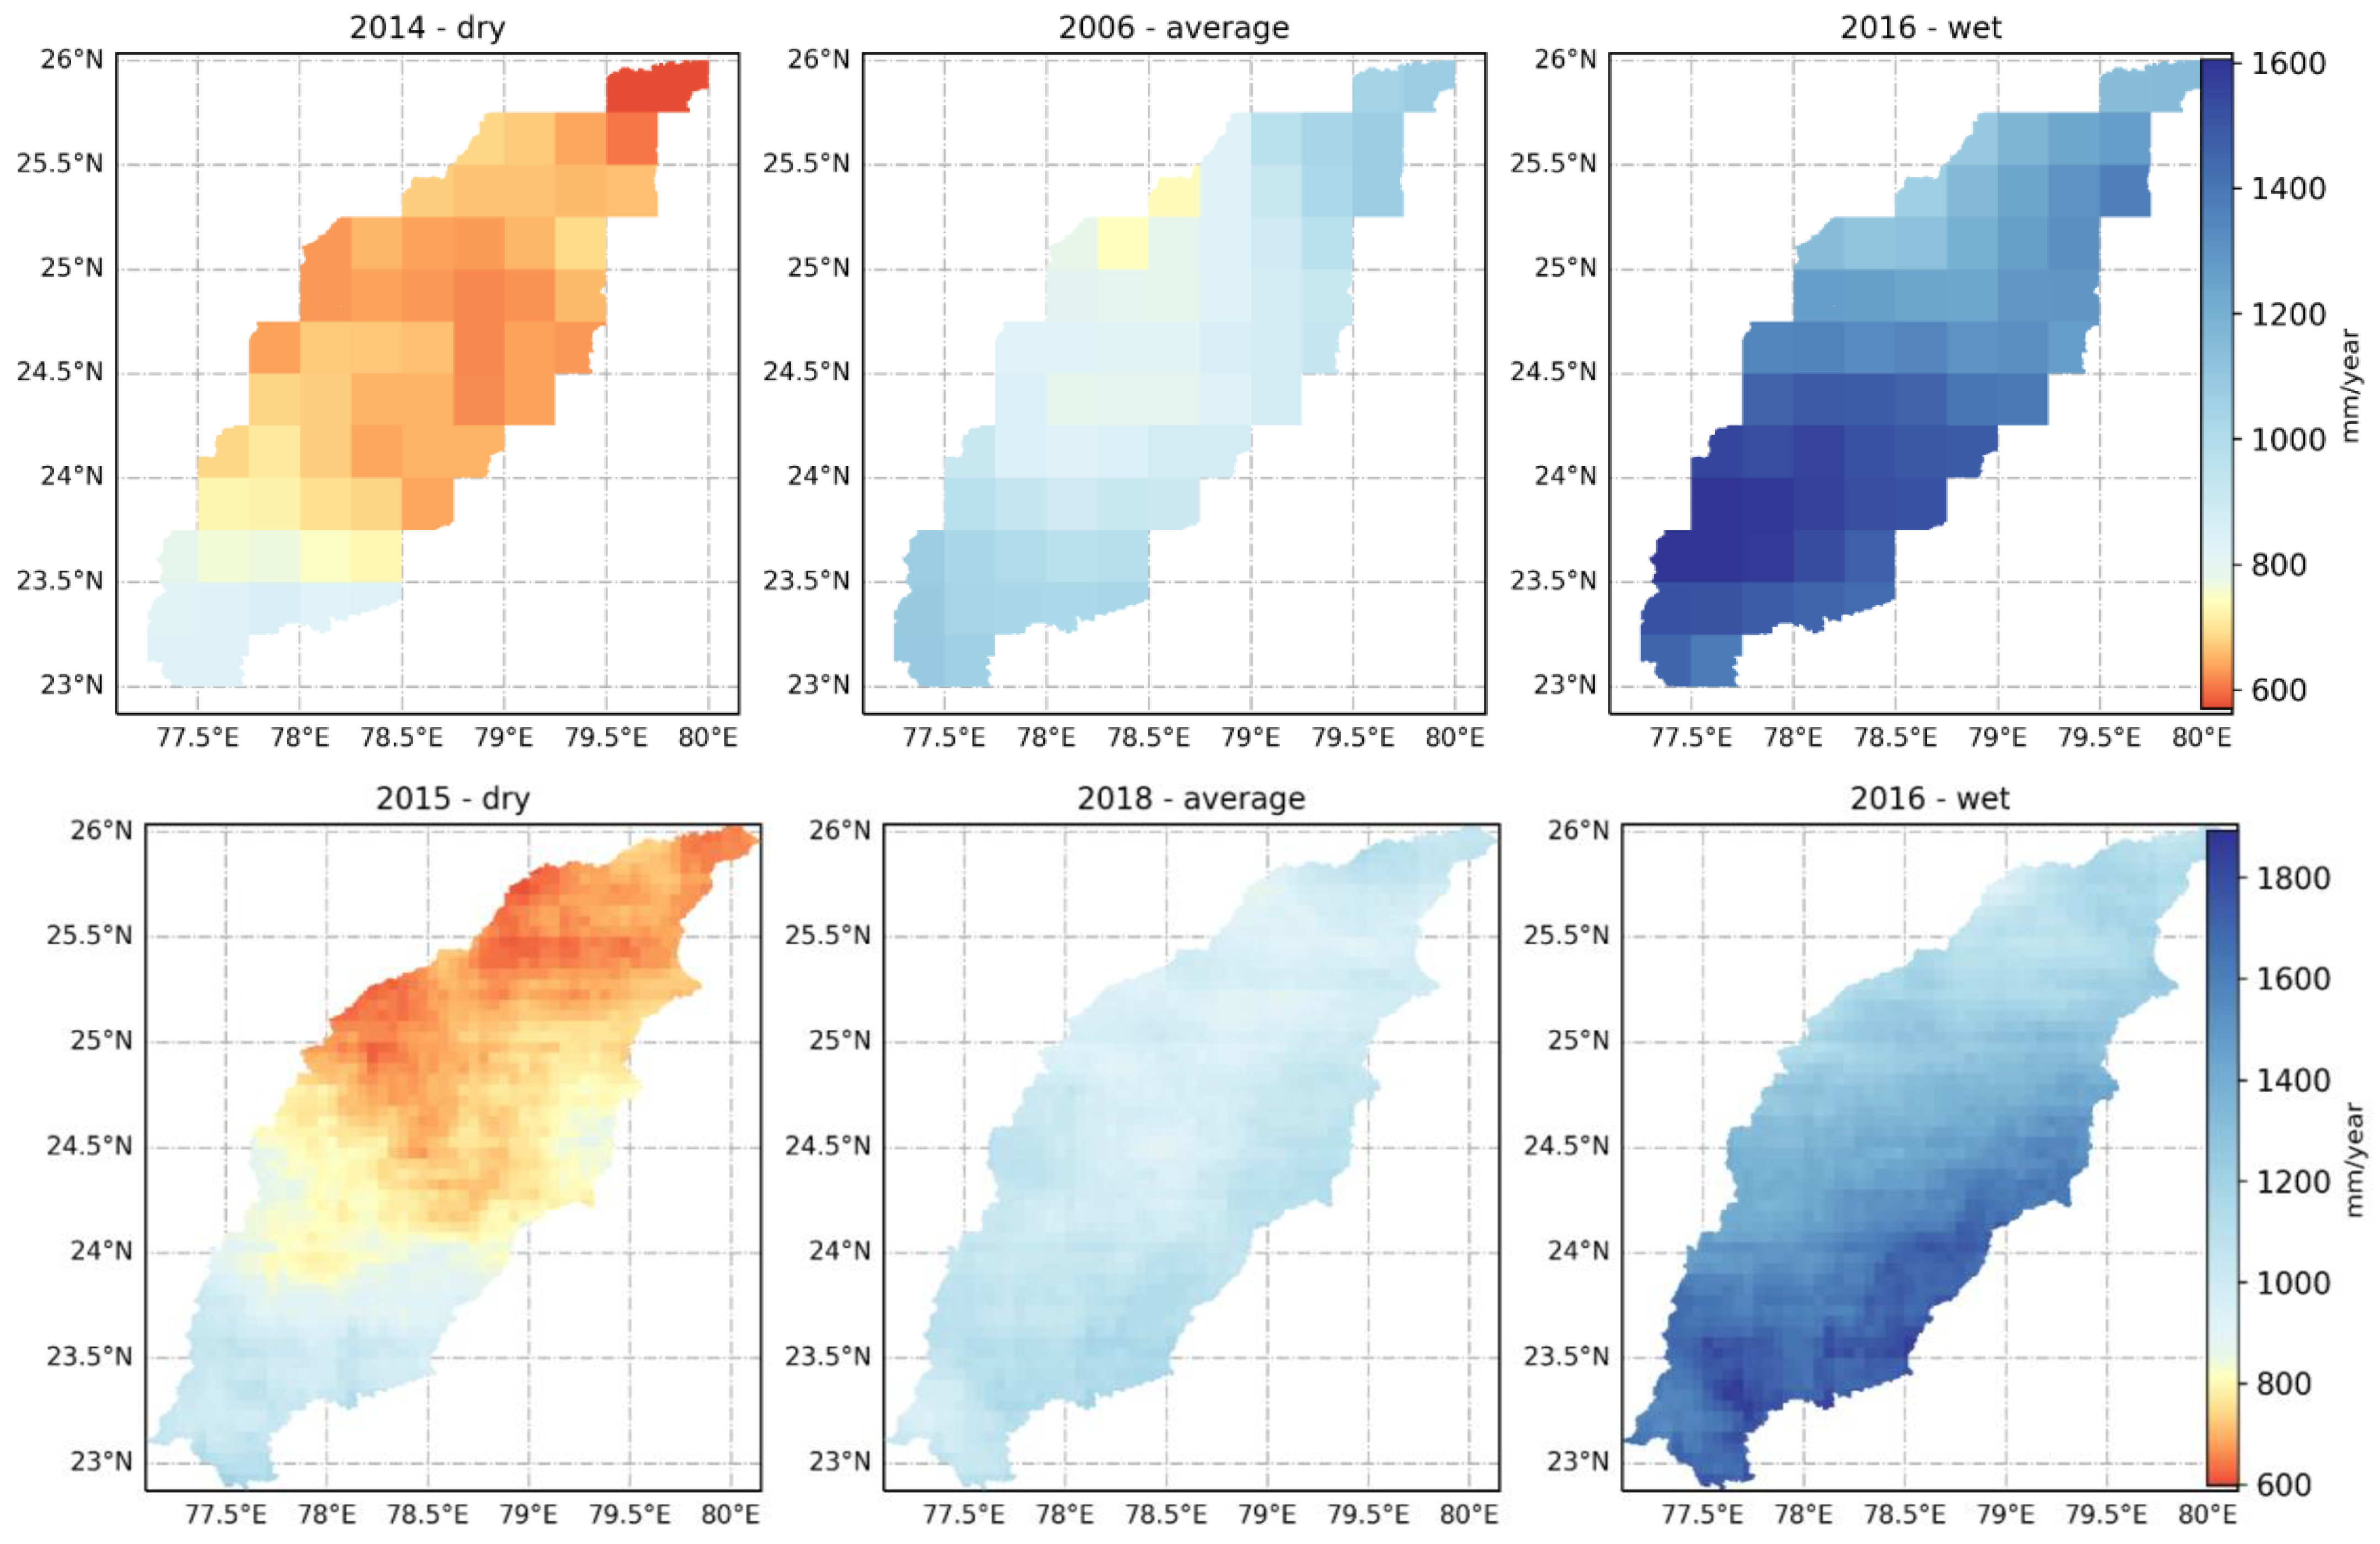
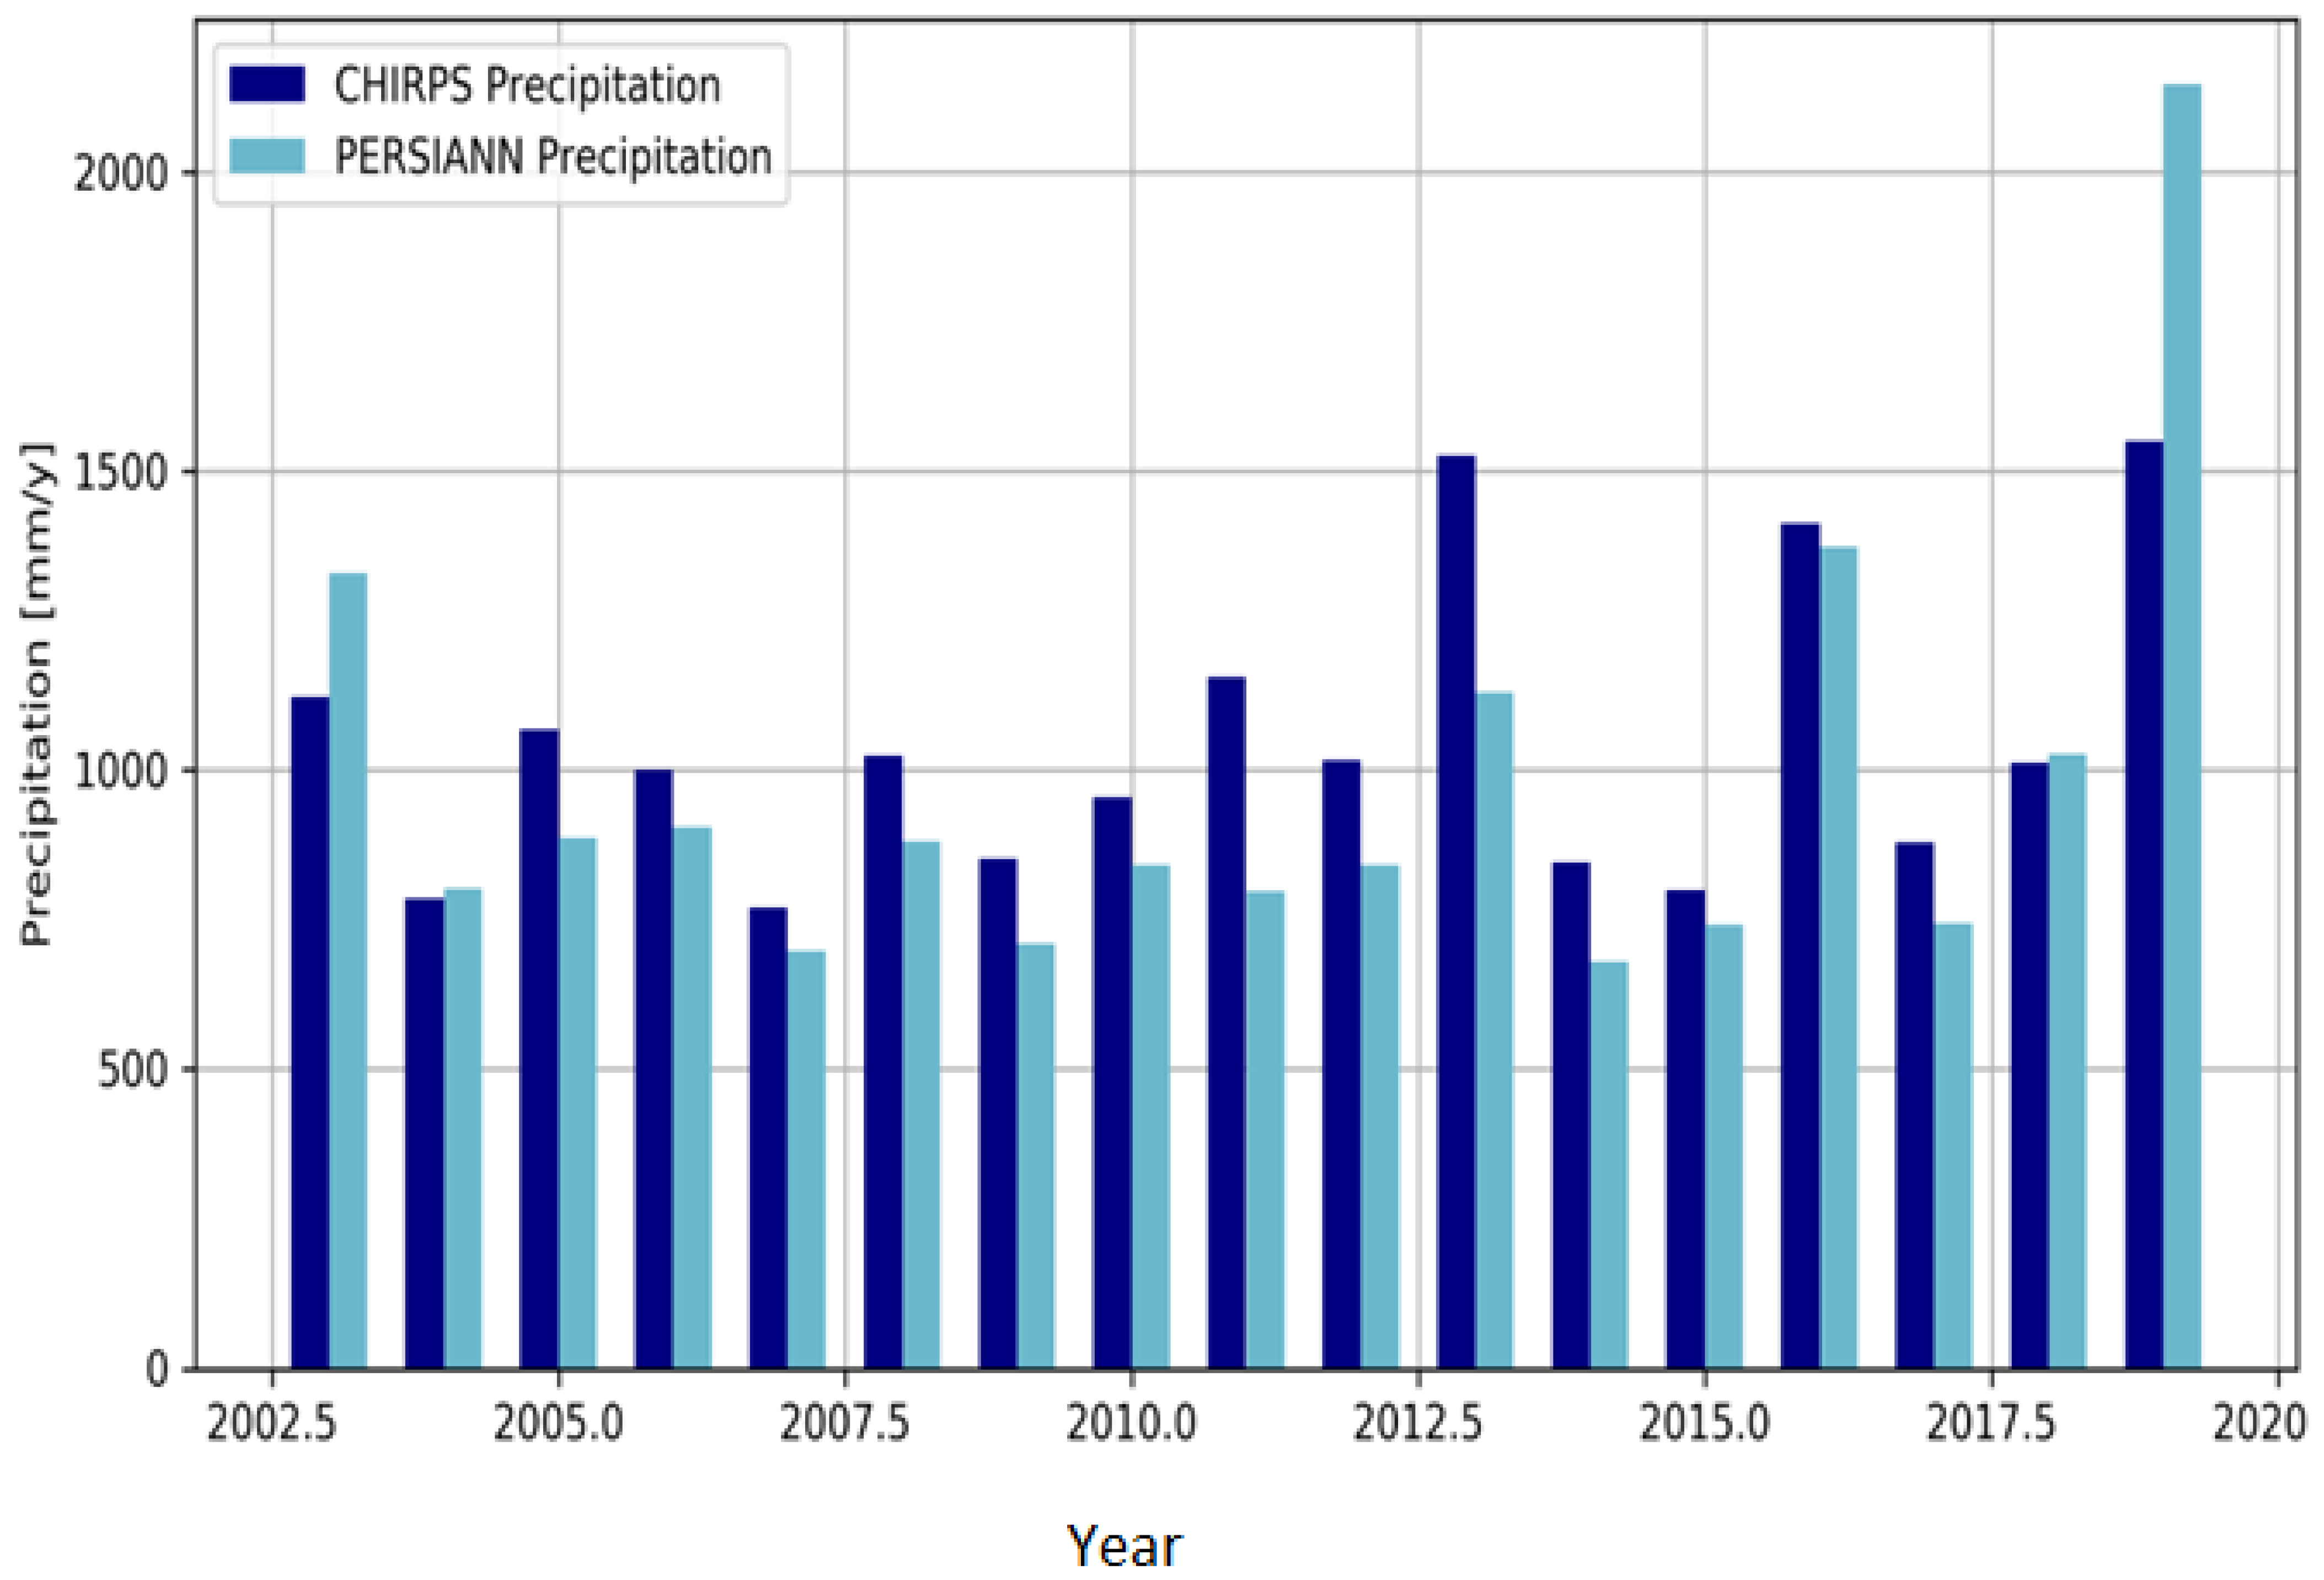
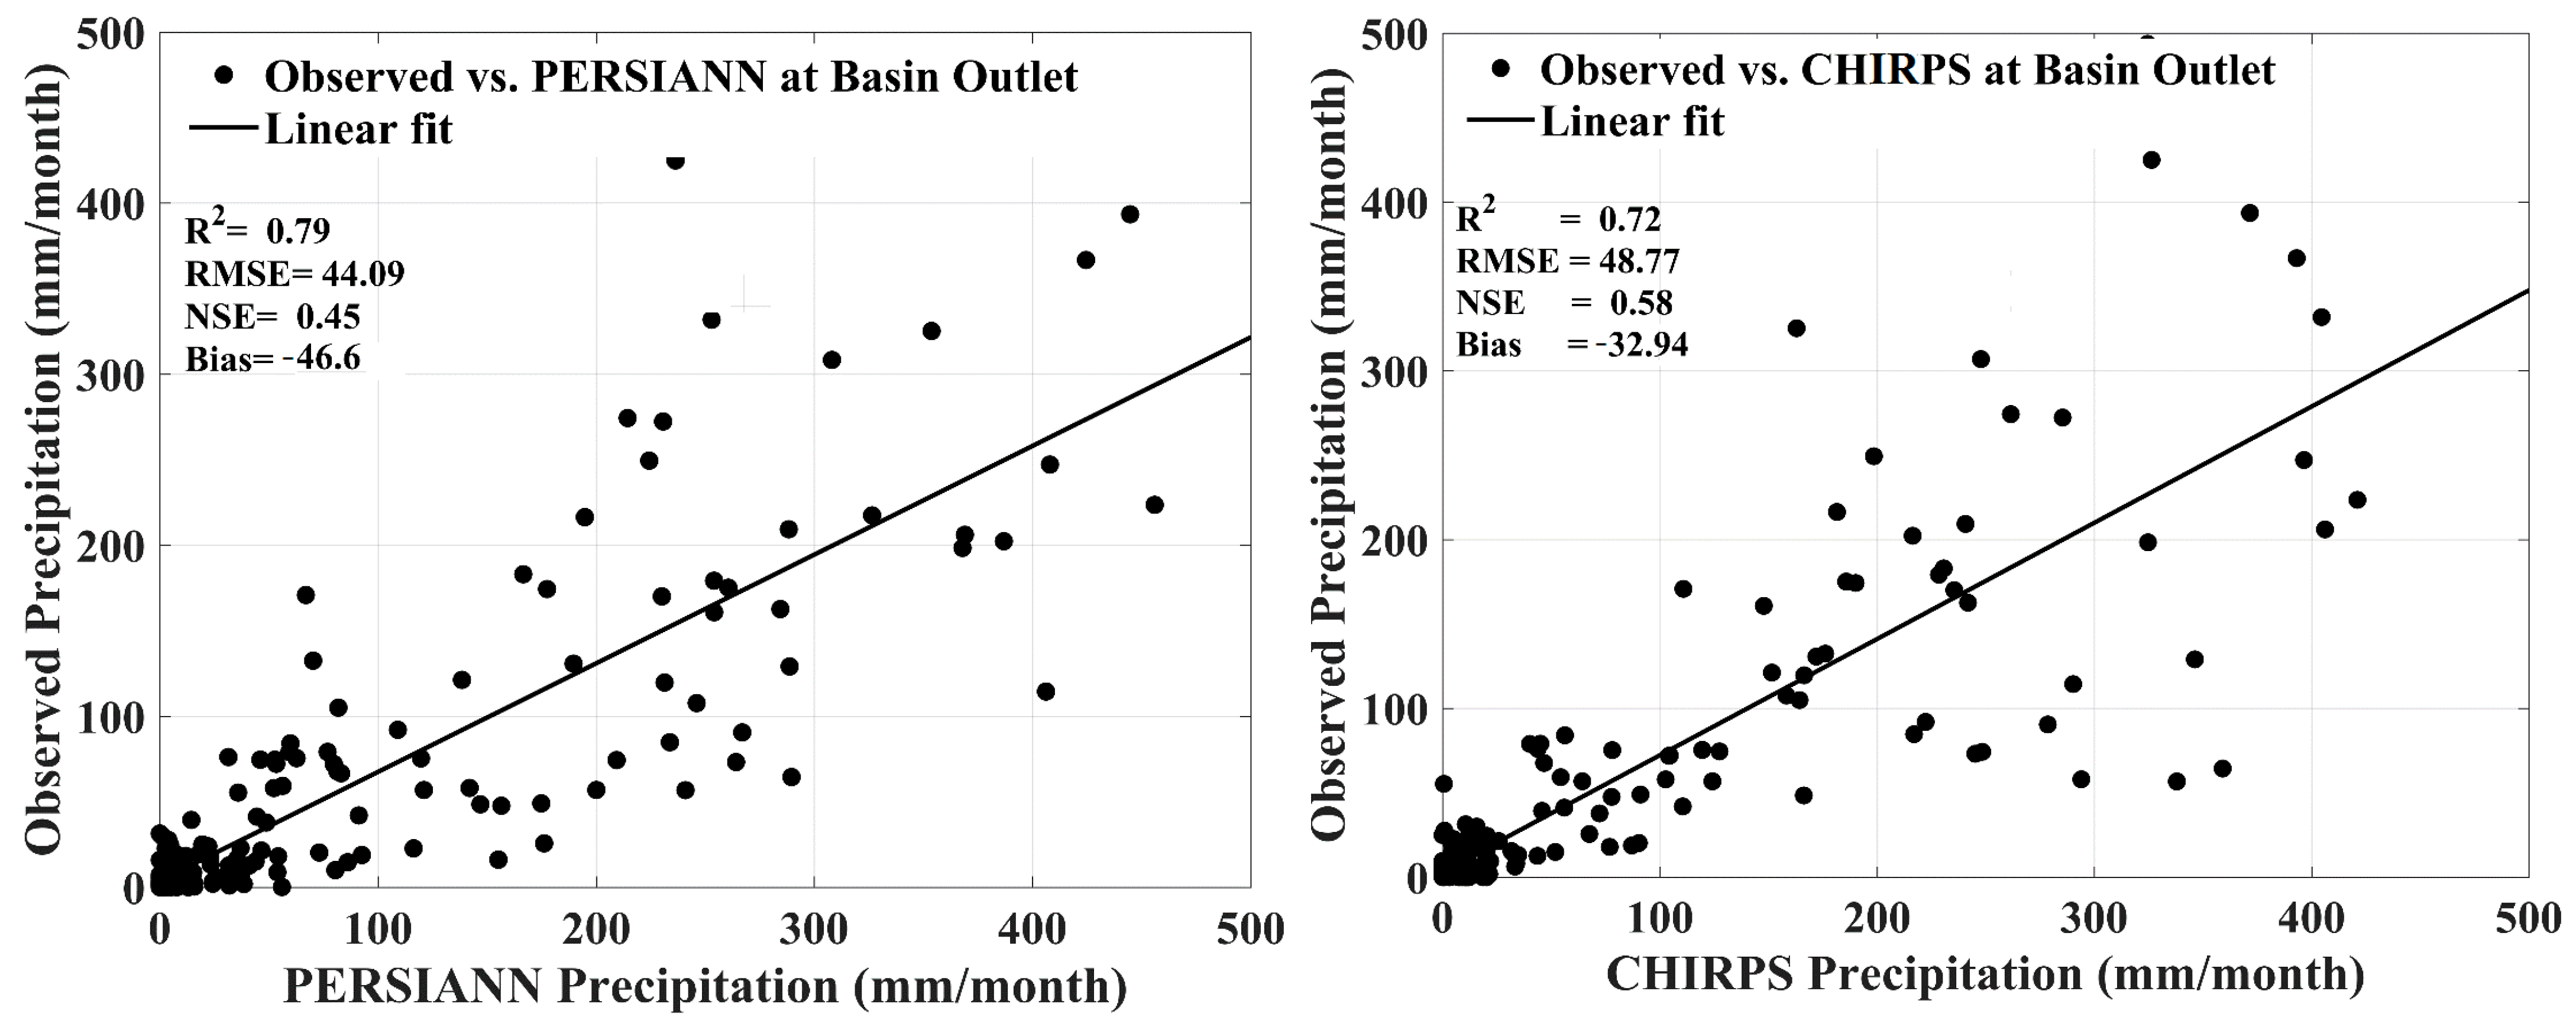
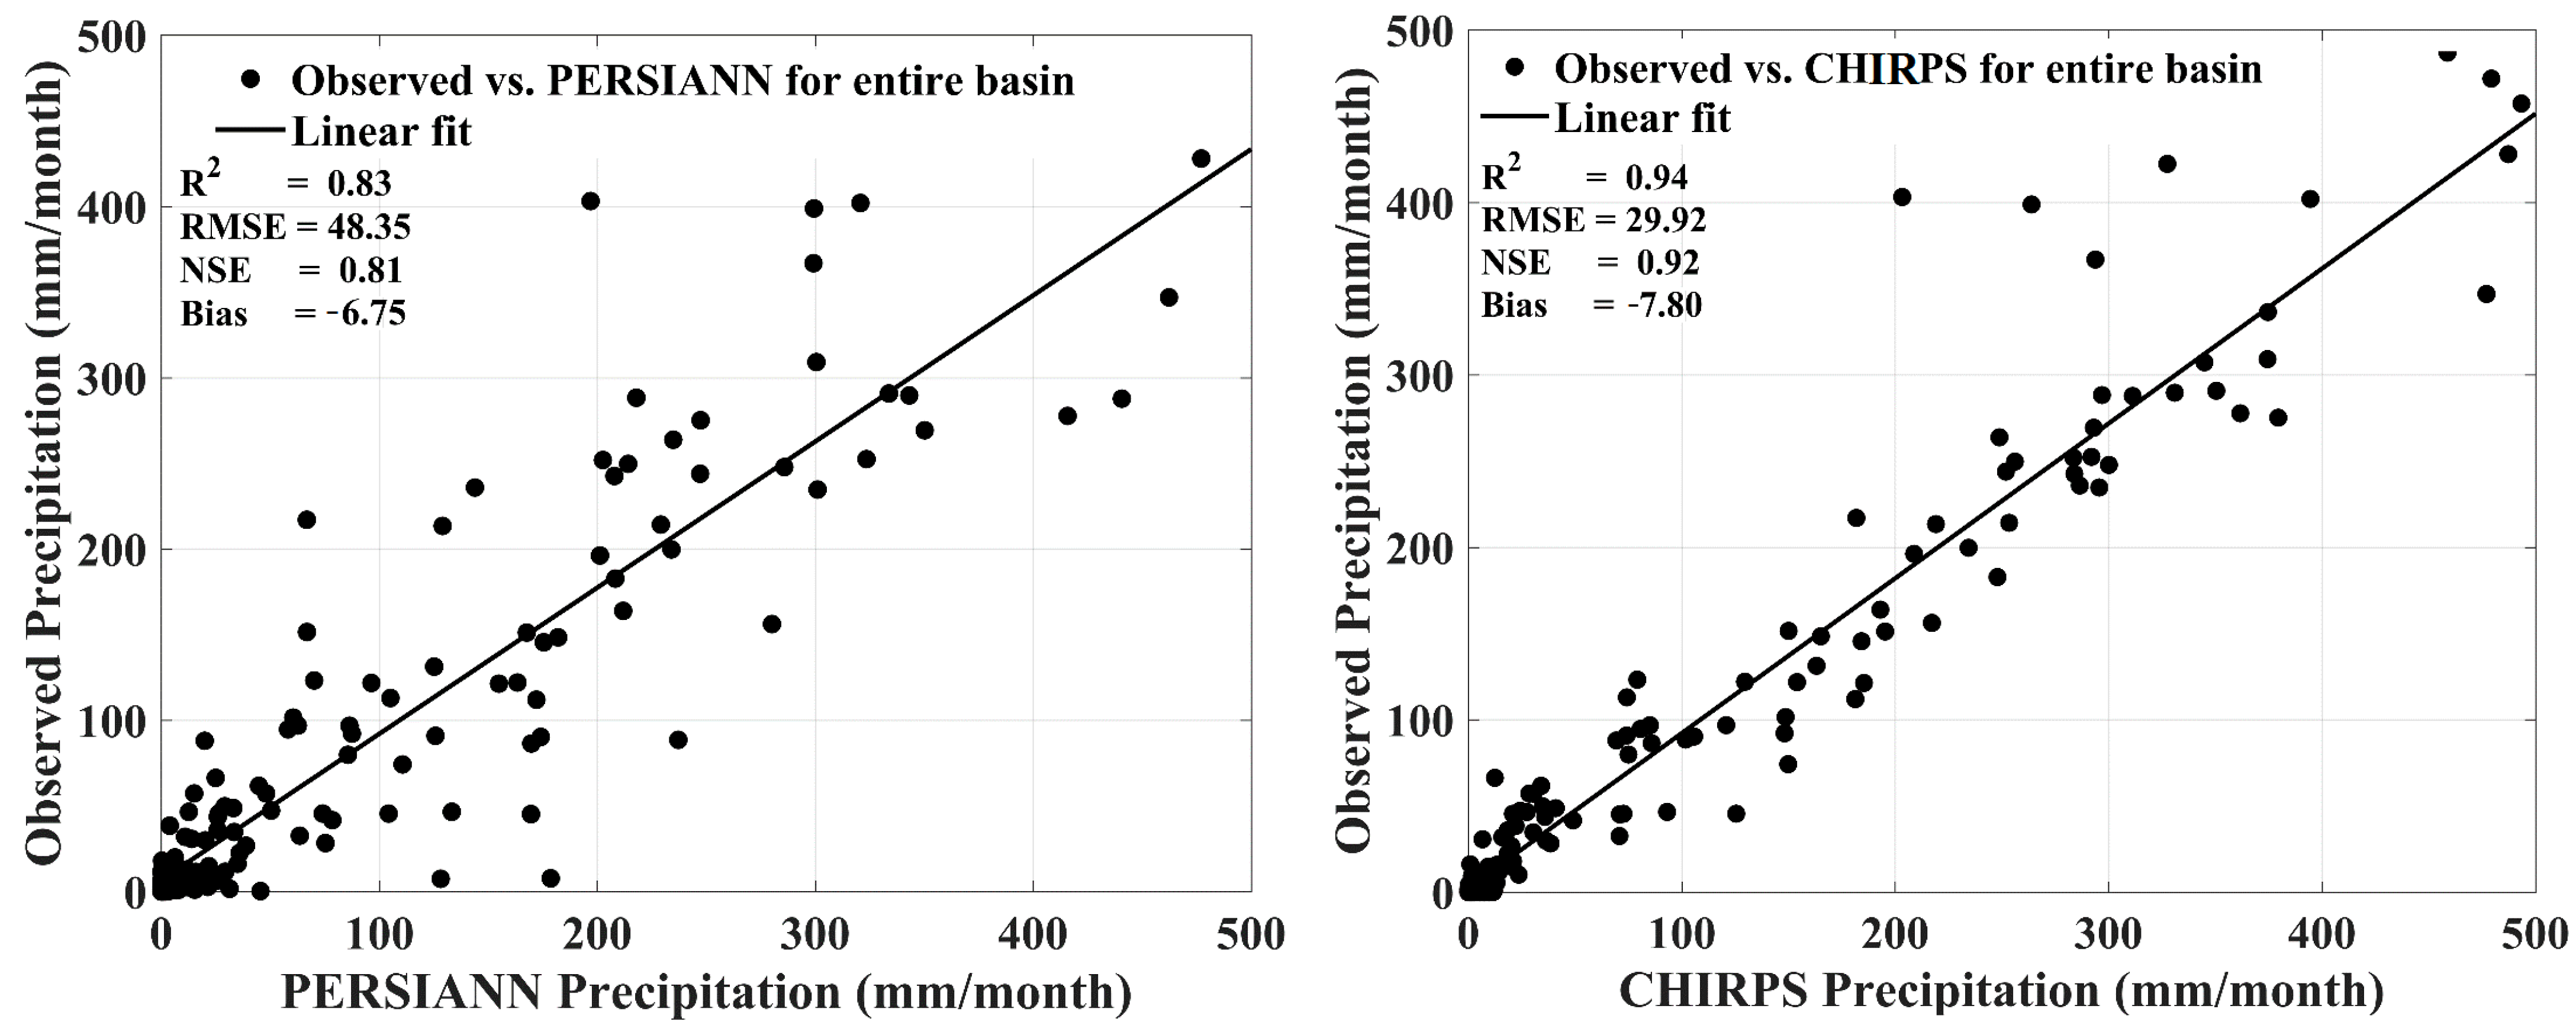
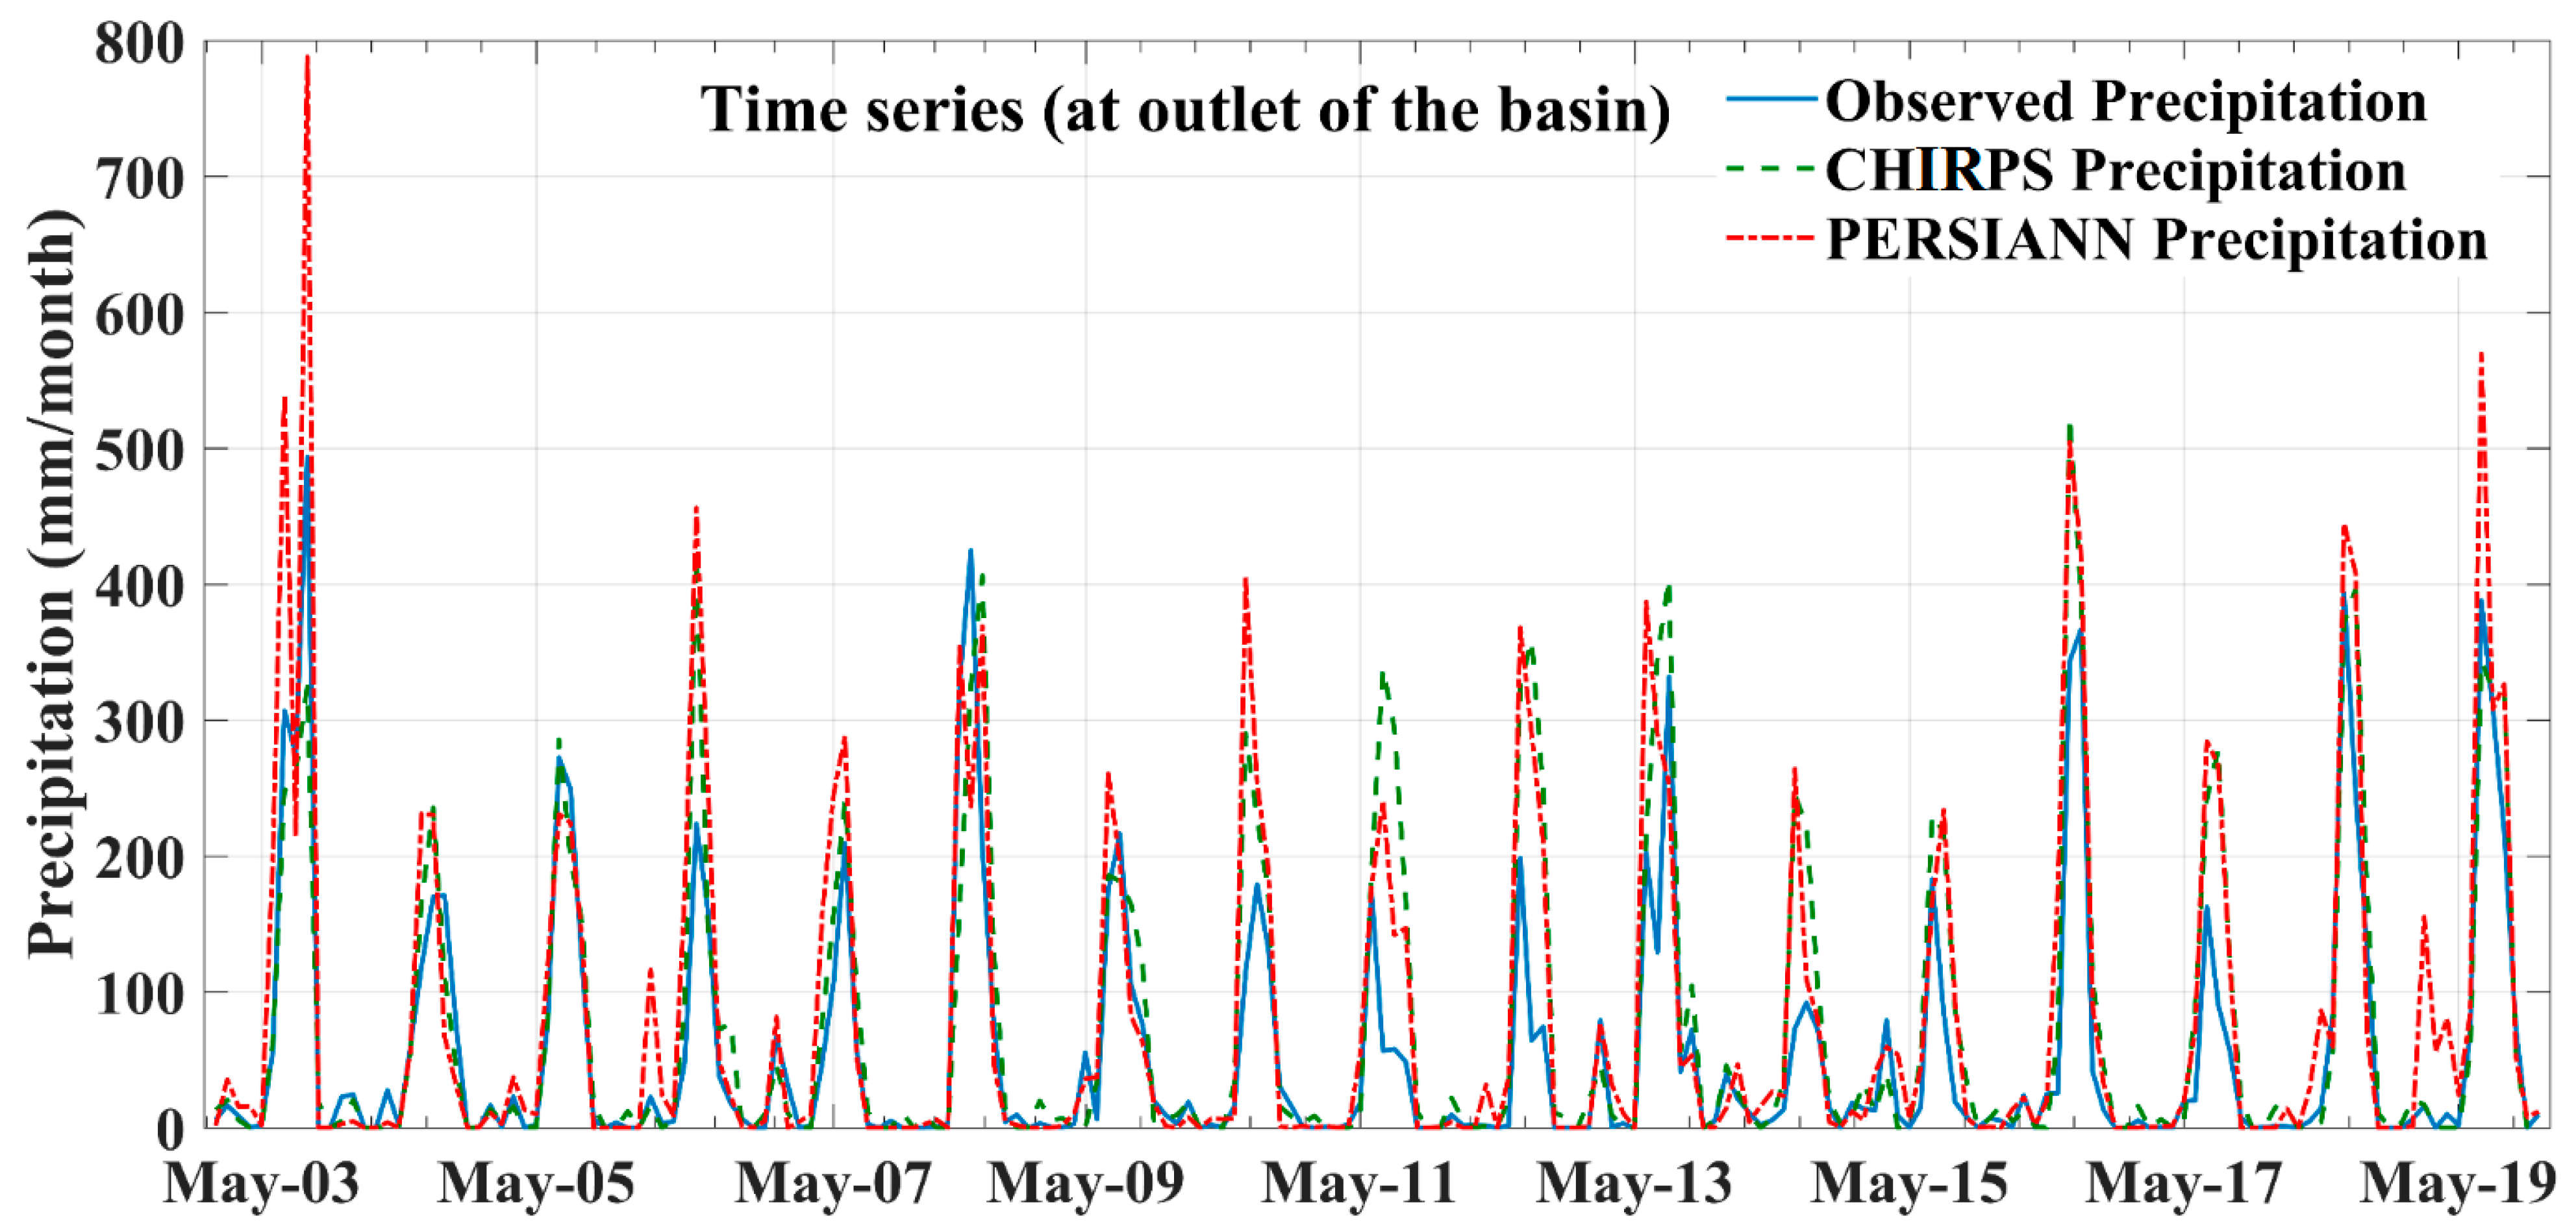
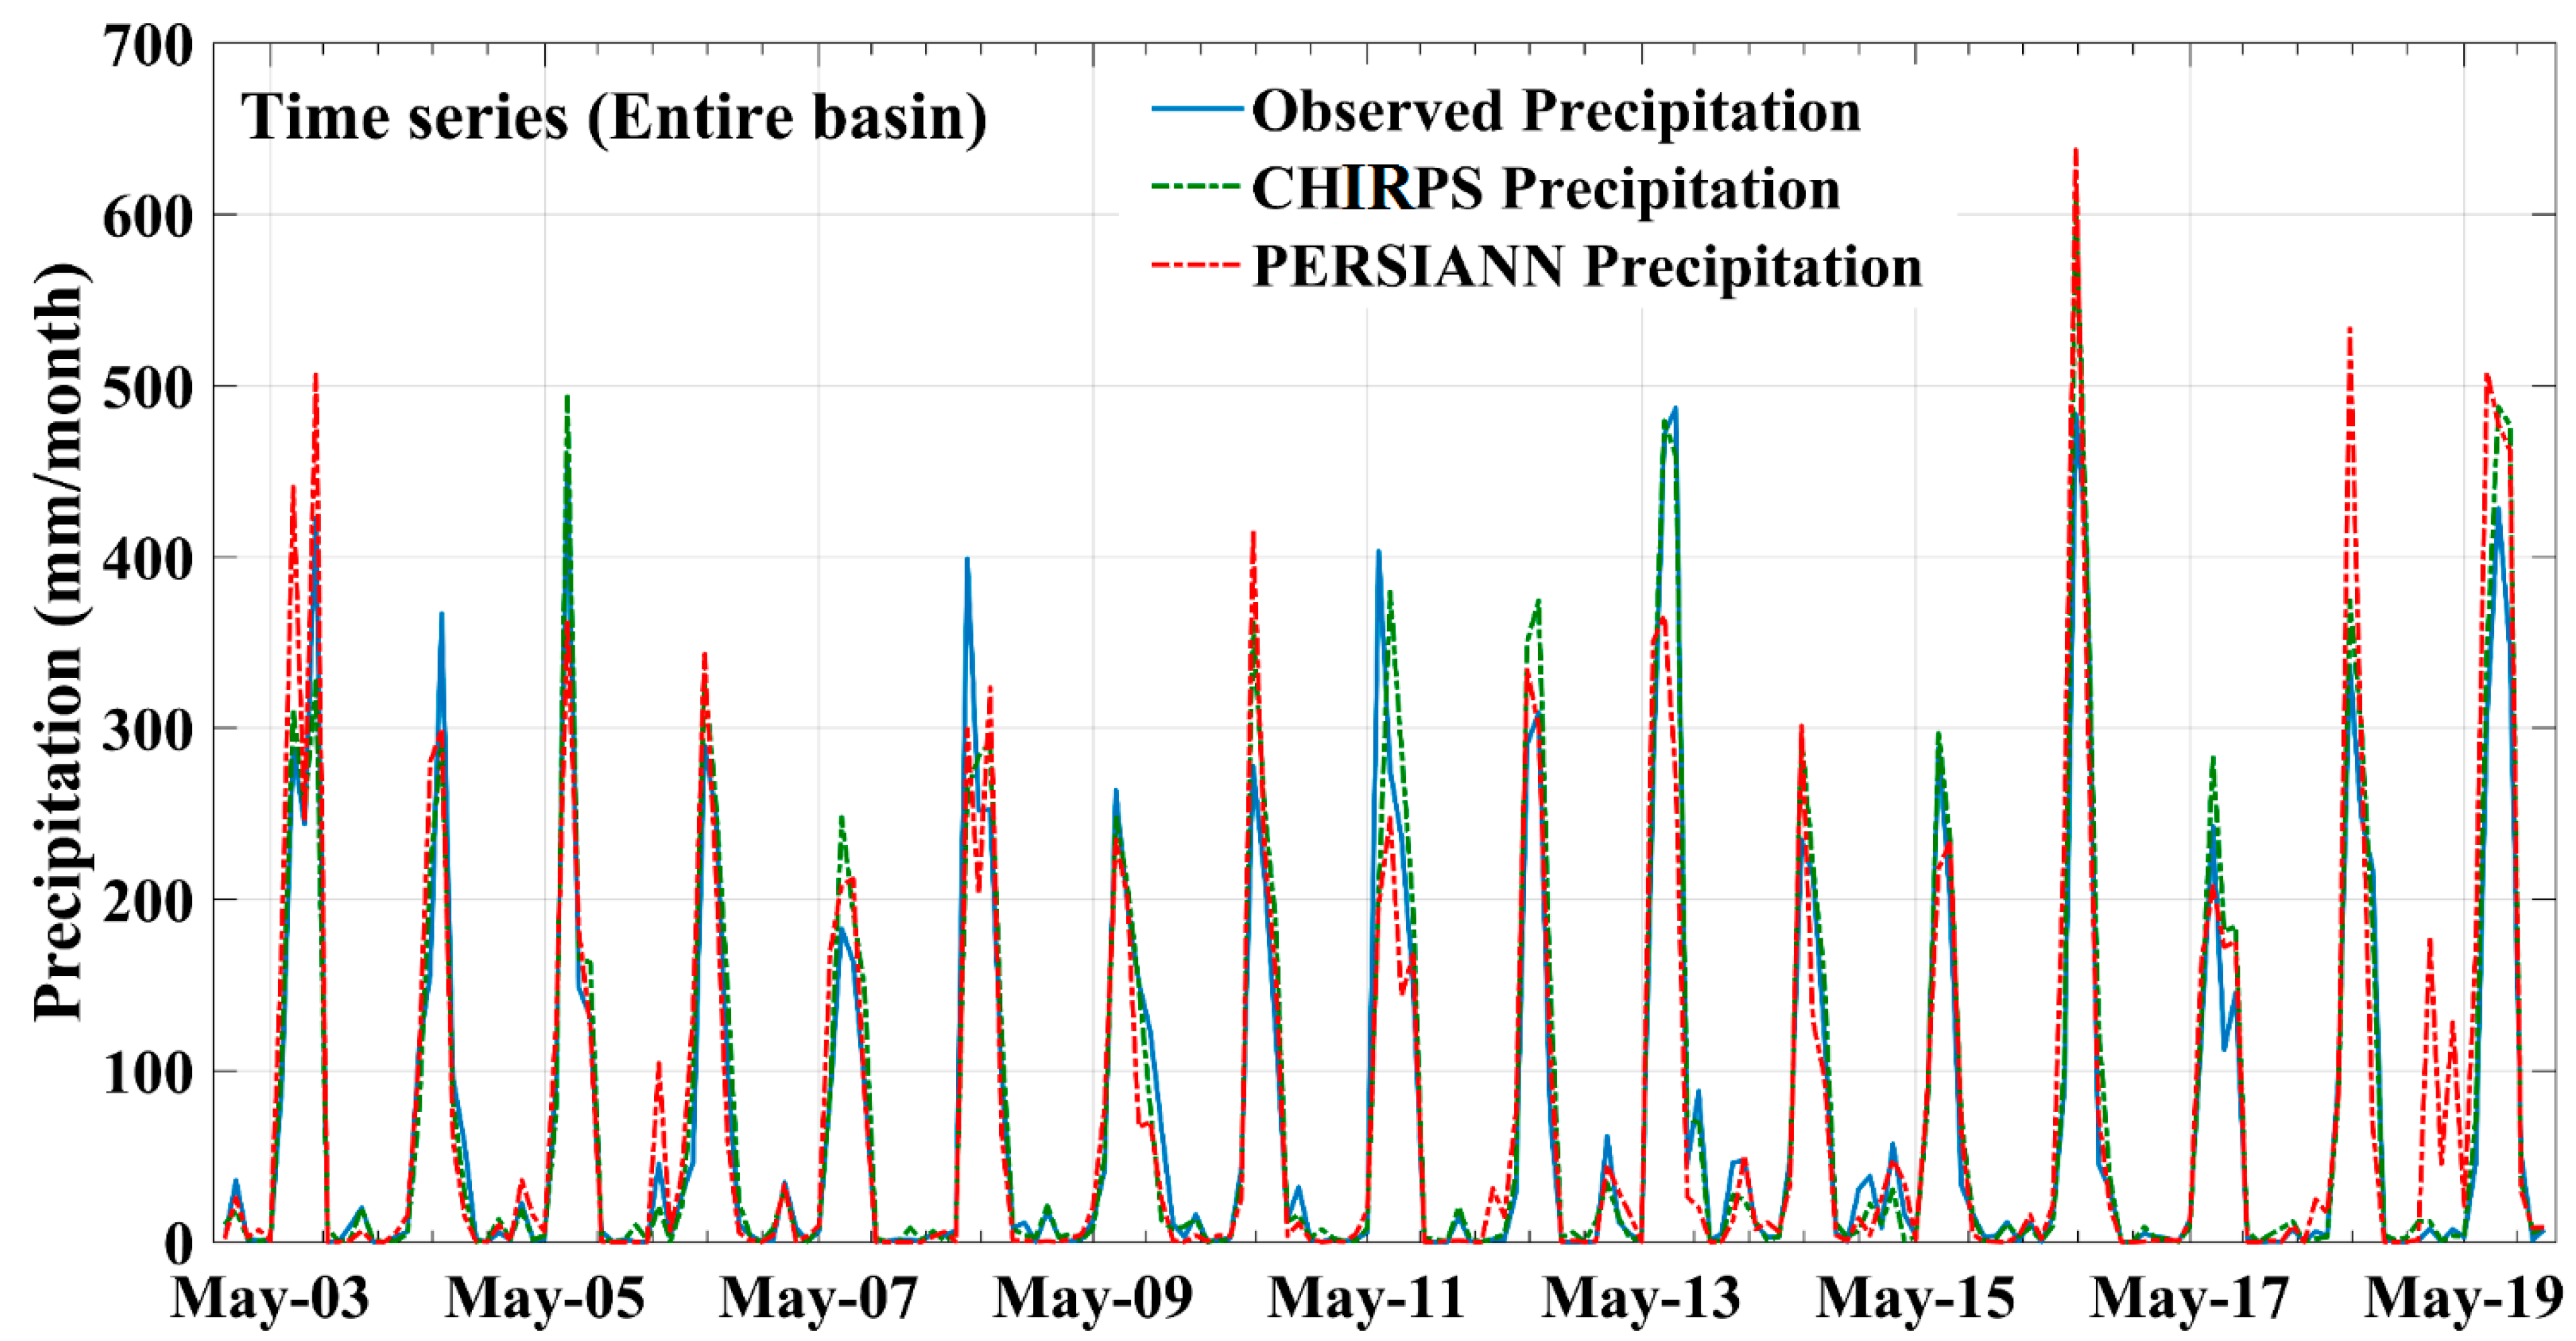
4.2. Spatio-Temporal Distribution of Rainfall

The daily precipitation data of the PERSIANN [44] and CHIRPS was used to estimate the number of rainy days. PERSIANN and CHIRPS daily precipitation data were downloaded from the Climate Engine [45] at a spatial scale of 0.25° × 0.25°. It is freely available to download from several web-based interfaces, including the Center for Hydrometeorology and Remote Sensing (CHRS), USA [44,46,47,48,49]. The analysis of the precipitation data was performed from 2003 to 2019, due to the availability of the observational data. Considering the uncertainties associated with satellite-based rainfall data, their reliabilities must be validated with observed datasets [50]. The mean monthly precipitation derived from CHIRPS showed variation in spatial distribution from 70 mm/month in the lower and middle basins to 120 mm/month in the upper basin (Figure 2). The dry, average, and wet years were reported for CHIRPS precipitation for 2015, 2018, and 2016, respectively (Figure 3). However, the dry, average, and wet year for PERSIANN were found in 2014, 2006, and 2016, respectively. The mean monthly precipitation derived from PERSIANN data showed lower variations, with a minimum of 76 mm/month to a maximum of 88 mm/month for the lower middle and upper portions of the basin, respectively. The analysis showed that the upper southeast portion of the basin receives higher precipitation, whereas the middle and lower parts of the basin receive lesser precipitation. The average annual precipitation derived from PERSIANN and CHIRPS datasets showed that the CHIRPS datasets had a higher amount of precipitation than the PERSIANN datasets throughout the study period. The maximum and minimum amounts of average annual precipitation in the basin derived from CHIRPS precipitation data were 1510 and 840 mm/year, whereas PERSIANN showed 2040 and 680 mm/year, respectively (Figure 4).

Validation of PERSIANN and CHIRPS with the IMD datasets

The PERSIANN and CHIRPS rainfall data sets were compared with the observed gridded rainfall data of the Indian Meteorological Department (IMD), and their performances were assessed through the goodness of fit statistics, including different statistical criteria, such as root mean square error (RMSE), Pearson correlation coefficient, bias, and Nash–Sutcliffe efficiency (NSE) (Table 4). The comparison of PERSIANN and IMD depicted the R2, RMSE, NSE, and PBIAS values as 0.79, 44.09, 0.45, and −46.6, respectively. However, the comparison of CHIRPS and IMD showed the R2, RMSE, NSE, and PBIAS values as 0.72, 48.77, 0.58, and −32.94, respectively, at the outlet (Figure 5). Further, the comparison was also made for the entire basin. The comparison of PERSIANN and IMD showed R2, RMSE, NSE, and PBIAS values as 0.83, 48.35, 0.81, and −6.75, respectively. However, the comparison of CHIRPS and IMD showed a good correlation of R2, RMSE, NSE, and PBIAS values as 0.94, 29.92, 0.92, and −7.80, respectively, for the entire basin (Figure 6). It was found that CHIRPS precipitation showed its usefulness, followed by PERSIANN, over the entire basin and at the outlet. Researchers such as Ali and Mishra [51], Prakash [52], Musie et al. [53], Gupta et al. [54], and Dembele et al. [55] have also compared the CHIRPS satellite-based precipitation data with IMD for hydrological analysis over different Indian regions and reported a significant positive correlation between them. In this study, the CHIRPS dataset showed better and positive correlation (>0.5) with IMD for the entire basin and at the outlet, as compared to the PERSIANN, which showed the positive correlation. Hence, the CHIRPS precipitation data was found to be more reliable for estimating total water consumption in the basin.
The precipitation products from PERSIANN and CHIRPS were also evaluated for their seasonality, maxima, and minima with IMD from 2003 to 2019. The time series plots have been developed between the observed precipitation data of IMD, PERSIANN, and CHIRPS precipitation datasets at the outlet of the basin (Figure 7) and for the entire basin (Figure 8). The time series plots depict the overestimation of precipitation by both PERSIANN and CHIRPS precipitation datasets, compared to observed data at the outlet of the basin. Compared to the observed data, the PERSIANN precipitation data underestimated the precipitation with bias of −6.75%, while CHIRPS precipitation data overestimated the precipitation with bias of −07.80% over the entire basin. Analysis showed that CHIRPS could detect a high percentage of precipitation in flat areas, but not in hills or mountains [56]. Further, the accuracy of CHIRPS satellite-based precipitation data provided a positive correlation of 0.94, compared to the positive correlation of 0.83 of PERSIANN satellite-based precipitation data with the observed data of IMD. The analysis showed that CHIRPS satellite-based precipitation data provided more reliable, temporally consistent, and spatially distributed information about precipitation in the catchment, compared to the PERSIANN satellite-based precipitation data.

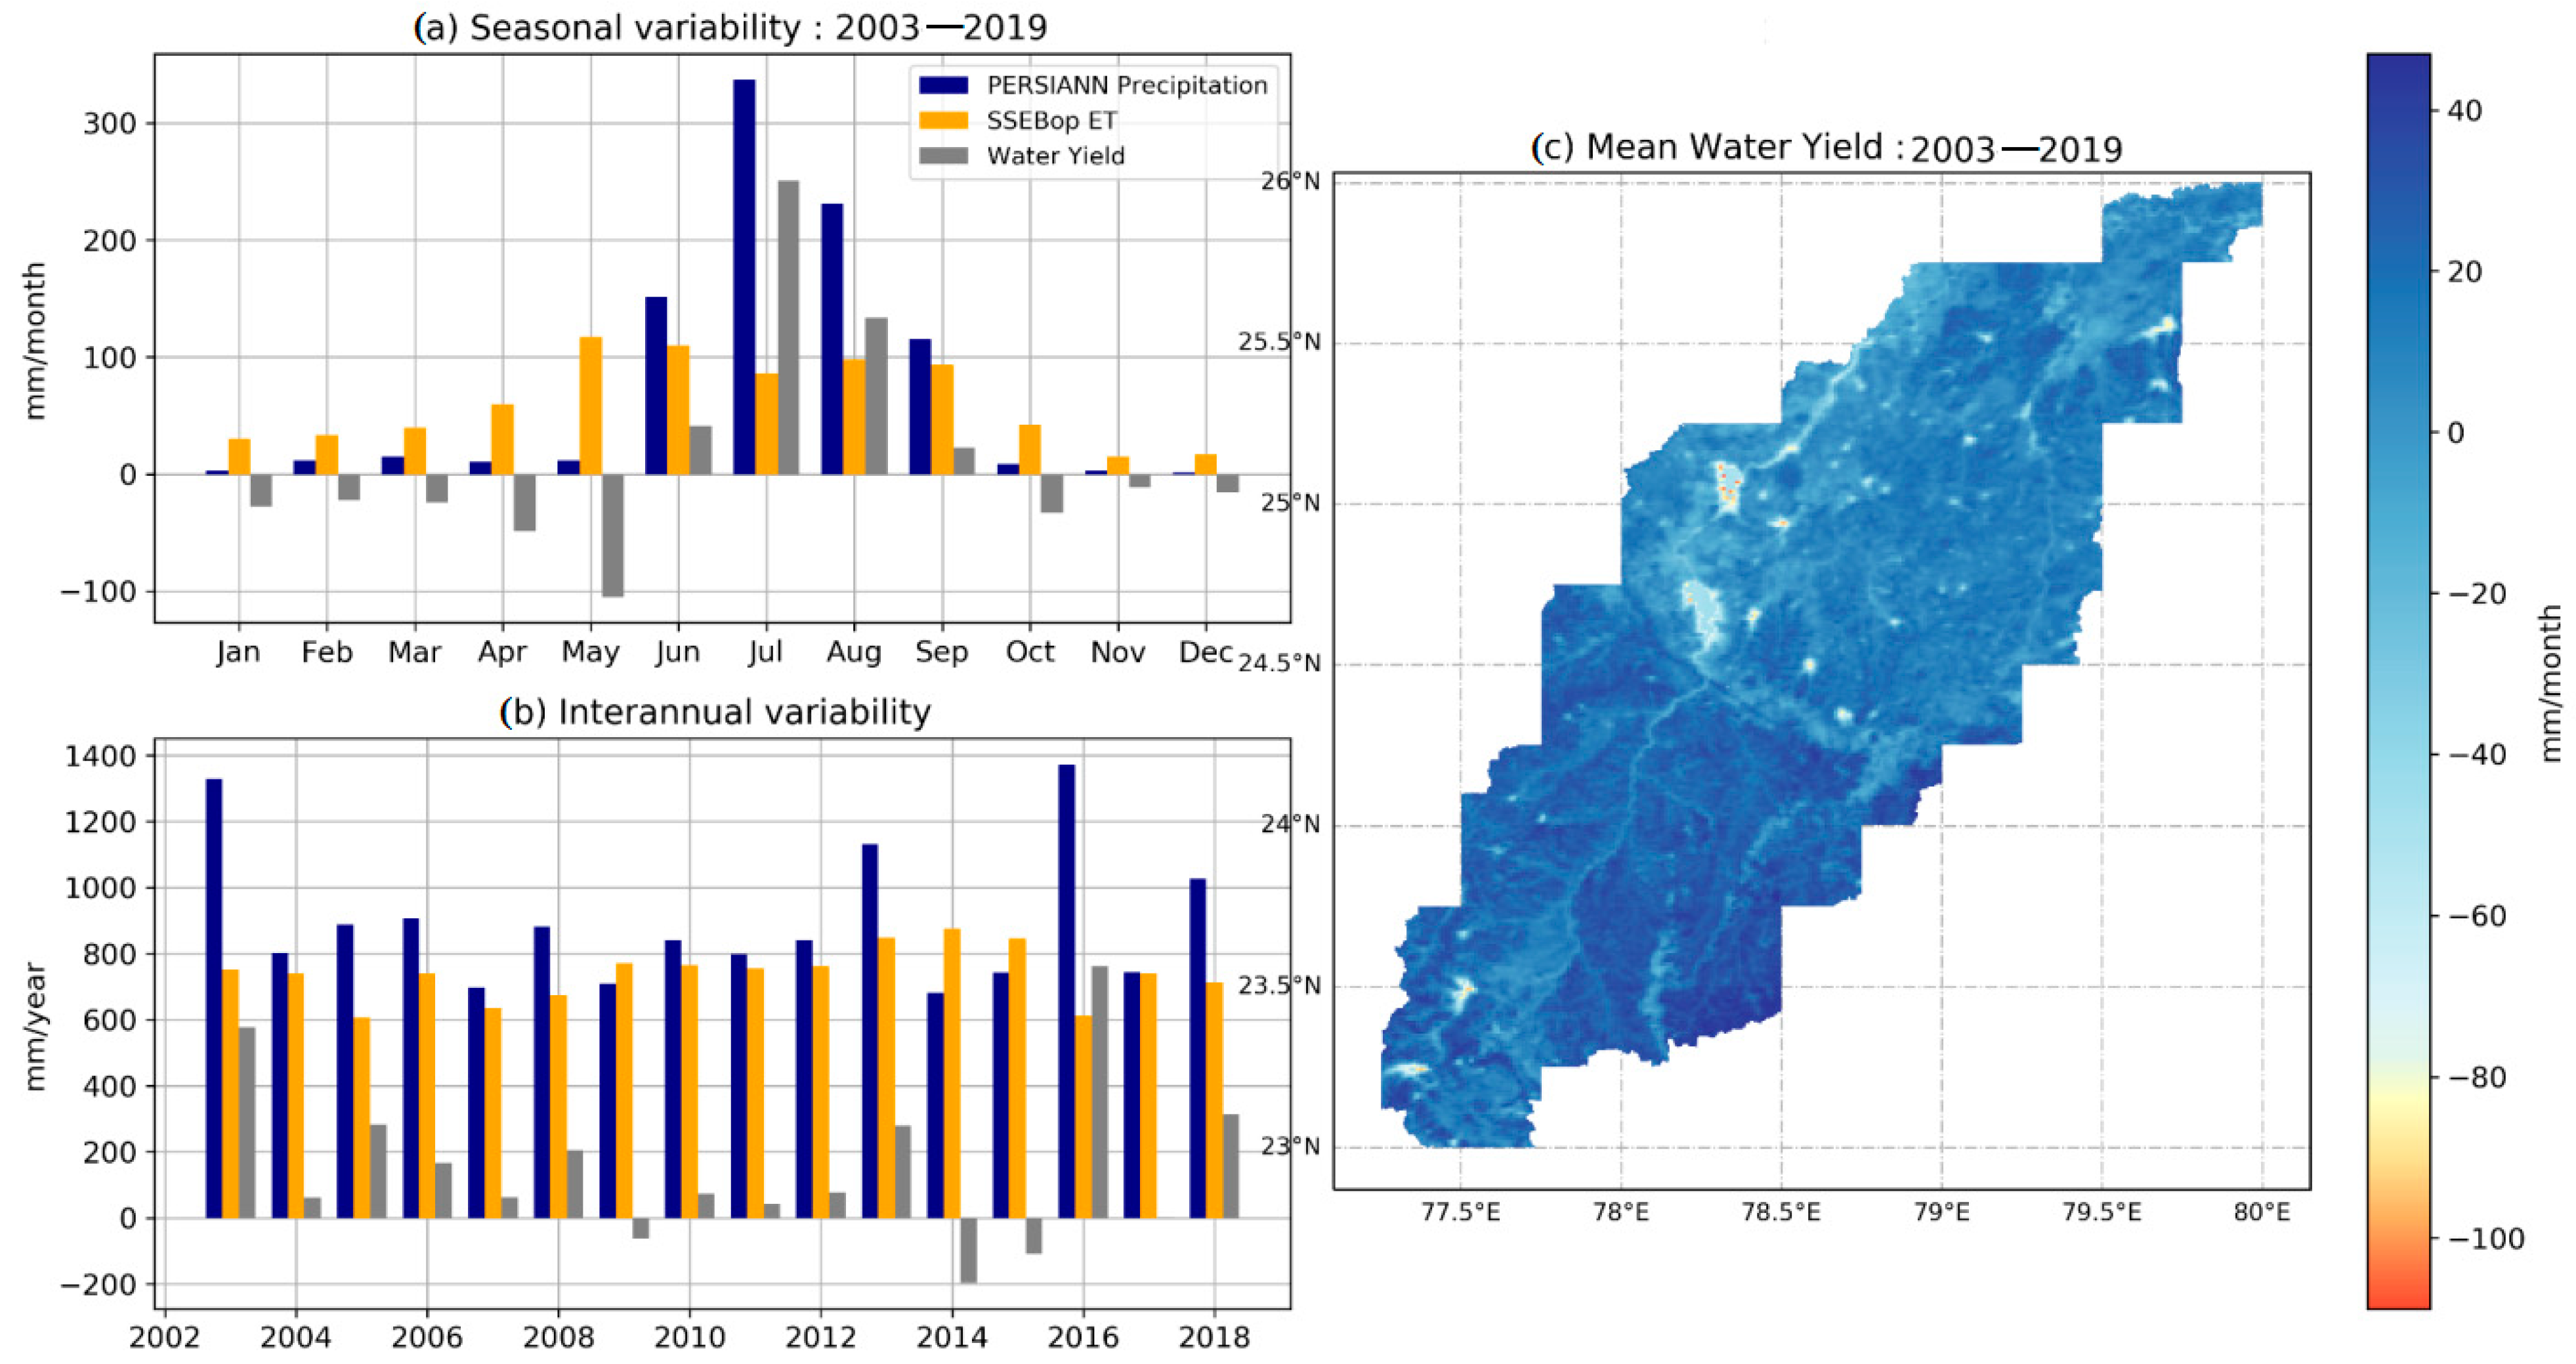
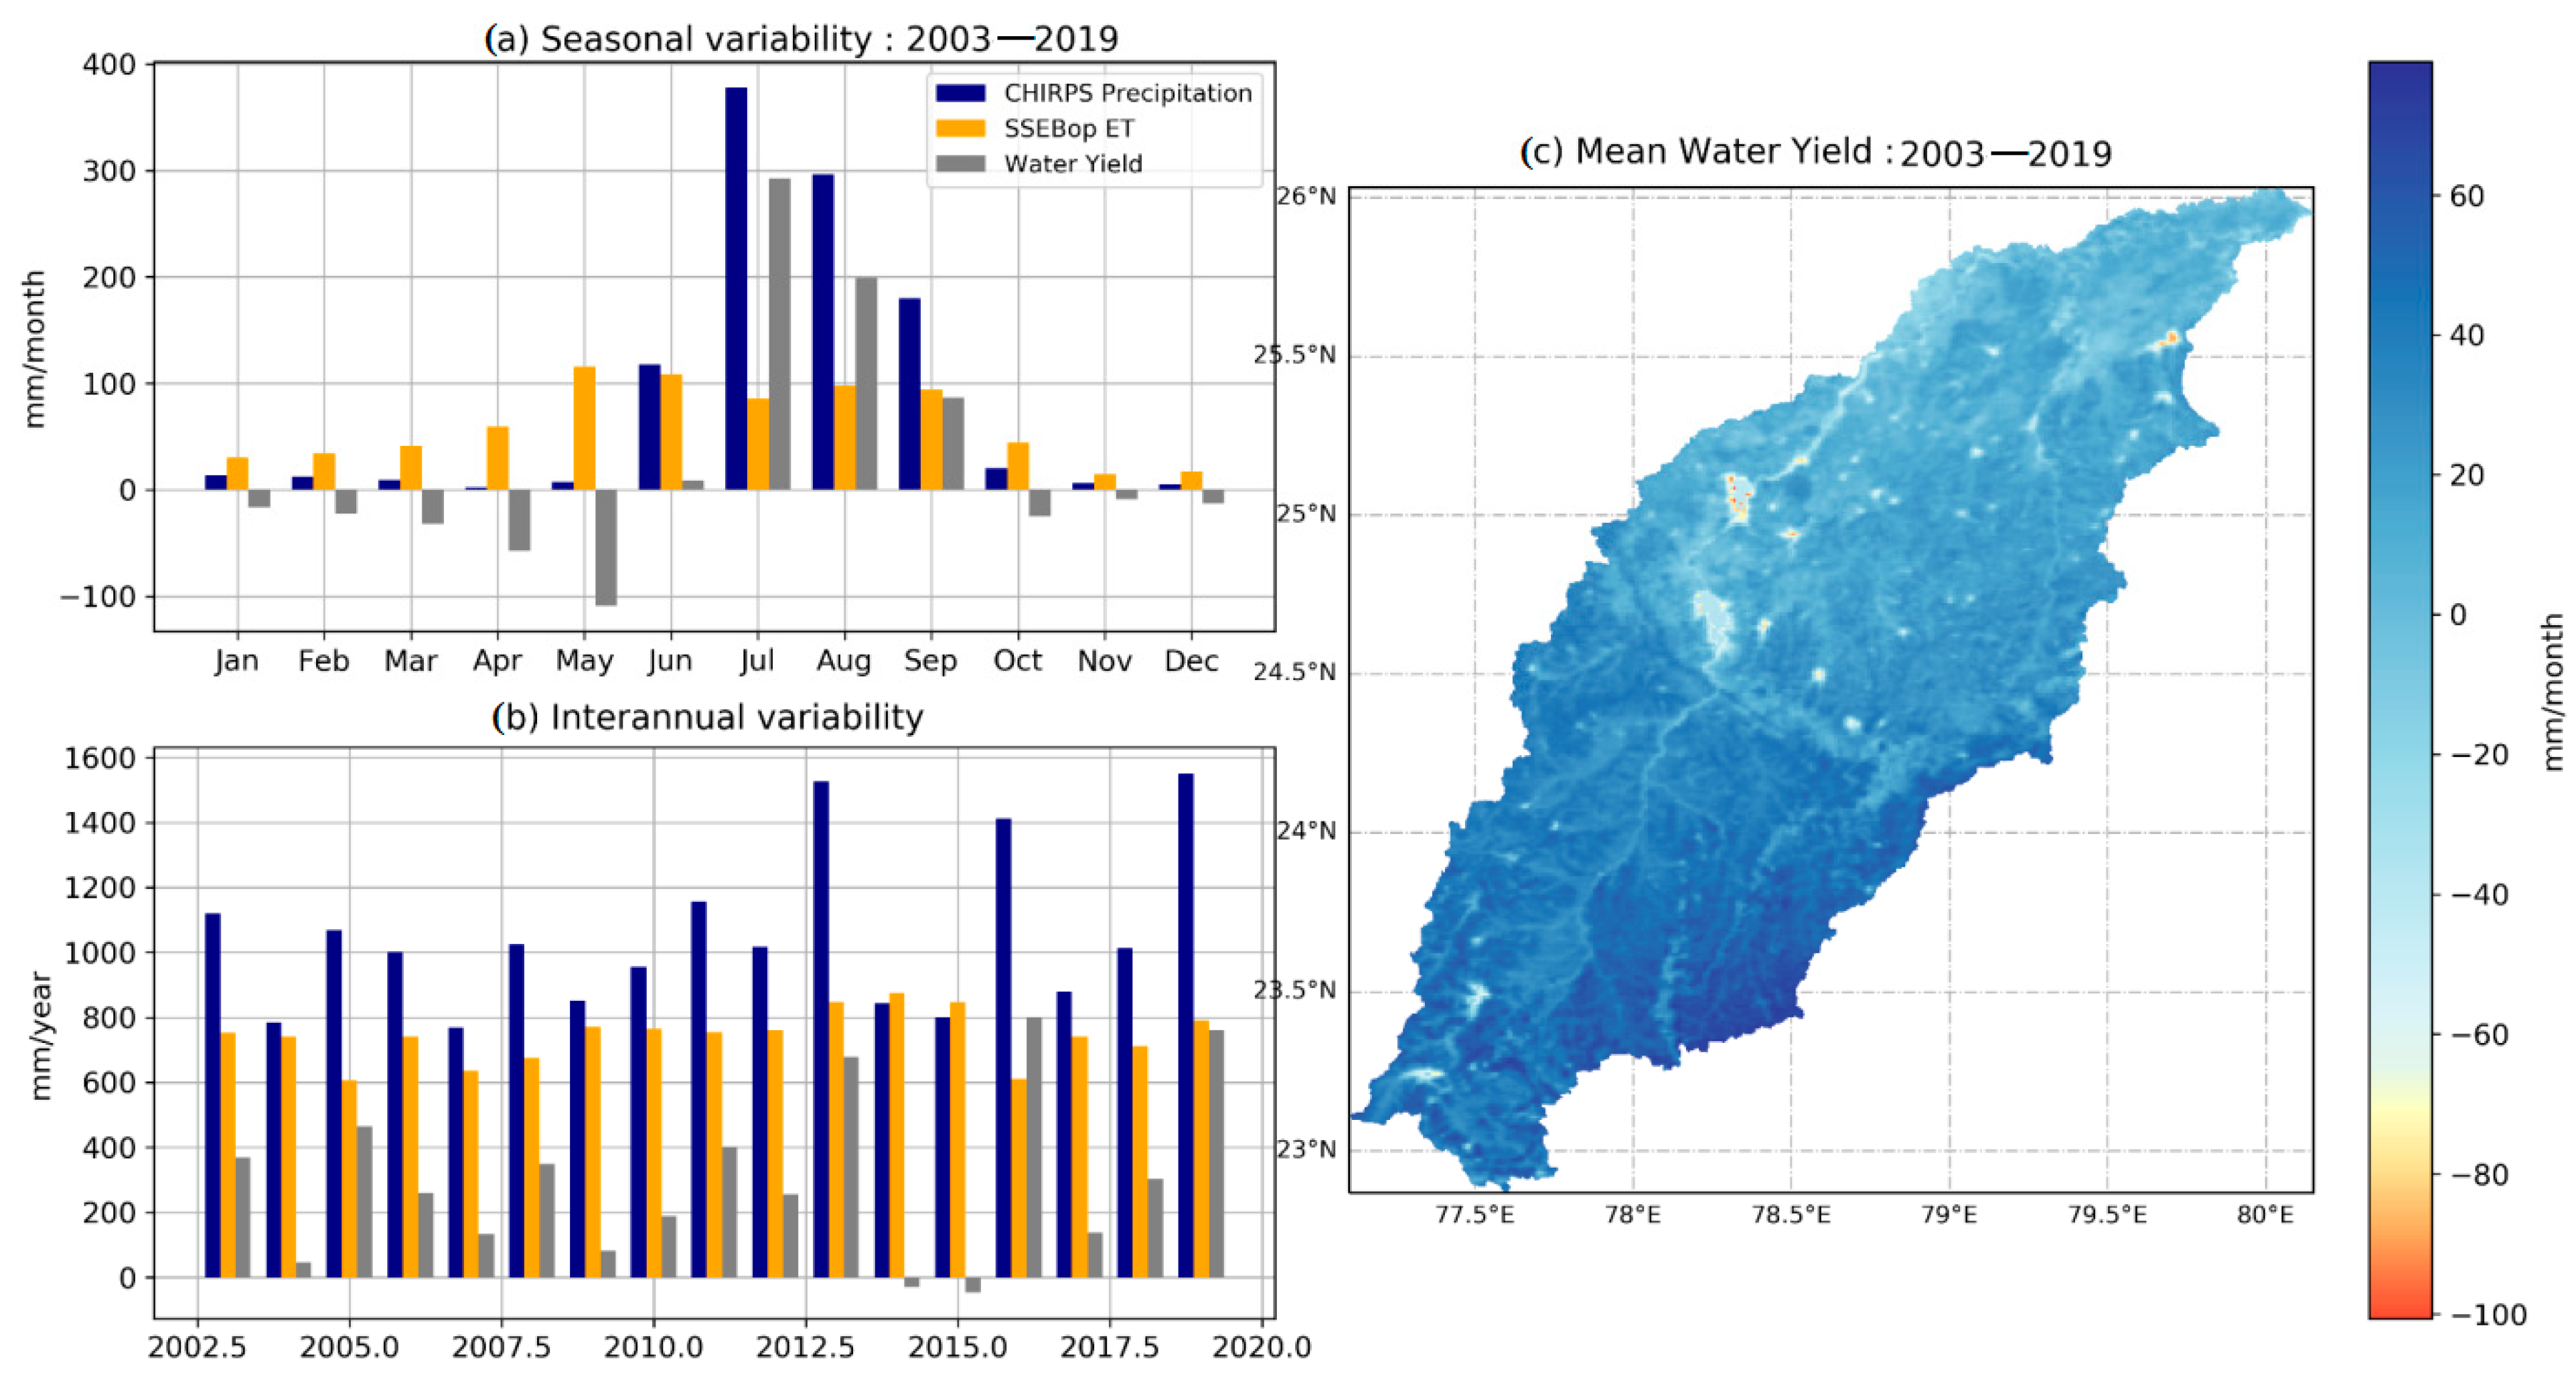
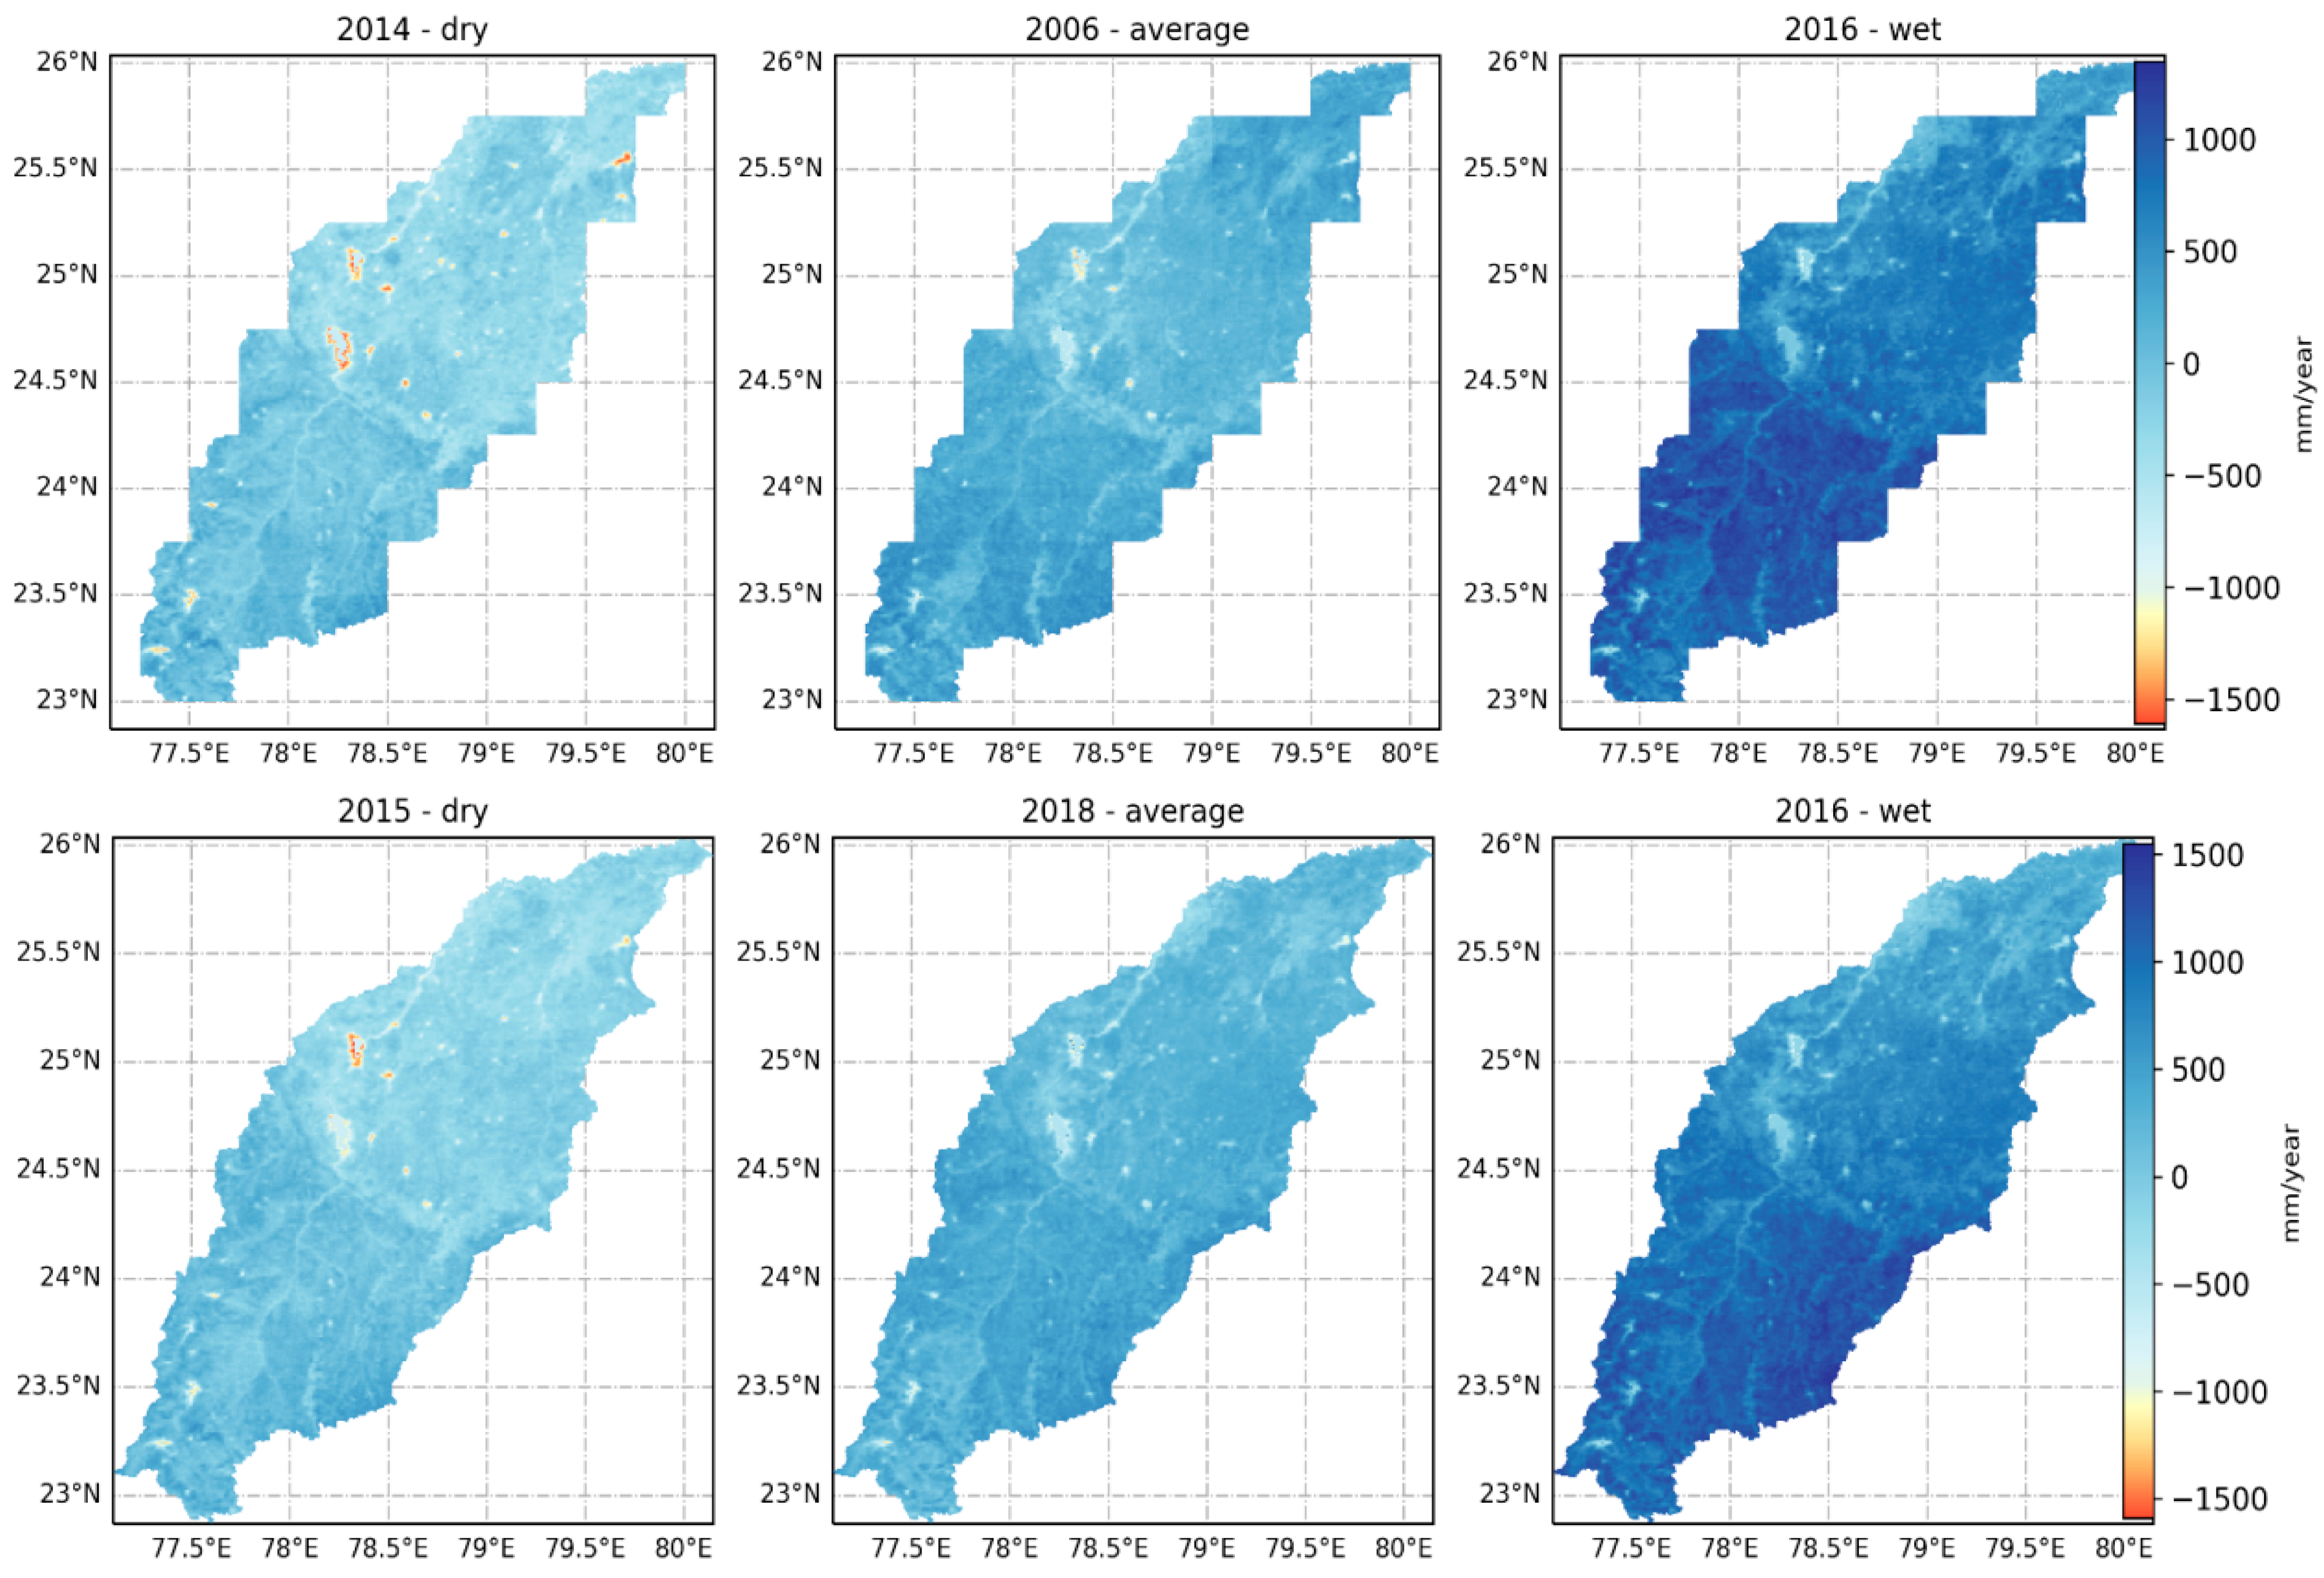
4.3. Spatio-Temporal Variability of Evapotranspiration and Water Yield in the Basin

Evapotranspiration (ET) defines the turbulent transfer of water in the form of transpiration from vegetation surfaces and evaporation from ground surfaces [57]. It is one of the important components of the hydrologic cycle. Calculation of ET is typically based on the conservation of either energy or mass, or both. Evapotranspiration is one of the important processes of energy balance because it requires latent heat (energy) to evaporate. It is simply too expensive to install equipment measuring ETs in various locations across river basins. To deal with such problems, the USGS Earth Resources Observation and Science (EROS) Center estimates actual evapotranspiration based on surface energy balance methods from the earth land surface using satellite remote sensing techniques and the operational simplified surface energy balance (SSEBop) model. Senay et al. [58] have developed a method to estimate the actual evapotranspiration, based on SSEBop model, with a unique parameterization using (MODIS) land surface temperature (LST) data. SSEBop’s ET was available publicly via the famine early warning system [48]. In this study, seasonal and inter-annual variability of evapotranspiration ET of the basin was calculated using SSEBop ET datasets. The maximum and minimum values of ET, that is, 125 mm/month and 12 mm/month in the basin, were obtained during May and November, respectively (Figure 9). Higher and lower ET values in the basin were obtained during post-monsoon and monsoon seasons, respectively. The analysis shows that the October and November months of the post-monsoon season generate minimum ET from the basin. The seasonal variability of water yield derived from PERSIANN precipitation data depicts that the high water yield in the basin is associated with the July and August months of the monsoon season, with water yields of 240 mm/month and 120 mm/month, respectively (Figure 9). The analysis of PERSIANN precipitation data also shows that the pre-monsoon and post-monsoon seasons generate almost zero to negative water yield in the basin. The spatial variability in mean monthly water yield (mm/month) obtained from PERSIANN precipitation data implies that the higher mean monthly water yield concentrates over the upper part of the basin. The mean monthly water yield consistently decreases from the upper reaches towards downstream and up to the outlet of the basin, reflecting a moderate to very low mean monthly water yield from the middle and lower parts of the basin.
Further, inter-annual variability of water yield obtained from PERSIANN precipitation datasets showed that higher water yield was associated with the wet period, and lower water yield was associated with the dry period.
The seasonal water yield from CHIRPS precipitation showed higher water yield during monsoons (July and August, with water yield amounts of 290 mm/month and 200 mm/month, respectively) (Figure 10).
The water yield obtained from CHIRPS precipitation data for the pre-monsoon and post-monsoon seasons depicted very low water yield in the basin. The spatial variability of mean monthly water yield derived from CHIRPS precipitation data showed that the upper part of the basin, especially the southeast portion, has a higher mean monthly water yield value (40–60 mm/month). In contrast, the middle and lower portions of the basin have almost zero to negative water yield. The pattern of inter-annual variability of the water yield derived from the CHIRPS precipitation datasets was almost similar to the pattern derived from PERSIANN precipitation datasets. CHIRPS precipitation datasets also showed higher water yield during the wet period and lower water yield during the dry period. For a better understanding, we have assessed the water yields for the entire basin and every individual year of the study period. Both precipitation datasets have shown lower yearly water yield in the middle and lower portions of the basin during the dry period (Figure 11). Where the wet period is concerned, both precipitation datasets showed higher water yields in the upper portion of the basin. However, the value of annual water yield derived from the CHIRPS precipitation datasets was larger than the PERSIANN datasets.

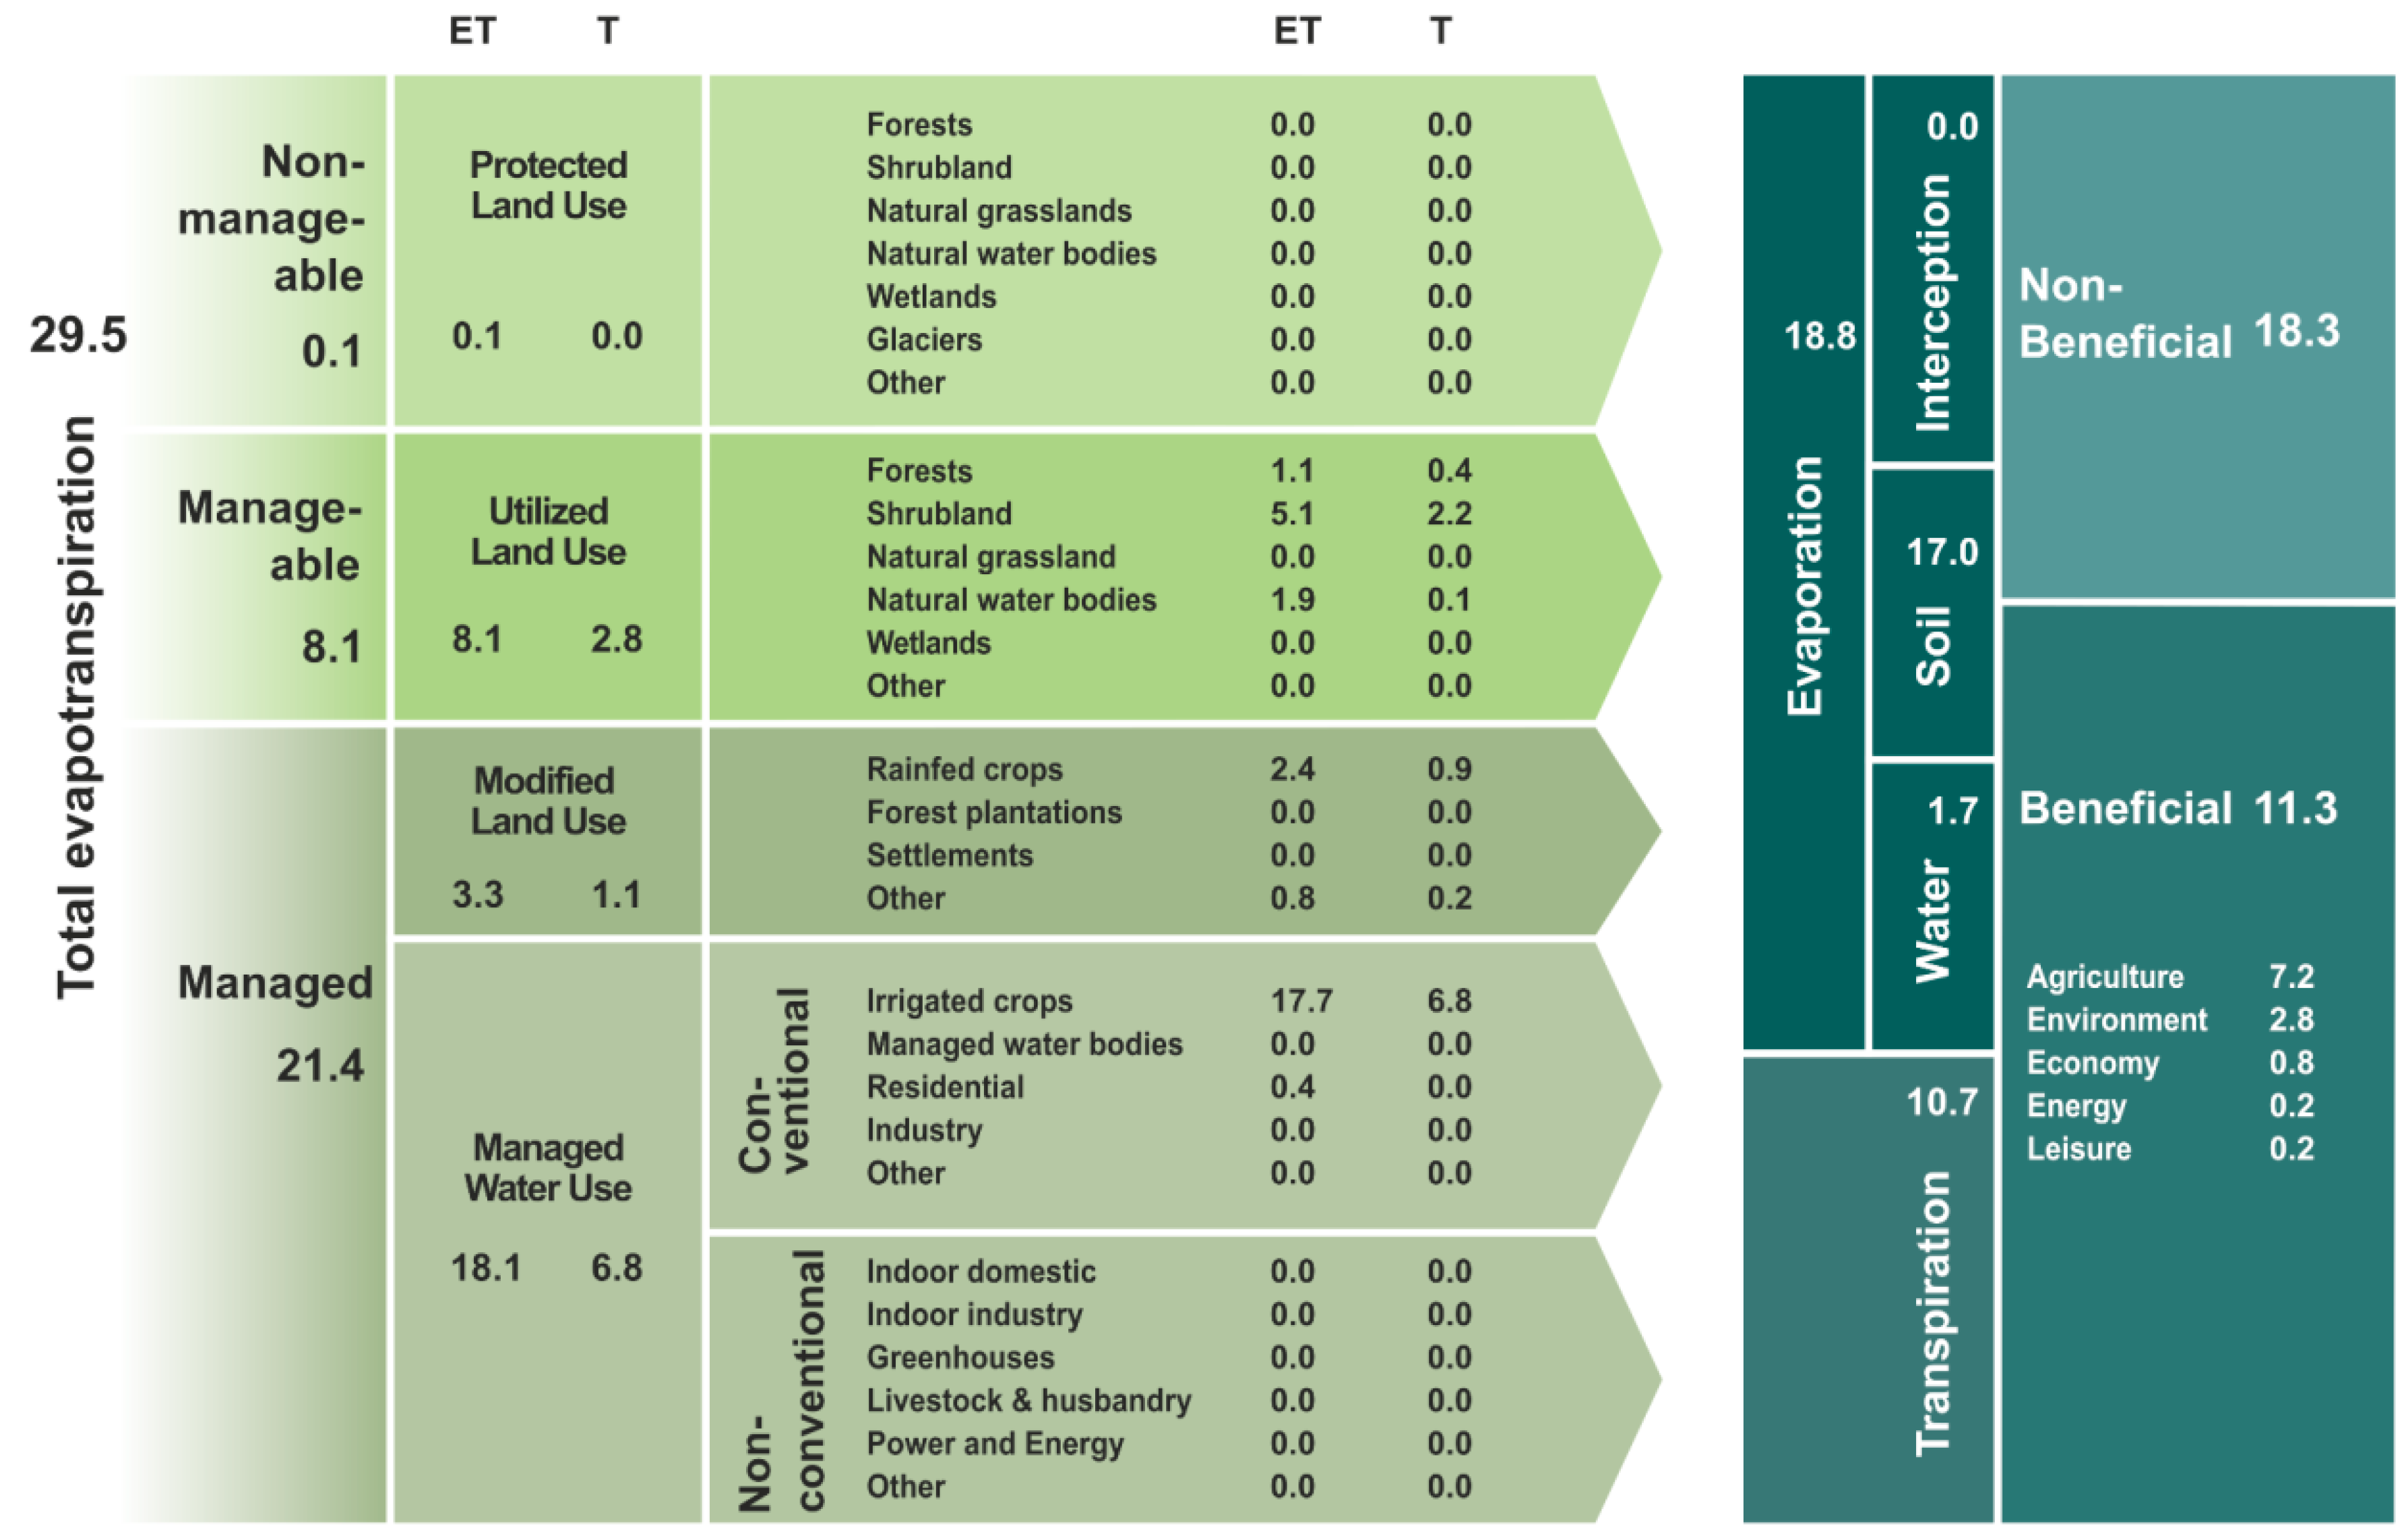
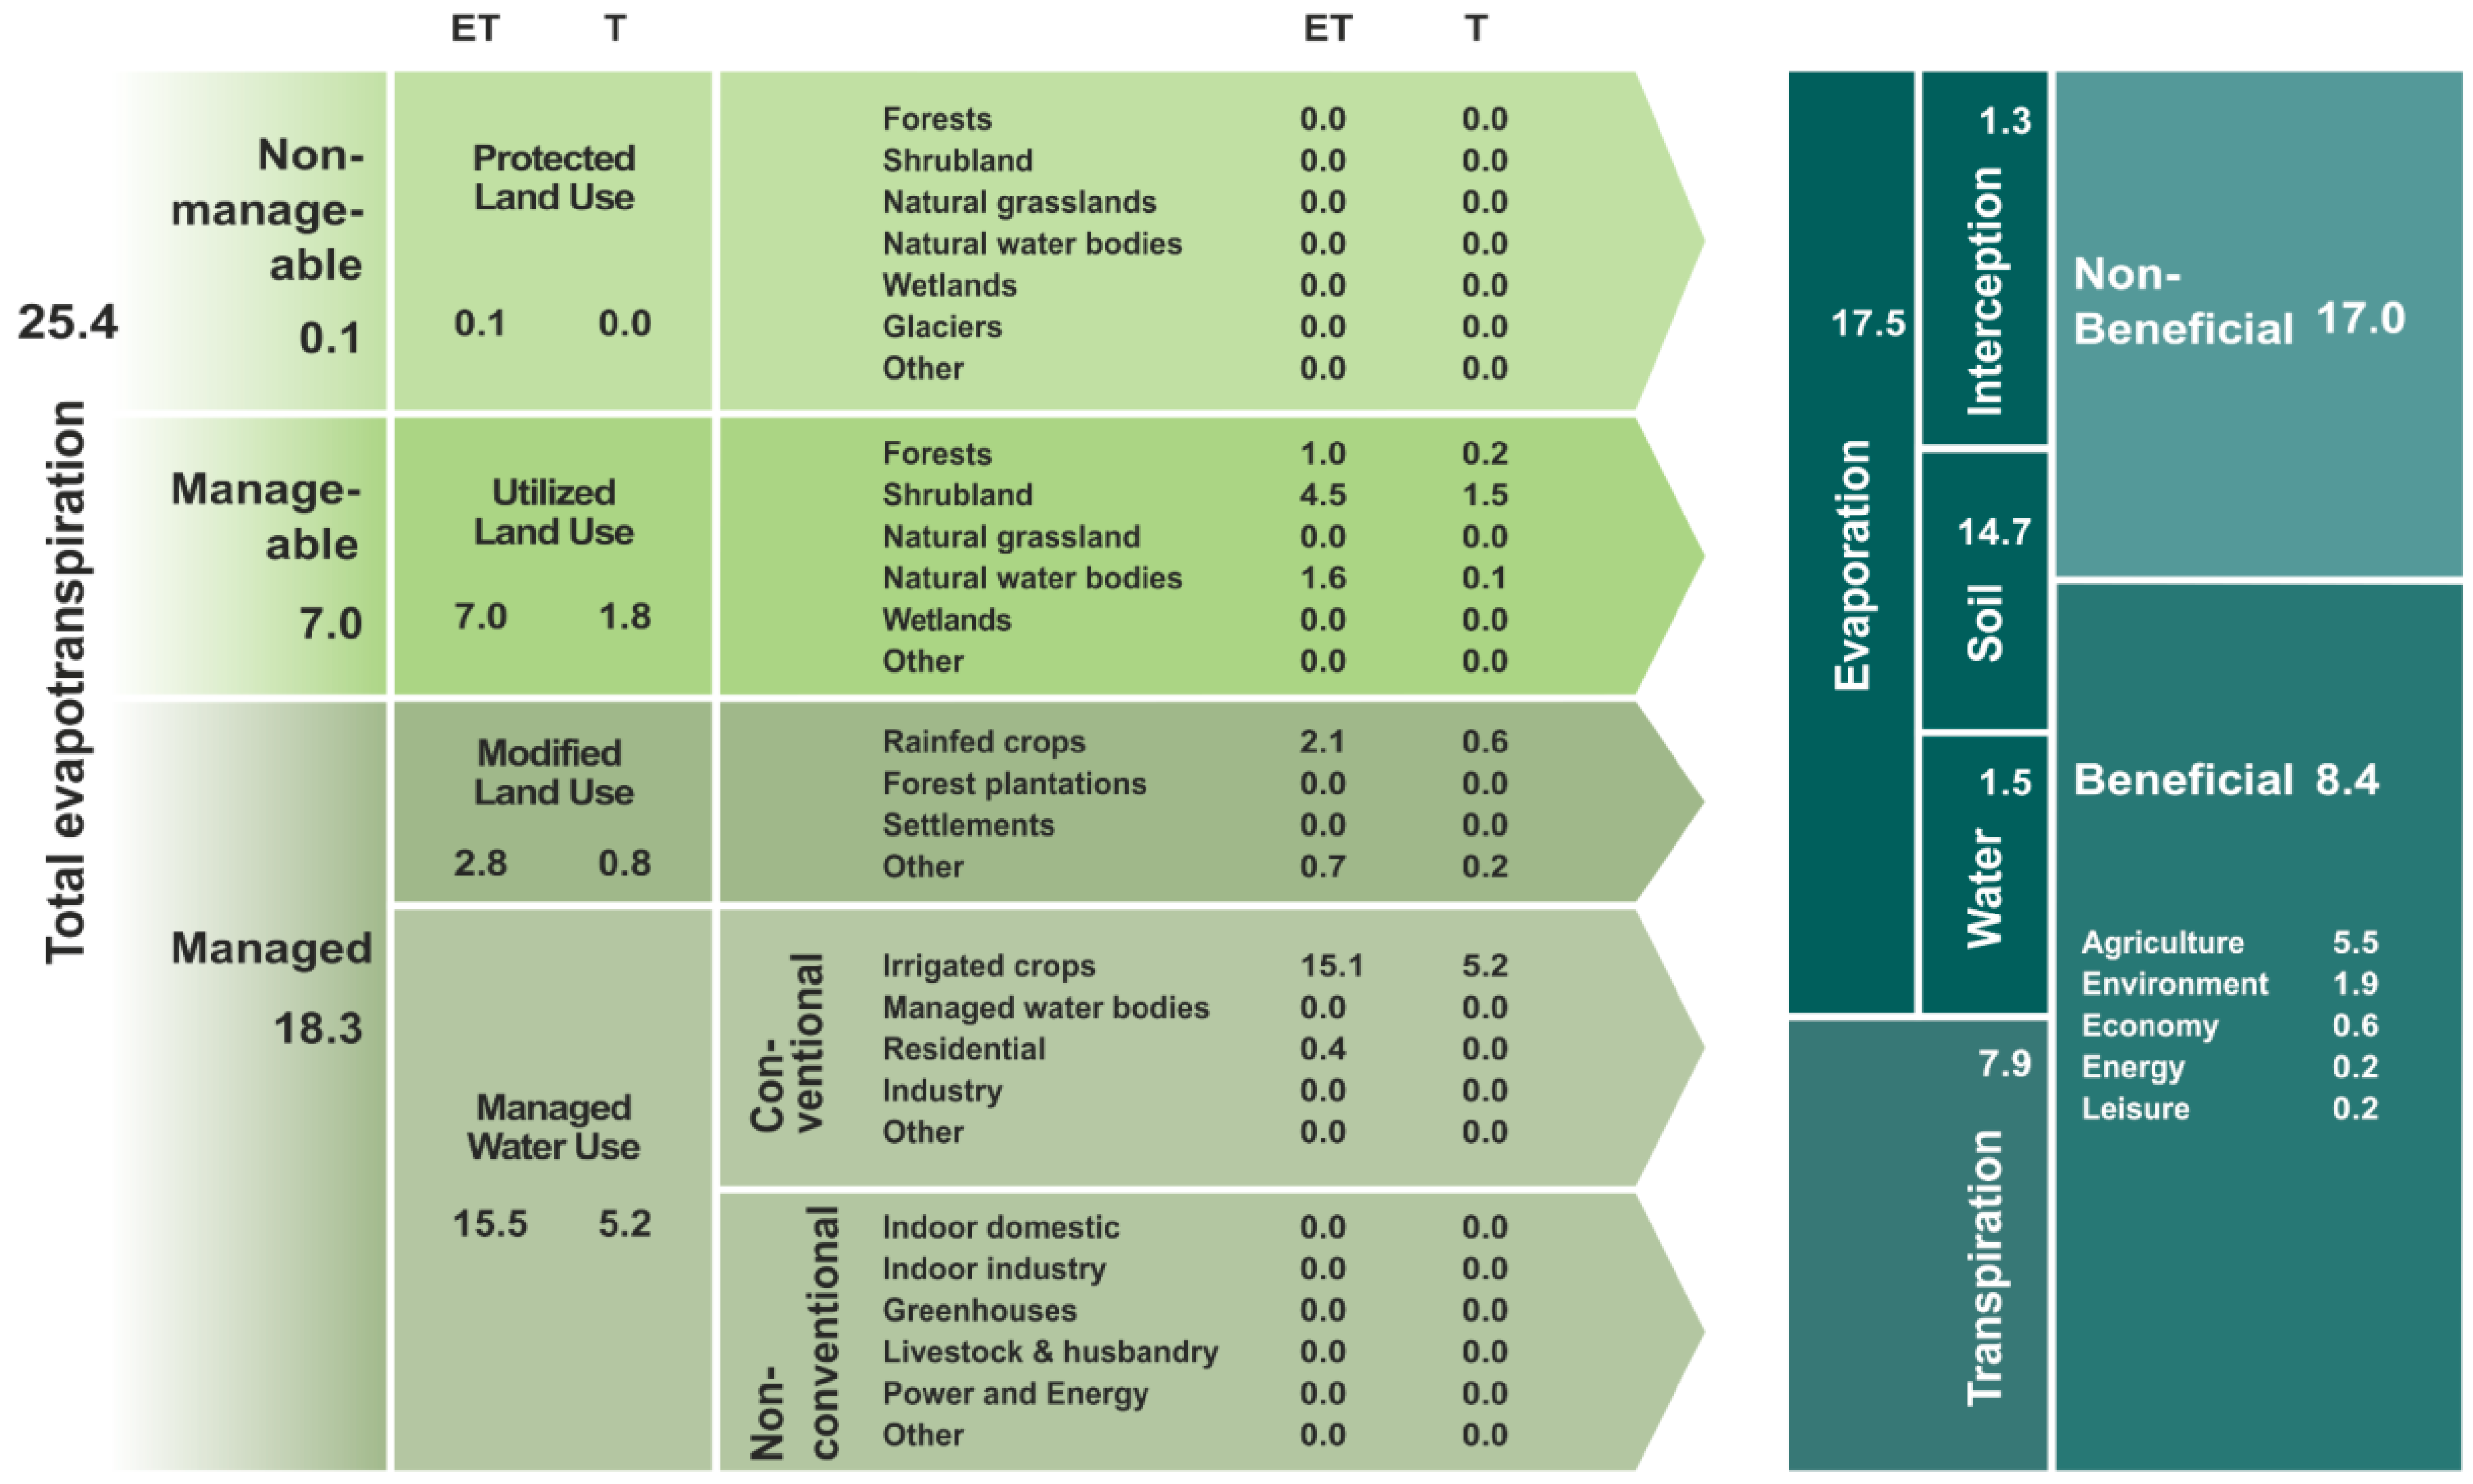
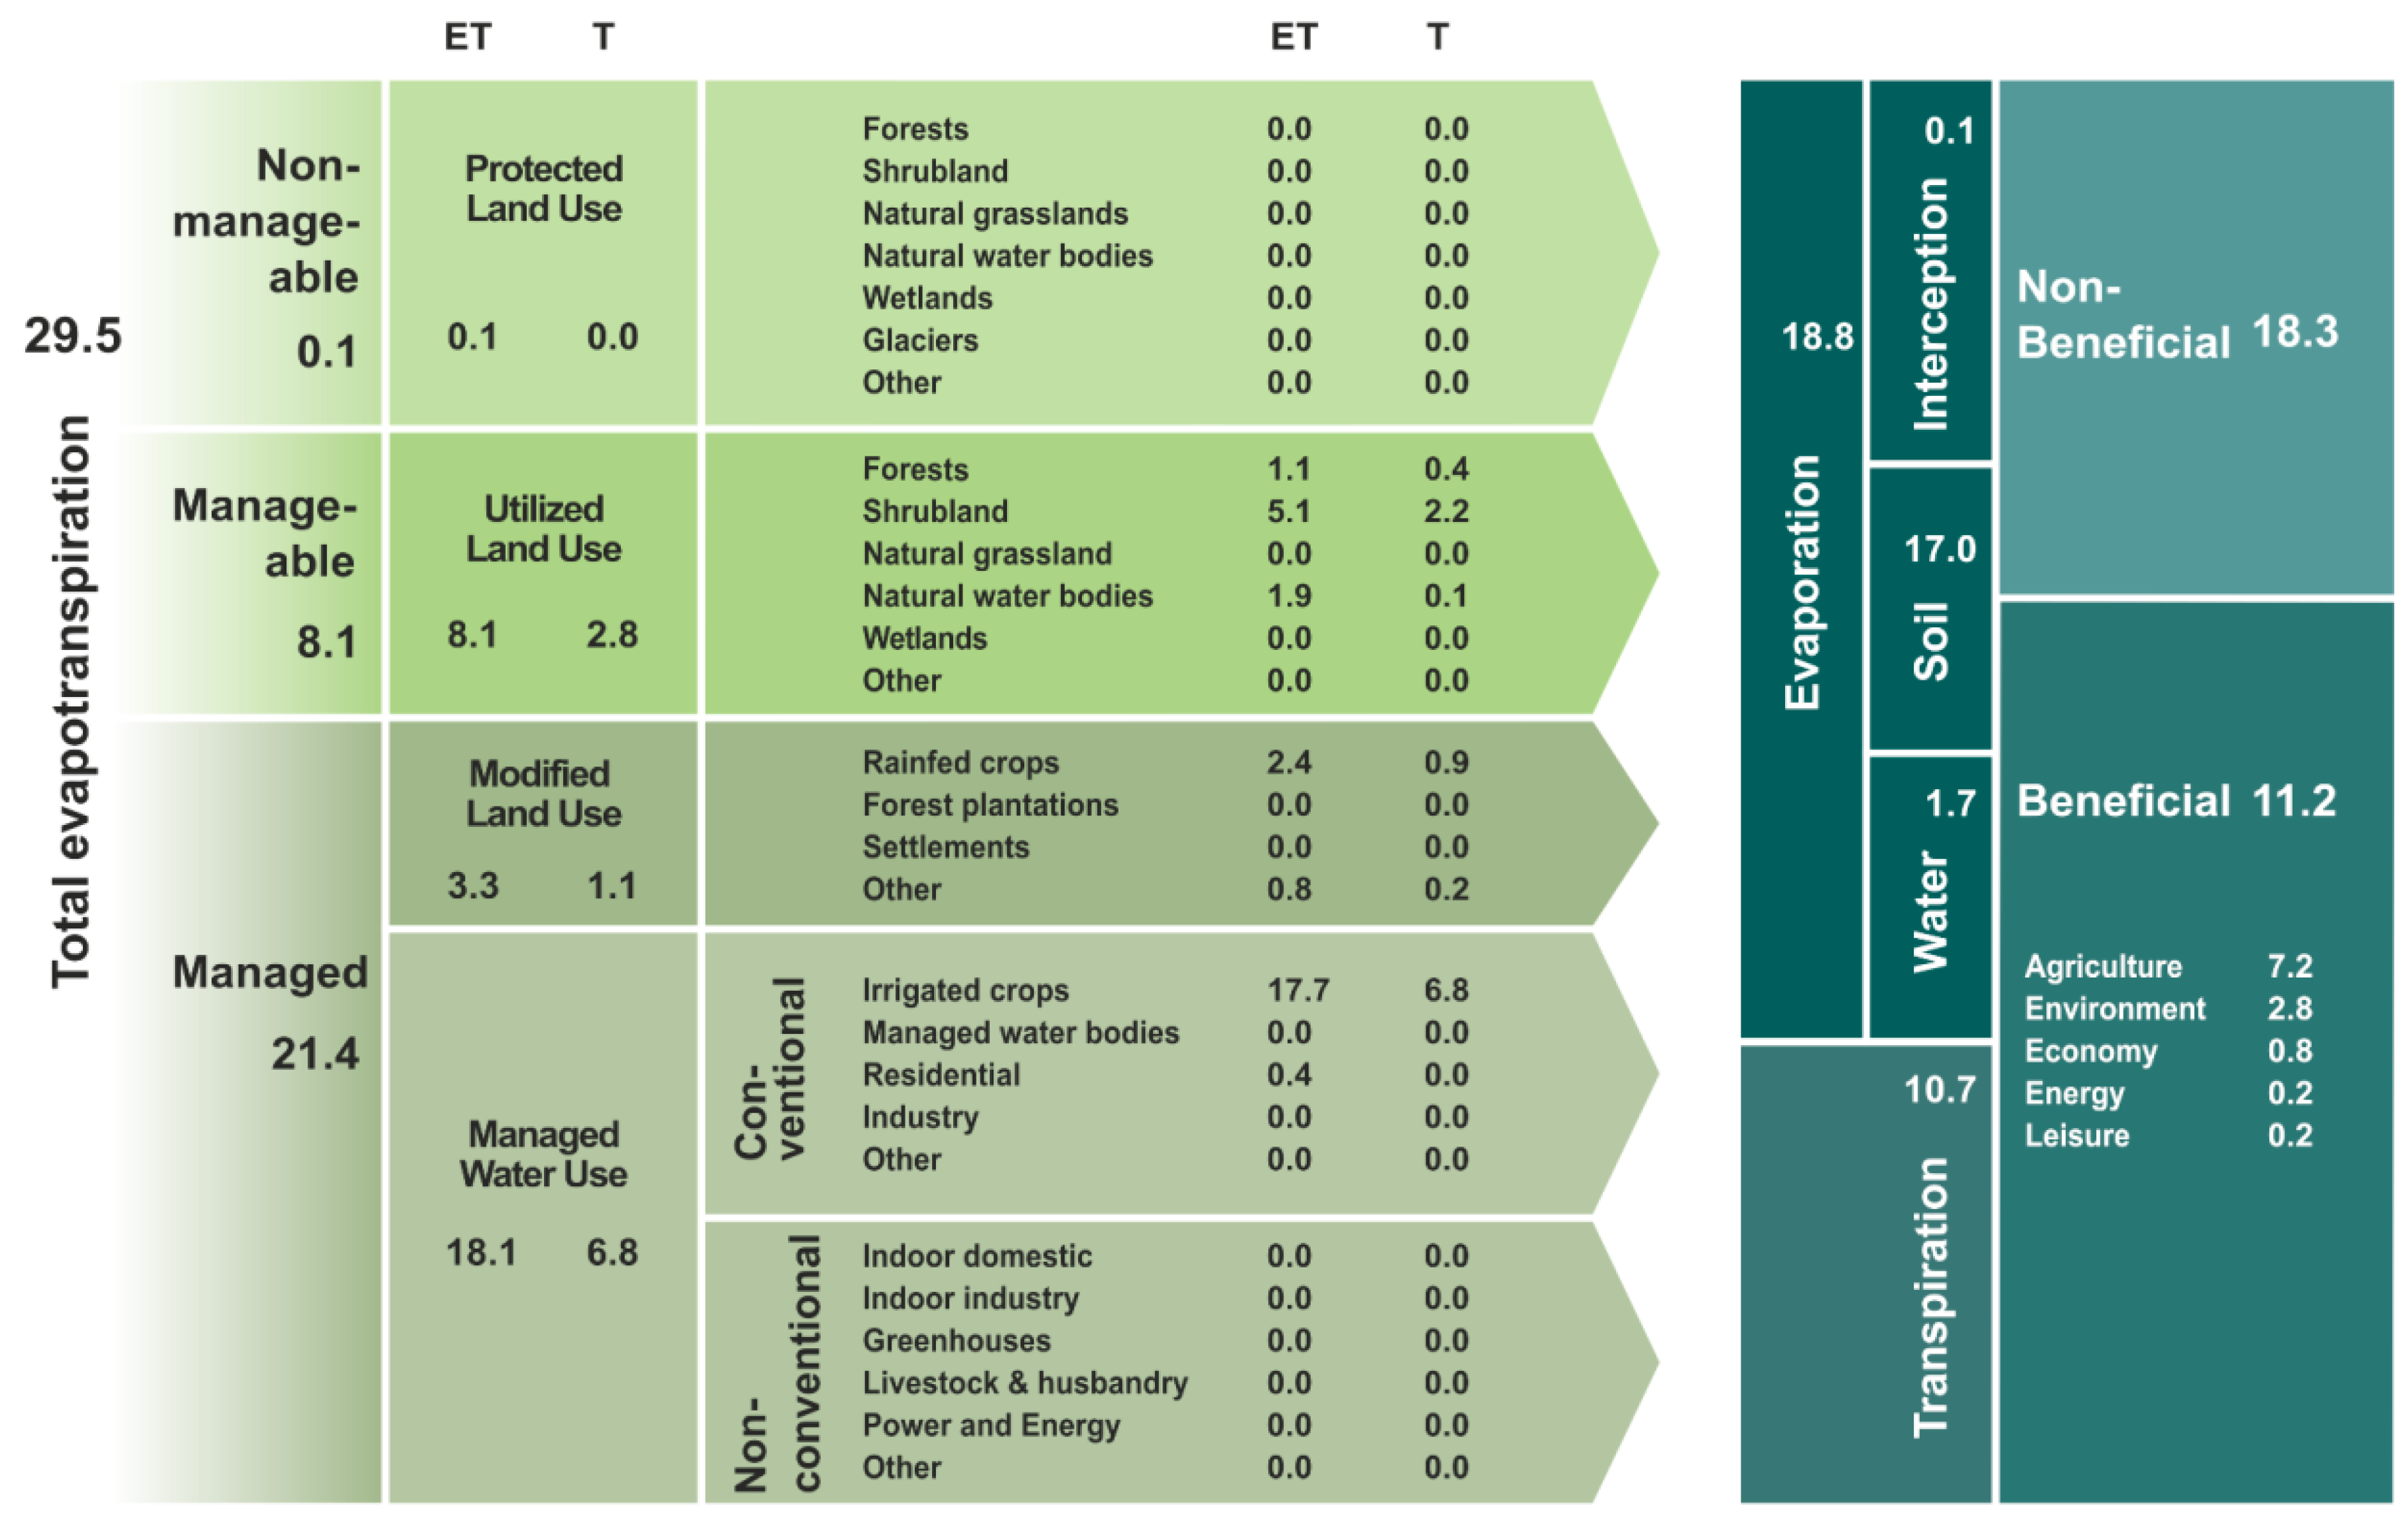
4.4. Estimation of Total Water Consumption in the Basin (Sheet 2)

The WA+ based sheet 2 was generated to estimate total water consumption (ET), evaporation (E), transpiration (T), and interception (I) from different water management classes in BRB. Sheet 2 was developed using the WALU map having four different water management classes. Total ET in the basin includes the amount of ET and T. The values of ET and T were evaluated for the non-manageable (actual evapotranspiration from PLU), manageable (actual evapotranspiration from ULU), and managed (actual evapotranspiration from MLU and MWU) types of WALU. The calculated values of ET and T of the basin were categorized according to the four water management classes (PLU, ULU, MLU, and MWU) of WALU. Since the precipitation years in the study were divided into dry and wet years, sheet 2 for the wet and dry years was generated separately.
Sheet 2, derived for PERSIANN precipitation dataset, based a dry year (2014–2015), showed a total water consumption of 36.2 BCM/year in the basin (Figure 12). The shares of non-manageable, manageable, and managed water consumptions in the total water consumption were 0.10 BCM/year, 09.80 BCM/year, and 26.30 BCM/year, respectively. Managed land use classes have consumed more water than manageable and non-manageable land use classes in the basin. The total water consumption, split as ET and T, for PLU, ULU, MLU, and MWU were 0.1 BCM/year and 0.0 BCM/year, 09.80 BCM/year and 03.30 BCM/year, 04.10 BCM/year and 01.50 BMC/year, and 22.20 BCM/year and 09.40 BMC/year, respectively. The evaporation from the soil, water, interception, and transpiration was broken down as beneficial and non-beneficial ET. Non-beneficial ET includes evaporation from soil and open water bodies, interception from wet surfaces, such as leaves and canopies, buildings, roads, etc., and cropland-based weed infested transpiration, invasive species, or degraded species landscapes. The non-beneficial water consumption in the basin shared 21.4 BCM/year of the total water consumption, among which, the contributions from water, soil, and interception were 1.9 BCM/year, 18.4 BCM/year, and 1.5 BCM/year, respectively. Beneficial ET represents processes such as transpiration from different vegetative covers, evaporation from hydropower reservoirs and cooling towers, etc. WA+ regroups and labels beneficial consumptions as agricultural, environmental, economical, energy, and leisure. The beneficial component was 14.8 BCM/year, among which, the contribution from agriculture was 9.9 BCM/year. PERSIANN precipitation dataset-based sheet 2 depicted that, among various water management classes in the basin, the shrubland of ULU, rainfed crops of MLU, and irrigated crops of MWU consumed a higher amount of water.
Sheet 2, generated for the wet period (2016–2017), using the PERSIANN precipitation dataset, shows the amount of total water consumption in the basin as 29.50 BCM/year (Figure 13). Wet period (2016–2017)-based sheet 2 depicts the amount of water consumed by non-manageable, manageable, and managed land use classes as 0.10 BCM/year, 8.1 BCM/year, and 21.4 BCM/year, respectively. During the wet period, water consumptions by shrubland of ULU (5.10 BCM/year), rain-fed crops of MLU (2.40 BCM/year), and irrigated crops of MWU (17.7 BCM/year) were found to be higher, compared to the other land use classes of the basin. The ET and T by PLU, ULU, MLU, and MWU in the basin were 00.10 BCM/year and 0.00 BCM/year, 08.10 BCM/year and 02.80 BMC/year, 3.30 BCM/year and 1.10 BMC/year, and 18.10 BCM/year and 6.80 BMC/year, respectively. Sheet 2, of the wet period, showed a total evaporation of 18.8 BCM/year.
The non-beneficial component of total ET in the basin for the wet period was 18.3 BCM/year. It split evaporations by water, soil, and interception at 1.70 BCM/year, 17.00 BCM/year, and 0.00 BCM/year, respectively. The beneficial component of total ET in the basin for the wet period was 11.3 BCM/year, and the agricultural contribution was 7.2 BCM/year. The analysis using PERSIANN precipitation showed that the non-beneficial water consumptions in the basin were higher than the beneficial water consumption during both the dry and wet periods. Additionally, the MWU showed maximum ET and T among all the categories in the basin. Hence, the PERSIANN precipitation dataset-based outcomes suggest that the scope to improve water management exists in the basin by controlling the major losses from the soil and wet surface. Further, stakeholders should opt for proper planning and strategies to reduce the non-beneficial consumptions, especially under MWU category, as well as to increase the beneficial consumptions in the basin.
Sheet 2, derived from the CHIRPS precipitation, using the WA + framework, provides different water consumption scenarios in the basin. Separate sheets 2 for the dry and wet period were evaluated from CHIRPS precipitation dataset. The CHIRPS precipitation data-based total water consumption in the basin during a dry year (2015–2016) was 25.4 BCM/year (Figure 14). During the dry period, the shares of non-manageable, manageable, and managed water consumption in the basin were calculated as 0.1 BCM/year, 7.0 BCM/year, and 18.3 BCM/year, respectively.
The water consumptions, split as ET and T, for PLU, ULU, MLU, and MWU were estimated to be 0.1 BCM/year and 0.0 BCM/year, 7.0 BCM/year and 1.8 BCM/year, 2.8 BCM/year and 0.8 BCM/year, and 15.5 BCM/year and 5.2 BCM/year, respectively, in the basin. The land use under MWU showed maximum ET (15.5 BCM/year) and T (5.2 BCM/year) among all the categories in the basin during the dry period of CHIRPS precipitation datasets. The irrigated crops under MWU shared a maximum value of ET, 15.1 BCM/year, followed by the shrubland under ULU (4.5 BCM/year) and rainfed crops under MLU (2.1 BCM/year). The CHIRPS precipitation data-based sheet 2 of the dry period estimated evaporation in the basin to be 17.5 BCM/year. Soil evaporation (14.7 BCM/year) has contributed the maximum in evaporation, followed by water evaporation (1.5 BCM/year) and interception (1.3 BCM/year). Further, the total evapotranspiration of 25.4 BCM/year in the basin includes water consumption through transpiration (7.9 BCM/year) and evaporation (17.5 BCM/year). The CHIRPS precipitation data-based sheet 2 of the dry period showed that the non-beneficial and beneficial consumptions in the basin were 17.0 BCM/year and 8.4 BCM/year, respectively.
The CHIRPS precipitation-based outcomes for the wet year (2016–2017) in sheet 2 outlined the total water consumption in the basin as 29.5 BCM/year (Figure 15). The shares of non-manageable, manageable, and managed water management classes in total water consumption in the basin were 0.1 BCM/year, 8.1 BCM/year, and 21.4 BCM/year, respectively.
Sheet 2 estimated the amount of water consumption by PLU, ULU, MLU, and MWU water management classes, in the form of ET and T. The ET- and T-based water consumption by PLU, ULU, MLU, and MWU in the basin were 0.1 BCM/year and 0.0 BCM/year, 8.1 BCM/year and 2.8 BCM/year, 3.3 BCM/year and 1.1 BCM/year, and 18.1 BCM/year and 6.8 BCM/year, respectively. The soil (17.0 BCM/year)-, water (1.7 BCM/year)-, and interception (0.1 BCM/year)-based water consumptions detailed in sheet 2 of the wet year (2016–2017) contributed to the evaporation of 18.8 BCM/year in the basin. Total evapotranspiration of 29.5 BCM/year in the basin includes the evaporation of 18.8 BCM/year and transpiration of 10.7 BCM/year. The CHIRPS precipitation-based outcome also approved the maximum water consumption by soil, followed by transpiration. The CHIRPS precipitation-based outcomes for the wet year (2016–2017) in sheet 2 showed the non-beneficial and beneficial consumptions in the basin as 18.3 BCM/year and 11.2 BCM/year, respectively. Further, it was found that the non-beneficial components were higher than beneficial for both satellite observations precipitations in the basin, along with the maximum losses, in the form of evaporation, that occurred by the soil and wet surface.
Singh et al. [33] discovered that the non-beneficial component was greater than the beneficial component in the Subarnarekha basin and advised limiting non-beneficial consumptions from soil evaporation. Al-Bakri et al. [59] analyzed the beneficial components of ET that accounted for 81% of total ET (146.0 BCM/year) in North Jordan Valley under shortage irrigation scenarios. The study area is located in the semi-arid region (average annual rainfall 918 mm), and it is a drought-prone river basin. Therefore, sustainable measures should be promptly adopted to control the water losses from the bare soil and wet surface and improve the beneficial consumptions. A majority of the population living in the basin is rural, poor, and primarily depends on agriculture and livestock rearing for their livelihoods [60]. BRB shows that low water productivity of agriculture in the basin will lead to dire socio-economic and environmental consequences. Changing climate (reduction in rainfall and rising temperature) will cascade the existing problem in the future. Hence, managing water consumption in agriculture, without affecting the potential of food production in the basin, is of the utmost importance. Water consumption in agriculture can be improved by employing advanced farm management practices, such as high-tech irrigation systems (drip and sprinkler), growing high yielding drought-tolerant crop varieties, changes in cropping pattern, use of cover crops, and better crop rotation practices, etc. It will help in reducing evaporative losses from agriculture in the basin. Further, the use of new water supply sources, such as recycled wastewater for irrigation and maintaining river’s environmental flow by afforestation along the river banks, building micro- and small check dams on the tributaries, will enhance water availability in the basin. Soft measures, such as increasing awareness among different stakeholders, capacity building, and improvement in other human managed processes, will bring non-beneficial water consumption down in the basin.
The transpiration fraction (TF), beneficial fraction (BF), and irrigated RT fraction (IEF) indices were also calculated to summarize the non-beneficial and beneficial water consumptions obtained from the evaporation sheet [13]. The beneficial fractions derived from PERSIANN and CHIRPS precipitation dataset were 38.31% and 37.97% for the wet period (Table 5) and 40.88% and 33.07% for the dry period, respectively (Table 6). The PERSIANN precipitation dataset-based outcome indicated an increase in the beneficial fraction of ET.

5. Conclusions

The WA+ is a comphrensive tool that integrates different fields of hydrology, water and environmental management, water allocations, reporting and communication, and policy decisions. It has limitations, as it can not replace hydrological models in their functions to provide detailed information on flow component of a basin. The assumption in the WA+ framework is that it considers the basin, tributaries, and aquifer a bulk single system. The satellite data parameters have uncertainity and errors in measuring the indirect hydrological processes. Hence, the water accounting in a BRB was performed using earth observation datasets and the WA+ framework. Total water consumptions by different land use classes in the basin were calculated and summarized in sheet 2 of the WA+ framework. The CHIRPS and PERSIANN satellite-based precipitation products were statistically compared with the gridded IMD rainfall. The CHIRPS precipitation dataset was found close to the IMD. The MWU is the largest water management category in BRB, which occupies a 63.46% area of the basin. Irrigated crops–cereals are the largest land use class under MWU category, with a cover of 62.02% of the total basin area. Further, irrigated crops–cereals and rainfed-cereals account for 70.31% of the basin’s total area. Hence, agriculture under managed activity is the main consumer of water and accounts maximum ET in the basin. The beneficial ETs from agriculture were only 24.41% (for the wet period) and 21.65% (for the dry period) of the total evapotranspiration for CHIRPS. Non-beneficial ET was higher than beneficial ET in the form of evaporation by soil. The seasonal water yield from CHIRPS showed greater than 150 mm/month during monsoons (July and August). The authors recommend that the promotion of maize, sorghum, and millet crop cultivation, in the place of water intensive crops, such as rice, sugarcane, and wheat cultivation, will substantially reduce water consumption, without affecting the cereals production in the basin. The outcomes of the study will help government, concerned authorities, and other stakeholders formulate sustainable plans, policies, and strategies to ensure water use in the most beneficial manner in BRB. The future work will focus on estimating the vertical water balance component for the unsaturated root zone of the river basin. This will help explain the exchanges between land and atmosphere and segregate water balance component viz. infiltration and surface runoff.

Author Contributions

Conceptualization, V.G.S., N.K., P.K.S. and S.K.S.; methodology, V.G.S., N.K., P.K.S., P.K.G. and S.K.S.; software, V.G.S., N.K., P.K.S., S.K.S. and R.L.R.; validation, V.G.S., N.K., P.K.S., S.K.S., R.L.R. and M.G.; formal analysis, V.G.S., N.K., P.K.S., S.K.S. and P.K.; investigation, V.G.S., N.K., P.K.S., S.K.S. and P.K.; resources, V.G.S., N.K., P.K.S., S.K.S. and P.K.; data curation, V.G.S., N.K., P.K.S., P.K.G. and M.G.; writing—original draft preparation, V.G.S., N.K., P.K.S., S.K.S., R.L.R., M.G., P.K., V.G.S., N.K., P.K.S., S.K.S., P.K. and O.S.; supervision, P.K.S. and S.K.S.; project administration, P.K.S. and S.K.S.; funding acquisition, V.G.S., N.K., S.K.S. and P.K. All authors have read and agreed to the published version of the manuscript.

Funding

This publication is supported by the Asia Pacific Network for Global Change Research (APN), under collaborative regional research programme (CRRP), with project reference number CRRP2019-01MY-Kumar.

Data Availability Statement

The data will be made available, as per the request of users.

Acknowledgments

The author (VGS) wishes to acknowledge the support from the University Grants Commission (UGC) for providing funds under UGC NET-JRF fellowship (ref no. 3622/(NET-JUNE 2014). The author (NK) thanks to the DST-INSPIRE fellowship (No. DST/INSPIRE fellowship/2016/IF160401), New Delhi, for financial help. The Indian Meteorological Department, Pune, Maharashtra, India, provided observation data. The support of SERB, New Delhi, India (grant no. CRG/2019/003551) is gratefully acknowledged by the author (SKS). The authors also acknowledge DST-FST, Govt. of India, and Coordinator, KBCAOS, University of Allahabad, for providing the infrastructural facilities. This research was supported by Japan Science and Technology Agency (JST), as a part of the Abandonment and Rebound: Societal Views on the Landscape- and Land-Use Change and their Impacts on Water and Soils (ABRESO) project under Belmont Forum.

Conflicts of Interest

The authors declare no conflict of interest.

Appendix A

Figure A1. Diagram of methodology describes the steps opted for estimating total water consumption in the BRB.
Water 14 03473 g0a1

References

  1. World Water Assessment Programme (Nations Unies). The United Nations World Water Development Report 2018; United Nations Educational, Scientific and Cultural Organization: New York, NY, USA, 2018; Available online: www.unwater.org/publications/world-water-development-report-2018/ (accessed on 12 March 2022).
  2. Wada, Y.; Flörke, M.; Hanasaki, N.; Eisner, S.; Fischer, G.; Tramberend, S.; Satoh, Y.; van Vliet, M.T.H.; Yillia, P.; Ringler, C.; et al. Modelling global water use for the 21st century: The Water Futures and Solutions (WFaS) initiative and its approaches. Geosci. Model Dev. 2016, 9, 175–222. [Google Scholar] [CrossRef] [Green Version]
  3. IPCC. 2022: Climate Change 2022: Impacts, Adaptation, and Vulnerability. Contribution of Working Group II to the Sixth Assessment Report of the Intergovernmental Panel on Climate Change; Pörtner, H.-O., Roberts, D.C., Tignor, M., Poloczanska, E.S., Mintenbeck, K., Alegría, A., Craig, M., Langsdorf, S., Löschke, S., Möller, V., et al., Eds.; Cambridge University Press: Cambridge, UK, 2022; Available online: https://www.ipcc.ch/report/ar6/wg2/downloads/report/IPCC_AR6_WGII_FinalDraft_FullReport.pdf (accessed on 14 March 2022).
  4. Deng, H.; Chen, Y.; Chen, X. Driving factors and changes in components of terrestrial water storage in the endorheric Tibetan Plateau. J. Hydrol. 2022, 612, 128225. [Google Scholar] [CrossRef]
  5. Moore, I.D.; Grayson, R.B.; Ladson, A.R. Digital terrain modelling: A review of hydrological, geomorphological, and biological applications. Hydrol. Processes 1991, 5, 3–30. [Google Scholar] [CrossRef]
  6. Molden, D.; Sakthivadivel, R. Water accounting to assess use and productivity of water. Int. J. Water Resour. Dev. 1999, 15, 55–71. [Google Scholar] [CrossRef]
  7. FAO; IHE Delft. Water Accounting in the Niger River Basin; FAO WaPOR Water Accounting Reports; Food and Agriculture of the United Nations: Rome, Italy, 2020. [Google Scholar]
  8. Kumar, N.; Singh, S.K. Soil erosion assessment using earth observation data in a trans-boundary river basin. Nat. Hazards. 2021, 107, 1–34. [Google Scholar] [CrossRef]
  9. National Water Policy, Draft Recommended by National Water Board, Ministry of Water Resources. 2012. Available online: http://mowr.gov.in/writereaddata/linkimages/DraftNWP2012_English9353289094.pdf (accessed on 4 April 2022).
  10. Kumar, N.; Dubey, A.K.; Goswami, U.P.; Singh, S.K. Modeling of hydrological and environmental flow dynamics over a central Himalayan River basin through satellite altimetry and recent climate projections. Int. J. Climatol. 2022. [Google Scholar] [CrossRef]
  11. Godfrey, J.M.; Chalmers, K. Water Accounting: International Approaches to Policy and Decision-Making; Edward Elgar Publishing: Camberley, UK, 2012. [Google Scholar]
  12. Karimi, P.; Molden, D.; Bastiaanssen, W.G.M.; Cai, X. Water Accounting to Assess Use and Productivity of Water: Evolution of a Concept and New Frontiers. In Water Accounting: International Approaches to Policy and Decision-Making; Godfrey, J.M., Chalmers, K., Eds.; Edward Elgar Publishing: Cheltenham, UK, 2012; pp. 76–88. [Google Scholar] [CrossRef]
  13. Karimi, P.; Bastiaanssen, W.G.M.; Molden, D. Water Accounting Plus (WA+)—A water accounting procedure for complex river basins based on satellite measurements. Hydrol. Earth Syst. Sci. 2013, 17, 2459–2472. [Google Scholar] [CrossRef] [Green Version]
  14. Molden, D. Accounting for Water Use and Productivity, SWIM Paper 1; International Irrigation Management Institute: Colombo, Sri Lanka, 1997. [Google Scholar]
  15. Kijne, J.W.; Barker, R.; Molden., D. (Eds.) Water Productivity in Agriculture: Limits and Opportunities for Improvement; (Comprehensive Assessment of Water Management in Agriculture Series 1); CABI: Wallingford, UK; International Water Management Institute (IWMI): Colombo, Sri Lanka, 2003; Volume xix, 332p. [Google Scholar]
  16. Bastiaanssen, W.G.M.; Chandrapala, L. Water balance variability across Sri Lanka for assessing agricultural and environmental water use. Agric. Water Manag. 2003, 58, 171–192. [Google Scholar] [CrossRef]
  17. Gosling, S.N.; Arnell, N.W. A global assessment of the impact of climate change on water scarcity. Clim. Chang. 2016, 134, 371–385. [Google Scholar] [CrossRef]
  18. Shilpakar, R.L.; Bastiaanssen, W.G.M.; Molden, D.J. A remote sensing-based approach for water accounting in the East Rapti River Basin, Nepal. Himal. J. Sci. 2012, 7, 15–30. [Google Scholar] [CrossRef] [Green Version]
  19. Dost, R.; Obando, E.B.; Bastiaanssen, W.; Hoogeveen, J. Water Accounting Plus (WA+) in the Awash River Basin; Food and Agriculture of the United Nations: Amsterdam, The Netherlands, 2012. [Google Scholar]
  20. FAO; IHE Delft. Water Accounting in the Nile River Basin; FAO WaPOR Water Accounting Reports; Food and Agriculture of the United Nations: Rome, Italy, 2020. [Google Scholar] [CrossRef]
  21. Kayatz, B.; Harris, F.; Hillier, J.; Adhya, T.; Dalin, C.; Nayak, D.; Green, R.F.; Smith, P.; Dangour, A.D. “More crop per drop”: Exploring India’s cereal water use since 2005. Sci. Total Environ. 2019, 673, 207–217. [Google Scholar] [CrossRef] [PubMed]
  22. Luo, T.; Young, R.S.; Reig, P. Aqueduct Projected Water Stress Country Rankings; World Resources Institute: Washington, DC, USA, 2015. [Google Scholar]
  23. Central Water Commission (CWC). Water and Related Statistics; Directorate of Information System Organisation, Water Planning and Projects Wing Report; Central Water Commission: New Delhi, India, 2015. [Google Scholar]
  24. Madhok, A.K. Enhancing Water Use Efficiency, Roorkee Water Conclave 2020. 2020. Available online: https://www.iitr.ac.in/rwc2020/pdf/papers/RWC_246_Madhok_A_K.pdf (accessed on 1 April 2022).
  25. Molden, D.; Oweis, T.Y.; Pasquale, S.; Kijne, J.W.; Hanjra, M.A.; Bindraban, P.S.; Bouman, B.A.M.; Cook, S.; Erenstein, O.; Farahani, H.; et al. Pathways for Increasing Agricultural Water Productivity; Earthscan: London, UK; International Water Management Institute: Colombo, Sri Lanka, 2007; No. 612-2016-40552. [Google Scholar]
  26. Harsh, J. Micro-Irrigation in India: An Assessment of Bottlenecks and Realities. 2017. Available online: https://globalwaterforum.org/2017/06/13/micro-irrigation-in-india-an-assessment-of-bottlenecks-and-realities/ (accessed on 15 May 2022).
  27. Sharma, B.R.; Gulati, A.; Mohan, G.; Manchanda, S.; Ray, I.; Amarasinghe, U. Water Productivity Mapping of Major Indian Crops, NABARD and ICRIER. 2018. Available online: https://www.nabard.org/auth/writereaddata/tender/1806181128Water%20Productivity%20Mapping%20of%20Major%20Indian%20Crops,%20Web%20Version%20(Low%20Resolution%20PDF).pdf (accessed on 3 March 2022).
  28. EnviStats India: Environment Accounts; Annual Report 2020–2021; Department of Agriculture, Cooperation & Farmer’s Welfare: Delhi, India, 2020; Volume II.
  29. CGWB. National Compilation on Dynamic Groundwater Resources of India, 2017; Central Ground Water Board, Government of India: Delhi, India, 2019. [Google Scholar]
  30. FAO; IFAD; UNICEF; WFP; WHO. The State of Food Security and Nutrition in the World 2021. In Transforming Food Systems for Food Security, Improved Nutrition and Affordable Healthy Diets for All; FAO: Rome, Italy, 2021. [Google Scholar] [CrossRef]
  31. Amarasinghe, U.A.; Shah, T.; Turral, H.; Anand, B.K. India’s Water Future To 2025–2050: Business-As-Usual Scenario And Deviations; IWMI Research Reports 44522; International Water Management Institute: Colombo, Sri Lanka, 2007. [Google Scholar]
  32. Sakthivadivel, R.; Thiruvengadachari, S.; Amerasinghe, U.; Bastiaanssen, W.G.M.; Molden, D. Performance Evaluation of the Bhakra Irrigation System, India, Using Remote Sensing and GIS Techniques; Research Report 28; International Water Management Institute: Colombo, Sri Lanka, 1999. [Google Scholar]
  33. Singh, P.K.; Jain, S.K.; Mishra, P.K.; Goel, M.K. An assessment of water consumption patterns and land productivity and water productivity using WA+ framework and satellite data inputs. Phys. Chem. Earth Parts A/B/C 2021, 126, 103053. [Google Scholar] [CrossRef]
  34. Pati, J.K.; Patel, S.C.; Pruseth, K.L.; Malviya, V.P.; Arima, M.; Raju, S.; Pati, P.; Prakash, K. Geology and geochemistry of giant quartz veins from the Bundelkhand Craton, central India and their implications. J. Earth Syst. Sci. 2007, 116, 497–510. [Google Scholar] [CrossRef]
  35. Malviya, V.P.; Arima, M.; Pati, J.K.; Kaneko, Y. Petrology and geochemistry of metamorphosed basaltic pillow lava and basaltic komatiite in Mauranipur area: Subduction related volcanism in the Archean Bundelkhand craton, Central India. J. Mineral. Petrol. Sci. 2006, 101, 199–217. [Google Scholar] [CrossRef] [Green Version]
  36. Suryavanshi, N.; Furmston, J.; Ridley, A.J. The STRIPAK complex components FAM40A and FAM40B regulate endothelial cell contractility via ROCKs. BMC Cell Biol. 2018, 19, 26. [Google Scholar] [CrossRef]
  37. Economic Survey 2018–2019, Economic Division, Department of Economic Affairs, Ministry of Finance, Government of India, New Delhi. 2019. Available online: https://www.thehinducentre.com/resources/article28283454.ece/binary/Economic%20Survey%20Volume%20II%20Complete%20PDF.pdf (accessed on 5 March 2021).
  38. Ahlawat, O.P.; Gupta, P.; Kumar, S.; Sharma, D.K.; Ahlawat, K. Bioremediation of fungicides by spent mushroom substrate and its associated microflora. Ind. J. Microbio. 2010, 50, 390–395. [Google Scholar] [CrossRef] [Green Version]
  39. Available online: https://www.wateraccounting.org/ (accessed on 3 January 2022).
  40. Karimi, P.; Bastiaanssen, W.G.M.; Molden, D. Water Accounting Plus (WA+)—A water accounting procedure for complex river basins based on satellite measurements. Hydrol. Earth Syst. Sci. Discuss. 2012, 9, 12879–12919. [Google Scholar] [CrossRef]
  41. Karimi, P.; Bastiaanssen, W.G.M.; Molden, D.; Cheema, M.J.M. Basin-wide water accounting based on remote sensing data: An application for the Indus Basin. Hydrol. Earth Syst. Sci. 2013, 17, 2473–2486. [Google Scholar] [CrossRef] [Green Version]
  42. Delavar, M.; Morid, S.; Morid, R.; Farokhnia, A.; Babaeian, F.; Srinivasan, R.; Karimi, P. Basin-wide water accounting based on modified SWAT model and WA+ framework for better policy making. J. Hydrol. 2020, 585, 124762. [Google Scholar] [CrossRef]
  43. Lambin, E.F.; Turner, B.L.; Geist, H.J.; Agbola, S.B.; Angelsen, A.; Bruce, J.W.; Coomes, O.T.; Dirzo, R.; Fischer, G.; Folke, C.; et al. The causes of land-use and land-cover change: Moving beyond the myths. Glob. Environ. Chang. 2001, 11, 261–269. [Google Scholar] [CrossRef]
  44. Available online: https://irain.eng.uci.edu/ (accessed on 2 January 2022).
  45. Sorooshian, S.; Hsu, K.; Coppola, E.; Tomasseti, B.; Verdecchia, M.; Visconti, G. Hydrological Modelling and the Water Cycle: Coupling the Atmospheric and Hydrological Models; Springer: Berlin/Heidelberg, Germany, 2008. [Google Scholar] [CrossRef]
  46. Available online: https://climateengine.com/ (accessed on 2 January 2022).
  47. Available online: https://chrsdata.eng.uci.edu/ (accessed on 2 January 2022).
  48. Available online: https://rainsphere.eng.uci.edu/ (accessed on 3 January 2022).
  49. Available online: https://www.watres.com/ (accessed on 3 January 2022).
  50. Funk, C.; Peterson, P.; Landsfeld, M.; Pedreros, D.; Verdin, J.; Shukla, S.; Husak, G.; Rowland, J.; Harrison, L.; Hoell, A.; et al. The climate hazards group infrared precipitation with stations—A new environmental record for monitoring extremes. Sci. Data 2015, 2, 150066. [Google Scholar] [CrossRef] [PubMed] [Green Version]
  51. Yan, K.; Park, T.; Yan, G.; Liu, Z.; Yang, B.; Chen, C.; Nemani, R.R.; Knyazikhin, Y.; Myneni, R.B. Evaluation of MODIS LAI/FPAR Product Collection 6. Part 2: Validation and Intercomparison. Remote Sens. 2016, 8, 460. [Google Scholar] [CrossRef] [Green Version]
  52. Ali, H.; Mishra, V. Increase in Subdaily Precipitation Extremes in India Under 1.5 and 2.0 °C Warming Worlds. Geophys. Res. Lett. 2018, 45, 6972–6982. [Google Scholar] [CrossRef] [Green Version]
  53. Prakash, A.; Goodrich, C.G.; Singh, S. Informing Water Policies in South Asia; Routledge Publications: Oxford, UK, 2014; p. 252. [Google Scholar]
  54. Musie, M.; Momblanch, A.; Sen, S. Exploring future global change-induced water imbalances in the Central Rift Valley Basin, Ethiopia. Clim. Chang. 2021, 164, 47. [Google Scholar] [CrossRef]
  55. Gupta, V.; Singh, V.; Jain, M.K. Assessment of precipitation extremes in India during the 21st century under SSP1-1.9 mitigation scenarios of CMIP6 GCMs. J. Hydrol. 2020, 590, 125422. [Google Scholar] [CrossRef]
  56. Dembélé, M.; Schaefli, B.; Giesen, N.V.D.; Mariéthoz, G. Suitability of 17 gridded rainfall and temperature datasets for large-scale hydrological modelling in West Africa. Hydrol. Earth Syst. Sci. 2020, 24, 5379–5406. [Google Scholar] [CrossRef]
  57. Aadhar, S.; Mishra, V. High-resolution near real-time drought monitoring in South Asia. Sci. Data 2017, 4, 170145. [Google Scholar] [CrossRef] [Green Version]
  58. Senay, G.B.; Kagone, S.; Velpuri, N.M. Operational global actual evapotranspiration: Development, evaluation, and dissemination. Sensors 2020, 20, 1915. [Google Scholar] [CrossRef]
  59. Al-Bakri, J.T.; D’Urso, G.; Batchelor, C.; Abukhalaf, M.; Alobeiaat, A.; Al-Khreisat, A.; Vallee, D. Remote Sensing-Based Agricultural Water Accounting for the North Jordan Valley. Water 2022, 14, 1198. [Google Scholar] [CrossRef]
  60. Singh, V.G.; Singh, S.K.; Kumar, N.; Singh, R.P. Simulation of land use/land cover change at a basin scale using satellite data and markov chain model. Geocarto Int. 2022, 1–26. [Google Scholar] [CrossRef]
Figure 1. Location map of the Betwa River basin shows the topographic variability, drainage network, and respective gauge stations.
Water 14 03473 g001
Figure 2. Figure depicting PERSIANN and CHIRPS precipitation datasets, based on the spatial distribution of mean monthly precipitation in the BRB.
Water 14 03473 g002
Figure 3. It shows the amount of mean annual precipitation in the basin and corresponding dry, wet, and average years derived from PERSIANN and CHIRPS datasets.
Water 14 03473 g003
Figure 4. Figure portraying average annual precipitation derived from PERSIANN and CHIRPS datasets for the whole study period.
Water 14 03473 g004
Figure 5. Scatter plots showing comparison of satellite precipitations (PERSIANN and CHIRPS) with the observed precipitation of single location at the outlet of the basin.
Water 14 03473 g005
Figure 6. Scatter plots show a comparison of satellite precipitations (PERSIANN and CHIRPS) with the observed precipitation for the entire basin.
Water 14 03473 g006
Figure 7. The time series plot of a single location at the basin outlet for observed (IMD) vs. satellite precipitations (PERSIANN and CHIRPS) datasets over a period from 2003–2019.
Water 14 03473 g007
Figure 8. The time series plot of observed (IMD) vs. satellite precipitations (PERSIANN and CHIRPS) datasets for the entire basin over a period from 2003–2019.
Water 14 03473 g008
Figure 9. Figure shows seasonal and inter-annual variability in the precipitation, SSEBop ET, and water yield obtained from the PERSIANN precipitation for the period of 2003–2019. (a) seasonal variability plot of PERSIANN precipitation, SSEBop ET and water yield; (b) interannual variability; (c) mean water yield of period 2003–2019.
Water 14 03473 g009
Figure 10. The figure shows the seasonal and inter-annual variability in the precipitation, SSEBop ET, and water yield obtained from the CHIRPS precipitation for the period of 2003–2019. (a) CHIRSP precipitation, SSEBopET and water yield seasonal and inter-annual variability in the precipitation, SSEBop ET, and water yield; (b) inter-annual variability in the precipitation, SSEBop ET, and water yield; (c) mean water yield of period 2003–2019.
Water 14 03473 g010
Figure 11. The figures depict yearly average water yields in the basin for dry, wet, and average years, based on PERSIANN and CHIRPS precipitation datasets.
Water 14 03473 g011
Figure 12. Sheet 2 was generated using WA+ with details of total water consumption in the basin for PERSIANN precipitation datasets based on dry year (2014–2015).
Water 14 03473 g012
Figure 13. Sheet 2 was generated using WA+, with details of total water consumption in the basin for PERSIANN precipitation datasets, based on wet year (2016–2017).
Water 14 03473 g013
Figure 14. Sheet 2 was generated using WA+, with details of total water consumption in the basin for CHIRPS precipitation datasets, based on the dry year (2015–2016).
Water 14 03473 g014
Figure 15. Sheet 2 was generated using WA+, with details of total water consumption in the basin for CHIRPS precipitation datasets, based on wet year (2016–2017).
Water 14 03473 g015
Table 1. List of earth observation datasets used for estimating total water consumption in BRB.
Data SourceData TypesTemporal ResolutionSpatial ResolutionAvilable fromWeb Portal
WDPAWorld data on protected areasAnnualShapefile-https://www.protectedplanet.net/en/thematic-areas/wdpa?tab=WDPA (accessed on 6 January 2022)
GlobCover
LC v2
Glob coverAnnual300 m1992–2015http://due.esrin.esa.int/page_globcover.php (accessed on 6 January 2022)
MODISLand use/land coverAnnual500 m2001-onwardshttps://lpdaac.usgs.gov/products/mcd12q1v006/ (accessed on 6 January 2022)
MIRCAMonthly irrigated and rainfed crop areasAnnual10 km1998–2002https://www.uni-frankfurt.de/45217893/5_MIRCA? (accessed on 6 January 2022)
GMIAGlobal map of irrigated areasAnnual5 arc-min2013https://www.fao.org/aquastat/en/ (accessed on 7 January 2022)
8daily LAILead area index8 daily500 m2000 onwardshttps://lpdaac.usgs.gov/products/mcd15a2hv006/ (accessed on 7 January 2022)
8daily GPPGross primary production8 daily500 m2000 onwardshttps://lpdaac.usgs.gov/products/mod17a2hv006/ (accessed on 7 January 2022)
Yearly NPPNet primary productionAnnual500 m2000-onwardshttps://lpdaac.usgs.gov/products/mod17a3hv006/ (accessed on 7 January 2022)
IMDPrecipitationDaily0.25°1901-onwardshttps://www.imdpune.gov.in/ (accessed on 7 January 2022)
PERSIANNPrecipitationDaily0.25°2000-onwardshttps://chrsdata.eng.uci.edu/ (accessed on 7 January 2022)
CHIRPSPrecipitationDaily5 km1981-onwardshttps://www.chc.ucsb.edu/data/chirps (accessed on 7 January 2022)
Table 2. Land use class categories with a likeness to ecosystem services, human interaction, provisioning services, and interventions in the water cycle. These classes govern the management options in WA+.
Managed Water UseModified Land UseUtilized Land UseConserved Land Use
Irrigated crops
Irrigated pastures
Irrigated biofuels
Reservoirs and canals
Irrigated fruit
Greenhouses
Aquaculture
Residential areas and homesteads
Industrial area
Irrigated recreational parks
Managed wetlands and swamps
Inundation areas
Mining
Evaporation ponds
Wastewater treatment beds
Power plants
Plantation trees
Rainfed pastures
Rainfed crops cereals
Rainfed fruit
Rainfed biofuels
Rainfed recreational parks
Fallow land
Dump sites
Oasis and wadis
Roads and lanes
Peri-urban areas
Closed natural forests
Tropical rain forest
Open natural forest
Woody savanna
Open savanna
Sparse savanna
Shrub land
Natural pastures
Deserts
Mountains
Rocks
Flood plains
Tidal flats
Bare land
Wasteland
Moore fields
Wetlands and swamps
Alien invasive species
Permafrosts
Reserves or national parks
Areas set aside for conservation
Glaciers
Coastal protection sites
Protected forests
Protected shrubland
Protected natural water bodies
Protected wetlands
Table 3. The area wise distribution of WALU-based land use classes in the study area.
Water Management Category (WMC)WALU CodeWA+ Based LULCArea (km2)Area (%)
Protected Land Use
(PLU) (20%)
PLU1Protected forests16.920.04
PLU2Protected shrubland65.190.15
PLU3Protected natural waterbodies2.390.01
Utilized Land Use
(ULU) (25.25%)
ULU1Closed deciduous forest1435.653.32
ULU2Shrub land and mesquite7734.4417.87
ULU3Brooks, rivers, and waterfalls1757.694.06
Modified Land Use
(MLU) (11.10%)
MLU1Forest plantations0.570.00
MLU2Rainfed crops—cereals3569.558.25
MLU3Rainfed crops—vegetables and melons17.260.04
MLU4Fallow and idle land1178.072.72
MLU5Rainfed industry parks—outdoor37.930.09
Managed Water Use
(MWU) (63.46%)
MWU1Irrigated crops—cereals26,859.2662.06
MWU2Irrigated homesteads and gardens (urban cities)–outdoor211.540.49
MWU3Irrigated homesteads and gardens (rural cities)–outdoor349.060.91
Total Area (km2) 43,280.54100.00
Table 4. Statistical parameters obtained after validation of CHIRPS and PERSIANN precipitation datasets with the Indian Meteorological Department (IMD) precipitation data at a single location (outlet of the basin) and for the entire basin (average of the different locations) in the basin.
Datasets Used for ComparisonLocationsR2RMSENSEBIAS (%)
Observed vs. PERSIANNBasin Outlet0.7944.090.45−46.6
Observed vs. CHIRPS0.7248.770.58−32.94
Observed vs. PERSIANNEntire Basin0.8348.350.81−6.75
Observed vs. CHIRPS0.9429.920.92−7.8
Table 5. Performance indicators based on satellite precipitation datasets for wet year in the Betwa River basin.
EvaporationFor PERSIANN PrecipitationFor CHIRPS PrecipitationImplication
Transpiration fraction
( T t o t a l E T ) × 100
36.27%36.27%Sufficient amount of transpiration being generated from rainfed and irrigated areas
Beneficial fraction
( E T b e n e f i c i a l t o t a l E T ) × 100
38.31%37.97%Poor utilization of
ET amounts
Agricultural ET fraction24.41%24.41%Area dominated by
agricultural activities
Irrigated ET fraction60.00%60.00%Large proportion of ET came from irrigated areas
Rainfed ET Fraction8.14%8.14%Considerable proportion of ET came from rainfed areas
Table 6. Performance indicators based on satellite precipitation datasets for dry year in the Betwa River basin.
EvaporationFor PERSIANN PrecipitationFor CHIRPS PrecipitationImplication
Transpiration fraction
( T t o t a l E T ) × 100
39.50%31.10%Sufficient amount of transpiration being generated from rainfed and irrigated areas
Beneficial fraction
( E T b e n e f i c i a l t o t a l E T ) × 100
40.88%33.07%Poor utilization of
ET amounts
Agricultural ET fraction27.35%21.65%Area dominated by
agricultural activities
Irrigated ET fraction59.94%59.45%Large proportion of ET being generated from irrigated areas
Rainfed ET Fraction8.29%8.27%Considerable proportion of ET came from rainfed areas
Publisher’s Note: MDPI stays neutral with regard to jurisdictional claims in published maps and institutional affiliations.

