Article

Distribution, Sources, and Risk of Polychlorinated Biphenyls in the Largest Irrigation Area in the Yellow River Basin

1
Water Conservancy and Civil Engineering College, Inner Mongolia Agricultural University, Huhhot 010018, China
2
School of Space and Environment, Beihang University, Beijing 100191, China
*
Author to whom correspondence should be addressed.
These authors contributed equally to this work.
Water 2022, 14(21), 3472; https://doi.org/10.3390/w14213472
Submission received: 21 September 2022 / Revised: 20 October 2022 / Accepted: 26 October 2022 / Published: 30 October 2022
(This article belongs to the Special Issue Water Environment Pollution and Control)

Abstract

:
To investigate the contamination of PCBs in agricultural soils irrigated chronically with polluted water and the distribution and migration of PCBs under long-term irrigation, 100 farmland soil profile samples were collected in the Yellow River irrigation area in Inner Mongolia, China, to determine PCB content. Cluster analysis was used to identify possible sources of PCBs products, and the USEPA Health Risk Evaluation Model assessed the health risks posed by PCBs to humans. The results showed that the detection rates of eight monomers in the different soil layers of each sample site ranged from 5% to 90%, and the concentration ranged from not detected to 87.71 ng·g−1. The PCBs content showed a vertical distribution rule of accumulation in the shallow layer, sudden decrease in the middle layer. Low-chlorinated PCBs were dominant in each soil profile. Source identification indicated that PCB pollution in the study area originated mainly from the Aroclor1242, Aroclor1248, Aroclor1016, Aroclor1232, and Aroclor1221 industrial products and domestic transformer oil. Finally, a health risk assessment demonstrated that child and adult groups in study area were exposed to negligible carcinogenic and noncarcinogenic risks.

1. Introduction

It has been reported that more than 80 countries are currently facing freshwater shortages, and global water quality is deteriorating [1]. Global freshwater use has increased by a factor of six over the past 100 years, Agriculture currently accounts for 69% of global water withdrawals, which are mainly used for irrigation [2]. Pollutants in irrigation water, particularly persistent organic pollutants (POPs), would be inevitably deposited in the farmland, absorbed by crops, and finally transferred to the human body, pose potential threats to the soil-crop system and human health [3]. The control of non-point source pollution of POPs in the farmland is facing great challenges. The Yellow River is the fifth-largest river in the world, and the largest water source in northern China, and it is responsible for the irrigation of farmland in the Yellow River irrigation area. The Yellow River irrigation area in Inner Mongolia is an important commodity grain and oil production base for the Inner Mongolia Autonomous Region and for China in general. Ensuring food security and sustainable agriculture in this area is critical to achieving sustainable development goals. In recent years, there have been numerous reports on water pollution in the Yellow River. A study on the distribution and migration of POPs in the Inner Mongolia section of the Yellow River Polychlorinated biphenyls (PCBs) were detected [4].
PCBs are noted for their persistence, ubiquity, long-range atmospheric transport, bioaccumulation [5], and adverse effects on the environment [6] and human health [7]. PCBs have been extensively used in various industrial and commercial applications, such as transformers, capacitors, and plasticizers [8]. After entering the farmland with water, PCBs will gradually migrate to the deeper layers of the soil, eventually causing groundwater pollution, and even the entire ecosystem pollution. Although PCBs were banned in 2004 by the Stockholm Convention, they are still frequently detected in farmland soils in many countries because of their persistence and non-degradable nature [9]. China is a large agricultural country with a long history and large farmlands. Due to the significant historical production and usage of PCBs, residues of these contaminants have been found at high levels in farmland soil in some places in China [10,11,12].
To date, many scholars have studied the PCB pollution in the irrigation farming area such as farmland sewage irrigation, reclaimed water irrigation, and clear irrigation areas [13,14,15,16]. In the study on the effect of irrigation years on the concentration of PCBs in agrarian soils, Abrahao et al. found that during the first years of irrigation in the Lerma basin, irrigation has not significantly influenced the concentrations of PCBs in the soils [17]. Teng et al. collected soil samples from paddy fields in Liaohe River Plain and monitored the PCBs contents, and verified that there is a significant contribution of long-term irrigation of polluted river water to PCBs contaminations in paddy soils [18]. Ngweme at al investigated the levels of PCBs in irrigation water and soils from the vegetable growing sites in Congo, and evaluated the potential human health risks; the results showed that PCBs did not pose a carcinogenic risk to the local population [19]. These studies have focused on PCBs’ pollution of the soil surface. However, there have been few reports on the PCBs’ pollution vertical distribution characteristics in soils with polluted water. To investigate the contamination of PCBs in agricultural soils irrigated chronically with polluted water and the distribution and migration of PCBs under long-term irrigation with the Yellow River irrigation area of Inner Mongolia in China as the study area, this study investigated PCB contamination in agricultural soils chronically irrigated with contaminated Yellow River water. The vertical and spatial distribution characteristics of PCBs in soils of irrigated areas under the effect of long-term irrigation were studied. The possible product sources of PCBs in the study area were identified through cluster analysis, and the health risk was evaluated. To contribute a theoretical basis for the distribution and migration of PCBs in soil and to provide reference for the study of persistent organic pollutants in irrigated soils by contaminated water, it is of great significance to seek safe irrigation modes, study food security, and promote the agricultural sustainable development.

2. Materials and Methods
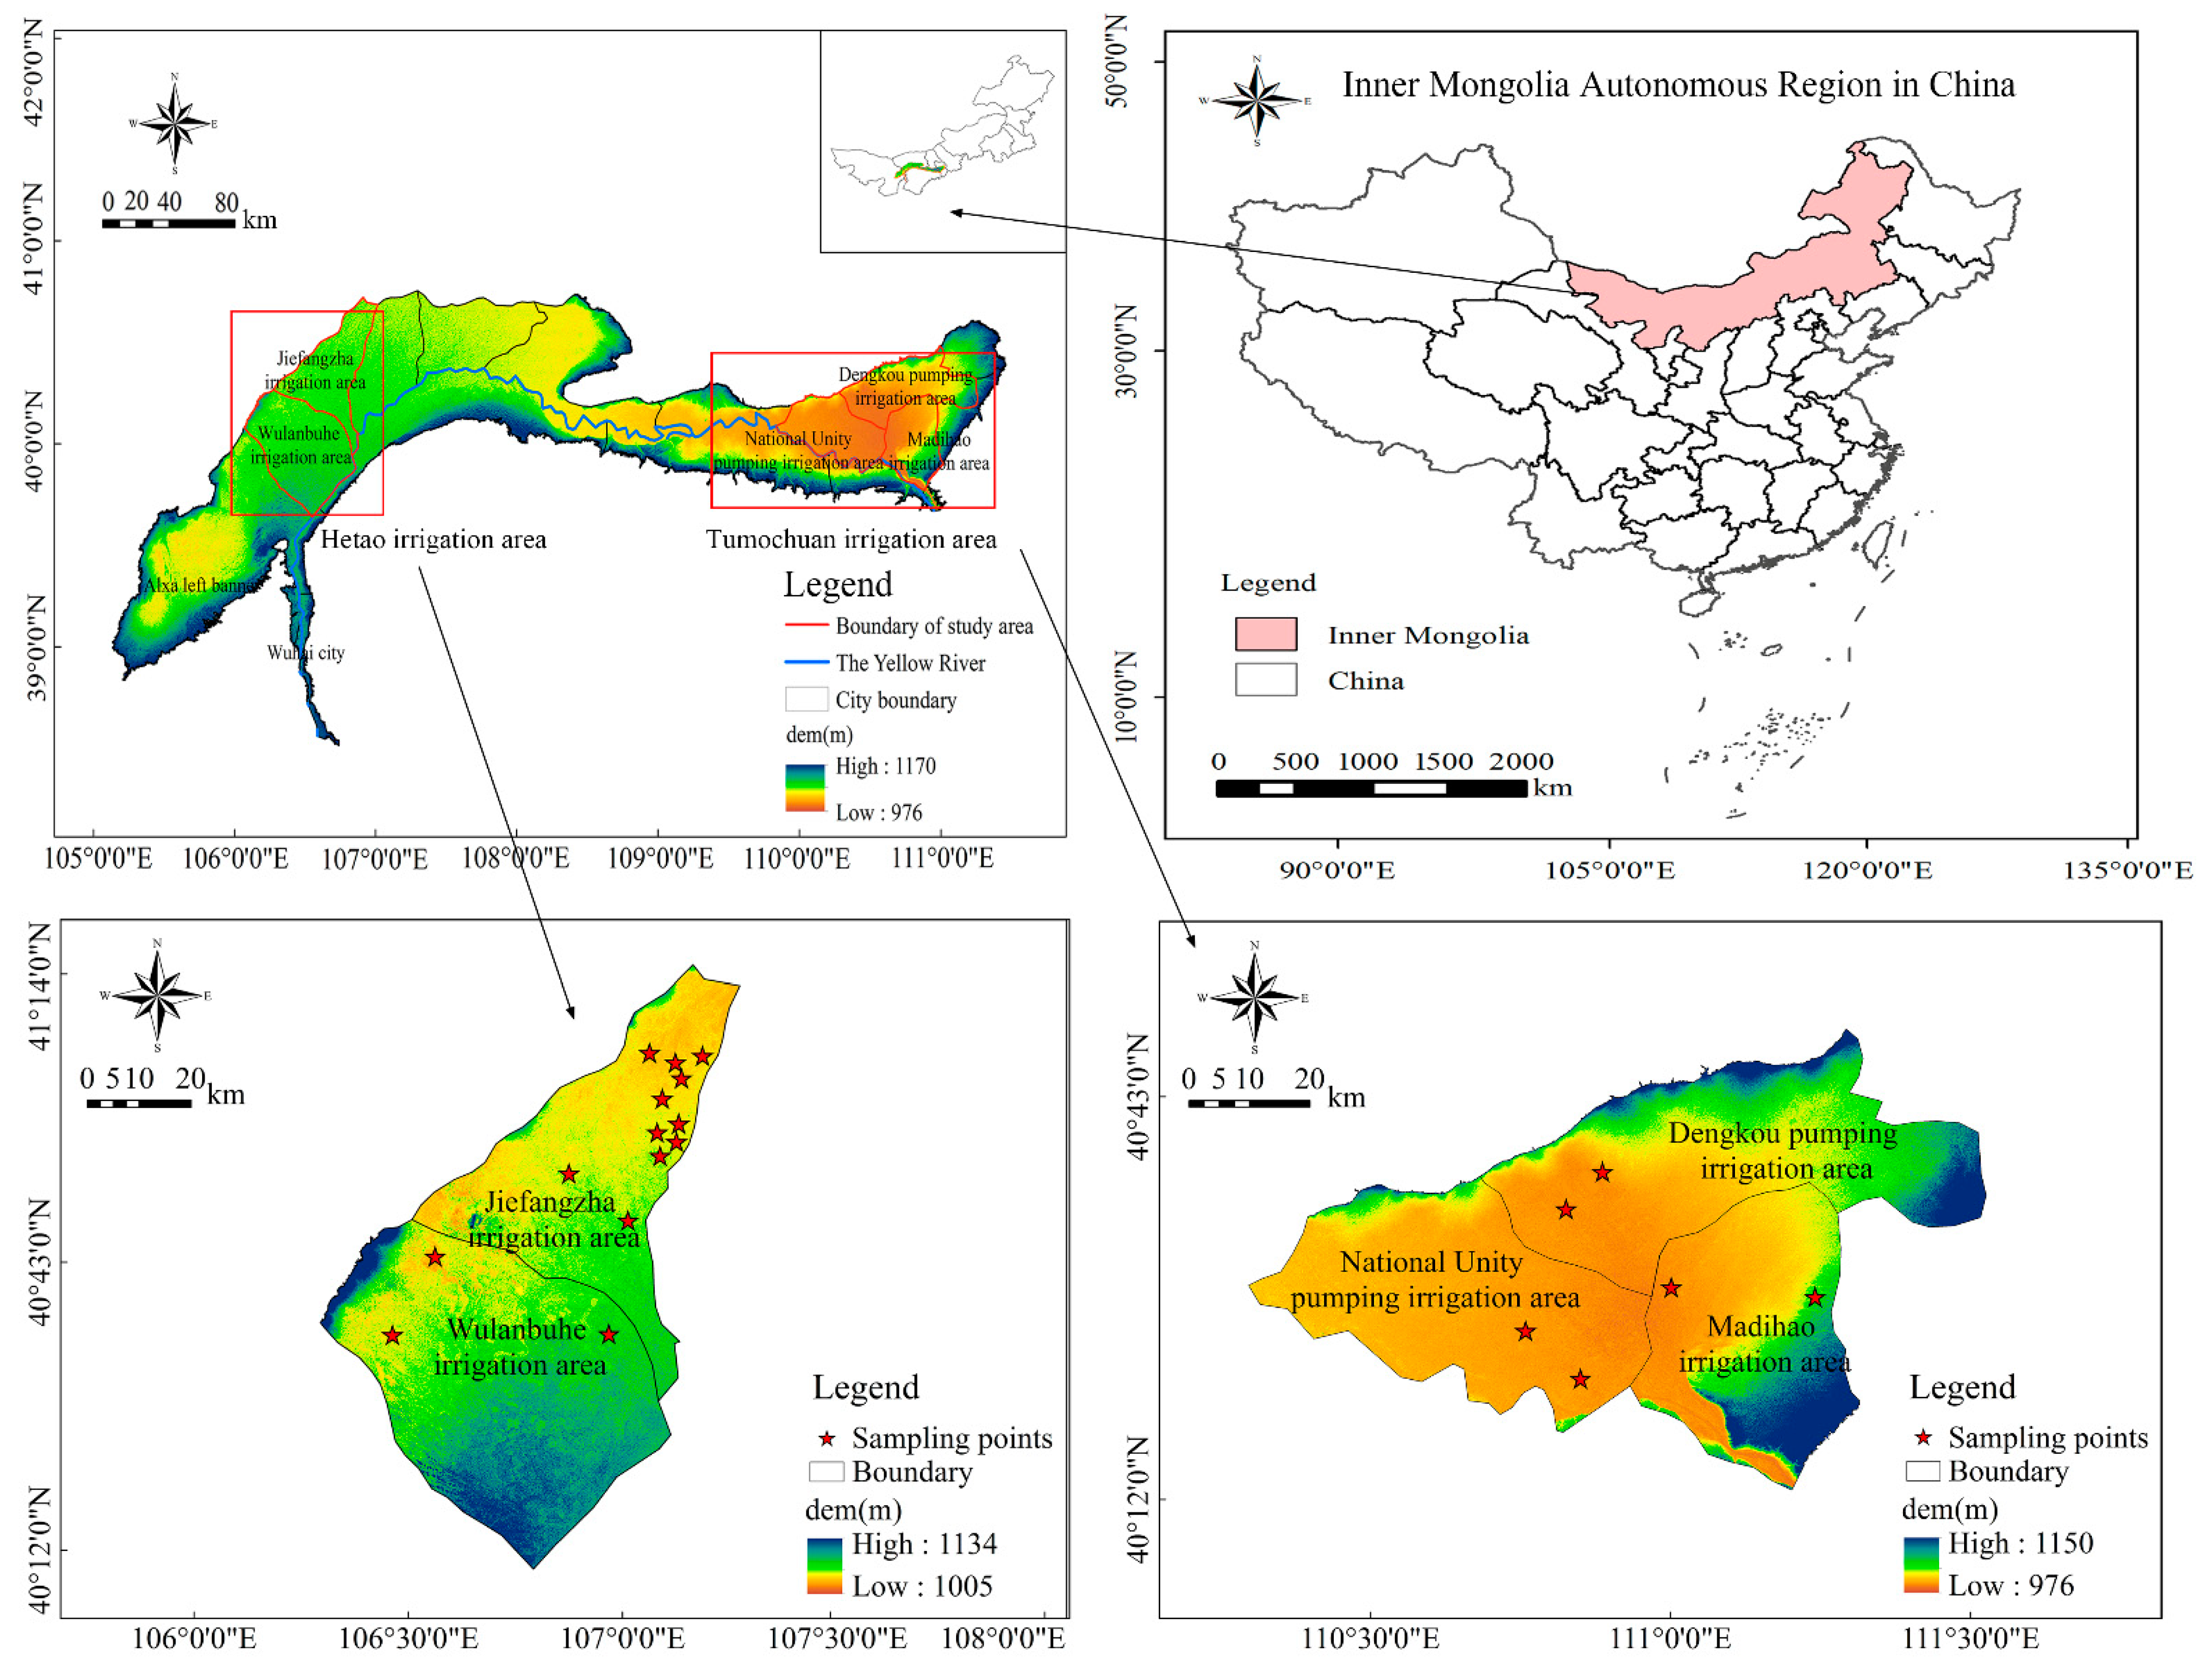
2.1. Study Area

The Yellow River irrigation area of Inner Mongolia is located at the northern end of the Yellow River Basin, with a total land area of 19.27 thousand km2. The existing arable land is 12.52 thousand km2, and the effective irrigation area is approximately 7.3 thousand km2. The soil type is mainly salinized light color meadow soil and saline soil, and the soil texture is mainly light sandy loam. The Yellow River irrigation area of Inner Mongolia is composed of the Hetao irrigation district, Tumochuan irrigation district, and the South Bank of the Yellow River irrigation district. The Hetao-Tumochuan Plain is the main agricultural production area in the Yellow River irrigation area of Inner Mongolia. Therefore, the Hetao (mainly in the Jiefangzha and Wulanbuhe irrigation area) and Tumochuan (Including the Madihao, Dengkou and National Unity Pumping irrigation area) irrigation areas were selected as the study area; the study area location is shown in Figure 1. The main crops grown are wheat, corn, and sunflower. The irrigated area has flat terrain and sufficient heat, with annual sunshine of 2900–3200 h and frost-free period of 140–180 d. Rainfall in this area is scarce, with an annual average precipitation of only 130–400 mm and annual average evaporation of 1200–1600 mm. Agricultural production in this area is therefore entirely dependent on irrigation, with the Yellow River as the main water source.

2.2. Sample Collection

In this study, a total of 20 sampling sites were laid in differing irrigation districts along the Yellow River in Inner Mongolia (Figure 1), and Global Positioning System was used to record the specific locations. At each site, a profile (0–100 cm) soil was taken using a hand soil auger. One sample was collected every 20 cm starting from the soil surface, i.e., 0–20, 20–40, 40–60, 60–80, 80–100 cm, meaning 5 samples were collected for each site and a total of 100 samples at 20 sites. The samples were labelled, stored in clean special aluminum boxes, sealed, and frozen at 4 °C until analysis. All the equipment was carefully washed with acetone and n-hexane and dried before use.

2.3. Material and Reagents

All solvents used pesticide grade for the chromatographic analysis. External calibration standards of PCBs #2, 5, 29, 47, 98, 154, 171, and 201 were purchased from Accu Standard (New Haven, CT, USA) and all have a highly pure (>98%). The Florisil column was obtained from Supelco (Bellefonte, PA, USA).

2.4. Sample Extraction and Analysis

After removing pebbles and plant roots, the fresh soils were placed in a freeze-dryer that removed all water over the course of 24 h, then ground and sieved through sieve. Next, 4.00 g of soil and diatomite (1.00 g) were accurately weighed and mixed before being adding to the extract pond for accelerated solvent extraction with n-hexane and acetone (V = 1:1). The optimized operational variables of the accelerated solvent extraction were as follows: static extraction time, 6 min; extracting pressure, 1700 psi; extraction temperature, 100 °C; flush volume, 90%; cycle number, 3. The Florisil columns were first preconditioned with 30 mL of acetone and then rinsed with 20 mL of n-hexane. This mixture was subsequently concentrated in a preconditioned Florisil column with n-hexane and hexane-acetone as the eluent, as outlined in the USEPA Method 8082A.
For PCB analysis, a Varian 450 GC system with a CP-Sil 5CB (30 m × 0.25 mm; 0.39 μm thick) and an electron capture detector was used, and the external standard calibration of the peak area versus the concentration was also determined. The resulting mixture was further concentrated to approximately 2 mL under a gentle stream of dry nitrogen gas. The injection port was operated at 280 °C in split-less mode, nitrogen (99.999% pure) was used as the carrier gas, and the column flow was 1.0 mL·min−1. The linear temperature program of the GC oven was as follows: the initial temperature was maintained at 80 °C for 2 min, then heated to 180 °C at 10 °C·min−1 and then 250 °C for 10 min at 3 °C·min−1 before being set to a temperature program from 250 to 280 °C at 20 °C·min−1 and maintained for 8 min.
Quality assurance and quality control were performed using a five-level multipoint calibration standard based on the peak area. Laboratory blank, laboratory blank spike, and matrix spike samples were run for the eight PCBs in parallel with the samples to check for any contaminants during concentration and detection. The concentration of the lowest calibration standard was taken as the limit of quantitation (LOQ). The LOQs of PCBs ranged from 0.1 to 0.3 ng·g−1, and recoveries between 84.25% and 109.25%. In all the blank samples, all values were lower than the detection limit. These results indicate that the method was accurate and replicable.

2.5. Statistical Analysis

Analysis of data using SPSS 25.0. The Kolmogorov–Smirnov test was used to test the data and determined that all data conformed to the normal distribution. The results were explained via cluster analysis, which was used to categorize Σ8PCBs values in similar sets and clarify their sources.

2.6. Health Risk Assessment Methods

2.6.1. Exposure Assessment

The USEPA health risk assessment model was used to assess the exposure of PCBs in farmland soil in the Yellow River irrigation area from three exposure routes: ingestion, dermal, and inhalation, according to the chronic daily intake (CDI). The CDI in soil was computed by following Equations (1)–(3) [20]:
C D I i n g = C × I n g R × E F × E D × C F B W × A T
C D I d e r = C × S A × A F × E F × E D × A B S × C F B W × A T
C D I i n h = C × I n h R × E F × E D P E F × B W × A T
where CDIing, CDIder, and CDIinh refer to the exposure amount (mg·(kg·d)−1) of soil pollutants under ingestion, dermal, and inhalation, respectively. C is the concentration of PCBs in the soil (mg·kg−1). Other parameters and their meanings are listed in Table 1 [21,22,23].

2.6.2. The Carcinogenic Risk

The carcinogenic risk ( R T ) is calculated as follows:
R i = C D I i × S F i
R T = R i
where R i is the carcinogenic risk generated by different routes, dimensionless; R T is the total risk of cancer under multiple routes, without dimensionality; and S F I is the slope factor of carcinogenesis via different routes (kg·d·mg−1). The SF value of PCBs is 2 kg·d·mg−1 for ingestion and the dermal route, and 2.18 × 10⁻³ kg d·mg−1 for inhalation [24]. According to the US Environmental Protection Agency [20], a range of 10−6 to 10−4 is considered an acceptable level of cancer risk.

2.6.3. The Non-Carcinogenic Risk

The non-carcinogenic risk ( H I ) is calculated as follows:
H Q i = C D I i R f D i
H I = H Q i
where H Q i is the non-carcinogenic risk generated by different approaches, dimensionless; H I is the total noncarcinogenic risk across multiple pathways, nondimensional; and R f D i is the reference dose of non-carcinogenic pollutants in different channels, mg·(kg·d)−1. The RfD value of PCBs is 2.3 × 10⁻⁵ mg (kg·d)−1 [20]. An HI value of 1 is the acceptable hazard quotient [20].

3. Results

3.1. Distribution Characteristics of Polychlorinated Biphenyls (PCBs) in Soil Profiles

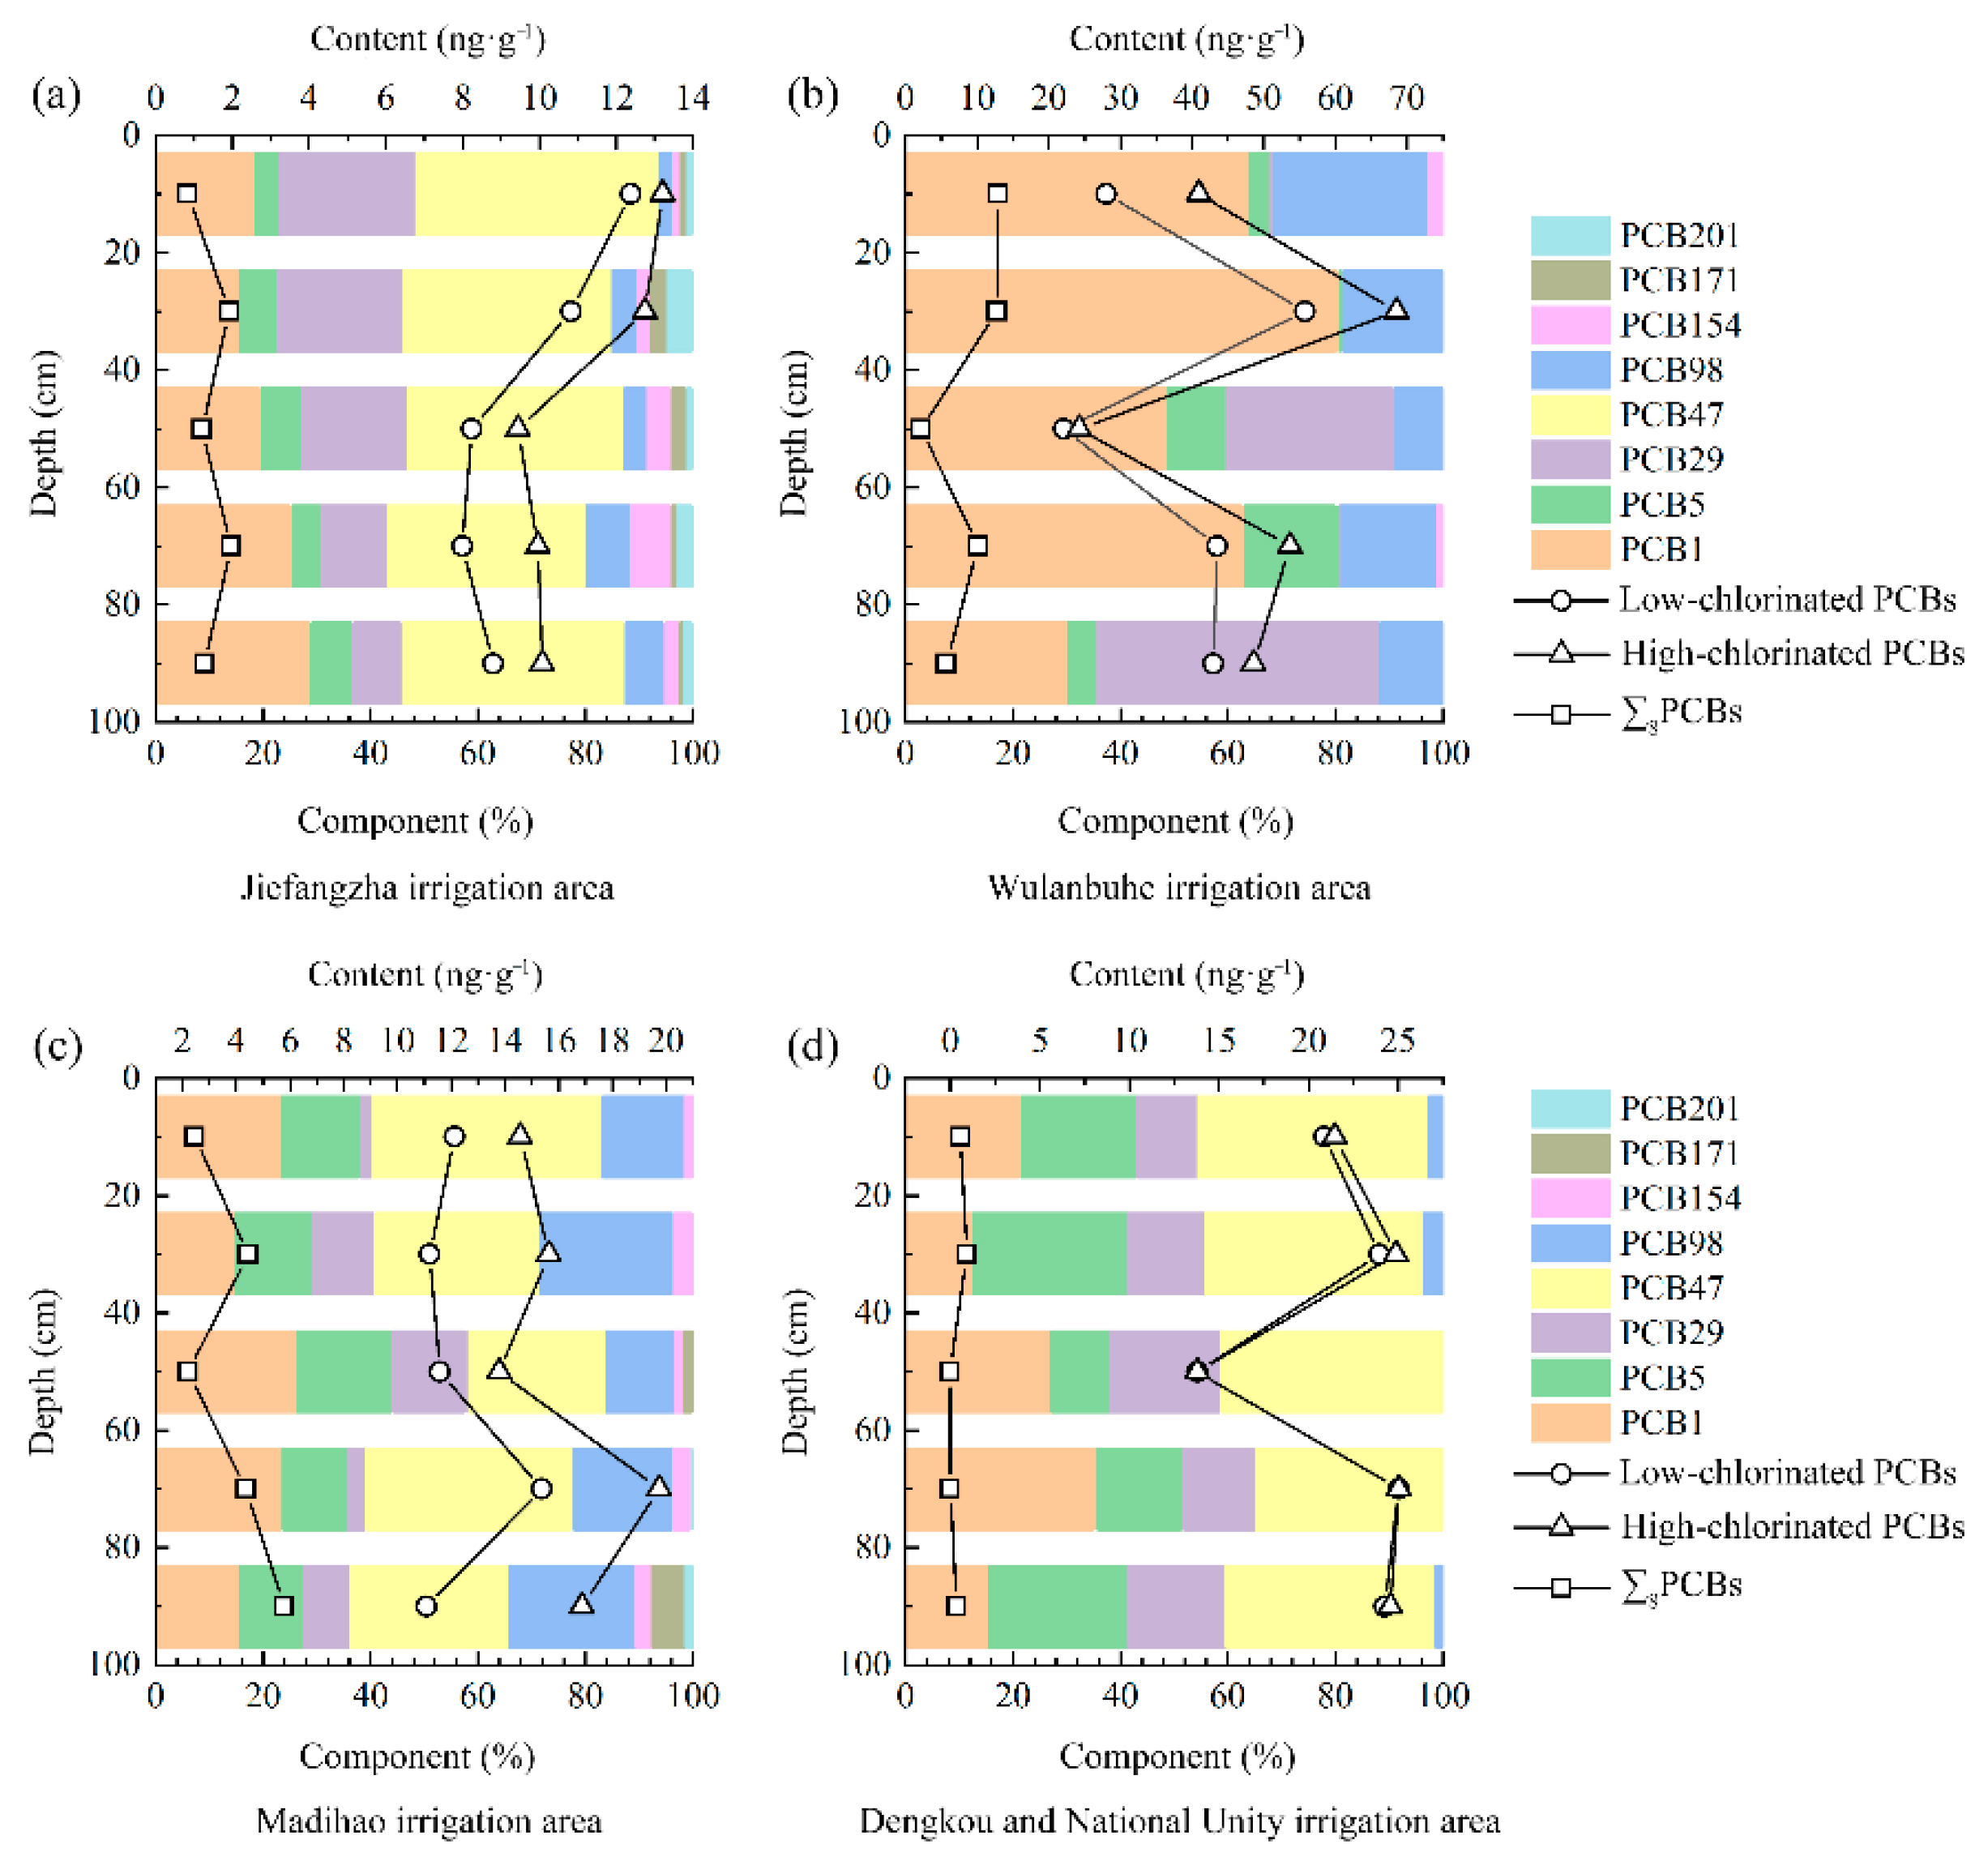
3.1.1. Vertical Distribution of PCBs

The statistical analysis results for PCBs in the 0–100 cm soil profile in the Yellow River irrigation area of Inner Mongolia are shown in Table 2. The detection rates of eight monomers in different soil layers from each sample point ranged from 5% to 90%, and their concentrations ranged from Nd-87.71 ng·g−1. The highest concentration was found in the 20–40 cm soil layer, and the lowest concentration was concentrated in the 40–60 cm soil layer. Overall, the content of PCBs in the deeper soil profile in the study area increased and the coefficient of variation was high.
The detection rate of ∑8PCBs in the study area was 100% and decreased gradually along the vertical section. The contents of ∑8PCBs ranged from not detected to 120.65 ng·g−1. The ∑8PCBs in each soil layer was in the order 20–40 > 60–80 > 80–100 > 0–20 > 40–60 cm. Apart from the average concentration of 40–60 cm at 12.97 ng·g−1, the average concentrations of the other soil layers were all within 5 ng·g−1, and the vertical distribution was relatively uniform in all profiles (Figure 2). The detection rate and content of low-chlorinated PCBs were higher than those of high-chlorinated PCBs in all profiles. The detection rate of low-chlorinated PCBs ranged from 65% to 90%, and the content of low-chlorinated PCBs in each layer accounted for 85.13–90.67% of the total PCB content. It is noteworthy that the concentration order of low-chlorinated PCBs in each layer was the same as ∑8PCBs, and the vertical distribution trend was similar to that of ∑8PCBs (Figure 2). The distribution of PCBs in the study area was dominated by low-chlorinated PCBs. The detection rate of high-chlorinated PCBs ranged from 5% to 60%. In contrast with low-chlorinated PCBs, the content of high-chlorinated PCBs in the 20–40 cm soil layer was higher than that in the 80–100 cm soil layer, indicating that it was more difficult for high-chlorinated PCBs to migrate to deeper soil than low-chlorinated PCBs.
The composition of PCBs in each soil layer of the study area consisted mainly of PCB1 and PCB47. The proportion of high-chlorinated PCBs in each layer was lower than 15%, the monomer of high-chlorinated PCBs was mainly PCB98, and the content of 6–8 PCBs in each layer was lower than 1 ng·g−1. Pentachlorobiphenyl is often used as domestic paint additives, it is speculated that PCBs in the study area were related to domestic paint additives. Our results indicate that the use of and residue from PCB-containing products are potential sources of PCBs in farmland soil in the Yellow River irrigation area of Inner Mongolia. The composition characteristics of PCBs in the topsoil were as follows: PCB1 (34.21%) > PCB47 (30.10%) > PCB29 (12.37%) > PCB98 (11.94%) > PCB5 (8.94%) > PCB154 (1.55%) > PCB171 (0.45%) > PCB201 (0.44%) [4]. This is essentially consistent with the composition structure of PCBs in the Inner Mongolia section of the Yellow River (PCB47 > PCB29 > PCB5 > PCB154 > PCB201 > PCB98 > PCB171). The component distribution of PCBs in the soil profile (Figure 2) suggested that the types of PCBs in the deep soil were similar to those in the shallow soil.

3.1.2. Spatial Distribution of PCBs

The distribution trend of PCBs in the Yellow River irrigation area of Inner Mongolia is shown in Table 3, the order of mean Σ8PCB concentrations in different soil profiles in different irrigation areas was Wulanbuhe > Dengkou and National Unity > Madihao > Jiefangzha. The degree of pollution was the most serious in the Wulanbuhe irrigation area, and the mean concentration of Σ8PCBs in each soil core in this irrigation area ranged from 24.24 to 68.50 ng·g−1, which was approximately 3–6 orders of magnitude higher than those in other irrigation areas. The residual PCBs in the other irrigation areas were low.
The content of PCBs in different irrigation plots was dominated by low-chlorinated PCBs, and the highest concentrations of low- and high-chlorinated PCBs were observed in the Wulanbuhe irrigation area soil profile. The distribution characteristics of low-chlorinated biphenyls in different irrigation areas were basically consistent with Σ8PCBs; high-chlorinated PCBs were significantly different, and the mean concentrations of high-chlorinated PCBs from high to low were Wulanbuhe > Madihao > Jiefangzha > Dengkou and National Unity. The high-chlorinated PCBs in the Dengkou and National Unity pumping irrigation areas were lower than 1 ng·g−1, and were not detected in the 40–80 cm soil layers.
Figure 3 shows the concentration and component distribution of PCBs in the soil pro-files of the different irrigation fields in the study area. The trend of low-chlorinated PCBs and ∑8PCBs was consistent across all irrigation fields. The concentrations of low-chlorinated PCBS and ∑8PCBs in the surface layer of the Jiefangzha irrigation area showed accumulation characteristics, gradually decreasing from 0–60 cm, and slightly increasing from 60–100 cm, with a small variation range. Diametrically opposite, in Madihao irrigation area, the PCBs distribution of 0–60 cm was stable, and the concentration of 60–80 cm increased to a certain extent, which accumulated in deep soil. Variation characteristics in the Wulanbuhe irrigation area were similar to Dengkou and National unity pumping irrigation areas. Moving down the soil profile, the concentration first increased, then decreased, and then increased, with relatively significant changes; the concentration range was wider in the Wulanbuhe irrigation area. The content of high-chlorinated PCBs in different sections in various irrigation fields showed little difference, and the vertical distribution was uniform without obvious change characteristic patterns.
The vertical distribution of each component of PCBs in the soil was analyzed. All monomers were detected in different soil layers in the Jiefangzha irrigation area, with a small degree of dispersion. Among them, PCB1 and PCB29 showed obvious trends. With increasing depth, the proportion of PCB1 gradually increased, whereas that of PCB29 gradually decreased. The soil layers in the Wulanbuhe irrigation area were dominated by PCB1, PCB29, and PCB98, indicating that the pollution of PCBs in this area was related to the domestic PCBs products, which was consistent with the above speculation. PCB1 was widely distributed from 0–80 cm, PCB29 was concentrated in deep soil, and PCB98 was concentrated in shallow soil. The vertical distribution of each monomer in the profiles of Madihao, Dengkou and National Unity pumping irrigation area were uniform.

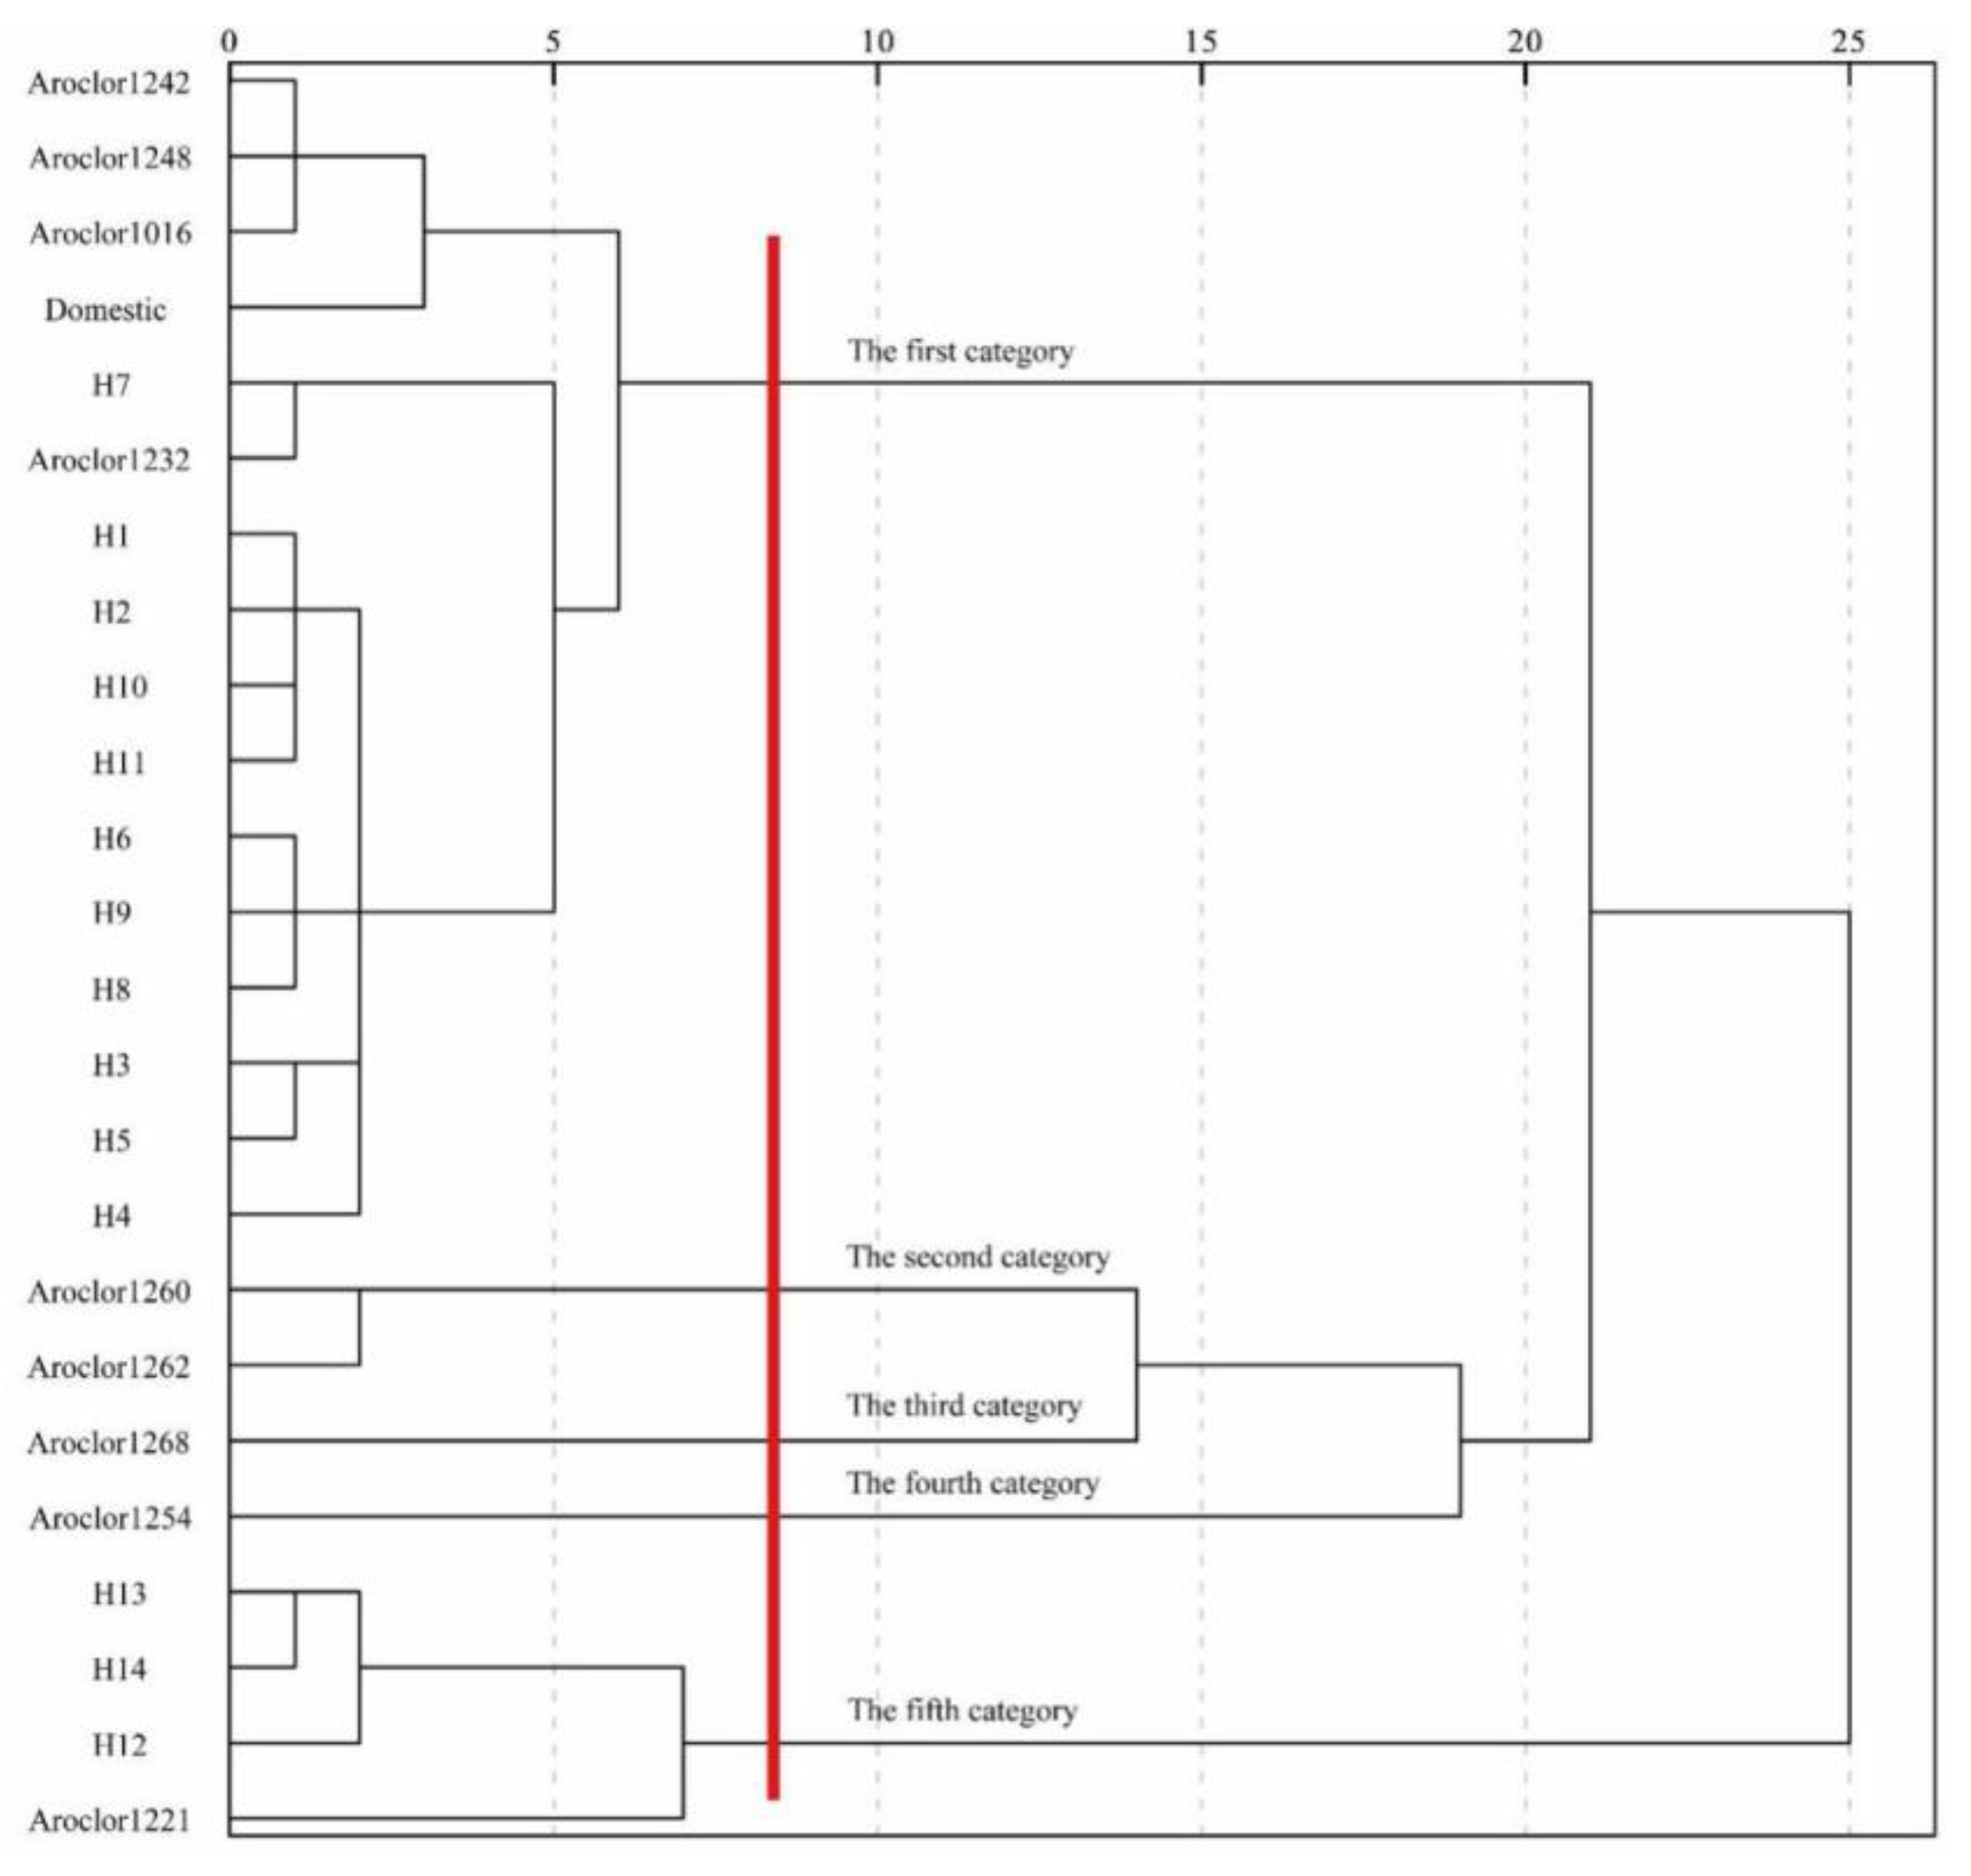
3.2. Source Apportionment of PCBs in Shallow Soil

PCBs are synthetic compounds, and the main source of environmental PCB pollution is the production and manufacture of products containing PCBs. After entering soil, air, water, and other media, PCBs can undergo metabolic transformation through physical, chemical, and biological processes. Their migration and transformation behaviors include adsorption and desorption [25], abiotic degradation (photolysis [26], hydrolysis [27], volatilization [28], biodegradation [29], and bioaccumulation [30]. The soil in the present study received PCBs mainly through atmospheric deposition, water irrigation, and biological decay.
The Aroclor series in the United States is the most common PCB product in the global PCBs production history; typical Aroclor products include [31] Aroclor1016, Aroclor 1221, Aroclor1232, Aroclor1242, Aroclor1248, Aroclor1254, Aroclor1260, Aroclor1262, and Aroclor1268. Of PCBs produced in China, 90% are trichlorinated biphenyls, which are mostly used in the production of capacitors and transformers, and 10% are pentachlorinated biphenyls, which are commonly used as paint additives [23]. The main components of these PCB products and domestic transformer oils are summarized in Table 4 [32,33].
The sources of PCB pollution in agricultural soil in the Yellow River irrigation area of Inner Mongolia are complicated owing to the influence of various factors. According to the above analysis, the PCBs content in the study area was higher in the shallow soil, and they did not readily migrate; the PCBs in the deeper soil were related to the migration of PCBs in the shallow zone. Therefore, the main product sources of PCBs in the shallow soil were identified. Cluster analysis was used to analyze the relationship of PCBs components in soil samples from the Hetao and Tumochuan irrigation areas, domestic transformer oil, and Aroclor series PCB products to determine the possible sources of PCBs in the study area.
The clustering results of soil samples in the Hetao irrigation area, domestic transformer oil, and Aroclor series PCB products are shown in Figure 4, which can be divided into five categories. The first category included 11 shallow soil samples from the Hetao irrigation area, four types of Aroclor industrial products (Aroclor1242, Aroclor1248, Aroclor1016, and Aroclor1232), and domestic transformer oil. This grouping implied that the PCBs in these 11 samples may come from the four types of Aroclor industrial products and domestic transformer oil. The second, third, and fourth categories did not include any soil samples: the second category included Aroclor1260 and Aroclor1262; the third category was only Aroclor1268; and the fourth category was Aroclor1254. The fifth category included three soil samples and Aroclor1221, which, therefore, may be the source of PCB contamination in these three samples. In conclusion, PCBs in 78.57% of samples in shallow soil in the Hetao irrigation area originated from Aroclor1242, Aroclor1248, Aroclor1016, and Aroclor1232 products and domestic transformer oil. On the other hand, PCBs in 21.43% of the samples were obtained from Aroclor1221 products.
The clustering results of soil samples in the Tumochuan irrigation area, domestic transformer oil, and Aroclor series PCB products are shown in Figure 5, which can also be divided into five categories. The first category included six samples of shallow soil in the Hetao irrigation area, four types of Aroclor industrial products (Aroclor1242, Aroclor1248, Aroclor1016, and Aroclor1232), and domestic transformer oil. Therefore, the PCBs of the above six sample points may come from these four types of Aroclor industrial products and domestic transformer oils. The second category was Aroclor1221, the third included Aroclor1260 and a Aroclor1262, the fourth was Aroclor1268, and the fifth was Aroclor1254. In conclusion, PCBs in shallow soil of Tumochuan irrigation area originated from Aroclor1242, Aroclor1248, Aroclor1016, and Aroclor1232 industrial products and domestic transformer oil.
Combined with the above analysis results, the PCB pollution in shallow soil in the Yellow Irrigation area of Inner Mongolia mainly came from Aroclor1242, Aroclor1248, Aroclor1016, and Aroclor1232 products and domestic transformer oil, and a small part came from Aroclor1221 products.

3.3. Health Risk Assessment of PCBs in Shallow Soil

The carcinogenic and non-carcinogenic risk of PCBs in 0–20 and 20–40 cm soil through ingestion, inhalation, and dermal contact was assessed and is presented in Table 5 and Table 6. PCBs in the study area pose a certain risk of cancer in children. The cumulative carcinogenic risks to adults and children in the 0–20 cm soil were 5.46 × 10⁻⁷ and 1.15 × 10⁻⁶, respectively, and 6.80 × 10⁻⁷ and 1.42 × 10⁻⁶, respectively, in 20–40 cm soil. The carcinogenic risk values of PCBs to children in both soil layers were higher than the minimum acceptable risk values stipulated by the USEPA, and the potential threat of PCBs to children could not be ignored. From the perspective of different exposure pathways, the carcinogenic risk to adults and children is in the order of oral ingestion > skin contact > respiratory inhalation. The carcinogenic risk to children caused by oral ingestion in soil of 20–40 cm is greater than 10−6, and is thus the main pathway of carcinogenic harm to children. The contribution rate of respiratory inhalation to carcinogenic risk in the two groups was very small.
The cumulative hazard quotients of adults and children in 0–20 cm soil were 0.035 and 0.290, respectively, and 0.043 and 0.361, respectively, in 20–40 cm soil, which did not cause non-carcinogenic harm to adults and children. Under three exposure modes, the non-carcinogenic risk of oral exposure was the highest, followed by skin contact, and the respiratory route hardly had any risk. It is worth paying attention to that, regardless of the exposure route, the carcinogenic and non-carcinogenic risks in children (who are less physically strong than adults) are higher than those in adults; thus, the potential threat posed by PCBs to children should be carefully considered.
The carcinogenic and non-carcinogenic risks of different monomers in the 0–20 cm soil were as follows: PCB1 > PCB47 > PCB29 > PCB98 > PCB5 > PCB154 > PCB171 > PCB201; and in 20–40 cm soil were as follows: PCB1 > PCB47 > PCB98 > PCB29 > PCB5 > PCB201 > PCB154 > PCB171, which corresponds to the occurrence level of each monomer in the soil, and the health risk caused by 20–40 cm soil was greater than that caused by 0–20 cm soil.

4. Discussion

In this study, the vertical distribution of PCBs is aggregation in the shallow layer and a sudden decrease in the middle layer. The soil PCBs in the process of vertical migration are more likely to be enriched in shallow soil rich in organic matter: in this regard, the 20–40 cm range of long-term soil is disturbed by farming tools, relatively tight, with low porosity, large soil bulk density, and poor permeability. All of this elevates the concentration of PCBs in the soil. The crops developed strong roots at 40–60 cm. On the other hand, crop roots have the ability to absorb PCBs in the soil rhizosphere; additionally, roots secrete biosurfactants that can promote mass transfer and the degradation of PCBs in soil. In addition, their metabolic activities provide a suitable micro-ecological environment for microorganisms to survive, which can enhance indigenous microorganisms with the ability to degrade PCBs in soil [34,35]. Therefore, the PCB content in the 40–60 cm soil layer was low. The low concentration of PCBs in the surface soil could be attributed to the continuous loss of surface soil water via evaporation and erosion, and some of the PCBs were transferred to the atmosphere via water evaporation. However, some PCBs migrated to the lower soil because of gravity, irrigation, and precipitation, among other factors. Increased concentrations of PCBs in deep soils may pose a threat to groundwater. The combination of the long history of irrigation with Yellow River water in this area; the influence of irrigation leaching is far-reaching, and the distribution and migration of PCBs will be affected to a certain extent by soil tillage. The detection rate and content of low-chlorinated PCBs were higher than those of high-chlorinated PCBs in all profiles.
Compared with high-chlorinated PCBs, low-chlorinated PCBs had lower octanol water distribution coefficients (logKow), weaker hydrophobicity, and were more likely to migrate with soil moisture. The soil profiles of the study area were dominated by low-chlorinated PCBs, this characteristic is consistent with the composition profile of PCBs in farmland soil in China [36] and with the low-chlorinated PCBs content in PCB-containing products (24.7% of tetrachlorobiphenyls). PCB98 is the dominant high-chlorinated PCBs in each soil layer, Pentachlorobiphenyl is often used as domestic paint additives, it is speculated that PCBs in the study area were related to domestic paint additives. The composition characteristics of PCBs in the topsoil is essentially consistent with the composition structure of PCBs in the Inner Mongolia section of the Yellow River, suggesting that irrigation using Yellow River water is one of the reasons for the accumulation of soil PCBs in the study area. Meanwhile, compared with a study on PCBs in the urban atmosphere of Inner Mongolia [37], it was found that the composition of PCBs in the soil of the Yellow River irrigation area was consistent with that in the atmosphere. Therefore, the channels for PCBs entering the soil in the Yellow River irrigation area of Inner Mongolia include irrigation with Yellow River water, dechlorination degradation, and atmospheric deposition over the Inner Mongolia autonomous region. The PCBs in the deep soil may be related to the migration of PCBs in the shallow zone.
The distribution trend of PCBs in the Yellow River irrigation area of Inner Mongolia was higher in the west and lower in the east. The degree of pollution was the most serious in the Wulanbuhe irrigation area. The concentration of mining companies, energy companies, and substations in the Wulanbuhe irrigation area once produced a large amount of tar, plasticizer, and other waste raw materials and waste power equipment, the volatilization and leakage of waste gas and waste liquid led to an increase in PCB content in the soil. The Wulanbuhe irrigation area is close proximity to the entrance of the Inner Mongolia section of the Yellow River. The pollutants discharged into the Yellow River from industrial parks in Wuhai City and the Alxa League, along with irrigation with Yellow River water, enter the farmland soil in the Wulanbuhe irrigation area in large quantities, resulting in high soil pollution. The residual PCBs in the other irrigation areas were low, indicating that there was no centralized point source pollution. The Yellow River has a large sand content and coarse sand, which readily absorb PCBs present in water [38]. Due to adsorption in the higher reaches of the river, the contents of PCBs in the middle and lower reaches of the river were reduced to a certain extent, and the content of PCBs in the irrigation areas was also greatly reduced. In addition, PCBs content is also related to soil organic matter content, physical and chemical properties, and tillage methods; cli-mate change can also cause changes in the soil environment [39], which in turn could impact PCBs contents. The high-chlorinated PCBs in the Dengkou and National Unity pumping irrigation areas were low. It was inferred that there was no historical residue of PCB products, and the degree of transformation from high- to low-chlorinated PCBs by degradation was higher than that of other irrigation fields.
The vertical distribution of components in each irrigation tract in the study area differed; the overall characteristics were as follows:(1) PCB1 is a non-negligible component in all irrigation tracts, with contribution rates ranging from 12–81%, indicating that PCBs in the study area are highly biodegradable. (2) Tetrachlorobiphenyl (26–45%) accounted for the highest proportion in all soil layers of the irrigation areas, except for the Wulanbuhe irrigation area; dichlorobiphenyl (5–29%) and trichlorinated biphenyl (3–25%) also accounted for significant proportions, which agrees with distribution results of PCBs obtained in a study of rural soil in China [36]. (3) Low-chlorinated PCBs migrated to the deep soil more easily, whereas high-chlorinated PCBs tended to accumulate in the upper soil. This finding is related to the differences in the physical and chemical properties, as well as the migration abilities of different monomers.
Analysis of the results of the health risk evaluation found that both carcinogenic and non-carcinogenic risks caused by PCBs in the 0–20 and 20–40 cm soils corresponded to the concentration of each monomer, indicating that the concentration of pollutants in the soil had a great impact on the health risk assessment. Wu analyzed the sensitivity of all risk indices for health risk assessment of nitrogen pollution in groundwater in the Songnen Plain [40]. Their results indicated that pollutant concentration was the most sensitive of all indexes, contributing more than 90% to the risk value, and playing a decisive role in determining the risk value.

5. Conclusions

This study investigated the distribution, source, and risk of PCBs in agricultural soils of the Yellow River irrigation area in China. The results indicate the widespread occurrence of PCBs, even though these compounds have been banned for over 30 years, due to their extensive historical usage and persistent nature. Low-chlorinated PCBs were dominant in each section. Source identification indicated that PCB pollution in the study mainly originated from Aroclor1242, Aroclor1248, Aroclor1016, Aroclor1232, and Aroclor1221 industrial products and domestic transformer oil. The lifetime carcinogenic and non-carcinogenic risks of PCBs through ingestion, inhalation, and dermal contact indicate that PCB residues in agricultural soils were at a low-risk level.

Author Contributions

Q.Z.: Methodology, Investigation, Data Curation, Formal Analysis, Visualization, Writing—Original Draft; Y.L.: Conceptualization, Resources, Project Administration, Data Curation, Methodology and Writing—Review and Editing; Q.M.: Software, Investigation, Data Curation, Formal Analysis, Visualization, Writing—Original Draft; G.P.: Conceptualization, Resources, Funding Acquisition, Project Administration, Validation, Supervision, Writing—Review and Editing; Y.N.: Visualization and Supervision; S.Y.: Validation and Writing—Review and Editing; X.M.: Investigation; W.F.: Modified, editing and funding. All authors have read and agreed to the published version of the manuscript.

Funding

This work was supported by the National Natural Science Foundation of China (52009056, 51469023), Inner Mongolia Agricultural University High-level Talents Introduction Scientific Research Startup Project (NDYB2016-22), the Inner Mongolia Autonomous Region Science and Technology Department (2021MS04012), and the Science and Technology Plan Project of Inner Mongolia Autonomous Region (2022YFHH0044).

Data Availability Statement

The data that support the findings of this study are available on request from the corresponding author. The data are not publicly available due to privacy restrictions.

Conflicts of Interest

The authors declare no conflict of interest.

Consent to Participate

Not applicable.

Consent for publish

Not applicable.

References

  1. United Nations. World Water Development Report. 2019. Available online: https://www.unwater.org/publications/world-water-development-report2019/ (accessed on 17 October 2022).
  2. United Nations. World Water Development Report. 2021. Available online: https://www.unwater.org/publications/world-water-development-report2021/ (accessed on 17 October 2022).
  3. Wu, F.; Li, F.; Zhao, X.; Bolan, N.S.; Fu, P.; Lam, S.S.; Mašek, O.; Ong, H.C.; Pan, B.; Qiu, X.; et al. Meet the challenges in the “Carbon Age”. Carbon Res. 2022, 1, 1. [Google Scholar] [CrossRef]
  4. Pei, G.X.; Zhang, Y.; Ma, T.L.; Tian, C.Y.; Ren, Z.H. Distribution of HCHs and PCBs in water body of Inner Mongolia section of Yellow River. J. Water Resour. Water Eng. 2010, 21, 25–27, 33. [Google Scholar]
  5. Net, S.; Henry, F.; Rabodonirina, S.; Diop, M.; Merhaby, D.; Mahfouz, C.; Amara, R.; Ouddane, B. Accumulation of PAHs, Me-PAHs, PCBs and total Mercury in sediments and Marine Species in Coastal Areas of Dakar, Senegal: Contamination level and impact. Int. J. Environ. Res. 2015, 9, 419–432. [Google Scholar]
  6. Ranjbaran, S.; Sobhanardakani, S.; Cheraghi, M.; Lorestani, B.; Sadr, M.K. Ecological and human health risks assessment of some polychlorinated biphenyls (PCBs) in surface soils of central and southern parts of city of Tehran, Iran. J. Environ. Health Sci. Eng. 2021, 19, 1491–1503. [Google Scholar] [CrossRef]
  7. Donato, F.; Moneda, M.; Portolani, N.; Rossini, A.; Molfino, S.; Ministrini, S.; Contessi, G.B.; Pesenti, S.; De Palma, G.; Gaia, A.; et al. Polychlorinated biphenyls and risk of hepatocellular carcinoma in the population living in a highly polluted area in Italy. Sci. Rep. 2021, 11, 3064. [Google Scholar] [CrossRef]
  8. Khalid, F.; Hashmi, M.Z.; Jamil, N.; Qadir, A.; Ali, M.I. Microbial and enzymatic degradation of PCBs from e-waste-contaminated sites: A review. Environ. Sci. Pollut. Res. 2021, 28, 10474–10487. [Google Scholar] [CrossRef]
  9. Agbo, I.A.; Abaye, D. Levels of Polychlorinated Biphenyls in Plastic Resin Pellets from Six Beaches on the Accra-Tema Coastline, Ghana. J. Health Pollut. 2016, 6, 9–17. [Google Scholar] [CrossRef] [Green Version]
  10. Liu, C.; Wei, B.K.; Bao, J.S.; Wang, Y.; Hu, J.C.; Tang, Y.E.; Chen, T.; Jin, J. Polychlorinated biphenyls in the soil-crop-atmosphere system in e-waste dismantling areas in Taizhou: Concentrations, congener profiles, uptake, and translocation. Environ. Pollut. 2020, 257, 113622. [Google Scholar] [CrossRef]
  11. Sun, L.X.; Mao, J.; Liu, T.F.; Yang, D.F. Analysis of polychlorinated biphenyls pollution status in farmland soils of south Jiangsu under different land-use types. J. Food Saf. Qual. 2019, 10, 5615–5620. [Google Scholar] [CrossRef]
  12. Lu, Y.T.; Liu, M.L.; Wang, J.; Zhang, S.C.; Yao, H.; Sun, S.B. Distribution characteristics and ecological risk assessment of polychlorinated biphenyls in farmland soil of Tongliao City. J. Beijing Jiaotong Univ. 2017, 41, 61–69. [Google Scholar] [CrossRef]
  13. Cetin, B. Investigation of PAHs, PCBs and PCNs in soils around a Heavily Industrialized Area in Kocaeli, Turkey: Concentrations, distributions, sources and toxicological effects. Sci. Total Environ. 2016, 560, 160–169. [Google Scholar] [CrossRef] [PubMed]
  14. Haddaoui, I.; Mahjoub, O.; Mahjoub, B.; Boujelben, A.; Di Bella, G. Occurrence and. distribution of PAHs, PCBs, and chlorinated pesticides in Tunisian soil irrigated with treated wastewater. Chemosphere 2016, 146, 195–205. [Google Scholar] [CrossRef] [PubMed]
  15. Han, S.L.; Wang, B.S.; Ruan, T.; Wang, Y.W.; Fu, J.J.; Hu, J.T.; Jiang, G.B. Within-field spatial distribution of polychlorinated biphenyls and polybrominated diphenyl ethers in farm soils with different irrigation sources. Environ. Chem. 2012, 31, 958–965. [Google Scholar]
  16. Kumar, B.; Mishra, M.; Verma, V.K.; Rai, P.; Kumar, S. Organochlorines in urban soils from Central India: Probabilistic health hazard and risk implications to human population. Environ. Geochem. Health 2018, 40, 2465–2480. [Google Scholar] [CrossRef]
  17. Abrahao, R.; Sarasa, J.; Causape, J.; Garcia-Garizabal, I.; Ovelleiro, J.L. Influence of irrigation on the occurrence of organic and inorganic pollutants in soil, water and sediments of a Spanish agrarian basin (Lerma). Span. J. Agric. Res. 2011, 9, 124–134. [Google Scholar] [CrossRef] [Green Version]
  18. Teng, M.; Zhang, H.; Fu, Q.; Lu, X.; Chen, J.; Wei, F. Irrigation-induced pollution of organochlorine pesticides and polychlorinated biphenyls in paddy field ecosystem of Liaohe River Plain, China. Chin. Sci. Bull. 2013, 58, 1751–1759. [Google Scholar] [CrossRef] [Green Version]
  19. Ngweme, G.N.; Al Salah, D.M.o.h.a.m.m.e.d.M.; Laffite, A.; Sivalingam, P.; Grandjean, D.; Konde, J.N.; Mulaji, C.K.; Breider, F.; Poté, J. Occurrence of organic micropollutants and human health risk assessment based on consumption of Amaranthus viridis, Kinshasa in the Democratic Republic of the Congo. Sci. Total Environ. 2021, 754, 142175. [Google Scholar] [CrossRef] [PubMed]
  20. United States Environmental Protection Agency (USEPA). Risk Assessment Guidance for Superfund (Volume 1) Human Health Evaluation Manual; EPA/540/189/002; Office of Emergency and Remedial Response: Washington, DC, USA, 1989. [Google Scholar]
  21. United States Environmental Protection Agency (USEPA). Regional Screening Levels (RSL) for Chemical Contaminants at Superfund Sites. 2021. Available online: http://www.epa.gov/region9/superfund/prg/ (accessed on 25 May 2022).
  22. Li, Y.; Huang, G.H.; Gu, H.; Huang, Q.Z.; Li, L.; Liu, H.L. Assessment of Contamination Risk of PCBs in Soils and Agricultural Products in Typical Irrigation District in Beijing. Trans. Chin. Soc. Agric. Mach. 2018, 49, 313–322. [Google Scholar] [CrossRef]
  23. Lu, Y.T.; Liu, M.L.; Liu, Y.Z.; Zhang, S.C.; Xiang, X.X.; Yao, H. Characteristics and health risk assessment of polychlorinated biphenyls in surface soil of the Yangtze River. China Environ. Sci. 2018, 38, 4617–4624. [Google Scholar] [CrossRef]
  24. Chen, X.R.; Wang, Y.; Liu, Q.; Zhang, J.J.; Rui, Y.U.; Cui, Z.W.; Liu, J.S. Residual Characteristics and Health Risk Assessment of Polychlorinated Biphenyls in Suburban Vegetable Soils in Different Industrial Cities. Soils Crops 2016, 5, 14–23. [Google Scholar] [CrossRef]
  25. Adeyinka, G.C.; Moodley, B. Kinetic and thermodynamic studies on partitioning of polychlorinated biphenyls (PCBs) between aqueous solution and modeled individual soil particle grain sizes. J. Environ. Sci. 2019, 76, 100–110. [Google Scholar] [CrossRef] [PubMed]
  26. Wu, N.N.; Cao, W.M.; Qu, R.J.; Zhou, D.M.; Sun, C.; Wang, Z.Y. Photochemical transformation of decachlorobiphenyl (PCB-209) on the surface of microplastics in aqueous solution. Chem. Eng. J. 2021, 420, 129813. [Google Scholar] [CrossRef]
  27. Sako, T.; Sugeta, T.; Otake, K.; Kamizawa, C.; Okano, M.; Negishi, A.; Tsurumi, C. Dechlorination of PCBs with Supercritical Water Hydrolysis. J. Chem. Eng. Jpn. 1999, 32, 830–832. [Google Scholar] [CrossRef]
  28. Lohmann, R.; Klanova, J.; Kukucka, P.; Yonis, S.; Bollinger, K. PCBs and OCPs on a East-to-West Transect: The Importance of Major Currents and Net Volatilization for PCBs in the Atlantic Ocean. Environ. Sci. Technol. 2012, 46, 10471–10479. [Google Scholar] [CrossRef] [PubMed]
  29. Nair, S.; Abraham, J. Biodegradation of Polychlorinated Biphenyls. Microb. Metab. Xenobiotic Compd. 2019, 10, 263–284. [Google Scholar] [CrossRef]
  30. Palladini, J.; Bagnati, R.; Passoni, A.; Davoli, E.; Lanno, A.; Terzaghi, E.; Falakdin, P.; Di Guardo, A. Bioaccumulation of PCBs and their hydroxy and sulfonated metabolites in earthworms: Comparing lab and field results. Environmental Pollution. 2021, 293, 11507. [Google Scholar] [CrossRef]
  31. Uhler, A.D.; Hardenstine, J.H.; Edwards, D.A.; Lotufo, G.R. Leaching Rate of Polychlorinated Biphenyls (PCBs) from Marine Paint Chips. Arch. Environ. Contam. Toxicol. 2021, 81, 324–334. [Google Scholar] [CrossRef]
  32. Frame, G.M.; Cochran, J.W.; Bowadt, S.S. Complete PCB congener distributions for 17 aroclor mixtures determined by 3 HRGC systems optimized for comprehensive, quantitative, congener-specific analysis. J. High Resolut. Chromatogr. 1996, 19, 657–668. [Google Scholar] [CrossRef]
  33. Jiang, Q.L.; Zhou, H.Y.; Xu, D.D.; Chai, Z.F.; Li, Y.F. Characteristics of PCB congenersand homologues in Chinese transformer oil. China Environ. Sci. 2007, 27, 608–612. [Google Scholar] [CrossRef]
  34. Gomathy, M.; Sabarinathan, K.G.; Subramanian, K.S.; Ananthi, K.; Kalaiyarasi, V.; Jeyshri, M.; Dutta, P. Rhizosphere: Niche for microbial rejuvenation and biodegradation of pollutants. In Microbial Rejuvenation of Polluted Environment; Springer: Singapore, 2021; Volume 25, pp. 1–22. [Google Scholar] [CrossRef]
  35. Cai, Z.; Yan, X.; Gu, B. Applying C:N ratio to assess the rationality of estimates of carbon sequestration in terrestrial ecosystems and nitrogen budgets. Carbon Res. 2022, 1, 2. [Google Scholar] [CrossRef]
  36. Zhang, Z. Polychlorinated Biphenyls in Chinese Air and Surface Soil: Spatial Distribution Characteristics and Thrie Inherent Causes; Harbin Institute of Technology: Shenyang, China, 2010; pp. 41–43. [Google Scholar]
  37. Zhang, X.H. Distribution Characteristics of Polychlorinated Biphenyls (PCBs) in Main Urban Atmospheric Particles of Inner Mongolia; Inner Mongolia normal University: Hohhot, China, 2015. [Google Scholar]
  38. Zhang, Q.; Pei, G.X.; Liu, G.Y.; Zhang, Y. Temporal Distribution of PCBs in River Water at Toudaoguai Section of the Yellow River. Arid. Zone Res. 2014, 31, 937–942. [Google Scholar] [CrossRef]
  39. Zhang, Z.; Li, M.; Song, X.L.; Xue, Z.S.; Lv, X.G.; Jiang, M.; Wu, H.T.; Wang, X.H. Effects of Climate Change on Molecular Structure and Stability of Soil Carbon Pool: A General Review. Acta Pedol. Sin. 2018, 55, 273–282. [Google Scholar] [CrossRef]
  40. Wu, J.; Bian, J.; Wan, H.; Ma, Y.; Sun, X. Health risk assessment of groundwater nitrogen pollution in Songnen Plain. Ecotoxicol. Environ. Saf. 2021, 207, 111245. [Google Scholar] [CrossRef] [PubMed]
Figure 1. The Yellow River irrigation area in Inner Mongolia and distribution of sampling points.
Water 14 03472 g001
Figure 2. Concentration and component distribution of PCBs in soil profiles.
Water 14 03472 g002
Figure 3. Concentration and component distribution of PCBs in soil profiles of different irrigation areas. (a) Jiefangzha irrigation areas; (b) Wulanbuhe irrigation areas; (c) Madihao irrigation areas; (d) Dengkou and National Unity pumping irrigation areas.
Water 14 03472 g003
Figure 4. Hierarchial dendogram for soil samples in Hetao irrigation area, Aroclor PCBs and Chinese transformer oil.
Water 14 03472 g004
Figure 5. Hierarchial dendogram for soil samples in Tumochuan irrigation area, Aroclor PCBs and Chinese transformer oil.
Water 14 03472 g005
Table 1. Exposure evaluation parameter values.
SymbolMeaning of ParametersSelected Values
AdultsChildren
CFConversion factor (kg·mg−1)10−610−6
EFExposure frequency (d·a−1)350350
EDExposure frequency (a)246
BWBody weight (kg)7015
ATAveraging time, non-carcinogenic/carcinogenic (d)8760/25,5502190/25,550
IngRIngestion rate of soil particle (mg·d−1)100200
SAContact surface area of skin with soil (cm2)57002800
AFSoil-to-skin adherence factor (mg·cm−2)0.070.2
ABSDermal absorption factor (%)0.130.13
InhRInhalation rate (m3·d−1)168
PEFParticle emission factor (m3·kg−1)1.36 × 1091.36 × 109
Table 2. Statistical characteristics of PCBs in soil.
Soil ProfilesStatistical CharacteristicsLow-Chlorinated PCBsHigh-Chlorinated PCBs
PCB1PCB5PCB29PCB47PCB98PCB154PCB171PCB201
0–20 cmConcentration range/ng·g−10–71.130–9.400–10.210–18.190–15.230–3.320–0.880–1.05
Mean of monomer/ng·g−16.551.712.375.772.290.370.110.11
Coefficient of variation/%229.01135.35107.2483.13183.07214.81264.7272.45
Detection rate/%9060858050351010
Mean/ng·g−116.42.75
20–40 cmConcentration range/ng·g−10–56.140–8.220–20.140–22.420–18.150–1.120–1.840–3.25
Mean of monomer/ng·g−110.232.242.535.222.820.230.210.34
Coefficient of variation/%185.63127.43166.93114.87170.96146.85248.48255.18
Detection rate/%8575858560402020
Mean/ng·g−120.233.61
40–60 cmConcentration range/ng·g−10–22.730–5.200–11.130–12.820–6.510–2.740–1.220–2.74
Mean of monomer/ng·g−13.91.332.933.590.720.250.170.06
Coefficient of variation/%125.84115.0199.78100.68201.29244.33191.84435.89
Detection rate/%906090704030255
Mean/ng·g−111.761.21
60–80 cmConcentration range/ng·g−10–87.710–19.490–6.080–21.920–22.490–6.690–0.630–1.69
Mean of monomer/ng·g−18.732.761.444.532.240.590.050.17
Coefficient of variation/%216.41164.73110.48111.34223.26258.25272.44237.49
Detection rate/%8080807550252025
Mean/ng·g−117.463.05
80–100 cmConcentration range/ng·g−10–36.110–11.240–77.090–15.560–9.530–1.170–1.250–1.21
Mean of monomer/ng·g−14.822.35.44.721.730.20.140.12
Coefficient of variation/%166.79140.04306.9898.44155.22155.13224.77255.94
Detection rate/%8065757050402515
Mean/ng·g−117.242.2
Table 3. Contents of PCBs in different irrigation areas (ng·g−1).
Homologue Soil ProfilesJiefangzha IrrigationWulanbuhe IrrigationMadihao IrrigationDengkou and National Unity Irrigation
RangeMeanRangeMeanRangeMeanRangeMean
Low–chlorinated PCBs0–20 cm4.21–29.9812.374.28–74.0128.039.77–14.4812.1310.23–26.1020.88
20–40 cm3.21–49.1610.8254.82–57.3955.747.82–14.5811.217.11–37.9923.96
40–60 cmND–14.018.2412.00–29.5622.0710.76–12.3911.574.24–23.2313.79
60–80 cmND–20.937.993.56–96.5143.512.79–17.9415.379.12–40.5825.02
80–100 cmND–23.468.80.28–120.6542.955.73–16.4411.09ND–35.9124.24
High–chlorinated PCBs0–20 cmND–2.400.839.68–15.2312.922.33–2.572.45ND–2.290.57
20–40 cmND–8.751.936.39–18.1512.772.36–6.534.45ND–37.000.92
40–60 cmND–3.711.2ND–6.512.172.06–2.382.22NDND
60–80 cmND–12.581.97ND–22.4910.173.88–4.874.37NDND
80–100 cmND–6.381.28ND–9.535.675.36–6.205.78ND–1.400.35
Σ8PCBs0–20 cm4.72–29.9813.215.46–89.2440.9512.10–17.0514.5710.23–26.1021.45
20–40 cmND–57.9112.7561.39–75.5468.510.19–21.1115.6517.11–37.9924.88
40–60 cmND–17.729.4418.51–29.5624.2413.13–14.4513.794.24–23.2313.79
60–80 cmND–30.449.9711.58–119.0053.6716.67–22.8119.749.12–40.5825.02
80–100 cmND–29.8210.077.77–120.6548.6211.09–22.6416.86ND–35.9124.59
Table 4. Main components of some PCB products (%).
Homologue AroclorDomestic Transformers
101612211232124212481254126012621268
Monochlorobiphenyl 1.163351.42
Dichlorobiphenyl17311918180.30.240.33 9
Trichlorinated biphenyl484.3193740.70.411.1 63
Tetrachlorobiphenyl331.4213736140.951.30.124
Pentachlorinated biphenyl0.770.184.26.54548.22.90.154
Hexachlorinated biphenyl 0.56 2639220.49
Heptachlorobiphenyl 4.143535.6
Octachlorobiphenyl 0.437.31741
Table 5. Carcinogenic and non-carcinogenic risks of PCBs in 0–20 cm soil.
ReceptorsMonomerCarcinogenicNon-Carcinogenic
RingRderRinhRTHQingHQderHQinhHI
AdultsPCB11.23 × 10−76.38 × 10−81.58 × 10−141.87 × 10−77.80 × 10−34.05 × 10−39.18 × 10−71.19 × 10⁻²
PCB53.22 × 10−81.67 × 10−84.13 × 10−154.89 × 10−82.04 × 10−31.06 × 10−32.40 × 10−73.10 × 10⁻³
PCB294.45 × 10−82.31 × 10−85.71 × 10−156.76 × 10−82.82 × 10−31.46 × 10−33.32 × 10−74.29 × 10⁻³
PCB471.08 × 10−75.62 × 10−81.39 × 10−141.64 × 10−76.87 × 10−33.56 × 10−38.08 × 10−71.04 × 10⁻²
PCB984.30 × 10−82.23 × 10−85.51 × 10−156.53 × 10−82.72 × 10−31.41 × 10−33.20 × 10−74.14 × 10⁻³
PCB1545.56 × 10−92.89 × 10−97.14 × 10−168.45 × 10−93.53 × 10−41.83 × 10−44.15 × 10−85.36 × 10⁻⁴
PCB1711.61 × 10−98.36 × 10−102.07 × 10−162.45 × 10−91.02 × 10−45.30 × 10−51.20 × 10−81.55 × 10⁻⁴
PCB2011.60 × 10−98.28 × 10−102.05 × 10−162.43 × 10−91.01 × 10−45.25 × 10−51.19 × 10−81.54 × 10⁻⁴
Σ8PCBs3.60 × 10−71.87 × 10−74.61 × 10−145.46 × 10−72.28 × 10−21.18 × 10−22.68 × 10−63.47 × 10⁻²
ChildrenPCB12.87 × 10−71.05 × 10−79.21 × 10−153.92 × 10−77.28 × 10−22.65 × 10−22.14 × 10−69.93 × 10⁻²
PCB57.51 × 10−82.73 × 10−82.41 × 10−151.02 × 10−71.90 × 10−26.93 × 10−35.60 × 10−72.60 × 10⁻²
PCB291.04 × 10−73.78 × 10−83.33 × 10−151.42 × 10−72.63 × 10−29.59 × 10−37.75 × 10−73.59 × 10⁻²
PCB472.53 × 10−79.20 × 10−88.10 × 10−153.45 × 10−76.41 × 10−22.33 × 10−21.89 × 10−68.74 × 10⁻²
PCB981.00 × 10−73.65 × 10−83.21 × 10−151.37 × 10−72.54 × 10−29.26 × 10−37.48 × 10−73.47 × 10⁻²
PCB1541.30 × 10−84.73 × 10−94.16 × 10−161.77 × 10−83.29 × 10−31.20 × 10−39.68 × 10−84.49 × 10⁻³
PCB1713.76 × 10−91.37 × 10−91.21 × 10−165.13 × 10−99.54 × 10−43.47 × 10−42.80 × 10−81.30 × 10⁻³
PCB2013.73 × 10−91.36 × 10−91.19 × 10−165.08 × 10−99.45 × 10−43.44 × 10−42.78 × 10−81.29 × 10⁻³
Σ8PCBs8.40 × 10−73.06 × 10−72.69 × 10−141.15 × 10−62.13 × 10−17.75 × 10−26.26 × 10−62.90 × 10⁻¹
Table 6. Carcinogenic and non-carcinogenic risks of PCBs in 20–40 cm soil.
ReceptorsMonomerCarcinogenicNon-Carcinogenic
RingRderRinhRTHQingHQderHQinhHI
AdultsPCB11.92 × 10−79.97 × 10−82.47 × 10−142.92 × 10−71.22 × 10−26.32 × 10−31.43 × 10−61.85 × 10⁻²
PCB54.20 × 10−82.18 × 10−85.38 × 10−156.38 × 10−82.66 × 10−31.38 × 10−33.13 × 10−74.04 × 10⁻³
PCB294.76 × 10−82.47 × 10−86.10 × 10−157.23 × 10−83.02 × 10−31.57 × 10−33.55 × 10−74.58 × 10⁻³
PCB479.81 × 10−85.09 × 10−81.26 × 10−141.49 × 10−76.22 × 10−33.23 × 10−37.32 × 10−79.45 × 10⁻³
PCB985.31 × 10−82.75 × 10−86.80 × 10−158.06 × 10−83.36 × 10−31.74 × 10−33.96 × 10−75.11 × 10⁻³
PCB1544.27 × 10−92.21 × 10−95.47 × 10−166.48 × 10−92.70 × 10−41.40 × 10−43.18 × 10−84.11 × 10⁻⁴
PCB1714.04 × 10−92.09 × 10−95.18 × 10−166.13 × 10−92.56 × 10−41.33 × 10−43.01 × 10−83.89 × 10⁻⁴
PCB2016.39 × 10−93.32 × 10−98.20 × 10−169.71 × 10−94.05 × 10−42.10 × 10−44.77 × 10−86.15 × 10⁻⁴
Σ8PCBs4.48 × 10−72.32 × 10−75.74 × 10−146.80 × 10−72.84 × 10−21.47 × 10−23.34 × 10−64.31 × 10⁻²
ChildrenPCB14.49 × 10−71.63 × 10−71.44 × 10−146.12 × 10−71.14 × 10−14.14 × 10−23.35 × 10−61.55 × 10⁻¹
PCB59.80 × 10−83.57 × 10−83.14 × 10−151.34 × 10−72.49 × 10−29.05 × 10−37.31 × 10−73.39 × 10⁻²
PCB291.11 × 10−74.04 × 10−83.56 × 10−151.52 × 10−72.82 × 10−21.03 × 10−28.29 × 10−73.84 × 10⁻²
PCB472.29 × 10−78.33 × 10−87.34 × 10−153.12 × 10−75.81 × 10−22.11 × 10−21.71 × 10−67.92 × 10⁻²
PCB981.24 × 10−74.51 × 10−83.97 × 10−151.69 × 10−73.14 × 10−21.14 × 10−29.23 × 10−74.28 × 10⁻²
PCB1549.95 × 10−93.62 × 10−93.19 × 10−161.36 × 10−82.52 × 10−39.19 × 10−47.42 × 10−83.44 × 10⁻³
PCB1719.42 × 10−93.43 × 10−93.02 × 10−161.28 × 10−82.39 × 10−38.70 × 10−47.03 × 10−83.26 × 10⁻³
PCB2011.49 × 10−85.43 × 10−94.78 × 10−162.03 × 10−83.78 × 10−31.38 × 10−31.11 × 10−75.16 × 10⁻³
Σ8PCBs1.04 × 10−63.80 × 10−73.35 × 10−141.42 × 10−62.65 × 10−19.64 × 10−27.79 × 10−63.61 × 10⁻¹
Publisher’s Note: MDPI stays neutral with regard to jurisdictional claims in published maps and institutional affiliations.

