
Rainwater Harvesting for Urban Landscape Irrigation Using a Soil Water Depletion Algorithm Conditional on Daily Precipitation


Department of Civil, Chemical and Environmental Engineering, University of Genova, 16145 Genoa, Italy
*
Author to whom correspondence should be addressed.
Water 2022, 14(21), 3468; https://doi.org/10.3390/w14213468
Submission received: 23 September 2022
/
Revised: 26 October 2022
/
Accepted: 27 October 2022
/
Published: 30 October 2022
(This article belongs to the Special Issue Nature-Based Solutions for Rainwater Management in the Urban Environment)
Abstract
:The supply of various non-potable water usages based on the harvesting and management of rainwater in urban areas allows to save high-quality water resources for strictly potable use and to limit the squandering of precious freshwater resources. A rainwater harvesting system included in a reconversion project of a former military area located in the town of Genova (Italy) is examined. Rainwater is collected and used for the landscape irrigation of public areas. Three rainwater collection scenarios are considered while varying the size of the storage tank, using daily rainfall data from a local long-term record as the reference rainfall climatology. A behavioural model is adopted to simulate the operation of the rainwater harvesting system and improved with a dedicated algorithm to account for the actual soil water availability for the vegetation and its temporal decay, based on the specific soil type and vegetation. For each scenario/tank size combination, reliability indices are calculated and compared, while the detention time and the annual usage volume per unit tank capacity are used as indicators of water quality deterioration in the tank and the economic benefit associated with the exploitation of the resource. The best solution in terms of rainwater collection scenario and tank size is identified.
1. Introduction
Depending on the local climate, rainwater is a potential freshwater resource, often underrated and unexploited at the scale of urban areas [1]. In cities, rainwater is typically drained and routed away rapidly and efficiently from roads, roofs, and other variably permeable surfaces by means of traditional urban drainage networks. Contrary to other sources of water supply, however, rainwater is directly available on-site and does not require onerous water transport infrastructures; it is, therefore, easily accessible. Admittedly, the quality of rainwater in urban areas is affected by various pollutants and must be carefully assessed in relation to any intended usage (see, e.g., [2]). However, Mazurkiewicz et al. [3] tested the quality of rainwater harvested in underground retention tanks and found that the collected rainwater even complied with the requirements of the European Union for drinking water.
Rainwater harvesting (RWH) and management allow to relieve the anthropic pressure on high-quality water supply sources (uphill lakes, aquifers, and springs) due to the potable water demand. Except in arid climates, indeed, the squandering of potable water resources for usages that would not require the high quality and safety features of potable water supply is rather common. These include the irrigation of public/private green areas, road cleaning, toilet flushing, fire suppression systems, etc.
The present work addresses the use of rainwater for the landscape irrigation of public areas by focusing on the case study of an RWH system included in a reconversion project of a former military area located in the town of Genova (Italy), within the Mediterranean temperate climate, with dry and hot summer (Csa in the Köppen–Geiger classification; see [4]). The project foresees the development of a public park where various playgrounds, green areas, orchards, and picnic areas will replace sheds and open areas used to store armaments. The project provides for rainwater to be collected and used for irrigation in the park, where a few nature-based solutions (NBSs) contribute to the management of stormwater drainage and control. NBSs are indeed defined as “both natural and constructed systems, which utilise and reinforce, physical, chemical and microbiological treatment processes” [5].
Although the implementation of NBSs in the project improves the resilience of the town against the impact of heavy rainfall events, it also reduces the availability of rainwater for harvesting and irrigation. Nevertheless, the collection of rainwater after infiltration improves the quality of the collected water when compared with water collected from impervious surfaces such as roofs, asphalt roads, and concrete sidewalks, as is typical of the heavily urbanized neighbourhood in the city of Genova. The collection of rainwater is, therefore, limited in this study to areas located inside the park. Rainwater is not only collected from rooftops and other impervious surfaces but also from green or semi-permeable areas of the park, including porous pavements, which can be counted among the NBSs since they exploit the natural process of infiltration through permeable surfaces, even if there is no vegetation contributing to water management and control (they are not “green”).
The high-intermittency and randomness features of rainfall events in space and time require smart management capabilities to avoid inefficiencies of RWH systems due to the scarce synchronization between availability and demand. In particular, the use of rainwater for irrigation is in phase opposition with the occurrence of rainfall events (irrigation is activated in dry periods, while during wet periods, irrigation is not needed). An efficient solution is the use of RWH systems equipped with a storage tank, suitably designed according to the expected variability of rainfall events and on the magnitude and temporal distribution of the demand.
In the RWH literature, many studies concentrate on domestic systems (see, e.g., [6,7]), where the optimization of the system is sought at the scale of the single building, for household consumption, while integrated systems at the urban scale and/or in complex urban renovation projects are limited. The potential for domestic potable water savings using rainwater in a house in Blumenau, southern Brazil, was demonstrated, e.g., by [8] by estimating the water end uses based on the frequency and time of use of the water appliances in the house. Typical multistore residential buildings were considered by [9] when investigating the applicability, reliability, and economic benefit of RWH systems to partially offset the daily water demand in Dhaka city (Bangladesh).
RWH systems for crop irrigation were addressed, e.g., by [10], who calculated the sustainability scores for various RWH designs and crops, together with the feasibility of combined RWH and well water systems. They found that the benefits of RWH systems irrigating soybeans supported with well water (0.4 well water and 0.6 RWH) provided significant cumulative energy savings and reductions in CO2 emissions, blue water use, ecotoxicity, eutrophication, and human health (in terms of anticancer activity). However, RWH-based irrigation is a special kind of water-saving irrigation using much less water than conventional water-saving irrigation (also called “low-rate irrigation”), and water supplied to crops is generally limited to 10–15% of the total crop water consumption over the whole growing season [11]. The work of [12] demonstrated the suitability of sustainable rainwater harvesting to support domestic or small-community agriculture or assist in fighting small forest fires.
When rainwater is used for landscape irrigation (e.g., in public green areas in cities), the demand is much lower than for crop irrigation. RWH systems for landscape irrigation were addressed, e.g., by [13] using roof water collection from three dome sports stadiums in the towns of Fukuoka and Nagoya, Japan, and by [14], who reported of a rainwater landscape irrigation project in Sydney, Australia. The citizens’ attitude towards a strategy to irrigate urban parks using rainwater collected in retention ponds was investigated by [15] for the city of Calgary (Canada). They found that about 80% were in favour of irrigating with rainwater during water shortages and that the use of rainwater was largely preferred against other proposed options (including wastewater recycling, no irrigation, and especially potable water).
Climate factors and the local characteristics of urbanization obviously have an influence on the performance of an RWH system. Preeti and Rahman [16] investigated the expected water savings from RWH systems located in various Australian cities, addressing different tank sizes and water uses, showing that—although efficient in supplying water for toilet-flushing and laundry water demands—the reliability for irrigation use was highly variable across all the locations. One of the reasons for this result was that the demand for irrigation was deemed too high.
However, the quantification of the water demand for irrigation in urban areas is often addressed in a very general way, assuming constant values for the irrigation demand and separating at best the growing season from the dormant season, when no irrigation is used [17]. Preeti and Rahman [16] assumed a reference value of 10 mm/session but provided limited information about the frequency of such sessions and their possible dependence on the actual rainfall events.
Recently, Li et al. [18] introduced the modelling of landscape irrigation demand in RWH systems by employing the Soil and Water Assessment Tool (SWAT) developed by [19] to quantify the contribution of vegetation on the sub-daily scale. Only roof runoff was assumed as the source for RWH. They investigated various combinations of rain cistern sizes, percentages of rooftop area collected, and irrigation strategies, where automatic irrigation was controlled by soil water depletion in pervious areas within the maximum depth of the root zone and stopped once the field capacity was reached. However, their study focused on evaluating the impact of rainwater harvesting and reuse strategies on runoff reductions (peak and depth) rather than on determining the efficiency of the RWH system in terms of water supply for irrigation.
Jones and Hunt [20] noted that the pattern of water usage may significantly affect the overall performance of an RWH system solely used for landscape irrigation, with high demand being expected during summer and low during the winter months. They suggested that water usage be correlated with typical seasonal rainfall patterns, to improve cistern performance with regards to the runoff volume captured.
While various studies are available for installations in cold and semi-arid climates [21,22], the application of RWH systems in the Mediterranean area is less common. In such climatic conditions, rainfall events are mostly concentrated in few intense occurrences, contributing a significant portion of the total annual rainfall. Mehrabadi et al. [23] found that in the Mediterranean climate, it was possible to supply at least 75% of the non-potable water demand in buildings with large roof areas for a maximum duration of 40% of the time, while in arid climate, a similar duration was only 23% of the time. Palla et al. [24] explored the variability of the performance of domestic RWH systems in various European climate zones, showing the role of the local rainfall climatology in determining the most suitable sizing of the system for similar demands.
To further investigate the performance of an RWH system for urban landscape irrigation in the Mediterranean climate, the implementation of an improved behavioural model is proposed in this work, where the daily irrigation demand is calculated based on soil water depletion following the actual precipitation derived from a quasi-bicentennial rainfall record. The model is applied to a reconversion project of a former military area, located in the town of Genova (Italy). The long-term performance of the system is calculated in a non-dimensional framework in terms of suitable temporal and volumetric reliability indices, detention time, and economic benefit, so that the transferability of the results into similar sites and configurations is made easier.
2. Methodology
A behavioural model is implemented to simulate the operation of a rainwater harvesting (RWH) system, designed to supply urban landscape irrigation. Three rainwater collection scenarios are modelled by assuming that rainwater is collected from the drainage of ground surfaces or from roof runoff. The methodology adopted for the analysis is similar to the ones proposed in the literature by various authors [25,26] but is suitably adapted by introducing a dedicated algorithm to account for the dynamics of the soil water content in calculating the daily irrigation demand.
2.1. Rainfall Climatology
The potential for rainwater harvesting and use depends on the urban surfaces made available for rainwater collection, the associated runoff coefficient, the relationship between the frequency and intensity of rainfall events in the region, and the variability of the demand. In the Mediterranean region, the strong intermittency and randomness of precipitation events in space and time require smart management capabilities to avoid that the adopted technical solutions end up being inefficient due to the scarce synchronization between availability and demand.
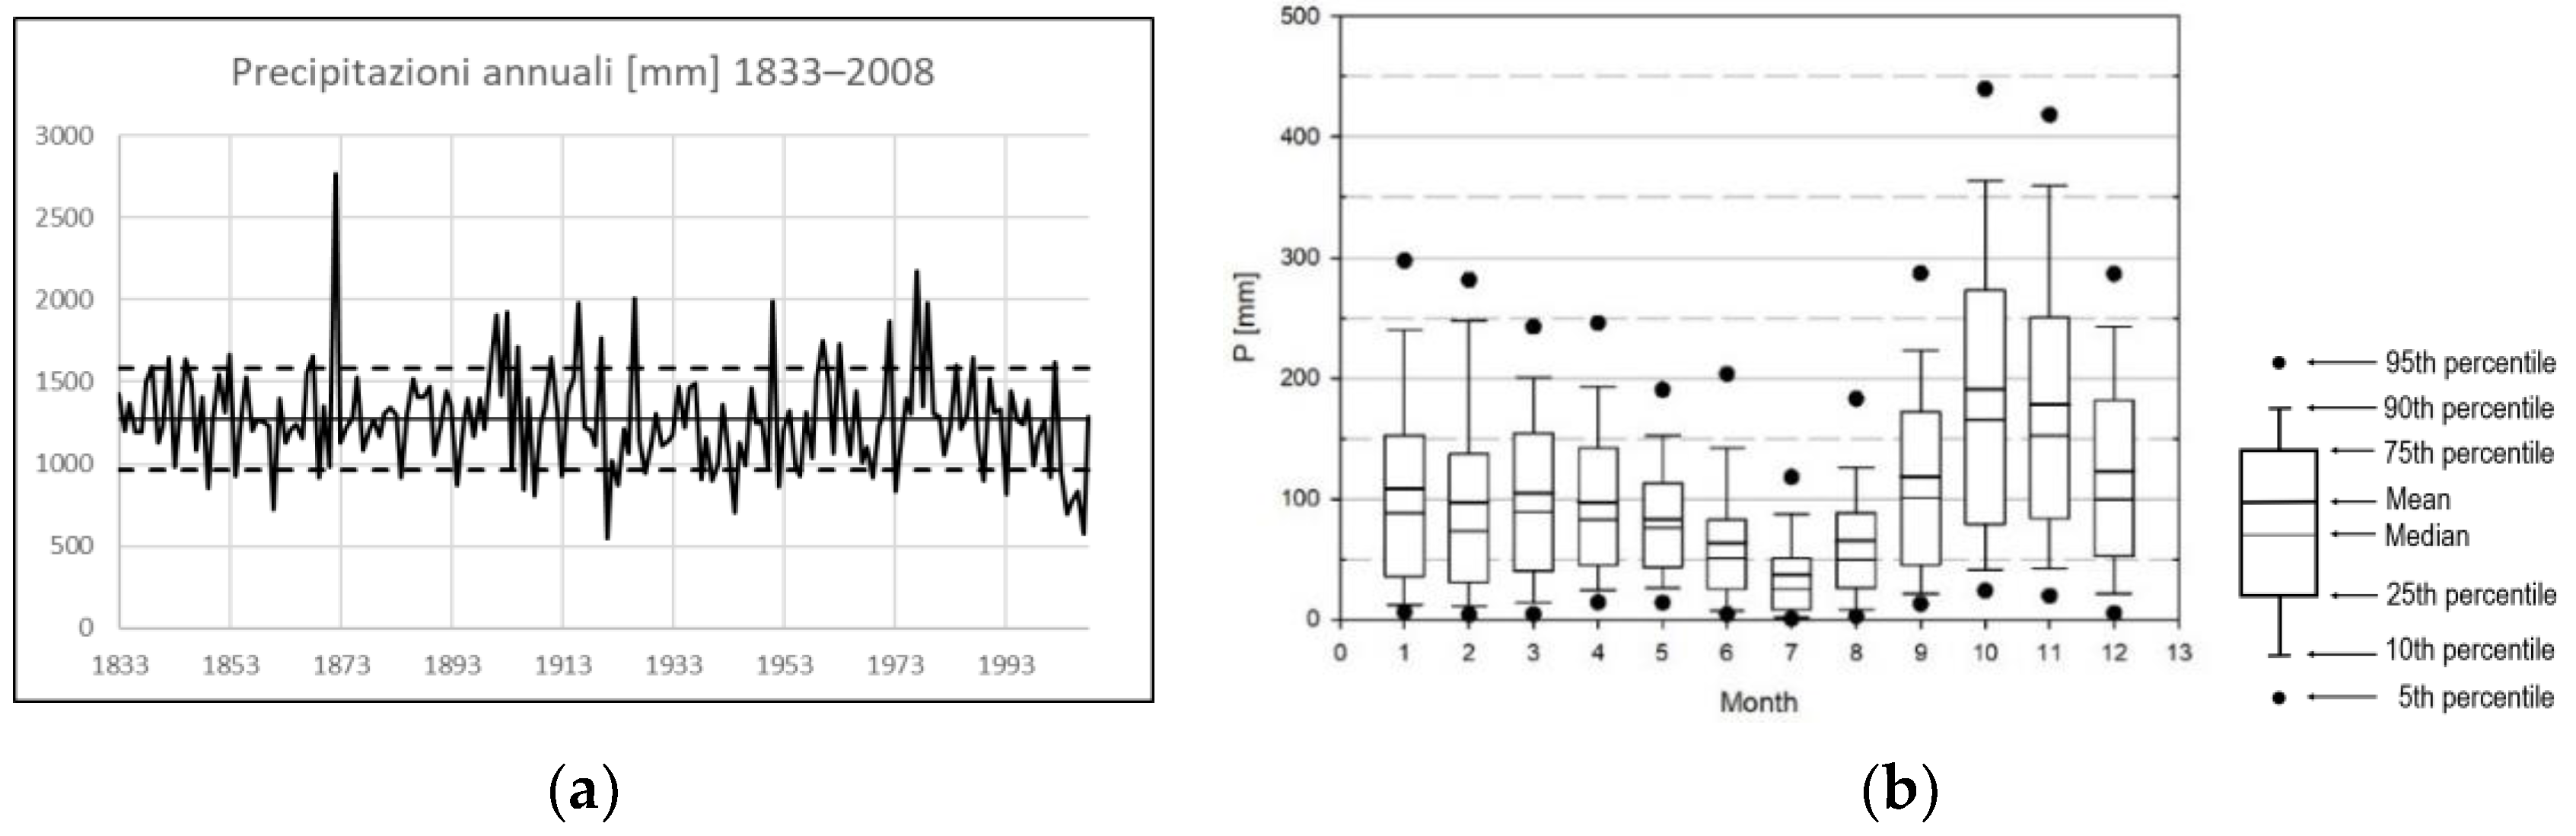
The efficiency of an RWH system can be established by simulating the system performance over a sufficiently long period. To this aim, the historical rainfall series recorded at the meteorological station of Genova Università (Italy) is adopted. Daily rainfall data are used, as observed in the period of 1833–2008. Annual data from the same time series are graphically reported in the left-hand panel of Figure 1.
The site is characterized by a strong seasonality of precipitation events, with the maximum values of monthly precipitation occurring in the fall season, while a minimum is reached in summer. In the right-hand panel of Figure 1, the observed variability of monthly precipitation is reported in the form of boxes and whiskers. The amplitude of the boxes and the distance between whiskers and dots reflect the dispersion of the data, and the distance between the mean and median values (if any) is indicative of a non-symmetric distribution.
In the fall season, the statistical variability of the observed monthly data is also strong, with individual monthly values that may vary even dramatically from year to year, with cases when the total precipitation of one single month may reach even 30% of the annual precipitation amount.
The characteristics of the local climatology are synthesized by the statistical values usually adopted for the description of rainfall events, i.e., the mean and standard deviation values of the annual precipitation depth (1270 ± 309 mm), the event depth (29 ± 43 mm), the event duration (1.93 ± 1.40 days), and the dry spell duration between two consecutive events (6.45 ± 7.24 days). The event depth and the dry spell duration show large standard deviations, confirming that the site is characterized by a typical Mediterranean climate with high-intensity events interspersed with even significant dry periods.
2.2. The Behavioural Model
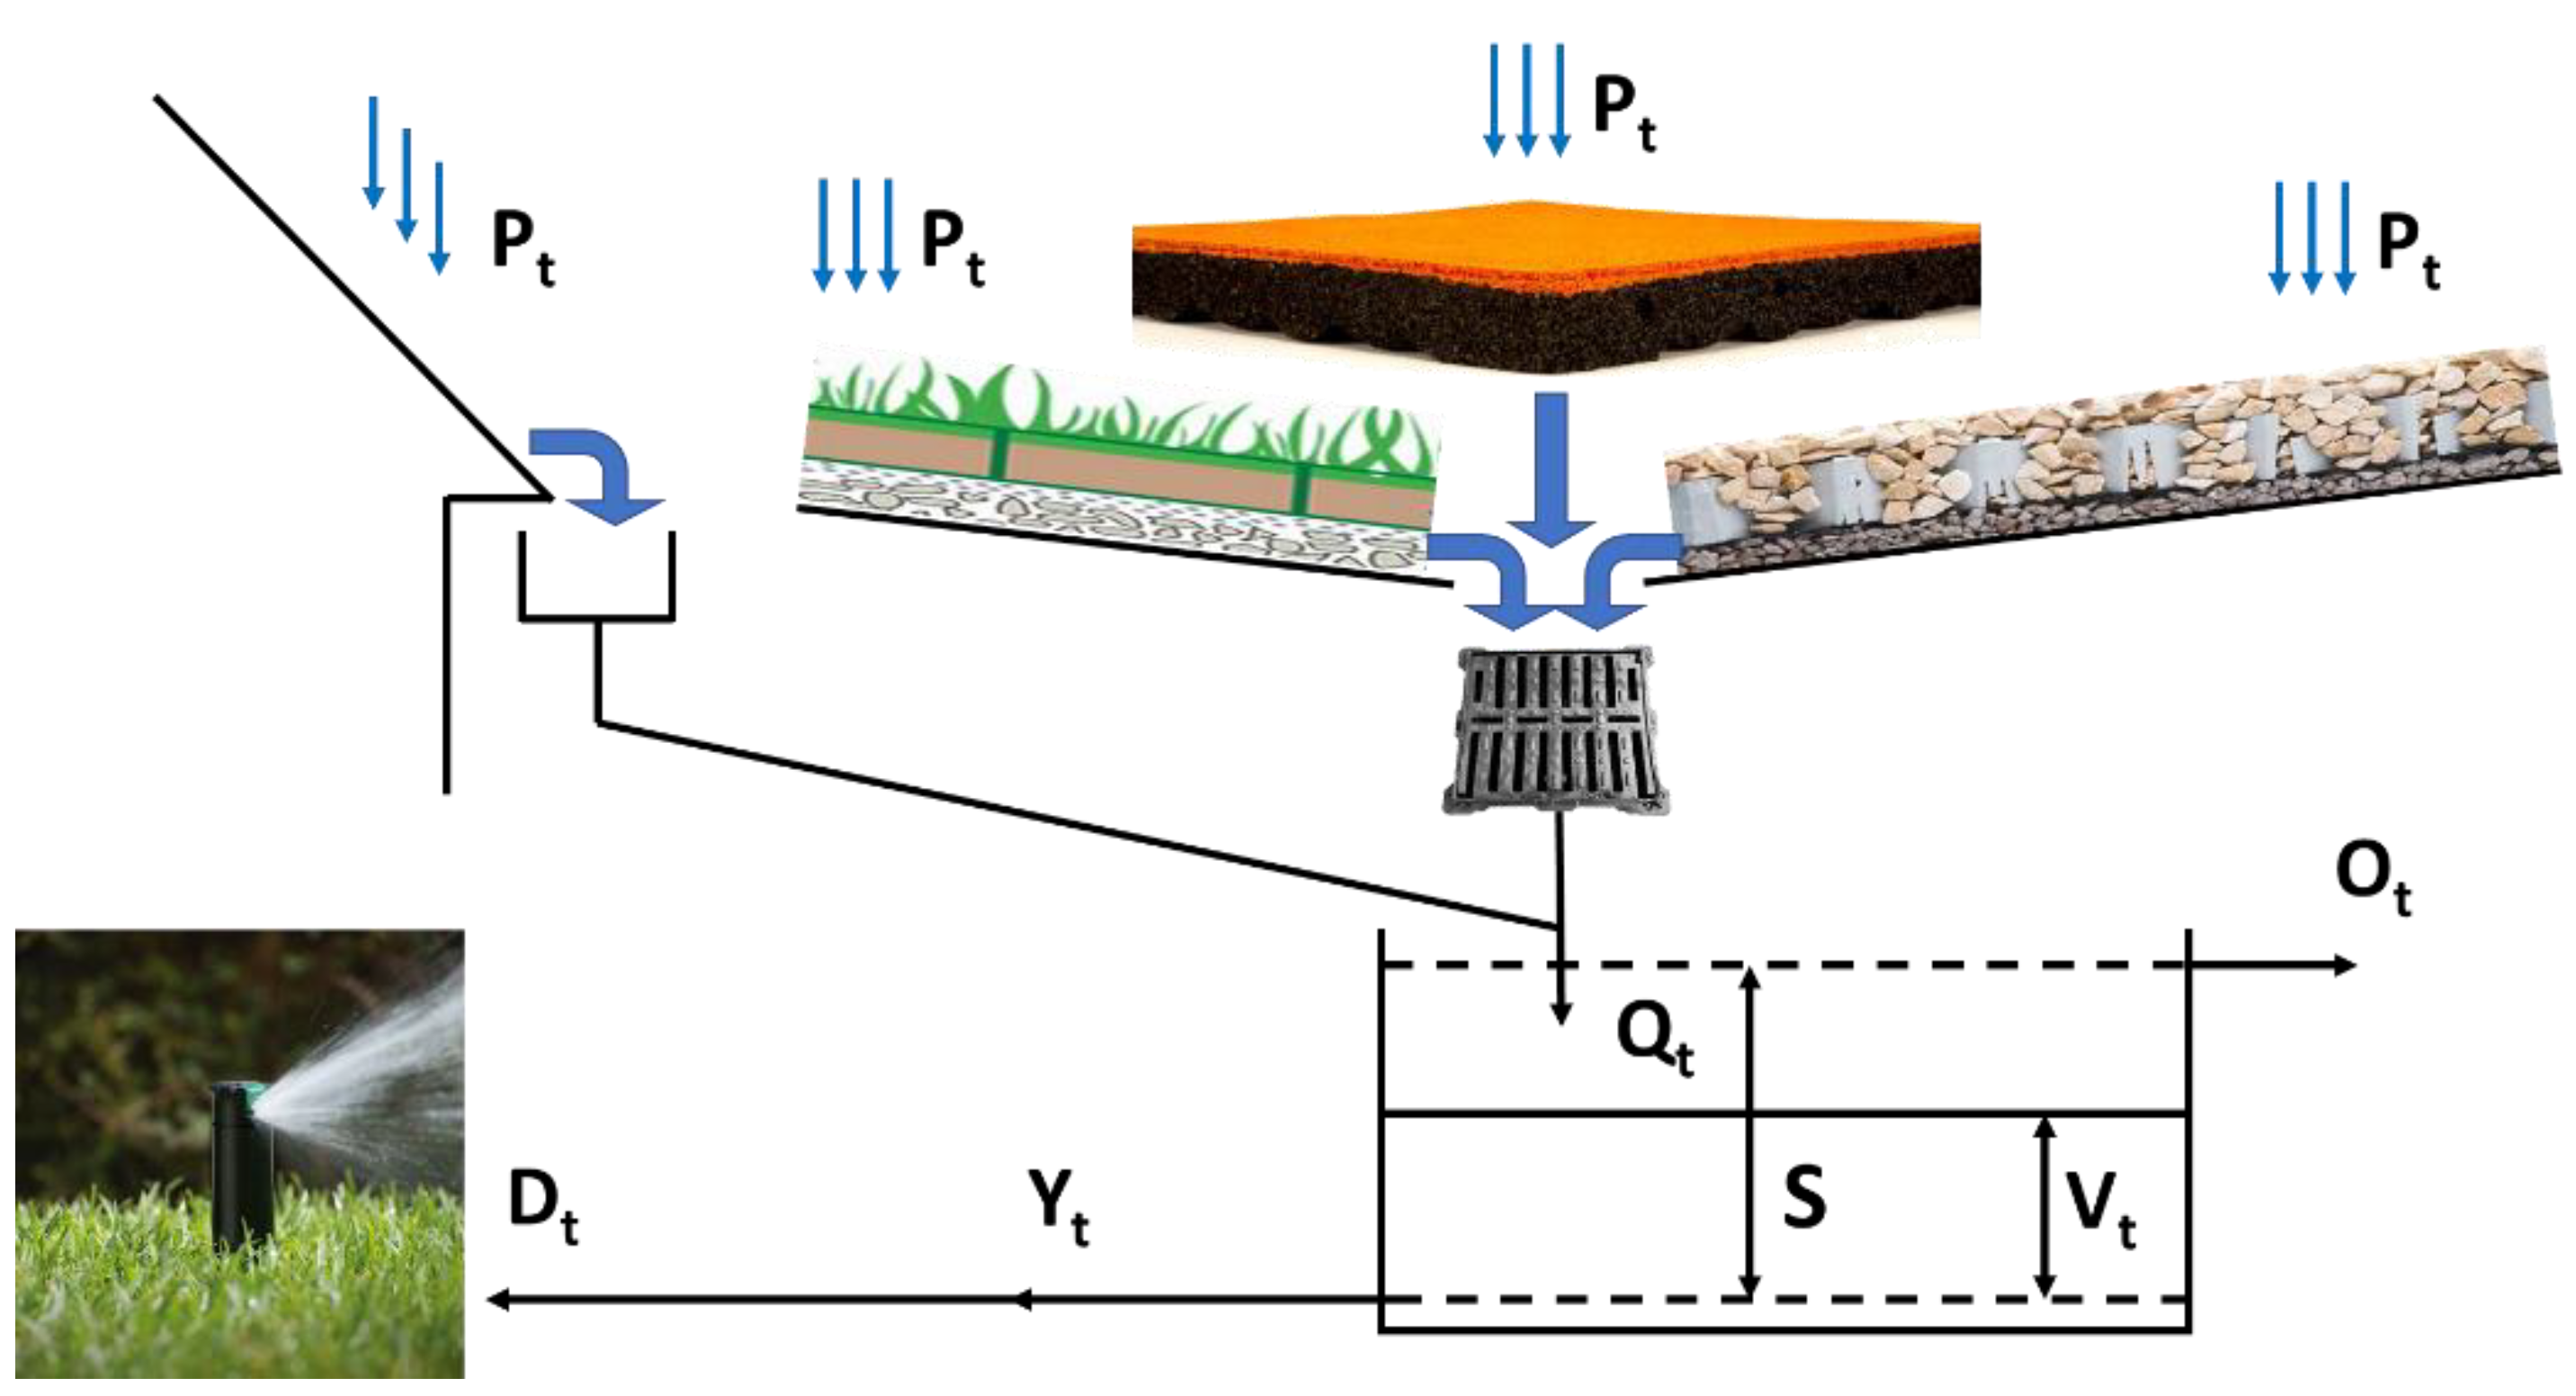
The behavioural model is based on a conceptual scheme implying the collection of rainwater from the drainage of ground surfaces and/or some building roofs. The model performs, at a daily scale, the balance of the incoming and outgoing volumes associated with the collected rainwater flows and the water supply. The daily water demand is calculated to only meet the landscape irrigation water needs. In Figure 2, a schematic of the RWH system is illustrated, and the variables used to describe the various components of the behavioural model are indicated, where t is the simulation interval, Pt (L) is the precipitation amount, Qt (L3) is the volumetric rainwater inflow to the storage tank, S (L3) is the storage capacity of the system (or tank volume), Vt (L3) is the actual rainwater volume stored in the system, Yt (L3) is the released volume, Ot (L3) is the overflow volume, and Dt (L3) is the water demand. The rainwater inflow to the storage tank Qt (L3) is evaluated based on the flow that is collected at each computational step t and conveyed to the storage tank using the rational formula:
where ϕ (–) is the runoff coefficient and A (L2) is the extension of a generic collection area.
The behavioural model is based on a daily mass balance equation:
where Yt and Vt are defined as follows, according to the so-called Yield After Spillage (YAS) algorithm:
The YAS algorithm provides a cautionary assessment of the system efficiency, independently on the temporal scale adopted for the model [27]. Mitchell [26] also recommended using the YAS algorithm based on its lower sensitivity to variations in the storage capacity and water demand. Although running the model on the daily scale does neglect the typical variability of the precipitation process on any finer temporal scale, [25] showed that this approach favours a reliable assessment of RWH systems in all cases when the storage fraction (S/Q)—calculated with the mean annual inflow—is larger than 0.01, as discussed below with respect to the investigated collection scenario/tank size combinations. For lower values of the storage fraction, finer-scale models (hourly, minutes) are more suitable, since in the case of small-size storage tanks, the temporal variability of the precipitation process may affect the accuracy of the results about the efficiency of the RWH system.
Given that previous studies demonstrated the scarce influence of the initial condition of the tank [28], an empty storage tank at the start of the simulation is adopted here. According to the final design of the reconversion project used as a case study, the tank is assumed to be covered, so that evaporation from the tank between rainfall events can be neglected.
2.3. Water Demand and Rainwater Collection Scenarios
The reconversion project, analysed as a case study, foresees the realization of green areas for picnic, orchards, dog areas, and other recreational uses. The topsoil of the planned installations is composed of fine sandy loam with a corresponding water holding capacity (WHC) equal to 158 millimetres per metre of soil depth. As indicated in the stratigraphic details reported in the final project for meadows and shrub areas, the root depth value is equal to 0.20 and 0.30 m, respectively, while for the areas where trees are planted, the root depth value is 1 m. Therefore, the corresponding water holding capacity is equal to 32, 48, and 158 mm, respectively.
From June to August, the daily water need (f) is equal to 5 mm for meadows and shrubs areas, while 0.8 mm is needed for areas where trees are planted. These values are halved in April, May, September, and October and assumed to be equal to zero from November to March. The water supplied through the irrigation system (It) is obtained, at each time step t, as a function of the actual soil water content according to the following scheduling of irrigation and watering criteria:
- Irrigation is not activated if it rains to cover at least the daily water need or if, in dry days, the soil water content is at least 80% of the WHC;
- Irrigation is always activated when the soil water content drops below the threshold of 80% of the WHC;
- The WHC of soil is recovered only after sufficiently large precipitation events but not from irrigation, which is used to ensure that only the water need of vegetation is fulfilled.
The excess precipitation, when larger than the soil WHC, either percolates due to gravity to deep soil and is drained away or becomes surface runoff and is collected and stored in the tank.
For each type of vegetation that is supplied with irrigation (meadows, shrubs, trees), the actual soil water content (mm) is calculated, at any daily time step t and based on the daily water need (mm), with the following algorithm:
If
then
else
where the dependency on daily precipitation is made explicit.
The water supplied through the irrigation system (It, expressed in mm) at each time step t is obtained according to the following rule:
If
then
else
The total daily demand for irrigation, Dt (m3), is, therefore, given by:
where Ameadows, Ashrubs, and Atrees are the surface areas of the irrigated portions covered with meadows, shrubs, and trees, respectively equal to 1369, 801, and 1400 m2. Per each area, the initial condition at the start of the simulation period is set as a soil water content equal to the WHC.
This approach is conceptually similar to the one proposed by [18] when dealing with landscape irrigation, although they only exploited the overflow from the RWH system for irrigation, since their objective was to limit the overall runoff from the site. In that case, however, irrigation was activated when soil water depletion in pervious area exceeded 50% of the total available water capacity in the root zone of grasses. In addition, they precautionary assumed that irrigation stops when the soil water content in pervious areas reaches the field capacity of the soil and/or precipitation occurs while irrigating. The differences in the two approaches reflect the different objectives of the adopted model, since in our case, the best RWH solution is sought in terms of its capacity to supply landscape irrigation, while [18] aimed at minimising the volume and peak of surface runoff in the connected watershed. However, we believe that our proposed irrigation criteria would be even more suitable in that case, since keeping the soil saturated at the field capacity would produce an earlier runoff at the next precipitation event than in our approach.
The performance of the RWH system is analysed by considering three different rainwater collection scenarios. The rainwater collection areas are defined as follows, where ϕeq is the equivalent runoff coefficient and Atot is the total extension of the collection area in each solution:
- Scenario 1: Rainwater collected from the drainage of ground surfaces with Atot = 7925.6 m2 and ϕeq = 0.4;
- Scenario 2: Rainwater collected from a sheet metal roof with Atot = 1800 m2 and ϕeq = 0.95;
- Scenario 3: Rainwater collected from a brick roof with Atot = 4960 m2 and ϕeq = 0.85.
The material and extension of the ground surfaces contributing to the rainwater collected in the storage tank in Scenario 1 are as follows:
- Sports field and skate area (synthetic membrane): 850 m2;
- Staircases (impervious material): 125 m2;
- Playground (anti-trauma paving): 220 m2;
- Sand playground (sand): 30 m2;
- Pedestrian and driveway area paving (resin gravel): 3280 m2;
- Historical and existing paving (stone): 1347 m2;
- Green areas (meadows): 2074 m2.
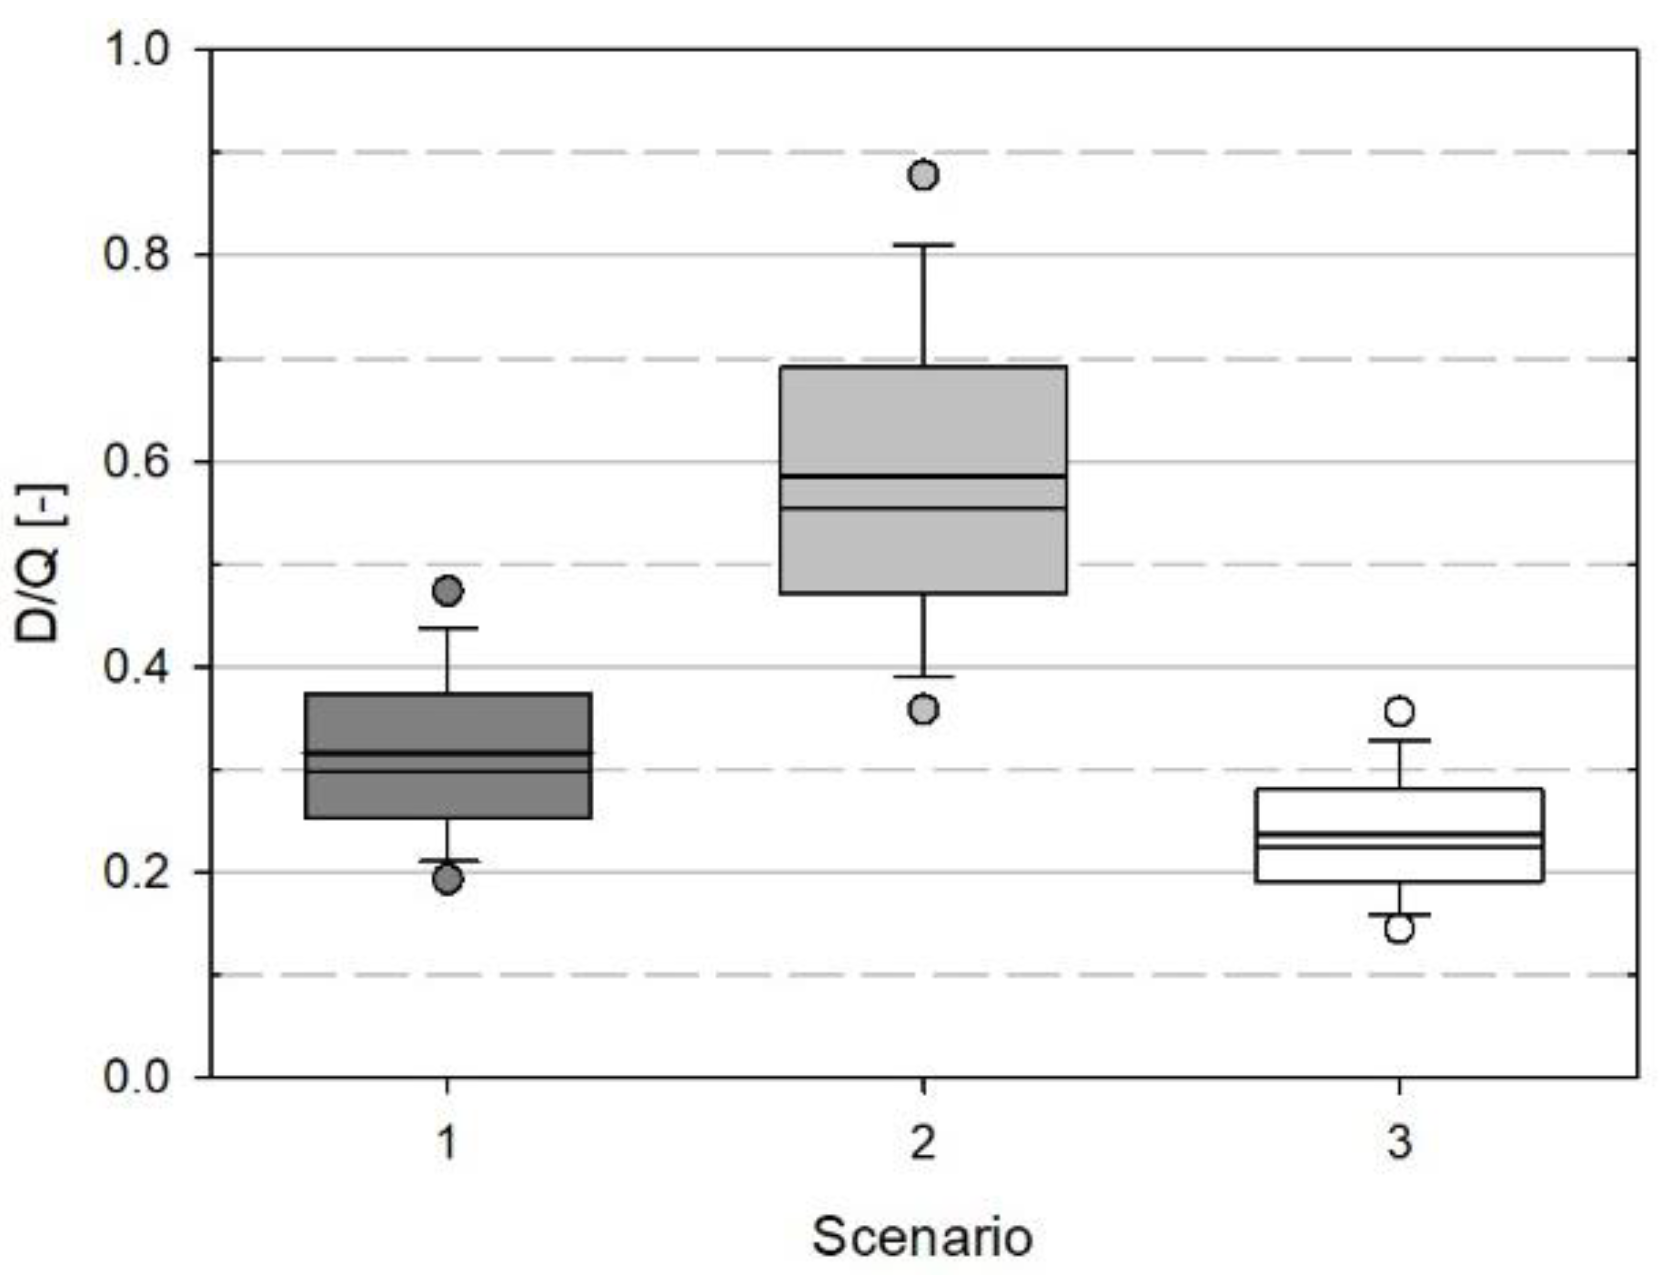
The annual demand fraction, D/Q, defined as the ratio between the annual water demand, D, and the annual inflow, Q, derives from the total water demand for irrigation, which depends on the distribution of daily precipitation during the year and the water collected from the various surfaces in each individual scenario. This non-dimensional parameter represents the overall attitude of the RWH system to meet the demand in any single year and should be less than unity to indicate that using rainwater for irrigation is feasible. The lower its numerical value, the larger the probability that the demand is met whenever needed throughout the year. In Figure 3, the inter-annual variability of the demand fraction is reported for the three collection scenarios in the form of box-and-whisker plots, where the box-and-whisker description is the same as in Figure 1.
It is evident that Scenario 3 has the best potential to maximize the system performance, since the mean value is low (0.238) and the inter-annual variability is quite limited (standard deviation equal to 0.074). As compared with the other two scenarios, both values are the lowest, with Scenario 2 showing the largest values of both the mean and standard deviation values, equal to 0.586 and 0.183, respectively. Scenario 1 has intermediate characteristics (0.316 ± 0.099) but closer to the values of Scenario 3, thus still maintaining a good potential to supply landscape irrigation in the area.
3. Results and Discussion
As proposed by [29], suitable indicators of the performance of the RWH system are used here, namely, two temporal reliability indices (fraction of time when storage is not empty, R, and when the demand is fully met, Re), and two volumetric reliability indices (efficiency, ET, and overflow ratio, OT).
The temporal reliability indices are non-dimensional variables, respectively defined as:
where m is the number of days when the tank is not empty, N is the total number of days, n is the number of days when the stored volume does not fully meet the demand, and N* is the number of days when Dt > 0.
The two non-dimensional volumetric reliability indices are:
where ET is defined as the ratio between the rainwater volume provided by the tank and the associated water demand over the simulation period, while OT is defined as the ratio between the overflow volume and the total rainwater volume collected over the simulation period.
Regarding the economic feasibility of an RWH project, the authors of [6], while investigating RWH to supply domestic, non-potable uses, provided a formulation for the cistern design volume, which incorporates the fixed and distributed costs of an RWH system considering the random nature of the depth and timing of rainfall. They assumed a linear relationship between commercial cistern prices and storage capacity for above-ground plastic cisterns, although recognizing that an economy-of-scale effect produces a nonlinear relationship for larger cistern volumes. The same seems to be reasonable, at least within certain limits, for underground tanks. Jones and Hunt [18] noted that, when using large storage volumes, there is a diminishing economic incentive for added tank capacity, because the increased cistern capacity is not fully utilized with every irrigation demand. They suggest that a general indication of the economic benefit of an RWH system is provided by the annual usage volume per unit of tank capacity (U), defined as:
where YT is the annual released volume.
Finally, to check the quality of the collected water, the detention time (τ), expressed in days, is calculated by assuming a full mixing between the rainwater inflow to the storage tank (Qt) and the rainwater volume stored in the tank at the previous time step (Vt−1), based on the following algorithm:
else if then:
The performance of the RWH system is analysed by varying the size of the storage volume, S. Tank sizes equal to 30, 60, 120, 240, and 480 m3 are considered to identify the most suitable system design.
The results are shown in the form of box-and-whisker plots of the non-parametric distribution of the annual values of each performance index and of the detention time and the specific usage volume as a function of the storage fraction (S/Q) in each scenario. The values of the storage fraction as a function of the tank volume in each scenario are listed in Table 1. Note that, except at S = 30 m3 in Scenarios 1 and 3, the storage fractions are larger than 0.01, confirming the correct choice of the daily temporal scale to run the simulations (see [25]).
3.1. Performance Indices
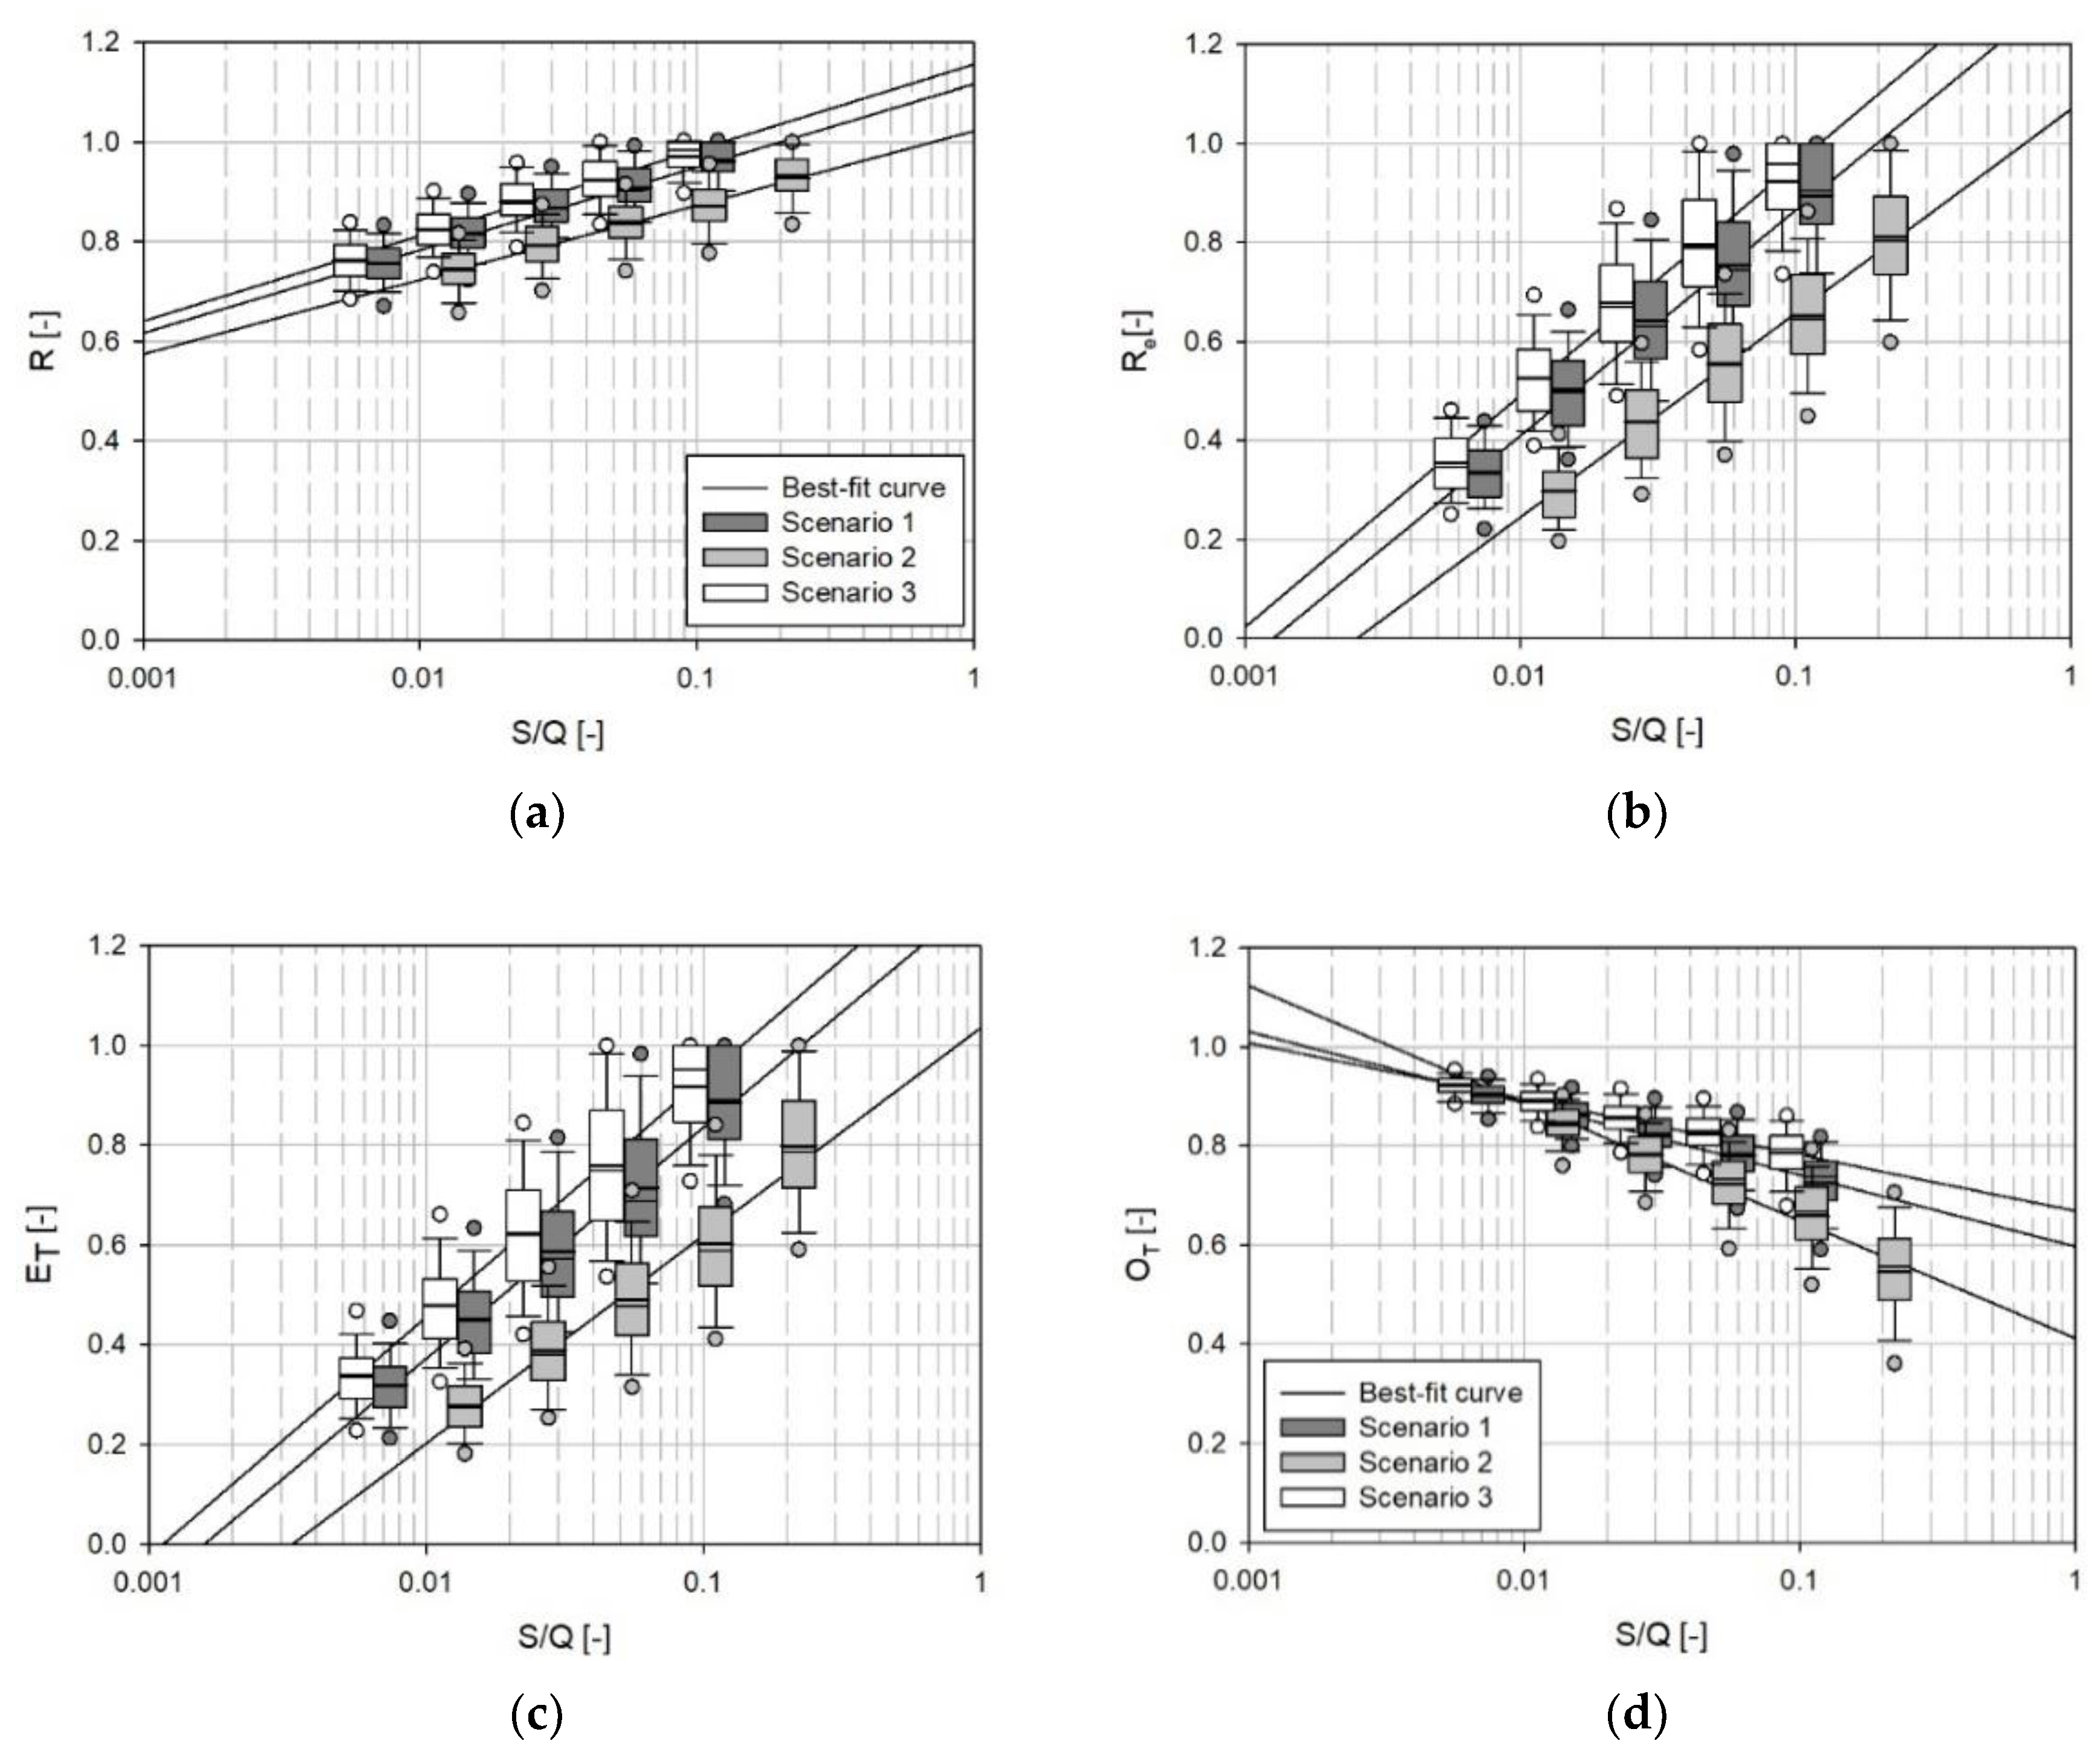
The adopted performance indices in the three investigated scenarios are compared in Figure 4. The box-and-whisker plots show the variability of the annual temporal reliability indices (R and Re, top panels) and of the annual volumetric reliability indices (ET and OT, bottom panels) as a function of the storage fraction (S/Q). The box-and-whisker description is the same as that in Figure 1, while the continuous lines represent the regression functions calculated from the mean values of the investigated indices.
The best fit formulation is logarithmic for all performance indices, generically expressed as a function of storage fraction S/Q as:
where I is the generic reliability index, while y0 and a are two numerical coefficients obtained from the regression. The values of the obtained numerical coefficients and the Pearson coefficient (R2) are listed in Table 2.
In addition to the overall evaluation conducted by calculating the demand fraction (D/Q), thus independently of the size of the storage tank (or the storage fraction S/Q), the behavioural model allows the day-by-day fulfilment of the demand to be reproduced according to the actual precipitation events and the deriving dynamics of the soil water content.
Depending on the storage fraction, indeed, the frequency and magnitude of precipitation events determine the performance of the RWH system, providing a tool to support the selection of the most appropriate combination of collection area and storage size. It is expected that the inter-annual variability of the performance indices increases with the increase in the size of the storage tank, but the amplitude of such behaviour can only be estimated by considering the daily distribution of precipitation events. Indeed, a large storage capacity would allow the volume of large events to be preserved, even for a significant duration, but the actual occurrence of such large events is very variable from year to year.
The results confirm that the most efficient scenario is Scenario 3, the one collecting rainwater from the brick roof, although Scenario 1, where the drainage from ground surfaces is collected, exhibits very similar performance in agreement with the overall result obtained above about the demand fraction (D/Q). Scenario 2, with rainwater collected from the sheet metal roof, is less performant due to the reduced size of the collecting surface (and a demand fraction about or more than twice those in the other two scenarios).
The fraction of time when the demand is fully met (Re) and the efficiency (ET) range between 0.2 and 1, and obviously increase with the tank size. Both are larger than 60% when the storage fraction is larger than 0.03, 0.1, and 0.02 in Scenarios 1, 2 and 3, respectively. This means that a much larger tank size (twice the volume) is required in Scenario 2 to achieve the same system reliability of the other two solutions. The most suitable design of the RWH system would, therefore, require an intermediate tank size, in the order of 120 m3.
In all cases, the overflow ratio is quite high, reflecting the large portion of rainwater that is collected but not used for irrigation (due to the scarce synchronization between the availability and the demand). This indicates that further usages of the collected rainwater would be compatible with the demand for irrigation, e.g., the supply of toilet flushing in the public or nearby areas. This is also confirmed by the fraction of time when storage is not empty (R), which exhibits quite high values since it is calculated over the whole year, including periods when irrigation is not used (from November to March), and the stored water would be available for additional usages.
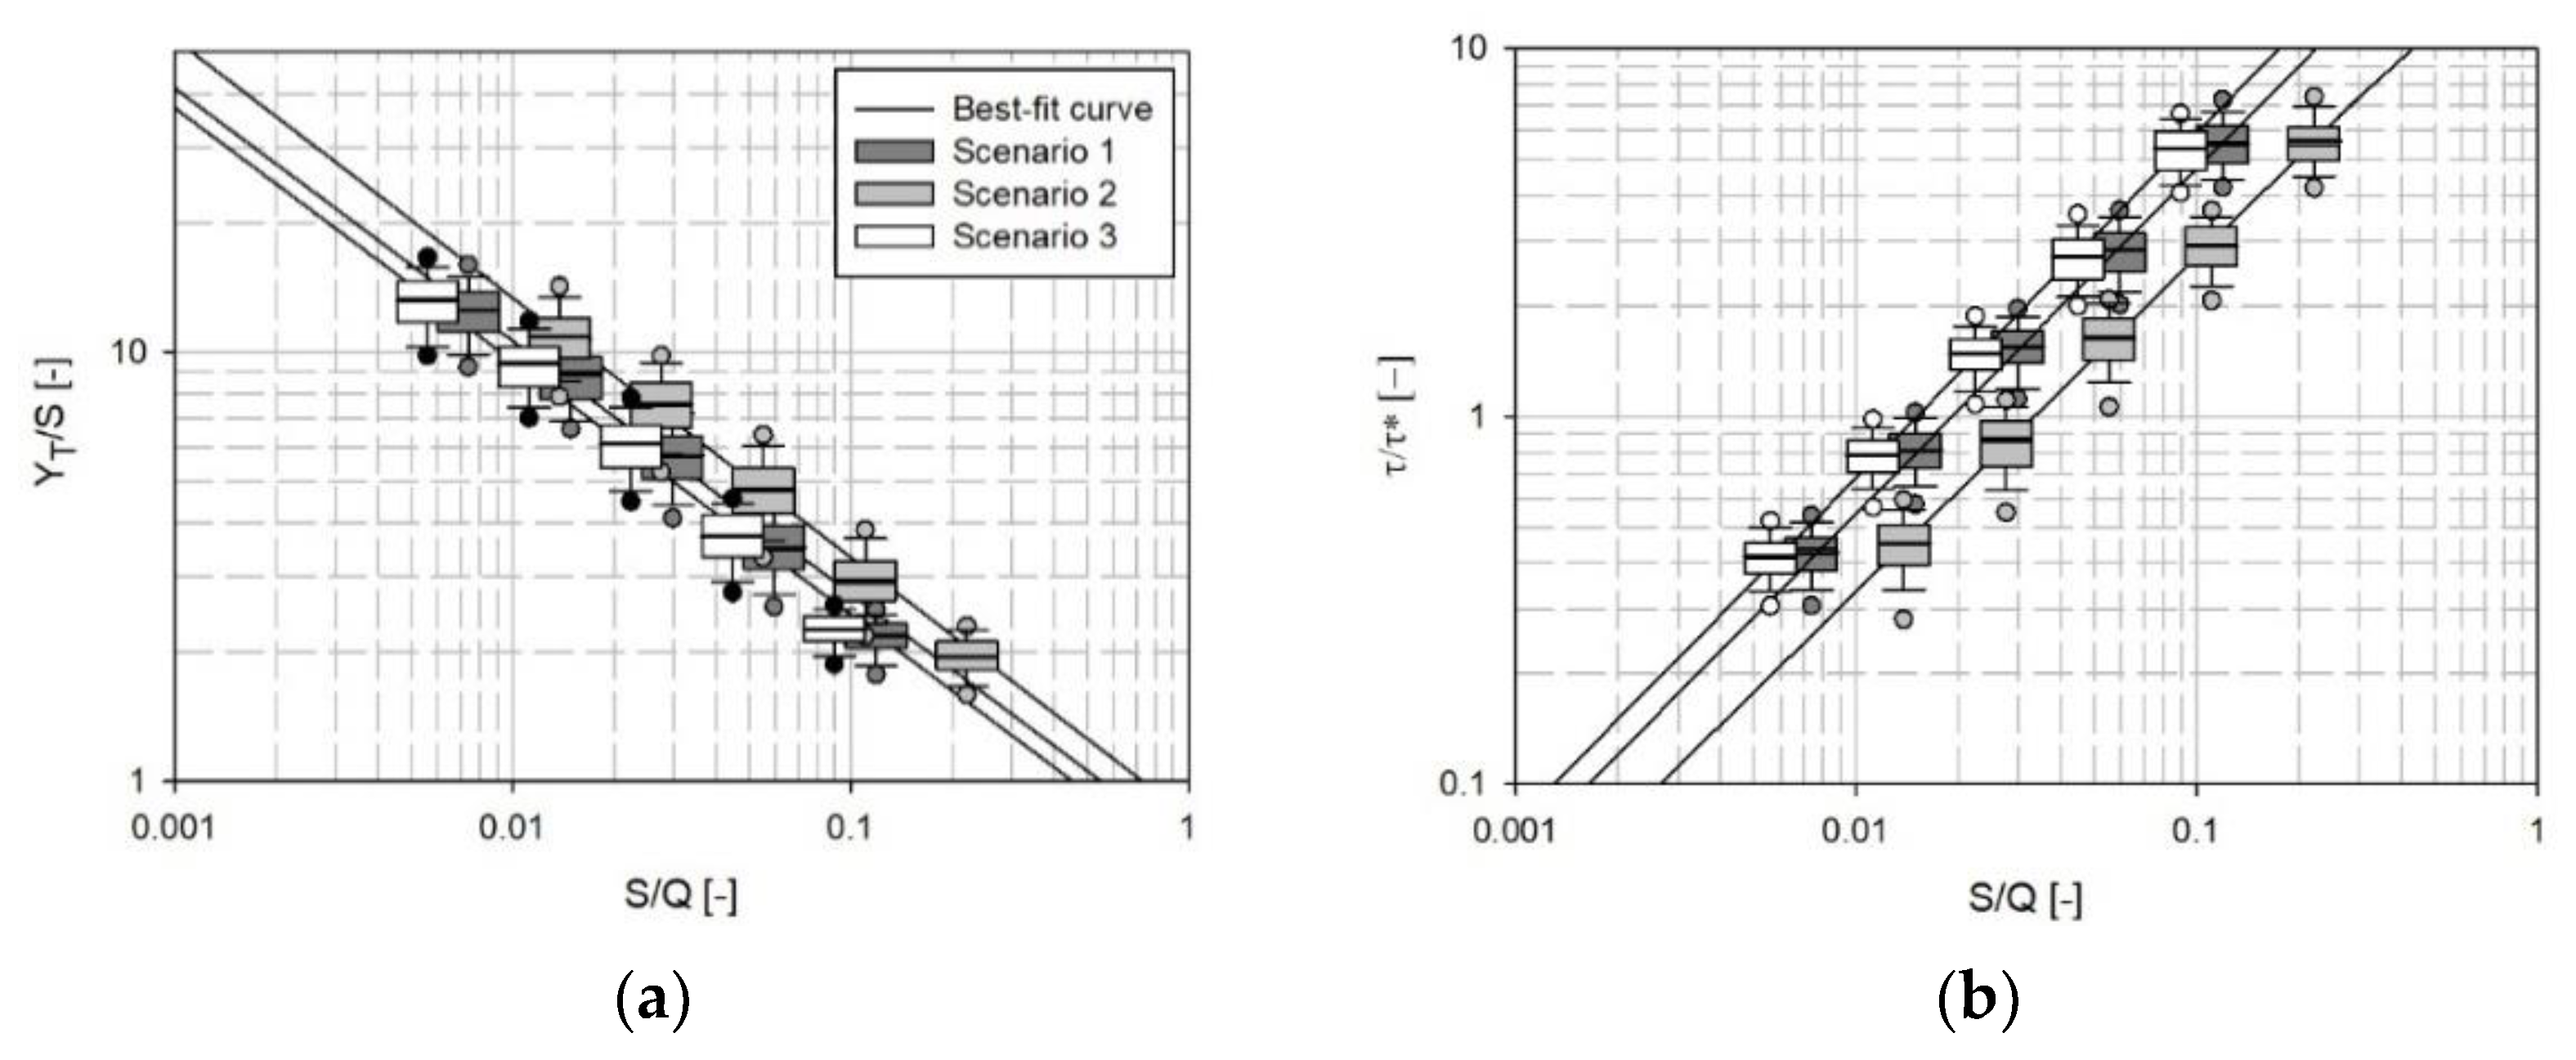
Since the tank cost is often directly related to its volume and monetary savings are directly related to the volume of water used, as suggested by [20], the annual usage volume per unit of tank capacity (U) is calculated. The ratio of YT/S decreases as the tank volume increases, since the added capacity is utilized less frequently (Figure 5, left-hand panel). The results show that by fixing the tank size, Scenario 3 and Scenario 1 exhibit higher mean values of U if compared with Scenario 2, which means that the adopted storage volume is much better exploited. The box-and-whisker description is the same as that in Figure 1, while the continuous lines represent the regression function calculated from the mean values of the investigated index. The best fit formulation is a power law, expressed as a function of the storage fraction S/Q as:
where T = U, while α and β are two numerical coefficients obtained from the regression. The values of the obtained numerical coefficients and the Pearson coefficient (R2) are listed in Table 3.
3.2. Detention Time
The analysis of the detention time of water within the storage tank aims at ensuring that the quality of the collected water does not deteriorate over time and reach conditions that are deemed not suitable for the intended use. For instance, Ogbozige et al. [30] proved that tap water for potable use, collected in plastic, or galvanized or coated steel metal tanks, should not be stored for more than three weeks.
In the case of non-potable usages, such as the landscape irrigation of urban green areas, less demanding quality standards are required. He et al. [31] performed rainwater quality observations in a case study involving RWH for the landscape irrigation of public areas and reported that “the quality level of stormwater (…) generally meets the requirements for irrigation under dry periods and low flow conditions, when watering is likely to be performed.” They also found that rain events “significantly contributed to elevated microbiological levels in rainwater” and suggested that the irrigation system be prevented from watering for a couple of days after each rain event, a condition that is indeed met by the irrigation schedule assumed in this work.
To avoid the formation of a suitable habitat for mosquitos in structural Best Management Practices (BMPs), it was suggested that the irrigation schedule allows the complete drawdown of the stored water volume within 72 h [32]. The same source suggested that irrigation should not begin within 12 h after the end of rainfall, so that direct storm runoff has ceased, and soils are not saturated.
Metzger et al. [33] investigated the quality of rainwater used in many BMPs realised throughout the United States and suggested that structures designed with sumps or basins that retain water permanently or longer than 72 h should be sealed completely to prevent the entry of adult mosquitoes but recognised that this is hardly feasible given the dimensions of insects and their ability to access indoor rooms. Summarising years of research and field observations, they reported that aquatic habitats that last only three to five days generally do not permit the complete development of mosquito larvae.
In this work, a conservatory three-days period is assumed as a reference value (τ*) to assess the quality performance of the RWH system based on the chosen collection scenario and tank size. The results of the detention time (τ) of the water in the tank are, therefore, reported below in terms of normalised values, τ/τ*, so that any deviation from the reference conditions can be easily highlighted. Again, as in the analysis of the performance indices, the presented box-and-whisker plots show the variability of the annual normalised detention time (τ/τ*) as a function of the storage fraction (S/Q) in each investigated scenario. The box-and-whiskers description is the same as in Figure 1, while the continuous lines represent the regression function calculated from the mean annual values.
The best fit formulation is a power law expressed as a function of storage fraction S/Q, with the same formulation of eq. 25 and T = τ/τ*. The values of the obtained numerical coefficients (α and β) and the Pearson coefficient (R2) are listed in Table 3.
It is evident from Figure 5 that the detention time is quite constant with the choice of the rainwater collection scenario, for any given tank size. The horizontal spacing of the various boxes in each group (with fixed tank size) is dictated by the differences in the collected rainwater volume (Q) among the investigated scenarios. However, the increase in the detention time with the tank size (storage volume) is significant, as expected.
The detention time slightly varies among the various scenarios and shows the highest mean values and spread in the case of Scenario 2. Note that the best choice of storage volume (S = 120 m3) identified above is here also confirmed in terms of the resulting water quality, since it implies normalized detention times only slightly larger than one in all scenarios and thus close to the reference value assumed in this work. It is important to highlight that the detention time provides an indication of the water quality deterioration over time after it is collected in the tank, while this parameter does not account for the initial water quality conditions. Scenario 1, where part the collected rainwater is subject to infiltration in the soil, allows improved water quality conditions to be obtained thanks to the purifying capability of the terrain and vegetation.
One last comment is needed about the quality of the collected water. As summarized by [34], Legionella pneumophila is a natural intracellular bacterial parasite of free-living freshwater protozoa and an accidental human pathogen that causes Legionnaires’ disease. The most common form of transmission of Legionella is the inhalation of contaminated aerosols produced in conjunction with water sprays, jets, or mists [35]. Halpern [36] showed that the minimum water temperatures for the growth of Legionella are 25–30 °C. Although similar air temperatures can occur in Genova in summer, water stored in the underground tank would hardly reach such temperatures. However, with the objective to exclude any risk of inhalation, irrigation during nighttime, when the public area is closed, is recommended for this project.
4. Conclusions
The present work illustrates a suitable algorithm to account for soil water depletion conditional on daily precipitation events in urban green areas subject to landscape irrigation within an RWH system. A reconversion project of a former military area, located in the town of Genova (Italy), is used as a case study. Being in the Mediterranean region, the site is characterized by a strong seasonality of the rainfall events, with a high variability of the event depth and the duration of inter-event dry periods throughout the year. A long-term precipitation dataset (quasi bicentennial) is used to investigate the performance of the RWH system over time. The performance of the RWH system in three different rainwater collection scenarios is evaluated using a suitable behavioural model coupled with a dedicated algorithm to account for the soil water dynamics on the daily scale. Non-dimensional performance indices are used to illustrate and compare the various combinations of collection areas and tank sizes.
The soil water depletion algorithm proposed in this work to control the scheduling and amount of landscape irrigation allows one to include in the analysis the response of the irrigated areas to both the actual precipitation events and the watering cycles. The representativeness of the behavioural model and the associated performance indices are, therefore, improved. Using a water depletion algorithm also enhances the resulting exploitation of the collected rainwater resource by minimizing the watering volumes while still meeting the time-varying demand of the vegetation. This opens the field to further non-potable usages of the collected rainwater, since in all the investigated scenarios and for all tank sizes, the overflow ratio remains significant.
For the investigated case study, the best solution is found to be the adopting of a tank size of 120 m3, also considering the quality deterioration of the water in the storage tank and the economic benefit associated with the exploitation of the resource. Based on the assumed parameters, Scenario 1 and Scenario 3 exhibit similar performances. Scenario 1, which involves collecting rainwater from various ground surfaces in the park, requires a more complex drainage network below the various ground surfaces contributing rainwater to the storage tank if compared with the other two scenarios where a simple assembly of gutters and pipes can be employed. Pros include the quality of the collected rainwater thanks to the purifying potential of the terrain and vegetation in the collection areas. Scenario 2 involves collecting rainwater from the sheet metal roof, but with 40% of the effective surface area (ϕeq · Atot) with respect to Scenario 3. Using Scenario 2 would require doubling the size of the storage tank to achieve efficiency values similar to those in the other two scenarios.
A limitation of the adopted approach can be found in the time scale used for the behavioural model. The daily scale does not obviously reproduce any higher frequency in the variability of precipitation and soil water dynamics. However, when the objective of the RWH system is landscape irrigation alone, the daily scale appears quite reasonable. The literature advice to adopt the daily scale when the storage fraction (S/Q) is larger than 0.01 is met in all but one of the investigated scenario/tank size combinations. Furthermore, long-term series of measured precipitation on the sub-daily scale to feed the behavioural model can hardly be found.
A second limitation is related to the use of the local rainfall climatology in the framework of a specific case study, and some differences could be expected when applying the same methodology to a site located in a different climate. The Mediterranean climate, however, is characterized by a strong seasonality and the occurrence of even long dry periods between precipitation events, thus by quite demanding conditions for the use of RWH for landscape irrigation. Transferring the proposed model to a different climate (arid, semi-arid, or humid) may lead to different results, although it is evident that using the soil water depletion algorithm proposed in this work in any other climatological framework would also be beneficial for the assessment of the system performance.
Author Contributions
Conceptualization, A.C. and L.G.L.; methodology, A.C. and L.G.L.; software, A.C.; formal analysis, A.C.; investigation, A.C.; resources, L.G.L.; writing—original draft preparation, A.C.; writing—review and editing, L.G.L.; visualization, A.C.; supervision, L.G.L.; funding acquisition, L.G.L. All authors have read and agreed to the published version of the manuscript.
Funding
This research was funded by Municipality of Genova, contract within the UNALAB project SCC-02-2016-2017.
Data Availability Statement
Data are available upon request from the corresponding author.
Acknowledgments
This work was developed in the framework of the Urban NAture LABs (UNALAB) project, funded under the “HORIZON 2020” programme, Smart and sustainable Cities-SCC-02-2016-2017, as a collaboration between University of Genova (DICCA) and Municipality of Genova (project partner).
Conflicts of Interest
The authors declare no conflict of interest.
References
- Campisano, A.; Butler, D.; Ward, S.; Burns, M.J.; Friedler, E.; DeBusk, K.; Fisher-Jeffes, L.N.; Ghisi, E.; Rahman, A.; Furumai, H.; et al. Urban rainwater harvesting systems: Research, implementation and future perspectives. Water Res. 2017, 115, 195–209. [Google Scholar] [CrossRef] [PubMed]
- Tsihrintzis, V.A.; Hamid, R. Modeling and Management of Urban Stormwater Runoff Quality: A Review. Water Resour. Manag. 1997, 11, 136–164. [Google Scholar] [CrossRef]
- Mazurkiewicz, K.; Jeż-Walkowiak, J.; Michałkiewicz, M. Physicochemical and microbiological quality of rainwater harvested in underground retention tanks. Sci. Total Environ. 2022, 814, 152701. [Google Scholar] [CrossRef] [PubMed]
- Peel, M.C.; Finlayson, B.L.; McMahon, T.A. Updated world map of the Köppen-Geiger climate classification. Hydrol. Earth Syst. Sci. 2007, 11, 1633–1644. [Google Scholar] [CrossRef] [Green Version]
- McCarton, L.; O’Hogain, S.; Nasr, A. Special issue: NBS for resilient cities and communities—How understanding the micro components of domestic water consumption can provide multiple water uses to facilitate a transition to a Circular Economy of Water. Nat.-Based Solut. 2022, 2, 100028. [Google Scholar] [CrossRef]
- Pelak, N.; Porporato, A. Sizing a rainwater harvesting cistern by minimizing costs, part B. J. Hydrol. 2016, 541, 1340–1347. [Google Scholar] [CrossRef] [Green Version]
- Kuntz Maykot, J.; Ghisi, E. Assessment of A Rainwater Harvesting System in A Multi-Storey Residential Building in Brazil. Water 2022, 12, 546. [Google Scholar] [CrossRef] [Green Version]
- Hammes, G.; Ghisi, E.; Thives, L.P. Water end-uses and rainwater harvesting: A case study in Brazil. Urban Water J. 2020, 17, 177–183. [Google Scholar] [CrossRef]
- Karim, M.R.; Bashar, M.Z.I.; Imteaz, M.A. Reliability and economic analysis of urban rainwater harvesting in a megacity in Bangladesh. Resour. Conserv. Recycl. 2015, 104, 61–67. [Google Scholar] [CrossRef]
- Ghimire, S.R.; Johnston, J.M. Sustainability assessment of agricultural rainwater harvesting: Evaluation of alternative crop types and irrigation practices. PLoS ONE 2019, 14, e0216452. [Google Scholar] [CrossRef]
- Zhu, Q. Rainwater Harvesting Techniques for Irrigation. In Rainwater Harvesting for Agriculture and Water Supply; Zhu, Q., Gould, J., Li, Y., Ma, C., Eds.; Springer: Singapore, 2015; pp. 165–194. [Google Scholar] [CrossRef]
- Terêncio, D.P.S.; Sanches Fernandes, L.F.; Cortes, R.M.V.; Moura, J.P.; Pacheco, F.A.L. Rainwater harvesting in catchments for agro-forestry uses: A study focused on the balance between sustainability values and storage capacity. Sci. Total Environ. 2018, 613–614, 1079–1092. [Google Scholar] [CrossRef] [PubMed]
- Zaizen, M.; Urakawa, T.; Matsumoto, Y.; Takai, H. The collection of rainwater from dome stadiums in Japan. Urban Water 2000, 1, 355–360. [Google Scholar] [CrossRef]
- Dallmer, L. SQUIRTS—An On-site Stormwater Treatment and Reuse Approach to Sustainable Water Management in Sydney’. Water Sci. Technol. 2002, 46, 151–158. [Google Scholar] [CrossRef]
- Hwang, A.H.-S.; Valeo, C.; Draper, D. Public Perceptions and Attitudes Toward Stormwater Recycling for Irrigation. Can. Water Resour. J. 2006, 31, 185–196. [Google Scholar] [CrossRef]
- Preeti, P.; Rahman, A. A Case Study on Reliability, Water Demand and Economic Analysis of Rainwater Harvesting in Australian Capital Cities. Water 2021, 13, 2606. [Google Scholar] [CrossRef]
- Fernandes, L.F.S.; Terêncio, D.P.; Pacheco, F.A. Rainwater harvesting systems for low demanding applications. Sci. Total Environ. 2015, 529, 91–100. [Google Scholar] [CrossRef]
- Li, S.; Liu, Y.; Her, Y.; Chen, J.; Guoc, T.; Shao, G. Improvement of simulating sub-daily hydrological impacts of rainwater harvesting for landscape irrigation with rain barrels/cisterns in the SWAT model. Sci. Total Environ. 2021, 798, 149336. [Google Scholar] [CrossRef]
- Her, Y.; Jeong, J.; Arnold, J.; Gosselink, L.; Glick, R.; Jaber, F. A new framework for modeling decentralized low impact developments using Soil and Water Assessment Tool. Environ. Model. Softw. 2017, 96, 305–322. [Google Scholar] [CrossRef]
- Jones, M.P.; Hunt, W.F. Performance of rainwater harvesting systems in the southeastern United States. Resour. Conserv. Recycl. 2010, 54, 623–629. [Google Scholar] [CrossRef]
- Molaei, O.; Kouchakzadeh, M.; Fashi, F.H. Evaluation of rainwater harvesting performance for water supply in cities with cold and semi-arid climate. Water Supply 2019, 19, 1322–1329. [Google Scholar] [CrossRef] [Green Version]
- Dos Santos, S.M.; de Farias, M.M.M.W.E.C. Potential for rainwater harvesting in a dry climate: Assessments in a semiarid region in northeast Brazil. J. Clean. Prod. 2017, 164, 1007–1015. [Google Scholar] [CrossRef]
- Mehrabadi, M.H.R.; Saghafian, B.; Fashi, F.H. Assessment of residential rainwater harvesting efficiency for meeting non-potable water demands in three climate conditions. Resour. Conserv. Recycl. 2013, 73, 86–93. [Google Scholar] [CrossRef]
- Palla, A.; Gnecco, I.; Lanza, L.G.; la Barbera, P. Performance analysis of domestic rainwater harvesting systems under various European climate zones. Resour. Conserv. Recycl. 2012, 62, 71–80. [Google Scholar] [CrossRef]
- Fewkes, A.; Butler, D. Simulating the performance of rainwater collection systems using behavioural models. Build. Serv. Eng. Res. Technol. 2000, 21, 99–106. [Google Scholar] [CrossRef]
- Mitchell, V.G. How important is the selection of computational analysis method to the accuracy of rainwater tank behaviour modelling? Hydrol. Process. 2007, 21, 2850–2861. [Google Scholar] [CrossRef]
- Fewkes, A. Modelling the performance of rainwater collection systems: Towards a generalised approach. Urban Water 2000, 1, 323–333. [Google Scholar] [CrossRef]
- Mitchell, V.G.; McCarthy, D.T.; Deletic, A.; Fletcher, T.D. Urban stormwater harvesting-sensitivity of a storage behaviour model. Environ. Model. Softw. 2008, 23, 782–793. [Google Scholar] [CrossRef]
- Palla, A.; Gnecco, I.; Lanza, L.G. Non-dimensional design parameters and performance assessment of rainwater harvesting systems. J. Hydrol. 2011, 401, 65–76. [Google Scholar] [CrossRef]
- Ogbozige, F.J.; Ibrahim, F.B.; Adie, D.B. Effect of Storage Time and Container Material on Potable Water Quality. Ife J. Sci. Technol. 2018, 1, 59–71. [Google Scholar]
- He, J.; Valeo, C.; Chu, A.; Neumann, N. Water Quality Assessment in the Application of Stormwater Reuse for Irrigating Public Lands. Water Qual. Res. J. Canada 2008, 43, 145–159. [Google Scholar] [CrossRef]
- CASQA California Stormwater Quality Association. Stormwater Best Management Practice Handbook; California Stormwater Quality Association: Redondo Beach, CA, USA, 2003; Available online: https://www.casqa.org (accessed on 22 September 2022).
- Metzger, M.E.; Messer, D.F.; Beitia, C.L.; Myers, C.M.; Kramer, V.L. The dark side of stormwater runoff management: Disease vectors associated with structural BMPs. Stormwater 2002, 3, 24–39. [Google Scholar]
- Robertson, P.; Abdelhady, H.; Garduño, R.A. The many forms of a pleomorphic bacterial pathogen the developmental network of Legionella pneumophila. Front. Microbiol. 2014, 5, 670. [Google Scholar] [CrossRef] [PubMed] [Green Version]
- Sharaby, Y.; Rodríguez-Martínez, S.; Oks, O.; Pecellin, M.; Mizrahi, H.; Peretz, A.; Brettar, I.; Höfle, M.G.; World Health Organization. WHO Legionellosis Fact Sheet. Geneva. 2018. Available online: https://www.who.int/news-room/fact-sheets/detail/legionellosis (accessed on 22 September 2022).
- Halpern, M. Temperature-dependent growth modeling of environmental and clinical Legionella pneumophila multilocus variable-number tandem-repeat analysis (MLVA) genotypes. Appl. Environ. Microbiol. 2017, 83, e03295-16. [Google Scholar] [CrossRef]
Figure 1.
(a) Quasi-bicentennial daily rainfall record as observed at the meteorological station of Genova Università, with continuous and dashed lines indicating the mean plus/minus the standard deviation of the whole series, respectively; (b) seasonal variability of monthly precipitation. Boxes and whiskers encompass the central 50% and 80% of the dataset, respectively, while dots indicate the 5th and 95th percentiles of their non-parametric distribution. The mean and median values are depicted with thick and thin horizontal lines, respectively.

Figure 2.
Schematics of the main elements of the simulated RWH system. Pt is the precipitation amount; Qt is the rainwater inflow to the storage tank; S is the storage capacity of the system; Vt is the rainwater volume stored in the tank; Yt is the released volume; Ot is the overflow volume; and Dt is the water demand.

Figure 3.
Box-and-whisker plots of the variability of the annual demand fraction (D/Q) during the simulation period for the three investigated scenarios. The box-and-whisker description is the same as in Figure 1.
Figure 3.
Box-and-whisker plots of the variability of the annual demand fraction (D/Q) during the simulation period for the three investigated scenarios. The box-and-whisker description is the same as in Figure 1.

Figure 4.
Box-and-whisker plots of the variability of the annual temporal reliability indices (R and Re in panels (a) and (b), respectively) and volumetric reliability indices (ET and OT in panels (c) and (d), respectively) as a function of the storage fraction (S/Q) in the three investigated scenarios. The box-and-whiskers description is the same as that in Figure 1. Continuous lines represent the logarithmic regression function calculated from the mean values of the investigated indices.

Figure 5.
Box-and-whisker plots of the annual variability of the usage volume per unit of tank capacity (U = YT/S, panel (a)) and normalized detention time (τ/τ*, panel (b)) as a function of the storage fraction (S/Q) in the three investigated scenarios. The box-and-whisker description is the same as that in Figure 1. Continuous lines represent the power law regression function calculated from the annual mean values.


Table 1.
Storage capacity of the system (S) and storage fraction (S/Q) in the three investigated scenarios.
Table 1.
Storage capacity of the system (S) and storage fraction (S/Q) in the three investigated scenarios.
| S (m3) | S/Q (-) | ||
|---|---|---|---|
| Scenario 1 | Scenario 2 | Scenario 3 | |
| 30 | 0.007 | 0.014 | 0.006 |
| 60 | 0.015 | 0.028 | 0.011 |
| 120 | 0.030 | 0.055 | 0.022 |
| 240 | 0.060 | 0.111 | 0.045 |
| 480 | 0.119 | 0.221 | 0.090 |
Table 2.
Coefficients (y0 and a) and Pearson coefficient (R2) of the logarithmic regression function for the four reliability indices in each collection scenario.
Table 2.
Coefficients (y0 and a) and Pearson coefficient (R2) of the logarithmic regression function for the four reliability indices in each collection scenario.
| R | Re | ET | OT | |||||||||
|---|---|---|---|---|---|---|---|---|---|---|---|---|
| Scenario | 1 | 2 | 3 | 1 | 2 | 3 | 1 | 2 | 3 | 1 | 2 | 3 |
| y0 | 1.116 | 1.022 | 1.156 | 1.321 | 1.069 | 1.427 | 1.299 | 1.035 | 1.412 | 0.597 | 0.412 | 0.669 |
| a | 0.072 | 0.065 | 0.075 | 0.198 | 0.179 | 0.203 | 0.201 | 0.181 | 0.208 | −0.063 | −0.103 | −0.049 |
| R2 | 0.997 | 0.995 | 0.994 | 0.997 | 0.995 | 0.994 | 0.997 | 0.980 | 1.000 | 0.996 | 0.979 | 0.999 |
Table 3.
Coefficients (α and β) and Pearson coefficient (R2) of the power law regression function for the usage volume per unit of tank capacity and the normalized detention time in each collection scenario.
Table 3.
Coefficients (α and β) and Pearson coefficient (R2) of the power law regression function for the usage volume per unit of tank capacity and the normalized detention time in each collection scenario.
| YT/S | τ/τ* | |||||
|---|---|---|---|---|---|---|
| Scenario | 1 | 2 | 3 | 1 | 2 | 3 |
| α | 0.706 | 0.829 | 0.629 | 40.60 | 22.07 | 51.34 |
| β | −0.589 | −0.604 | −0.590 | 0.94 | 0.91 | 0.94 |
| R2 | 0.994 | 0.997 | 0.994 | 1.000 | 1.000 | 1.000 |
Publisher’s Note: MDPI stays neutral with regard to jurisdictional claims in published maps and institutional affiliations. |
© 2022 by the authors. Licensee MDPI, Basel, Switzerland. This article is an open access article distributed under the terms and conditions of the Creative Commons Attribution (CC BY) license (https://creativecommons.org/licenses/by/4.0/).
Share and Cite
MDPI and ACS Style
Cauteruccio, A.; Lanza, L.G. Rainwater Harvesting for Urban Landscape Irrigation Using a Soil Water Depletion Algorithm Conditional on Daily Precipitation. Water 2022, 14, 3468. https://doi.org/10.3390/w14213468
AMA Style
Cauteruccio A, Lanza LG. Rainwater Harvesting for Urban Landscape Irrigation Using a Soil Water Depletion Algorithm Conditional on Daily Precipitation. Water. 2022; 14(21):3468. https://doi.org/10.3390/w14213468
Chicago/Turabian StyleCauteruccio, Arianna, and Luca G. Lanza. 2022. "Rainwater Harvesting for Urban Landscape Irrigation Using a Soil Water Depletion Algorithm Conditional on Daily Precipitation" Water 14, no. 21: 3468. https://doi.org/10.3390/w14213468
Note that from the first issue of 2016, this journal uses article numbers instead of page numbers. See further details here.