
Development of Lake from Acidification to Eutrophication in the Arctic Region under Reduced Acid Deposition and Climate Warming


V.I. Vernadsky Institute of Geochemistry and Analytical Chemistry RAS, Kosygina Street 19, 119991 Moscow, Russia
*
Author to whom correspondence should be addressed.
Water 2022, 14(21), 3467; https://doi.org/10.3390/w14213467
Submission received: 4 October 2022
/
Revised: 25 October 2022
/
Accepted: 26 October 2022
/
Published: 30 October 2022
(This article belongs to the Special Issue Water Resources under Growing Anthropogenic Loads)
Abstract
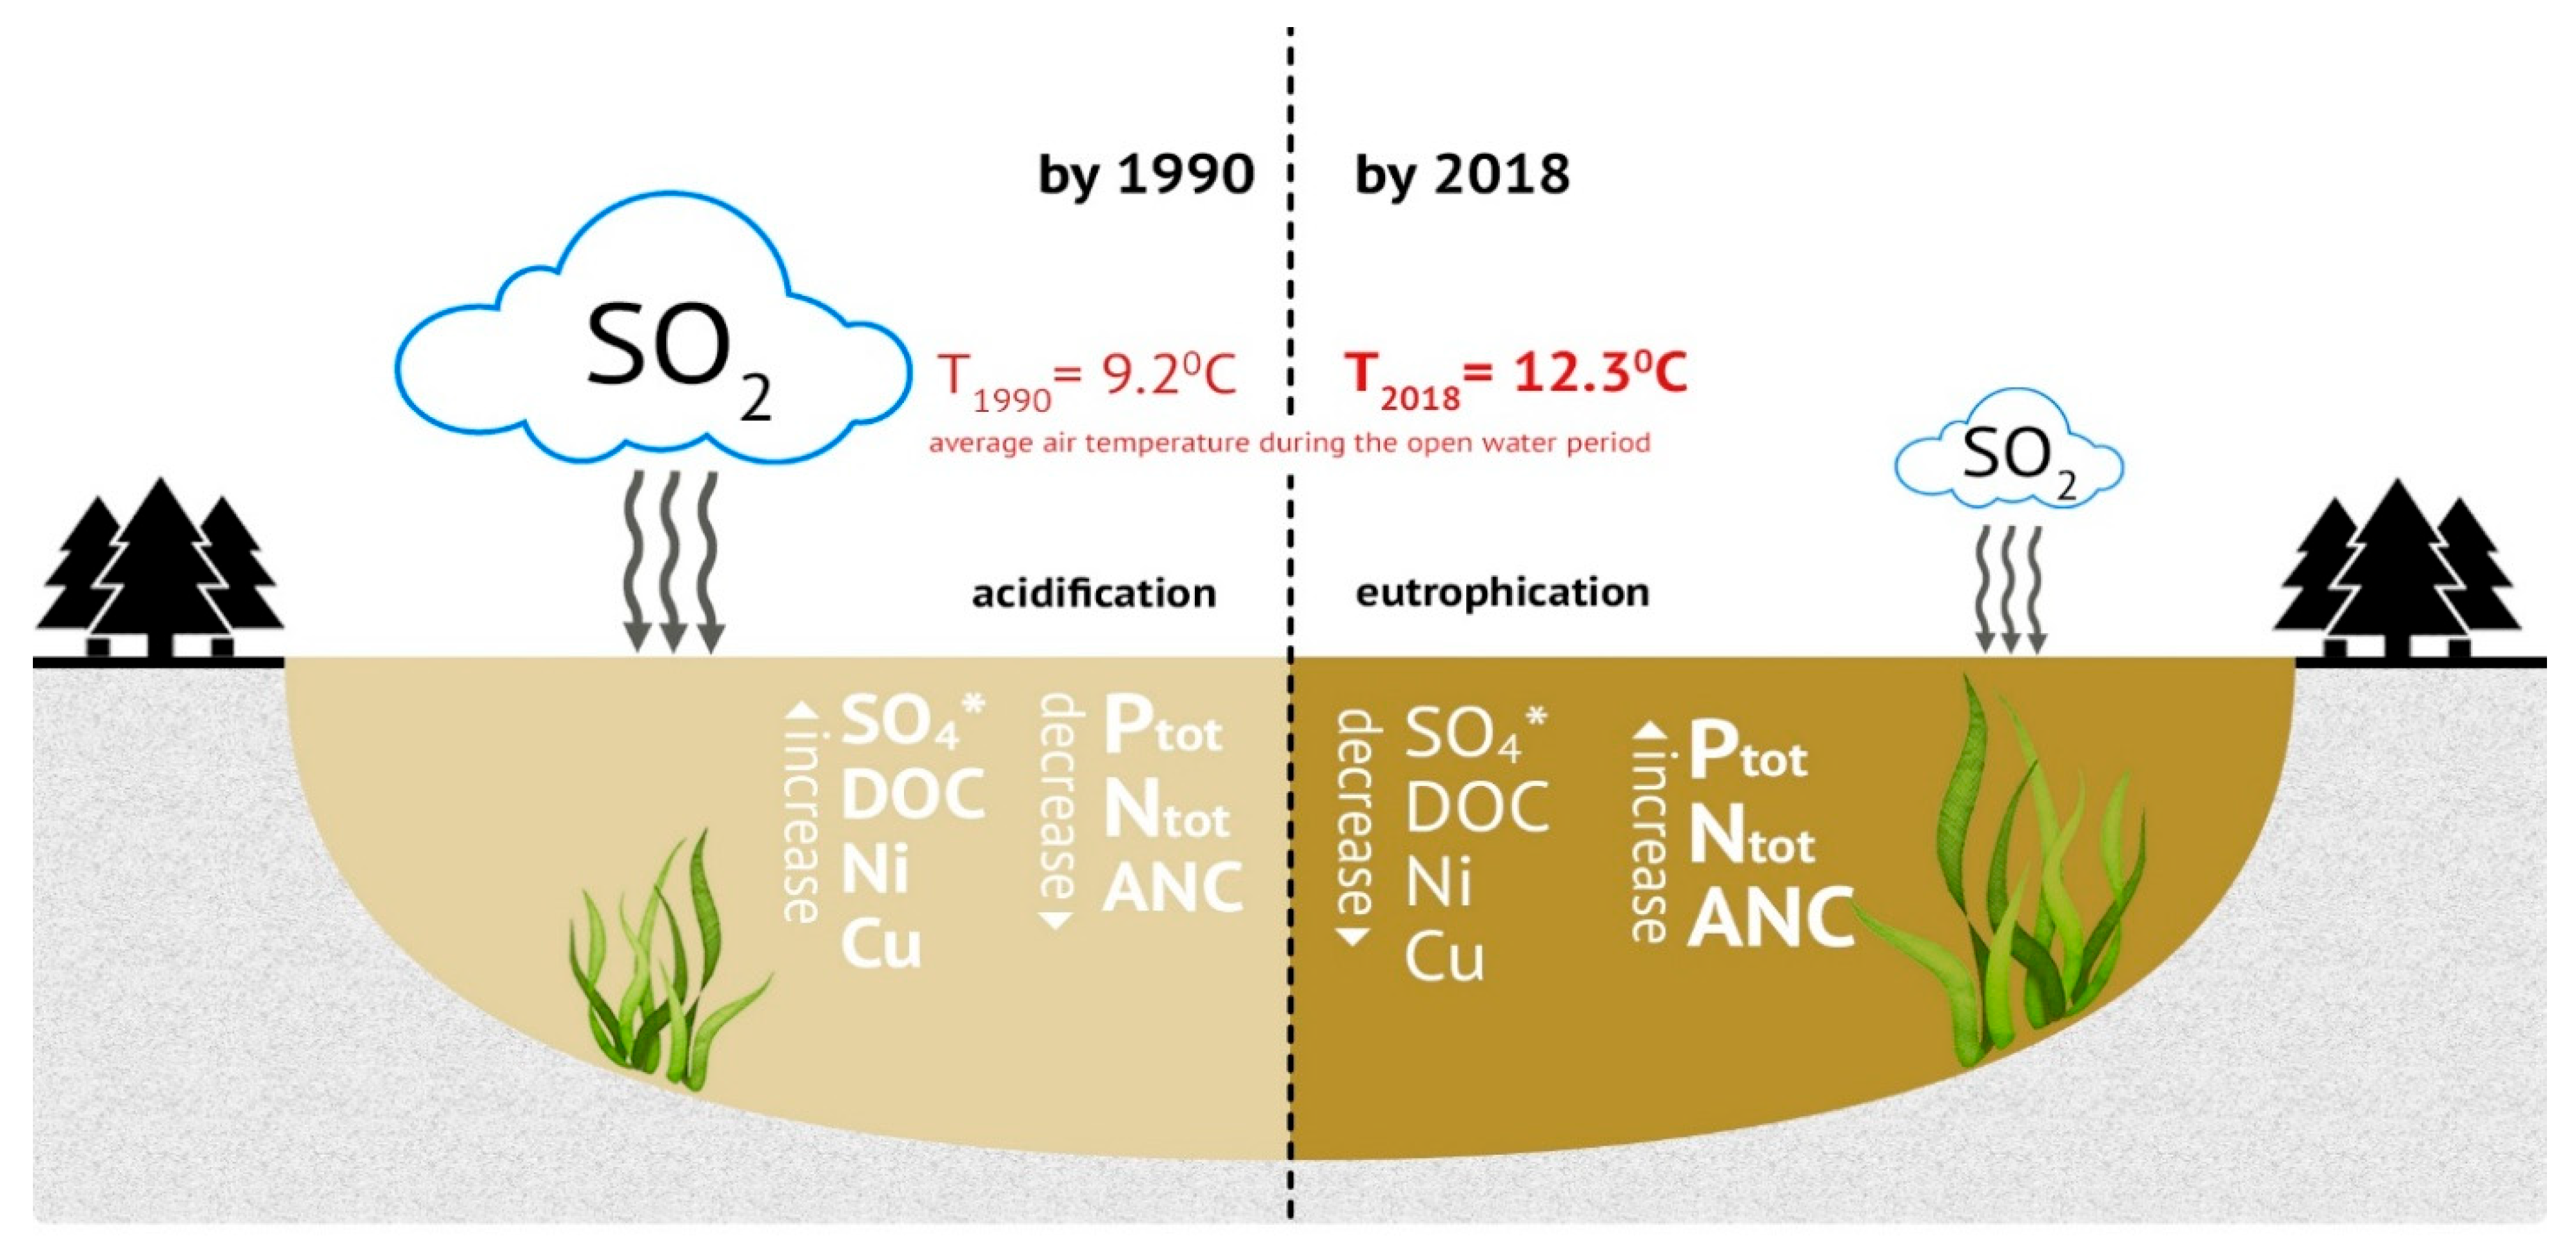
:Small lakes are potentially effective environmental sensors; they react quickly to anthropogenic stressors. We studied the long-term response of water chemistry to reduced acid deposition and climate warming in the Kola Arctic region of Russia based on monitoring data from 75 lakes. Monitoring was carried out once every 4–5 years in 1990–2018, with analysis for major anions and cations, dissolved organic carbon (DOC), and heavy metals (Ni and Cu). Analysis of archive data on the weather allowed us to reliably identify trends toward a systematic temperature increase over the past 28 years. The population of the lakes under study was proven to generally show a decrease in the concentrations of anthropogenic sulfates and the strengthening of the acid-neutralizing capacity (ANC) of the waters during this period. The concentrations of both DOC and nutrients (Ptot and Ntot) in the lake waters were determined to increase. This phenomenon can be explained by the following two mechanisms: a decrease in the deposition of strong acids and climate warming. We suggest that the effects of multiple factors on the surface waters result in an irreversible evolution of the lakes; hence, the term recovery does not adequately reflect the processes occurring in this industrially well-developed part of the Arctic.
1. Introduction
Anthropogenic activities in the 20th century were associated with vast atmospheric emissions of acid-forming gases (SO2, NOX and NH3), which can be converted into acids in the atmosphere and ecosystems and lead to the anthropogenic acidification of soils and waters. The acidification of waters manifested itself in many acid-sensitive areas worldwide by the 1960s and was then identified until the 1970s–1990s. Studies of the effects of acidic atmospheric precipitation on waters and soils were conducted in North America and Europe [1,2,3,4,5,6,7,8]. In view of the hazardous nature of this phenomenon, the International Cooperative Programme on Assessment and Monitoring of Acidification of Rivers and Lakes (ICP-Water) was launched in the 1980s to combine the efforts of research aimed at studying water acidification [9]. Several international resolutions adopted in the 1980s to minimize emissions of acid-forming gases led to a decrease in the deposition of acids into catchment basins in Europe and North America. Surface waters in many acid-sensitive areas started to recover from their acidification in response to diminishing emissions of SO2 and NO3. Some parameters of water chemistry display similar tendencies in lakes and rivers in Europe and North America: the concentrations of DOC, nitrogen, and phosphorus increase, whereas the concentrations of cations can decrease or increase [8,10,11,12,13,14,15,16].
Many factors delay the recovery of acid-neutralizing capacity (ANC) in surface waters following decreases in acid deposition [17]. The depletion of basic cations in catchments limits the ability to neutralize inputs of acid deposition. In recent decades, along with a decrease in sulfur and nitrogen emissions, climate warming has been observed with varying degrees of intensity depending on the region [18]. The climate has a significant impact on the biogeochemical cycles of elements in the reservoir and in the catchment [19,20,21]. Houle et al. [22] noted that higher annual air temperatures were more often correlated with alkalinity and pH than rates of decreasing SO4* deposition. Corman et al. [23], using long-term records of browning, found that DOC-associated nutrient loadings may have resulted in substantial increases in nitrogen and phosphorus in lakes. Increases in the Ptot concentration in the water of undeveloped catchments of the U.S. suggest that they cannot be attributed to either point or nonpoint sources of Ptot receipts [14].
Water acidification was identified in Russia in the early 1990s in some areas (in the Murmansk territory, Karelia, and in the Arkhangelsk and Vologda territories) where the geological structure of catchment areas is acid-sensitive [24,25]. It was later determined that up to 5% of lakes are anthropogenically acidified in extensive parts of humid areas in the European part of Russia and West Siberia [26]. The greatest amounts of SO2 were emitted in the 20th century from nonferrous metallurgy facilities, including those of the NorNickel Company, which operates in the Kola Peninsula and Norilsk area [27]. Similar to what took place in European countries, SO2 emissions in these areas have significantly decreased over the past three decades. The following three scenarios were identified in the long-term change of the water chemistry in response to a decrease in acidic deposition: (i) water acidification continues and ANC decreases; (ii) neither pH nor alkalinity changes; and (iii) the waters recover and ANC is increased [28].
The global climate is changing; models predict a 5–8 °C increase in the mean air temperatures by the year 2100 in Northern and Central Europe [29]. Moreover, these changes are more significant in the Arctic. Since the middle of the last century, a significant summer warming trend for lake water temperature (+0.25 °C per decade) has been recorded for Lake Inari (Finland) [30] and a more significant trend for Lake Kallavesi (+0.422 °C per decade), located in central Finland [31].
The natural conditions of the Arctic zone, such as the predominant atmospheric nutrition in the lakes, poorly developed vegetation, and a thin soil layer, provide a quick response of the lake water chemistry to changes in precipitation and climate variations. Long-term monitoring of lake water chemistry in these regions provides a great opportunity to examine the evolution of lakes and the effectiveness of air pollution reduction and climate warming.
This study was focused primarily on (1) characterizing the acid–base status of lakes in the Kola region on a systematic basis over a 28-year period; (2) understanding the key factors that control the rate of ANC recovery from an acidification lake; and (3) estimating how a temperature increase may affect the evolution of the lakes during long-lasting declines in sulfuric acid deposition.
2. Materials and Methods
2.1. Study Area
The Northern Kola Territory lies north of the Article Circle, within two geographical zones: tundra and taiga. It is bounded by the Barents Sea in the north and by the White Sea in the south and east, with approximately two-thirds of the territory covering the Kola Peninsula. The landscapes in the northeast are tundra, which gradually give way to forest tundra southward and to northern taiga farther southward, in the southern part of the territory. Polar winter there lasts for six to seven months (from November to May) [32].
The geology of the Kola territory is highly diverse. Acid granitic rocks typically crop out in the northeastern and southeastern parts of the Kola Peninsula. The Khibiny and Lovozero mountains in its central part consist of alkaline rocks (apatite–nepheline syenites). The Kola copper–nickel smelter facilities are situated on mafic bedrocks, which predetermine the good buffer characteristics of the nearby lakes [33]. With regard for the variability of geochemical environments in which the local waters are formed, it was proposed to estimate the susceptibility of the territory with the application of a geochemical parameter (Krock) that characterizes the bedrock lithologies in the northern Kola and the resistance of the rocks to chemical weathering. This coefficient is defined as the ratio of major cation oxides to silicon dioxide.
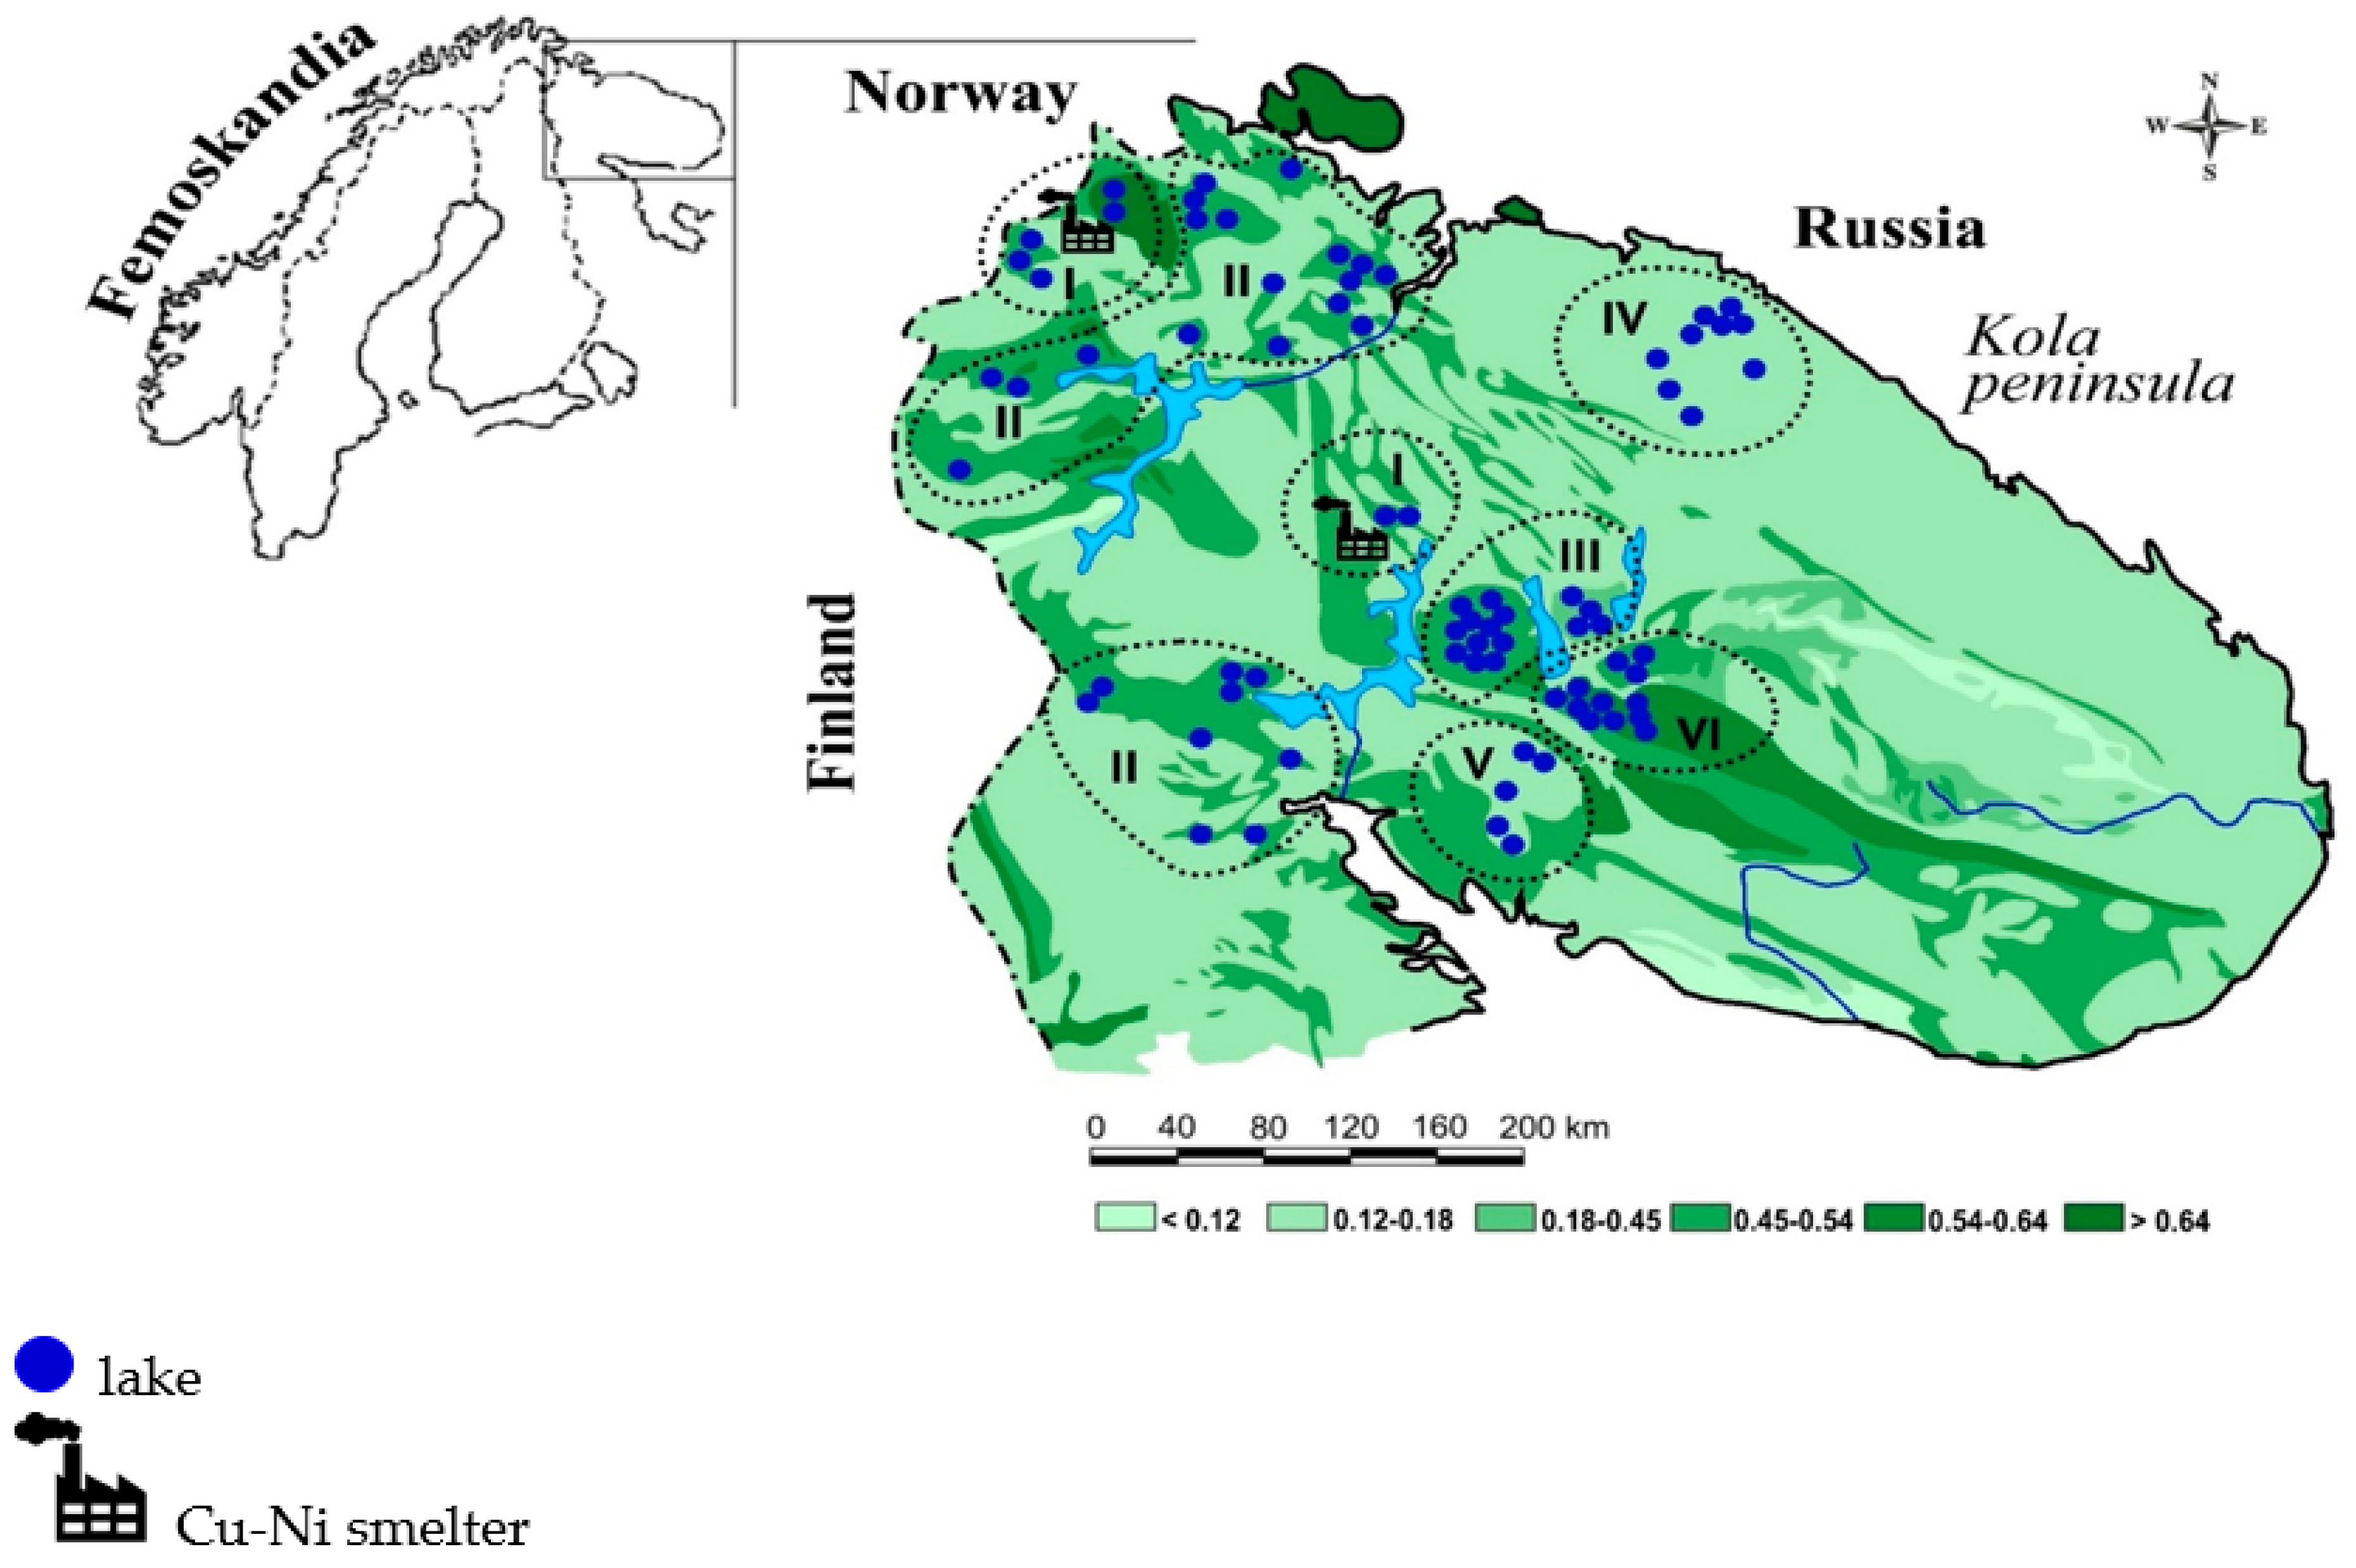
A schematic map of the area, the distribution of Krock values, and the location of the study sites (the studies were repeated once every four to five years) are shown in Figure 1. As this indicator increases, the buffer capacity of catchments, considering the geological structure, increases (from lighter to darker colors in Figure 1).
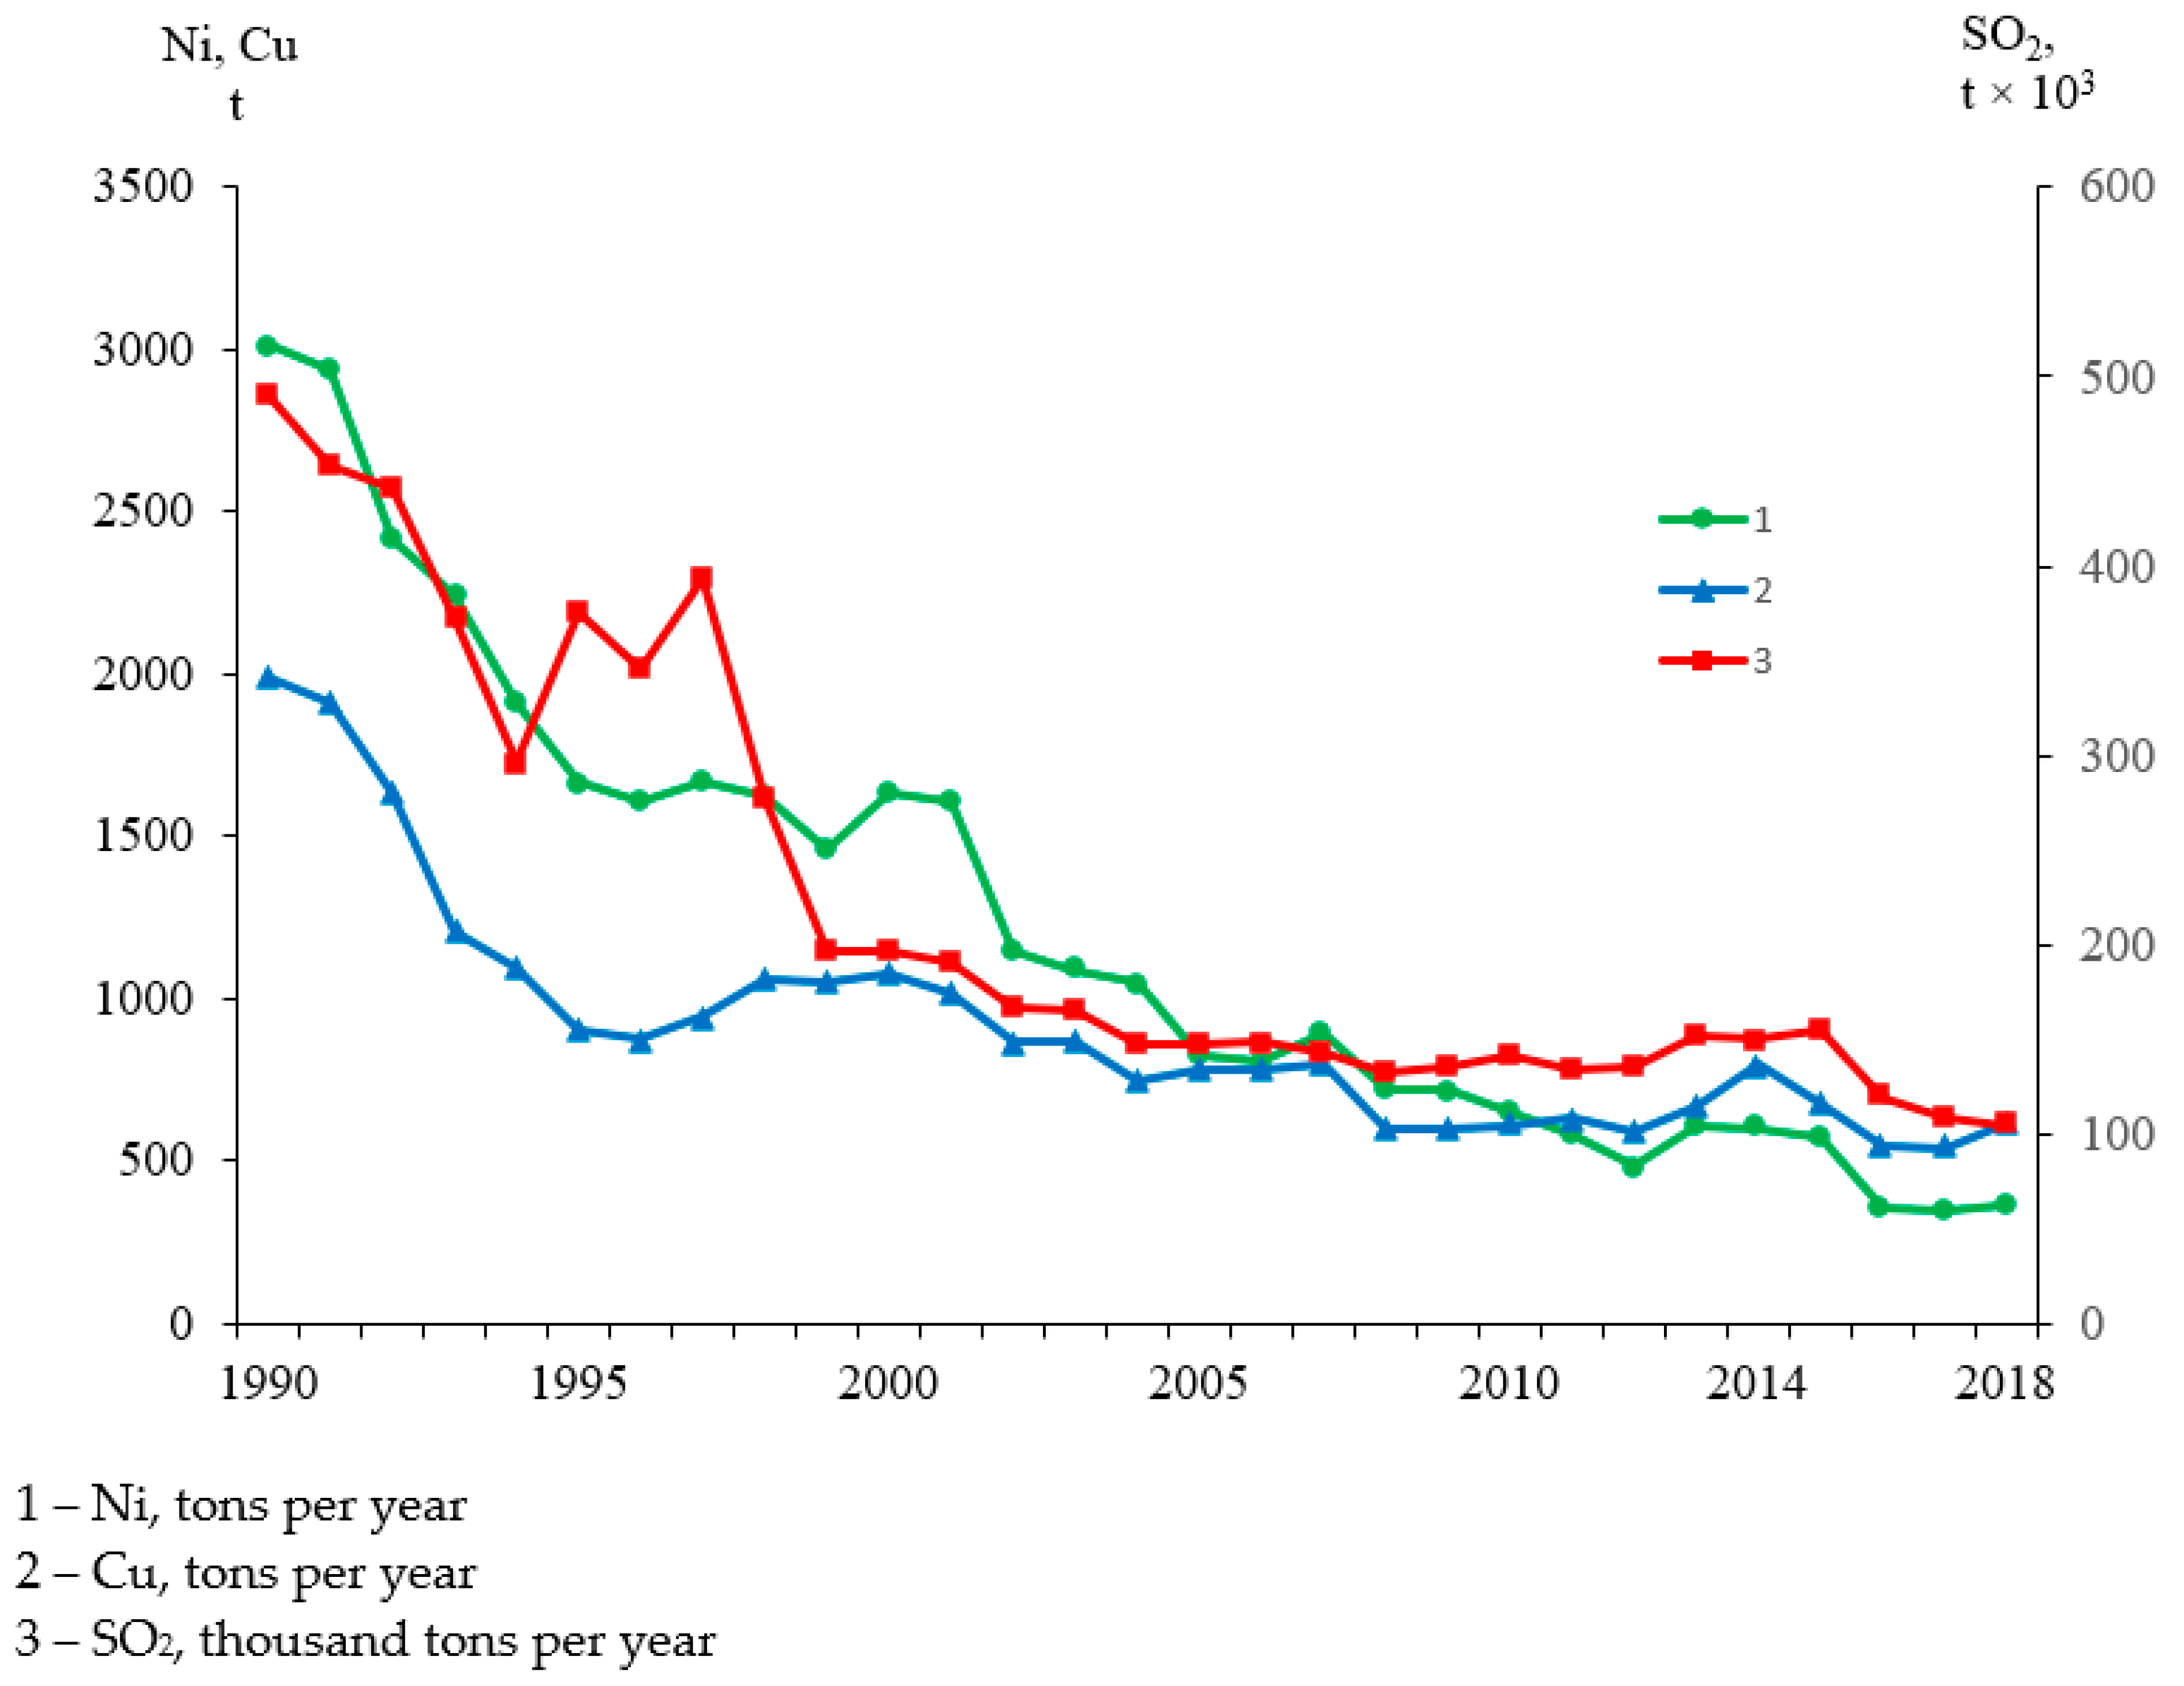
Copper and nickel smelter of the Severonickel and Pechenganickel companies and their processing facilities of copper and nickel ores have operated in the northern Kola Peninsula for more than seven decades. Figure 2 shows the dynamics of SO2, Ni, and Cu emissions from these smelters [34]. Sulfur emissions from the copper and nickel smelters reached a maximum in the mid-1970s and continued until the 1980s, when the Kola smelters worked with ores with high sulfur concentrations, which were delivered from Norilsk. Over the study period (three decades), the sulfur emission systematically decreased until 2010 and remained low afterward (Figure 2).
Deposition of anthropogenic sulphur in 1980–1990 was over 3 g S m−2 year−1 in the areas of distribution of smoke emissions from smelter and less than 0.3 g S m−2 year−1 in the eastern part of the Kola Peninsula [25]. At present, according to state reports [35], the annual average deposition of sulfur in impact zones for 2018 is low and is estimated 0.37 g S m−2 year−1.
Considering the great geochemical environments diversity in which the waters were formed, we distinguish six subareas, different in formation conditions and susceptibility to acidic deposition (Figure 1). These subareas are fixed with Roman numerals in the schematic map. The geological structure of the region is variable and general characteristics of the bedrock geology and landscapes in the subareas are presented in Table 1. The vegetation is poorly developed, the soils in the Arctic region are weakly thick, and, due to the leaching regime, are heavily washed out [32]. Subarea I unite lakes that are located at 30–50 km from smelters, are most influenced by the Kola copper–nickel smelters. The western territories (II and III) are characterized by a good buffer capacity according to the geochemical environments. These areas are forested. The most vulnerable subareas are IV (in the northeast) and V (in the southeast). The eastern catchments of the territory (subarea VI) are covered by wetlands and forest.
2.2. Water Chemistry: Sampling and Analysis
The first studies of the water chemistry were organized in 1990, when the Kola Research Center of the Russian Academy of Sciences started to actively cooperate with the national academies of sciences of neighboring countries (Finland, Norway, and Sweden). In 1995, 460 lakes in the northern Kola Peninsula, including remote lakes in the eastern Kola, were studied under the international project Northern European Lake Survey. The results of this study were published in [36] and the study of 75 small lakes in the northern Kola was then continued in the western part of the territory on a systematic basis (once every 4–5 years: in 2000, 2005, 2010, 2014, and 2018), and conducted with the application of the same methods as the 1995. This work was carried out in compliance with recommendations from the Waters Programme Manual. The aim of the Manual is to give guidance and recommend methods for surface waters monitoring and harmonize methodology to secure possibilities for comparison and common evaluation of data between countries. This will lead to a greater reliability of the data assessments and a higher probability to detect impacts of atmospheric pollution on surface waters [37].
The study was centered on lakes whose surface areas lied within the range of 0.4 to 20 km2 and which were not impacted by any waste ore sewage water. To minimize the effects of annual and seasonal variations, the waters were sampled during autumn cooling (in September for tundra lakes and in October for taiga ones). The water samples were stored in Nalgene polyethylene non-sorbing bottles. When waters were sampled, the bottles for water samples were twice rinsed with the lake water, and the bottles with the samples were placed into dark containers and transported (when cooled to approximately +4 °C) as soon as possible (usually within five to ten days) to laboratories of the Institute of Problems of the Industrial Ecology of the North (INEP) of the Kola Research Center, Russian Academy of Sciences, to analyze. pH and conductivity were determined first before the expiration of 48 h. Each water sample was filtered through a membrane filter (0.45 μm pore size). The chemical composition of the waters was analyzed by a unified technique, in compliance with the recommendations in [37,38].
Parameters determined included pH, cations, anions, conductivity, alkalinity, NH4+, PO43−, Si, total N (Ntot), total P (Ptot), and dissolved organic carbon (DOC). pH and conductivity (20 °C) were measured using a Metrohm pH meter, alkalinity using the Gran titration method, and DOC using the Mn oxidation method: DOC = 0.764 XПKMn + 1.55. Base cations (BC), the sum of Ca2+, Mg2+, K+, Na+, were measured using flame atomic absorption spectroscopy (FAAS), and anions (SO42−, Cl−, NO3−) were measured using ion chromatography. Si, Ntot, PO43−, and Ptot were analyzed using spectrophotometric methods.
The acid-neutralizing capacity (ANC) of waters was calculated without correcting the ions for marine salts, by the formula [4]:
ANC = [Ca2+] + [Mg2+] + [Na+] + [K+] + [NH4+] − [SO42−] − [NO3−] − [Cl−]
The concentration of anthropogenic sulfur (SO4*, µeq L−1) was calculated by correcting the total sulfate concentration (SO42−) in the lake water for the removal of marine sulfates. Concentrations of basic cations and anions, alkalinity, and ANC are presented in microequivalents.
Al, Fe, Cu, and Ni were determined using atomic absorption spectroscopy (GFAAS, Perkin-Elmer-5000, Corp., Norwalk, CT, USA) equipped with an HGA-400 graphite furnace and an MHS-10 hydride system. The quality of the analytical results was repeatedly tested by intercomparison within the framework of the International Cooperative Programme on Assessment and Monitoring of Acidification of Rivers and Lakes; for example, [39].
2.3. Statistical Analysis
In our calculations, we used the Statistics 12 program. For each water parameter for the regions and in general, the median was determined, as well as the minimum and maximum values.
To identify the general temperature trend, as well as to assess changes in the main parameters of water chemistry, regression dependences by years and their reliability were calculated. We calculated Kendall Validation Test (SKT) values based on the significance ranking of the identified trend in temperature, precipitation, SO4*, BC, ANC, DOC, Ptot, and Ntot for the entire set of lakes. As a result, we operated on the trend slope.
For the changes in copper smelter effect and different buffer capacities in lake catchments, we analyzed all period (1990–2018) and calculated Kendall’s tests for all region and subregions. This made it possible to check the slopes of parameters in different subregions (statistics of a small sample) and more reliably understand the development or stability of water chemistry (basic parameters).
3. Results
3.1. Main Parameters of Water Chemistry
The principal parameters of water chemistry during the study years are summarized in Table 2. The low salinity and oligotrophic nature of the lakes of the Kola region can be explained by the local bedrock geology and cold climate. Chloride and Na+ were the dominant ions in the tundra and forest tundra lakes and those in northern taiga because of the influence of the Barents and White seas. This marine influence also accounts for the high natural SO42− content of these lakes. However, SO4* of anthropogenic origin was also found in lake waters in the zones impacted by the Pechenganikel and Severonickel facilities, which operate in the Kola Peninsula and emit SO2 to the atmosphere. The broad variations in the chemical composition of the water in these lakes also likely result from the broad variability of the local bedrock geology.
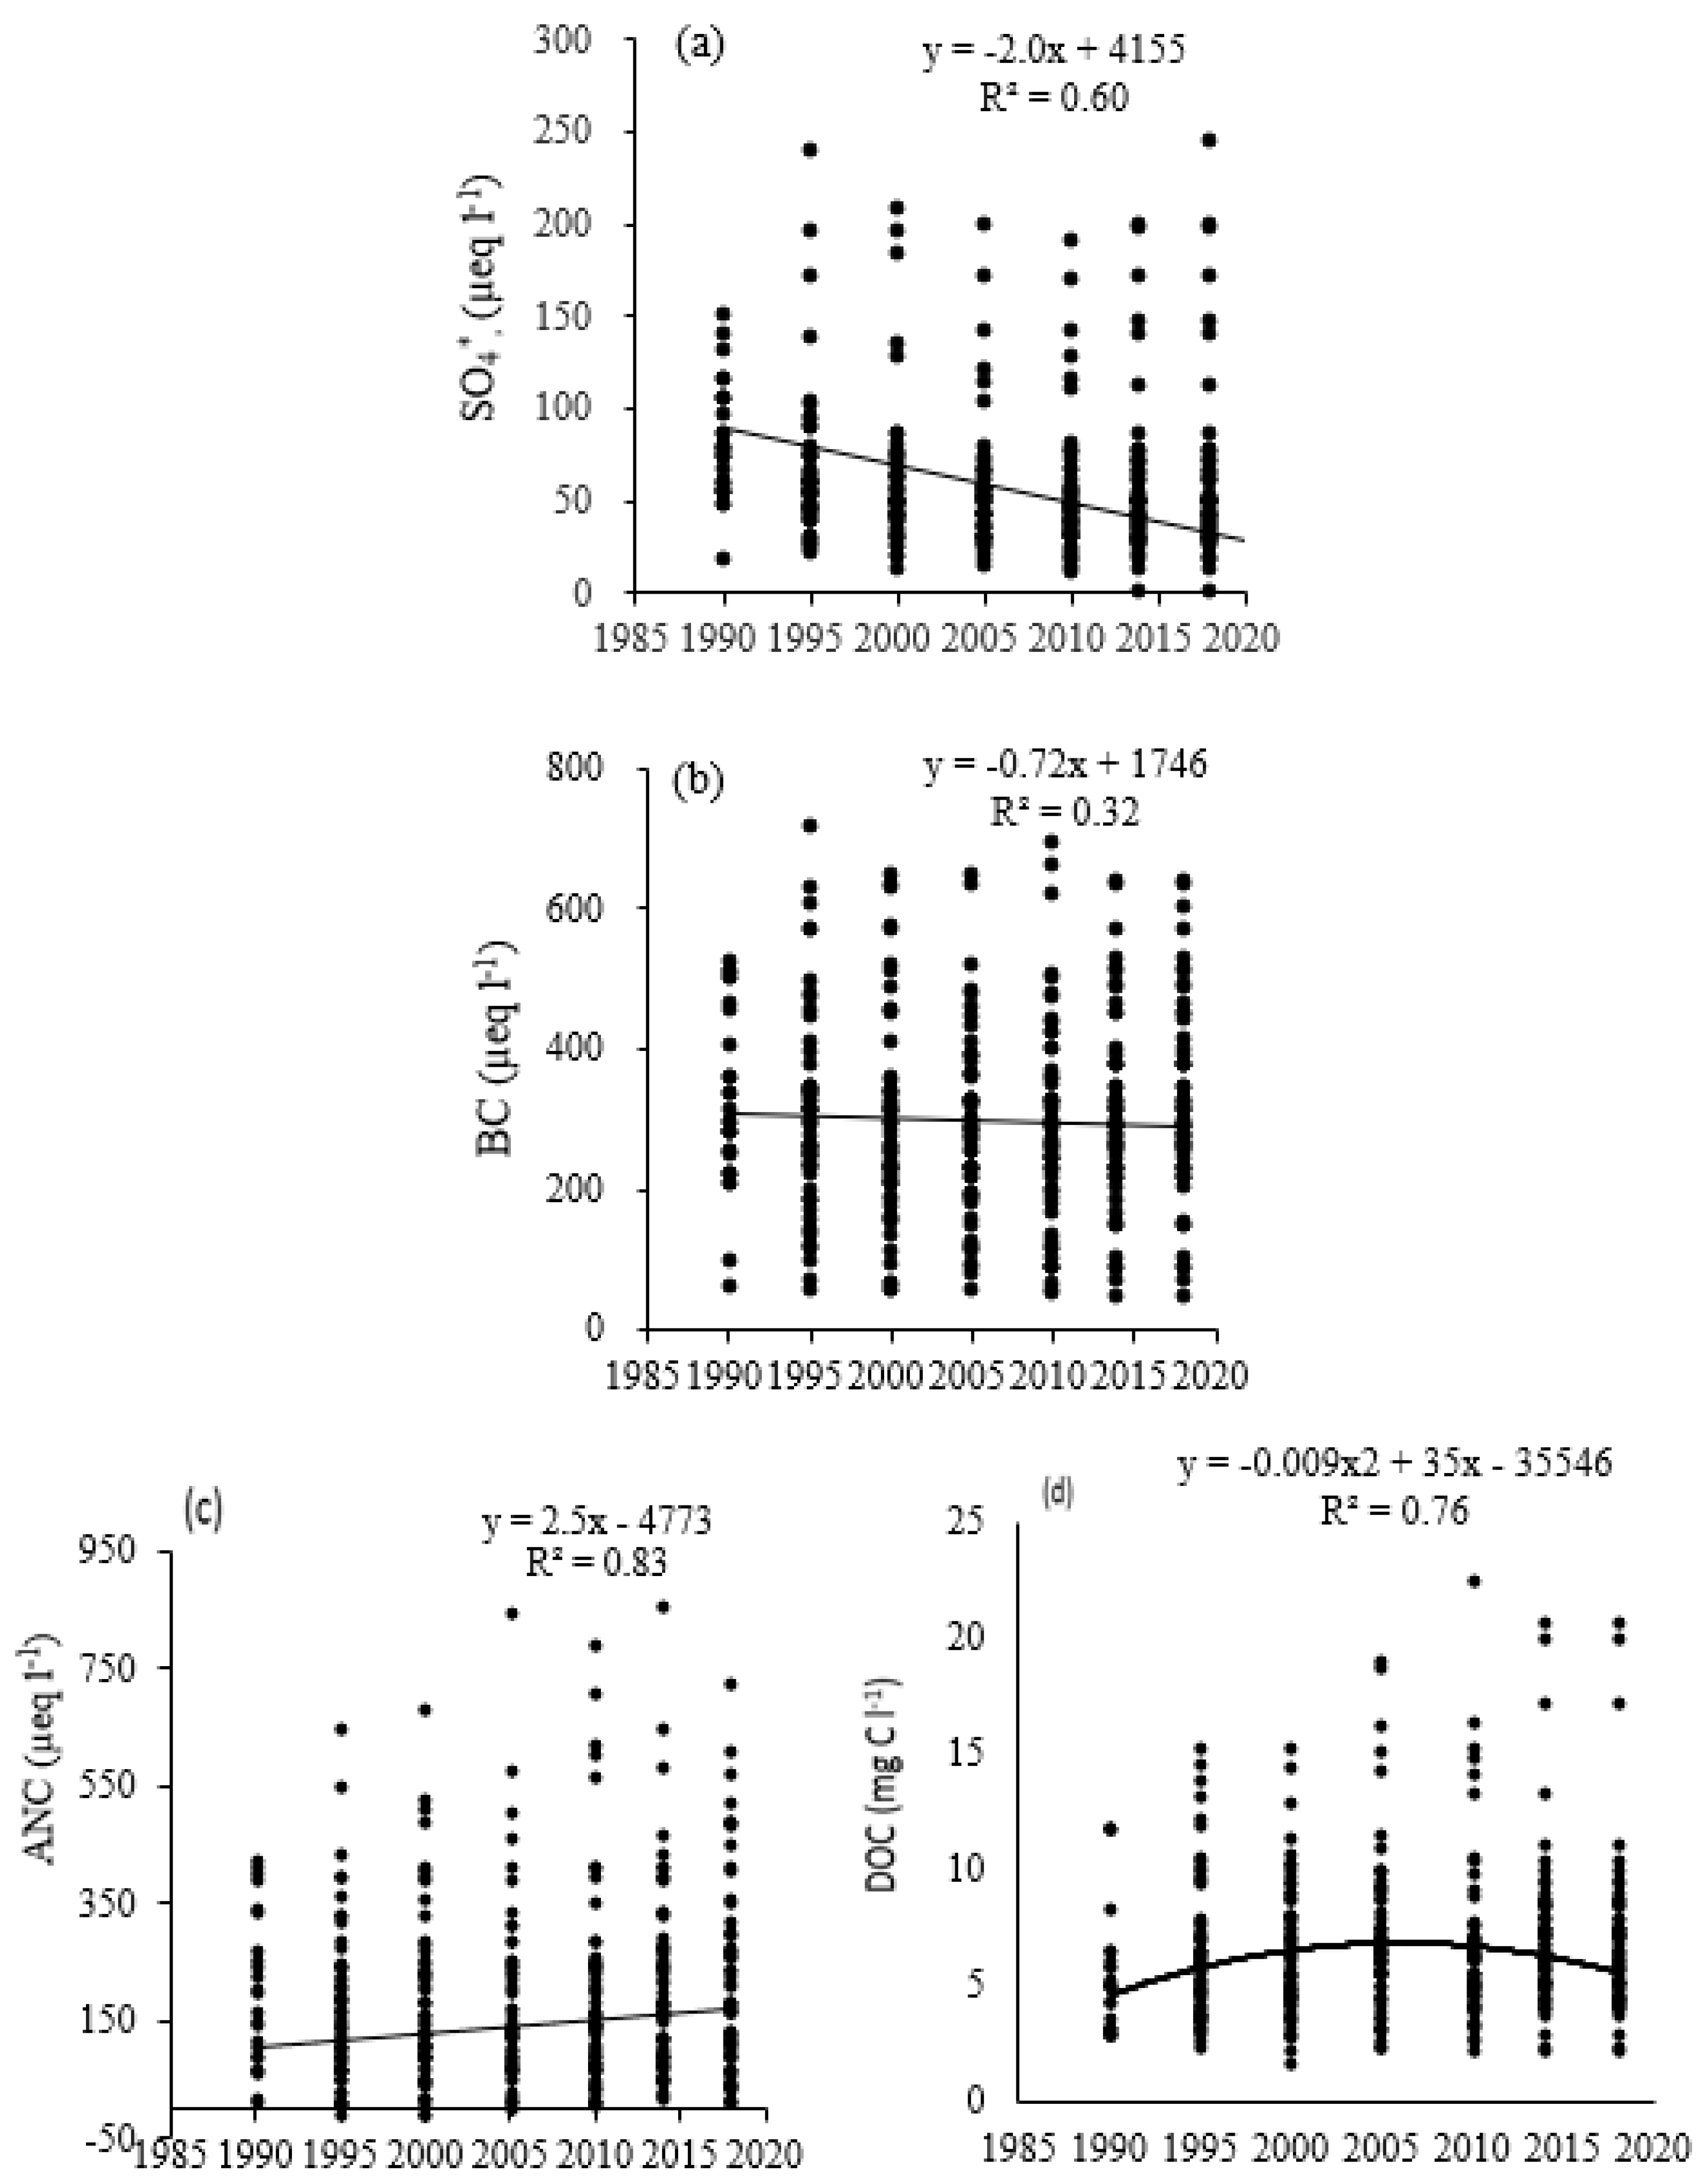
The population of lakes that were studied once every four to five years in 1990–2018 generally shows a sustainable decrease in sulfate concentrations. The reduction in anthropogenic sulfur emissions from Kola smelters resulted in a systematic trend towards a decrease in the concentrations of these sulfates (Figure 3a) in the waters of the lakes. Concentrations of SO4* in the lake waters decreased from 121 to 41 µeq L−1 (median values). In the 1990s, sulfates were dominant anions in the waters of 38% of the lakes, and the percentage of these lakes dropped to 25% in 2010 and 8% in 2018. For all explored lakes over a 28-year period, the reliability of a decrease in SO4* concentrations is confirmed by a reliable nonparametric statistic coefficient of Kendall’s test (SKT = −5.85, p = <0.001).
Concentrations of BC (Figure 3b) in the lake waters showed a heterogeneous trend, which indicates the variability of this parameter depending on the subregions, which will be further discussed in detail. The ANC of the waters increased (Figure 3c) in response to a decrease in the content of SO4*, and there was a significant increase in ANC for all lake populations: SKT = +7.15, p = <0.001 (Figure 3c and Table 3). The concentrations of nitrates are very low, and these compounds do not affect water acidification in the northern Kola. In the Arctic waters of the Kola region, the supplied nitrates are quickly utilized in the production processes of this region; therefore, their concentrations are low in all periods.
It is worth mentioning that the dynamics of DOC (mgC l−1) in the waters of the lakes are ambiguous: the median values systematically increased until 2010 and then decreased during the next eight years (Figure 3d). Because of this, the DOC dynamics are described by the following reliable polynomial dependence: DOC = −0.009x2 + 35x − 35,546, p < 0.05. The dynamics of this parameter will be discussed in more detail below. Nevertheless, the SKT for all studied lakes showed a significant slope of the upward DOC trend, SKT = +2.29, p = <0.05.
The total phosphorus and nitrogen concentrations in lake waters have increased (over the past 28 years), and the concentrations of the bioavailable nutrient species PO43− и NO3− are persistently very low. The total nitrogen concentrations increased from 184 to 304 µN l−1 on average, twofold in the minimum values and 2.5 times in the maximum values (SKT = +2.42, p < 0.01). The values of Ptot were detected to vary more significantly, and their maximum values increase, which likely indicates that the processes proceed differently in different lakes (SKT = +2.74, p < 0.01). The Cu and Ni concentrations were at a maximum in 1990, and the median values then systematically decreased until 2018 as a consequence of diminished atmospheric emissions from Kola smelters.
3.2. Regional Variations in Water Chemistry
With regard to the high natural variability of the water chemistry, lakes selected for detailed analysis were grouped into the following six subareas depending on the distances between the lakes and smelters and on geological and landscape environments in which the composition of the waters is formed (Table 1).
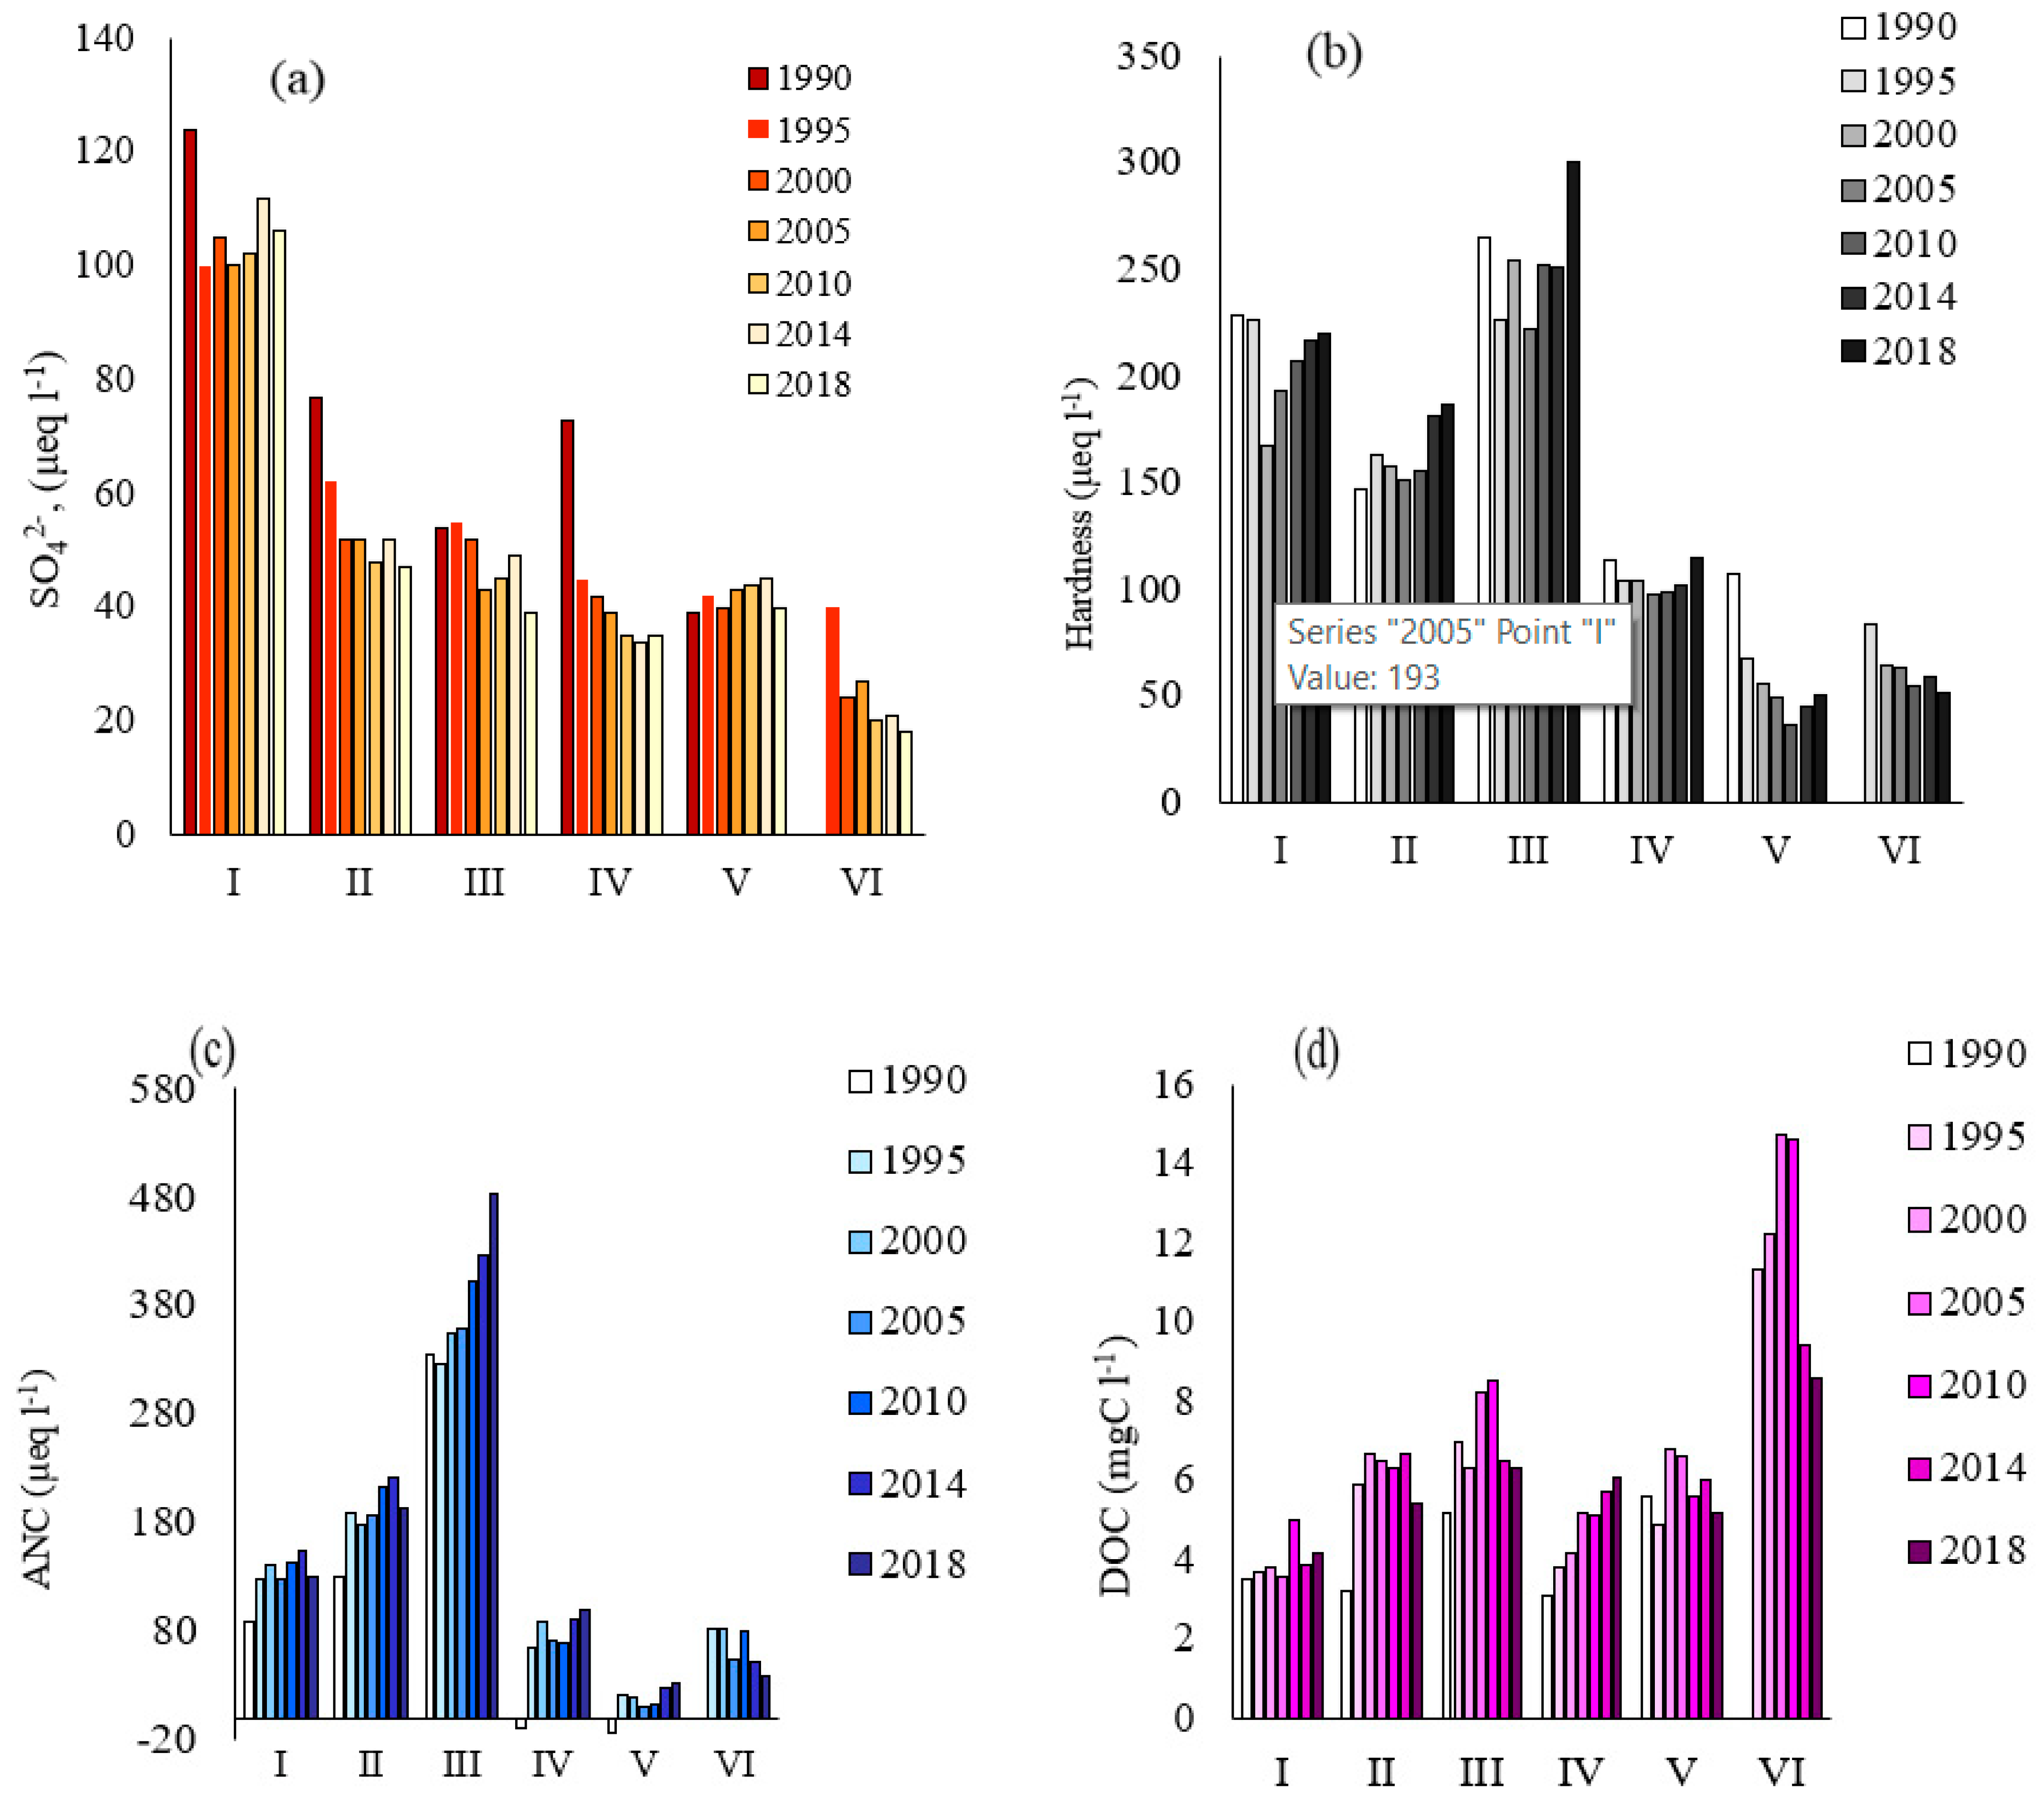
These results indicate that the waters of lakes I, II, and III possess good buffer capacities to neutralize acidic deposition (ANC > 100 µeq L−1), whereas lakes IV and V are acid-sensitive (ANC < 100 µeq L−1). High DOC was found in the waters of lakes in wetland and forested catchment areas (VI). Figure 4 shows how the main parameters varied in the subareas every 4–5 years.
Geologically, areas within 10–15 km around the smelters are made up mostly of mafic and basaltic rocks. Within the local zones impacted by the smelter facilities, the chemical composition of the waters is formed under the effect of emissions not only of sulfur dioxide but also of industrial dust. When the dust dissolves, basic cations are transferred into the waters and alkalinize them. Moreover, bedrock in the zone assists in neutralizing acidic precipitation; hence, the lakes have high ANC. Their waters contain the highest concentrations of sulfates, and these concentrations do not significantly decrease (Figure 4a): their concentration decreased as little as by 15–20% from 1990 to 2005 at a more than threefold decline in SO2 atmospheric emissions from the Kola smelters during the same period. Obviously, sulfates accumulated in the catchment area for more than seven decades when the smelters actively operated continued to migrate into the lakes and maintain high sulfate concentrations in their waters.
The decrease in sulfate concentrations is more significant in subareas II and III at distances of 100–150 km from the smelters. The highest ANCs are typical of the waters of lakes whose catchment basins consist of alkaline rocks of the Khibina and Lovozero alkaline massifs (III, Figure 4b). Because of the high buffer capacities of these rocks (nepheline syenites), the lake waters in this zone are rich in basic cations.
At distances greater than 150–200 km from the smelters (IV and V), the waters of lakes have low hardness, and these lakes are highly susceptible to acidification (see above). The rocks underlying these lakes are granite (IV) and quartz sands (V). A decrease in sulfate concentrations occurred in the lake waters of subarea IV. The response of the ANC of these waters manifested itself by 1995, when the sulfate concentrations decreased, and negative ANC values were single (Figure 4c).
An interesting variability dynamic was found in the forested and bogged catchment areas at a distance of more 200 km from the smelters (VI). In the forest lakes, whose bedrock is sandy quartzites, the concentrations of cations, pH, and ANC decrease. Lakes under these conditions are characterized by statistically significant dynamics of an increase in DOC concentrations until 2010 and the opposite tendency during the next eight years (Figure 4d). The decline in the supply of cations to the waters coincides with the tendency towards a decrease in the sulfate concentrations. A brief analysis of tendencies in the variations in the water chemical parameters in the distinguished subareas shows significant differences between the responses of the waters of the Arctic lakes to a decrease in the influx of sulfates to their catchment areas.
We separately considered the changes in SKT for the zone of emissions from copper-nickel production (lakes around smelters-I subarea) with good buffer capacity (II + III subareas), acid sensitivity (IV and V subareas), and forested and waterlogged-VI subareas (Table 3).
Calculations showed a significant decrease in SO4* for all lakes as a response to the decrease in SO2 emissions from the Kola smelters.
In subregion I (industrial zone), for all indicators, except for Ntot (SKT = 5.02, p < 0.001), the trends are heterogeneous because, for a long period, there was an uneven increase or decrease in the indicators under consideration. In subregions with a high buffer capacity (sustainable), on the background of a reliable trend in the decrease in SO4* (SKT = −4.03, p < 0.001), lakes are recovering, which is expressed in an increase in hardness, ANC, and DOC. Increases in Ntot and Ptot concentrations are associated with a high degree of forestedness. In acid-sensitive subregions (IV and V), the process of lake recovery occurs with a delay, namely, against the background of a decrease in SO4* (SKT = −2.61, p < 0.01), there is a significant downward trend in the hardness (SKT = −2.25, p < 0.05). On the other hand, there is an increase in the ANC, DOC, and Ntot. In forested and waterlogged landscapes (subregion VI), the trends of SO4*, BC, ANC, and DOC are heterogeneous. However, for Ntot and Ptot, significant slopes were noted due to the high proportion of boggy and forested areas typical for this subregion (Table 1). The increase in the DOC content was traced both in the stable regions and in the vulnerable acids (for all lakes, SKT had a significant slope of the DOC increase, SKT = +2.29, p < 0.05).
3.3. Climatic Changes
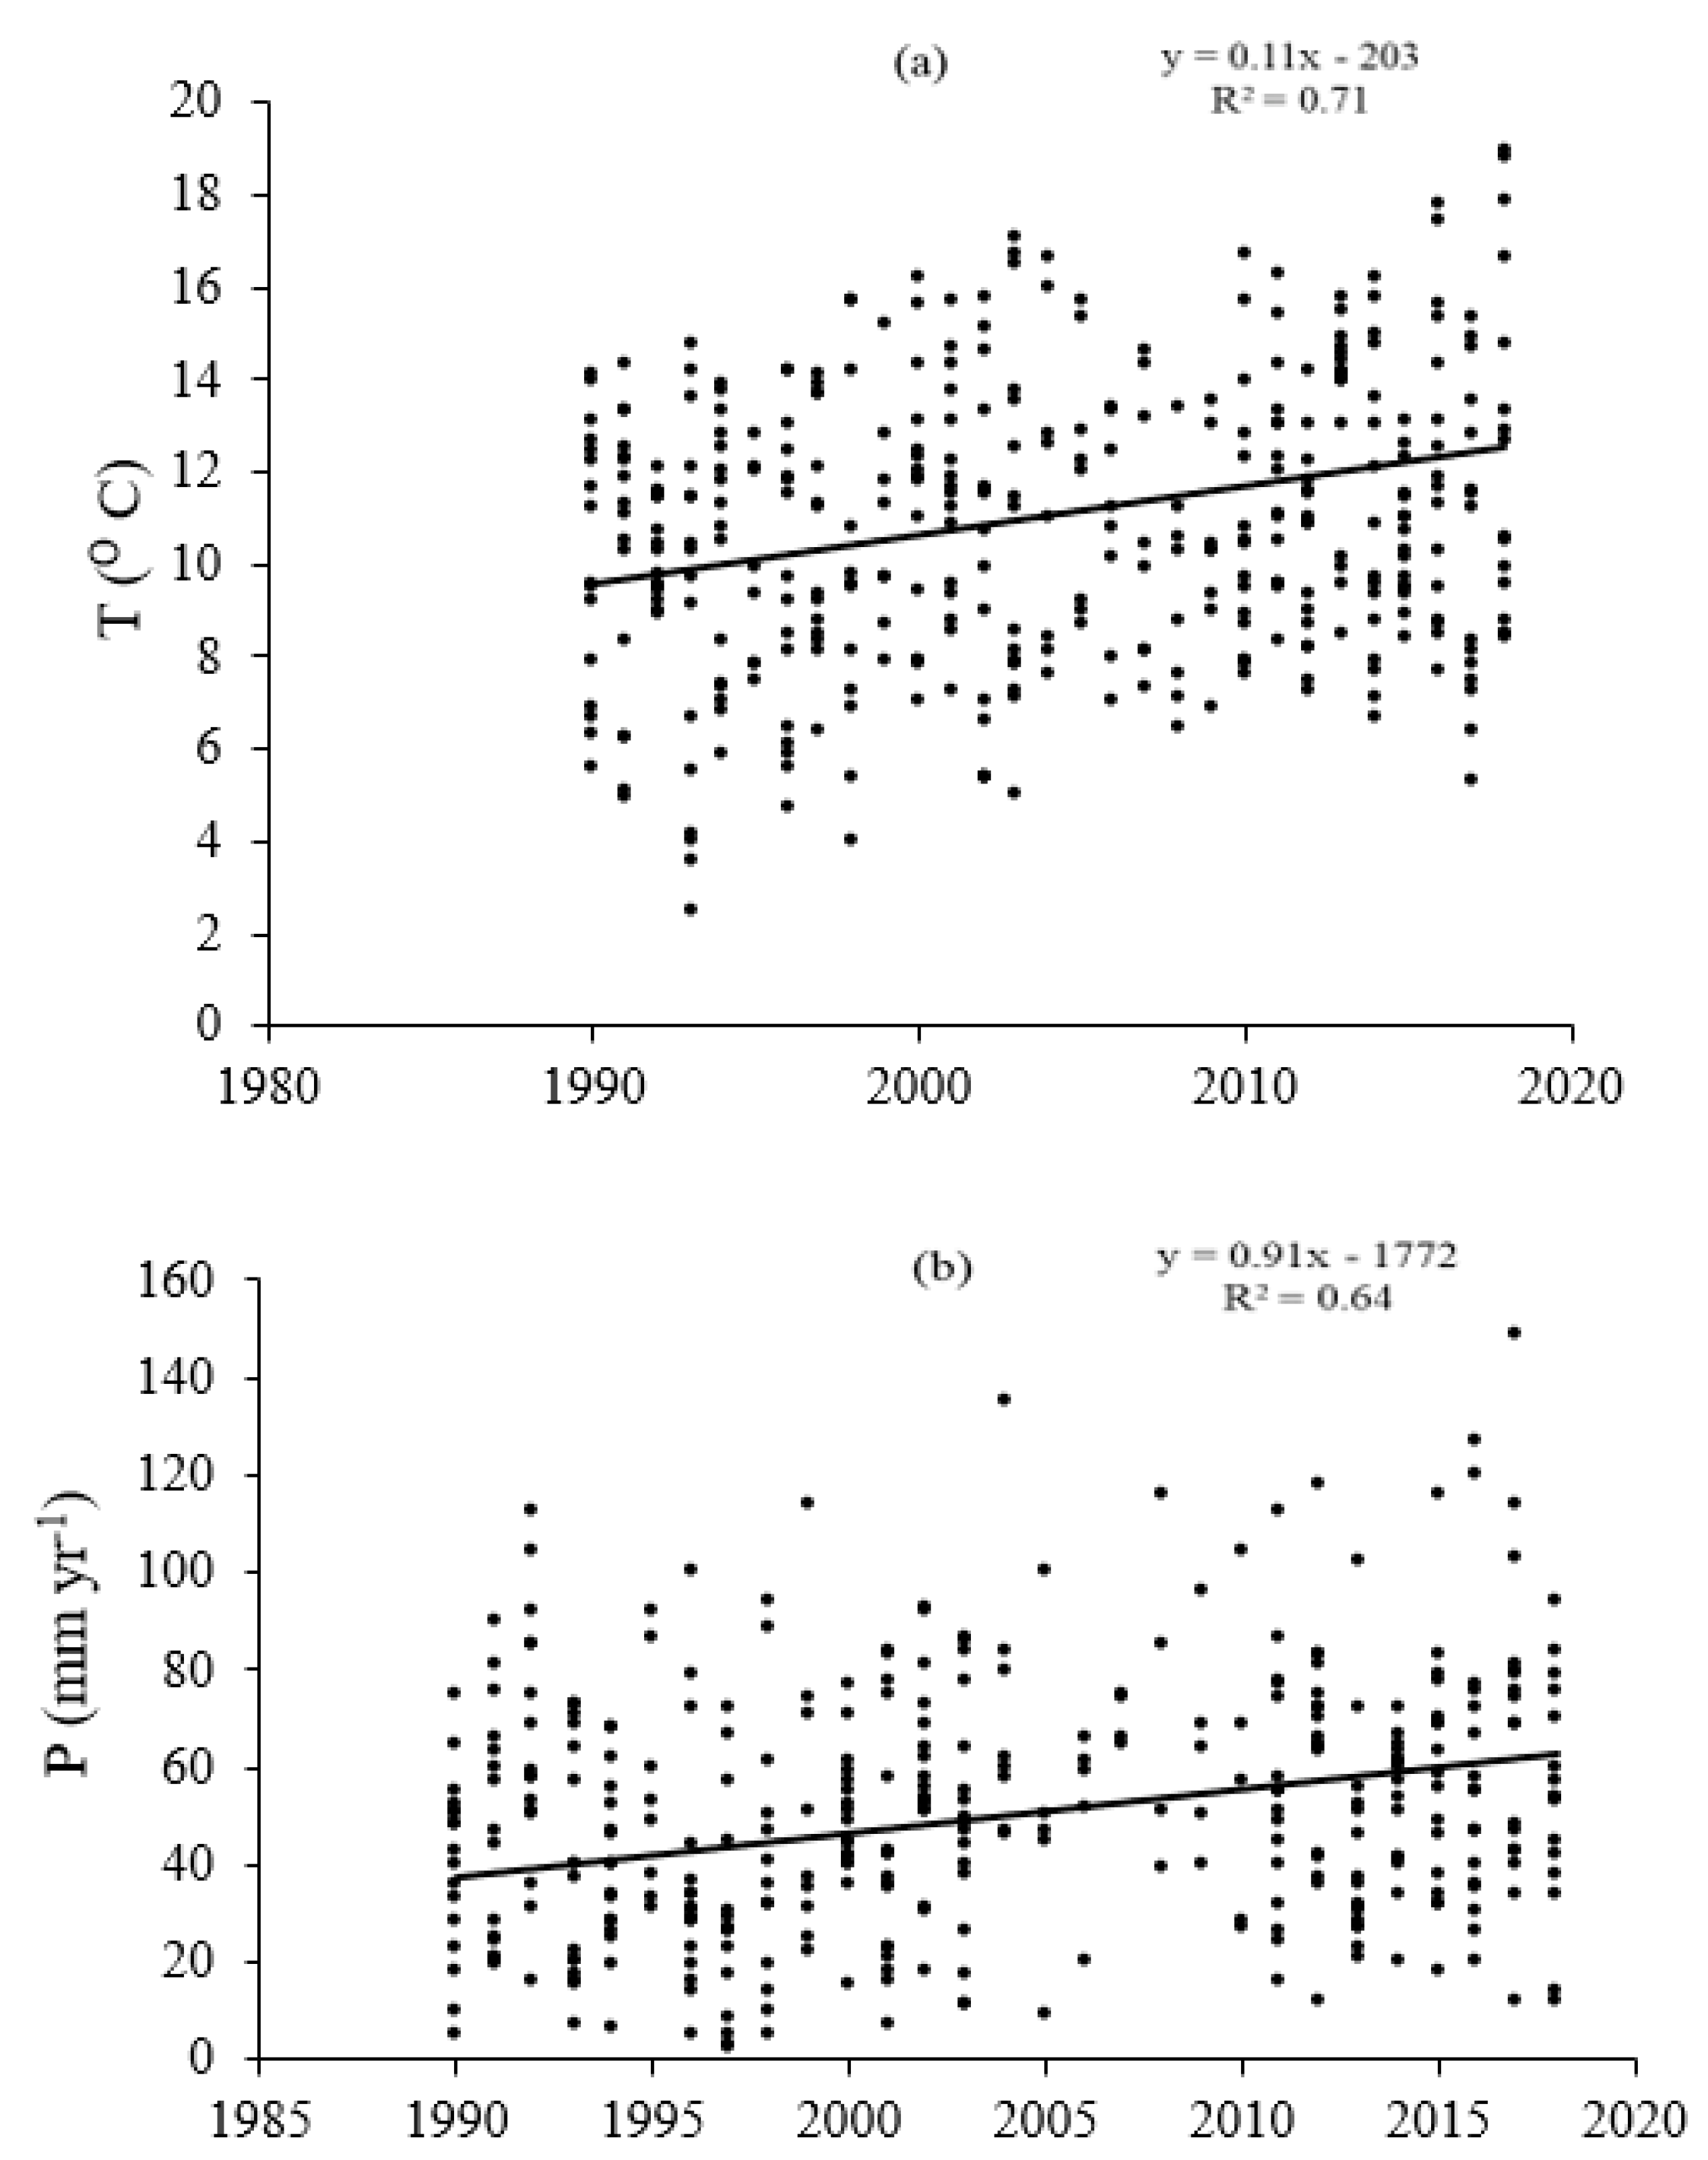
The occurrence of the study areas north of the Arctic Circle predetermines their climatic characteristics. The Kola region is characterized by low average annual air temperatures (−1 °C) and high amounts of atmospheric precipitation (up to 800 mm × yr−1) [32]. To estimate the climate variations, we utilized available data on air temperatures and precipitation during the monitoring period of 28 years [40]. It should be noted that data on the measurement of climatic parameters were extremely limited. To obtain data on monthly temperature and precipitation values, we used the average monthly air temperatures during the open-water period (June, July, August, and September) at four sites: in the northwestern part of the area, in its northern part (on the Barents Sea shore), in its central part (watershed between the peninsula itself and the mainland part of the Baltic crystalline shield), and in the southern part of the Kola Peninsula (on the shore of the White Sea). Data from these stations of meteorological observations reflect the general trend of changes in precipitation and temperature in the study region in the summer–autumn. Figure 5a presents the average monthly air temperatures during the open-water periods in 1990 through 2018. Although the temperatures vary widely, they obviously tend to increase air temperature during the open-water period. Along with the temperature increase, the amount of atmospheric precipitation also significantly increased (Figure 5b). Both of these parameters reflect a significant positive slope of the temperature and precipitation trend: SKT = +4.71, p < 0.001 and = +2.71, p < 0.01, respectively.
4. Discussion
4.1. Response of Anthropogenic Sulfates, ANC, and Basic Cations
The most obvious tendency in the Kola region is a decline in the emissions of anthropogenic sulfates (SO4*) and the recovery of ANC, both characterized by statistically significant trends over the past 28 years for all lake populations as a whole and subareas II–III (Table 3). Additionally, the ANC of some lakes has not changed or even continued to decrease, particularly in the acid-sensitive and wetland catchment areas (IV–VI). Such processes explain the very slow recovery in time as the influx of accumulated sulfates in the soils of the catchment area, as well as the depletion of soils by exchangeable bases [8,12,15,16].
It has been demonstrated that the response of water chemistry to the decline in sulfate depositions by 2010 is ambiguous: acidification processes continued in 24% of the lakes; recovery was identified in 40% of the lakes, and 30% of these lakes did not exhibit any discernible response to the decline in SO2 emissions [28].
Studies of long-term tendencies in the northeastern and southeastern U.S. show that some lakes also do not show evidence of their ANC recovery because of the effects of some accompanying factors: a decline in the depositions of basic cations, an increase in the concentration of DOC, a decrease in the influx of basic cations from depleted soils on the catchment areas, and the release of sulfates accumulated in the soils during long-lasting periods of intense loads on them [8,17,41,42].
Soil saturation in cations at the catchment plays a pivotal role in the recovery processes. The soils in the Arctic regions are thin; in acid-sensitive regions, the catchments of the lakes are characterized by a thin soil layer that is well washed out by atmospheric precipitation [32]. An important watershed factor limiting ANC recovery is the SO42− adsorption capacity of soils [43]. However, in the Arctic regions, a high leaching regime due to heavy rainfall and thin soil cover reduces the accumulation of SO42− in the soils of the catchment area. In our studies of Arctic lakes, it is possible that the key factor is the depletion of soils by exchangeable bases because of a long period of the influence of acid deposition.
The depletion of the catchment areas in exchangeable cations reduces the ability of the catchment soil to neutralize acidic depositions. It is interesting to more closely analyze how water hardness responded to the emission dynamics during the observation period in the subareas of the northern Kola Peninsula. By 1990–2018, the concentrations of cations (Ca + Mg) had decreased, particularly in the acid-sensitive areas (IV–V), which was similar to what occurred in Scandinavia and northeastern America [8]. This may partly explain why the anticipated recovery, for example, ANC enhancement, is slower in some of the lakes and continues to slow down.
Water hardness increased during the following years in most of the subareas (Table 3). The increase in water hardness in the lakes of subareas I–III can be attributed to the more intense effect of dust spreading around rock dumps and dump tailings after ore processing of mining industrial rather than being attributed to the recovery of the catchments after acid deposition on them. The Kola Peninsula is characterized by a well-developed mining and ore processing infrastructure and related dumps and tailings, which are sources of dust in summertime. The contents of Ca in atmospheric depositions in the northern Kola Peninsula systematically increase [35]. The increase in the Ca content and the high concentrations of hydrocarbonates in the precipitation may be indicative of a high dust content in the air. Rogora et al. [44] pointed out that dust transport from the Sahara Desert induced alkaline depositions in lakes in the Alps. On the Kola Peninsula, dust spreads from waste dumps of ore processing facilities, and this is particularly typical of subareas I–III (Figure 1). Additionally, we cannot rule out the possible effects of climatic factors, such as a temperature increase and, particularly, the more intense drainage of the lakes as a consequence of the regional increase in temperature.
4.2. DOC and Nutrients
Temporal increases in DOC have been referred to as “brownification”, which describes the yellow-brown color caused by dissolved humid matter from terrestrial and wetland areas that is characteristic of DOC-rich lakes [11]. Additionally, some recent publications present evidence that climatic factors also facilitate increasing organic matter contents in lake and river waters [16,20,45,46]. Dissolved organic compounds act similarly to organic acids with specific functional groups of both strong and weak acids [41,47]. The increasing inflow of DOC with strong acid functional groups acidifies the waters and counterbalances the potential ANC increase [48]. Data on waters in West Siberia indicate that humic acids in the waters operate mostly as strong acids, which are able to strengthen water acidification by producing protons when dissociating, with this process catalyzed by strong anthropogenic acids [26]. An increase in the contents of organic matter was also found in lake waters in the northern Kola Peninsula until 2010, particularly in forested and wetland territories (subregions III, V, and VI). After 2010, the DOC content in lake waters remained unchanged or decreased. The dynamics of organic matter contents in the subareas show a tendency towards an increase only in the tundra area on the shores of the Barents Sea (subarea IV).
A significant SKT slope of the DOC increase was revealed for all lakes (SKT = +2.29, p < 0.05) and for stable regions and acid-sensitive subarea regions (Table 3). Additionally, for wetland and forest watersheds, the trend is heterogeneous or characterizes a decrease in DOC, such as in forest and wetland areas. Active vegetation in a catchment can reduce the inflow of allochthonous organic matter from catchments during climate warming.
It is difficult to identify the factors responsible for the DOC increase because of conjugated signals of climate change and recovery from acidification. Along with the influence of the chemical composition of the depositions, which affect the DOC inflow, extensive evidence reportedly indicates that climatic factors are favorable for DOC variability [19,20,49].
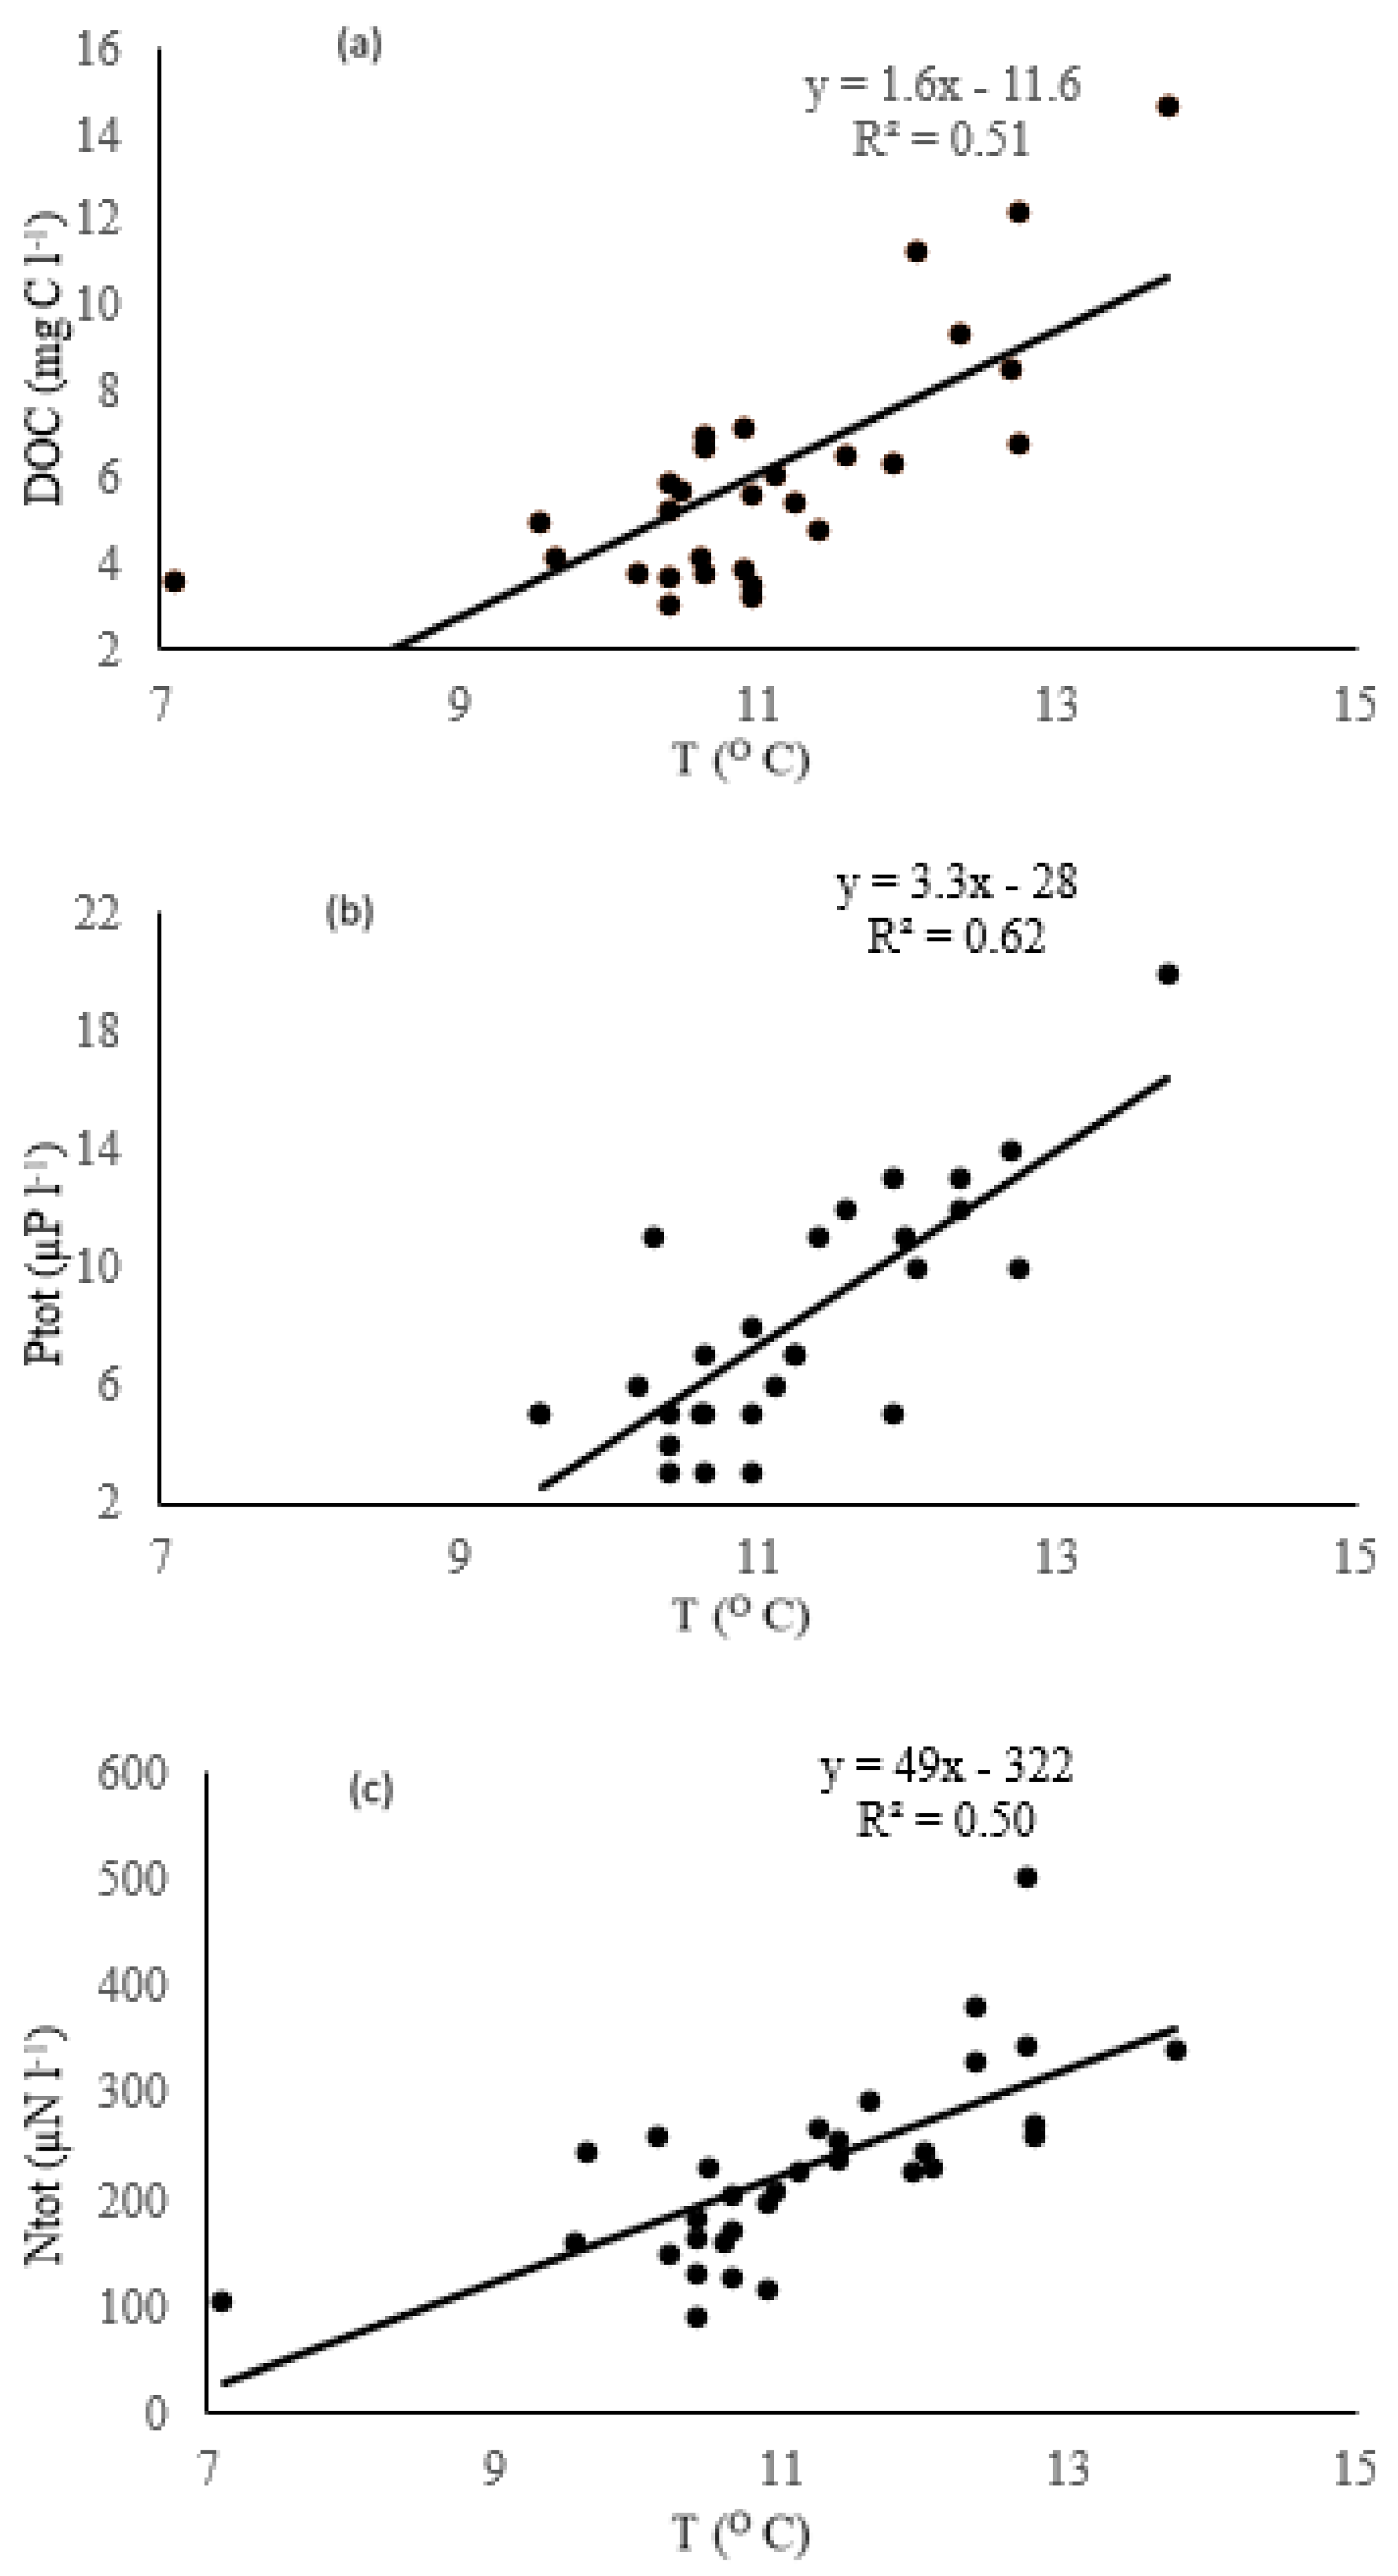
Climate warming affects biogeochemical processes in catchments and in water bodies. Bioavailable nutrients (PO43− and NO3−) are possibly actively utilized in the production processes by terrestrial plants in both catchment areas and lakes. Simultaneously, Ntot and Ptot concentrations increase, with Ntot and Ptot able to be both formed in water bodies and transported from the catchments, together with DOC. The synchronous increase in DOC and nutrients in the subareas and on a yearly basis was confirmed by correlations between DOC and Ptot (r = 0.68, n = 29, p < 0.01) and between DOC and Ntot (r = 0.60, n = 29, p < 0.05). Our data show significant correlations of DOC, Ptot, and Ntot in the waters with the temperature variations (Figure 6a–c). Low levels of bioavailable nutrients (NO3− and PO43−) from year to year with a significant increase in Ptot and Ntot indicate that bioavailable forms are successfully utilized in ecosystem processes and that organic matter contents in these ecosystems increase. DOC export from catchments reportedly [50] increases when washing at these catchments intensifies, which can also supply Ptot and Ntot. A ubiquitous increase in phosphorus and in the trophic status of lakes in the U.S. was reported in [14] and was typically observed in the northern Kola Peninsula.
4.3. Effect of the Climate on the Evolution of the Lakes
The interplay of multiple geochemical, biological, and climatic interactions makes it difficult to identify the principal responses of the water chemistry of the lakes to a decrease in anthropogenic sulfur deposition. A number of generalized reviews [20,41,45,51,52] demonstrate how the water chemistry of lakes changes in response to the decline in acidic precipitation over the past two to three decades. These authors note the difficulty of identifying the leading factor for changes in water chemistry. Tendencies in ANC recovery after acidification are associated with an increase in the concentrations of DOC in lakes, as was found across the eastern territory of the U.S., Canada, and Northern Europe. Many surface waters have shown a compensatory DOC increase in lake and river waters in response to a reduction in acid deposits and/or climate changes [11,15,41,52].
A temperature increase was registered at most of the northeastern U.S., particularly starting in the 1980s, and an increase in atmospheric precipitation in summertime [52,53]. Similar tendencies were also detected in the northern Kola Peninsula over the past 28 years: both a temperature increase and an increase in precipitation (Figure 5a,b). The average monthly air temperature for 28 years increased by 1.5–2.0 °C, which is consistent with the data of Grouza and Rankova [54], who determined that the temperature increases in the northwestern region of Russia every 10 years by 0.53 °C. Our data show an increase in temperature in the Kola Arctic region in the summer–autumn period: the average temperature in 1990 was 9.2 °C, and then in 2018, it became 12.3 °C.
A decrease in acid depositions in catchments and a temperature increase may have an integrated impact on some ecosystems [20,41,45]. Watmough et al. [21] noted impediments to recovery from acid deposition at a significant (for more than 70%) decline in the deposition of sulfates and nitrates in the catchments. Persistent water acidification is reportedly explained by biogeochemical processes in waterbody wetlands under the effect of climate variations. Vegetation activated in a warmer climate should more actively consume nutrients and transform DOC [20].
Our data indicate that the current transformations of lakes proceed simultaneously with climate change. In the absence of data on the natural DOC concentrations before the onset of anthropogenic acidification induced by SO4*, it remains uncertain as to whether the increase in the DOC concentrations over the past decades is explained by the return to a normal state or by whether the biogeochemical cycle has evolved into a new state in response to anthropogenic impacts, such as acid depositions and climate changes. Houle et al. [22] suggested that the improvements in the state of 47 lakes in Quebec cannot be explained solely by the reduction of the SO4* depositions and that climate changes also play an important role. A higher annual T positively correlates with the alkalinity and pH of the lakes, which enhances the ANC of the lakes. Analogous data on the influence of temperature on water chemistry were registered at lakes in the Alps in Europe [55].
According to our study, the hypothesis that climate is the most influential factor is confirmed by the increase in concentrations of nutrients (Ntot and Ptot) at an increase in their total contents at stable concentrations of bioavailable NO3 and PO43−, which are rapidly utilized in production processes in ecosystems. The dependence for the whole area over the 28 years of observations is as follows:
where T is the average temperature for the period of open water (June, July, August, September) at four observation stations in the Kola North. The activation of vegetation in a warmer climate is favorable for the consumption of bioavailable nutrients and DOC transformations [14,41]. An increase in the productivity of the lakes may result in autochthonous organic matter and in the stimulation of production processes in the warmer climate.
DOC (mgC L−1) = 2.3 × T (°C) − 17 (r = 0.62, n = 75, p < 0.001)
A number of general biogeochemical criteria for the process of water eutrophication can be distinguished: an increase in the concentration of nutrients; an increase in the concentration of suspended solids of organic nature and decrease in transparency; a decrease in the concentration of dissolved oxygen in the hypolimnion; and intensive development and successive change of algae populations. In the Moiseenko, Sharov review [56] on the example of large lake Imandra of the Kola North, polluted by domestic or agricultural waste, it was shown that eutrophication is manifested by “blooming” of water due to the intensive development of phytoplankton during the peak of spring (April) and summer (end of July-beginning of August) growing season to values corresponding to eutrophic and hypertrophic levels-1–5 thousand cells/m3.
In view of the aforementioned results, the term recovery does not adequately reflect processes in lakes in the Kola Subarctic. An illustration of the development of lakes over the past 28 years is shown in Figure 7. The small lakes irreversibly evolve and are characterized by different variabilities, which are controlled by two factors: a reduction in the inflow of strong acid depositions and climate warming.
5. Conclusions
Although the term recovery is currently widely applied, it does not adequately characterize processes that occurred in mainland water bodies in the northern Kola Peninsula during the past 28 years. The decline in metal and sulfur dioxide emissions from Kola copper–nickel smelting facilities generally resulted in beneficial trends in the chemistry of local water bodies. Retrospective analysis of changes in the chemical composition of lake waters that are not directly impacted by any factors led us to detect significant decreases in concentrations of anthropogenic sulfates and metals over the past two decades in lake waters and a tendency towards the recovery of their ANC. However, the ANC of some of the lakes remains at a critical level, particularly in acid-sensitive subareas. This provides evidence that water acidification continues.
DOC increased in the water of the Kola region until 2010, and the process stabilized over the past eight years. This process was due to two factors: (i) a decrease in the inflow of strong acids and (ii) the effect of climate warming. Along with an increase in the DOC concentrations, the concentrations of nutrients (Ntot and Ptot) also systematically increase simultaneously with the temperature increase. This phenomenon may be explained not only by the inflow of humic acids from the catchment areas but also by the generation of autochthonous organic matter by the eutrophication of lakes. This phenomenon may be accounted for by an increase in the trophic status of the lake in response to the regional temperature increase.
The analysis of the variability of water chemistry during the long observation period indicates that a reduction in acid depositions in the catchment areas and climate warming trigger a chain of biogeochemical processes in the catchments and in the water bodies themselves. Analysis of our and literature data shows how the lakes evolve. This evolution variably manifests itself in changes in the cation–anion composition of the waters, the flows and structure of humic acids, and the cycles of biogenic elements. A disputable issue is whether lakes can recover to their original natural parameters. We believe that biogeochemical cycles will also be able to variably change later, and no return to the original parameters is possible under continuing climate warming and varying anthropogenic loads, which can now increase or decrease.
Author Contributions
Conceptualization, T.I.M.; investigation, N.A.G.; methodology, T.I.M. and N.A.G.; project administration, T.I.M.; software, M.M.B.; visualization, M.M.B. All authors have read and agreed to the published version of the manuscript.
Funding
The work was supported by grants from the Russian Fund for Fundamental Investigation (Grant 22-1700061/22).
Institutional Review Board Statement
Not applicable.
Informed Consent Statement
Not applicable.
Data Availability Statement
Not applicable.
Acknowledgments
The authors are grateful to Kudryavtseva L.P. for performing analytical work in these studies.
Conflicts of Interest
The authors declare no conflict of interest.
References
- Brakke, D.F.; Landers, D.H. Chemical and Physical Characteristics of Lakes in the Northeastern United States. Environ. Sci. Technol. 1988, 222, 155–163. [Google Scholar] [CrossRef] [PubMed]
- Evans, C.D.; Cullen, J.M.; Alewell, C.; Kopacek, J.; Marchetto, A.; Moldan, F.; Prechtel, A.; Rogora, M. Recovery from acidification in European surface waters. Hydrol. Earth Syst. Sci. 2001, 5, 283–298. [Google Scholar] [CrossRef]
- Galloway, J.N. Acid deposition: Perspectives in time and space. Water Air Soil Pollut. 1995, 85, 15–24. [Google Scholar] [CrossRef]
- Henriksen, A.; Kämäri, I.; Posh, M.; Wilander, A. Critical loads of acidity: Nordic surface waters. AMBIO 1992, 21, 356–363. [Google Scholar]
- Jeffries, D.S. Canadian Acid Rain Assessment, Aquatic Effects; Authority of the Minister of Environment: Burlington, ON, Canada, 1997; p. 270. [Google Scholar]
- Kuylenstierna, J.C.I.; Rodhe, M.; Cinderby, S.; Hicks, K. Acidification in developing countries: Ecosystem sensitivity and the critical load approach on a global scale. AMBIO 2001, 30, 20–28. [Google Scholar] [CrossRef] [PubMed]
- Reuss, J.O.; Cosby, B.J.; Wright, R.F. Chemical processes governing soil and water acidification. Nature 1987, 329, 27–32. [Google Scholar] [CrossRef]
- Stoddard, J.L.; Jeffries, D.S.; Lukewille, A.; Clair, T.A.; Dillon, P.J.; Driscoll, C.T.; Forsius, M. Regional trends in aquatic recovery from acidification in North America and Europe. Nature 1999, 401, 575–578. [Google Scholar] [CrossRef]
- Kvaeven, B.; Ulstein, M.J.; Skjelkvåle, B.L. ICP Waters—An international program for surface water monitoring. Water Air Soil Pollut. 2001, 130, 775–780. [Google Scholar] [CrossRef]
- Clair, T.A.; Dennis, I.F.; Vet, R. Water chemistry and dissolved organic carbon trends in lakes from Canada's Atlantic Provinces: No recovery from acidification measured after 25 years of lake monitoring. J. Fish. Aquat. Sci. 2011, 68, 663–674. [Google Scholar] [CrossRef]
- Monteith, D.T.; Stoddard, J.L.; Evans, C.D.; de Wit, H.A.; Forsius, M.; Høgåsen, T.; Wilander, A.; Skjelkvåle, B.L.; Jeffries, D.S.; Vuorenmaa, J.; et al. Dissolved organic carbon trends resulting from changes in atmospheric deposition chemistry. Nature 2007, 450, 537–539. [Google Scholar] [CrossRef] [PubMed]
- Skjelkvåle, B.L.; Stoddard, J.L.; Andersen, T. Trends in surface water acidification in Europe and North America (1989–1998). Water Air Soil Pollut. 2001, 130, 787–792. [Google Scholar] [CrossRef]
- Skjelkvåle, B.L.; Stoddard, J.L.; Jeffries, D.S.; Torseth, K.; Hogasen, T.J.; Bowmane, J.; Manniof, J.; Monteithg, D.T.; Moselloh, R.; Rogorah, M.; et al. Regional scale evidence for improvements in surface water chemistry 1990–2001. Environ. Pollut. 2005, 137, 165–176. [Google Scholar] [CrossRef] [PubMed] [Green Version]
- Stoddard, J.L.; Van, Sickle, J.; Herlihy, A.T.; Brahney, J.; Paulsen, S.; Peck, D.V.; Mitchell, R.; Pollard, A.I. Continental-scale increase in lake and stream phosphorus: Are oligotrophic systems disappearing in the United States? Environ. Sci. Technol. 2016, 50, 3409–3415. [Google Scholar] [CrossRef] [PubMed] [Green Version]
- Strock, K.E.; Nelson, S.J.; Kahl, J.S.; Saros, J.E.; McDowell, W.H. Decadal trends reveal recent acceleration in the rate of recovery from acidification in the northeastern U.S. Environ. Sci. Technol. 2014, 48, 4681–4689. [Google Scholar] [CrossRef] [PubMed]
- Strock, K.E.; Theodore, N.; Gawley, W.G.; Ellsworth, A.C.; Saros, J.E. Increasing dissolved organic carbon concentrations in northern boreal lakes: Implications for lake water transparency and thermal structure. J. Geophys. Res. Biogeosci. 2017, 122, 1022–1035. [Google Scholar] [CrossRef]
- Driscoll, C.T.; Driscoll, K.M.; Roy, K.M.; Mitchell, M.J. Chemical response of lakes in the Adirondack Region of New York to declines in acidic deposition. Environ. Sci. Technol. 2003, 37, 2036–2042. [Google Scholar] [CrossRef] [Green Version]
- AR5 Synthesis Report: Climate Change. 2014. Available online: https://www.ipcc.ch/report/ar5/syr/ (accessed on 3 October 2022).
- Clark, J.M.; Bottrell, S.H.; Evans, C.D.; Monteith, D.T.; Bartlett, R.; Rose, R.; Newton, R.J.; Chapman, P.J. The importance of the relationship between scale and process in understanding long-term DOC dynamics. Sci. Total Environ. 2010, 408, 2768. [Google Scholar] [CrossRef]
- Gavin, A.L.; Nelson, S.J.; Klemmer, A.J.; Fernandez, I.J.; Strock, K.E.; McDowell, W.H. Acidification and climate linkages to increased dissolved organic carbon in high elevation lakes. Water Resour. Res. 2018, 54, 5187–5877. [Google Scholar]
- Watmough, S.A.; Eimers, C.; Baker, S. Impediments to recovery from acid deposition. Atmos. Environ. 2016, 146, 15–27. [Google Scholar]
- Houle, D.; Couture, S.; Gagnon, C. Relative role of decreasing precipitation sulfate and climate on recent lake recovery. Global Biogeochem. Cycles 2010, 24, 4029. [Google Scholar] [CrossRef]
- Corman, J.R.; Bertolet, B.L.; Casson, N.J.; Sebestyen, S.D.; Kolka, R.K.; Stanley, E.H. Nitrogen and phosphorus loads to temperate seepage lakes associated with allochthonous dissolved organic carbon loads. Geophys. Res. Let. 2018, 45, 5481–5490. [Google Scholar] [CrossRef]
- Komov, V.T.; Lazareva, V.I.; Stepanova, I.K. Anthropogenic pollution of small lakes of the Northern European Part of Russia. Biol. Vnutr. Vod. 1997, 3, 5–17. [Google Scholar]
- Moiseenko, T.I. Acidification and Critical Loads in Surface Waters: Kola, Northern Russia. AMBIO 1994, 23, 418–424. [Google Scholar]
- Moiseenko, T.I.; Dinu, M.I.; Gashkina, N.A.; Jones, V.; Khoroshavin, V.Y.; Kremleva, T.A. Present status of water chemistry and acidification under nonpoint sources of pollution across European Russia and West Siberia. Environ. Res. Lett. 2018, 13, 105007. [Google Scholar] [CrossRef] [Green Version]
- Moiseenko, T.I.; Gashkina, N.A.; Dinu, M.I.; Kremleva, T.A.; Khoroshavin, V.Y. Water Chemistry of Arctic Lakes under Airborne Contamination of Watersheds. Water 2020, 12, 1659. [Google Scholar] [CrossRef]
- Moiseenko, T.I.; Dinu, M.I.; Bazova, M.M.; de Wit, H.A. Long-Term Changes in the Water Chemistry of Arctic Lakes as a Response to Reduction of Air Pollution: Case Study in the Kola, Russia. Water Air Soil Pollut. 2015, 226, 98. [Google Scholar] [CrossRef]
- Intergovernmental Panel for Global Climate Change (IPCC). The Physical Science Basis. Climate Change. 2013. Available online: http://www.ipcc.ch/report/ar5/wg1 (accessed on 30 September 2022).
- Noori, R.; Woolway, R.I.; Saari, M.; Pulkkanen, M.; Klove, B. Six decades of thermal change in a pristine lake situated north of the Arctic Circle. Water Resour. Res. 2022, 58, 2021WR031543. [Google Scholar] [CrossRef]
- Noori, R.; Bateni, S.M.; Saari, M.; Almazroui, M. Torabi Haghighi, A. Strong warming rates in the surface and bottom layers of a boreal lake: Results from approximately six decades of measurements (1964–2020). Earth Space Sci. 2022, 9, e2021EA001973. [Google Scholar] [CrossRef]
- Durov, A.G. Atlas of the Murmansk Region; The Head Office of Geodesy and Cartography: Moscow, Russian, 1971; p. 33. (In Russian) [Google Scholar]
- Pogilenko, V.I.; Gavrilenko, B.V.; Girov, D.V.; Gabin, S.V. The Geology of Ore Districts of the Murmansk Region Apatity Kola Scientific Center; Academy of Sciences: Russian, Moscow, 2002; p. 359. [Google Scholar]
- Reports on the State and Environmental Protection of the Murmansk Region in 1990–2018. 2019. Available online: https://gov-murman.ru/region/environmentstate/ (accessed on 3 October 2022).
- State Reports 2019. On State and Protection of the Environment of the Russian Federation (2003–2011). Available online: https://www.mnr.gov.ru/docs/gosudarstvennye_doklady (accessed on 30 September 2022).
- Henriksen, A.; Skjelvåle, B.L.; Mannio, J.; Wilander, A.; Harriman, R.; Curtis, C.; Jensen, J.P.; Fjeld, E.; Moiseenko, T. Northern European Lake Survey, Finland, Norway, Sweden, Denmark, Russian Kola, Russian Karelia, Scotland and Wales. AMBIO 1998, 27, 80–91. [Google Scholar]
- ICP-waters. Waters Programme Manual. Report105/2010, International Cooperative Programme on Assessment and Monitoring Effects of Air Pollution on Rivers and Lakes. 2010. Available online: https://niva.brage.unit.no/niva-xmlui/handle/11250/215220?locale-ttribute=en (accessed on 30 September 2022).
- Eaton, A.; Arnold, E.; Archie, A.E.; Rice, E.W.; Clesceri, L.S. Standard Methods for the Examination of Water and Wastewater, 17th ed.; American Public Health Association (APHA): Washington, DC, USA, 1992. [Google Scholar]
- Intercomparison 2034: pH, Cond, HCO3 NO3+NO2, C1, SO4, Ca, Mg, Na, K, Fe, Mn, Cd, Pb, Cu, Ni, and Zn. In International Cooperative Programme on Assessment and Monitoring of Acidification of Rivers and Lakes; Reports of Norwegian Institute of Water Research: Oslo, Norway, 2020.
- Weather Archive: Murmansk Region. Knowledge Management Portal “Pogoda i Klimat”. 2019. Available online: http://www.pogodaiklimat.ru/archive.php?id=ru®ion=51 (accessed on 30 September 2022).
- Driscoll, C.T.; Driscoll, K.M.; Fakhraei, H.; Civerolo, K. Long-term temporal trends and spatial patterns in the acid-base chemistry of lakes in the Adirondack region of New York in response to decreases in acidic deposition. Atmos. Environ. 2016, 146, 5–14. [Google Scholar] [CrossRef] [Green Version]
- Kline, K.M.; Eshleman, K.N.; Garlitz, J.E.; U'Ren, S.H. Long-term response of surface water acid neutralizing capacity in a central Appalachian (USA) river basin to declining acid deposition. Atmos. Environ. 2016, 146, 195–205. [Google Scholar] [CrossRef] [Green Version]
- Galloway, J.N.; Norton, S.A.; Church, M.R. Freshwater acidification from atmospheric deposition of sulfuric acid: A conceptual model. Environ. Sci. Technol. 1983, 17, 541A–545A. [Google Scholar] [CrossRef] [PubMed]
- Rogora, M.; Colombo, L.; Marchetto, A.; Mosello, R.; Steingruber, S. Temporal and spatial patterns in the chemistry of wet deposition in Southern Alps. Atmosph. Environ. 2016, 146, 44–54. [Google Scholar] [CrossRef] [Green Version]
- San Clements, M.D.; Fernandez, I.J.; Lee, R.H.; Roberti, J.A.; Adams, M.B.; Rue, G.A.; McKnight, D.M. Long-Term Experimental Acidification Drives Watershed Scale Shift in Dissolved Organic Matter Composition and Flux. Environ Sci. Technol. 2018, 52, 2649–2657. [Google Scholar] [CrossRef] [PubMed]
- De Wit, H.A.; Stoddard, J.L.; Monteith, D.T.; Sample, J.E.; Austnes, K.; Couture, S.; Fölster, J.; Higgins, S.N.; Houle, D.; Hruška, J.; et al. Cleaner air reveals growing influence of climate on dissolved organic carbon trends in northern headwaters. Environ. Res. Lett. 2021, 16, 104009. [Google Scholar] [CrossRef]
- Evans, C.D.; Monteith, D.T.; Reynolds, B.; Clark, J.M. Buffering of recovery from acidification by organic acids. Sci. Total Environ. 2008, 404, 316–325. [Google Scholar] [CrossRef]
- Fakhraei, H.; Driscoll, C.T. Proton and Aluminum Binding Properties of Organic Acids in Surface Waters of the Northeastern U.S. Environ. Sci. Technol. 2015, 49, 2939–2947. [Google Scholar] [CrossRef]
- de Wit, H.A.; Valinia, S.; Weyhenmeyer, G.A.; Futter, M.N.; Kortelainen, P.; Austnes, K.; Hessen, D.O.; Räike, A.; Laudon, H.; Vuorenmaa, J. Current browning of surface waters will be further promoted by wetter climate. Environ. Sci. Technol. Lett. 2016, 3, 430–435. [Google Scholar] [CrossRef] [Green Version]
- Meingast, K.M.; Kane, E.; Coble, A.A.; Marcarelli, A.M.; Toczydlowski, D. Climate, snowmelt dynamics and atmospheric deposition interact to control dissolved organic carbon export from a northern forest stream over 26 years. Environ. Res. Lett. 2020, 15, 104034. [Google Scholar] [CrossRef]
- Garmo, O.G.; Skjelkvåle, B.L.; de Wit, H.A.; Colombo, L.; Curtis, C.; Folster, J.; Hoffmann, A. Trends in surface water chemistry in acidified areas in Europe and North America from 1990 to 2008. Water Air Soil Pollut. 2014, 225, 1880. [Google Scholar] [CrossRef] [Green Version]
- Campbell, J.L.; Rustad, L.E.; Boyer, E.W.; Christopher, S.F.; Driscoll, C.T.; Fernandez, I.J.; Groffman, P.M.; Houle, D.; Kiekbusch, J.; Magill, A.H.; et al. Consequences of climate change for biogeochemical cycling in forests of northeastern North America. Can. J. For. Res. 2009, 39, 264–284. [Google Scholar] [CrossRef]
- Melillo, J.M.; Richmond, T.C.; Yohe, G.W. Climate Change Impacts in the United States: The Third National Climate Assessment; U.S. Global Change Research Program; U.S. Government Printing Office: Washington, DC, USA, 2014; p. 841. [Google Scholar]
- Grouza, G.V.; Rankova, E.Y. The Observed and Expected Climate Change of RUSSIA: Air Temperature; Academy of Sciences, Obninsk Institute of Global Climate and Ecology: Russian, Moscow, 2012; p. 194. [Google Scholar]
- Sommaruga-Wӧgrath, S.; Koinig, K.A.; Schmidt, R.; Sommaruga, R.; Tessadri, R.; Psenner, R. Temperature effects on the acidity of remote alpine lakes. Nature 1997, 387, 64–67. [Google Scholar] [CrossRef]
- Moiseenko, T.; Sharov, A. Large Russian lakes Ladoga, Onega, and Imandra under strong pollution and in the period of revitalization: A review. Geosciences 2019, 9, 492. [Google Scholar] [CrossRef]
Figure 1.
Distribution of rocks with different sensitivity to acidification of the Kola North and lakes with tendencies of water chemistry change. The coefficient (Krock) is determined as the ratio of major cation oxides to silicon dioxide. Light colors characterize high resistance to chemical weathering and acid-sensitive catchments; I – VI – subregions.

Figure 2.
Emissions of SO2 (thousand tons per year), Cu and Ni (tons per year) Ni–Cu smelter in Kola North [34].
Figure 2.
Emissions of SO2 (thousand tons per year), Cu and Ni (tons per year) Ni–Cu smelter in Kola North [34].

Figure 3.
Trends change of water chemistry parameters of the water bodies for a 28-year period (1990–2018): (a) SO4* (µeq L−1), (b) BC (µeq L−1), (c) ANC (µeq L −1), (d) DOC (mgC L−1); dots are values, lines are trends.
Figure 3.
Trends change of water chemistry parameters of the water bodies for a 28-year period (1990–2018): (a) SO4* (µeq L−1), (b) BC (µeq L−1), (c) ANC (µeq L −1), (d) DOC (mgC L−1); dots are values, lines are trends.

Figure 4.
Distribution of water chemistry parameters of the water bodies for a 28-year period (1990–2018) in various subregions of the Kola North: (a) SO4* (µeq L −1), (b) Hardness (µeq L −1), (c) ANC (µeq L −1), (d) DOC (mgC L −1); I – VI – subregions.
Figure 4.
Distribution of water chemistry parameters of the water bodies for a 28-year period (1990–2018) in various subregions of the Kola North: (a) SO4* (µeq L −1), (b) Hardness (µeq L −1), (c) ANC (µeq L −1), (d) DOC (mgC L −1); I – VI – subregions.

Figure 5.
Distribution of mean monthly surface air temperature T °C (a) and precipitation P (mm yr−1) (b) for a 28-year period (1990–2018) on the territory of the Kola North; dots are values, lines are trends.
Figure 5.
Distribution of mean monthly surface air temperature T °C (a) and precipitation P (mm yr−1) (b) for a 28-year period (1990–2018) on the territory of the Kola North; dots are values, lines are trends.

Figure 6.
Dependencies between (a) dissolved organic carbon (DOC), (b) total P (Ptot), (c) total nitrogen (Ntot), and mean monthly surface air temperature (T) for a 28-year period (1990–2018) dots are values, lines are trends.
Figure 6.
Dependencies between (a) dissolved organic carbon (DOC), (b) total P (Ptot), (c) total nitrogen (Ntot), and mean monthly surface air temperature (T) for a 28-year period (1990–2018) dots are values, lines are trends.

Figure 7.
Scheme of the development of lakes from acidification to eutrophication in the Arctic region under the influence of reduced acid deposition and climate warming.
Figure 7.
Scheme of the development of lakes from acidification to eutrophication in the Arctic region under the influence of reduced acid deposition and climate warming.


Table 1.
Landscape (forest, peat) and geochemical characteristics (major rock type) of the identified subregions of the Kola region.
Table 1.
Landscape (forest, peat) and geochemical characteristics (major rock type) of the identified subregions of the Kola region.
| Subregion | Major Rock Type (%) | Forest (%) | Peat (%) | Distance |
|---|---|---|---|---|
| from the Smelters, km | ||||
| I | basaltic (70), gneiss (10), | 12 | 13 | <40 km |
| amphibolites (10), slantsy (10) | 2–58 | 5–17 | ||
| II | basaltic and gabbros (90), | 63 | 15 | 40–120 km |
| gneiss (10) | 38–79 | 6–30 | ||
| III | nepheline syenite (80), | 57 | 18 | 40–80 km |
| foyaites and urtite (20) | 21–88 | 3–42 | ||
| IV | granite (100) | 8 | 7 | >150 km |
| 1–17 | 2–17 | |||
| V | quartz sands (100) | 54 | 22 | >200 km |
| 47–75 | 4–29 | |||
| VI | gneiss (20), diorites (20), | 74 | 23 | >200 km |
| migmatites (20), tonalities (20), | 56–81 | 16–46 | ||
| pyroxenes (20) |
Table 2.
Median and limits of variation of water chemistry parameters of the water bodies for a 28-year period (1990–2018) of the Kola North.
Table 2.
Median and limits of variation of water chemistry parameters of the water bodies for a 28-year period (1990–2018) of the Kola North.
| Parameters | 1990 | 1995 | 2000 | 2005 | 2010 | 2014 | 2018 |
|---|---|---|---|---|---|---|---|
| pH | 6.79 | 6.7 | 6.85 | 6.41 | 6.58 | 6.55 | 6.6 |
| 4.32–7.18 | 4.64–7.59 | 4.85–7.45 | 4.64–7.21 | 4.99–7.33 | 4.49–7.34 | 4.55–7.23 | |
| ANC | 89 | 128 | 140 | 128 | 143 | 170 | 168 |
| μeq l−1 | [−23]–410 | [−10]–648 | [−10]–682 | [−11]–843 | [−4]–789 | 16–856 | 11–724 |
| BC | 305 | 319 | 309 | 280 | 293 | 290 | 299 |
| μeq l−1 | 137–527 | 57–717 | 54–629 | 53–646 | 51–695 | 47–634 | 54–602 |
| Alk | 125 | 131 | 137 | 111 | 96 | 135 | 151 |
| μeq l−1 | 0–400 | 0–639 | 0–694 | 0–839 | 0–793 | 0–866 | 0–683 |
| SO4* | 121 | 65 | 49 | 46 | 45 | 44 | 41 |
| μeq l−1 | 48–158 | 22–239 | 13–209 | 15–199 | 0–192 | 0–198 | 11–246 |
| Cl | 46 | 38 | 37 | 36 | 40 | 37 | 42 |
| μeq l−1 | 8–290 | 14–307 | 7–287 | 11–270 | 12–265 | 7–281 | 11–274 |
| Color | 49 | 35 | 27 | 28 | 19 | 24 | 20 |
| 0 Pt-Co | 0–88 | 0–156 | 0–143 | 3–123 | 3–165 | 2–128 | 3–136 |
| DOC | 4.9 | 5.6 | 5.9 | 6.9 | 7.4 | 6.4 | 5.2 |
| mgC L−1 | 1.2–8.9 | 2.6–15.1 | 1.6–14.5 | 2.4–18.7 | 2.2–22.5 | 2.2–20.6 | 2.6–19.3 |
| Ntot | 184 | 202 | 170 | 223 | 214 | 220 | 304 |
| μgN l−1 | 55–376 | 33–216 | 57–484 | 87–429 | 70–428 | 94–639 | 108–836 |
| NO3− | 1 | 1 | 1 | 2 | 2 | 1 | 1 |
| μgN l−1 | 0–3 | 0–23 | 0–17 | 1–17 | 0–30 | 0–31 | 0–28 |
| Ptot | 2 | 4 | 8 | 9 | 5 | 10 | 8 |
| μgP l−1 | 0–12 | 1–39 | 1–54 | 2–258 | 2–230 | 5–76 | 4–93 |
| PO43− | 4 | 1 | 1 | 1 | 2 | 4 | 2 |
| μgP l−1 | 2–10 | 0–29 | 0–34 | 0–98 | 1–36 | 0–41 | 0–38 |
| Al | 43 | 33 | 39 | 47 | 54 | 20 | 39 |
| μg l−1 | 0–149 | 3–330 | 4–186 | 10–448 | 9–416 | 8–170 | 5–352 |
| Fe | 55 | 41 | 45 | 70 | 77 | 88 | 60 |
| μg l−1 | 0–99 | 4–370 | 3–340 | 5–509 | 11–580 | 4–480 | 10–510 |
| Cu | 2.2 | 0.7 | 0.7 | 0.8 | 1.1 | 0.9 | 0.8 |
| μg l−1 | 0.5–9 | 0.1–14 | 0.2–12 | 0.2–8.9 | 0.3–12 | 0.1–14.2 | 0.3–12.5 |
| Ni | 3.9 | 0.6 | 0.8 | 0.9 | 0.9 | 0.7 | 0.8 |
| μg l−1 | 0.7–65 | 0.1–65 | 0.2–60 | 0.2–54 | 0.2–74 | 0.1–79 | 0.2–65 |
Table 3.
Regional trend Mann–Kendall tests (SKT) of water chemistry parameters of the water bodies for a 28-year period (1990–2018) in various subregions of the Kola North.
Table 3.
Regional trend Mann–Kendall tests (SKT) of water chemistry parameters of the water bodies for a 28-year period (1990–2018) in various subregions of the Kola North.
| SO4* Trend | Hardness (Ca2+ + Mg2+) Trend | ANC Trend | DOC Trend | Ntot Trend | Ptot Trend | |||||||
|---|---|---|---|---|---|---|---|---|---|---|---|---|
| Slope | p | Slope | p | Slope | p | Slope | p | Slope | p | Slope | p | |
| μeq L−1 | μeq L−1 | μeq L−1 | mgC L−1 | μgN L−1 | μgP L−1 | |||||||
| I-around the smelters Kola, n = 7 | ||||||||||||
| 1990–2018 | −0.62 ◊ | 0.53 | −0.49 ◊ | 0.62 | +0.93 ◊ | 0.35 | +0.11 ◊ | 0.91 | +1.93 * | <0.05 | +1.21 ◊ | 0.23 |
| sustainable (II + III), n = 42 | ||||||||||||
| 1990–2018 | −4.03 *** | <0.001 | +3.14 ** | <0.01 | +6.63 *** | <0.001 | +3.07 ** | <0.01 | +5.62 *** | <0.001 | +2.16 * | <0.05 |
| acid-sensitive (IV + V), n = 14 | ||||||||||||
| 1990–2018 | −2.61 ** | <0.01 | −2.25 * | <0.05 | +2.25 * | <0.05 | +2.32 * | <0.05 | +2.43 * | <0.01 | +0.31 * | 0.75 |
| VI-forest and wetland landscapes, n = 12 | ||||||||||||
| 1990–2018 | −0.06 ◊ | 0.95 | −0.53 ◊ | 0.59 | −0.69 ◊ | 0.49 | −0.83 ◊ | 0.41 | +2.16 * | <0.05 | +2.65 ** | <0.01 |
| all region, n = 75 | ||||||||||||
| 1990–2018 | −5.85 *** | <0.001 | +1.99 * | <0.05 | +7.15 *** | <0.001 | +2.29 * | <0.05 | +2.42 * | <0.01 | +2.74 * | 0.03 |
Results of meta-analysis of trends in SO4*, Hardness, ANC, DOC, Ntot, Ptot in various subregions of the Kola North for all periods (1990–2018). Statistics (p values based on x2 tests) are from an analysis of variance of site trend Z scores, and constitute a test of trend homogeneity within the subregions and all regions. Significant trends are highlighted in bold: * p < 0.05; ** p < 0.01; *** p < 0.0001; ◊ trend heterogeneity.
Publisher’s Note: MDPI stays neutral with regard to jurisdictional claims in published maps and institutional affiliations. |
© 2022 by the authors. Licensee MDPI, Basel, Switzerland. This article is an open access article distributed under the terms and conditions of the Creative Commons Attribution (CC BY) license (https://creativecommons.org/licenses/by/4.0/).
Share and Cite
MDPI and ACS Style
Moiseenko, T.I.; Bazova, M.M.; Gashkina, N.A. Development of Lake from Acidification to Eutrophication in the Arctic Region under Reduced Acid Deposition and Climate Warming. Water 2022, 14, 3467. https://doi.org/10.3390/w14213467
AMA Style
Moiseenko TI, Bazova MM, Gashkina NA. Development of Lake from Acidification to Eutrophication in the Arctic Region under Reduced Acid Deposition and Climate Warming. Water. 2022; 14(21):3467. https://doi.org/10.3390/w14213467
Chicago/Turabian StyleMoiseenko, Tatyana I., Mariya M. Bazova, and Natalia A. Gashkina. 2022. "Development of Lake from Acidification to Eutrophication in the Arctic Region under Reduced Acid Deposition and Climate Warming" Water 14, no. 21: 3467. https://doi.org/10.3390/w14213467
Note that from the first issue of 2016, this journal uses article numbers instead of page numbers. See further details here.