Article

Spatial-Temporal Variations of Active Accumulated Temperature and Its Impact on Vegetation NDVI in the Source Region of China’s Yellow River

1
College of Hydraulic Engineering, Zhejiang Tongji Vocational College of Science and Technology, Hangzhou 311231, China
2
College of Hydrology and Water Resources, Hohai University, Nanjing 210098, China
3
Fujian Provincial Investigation, Design & Research Institute of Water Conservancy & Hydropower, Fuzhou 350001, China
4
Key Laboratory for Technology in Rural Water Management of Zhejiang Province, Hangzhou 310018, China
*
Author to whom correspondence should be addressed.
Water 2022, 14(21), 3458; https://doi.org/10.3390/w14213458
Submission received: 28 July 2022 / Revised: 19 October 2022 / Accepted: 26 October 2022 / Published: 29 October 2022

Abstract

:
Global climate change has greatly influenced the ecosystems in the Tibetan Plateau. Many studies focused on the direct effects of climate warming on the headwater regions by mean temperature, while less investigating its implication for the eco-environment. To address this, the study discussed the spatial-temporal variations of the bio-related climate indicators ≥0 °C annual accumulated temperature AAT0 and its lasting days LDT0, and corresponding ≥5 °C indicators AAT5 and LDT5 on the source region of the Yellow River (SRYR). The stationarity of indicators during 1979–2018 were tested by Pettitt test, and trends checked by linear regression analysis and Mann-Kendall test. Normalized difference vegetation index NDVI (2001–2016) was adopted to detect the correlation between vegetation activities and indicators. Results show that the AAT and LDT0 exhibited significant increasing trend over the SRYR, while the LDT5 significantly increased mainly under 4000 m. Most LDT extended due to the combined efforts of the early onset and late termination of the given temperature. 1997 was detected in the abrupt change analysis of AAT0 both on the basin scale and most area, and was adopted to divide the period into two stages. The regional mean AAT0 linearly grew at a rate of 96 °C decade−1 during the entire period, and 104 °C decade−1 during the second stage. Except for a drastic jump in the areal mean values, there was a distinct upward-shift of isoline in elevation between stages. NDVI showed strong correlativity with ≥0 °C indicators on the basin scale, according to the Pearson, Spearman and Kendall correlation coefficients, ranging from 0.5 to 0.7. Spatially, the overlap area between Pearson’s γ ≥ 0.5 and linearly rising AAT0 reached 50%, which was fully covered with significantly increasing AAT0 during the recent stage. Thus the rapid growth of ≥0 °C indicators would effectively accelerate NDVI over this major alpine grasslands, especially around the eastern low regions, where indicators are higher and grow faster.

1. Introduction

Since the 1960s, climate change has gradually become a hot issue of global concern. It stated that the global average surface temperature increased by 0.85 (0.65–1.06) °C during 1880–2012 in the 6th Assessment Report of the Intergovernmental Panel on Climate Change (IPCC), and the most recent special report pointed out the impacts of global warming of 1.5 °C above pre-industrial levels [1]. The report also showed that the linear rising rate of the temperature during the last decade is almost double that of the last century, and estimated that the warming trend will continue in the future. It is inevitable that climate warming will cause a change of heat resources, and bring effects on the ecosystems closely related [2,3]. Such climate variability can induce substantial variations in the composition, structure, and function of terrestrial ecosystems, and the acclimatization will influence the role as the carbon sinks and constrain the inter-annual variability of carbon fluxes [4,5,6]. Additionally, warming favors the introduction of new species on mountain summits, and accelerated global warming is strikingly synchronized with a continent-wide acceleration in the rate of increase in plant species richness. The acceleration in climate-induced biotic change highlights the widespread consequences of human activities on the biosphere, with potentially far-ranging impacts on ecosystem functioning and services [7].
Geographical characteristics is conspicuous in the global climate change, and also in the impacts of warming on ecosystems. The Tibetan Plateau (TP), the sole and largest geographical unit with the highest elevation on earth, referred to by scientists as the “Third Pole”, covering 5 × 10⁶ km2 with an average elevation of >4000 m and including more than 1 ×10⁵ km2 of glaciers, also represents one of the largest ice masses of the Earth, is the most sensitive and readily visible indicator of climate change [7]. Climate change and its direct impacts on the TP has long attracted the attention of researchers around the world [8]. Heat is an important environmental factor and energy for the survival, growth and distribution of vegetation. Yang, Ding and Chen [9] have found that, during the growing seasons, variations in the alpine vegetation are controlled mainly by the warming climate. However, the previous studies have mainly focused on the statistical meaning of factors directly reflecting climate change in the region, scarcely on the consequent ecological effects. The findings from the researches based on surface air temperature over the TP include that the distinct climate warming started from the 1950s; mean annual air temperature experienced robust increases and the rising rate is still growing [9]; the most significant changes happened in the nocturnal temperature during winter and autumn [10]; the minimum and maximum daily temperature and the extreme events increase; and the significant warming trends mostly concentrated in the northern part of the TP spatially [10,11].
Vegetation requires both a certain temperature for dormancy release and a total amount of temperature to sustain the complete life cycle. The aggregate of temperature is known as the accumulated temperature, representing the heat demands of plants during the growing-season. Accumulated temperature could be applied to monitor and forecast key phenological stages [12]. The demands are different among various vegetation types, so that distinct temperatures should be identified as the onset of the accumulation [13]. Previous studies of accumulated temperature have been taking aim at the influence of changes in the climatic conditions and environment on the agricultural production and development. The mean daily temperature stabled reaching 10 °C has been widely considered the onset of effective growing season of main grain crops. Thus the ≥10 °C accumulated temperature was the key bio-temperature indicator in most studies, for it reflecting total heat of local plant production requirement [14,15], besides, the maize drove most concern in the studies, as an important food crop around the world [16]. The ≥10 °C accumulated temperature was frequently studied not only for the growth, development, yield and quality of crops, but also for the distribution boundaries of temperature zones, cropping pattern and cultural method of crops. That is to say, the objectives of previous studies contained searching suitable cultivation zones or innovation cropping methods, while research gaps related to climate change effects on environmentally sensitive regions remain.
As an important component of global terrestrial ecosystem, the biomass and dynamics of vegetation response to climate change have attracted a lot of attention. The most common materials are the satellite-extracted vegetation index, as NDVI (normalized difference vegetation index), EVI (enhanced vegetation index), LAI (leaf area index) and NPP (Net Primary Productivity), etc. Kumari, Srivastava and Dumka [17] analyzed the relationship between the spatiotemporal variability of vegetation greenness and associated climatic drivers in the Himalayas at annual and seasonal scales, by NDVI and EVI, and found that both indexes showed increasing trends in the vegetation greening during 2001–2020, with the NDVI being consistently higher than the EVI. The significant increase in NDVI and EVI occurred varied for different vegetation types among different seasons [18]. The delayed responses at three-month intervals of ecosystems in different regions worldwide to accumulated temperature were revealed by applying the NDVI dataset [19]. Feng, Dong, Qin, Liu, Zhang and Gong [20] found that NDVI was positively correlated with accumulated temperature over the Huangshui River Basin at annual and seasonal scales, however, the correlation between NDVI and 16-days accumulated temperature was uncertain. Through the comparison among three NDVI-based indices, minimum, mean, and maximum NDVIs, the annual maximum NDVI showed best performance in capturing the sensibility of vegetation activities in the Middle and Lower Reaches of the Yangtze River [21]. Thus, the annual maximum NDVI constitute the indicator of vegetation activities in this study.
Alpine ecosystem is particularly vulnerable to climate change on the TP, and the permafrost environment makes it extremely sensitive to warming. The dominant ecosystem is the alpine grassland comprising 60% of the TP. The source region of the Yellow River (SRYR) in the northeast of the TP is densely occupied by alpine grasslands, which serves as one of the largest grazing districts in China, and the ecosystems have been greatly reshaped by the changing environment [22]. The investigation of bio-related climate indicators would offer suggestions for far-reaching environmental regulations, as the cumulative effects of long-term warming would have much wider consequences on the associated ecosystems [2]. The ≥0 °C, ≥5 °C annual accumulated temperature (AAT0, AAT5) and the lasting days with mean daily temperature ≥0 °C, ≥5 °C (LDT0, LDT5) over the SRYR were selected for its clear biological implementation as the study objects. The guideline was as follows: firstly, mean daily temperature from 1979 to 2018 was employed to calculate the AAT and LDT by moving-average method; secondly, the linear regression method was applied to calculate the inclination rates with the determination coefficient R2 ≥ 0.5; thirdly, the statistic tests would be used to detect the stationarity and trends of the indicator series; fourthly, the spatial-temporal distribution of indicators divided by the abrupt change point were compared to investigate the variations between stages; finally, three linear correlation analyses were performed to detect the relationship between MODIS NDVI and indicators.

2. Materials and Methods
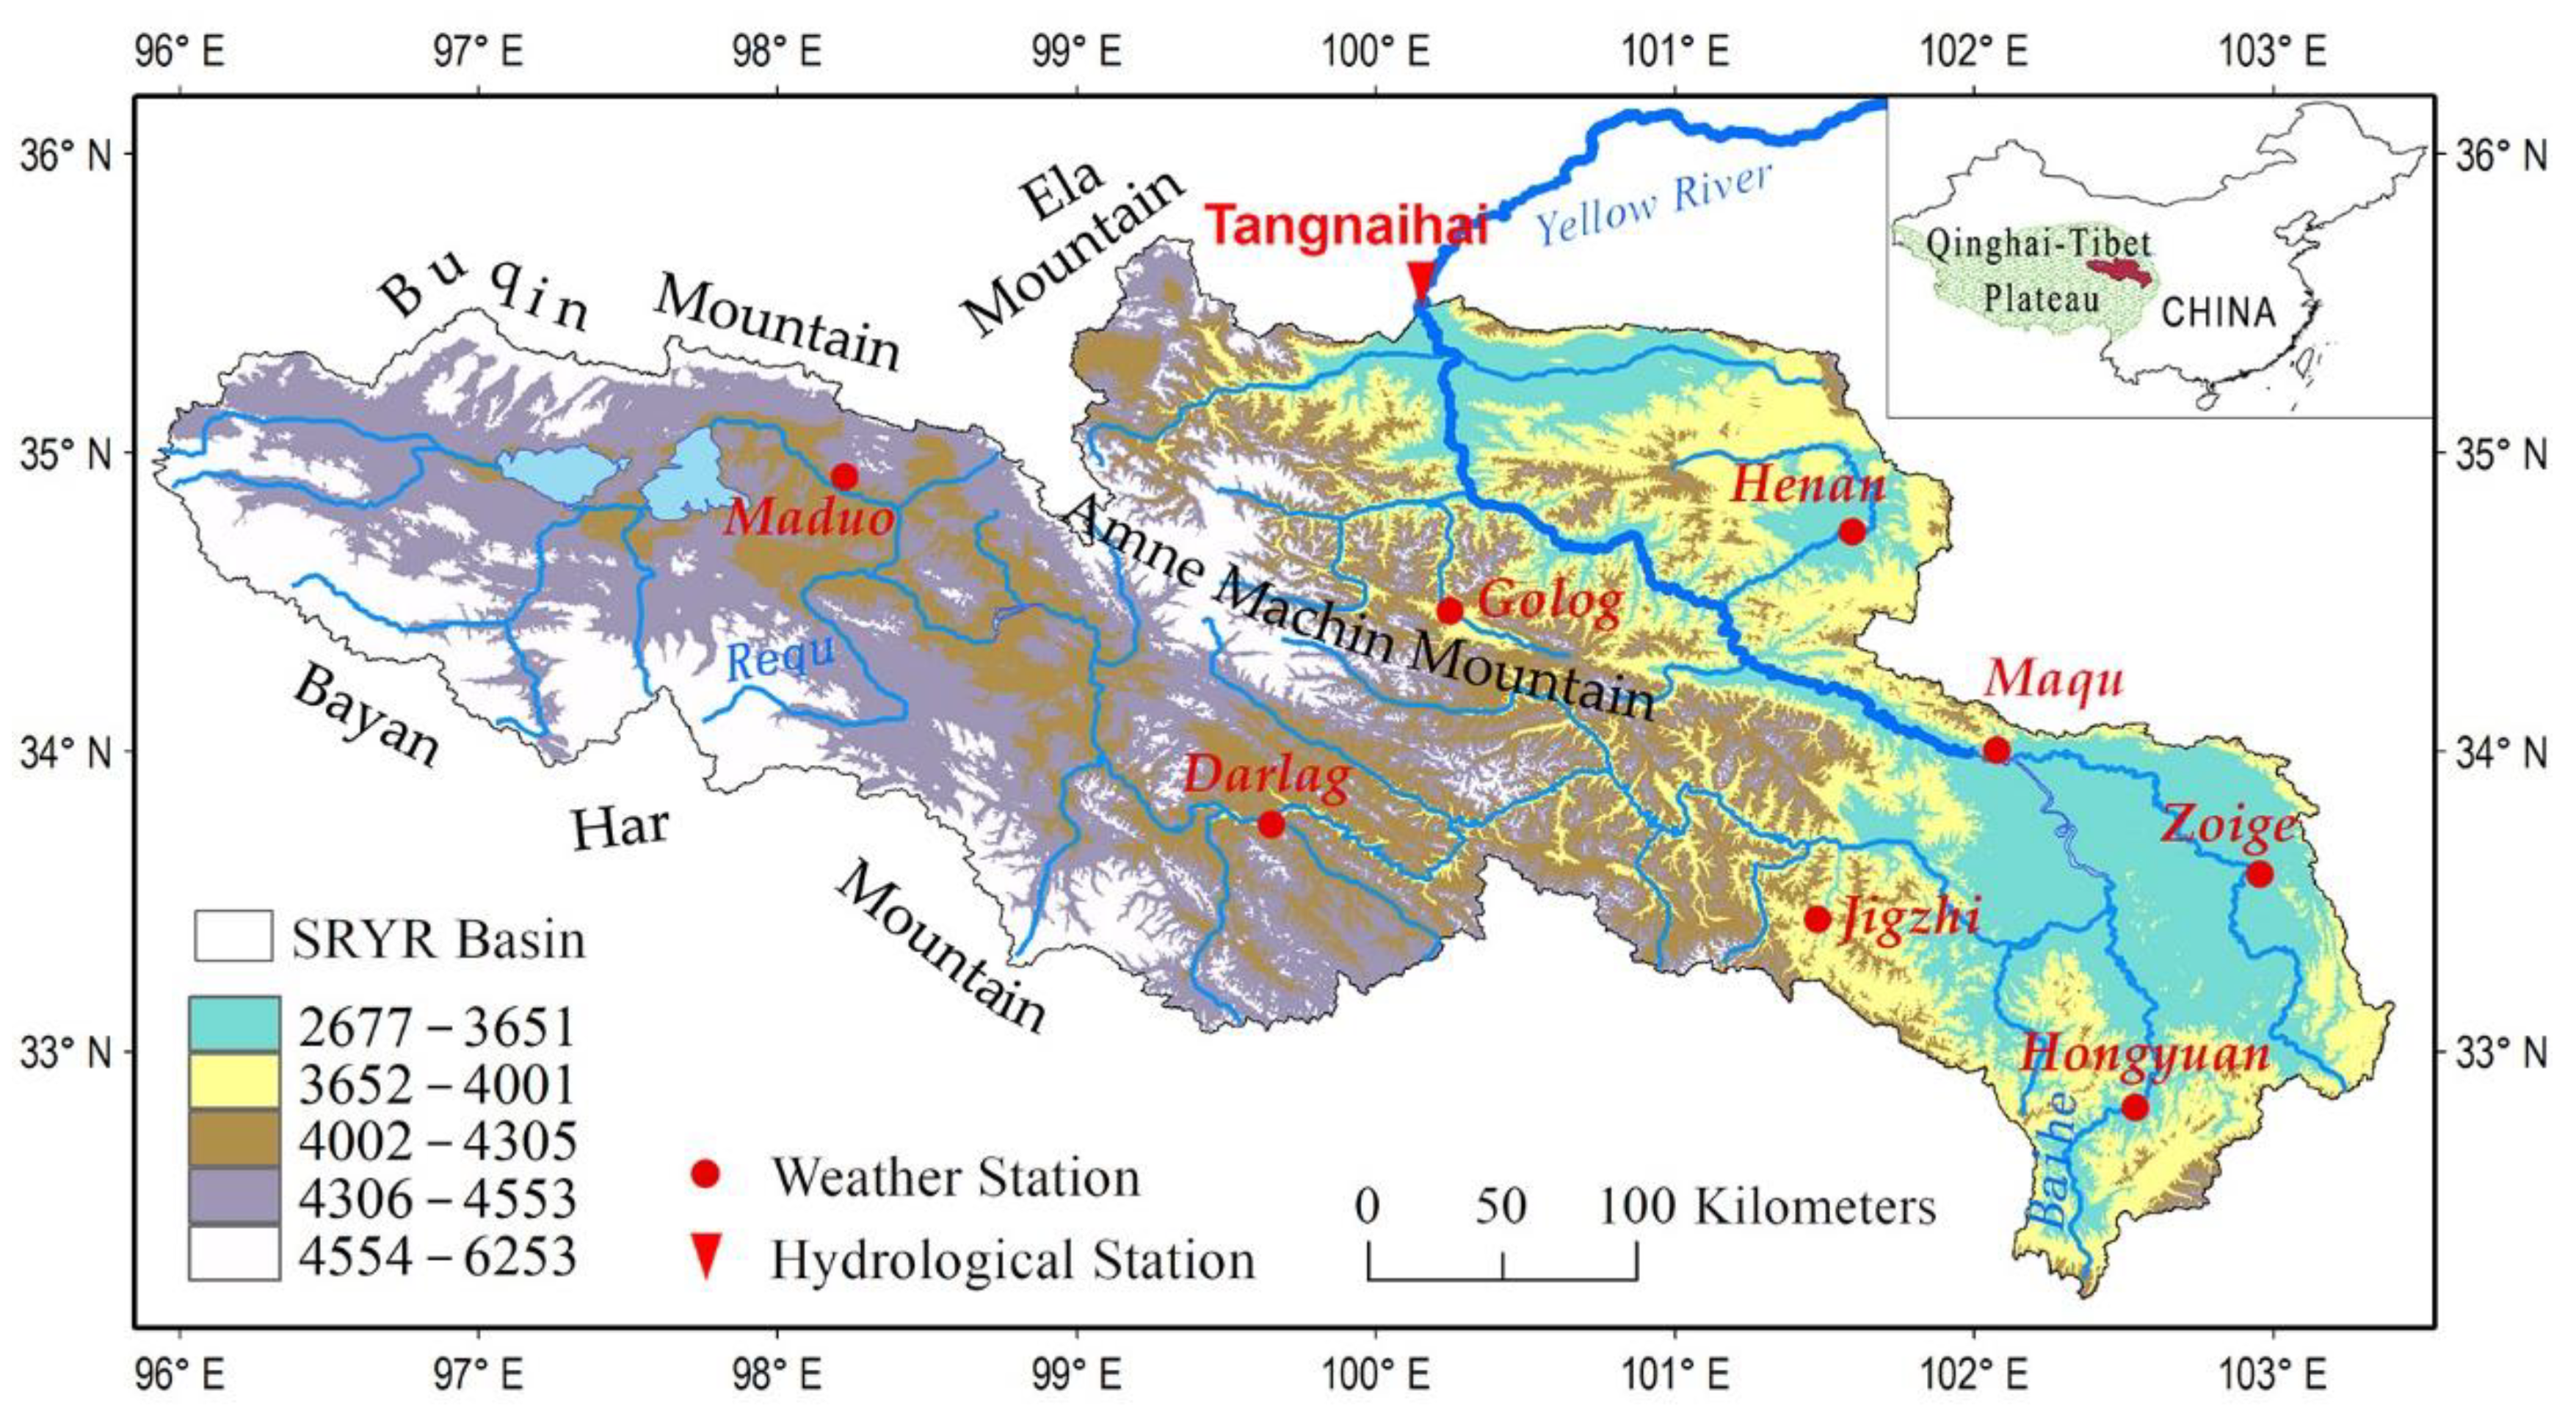
2.1. Study Area

The SRYR in the study refers to the basin above the Tangnaihai hydrological station, the geographical coordinate is 95.88–103.42° E, 32.15–35.73° N in the northeastern TP, in Figure 1. The mean elevation is over 4000 m, ranging from 2700 m to 6300 m low-lying west to east, with the highest point at the summit of Mt. Amne Machin, Machin Kangri (summit M). The elevation of 4000 m serves as a dividing line in SRYR, the eastern part is the low-elevation area. The climate is very cold, the average annual temperature is about −2.5 °C, and areal mean annual precipitation is 540 mm. The SRYR spreads most alpine meadow grassland and wetland of the TP, and serves as one of the high-quality forage areas in China. It supplies the feed to a variety of livestock, and graziery is the industry of important economy pillar of millions of people around [23]. The cryospheric environment, including the high-cold terrestrial hydrological and alpine vegetation systems, has changed greatly since the 1960s [9]. The degradation in its ecosystem has been prevailing, owing to the combined effects of the climate warming, overgrazing, and pika damage.

2.2. Datasets

There are only 8 national weather stations from the China Meteorological Administration (CMA) on the SRYR, with elevation ranging from 3440 m to 4272 m, listed in Table 1. Due to limited in-situ accessibility, studies in the alpine regions have been heavily relying on satellite observations since 1980s [24]. The CMFD (China Meteorological Forcing Dataset) [25], reanalysis temperature data derived from CMA station data and remote sensing datasets, is available from the National Tibetan Plateau Data Center and applied in the research. The effectiveness of CMFD was demonstrated with its high accuracy on the study of the spatiotemporal characteristics of climate related factors, like surface temperature, precipitation and radiation [26,27,28]. The mean daily temperature datasets with spatial resolution 0.1° × 0.1° of 1200 grids over the SRYR during 1979–2018 were obtained, listed in Table 2.
The DEM (Digital Elevation Model) adopted in the study is the Natural Breaks (Jenks) classification system and the ASTER (Advanced Spaceborne Thermal Emission and Reflection Radiometer)—GDEM (Global Digital Elevation Model) [29], for its high accuracy and fine resolution, 30 m × 30 m, listed in Table 2.
The sixth version of the MODIS Normalized Difference Vegetation Index (MOD13C1 NDVI) product (2001–2016) [30] was employed in the study to investigate the correlation between accumulated temperature and vegetation growth across the SRYR. The MOD13C1 is a Climate Modeling Grid (CMG) data product with 13 science data sets, and the NDVI has a temporal resolution of 16 days and a spatial resolution of 0.05 degrees, listed in Table 2.

2.3. Accumulated Temperature Calculation

The timing of events in the vegetation growth or phenological phenomenon, such as initiation, termination, and conversion, is mainly regulated by air temperatures in high-latitude area. Linderholm [31] found out that the critical temperature of the alpine grassland in the SRYR is 0 °C and 5 °C, the minimum biology temperature for budburst and greenup, respectively. Thus ≥0 °C annual accumulated temperature (AAT0) and ≥5 °C annual accumulated temperature (AAT5) was determined as the bio-related indicators for the specific species in this particular region.
AAT0 and AAT5 represent the aggregate of mean daily temperatures above or equal to the critical temperature 0 °C and 5 °C, respectively. Since the baseline temperature is related to growing season, the indicators are also known as active accumulated temperature. To minimize the influence of randomness in the mean daily temperature datasets, the 5-day moving average method was applied to determine the start day (SDT0) and end day (EDT0) with mean daily temperature ≥0 °C throughout a year [32]. With the start and end day, the sum of mean daily temperature in between is AAT0. The dates for AAT5 were SDT5 and EDT5, correspondingly. The lasting days between the start day and end day with mean daily temperature ≥0 °C or 5 °C are LDT0 and LDT5, respectively.

2.4. Correlation Analysis

Pearson correlation analysis is frequently used to represent inter-examiner reliability, which was adopted together with Spearman and Kendall rank correlation analysis in the study, to detect the linear correlation between MODIS NDVI and indicators. The NDVI datasets were first re-sampled from 0.05 degrees to the same spatial resolution of AAT and LDT as 0.1 degrees by mean value, for spatial analysis. And then, to measure the vegetation activities on an annual basis, 16-day composite re-sampled NDVI datasets were extracted to annual maximum series, as the targeted NDVI in this study. The Pearson correlation coefficient (Pearson’s γ), Spearman rank correlation coefficient (Spearman’s ρ) and Kendall rank correlation coefficient (Kendall’s τ) were calculated between NDVI and AAT0, AAT5, LDT0 and LDT5, individually. The results were checked by two-tailed T test, and investigated both temporally and spatially.

3. Results

3.1. Spatial Distribution

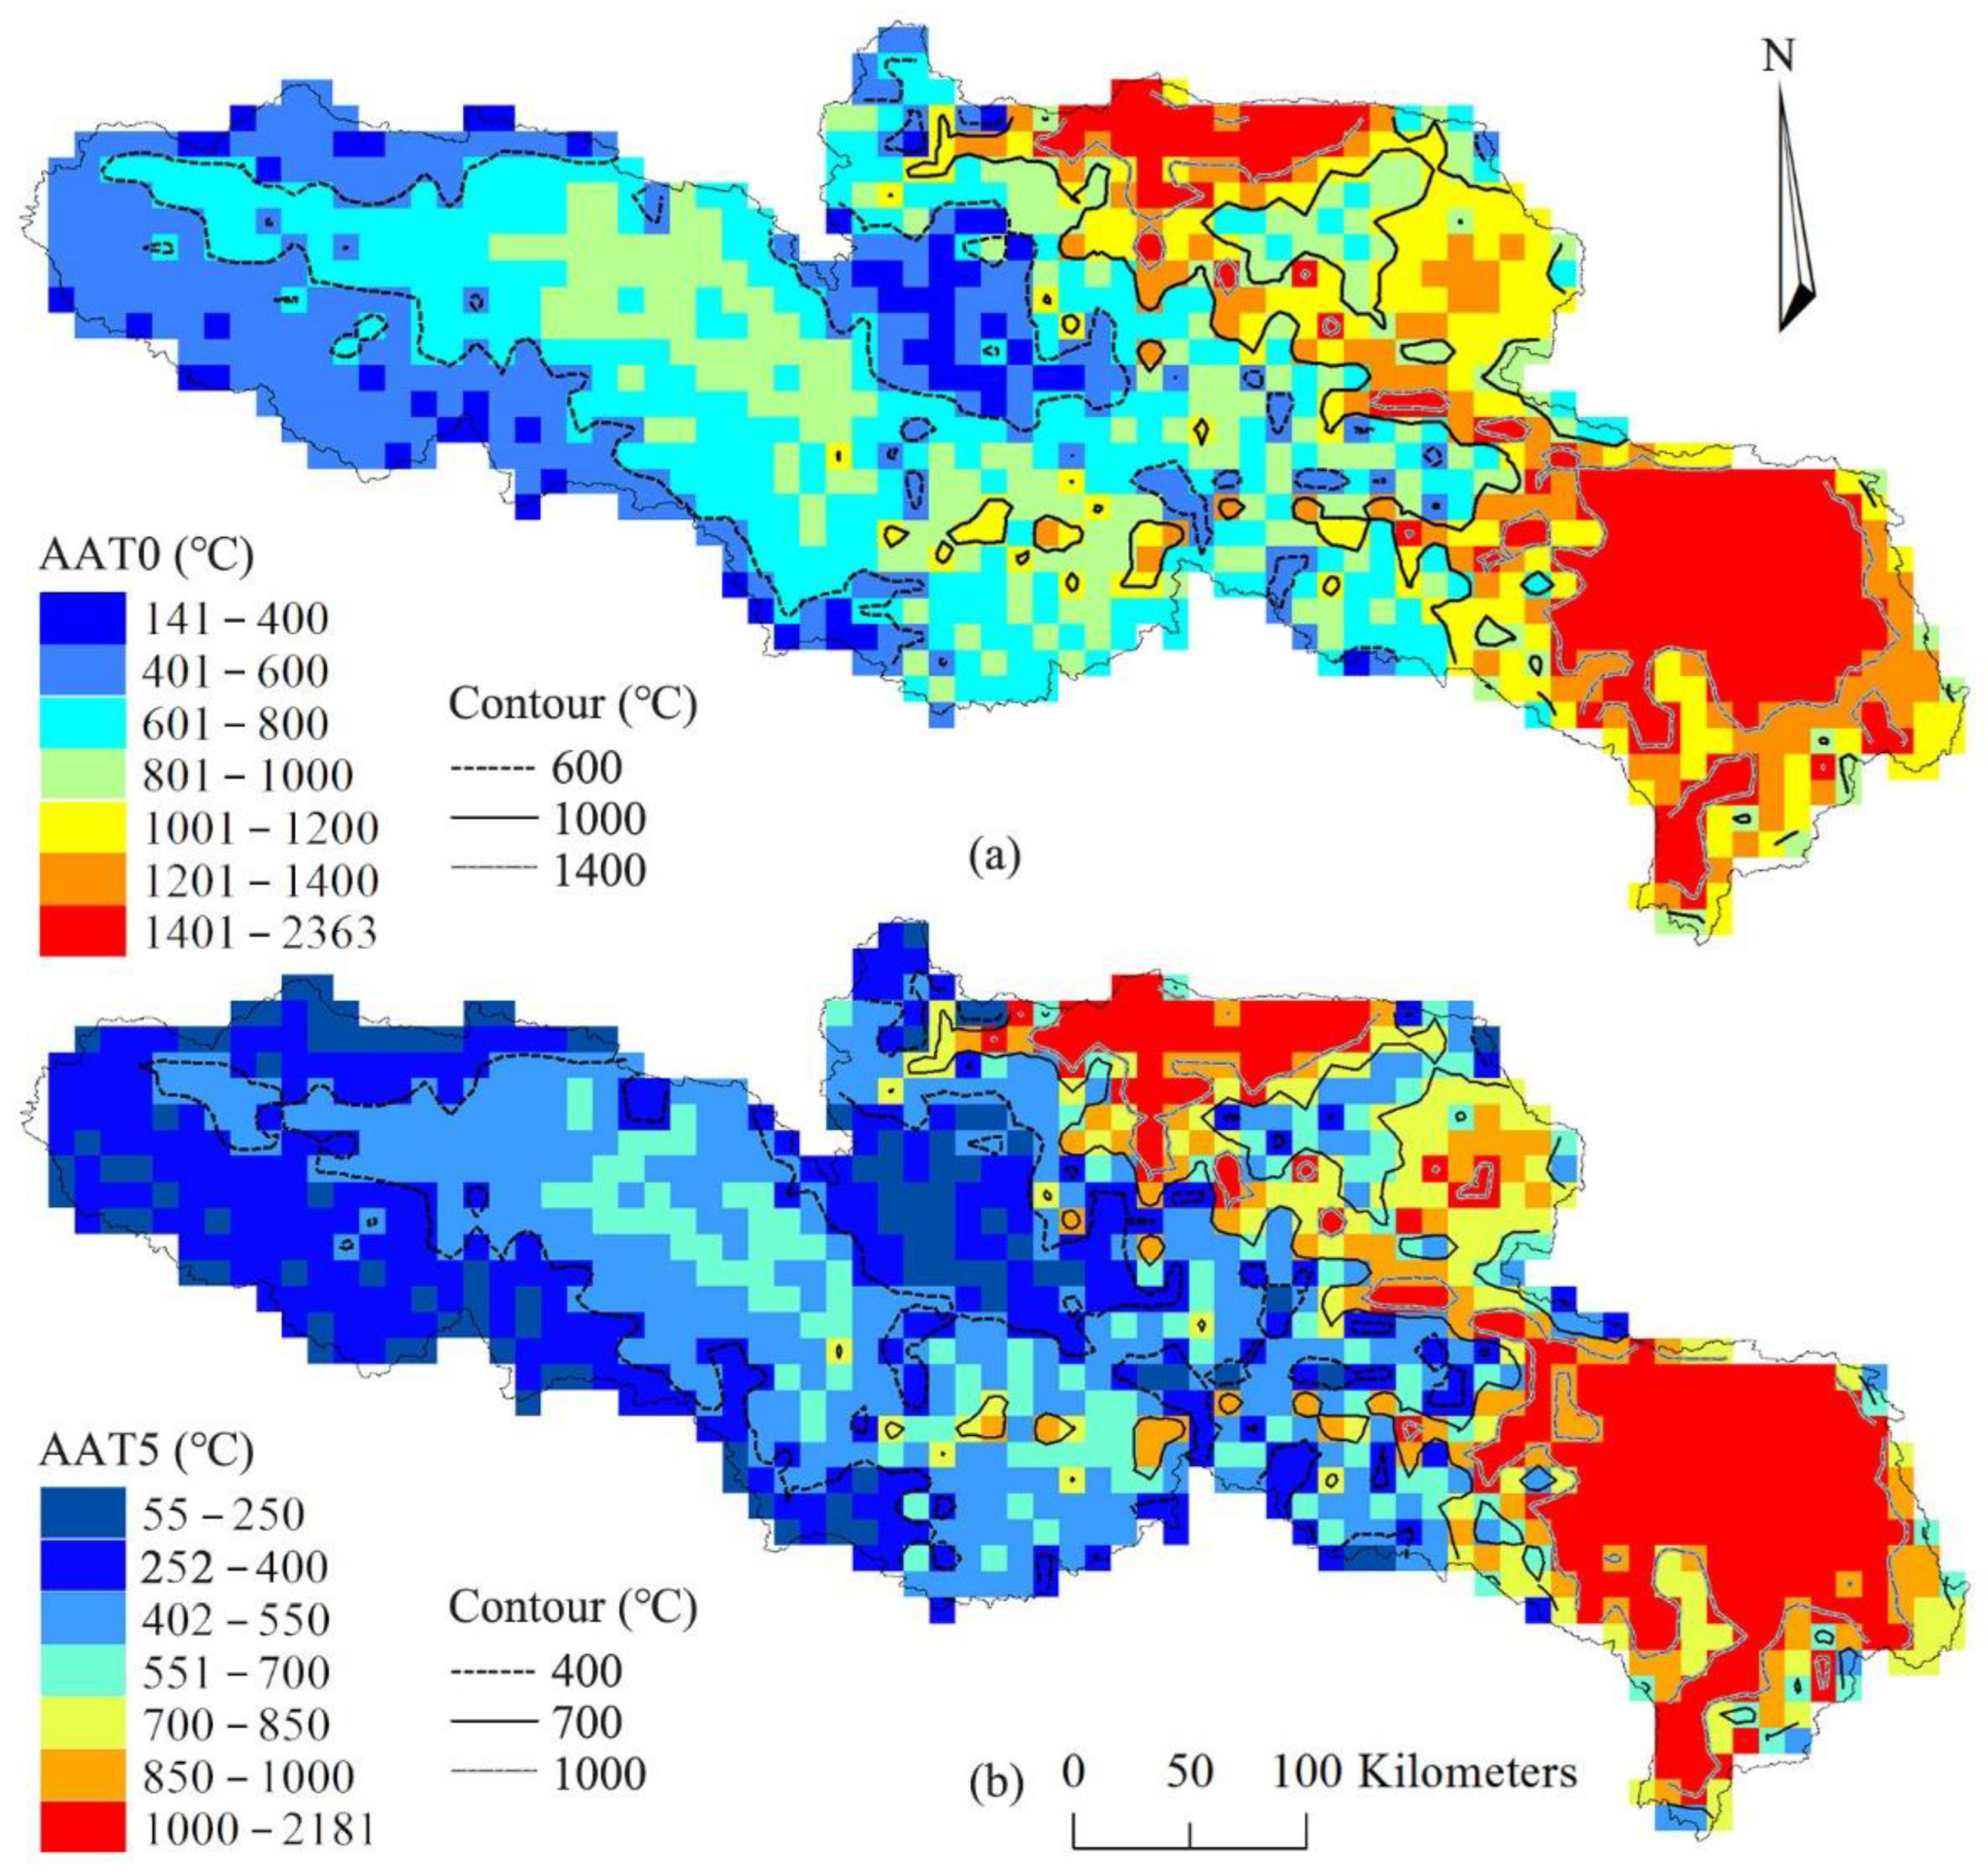
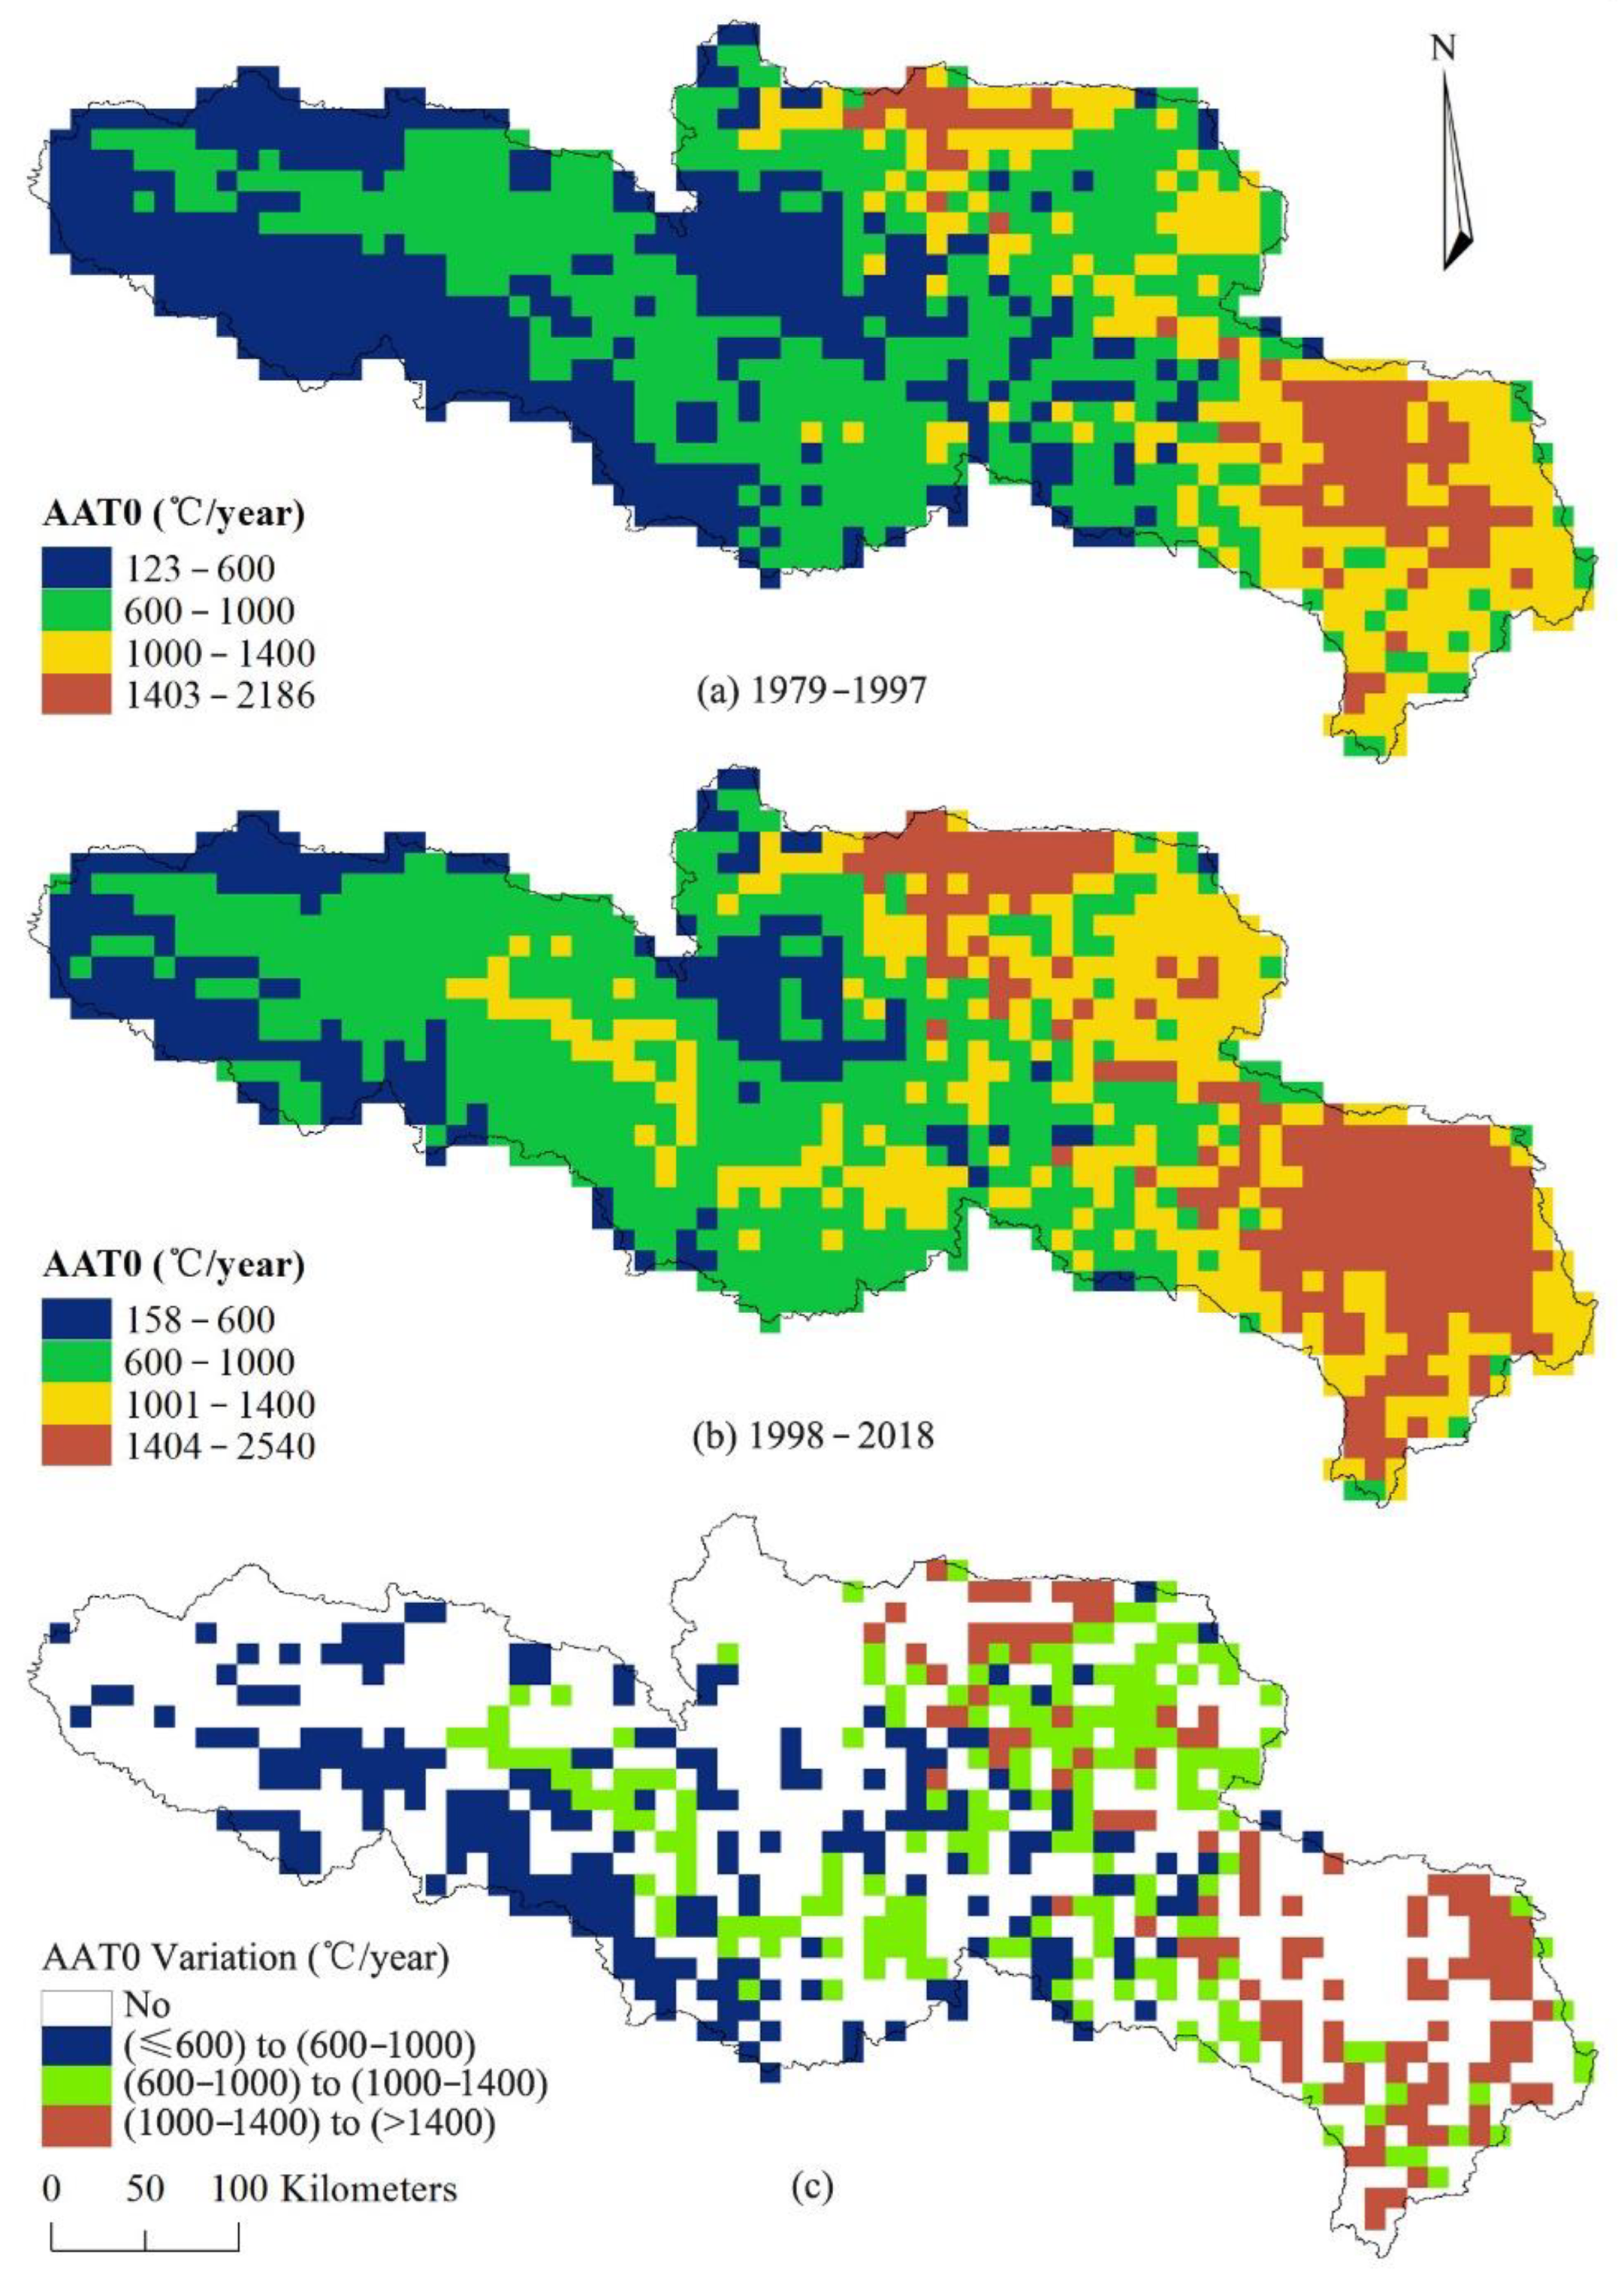
3.1.1. Distribution of AAT

The areal mean AAT0 of the SRYR during 1979–2018 was 895 °C, and the spatial distribution showed typical negative relationship with elevation, with Pearson’s γ as −0.94, verified by two-tailed test, α = 0.01. There are four obvious belts with an interval of 400 °C in Figure 2a, I: the area with AAT0 ≤ 600 °C distributed in the summit M, and the ridges at the west corner, with Mt. Buqin and Mt. Bayan Har on the northern and southern edges respectively; II: the area with 600 °C < AAT0 ≤ 1000 °C mainly distributed in the river valley in the middle and west parts; III: the region with 1000 °C < AAT0 ≤ 1400 °C in the east and southeast edge of the SRYR; IV: the region where AAT0 > 1400 °C concentrated at the Zoige alpine wetland and Baihe river basin in the south corner and the outlet of the SRYR, Tangnaihai station in the north. The area and elevation features of each belt were listed in Table 3. The belts were distinctly negative with mean elevation and the range, and the belt II had the largest area share.
The areal mean AAT5 during 1979–2018 was 620 °C and also negatively related with elevation in spatial distribution, with verified Pearson’s γ as −0.92, α = 0.01. Four belts are distinct with an interval of 300 °C in Figure 2b, I: the area with AAT5 ≤ 400 °C similar to and larger than the region I of AAT0, except for the area around the summit M, the ridges at the west corner, and the north corner and the south edge in the middle; II: the area with 400 °C < AAT5 ≤ 700 °C scattered across the middle and west of the SRYR, mainly on the hillsides and river valleys; III: the region with 700 °C < AAT5 ≤ 1000 °C in the northeast wetlands and the east and southeast edges; IV: the region AAT5 > 1000 °C concentrated at the Zoige alpine wetland and the outlet of the SRYR, Tangnaihai station in the north. The area and elevation features of each belt were listed in Table 3. The belts were distinctly negative with elevation, and the belts ≤700 °C had the largest area share.

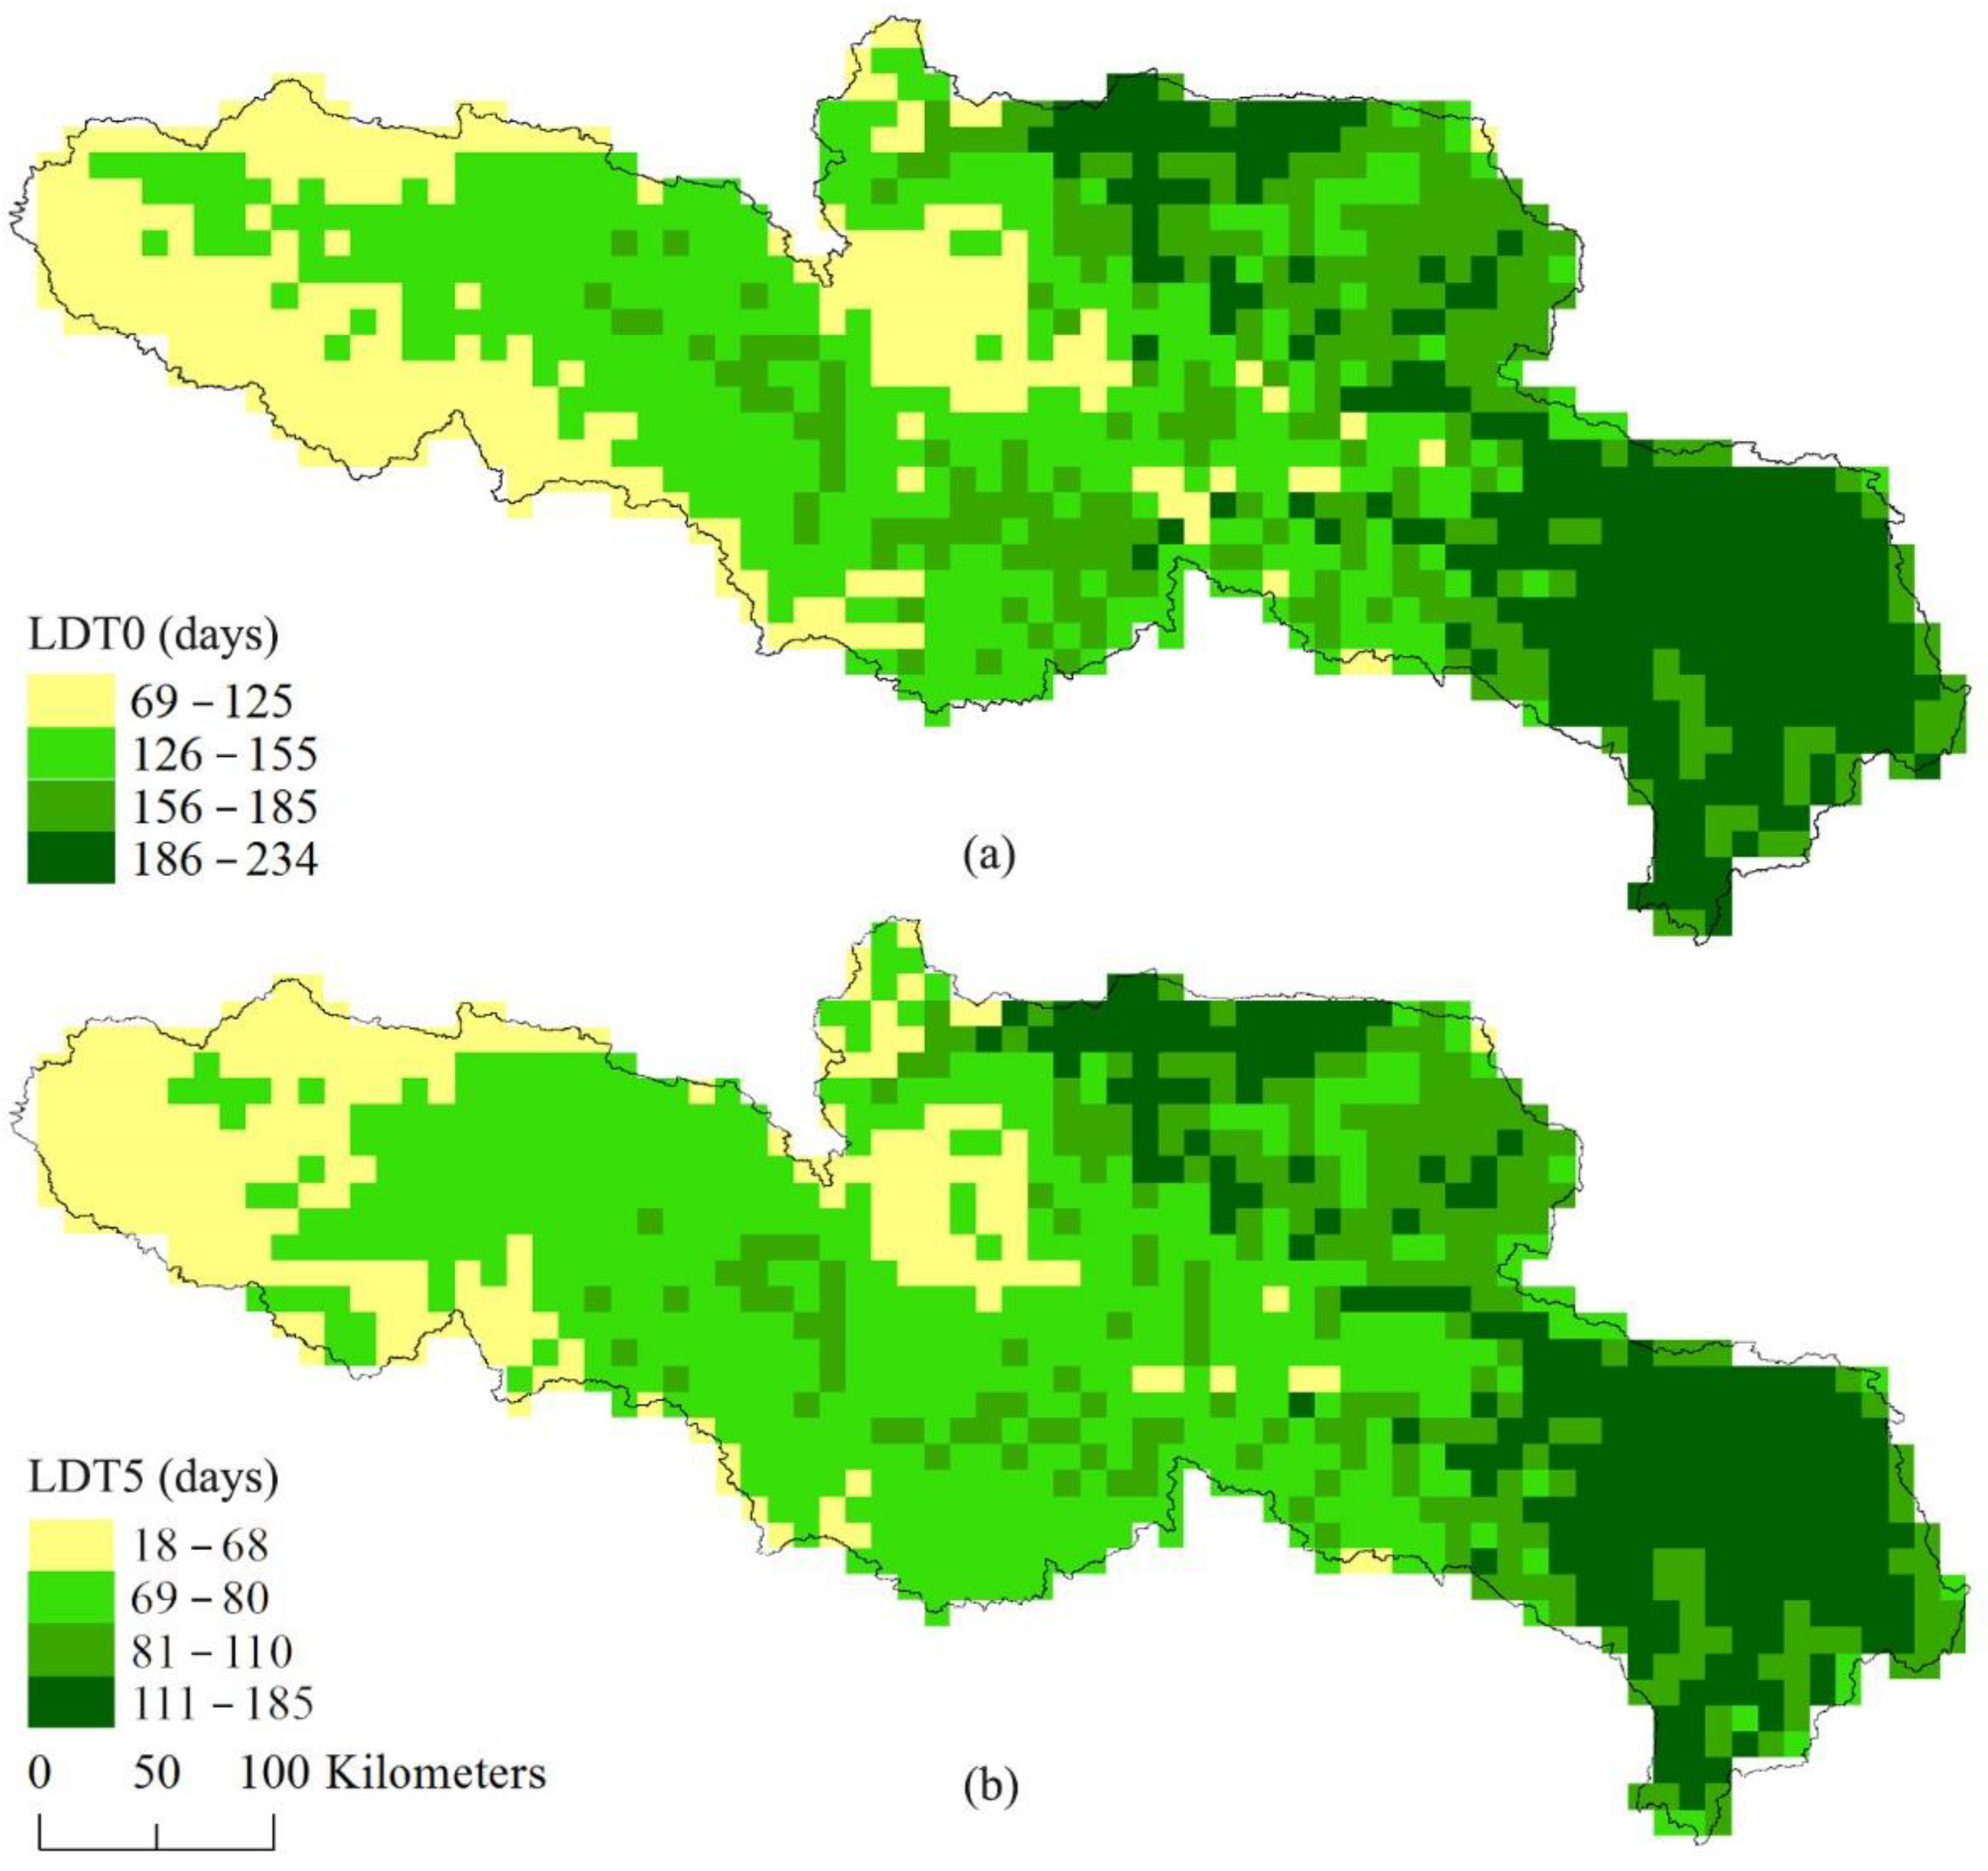
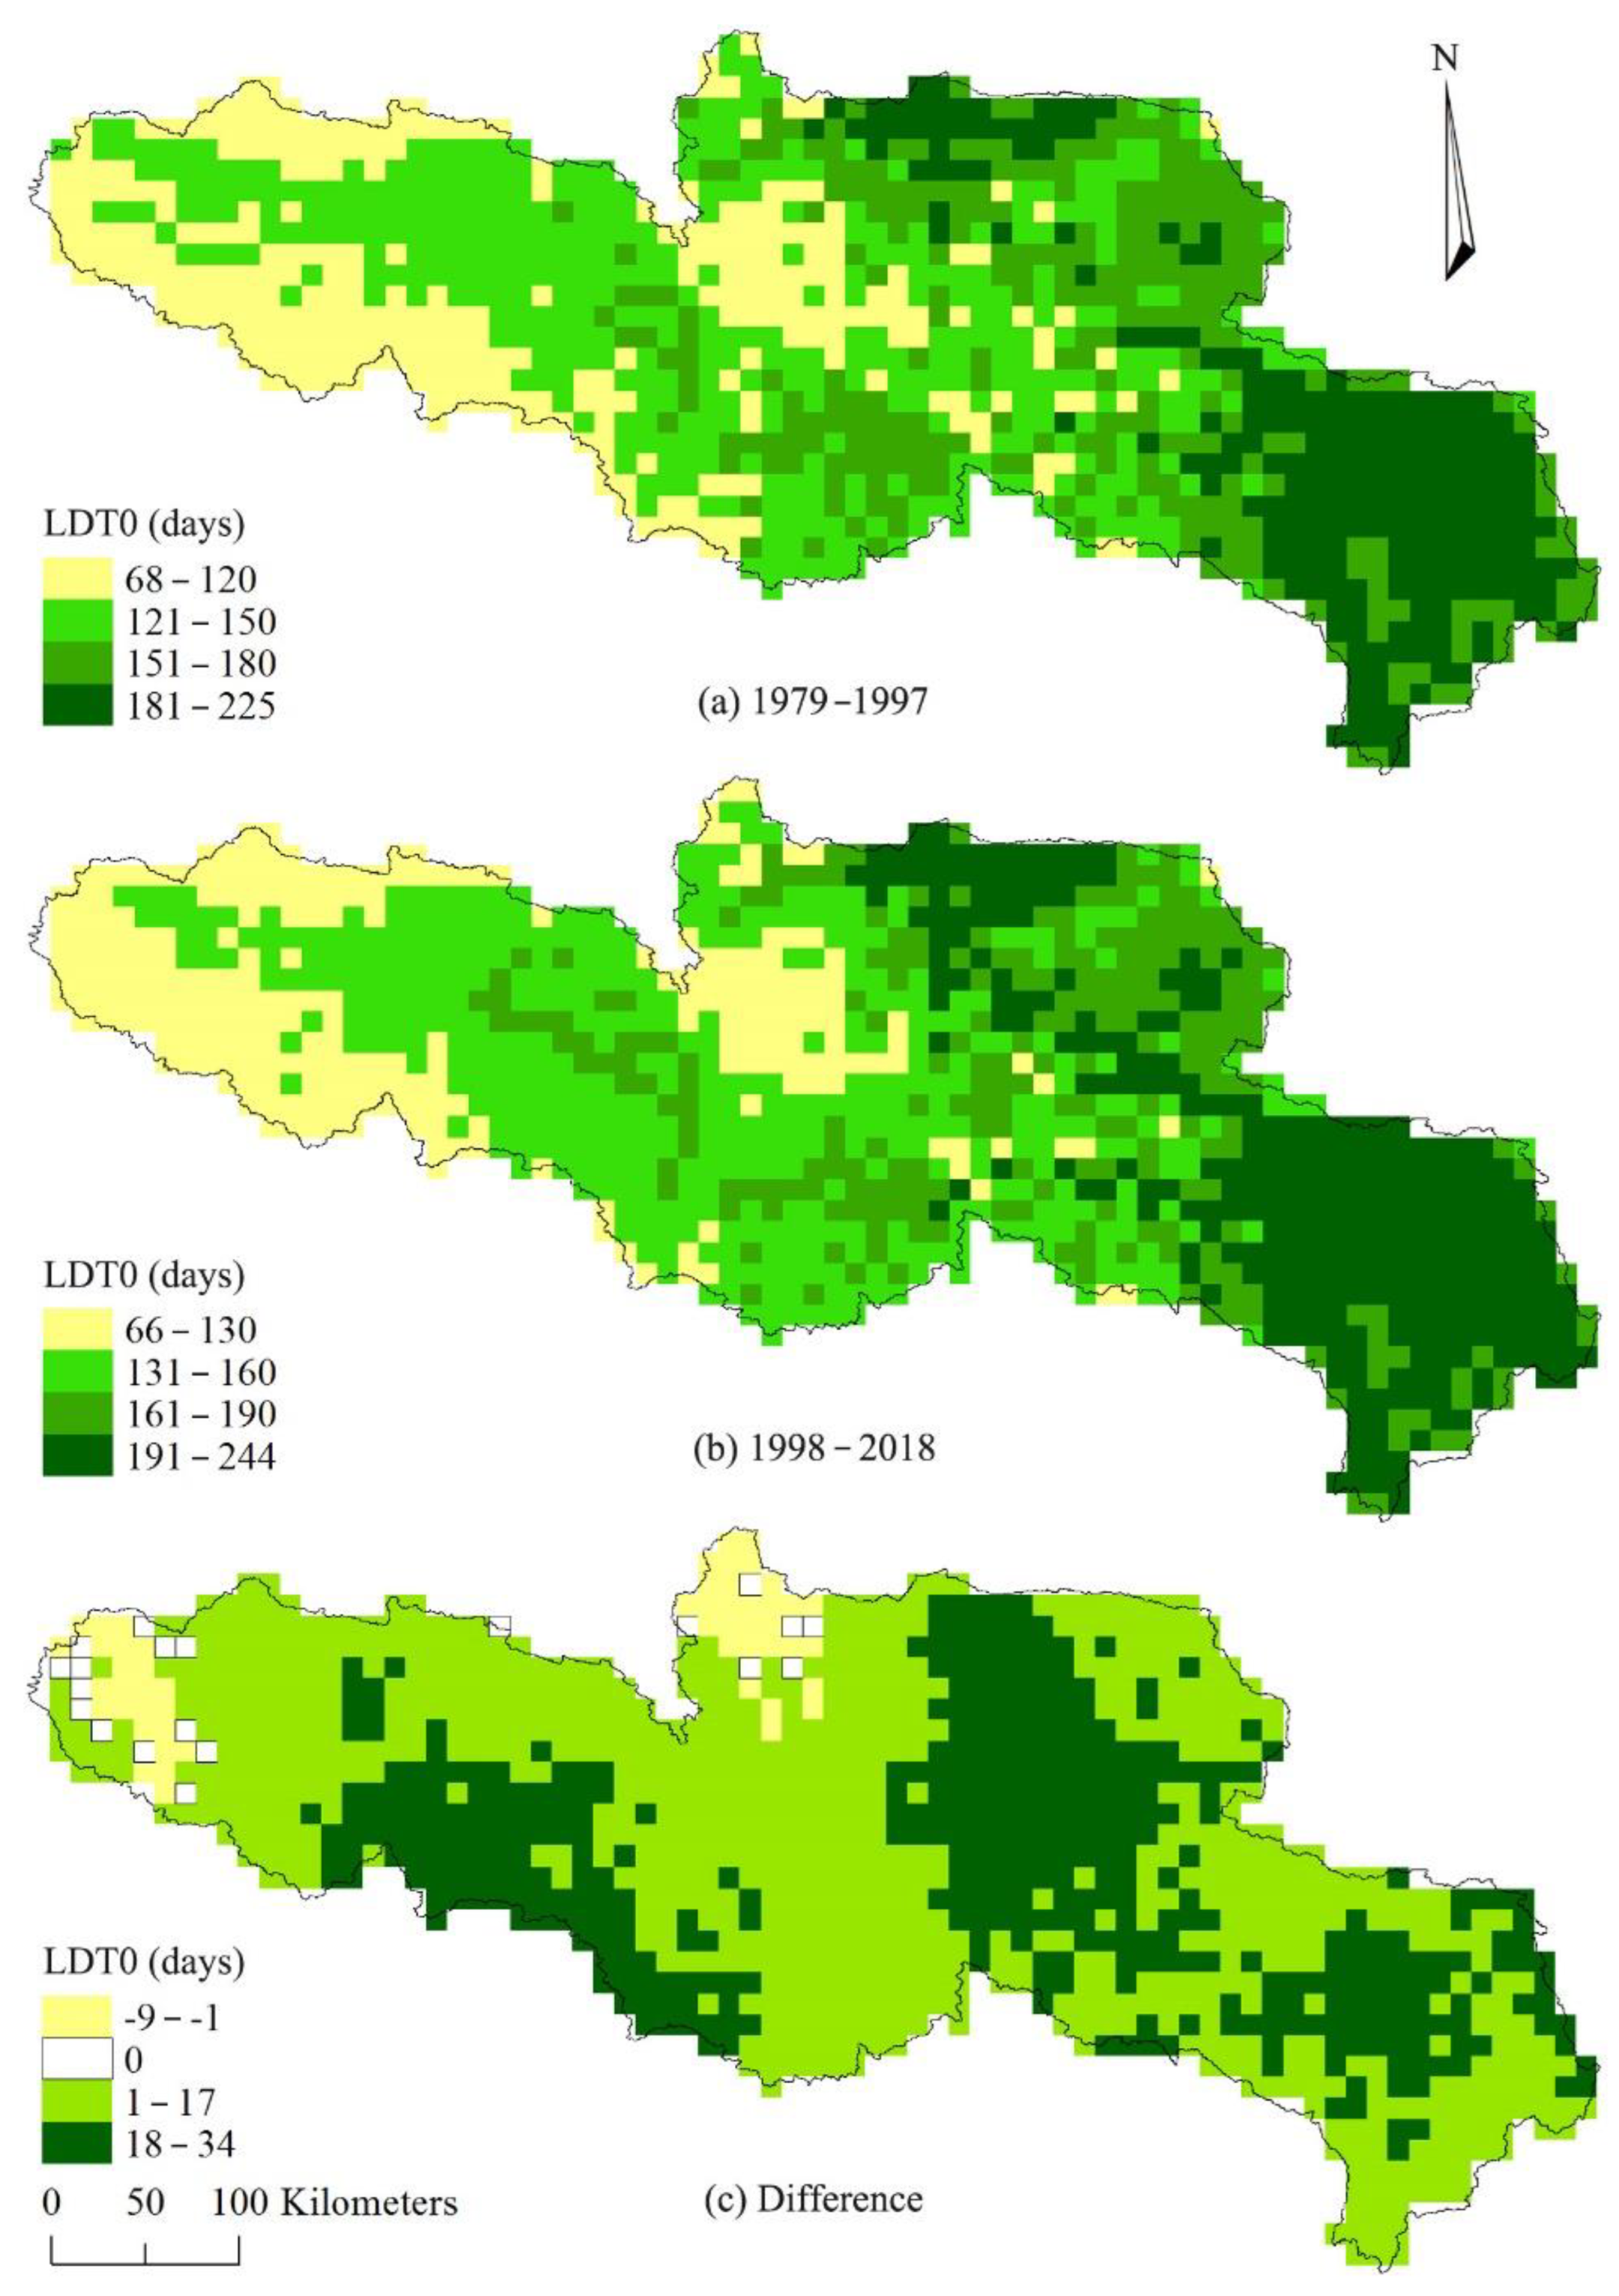
3.1.2. Distribution of LDT

The areal mean LDT0 of the SRYR during 1979–2018 was 153 days, ranging from 69 days to 234 days, and typically negatively related with elevation, with verified Pearson’s γ as −0.94, α = 0.01, in Figure 3a. The minimum demonstrated on the ridges of the mountains around, the Mt. Buqin, Mt. Bayan Har, and Mt. Amne Machin. The maximum was distributed in the Zoige alpine wetland and the outlet of the SRYR. The averaged LDT5 of the SRYR during 1979–2018 was 86 days, ranging from 18 days to 185 days, and similar to the LDT0 in the spatial distribution, with verified Pearson’s γ as −0.91, α = 0.01, in Figure 3b. Based on the LDT value, there were several distinct zones in the distribution. The area and elevation features of zones were listed in Table 4. The zones were negative to elevation, and the highest two zones mainly concentrated in the eastern part under the elevation of 4000 m.

3.2. Variation Trends

3.2.1. Trends of AAT

According to the linear regression analysis, the areal mean rising rate of AAT0 and AAT5 was 96 °C decade−1 and 90 °C decade−1 during the study period over the SRYR, with the coefficient of determination R2 as 0.73 and 0.66, respectively. The inclination rate of single grid AAT ranged from 60 °C decade−1 to 212 °C decade−1 during 1979–2018, in Figure 4. Linear growth AAT0 covered an area of 9.7 × 10⁴ km2, where rates were verified by the R2 ≥ 0.5 term, with a mean elevation of 4044 m and mean rate at 109 °C decade−1. While AAT5 grew linearly in a much smaller area of 4.6 × 10⁴ km2, with a lower elevation 3849 m and faster rate at 125 °C decade−1. Two threshold value 100 °C decade−1 and 130 °C decade−1 were taken according to the Natural Breaks for the partition of inclination rate to investigate geographic features in three zones separately. The area in each zone showed a descending order and a negative relation with its value, in AAT0, the minimum and the second zones had similar area around 4.0 × 10⁴ km2, about twice of that above 130 °C decade−1. While the relation in AAT5 was just the opposite, the area of three zones in an ascending value order was 0.9 × 10⁴ km2, 1.6 × 10⁴ km2 and 2.1 × 10⁴ km2, respectively. Zones were negatively related to elevation, for AAT0 the mean elevation in an ascending value order was 4234 m, 4007 m, and 3749 m, while for AAT5 was 4444 m, 3831 m, and 3628 m, respectively, in Table 5. To summarize, AAT0 and AAT5 grew linearly on the basin scale, and in long-time scale the linear-growth area accounted for 79% and 37% over the basin, respectively. AAT0 was mainly growth at a rate ≤130 °C decade−1 accounting for 81% of its linear-growth area with elevation ranging from 3000 m to 4900 m. While most AAT5 grew linearly at a rate >130 °C decade−1 over 46% of its area, mainly concentrated in the low eastern part, with a mean elevation of 3628 m.
The Mann-Kendall (M-K) test with a rejection rate of 5% was applied to test the monotonic trends of the 1200 AAT0 series during 1979–2018. Except the area of 2.6 × 10³ km2 around the Mt. Ela in the north corner displayed non-significant trends, 98% area showed significant increasing trend over the SRYR. The results in AAT5 were similar, but with more non-significant area as 6.1 × 10³ km2 around the Mt. Ela in the north and the Mt. Bayan Har in the west, and 95% area showed significant increasing trend. In summary, the AAT0 and AAT5 were found to exhibit significant increasing trends across the SRYR during the study period, except about 2% and 5% peak areas around the west and north edges, respectively.

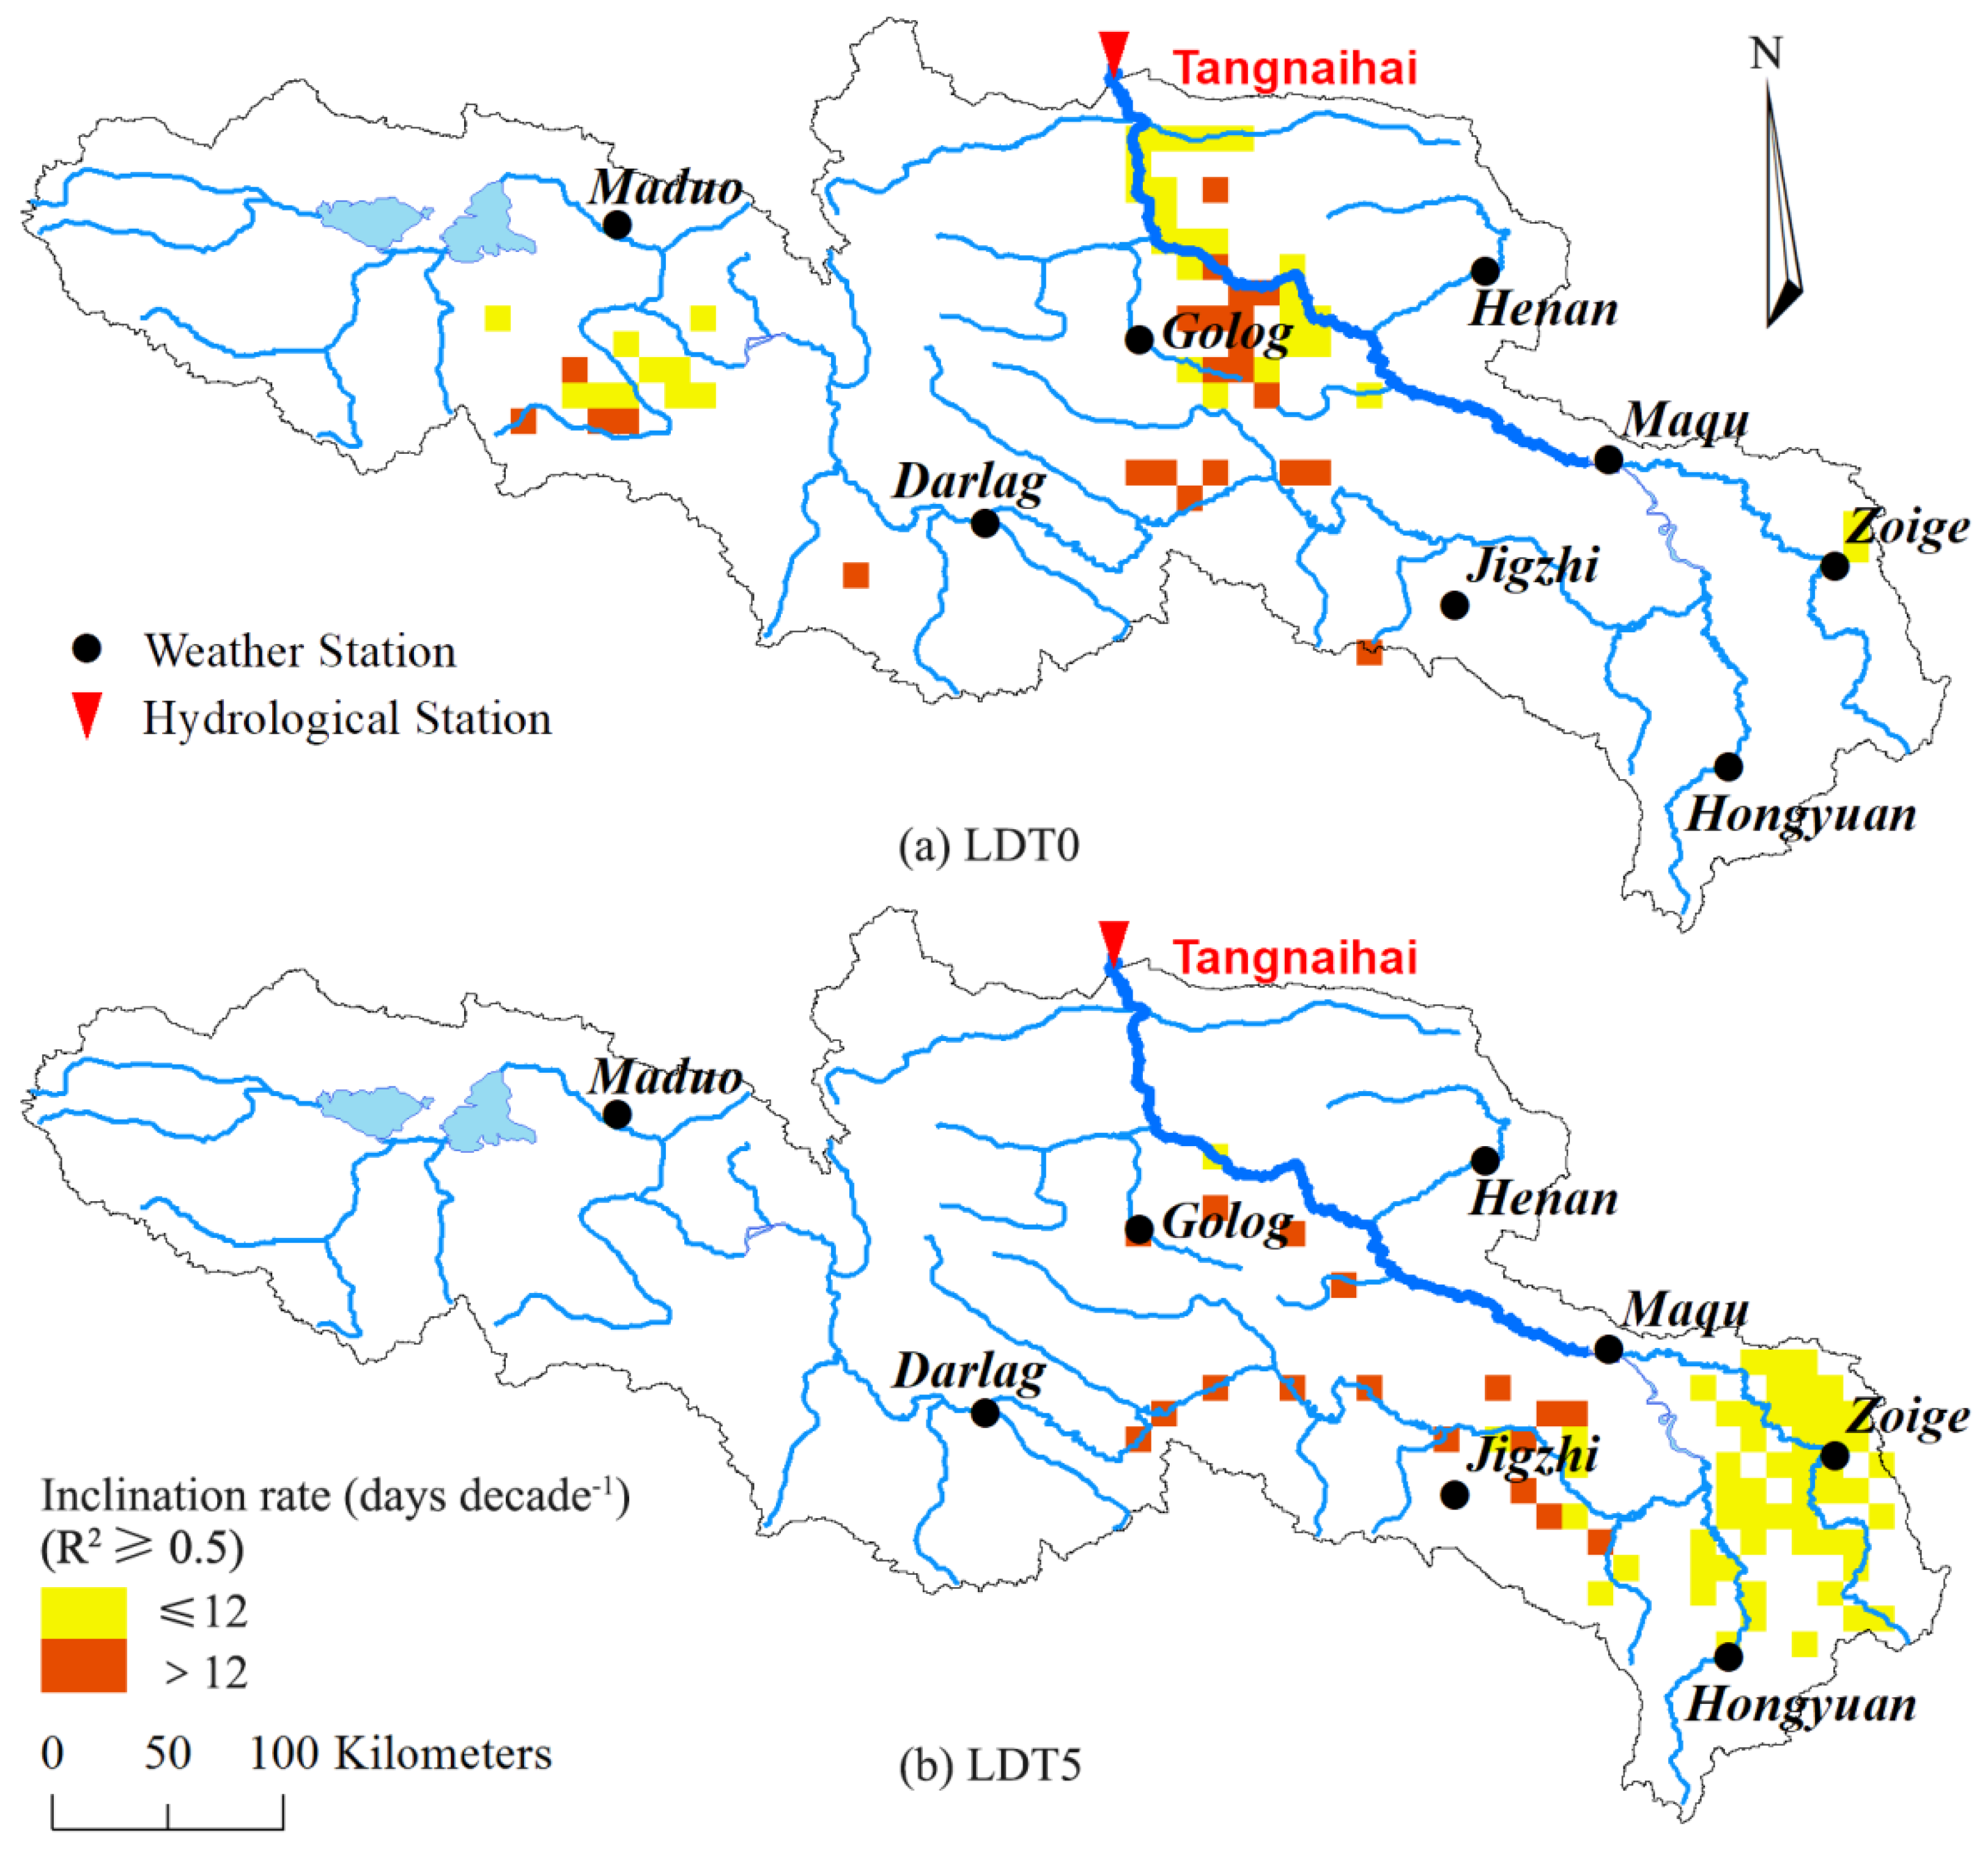
3.2.2. Trends of LDT

The areal mean LDT0 of the SRYR was linearly grew at the rate of 6.5 days decade−1 during the study period with a coefficient of determination R2 0.56, while the growth of areal mean LDT5 was nonlinear as the R2 was only 0.39. Spatially, LDT0 and LDT5 generally showed nonlinear growth over the SRYR, and the area with inclination rate during 1979–2018 was only 5.9 × 10³ km2 (5%) and 7.4 × 10³ km2 (6%), with a distinctly fast areal mean rate at 11.9 days decade−1 and 11.5 days decade−1, respectively. The minimum and maximum rising rate of LDT0 were 7.9 days decade−1 and 17.2 days decade−1, respectively. The rising rate of LDT5 ranged from 9.4 days decade−1 to 16.1 days decade−1. The spatial distribution of the area with verified linear rising rate was shown in Figure 5, and the area and elevation features in the area were listed in Table 6. There are basically two regions with effective rising rate of LDT0, the downstream of the Maduo station and the central area. The rate around the small area besides Golog station was >12 days decade−1, and other spots with high rates basically located along the river. The rising rates of LDT5 over and under 12 days decade−1 were generally separated under the elevation of 4.0 × 10³ m, with low rate around the Zoige alpine wetland, and high rate scattered along the river downstream the Darlag station and around the Golog station in the central part of the SRYR.
The trends in the LDT were tested through the M-K test with the rejection rate of 5% during 1979–2018, and the trends in the SDT and EDT were also tested to interpret the reason of the tendency of the LDT. The statistic UM-K of the 1200 LDT0, SDT0, and EDT0 series were calculated and the results of LDT0 were displayed in Figure 6a, together with the significant trends in the SDT0 and EDT0. There was a wide range of area with significant increasing trend in LDT0, covering 80% of the total, expect the mountainous areas in west and north corners and the middle. The area and elevation features in the area with significant increasing trend, non-significant increasing trend, and non-significant decreasing trend were listed in Table 7. The massive area with significant increasing trend had the smallest mean elevation and the smallest range, which suggested that it covered most of the area under 5345 m. To better interpret the reasons for the increase in the LDT0, the areas with significant increasing trend in the SDT0 and EDT0 were also draw in Figure 6a. The area of SDT0, EDT0 and LDT0 with significant increasing trend had obvious overlaps, and the two layers, LDT0 and SDT0/EDT0, and three layers overlap area was displayed in Table 8. The increasing trend of LDT0 could be explained by the tendency of SDT0/EDT0 or both at the overlap regions. To be exact, the whole area with significant increasing trend in the SDT0, 6.4 × 10⁴ km2, overlapped with the area of LDT0 with significant increasing trend. And 9.4 × 10⁴ km2 area of LDT0 with significant increasing trend overlapped with the area of EDT0 with significant increasing trend. The three layers overlap area accounted for 64% of LDT0 significant increasing area. In other words, 64% area of LDT0 with significant increasing trend could be explained by both the early onset and the late termination of the mean daily temperature ≥0 °C, and about 1%, 31% only by the early onset or the late termination of the mean daily temperature ≥0 °C, respectively.
The M-K test results of the LDT5, as well as the SDT5 and EDT5 with significant increasing trends were shown in Figure 6b. The area and elevation features in the area with significant increasing trend, non-significant increasing trend, and non-significant decreasing trend were listed in Table 7. The area of LDT5 with significant increasing trend had the smallest mean value and widest range in elevation, which suggested that the significant increasing trend spread and mainly concentrated in the low-elevation regions. The area of SDT5, EDT5 and LDT5 with significant increasing trend, and two or three layers overlap area was displayed in Table 8. The area of SDT5 with significant increasing trend overlapped 61% area of LDT5 with significant increasing trend, and the area of EDT5 with significant increasing trend overlapped 84% area of LDT5 with significant increasing trend. Three layers overlapped 53% area of LDT5 with significant increasing trend, basically in the low eastern part, where the increasing trend of LDT5 was thought to be the combined efforts of the early onset and late termination of the mean daily temperature ≥5 °C. About 31% area of LDT5 with significant increasing trend around the summit M and some areas along the boundary of the Mt. Bayan Har could be the results of the late end date with mean daily temperature ≥5 °C, since two layers of LDT5 and EDT5 overlapped. For the similar reason, the cause of the significant increasing trend of LDT5 in small region near the Maduo station, about 7% area of LDT5 with significant increasing trend, might lie in the early start date with mean daily temperature ≥5 °C.

3.3. Spatiotemporal Variation

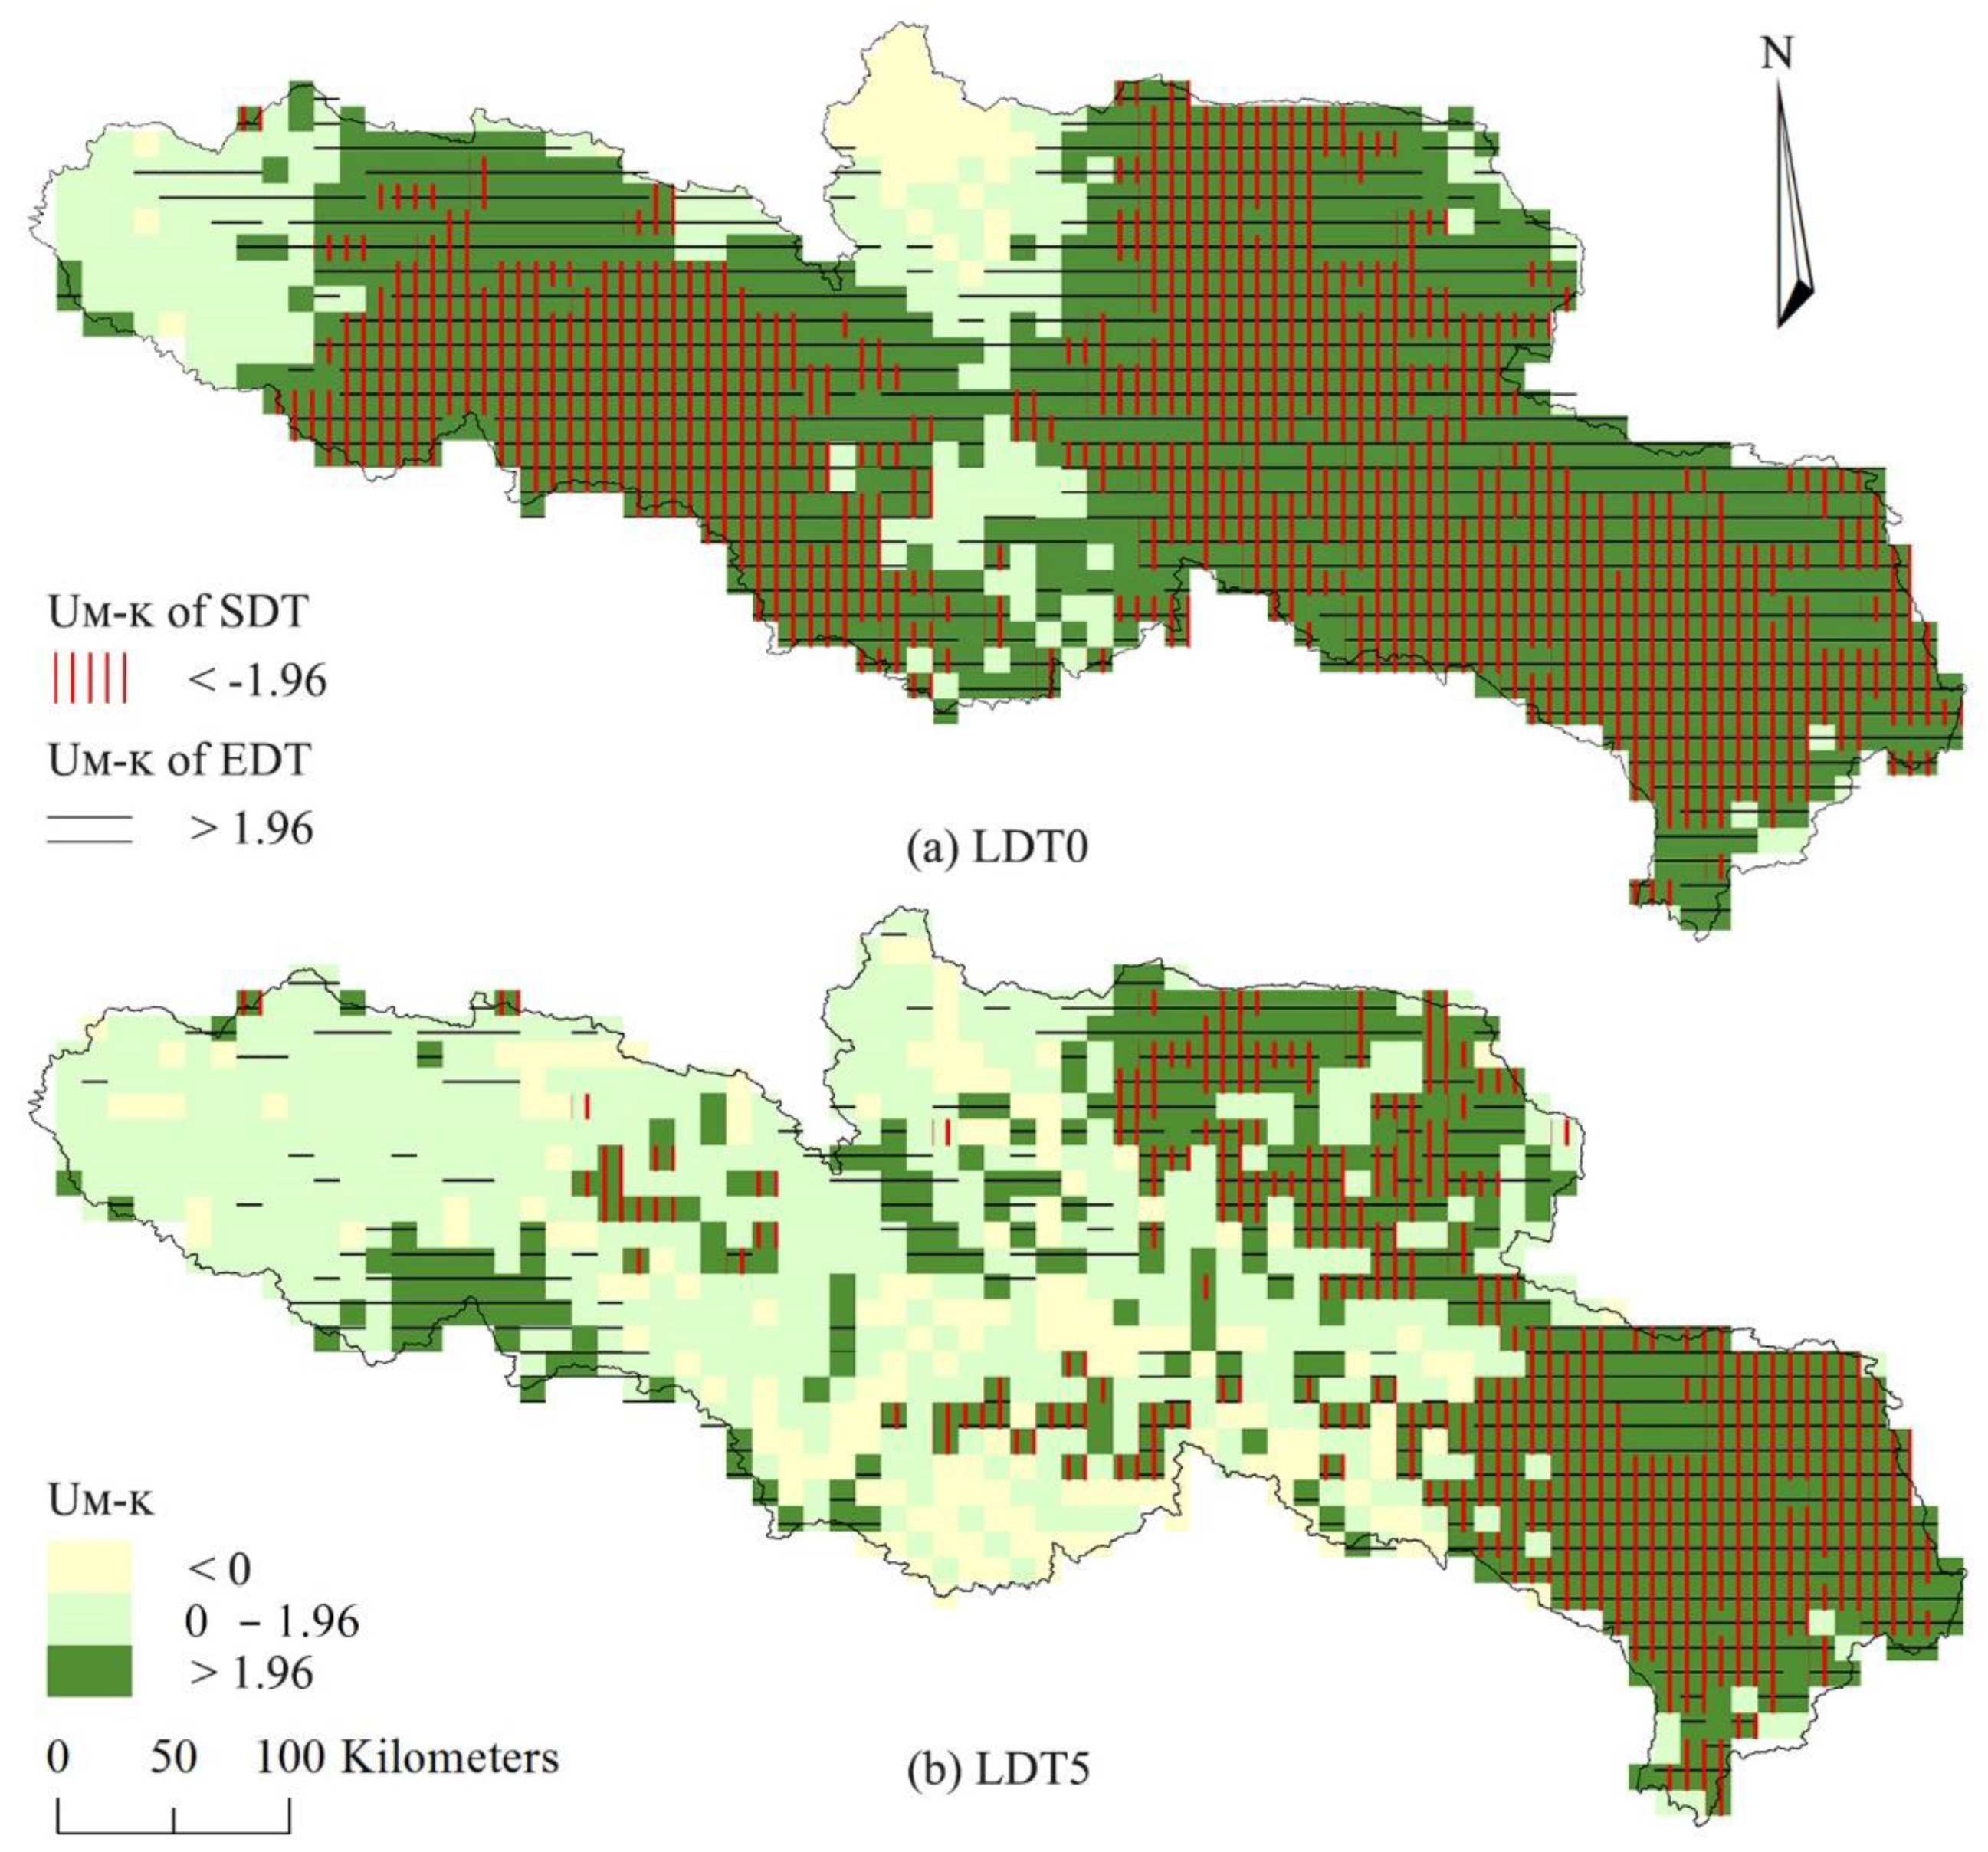
3.3.1. Abrupt Change Analysis

The Pettitt test with a rejection rate of 5% was applied to detect the stationarity of the time series of the AAT. Both areal mean AAT0 and AAT5 of the SRYR exhibited abrupt change in 1997. Only 25 AAT0 series out of 1200 passed stationarity test. The effective abrupt years were detected from 1990 to 2004, except 1992, 1996 and 2001. The distribution patterns of the abrupt years were obviously disturbed by 1997, in Figure 7a. Table 9 showed the area and elevation features of three periods according to the year 1997. The area of abrupt change in 1997 accounted for 66% of the SRYR, and had the widest range and the smallest mean value in elevation. In summary, 1997 was a dominant abrupt year in AAT0 across the SRYR, with a mean elevation of 4.0 × 10³ m slightly lower than the basin mean. 1997 is also the well-known abrupt year of the annual mean temperature on the SRYR. Abrupt changes were detected in 1100 AAT5 series on the SRYR during 1979–2018, from 1990 to 2007 except 1991 and 2006. Unlike AAT0, no distinct abrupt years displayed in the AAT5, in Figure 7b. Spatially, the abrupt changes of AAT launched at high-elevation regions from the northwest edge and the summit neighborhood before 1997, and the south corner experienced abrupt change most recently after 2002. Abrupt year in 1997 was mainly concentrated along the east and south boundary zones, covering most low-elevation region with a mean elevation about 4000 m.
Abrupt changes also existed in LDT0 and LDT5 with 1079 and 842 grids detected respectively. There were abrupt changes every year during 1979–2018 in both LDT. LDT0 changed most in 1997, with 342 grids, followed by 2002 and 2004, with 179 and 120 respectively, and no other year changed more than 100 grids. Three years witnessed more than 100 grids abrupt changing in LDT5, 1993, 2004, 1999, with 153, 112 and 101 grids respectively. Even though most grids in both AAT0 and LDT0 abrupt changed in 1997, LDT0 was not a reliable direct reason for the changes in AAT0, as the Pearson’s γ was only 0.25, checked by two-tailed test, α = 0.01. While the Pearson’s γ reached 0.48 between the abrupt year series between AAT5 and LDT5, and both relatively random in distribution pattern. DEM could not explain the changes in space either, according to the verified Pearson’s γ, which were −0.44, −0.19, −0.09 and 0.12 for LDT5, AAT5, AAT0 and LDT0.

3.3.2. Variation between Divided Stages

Abrupt changes of the AAT occurred gradually over the SRYR; however, a change point should be identified for quantifying changes. Abrupt year of 1997 was identified in AAT0 and LDT0, thus adopted to divide the study period of into two stages, 1979–1997 and 1998–2018. The averaged AAT0 and LDT0 series of each stage and the variation between them were studied. The areal mean AAT0 was increased from 795 °C to 996 °C between the two stages before and after 1997. Linear growth of the AAT0 only existed in the second stage, and the mean inclination rate was 104 °C decade−1 of the SRYR with the coefficient of determination R2 as 0.56. Spatially, the area with linear rising rate passing the R2 ≥ 0.5 was 3.9 × 10⁴ km2, accounting for 32% of the total area, and the areal mean rate was 143.4 °C decade−1, ranging from 95.2 °C decade−1 to 195 °C decade−1. It majorly concentrated at four regions, the south region of the Maduo station along the Mt. Bayan Har, the southeastern corner, small region around the Zoige station, and a large region in the middle nearby the Golog station. The spatial distribution of the stage-average AAT0 and the variation among the specified belts between two stages was shown in Figure 8. There was an obvious extension in three belts >600 °C, and the extended area increased with AAT0 value, while the belt I shrunk 2.2 × 10⁴ km2. The geological features of the variation between AAT0 belts were listed in Table 10. In general, the variation of the AAT0 belts was negatively related to elevation and longitude in space. In conclusion, an upward-shift trend of elevation was found in the variation of AAT0. The area of 57% in AAT0 did not change belts between stages, and 18%, 15%, and 10% jumped from the original belt to the next level, I-II, II-III, and III-IV, respectively.
The areal mean LDT0 increased from 146 days to 160 days between the two stages before and after 1997, with distribution negative to elevation, shown in Figure 9. Except small regions in the west and the north corner, the SRYR shows a general rise in the LDT0, up to 34 days. The high rise mainly concentrated in three regions, hillsides of the Mt. Bayan Har along the southwest edges, middle part and regions around the Zoige alpine wetland in Figure 9c. There was 94% area of SRYR extended in LDT0. The geographic features among the difference in LDT0 were listed in Table 10. The LDT0 mainly grew nonlinearly both during the whole study period and each stage. Temporally, the R2 of the areal mean growth rate did not pass the R2 ≥ 0.5 term in the linear regression analysis during both stages; and spatially, no rate series was verified in the analysis during the previous stage, and only one grid passed the term during the recent stage.

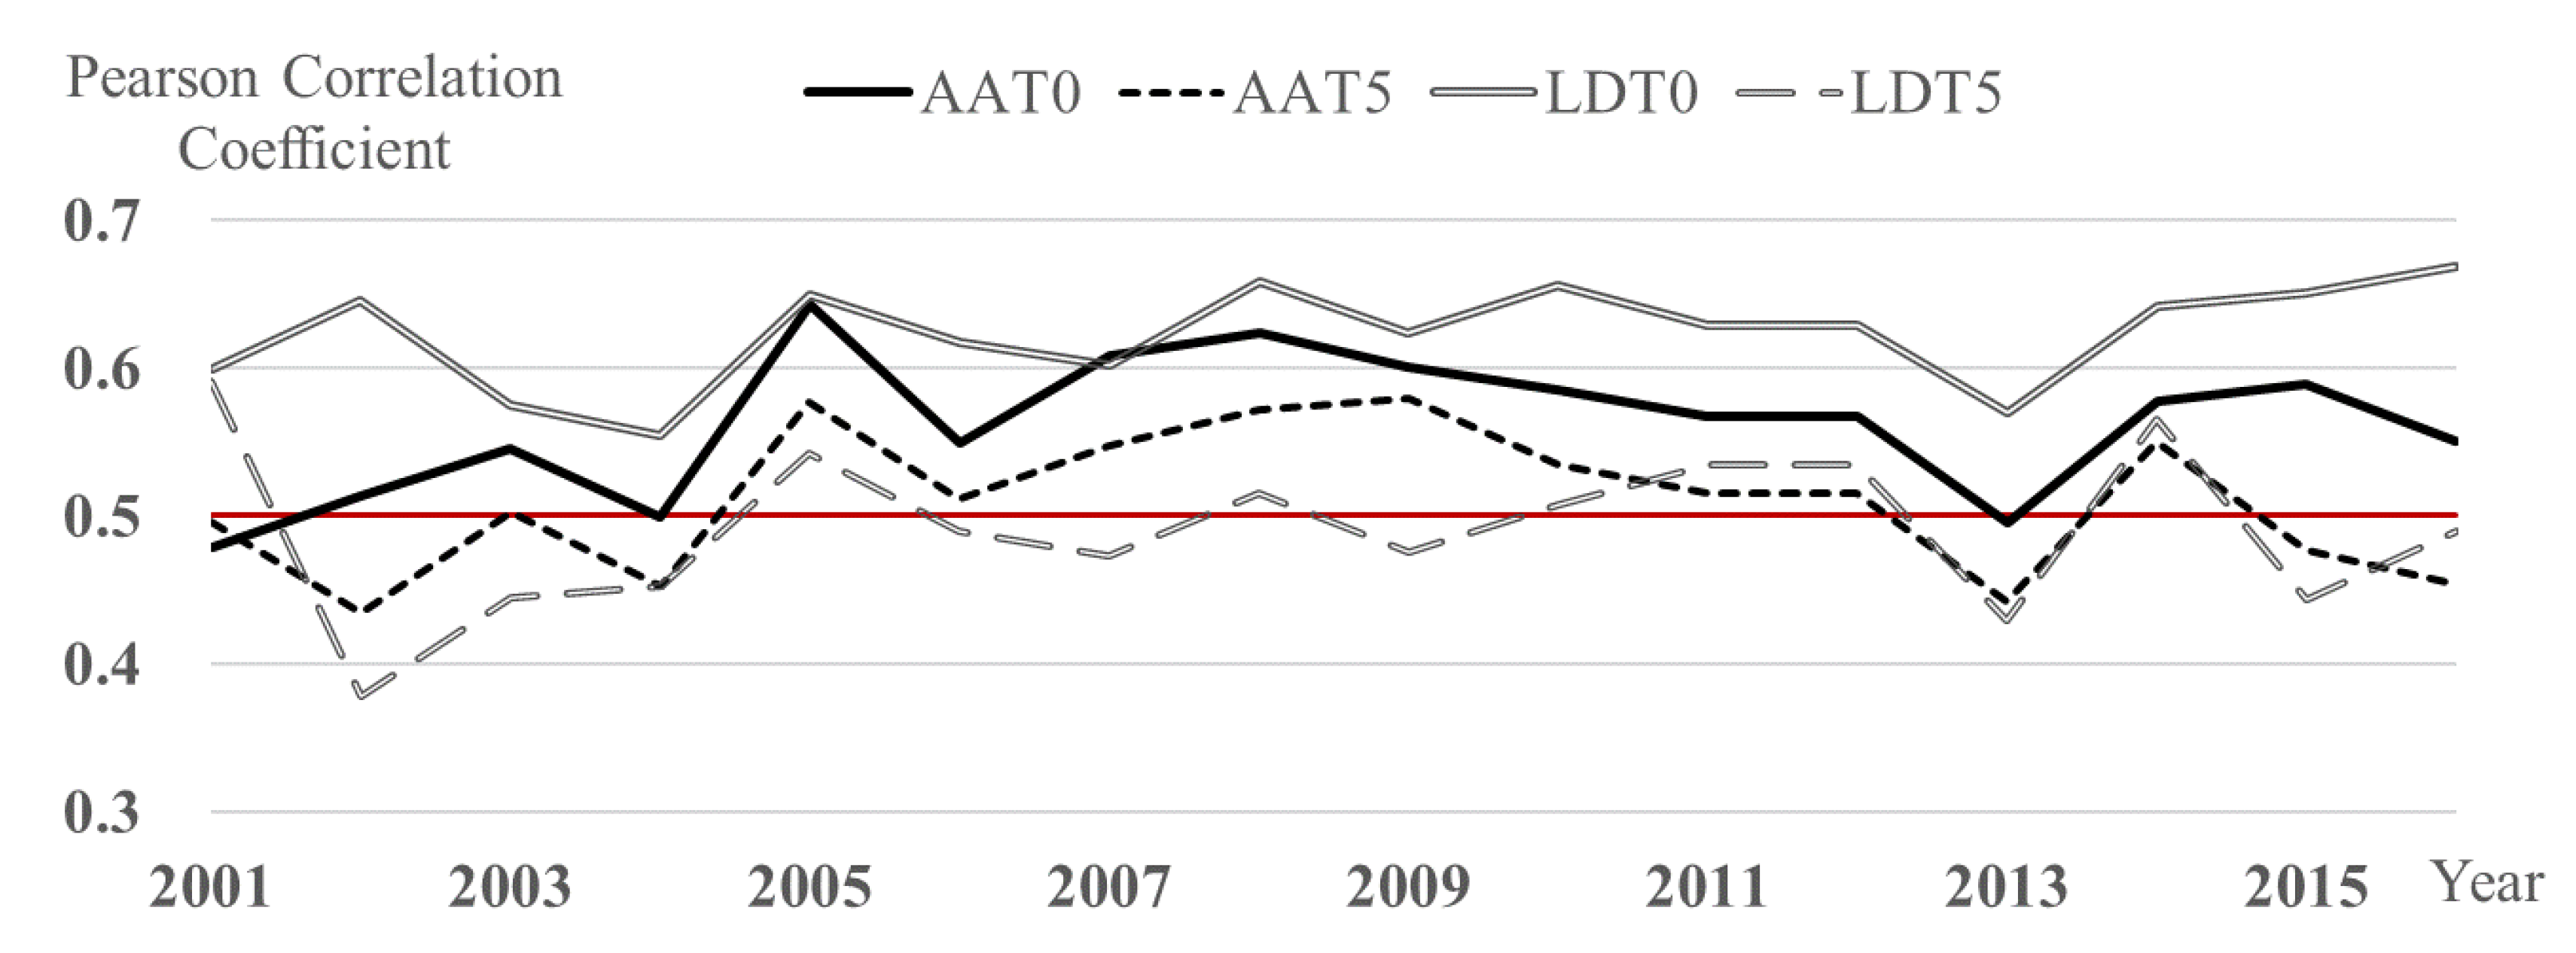
3.4. Correlation with NDVI

3.4.1. Temporal Analysis

There existed linear correlation between NDVI and indicators, with ≥0 °C indicators stronger than ≥5 °C indicators. The annual series of Pearson’s γ, Spearman’s ρ and Kendall’s τ between NDVI and indicators over the 1200-grid data in the SRYR during 2001–2016 were calculated and all verified by two-tailed T test, α = 0.01, and the features of results were listed in Table 11. The three linear correlation coefficient had similar values, with Pearson’s γ less than Spearman’s ρ and larger than Kendall’s τ. The annual series of ≥0 °C indicators ranged from 0.4 to 0.8, larger than ≥5 °C indicators series by 0.1, therefore the relationship was positive and ≥0 °C indicators were relatively closer to NDVI. It was obvious that the Pearson’s γ annual series of ≥0 °C indicators almost stayed above the 0.5 line in Figure 10. LDT0 showed the closest relationship with NDVI among indicators, with mean Pearson’s γ as 0.62, followed by AAT0 and AAT5, the correlation was relatively poor with LDT5, with mean Pearson’s γ as 0.49.

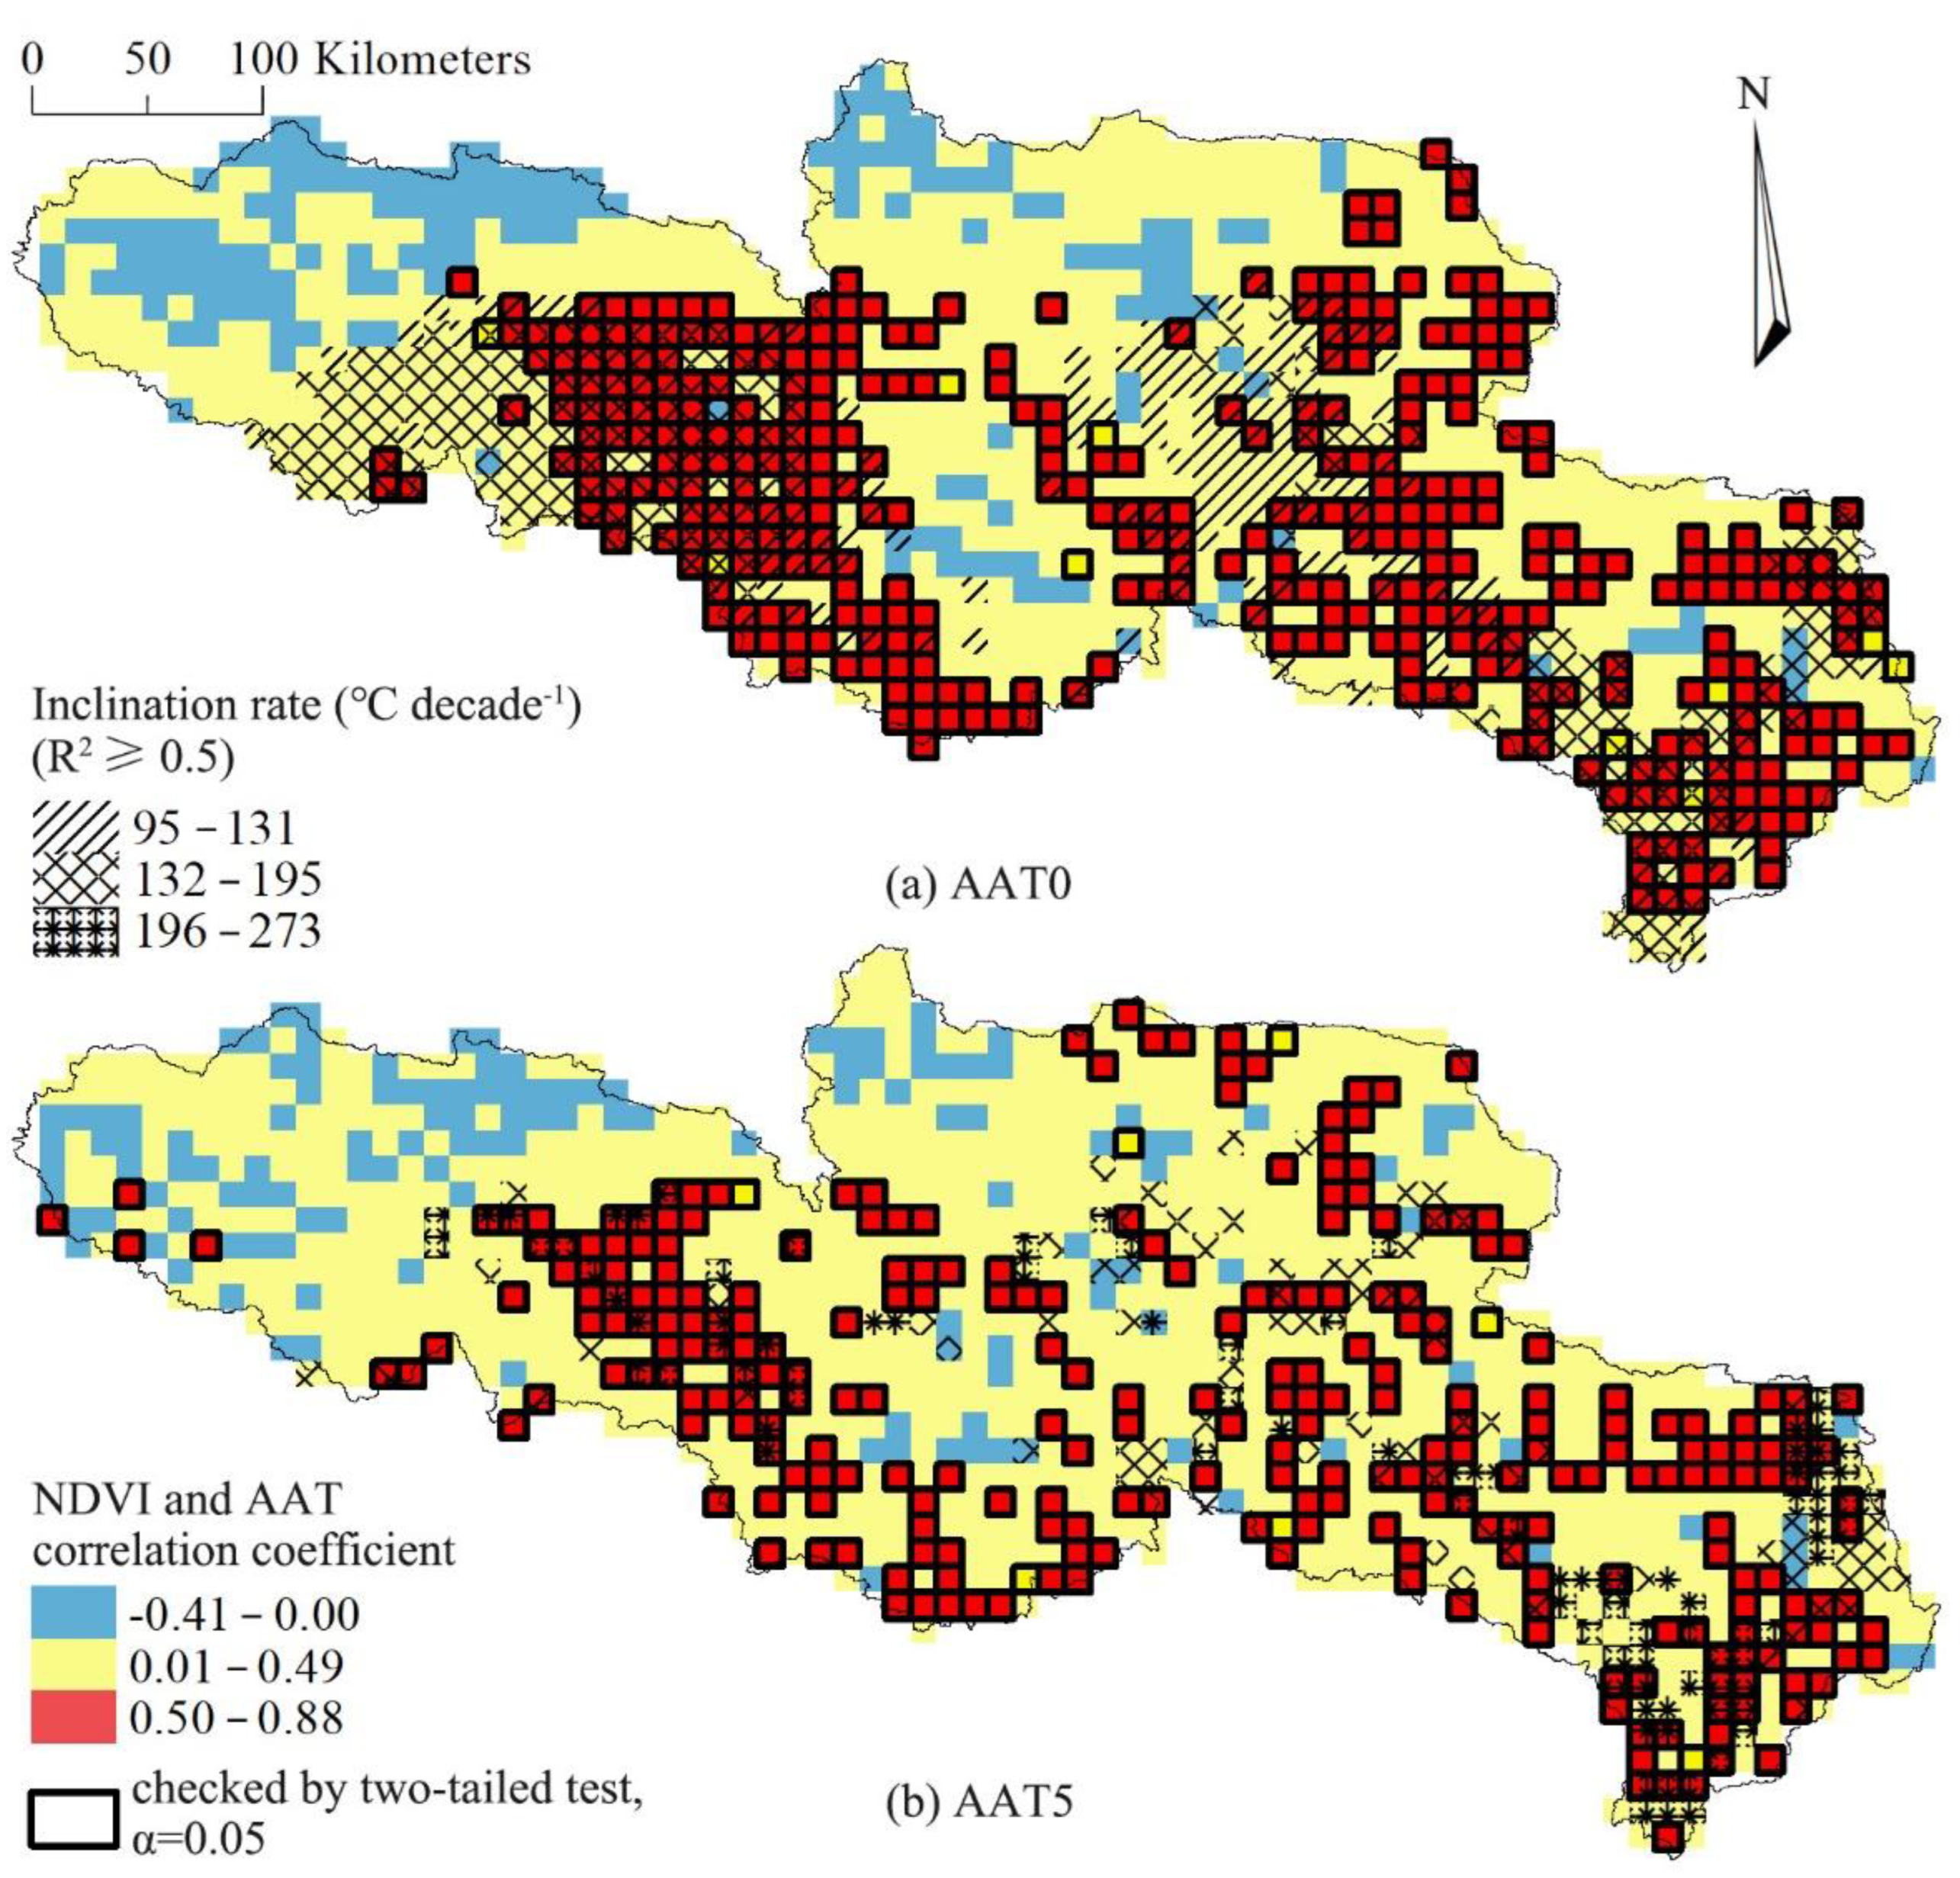
3.4.2. Spatial Analysis

The Pearson’s γ between annual maximum NDVI and indicators during 2001–2016 were calculated and the results were shown in Figure 11 and Figure 12, and the number of grids with three verified correlation coefficients in indicators checked by two-tailed T test, α = 0.05, were listed in Table 12. There were more annual series followed rank order in linear correlation analysis, as Spearman’s ρ and Kendall’s τ slightly over the Pearson’s γ in most indicators. There were obviously more verified grids in ≥0 °C indicators than in ≥5 °C indicators. No grids verified by the test valued from −0.49 to 0.48, that is to say, as long as the grids had linear correlation between NDVI and indicators, the relationship was close. Spatially, as the Pearson’s γ no less than 0.49, the checked grids had positive and close relationship between NDVI and AAT. Figure 11 also displayed the grids with verified inclination rate, ranging from 95 °C decade−1 to 195 °C decade−1 in AAT0 and from 132 °C decade−1 to 273 °C decade−1 in AAT5 during 1998–2018. 379 grids linearly grew, not the same 373 grids linearly correlated with NDVI, but there were 177 overlaps in AAT0. The overlap could be seen around the Requ basin and in the eastern lower regions. Besides, during the recent stage, 929 grids out of 1200 in AAT0 were detected with significant increasing trend, covered most area expect the north edge. AAT5 had 171 linear growth grids and 58 linear relating to NDVI grids, and overlap was remarkable. The grids linearly corelated with NDVI in LDT were quite less than AAT in Figure 12. Differ from AAT, although very few negative relationships existed between LDT and NDVI. The positive close linear correlation between LDT0 and NDVI mainly gathered around the Requ basin, while scattered in LDT5. 58 and 72 grids linearly grew in LDT0 and LDT5, respectively, with similar rate. The overlap was not obvious in Figure 12. The eastern low regions displayed overlaps in most indicators except LDT0, where the indicators are higher and grow faster.
It should be considered that in the study the annual time series of NDVI only contained 16 items. The two-tailed T test requires long time series; however, it effectively eliminated all the poor relationship grids. So, the results might not be sufficient to explain the correlation between NDVI and indicators in space, and need further research. From this aspect, the results in the temporal analysis could be more reliable in the correlation study. The LDT0 and AAT0 could strongly promote the NDVI on an annual basis and basin scale.

4. Discussion

Xu and Li [32] extended the accumulated temperature research, by taking ≥10 °C annual accumulated temperature (AAT10) to study the crop probability in the arid climate under the changing environment, meanwhile detecting ≥0 °C annual accumulated temperature to analyze the climate warming effects on the ecologically fragile desert regions. The study displayed that the AAT10 and AAT0 both increased during the study period, however they changed with different rates and patterns. Our study mainly focused on the ecosystems, thus ≥0 °C and ≥5 °C annual accumulated temperature and their lasting days were considered, and also found that AAT0 and AAT5 both increased with differences in the variation temporally and spatially. A few researchers aim at natural vegetation variation under the changing climate through temperature analysis, but Xu and Li [32] studied the spatial and temporal variability of key bio-temperature indicators on the TP, by using the mean daily temperature at the weather stations. They also found an increase in the AAT at the regional scale, however due to their limited and low-elevation located data source as well as large spatial scale, the rising rates could not be comparable. We applied multi-source data product CMFD and remote sensing materials, to investigate the spatial variation on a relatively smaller scale.
Many researches proved that global warming causes significant changes in vegetation, especially on the most sensitive cold regions on the earth. Warming in general would enhance vegetation growth with the increase of incoming energies, which has been revealed by satellite observations of vegetation greenness on the TP grasslands [33]. Climate change should be responsible for a significant increase in annual NPP [23] and LAI at the beginning of the growing season over the SRYR [34]. Cong, Shen, Yang, Yang, Zhang and Piao [33] analyzed the growing-season partial correlation coefficient between NDVI and temperature during 1982–2011, and found an increasing relationship in the start (May–June) and end (September) of the growing seasons. The findings in this study supported the similar conclusion, by investigating the correlation between annual maximum NDVI and the active accumulated temperature during 2001–2016. There existed close linear correlation between NDVI and indicators, especially the ≥0 °C indicators on an annual basis and basin scale. It agrees with that the land cover dominated by grasslands over the basin, which ends dormancy at 0 °C. The linear correlation coefficients, Pearson’s γ, Spearman’s ρ and Kendall’s τ, were similar but not the same, thus the correlation was generally linear, but the accumulated temperature alone could not explain the variations in NDVI, since they did not grow strictly together. Spatially, the close linear correlation grids generally overlap the remarkable linear rising AAT0 during the recent stage. Thus, the fast growth of accumulated temperature would strongly enhance vegetation activities in the SRYR, as well as the extension of its lasting days, although not the only factors. Even though the correlation analysis eliminated the grids with poor relationship by two-tailed test, the time series still too short to sufficiently support any conclusion in space. Thus, the influence of climate change on the local vegetation activities needs further attention.

5. Conclusions

The mean daily temperature were employed in the study to investigate the variations in the bio-related climate indicators, ≥0 °C, ≥5 °C annual accumulated temperature (AAT0, AAT5) and the respective lasting days (LDT0, LDT5), and their correlation with annual maximum NDVI on a major alpine grassland, the source region of the Yellow River. During 1979–2018, the areal mean AAT0 (AAT5) and LDT0 (LDT5) in the SRYR was 895 (620) °C, 153 (86) days, respectively, typically negative with elevation in space. The AAT0 (AAT5) exhibited significant increasing trends across the SRYR and increased linearly accounted for 79 (37) % area at 109 (125) °C decade−1, with the area of AAT5 mainly in the low eastern part. The average linear growth rate of LDT0 was 6.5 days decade−1, and LDT5 grew nonlinearly on the basin scale. LDT0 (LDT5) demonstrated significant increasing trends over 80 (43) % area. Most LDT extended due to the combined efforts of the early onset and late termination of the given temperature, and the termination date was significant delayed across the region.
Abrupt point of 1997 was adopted to divide the study period into two stages. The areal mean AAT0 and LDT0 increased by 201 °C and 14 days, respectively. Linear growth was only detected during the second stage in the areal mean AAT0 at the rate of 104 °C decade−1, prominently accelerated comparing to 96 °C decade−1 of the study period. The AAT0 was partitioned into four belts to analyze the spatial variation, by 600 °C, 1000 °C and 1400 °C. The belts displayed an upward-shift trend in elevation, with 43% area of AAT0 raising one belt. LDT0 extended over 94 % area of the SRYR between stages.
The NDVI has close correlation with ≥0 °C indicators on the basin scale on an annual basis, according to the Pearson’s γ, Spearman’s ρ and Kendall’s τ correlation coefficient. Spatially, the 373 grids closely related to NDVI during 2001–2016 have about 50% overlaps with the 379 linear growth AAT0 grids during recent period, and all covered with the area the AAT0 significantly increasing. In conclusion, the rapid growth of AAT0 and LDT0 would strongly promote NDVI on the SRYR, and the influence of climate change on the local vegetation activities needs further and long-lasting attention.

Author Contributions

Conceptualization, G.L.; Data curation, H.G.; Formal analysis, G.L.; Funding acquisition, H.G. and D.H.; Investigation, Y.H.; Methodology, J.L.; Project administration, H.G.; Resources, J.L.; Software, J.L. and H.G.; Supervision, G.L. and J.L.; Validation, Y.Y.; Visualization, H.G.; Writing—original draft, H.G. and G.L.; Writing—review & editing, H.G. All authors have read and agreed to the published version of the manuscript.

Funding

This research was supported by the Natural Science Foundation of Zhejiang Province (Grant No. LZJWY22D010002); the Open Fund of Key Laboratory for Technology in Rural Water Management of Zhejiang Province (Grant No. ZJWEU-RWM-20200202B); the Major Project Fund of Zhejiang Provincial Department of Water Resources Science and Technology Program (Grant No. RA2008).

Conflicts of Interest

The authors declare no conflict of interest.

References

  1. Masson-Delmotte, V.; Zhai, P.; Pirani, A.; Connors, S.L.; Péan, C.; Berger, S.; Caud, N.; Chen, Y.; Goldfarb, L.; Gomis, M.I.; et al. Summary for Policymakers. In Climate Change 2021: The Physical Science Basis; Yu, R., Zhou, B., Eds.; Cambridge University Press: Cambridge, UK; New York, NY, USA, 2021. [Google Scholar] [CrossRef]
  2. Elmendorf, S.; Henry, G.; Hollister, R.; Björk, R.; Bjorkman, A.; Callaghan, T.; Siegwart Collier, L.; Cooper, E.; Cornelissen, J.; Day, T.; et al. Global assessment of experimental climate warming on tundra vegetation: Heterogeneity over space and time. Ecol. Lett. 2012, 15, 164–175. [Google Scholar] [CrossRef] [PubMed]
  3. Suseela, V.; Conant, R.T.; Wallenstein, M.D.; Dukes, J.S. Effects of soil moisture on the temperature sensitivity of heterotrophic respiration vary seasonally in an old-field climate change experiment. Glob. Change Biol. 2012, 18, 336–348. [Google Scholar] [CrossRef]
  4. Bond-Lamberty, B.; Thomson, A. Temperature-associated increases in the global soil respiration record. Nature 2010, 464, 579–582. [Google Scholar] [CrossRef] [PubMed]
  5. Zhang, T.; Zhang, Y.; Xu, M.; Xi, Y.; Zhu, J.; Zhang, X.; Wang, Y.; Li, Y.; Shi, P.; Yu, G.; et al. Ecosystem response more than climate variability drives the inter-annual variability of carbon fluxes in three Chinese grasslands. Agric. For. Meteorol. 2016, 225, 48–56. [Google Scholar] [CrossRef]
  6. Zhao, D.; Wu, S. Spatial and temporal variability of key bio-temperature indicators on the Qinghai–Tibetan Plateau for the period 1961–2013. Int. J. Climatol. 2016, 36, 2083–2092. [Google Scholar] [CrossRef]
  7. Steinbauer, M.J.; Grytnes, J.-A.; Jurasinski, G.; Kulonen, A.; Lenoir, J.; Pauli, H.; Rixen, C.; Winkler, M.; Bardy-Durchhalter, M.; Barni, E.; et al. Accelerated increase in plant species richness on mountain summits is linked to warming. Nature 2018, 556, 231–234. [Google Scholar] [CrossRef] [Green Version]
  8. Zhang, L.; Lv, W.; Cui, S.; Jiang, L.; Li, B.; Liu, P.; Wang, Q.; Zhou, Y.; Hong, H.; Wang, A.; et al. Effect of warming and degradation on phenophases of Kobresia pygmaea and Potentilla multifida on the Tibetan Plateau. Agric. Ecosyst. Environ. 2020, 300, 106998. [Google Scholar] [CrossRef]
  9. Yang, J.; Ding, Y.; Chen, R. Climatic causes of ecological and environmental variations in the source regions of the Yangtze and Yellow Rivers of China. Environ. Geol. 2007, 53, 113–121. [Google Scholar] [CrossRef]
  10. Li, L.; Yang, S.; Wang, Z.; Zhu, X.; Tang, H. Evidence of Warming and Wetting Climate over the Qinghai-Tibet Plateau. Arct. Antarct. Alp. Res. 2010, 42, 449–457. [Google Scholar] [CrossRef]
  11. Wang, Y.; Ren, F.; Zhang, X. Spatial and temporal variations of regional high temperature events in China. Int. J. Climatol. 2014, 34, 3054–3065. [Google Scholar] [CrossRef]
  12. Huang, X.; Zhu, W.; Wang, X.; Zhan, P.; Liu, Q.; Li, X.; Sun, L. A Method for Monitoring and Forecasting the Heading and Flowering Dates of Winter Wheat Combining Satellite-Derived Green-Up Dates and Accumulated Temperature. Remote Sens. 2020, 12, 3536. [Google Scholar] [CrossRef]
  13. Fernández-Long, M.E.; Müller, G.V.; Beltrán-Przekurat, A.; Scarpati, O.E. Long-term and recent changes in temperature-based agroclimatic indices in Argentina. Int. J. Climatol. 2013, 33, 1673–1686. [Google Scholar] [CrossRef]
  14. Yan, M.; Liu, X.; Zhang, W.; Li, X.; Liu, S. Spatio-temporal changes of ≥10 °C accumulated temperature in northeastern China since 1961. Chin. Geogr. Sci. 2011, 21, 17–26. [Google Scholar] [CrossRef]
  15. Jiang, X.; Zhou, X.; Zhang, J.; Xu, Y.; Yang, J.; Niu, Q. The Spatiotemporal Change of Active Accumulated Temperature ≥10 °C in the Guizhou Plateau from 1961 to 2015. Earth Environ. 2019, 47, 121–130. [Google Scholar]
  16. Li, R.; Guo, J.; Song, Y. Optimizing parameters of a non-linear accumulated temperature model and method to calculate linear accumulated temperature for spring maize in Northeast China. Theor. Appl. Climatol. 2020, 141, 1629–1644. [Google Scholar] [CrossRef]
  17. Kumari, N.; Srivastava, A.; Dumka, U.C. A Long-Term Spatiotemporal Analysis of Vegetation Greenness over the Himalayan Region Using Google Earth Engine. Climate 2021, 9, 109. [Google Scholar] [CrossRef]
  18. Bai, Y. Analysis of vegetation dynamics in the Qinling-Daba Mountains region from MODIS time series data. Ecol. Indic. 2021, 129, 108029. [Google Scholar] [CrossRef]
  19. Wen, Y.; Liu, X.; Xin, Q.; Wu, J.; Xu, X.; Pei, F.; Li, X.; Du, G.; Cai, Y.; Lin, K.; et al. Cumulative Effects of Climatic Factors on Terrestrial Vegetation Growth. J. Geophys. Res. Biogeosciences 2019, 124, 789–806. [Google Scholar] [CrossRef]
  20. Feng, J.; Dong, B.; Qin, T.; Liu, S.; Zhang, J.; Gong, X. Temporal and Spatial Variation Characteristics of NDVI and Its Relationship with Environmental Factors in Huangshui River Basin from 2000 to 2018. Pol. J. Environ. Stud. 2021, 30, 3043–3063. [Google Scholar] [CrossRef]
  21. Pei, F.; Zhou, Y.; Xia, Y. Application of Normalized Difference Vegetation Index (NDVI) for the Detection of Extreme Precipitation Change. Forests 2021, 12, 594. [Google Scholar] [CrossRef]
  22. Li, X.; Guo, W.; Chen, J.; Ni, X.; Wei, X. Responses of vegetation green-up date to temperature variation in alpine grassland on the Tibetan Plateau. Ecol. Indic. 2019, 104, 390–397. [Google Scholar] [CrossRef]
  23. Xu, H.-J.; Wang, X.-P.; Zhang, X.-X. Impacts of climate change and human activities on the aboveground production in alpine grasslands: A case study of the source region of the Yellow River, China. Arab. J. Geosci. 2017, 10, 17. [Google Scholar] [CrossRef]
  24. Wang, C. A remote sensing perspective of alpine grasslands on the Tibetan Plateau: Better or worse under “Tibet Warming”? Remote Sens. Appl. Soc. Environ. 2016, 3, 36–44. [Google Scholar] [CrossRef]
  25. He, J.; Yang, K. China Meteorological Forcing Dataset. Cold Arid. Reg. Sci. Data Cent. Lanzhou 2011. [Google Scholar] [CrossRef]
  26. Chen, Y.; Yang, K.; Jie, H.; Qin, J.; Shi, J.; Du, J.; He, Q. Improving land surface temperature modeling for dry land of China. J. Geophys. Res. Atmos. 2011, 116, D20104. [Google Scholar] [CrossRef]
  27. Fang, Y.H.; Zhang, X.; Corbari, C.; Mancini, M.; Zeng, W. Improving the Xin’anjiang hydrological model based on mass—Energy balance. Hydrol. Earth Syst. Sci. 2017, 21, 3359–3375. [Google Scholar] [CrossRef] [Green Version]
  28. Gu, H.; Yu, Z.; Li, G.; Luo, J.; Ju, Q.; Huang, Y.; Fu, X. Entropy-Based Research on Precipitation Variability in the Source Region of China’s Yellow River. Water 2020, 12, 2486. [Google Scholar] [CrossRef]
  29. Gdem, A. ASTER Global Digital Elevation Model; USGS Earth Resources Observation and Science (EROS) Center: Sioux Falls, SC, USA, 2011. [Google Scholar]
  30. NASA. MODIS 0.05 NDVI of Global (2011–2016); National Tibetan Plateau Data Center: Beijing, China, 2018. [Google Scholar]
  31. Linderholm, H.W. Growing season changes in the last century. Agric. For. Meteorol. 2006, 137, 1–14. [Google Scholar] [CrossRef]
  32. Xu, M.; Li, Z. Accumulated temperature changes in desert region and surrounding area during 1960–2013: A case study in the Alxa Plateau, Northwest China. Environ. Earth Sci. 2016, 75, 1276. [Google Scholar] [CrossRef]
  33. Cong, N.; Shen, M.; Yang, W.; Yang, Z.; Zhang, G.; Piao, S. Varying responses of vegetation activity to climate changes on the Tibetan Plateau grassland. Int. J. Biometeorol. 2017, 61, 1433–1444. [Google Scholar] [CrossRef]
  34. Qin, Y.; Yang, D.; Gao, B.; Wang, T.; Chen, J.; Chen, Y.; Wang, Y.; Zheng, G. Impacts of climate warming on the frozen ground and eco-hydrology in the Yellow River source region, China. Sci. Total Environ. 2017, 605–606, 830–841. [Google Scholar] [CrossRef] [PubMed]
Figure 1. The source region of the Yellow River.
Water 14 03458 g001
Figure 2. The distribution of the averaged ≥0 °C (a) and ≥5 °C (b) annual accumulated temperature during 1979–2018 in the source region of the Yellow River.
Water 14 03458 g002
Figure 3. The distribution of the averaged lasting days with mean daily temperature ≥0 °C (a) and ≥5 °C (b) during 1979–2018 in the source region of the Yellow River.
Water 14 03458 g003
Figure 4. The inclination rate of ≥0 °C (a) and ≥5 °C (b) annual accumulated temperature where the determination coefficient R2 of regression analysis ≥ 0.5 during 1979–2018 in the source region of the Yellow River.
Water 14 03458 g004
Figure 5. The inclination rate of lasting days with mean daily temperature ≥0 °C (a) and ≥5 °C (b) where the determination coefficient R2 of regression analysis ≥0.5 during 1979–2018 in the source region of the Yellow River.
Water 14 03458 g005
Figure 6. The trends of the lasting days with mean daily temperature ≥0 °C (a) and ≥5 °C (b) and the distribution with significant trends in the start day (red vertical line) and end day (black horizontal line) during 1979–2018 in the source region of the Yellow River.
Water 14 03458 g006
Figure 7. The distribution of the abrupt year of ≥0 °C (a) and ≥5 °C (b) annual accumulated temperature during 1979–2018 in the source region of the Yellow River.
Water 14 03458 g007
Figure 8. The distribution of averaged ≥0 °C annual accumulated temperature before (a) and after (b) the abrupt year 1997 and the variation between the two stages (c) in the source region of the Yellow River.
Water 14 03458 g008
Figure 9. The distribution of averaged lasting days of ≥0 °C annual accumulated temperature before (a) and after (b) 1997 and the difference (c) in the source region of the Yellow River.
Water 14 03458 g009
Figure 10. The Pearson correlation coefficient between the areal mean annual maximum NDVI and ≥0 (5) °C annual accumulated temperature and lasting days of the source region of the Yellow River during 2001–2016.
Water 14 03458 g010
Figure 11. The Pearson correlation coefficient between annual maximum NDVI and ≥0 °C (a) and ≥5 °C (b) annual accumulated temperature during 2001–2016, checked by two-tailed test, α = 0.05, and inclination rate of respective AAT with the determination coefficient R2 of regression analysis ≥ 0.5 during 1998–2018 in the source region of the Yellow River.
Water 14 03458 g011
Figure 12. The Pearson correlation coefficient between annual maximum NDVI and lasting days of ≥0 °C (a) and ≥5 °C (b) annual accumulated temperature during 2001–2016, checked by two-tailed test, α = 0.05, and inclination rate of respective LDT with the determination coefficient R2 of regression analysis ≥0.5 during 1998–2018 in the source region of the Yellow River.
Water 14 03458 g012
Table 1. Meteorological stations in the source region of the Yellow River.
IDNameLongitude (°E)Latitude (°N)Altitude (m)Period (Year)
56033Maduo98.2234.9242721953–
56043Golog100.2534.4737191991–
56046Darlag99.6533.7539681956–
56065Henan101.6034.7335001959–
56067Jigzhi101.4833.4336291958–
56074Maqu102.0834.0034711967–
56079Zoige102.9733.5834401957–
56173Hongyuan102.5532.8034921960–
Table 2. The information of data products in the study.
DataSourceResolutionPeriod (Year)
Mean daily
temperature
CMFD (China Meteorological
Forcing Dataset)
0.1°1979–2018
DEM ASTER Global Digital Elevation Model. Version 230 m2011
NDVIMODIS NDVI. Version 60.05°2001–2016
Table 3. The area and elevation features of the four belts in the AAT.
IndicatorBeltArea
(104 km2)
Elevation Feature (m)
MeanRange
AAT0≤6002.945664122–4970
600–10005.242603703–4731
1000–14002.537903497–4241
>14001.734932953–3858
AAT5≤4003.845143924–4970
400–7004.542353687–4619
700–10001.937983535–4241
>10002.135252953–4003
Table 4. The area and elevation features of the zones in the LDT.
IndicatorZone (Days)Area
(104 km2)
Elevation Feature (m)
MeanRange
LDT0≤1252.845784160–4970
125–1554.243023726–4731
155–1852.739473535–4407
>1852.635742953–4108
LDT5≤807.543873726–4970
80–1102.438933535–4467
>1102.335472953–4003
Table 5. The area and elevation features of the inclination rates of the AAT with the determination coefficient R2 of regression analysis ≥0.5.
IndicatorInclination Rate
(°C Decade−1)
Area
(104 km2)
Elevation Feature (m)
MeanRange
AAT060–1004.042343252–4872
100–1303.840073022–4747
130–2121.937492953–4467
AAT560–1000.944443571–4872
100–1301.638313337–4588
130–2102.136282953–4363
Table 6. The area and elevation features of the inclination rates of the LDT with the determination coefficient R2 of regression analysis ≥0.5.
IndicatorInclination Rate
(Days Decade−1)
Area
(103 km2)
Elevation Feature (m)
MeanRange
LDT0≤123.638353132–4585
>122.441933540–4704
LDT5≤125.735243429–3745
>121.738283582–4108
Table 7. The area and elevation features of trends in the LDT.
IndicatorTrendArea
(104 km2)
Elevation Feature (m)
MeanRange
LDT0significant increasing9.940612953–4872
non-significant increasing2.043913567–4970
non-significant decreasing0.443453899–4964
LDT5significant increasing5.338372953–4938
non-significant increasing5.443323252–4970
non-significant decreasing1.643543900–4731
Table 8. The area of significant increasing trends in the SDT (start day of mean daily temperature ≥0(5) °C), EDT (end day of mean daily temperature ≥0(5) °C), and LDT (lasting days with mean daily temperature ≥0(5) °C) and their overlap areas during 1979–2018 over the SRYR, unit 104 km2.
IndicatorOverlap StateSDTLDTEDT
≥0 °CSingle6.49.910.1
Double6.49.4
Triple 6.3
≥5 °CSingle3.25.35.1
Double3.24.4
Triple2.8
Table 9. The area and elevation features of the abrupt year of the AAT.
IndicatorAbrupt YearArea
(104 km2)
Elevation Feature (m)
MeanRange
AAT01990–19952.143963567–4829
19978.139952953–4872
1998–20041.943253569–4826
AAT51990–19963.143233337–4938
19973.039562953–4747
1998–20075.240383438–4964
Table 10. The area and elevation features of the changed belt of the AAT0 and the difference of LDT0 between the stages before and after 1997.
IndicatorChanged Belt (AAT0)/
Difference (Days) (LDT0)
Area
(104 km2)
Elevation Feature (m)
MeanRange
AAT0≤600 to 600–10002.244233924–4747
600–1000 to 1000–14001.939983539–4407
1000–1400 to >14001.236063410–3977
LDT0<00.544744054–4970
00.245013899–4701
1–177.342473022–4938
18–344.240402953–4855
Table 11. The mean value, range and standard deviation of annual linear correlation coefficient series between NDVI and indicators during 2001–2016 in the SRYR, checked by two-tailed test, α = 0.01.
IndicatorCoefficientMeanRangeStd Dev
AAT0Pearson’s γ0.560.48–0.640.05
Spearman’s ρ0.670.60–0.740.04
Kendall’s τ0.480.41–0.550.04
LDT0Pearson’s γ0.620.55–0.670.04
Spearman’s ρ0.710.60–0.810.05
Kendall’s τ0.520.44–0.620.04
AAT5Pearson’s γ0.510.43–0.580.05
Spearman’s ρ0.630.52–0.700.06
Kendall’s τ0.440.36–0.500.05
LDT5Pearson’s γ0.490.38–0.590.06
Spearman’s ρ0.580.47–0.660.06
Kendall’s τ0.410.33–0.470.04
Table 12. The number of verified Pearson’s γ between annual series of NDVI and indicators during 2001–2016 among 1200 girds by two-tailed T test in the SRYR.
IndicatorPearson’s γSpearman’s ρKendall’s τ
AAT0373369373
LDT0278291280
AAT5586460
LDT594119104
Publisher’s Note: MDPI stays neutral with regard to jurisdictional claims in published maps and institutional affiliations.

