
Backward Trajectory Analysis Based on Specific Humidity Correction for the Influence of Moisture Sources on Precipitation Isotopes in the Western Loess Plateau, China
 , and
, and
Abstract
:1. Introduction
2. Data and Method
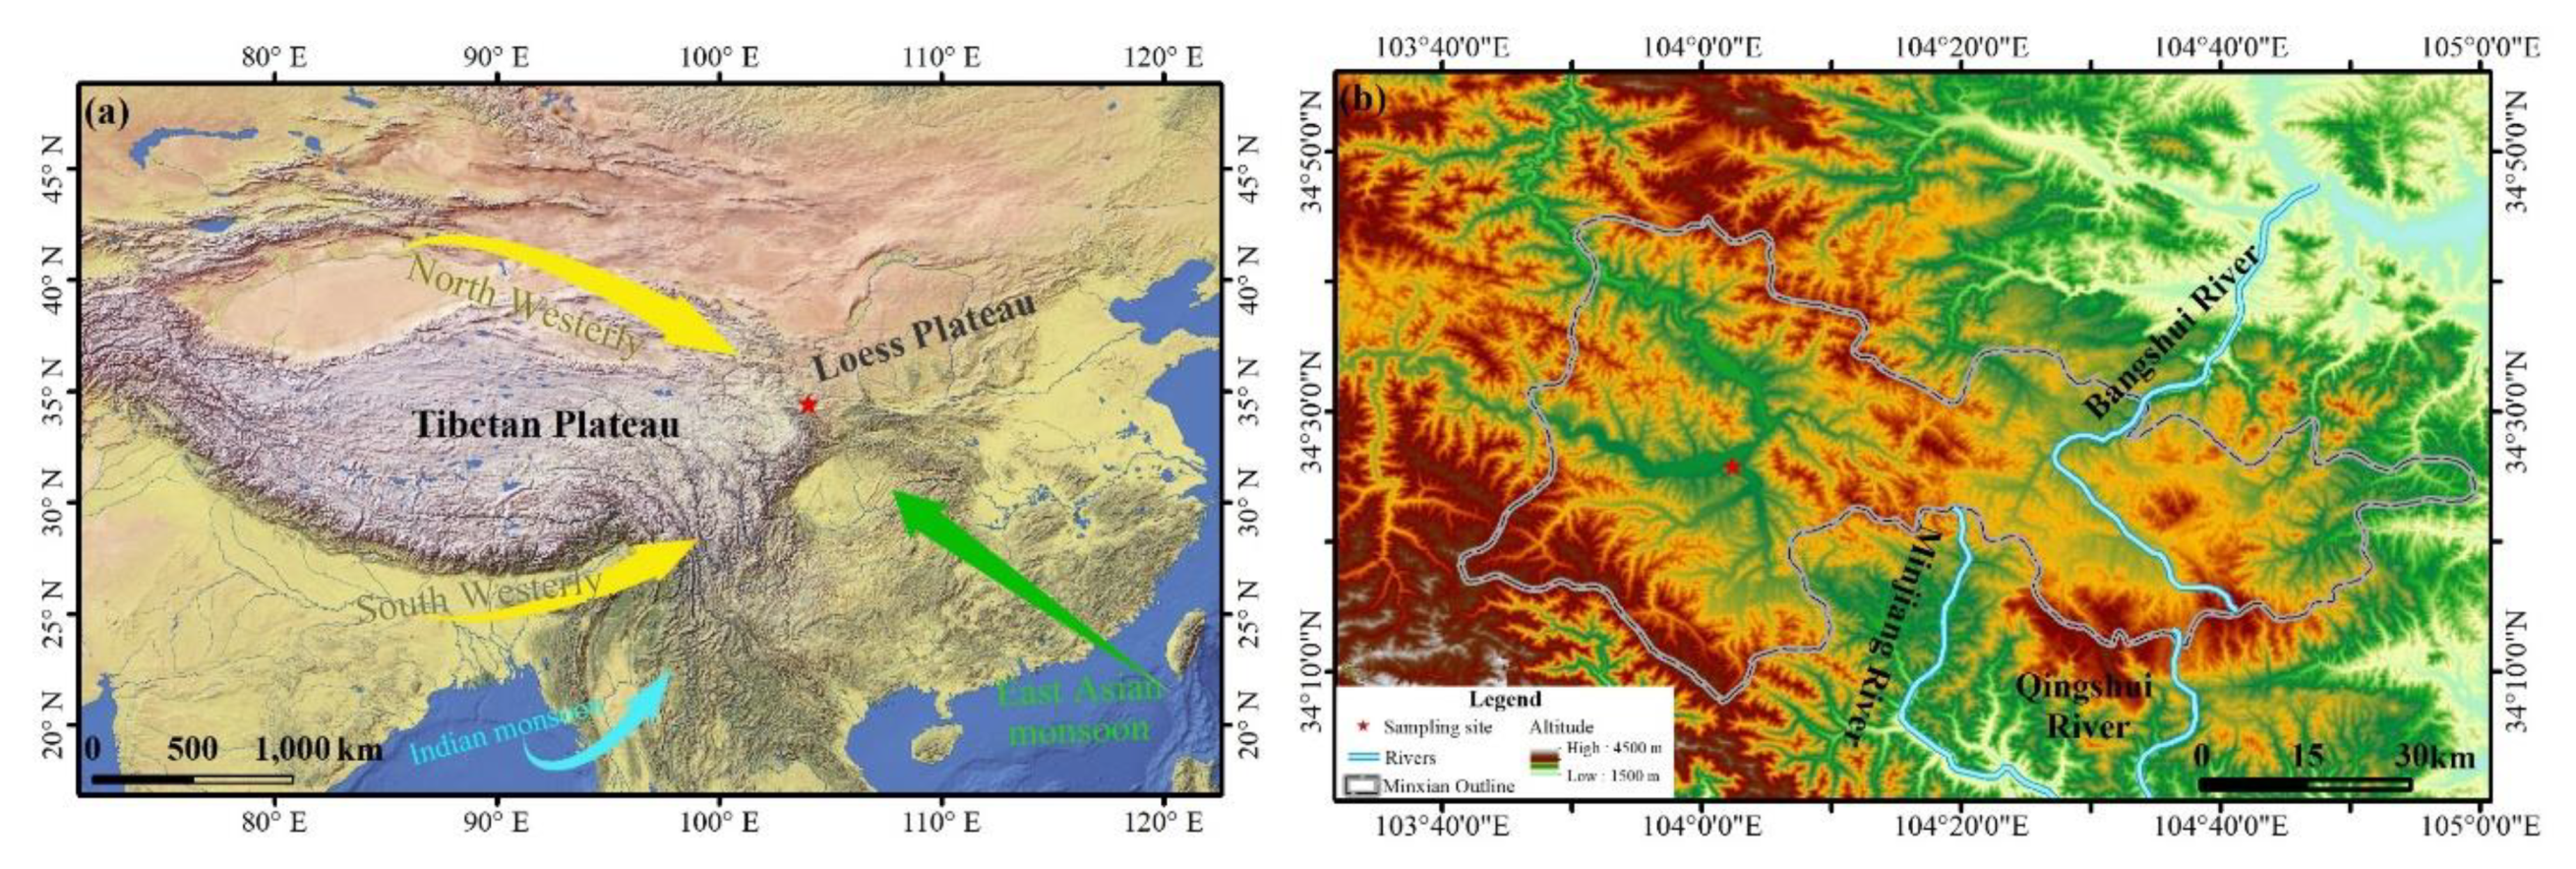
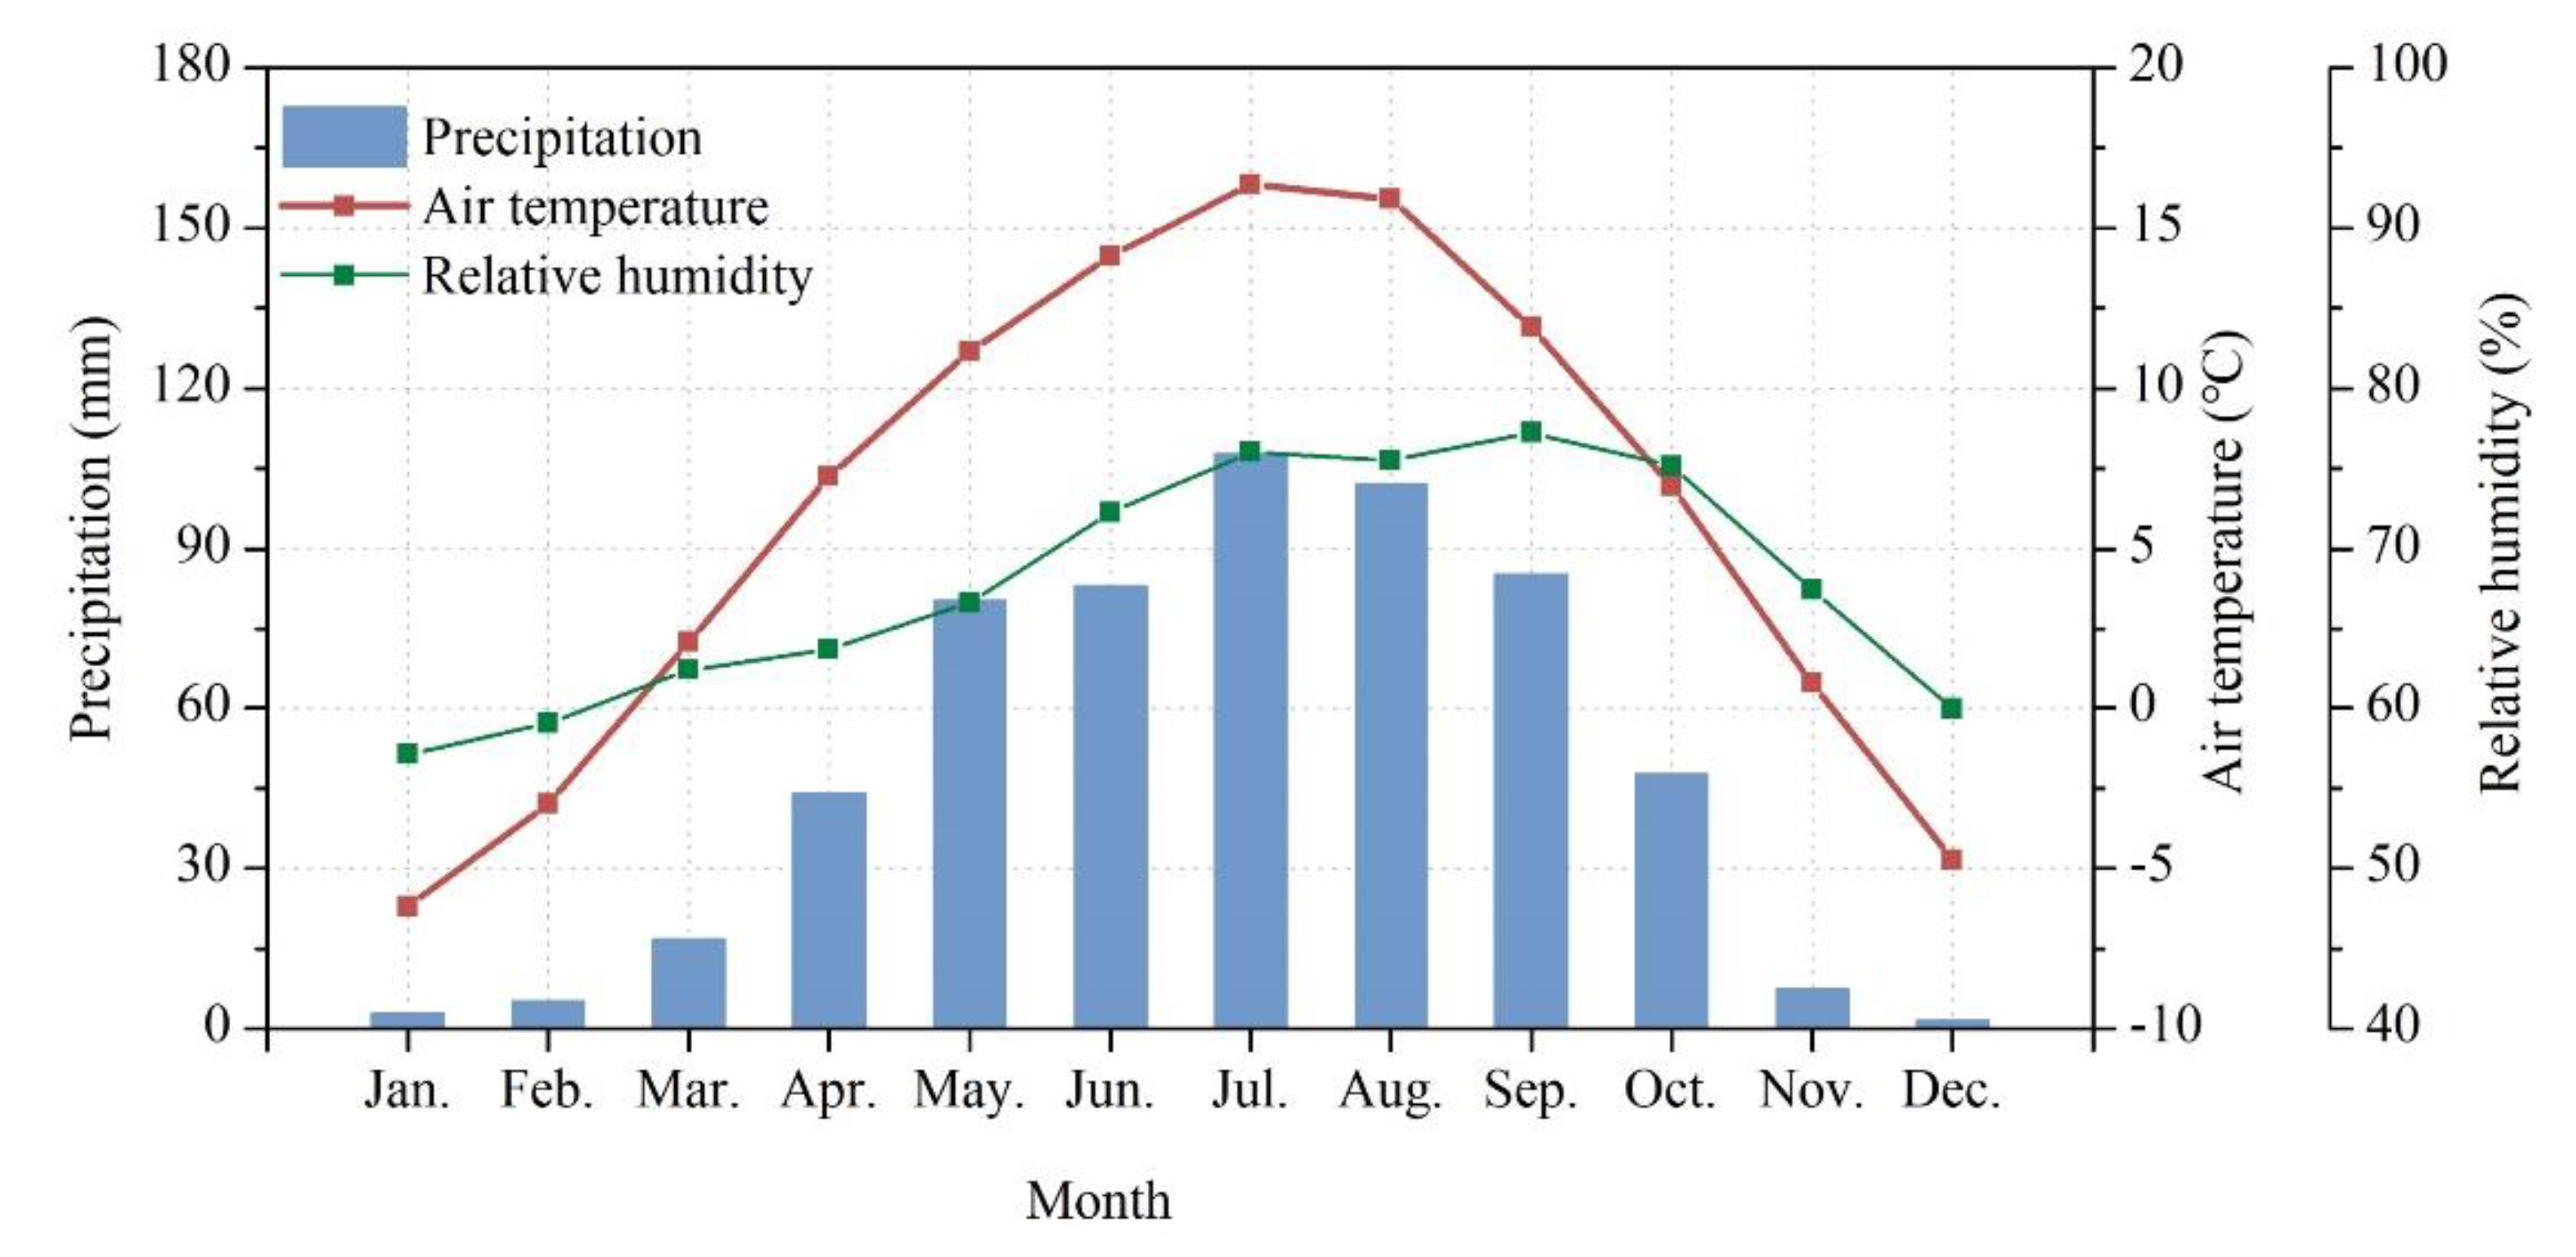
2.1. Study Area
2.2. Precipitation Sample Collection
2.3. Meteorological Data and Reanalysis Data
2.4. Backward Trajectory Model and Specific Humidity Correction
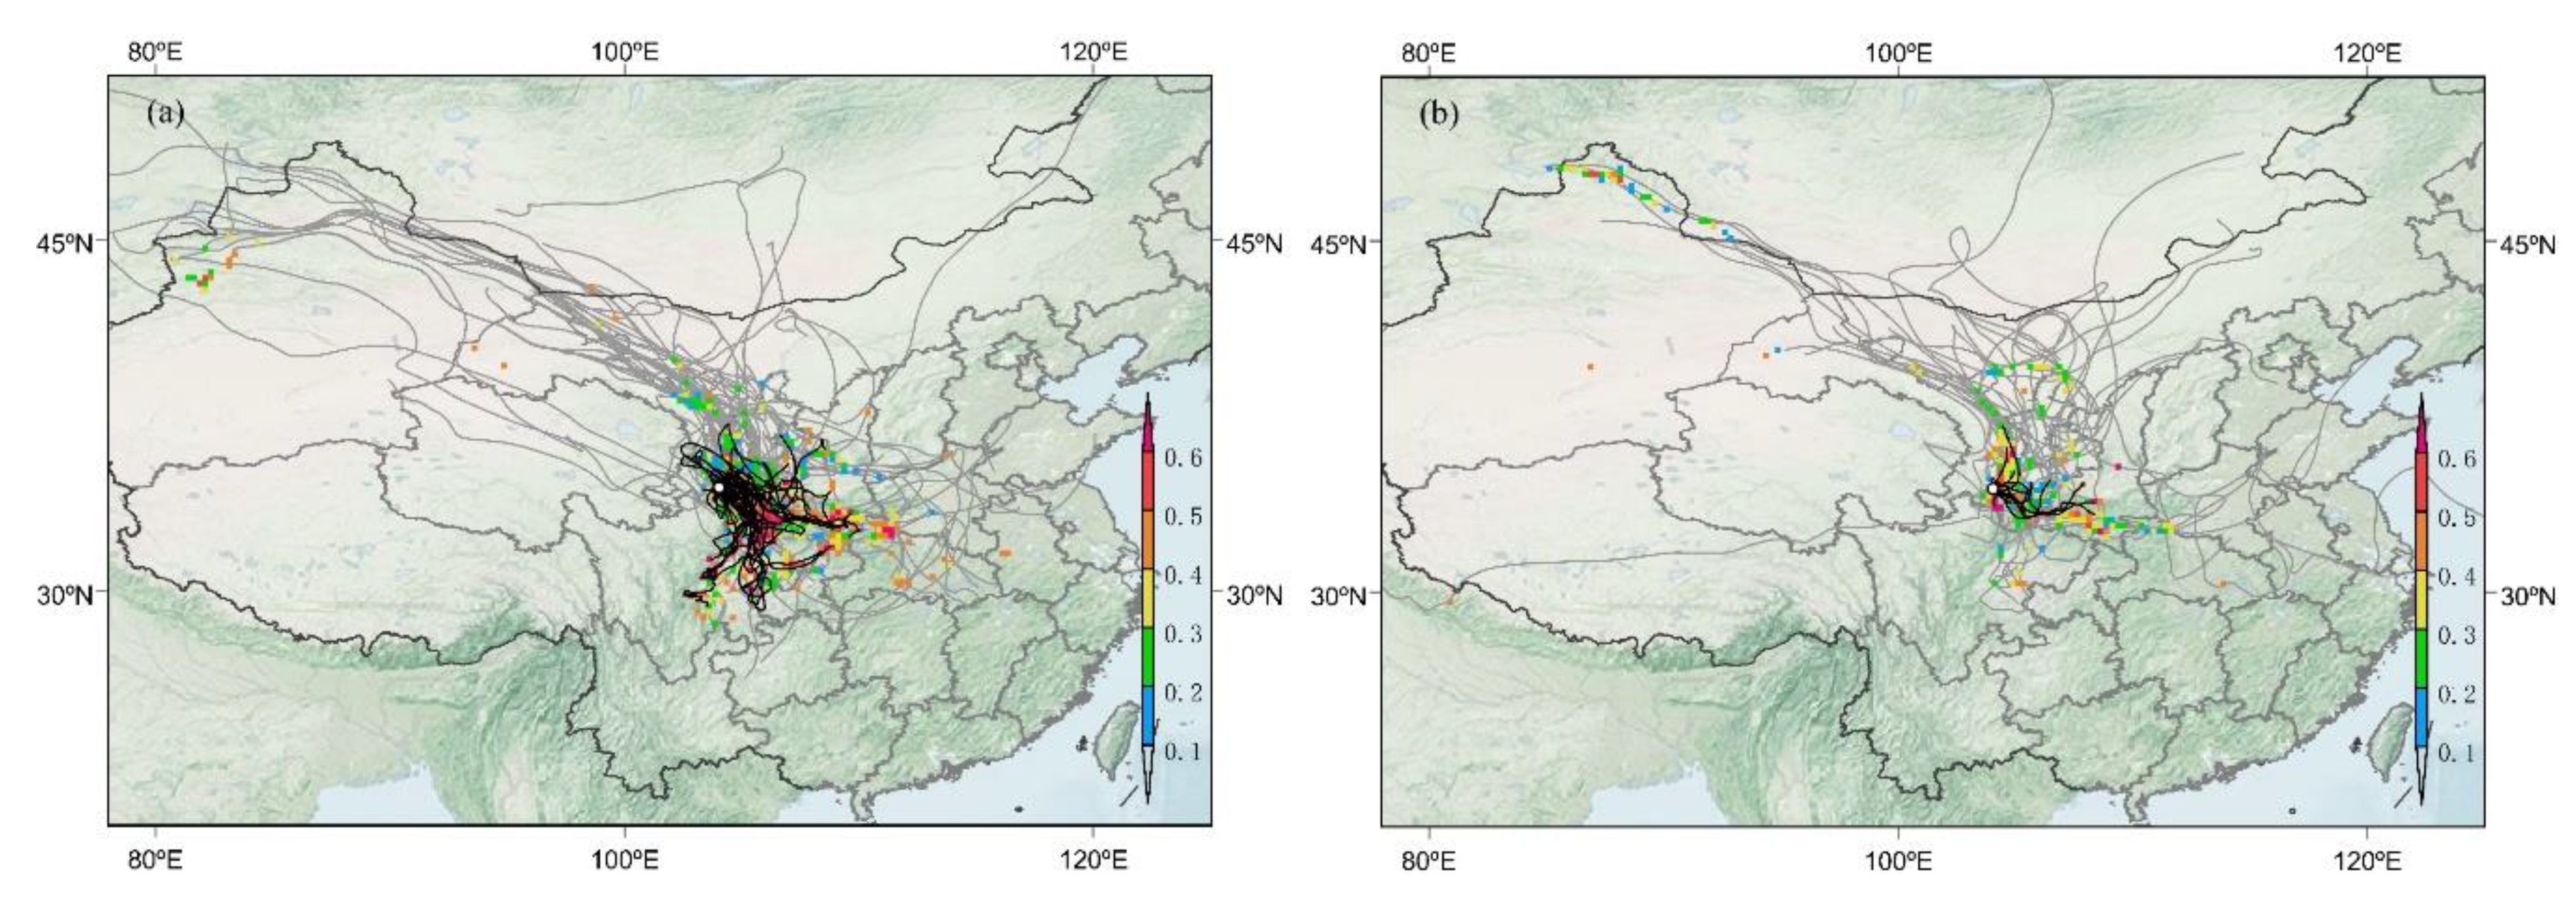
2.5. Potential Source Contribution Factor Analysis
3. Results and Discussion
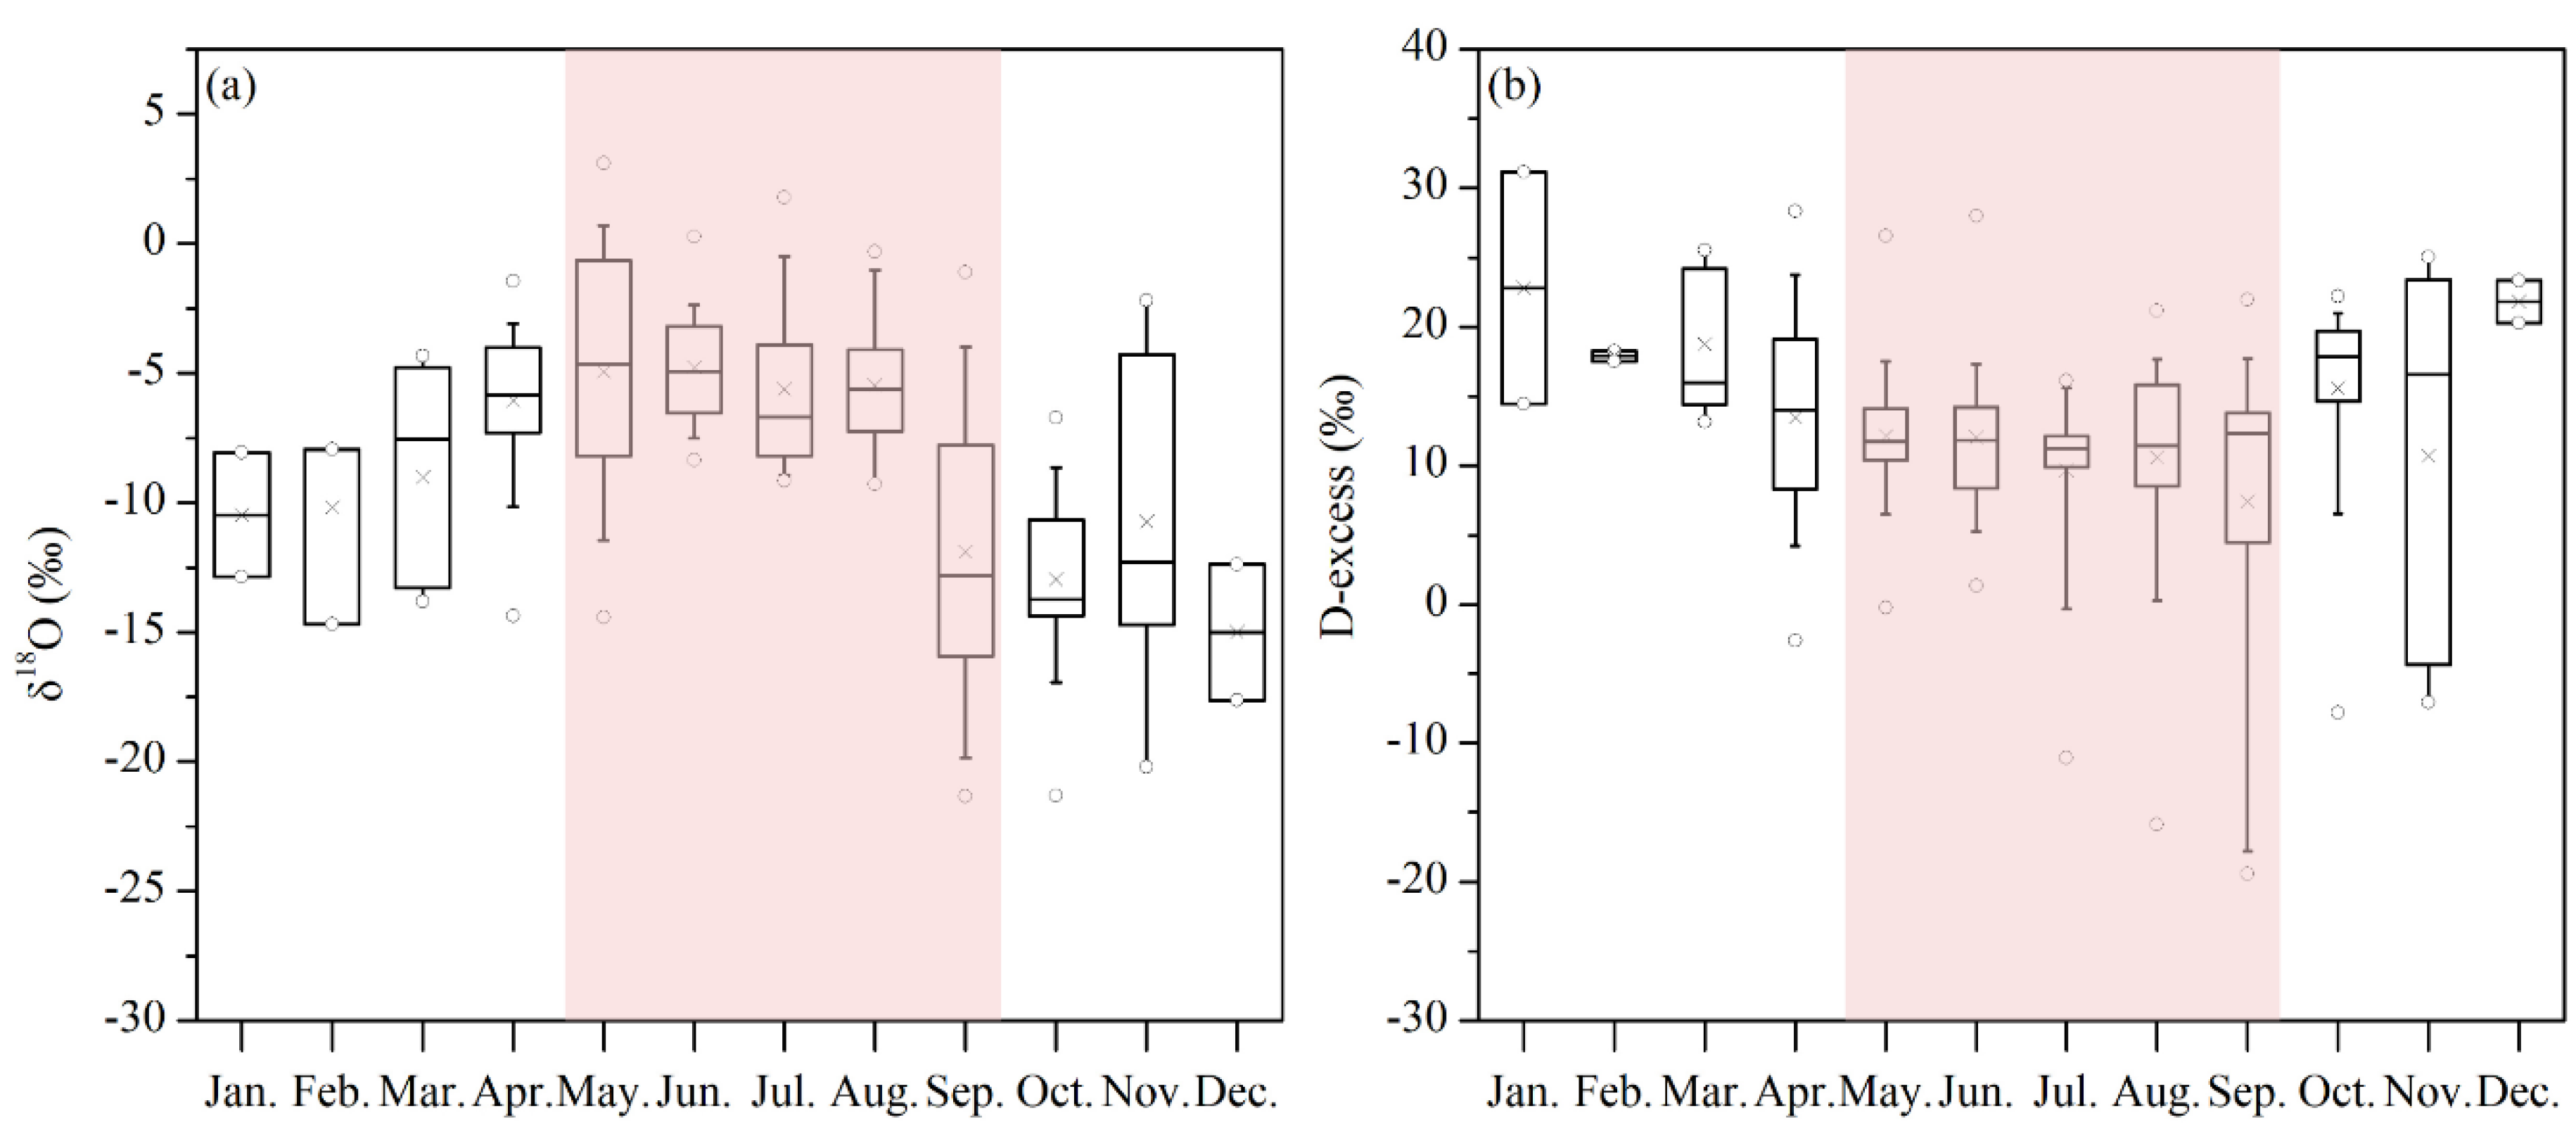
3.1. Preliminary Analysis of the Seasonal Distribution of Precipitation Isotopes
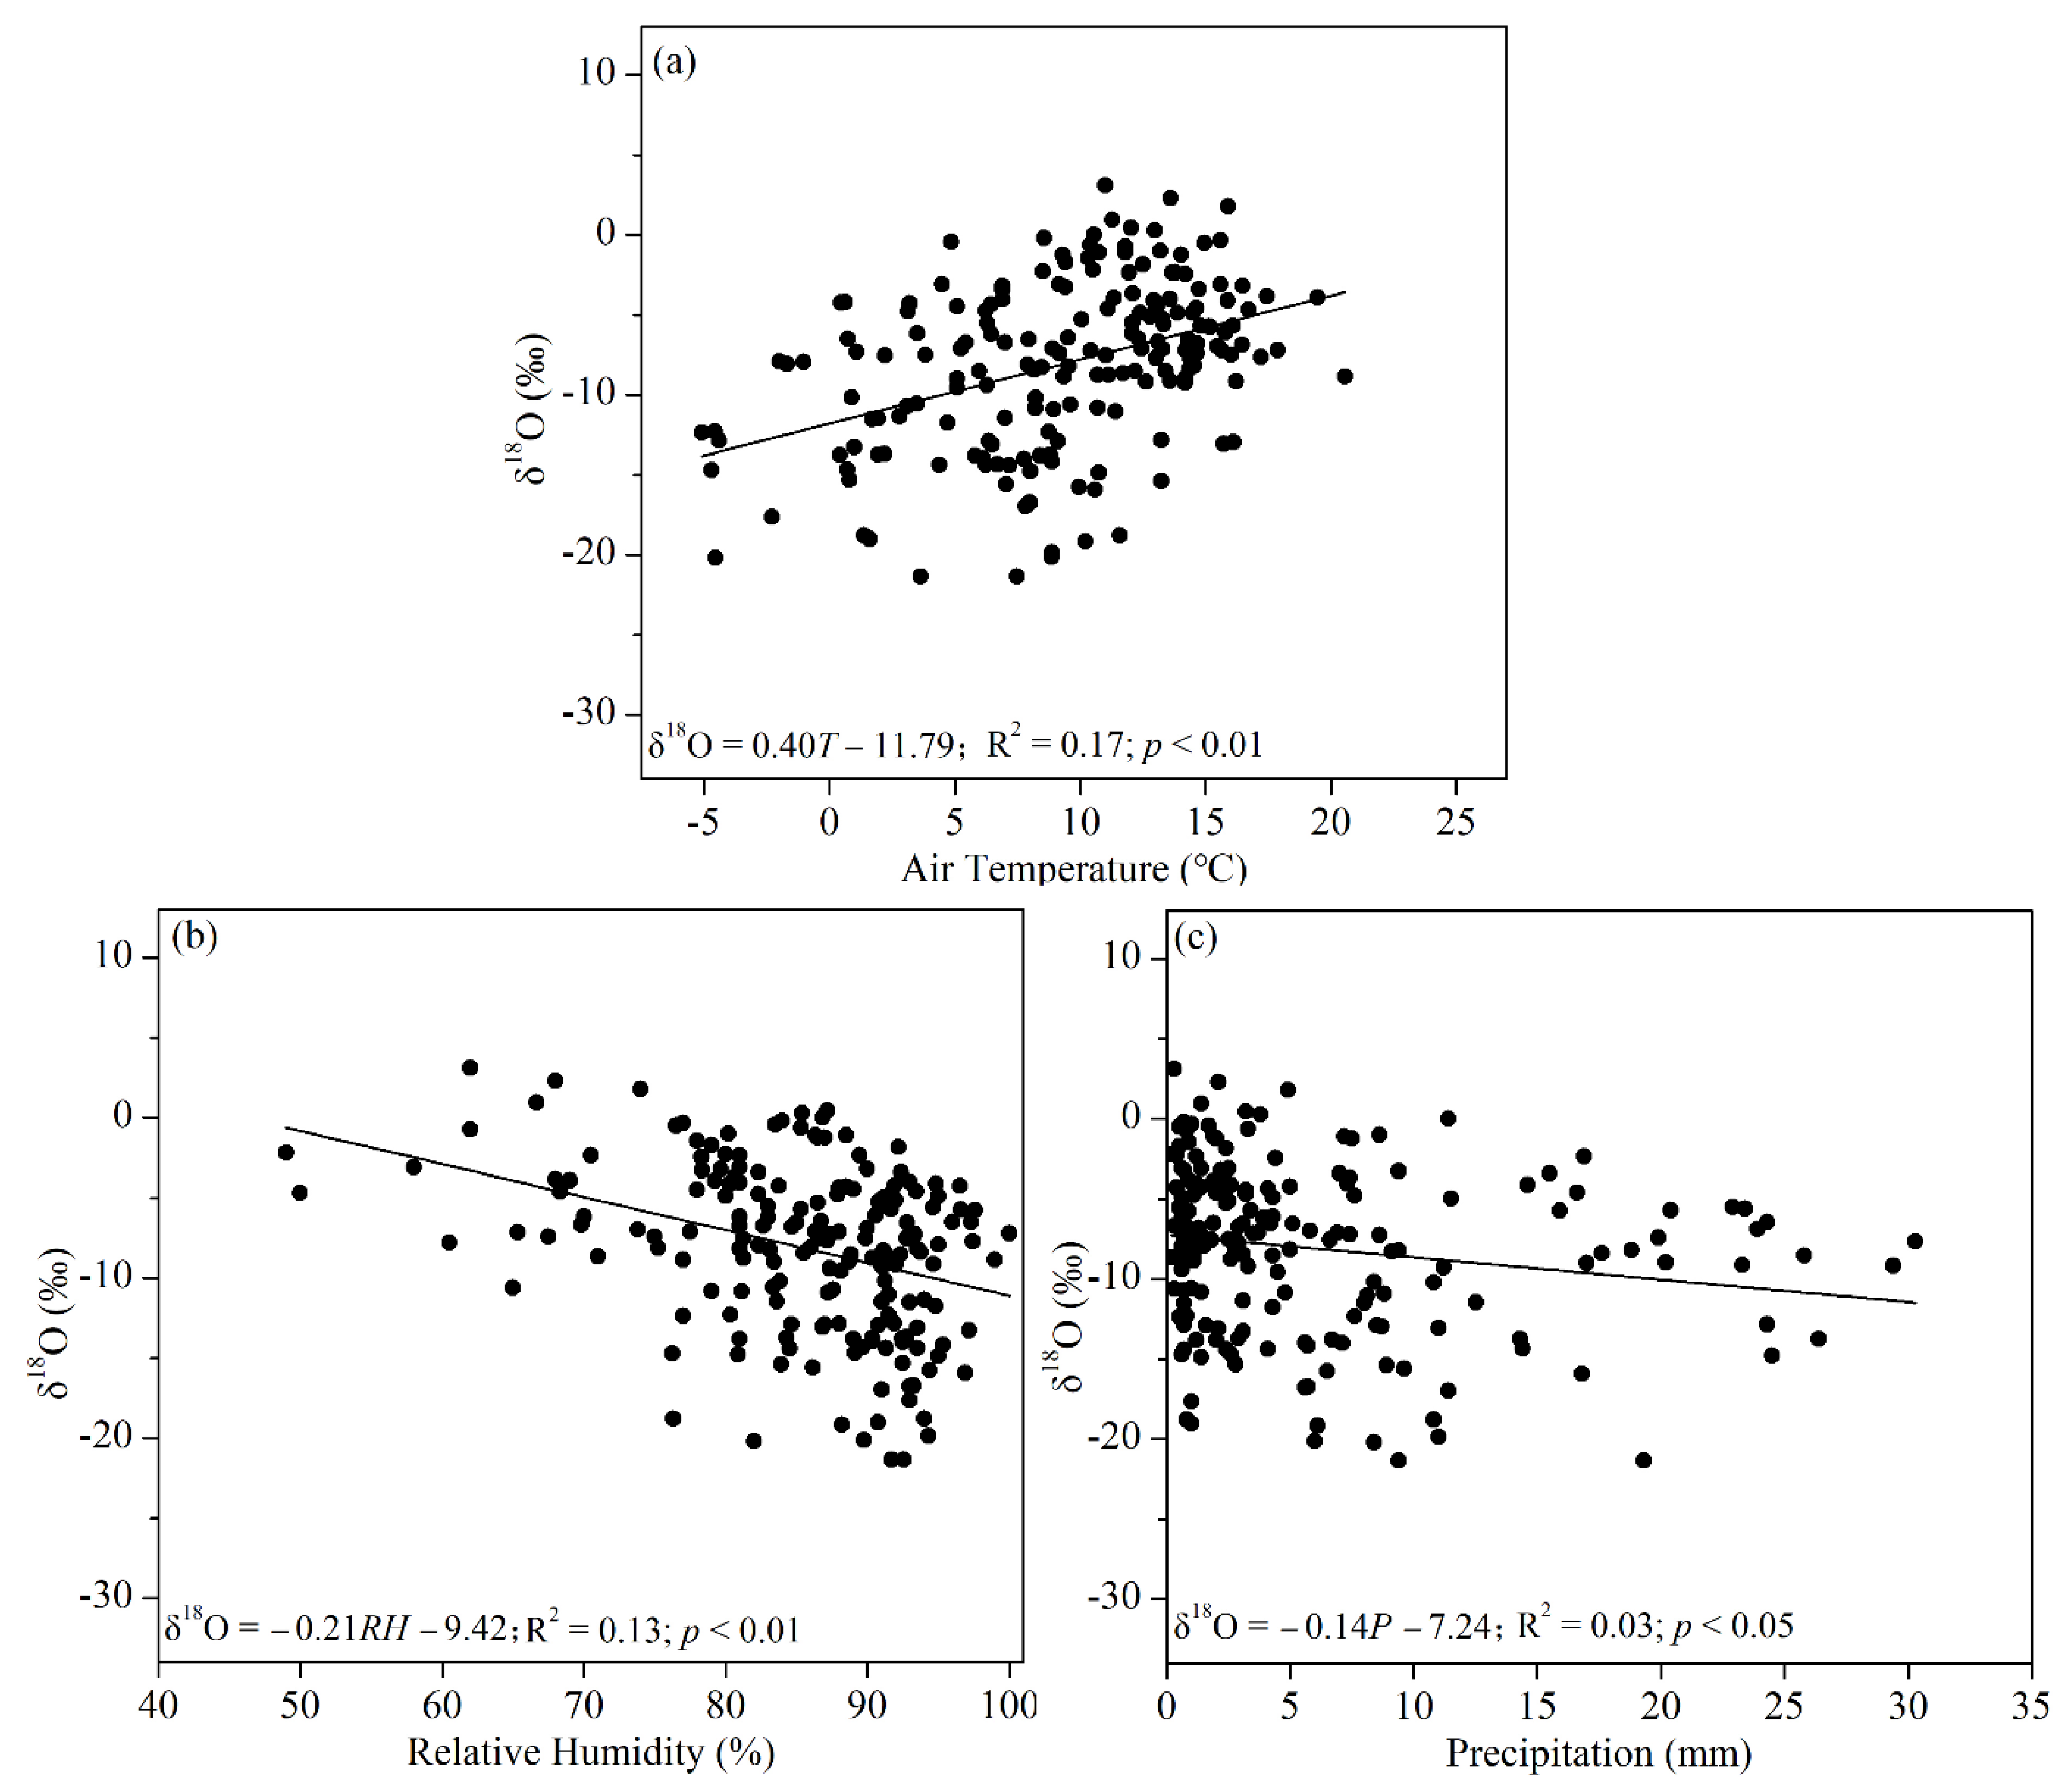
3.2. Preliminary Analysis of the Influence of Meteorological Parameters on Precipitation Isotopes
3.3. Effects of Moisture Sources on Precipitation Isotopes
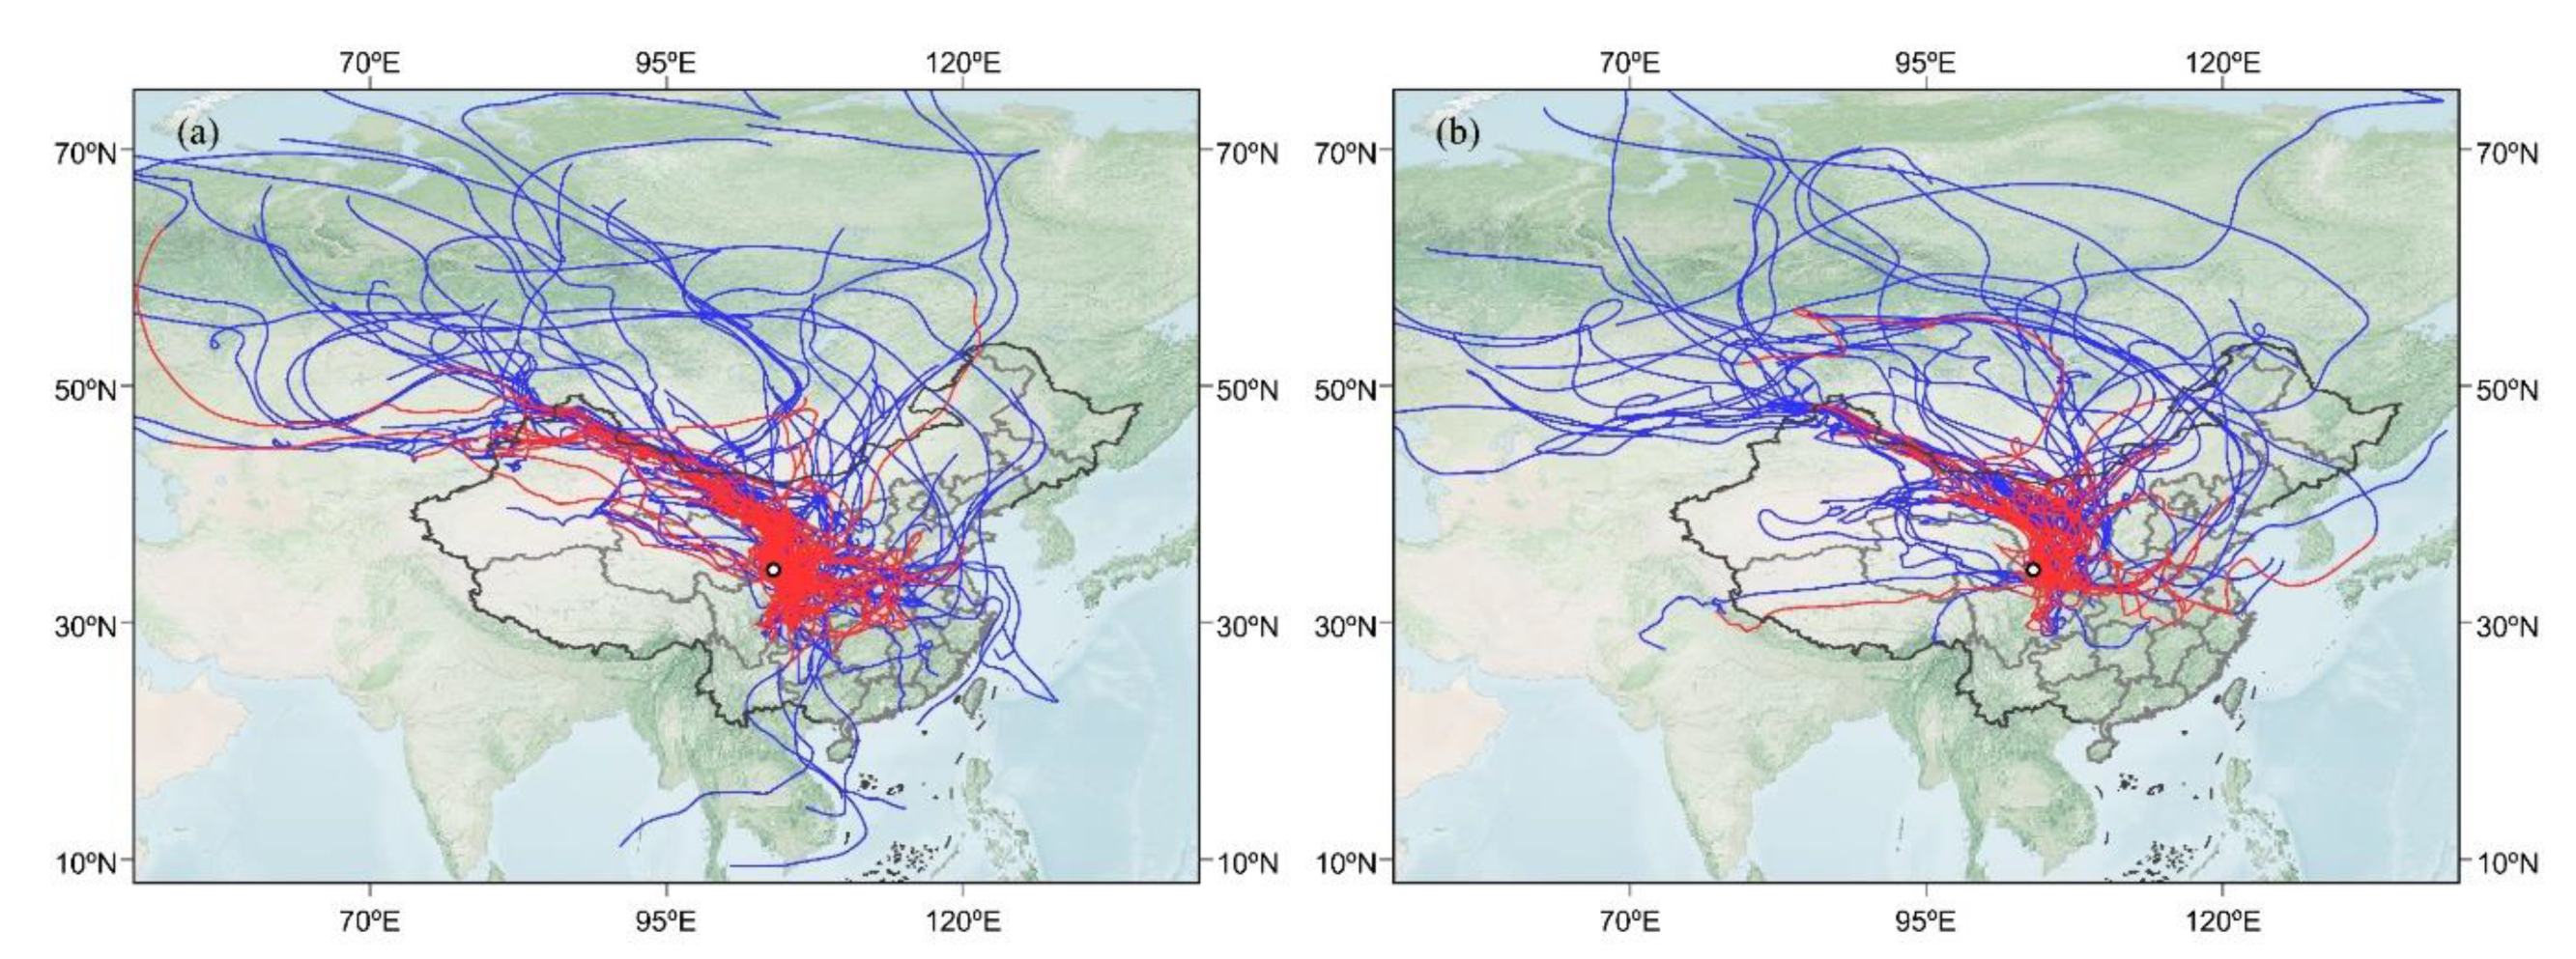
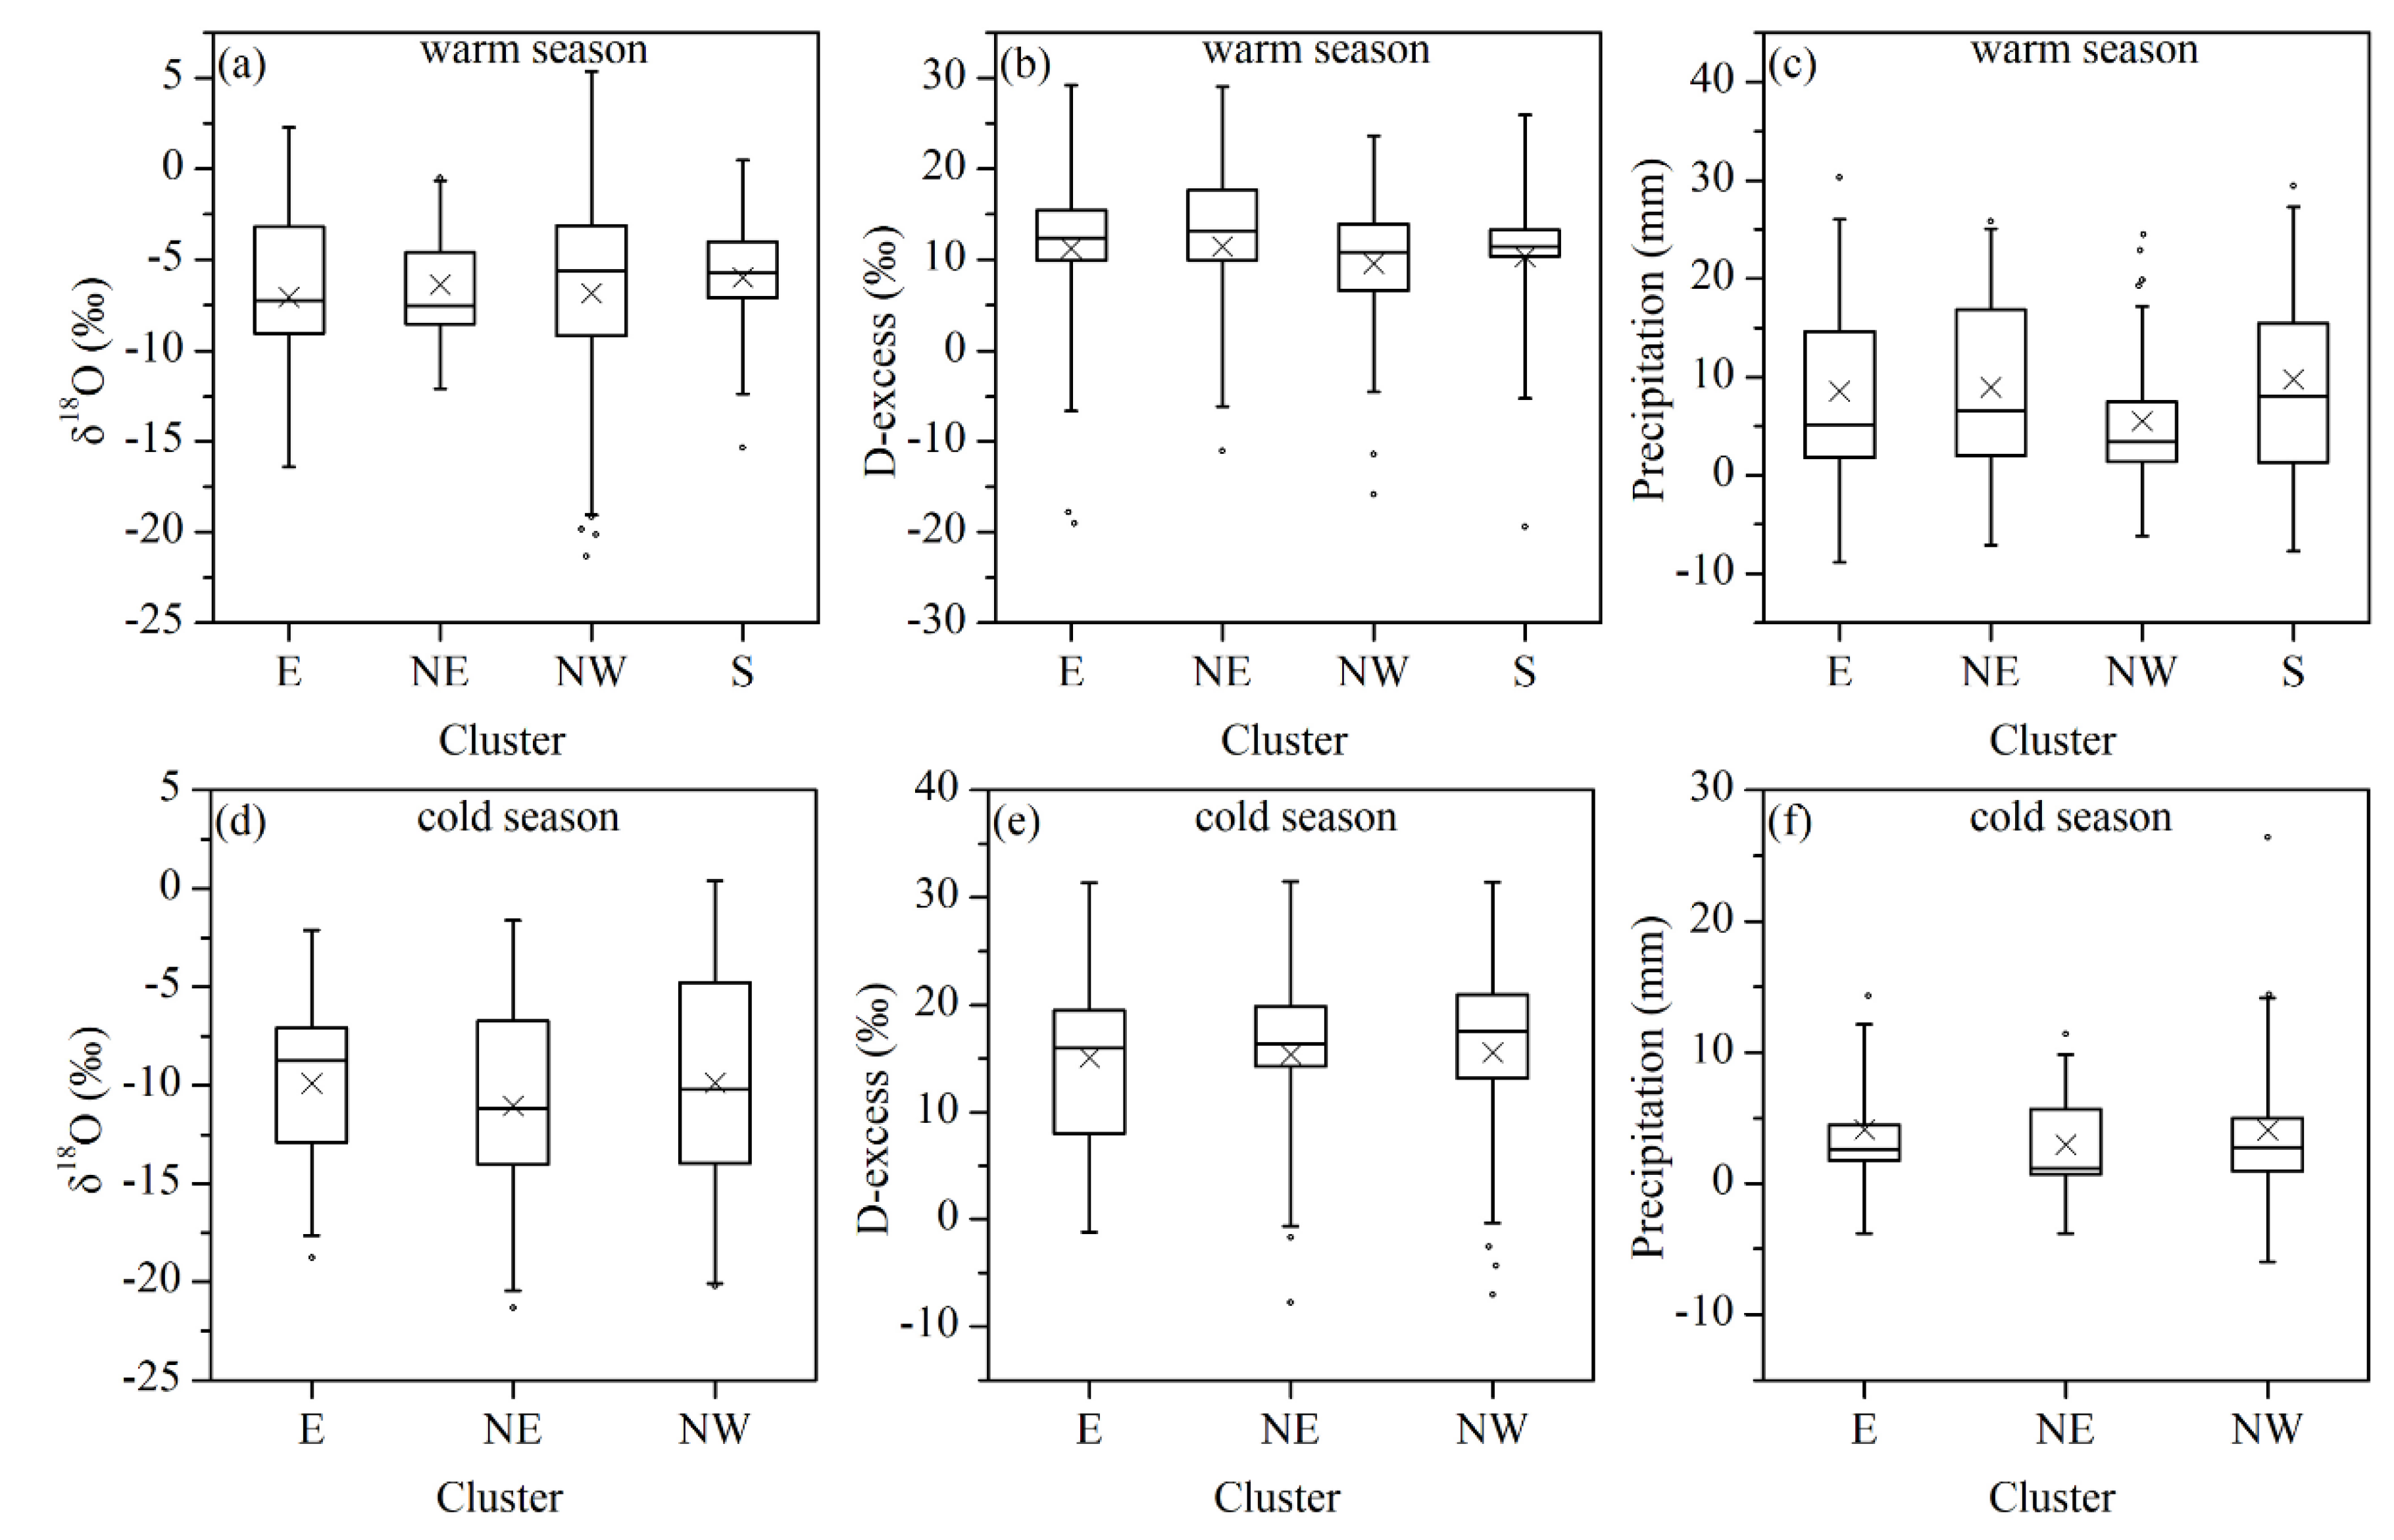
3.3.1. Effect of Different Moisture Source Regions on Precipitation Isotopes
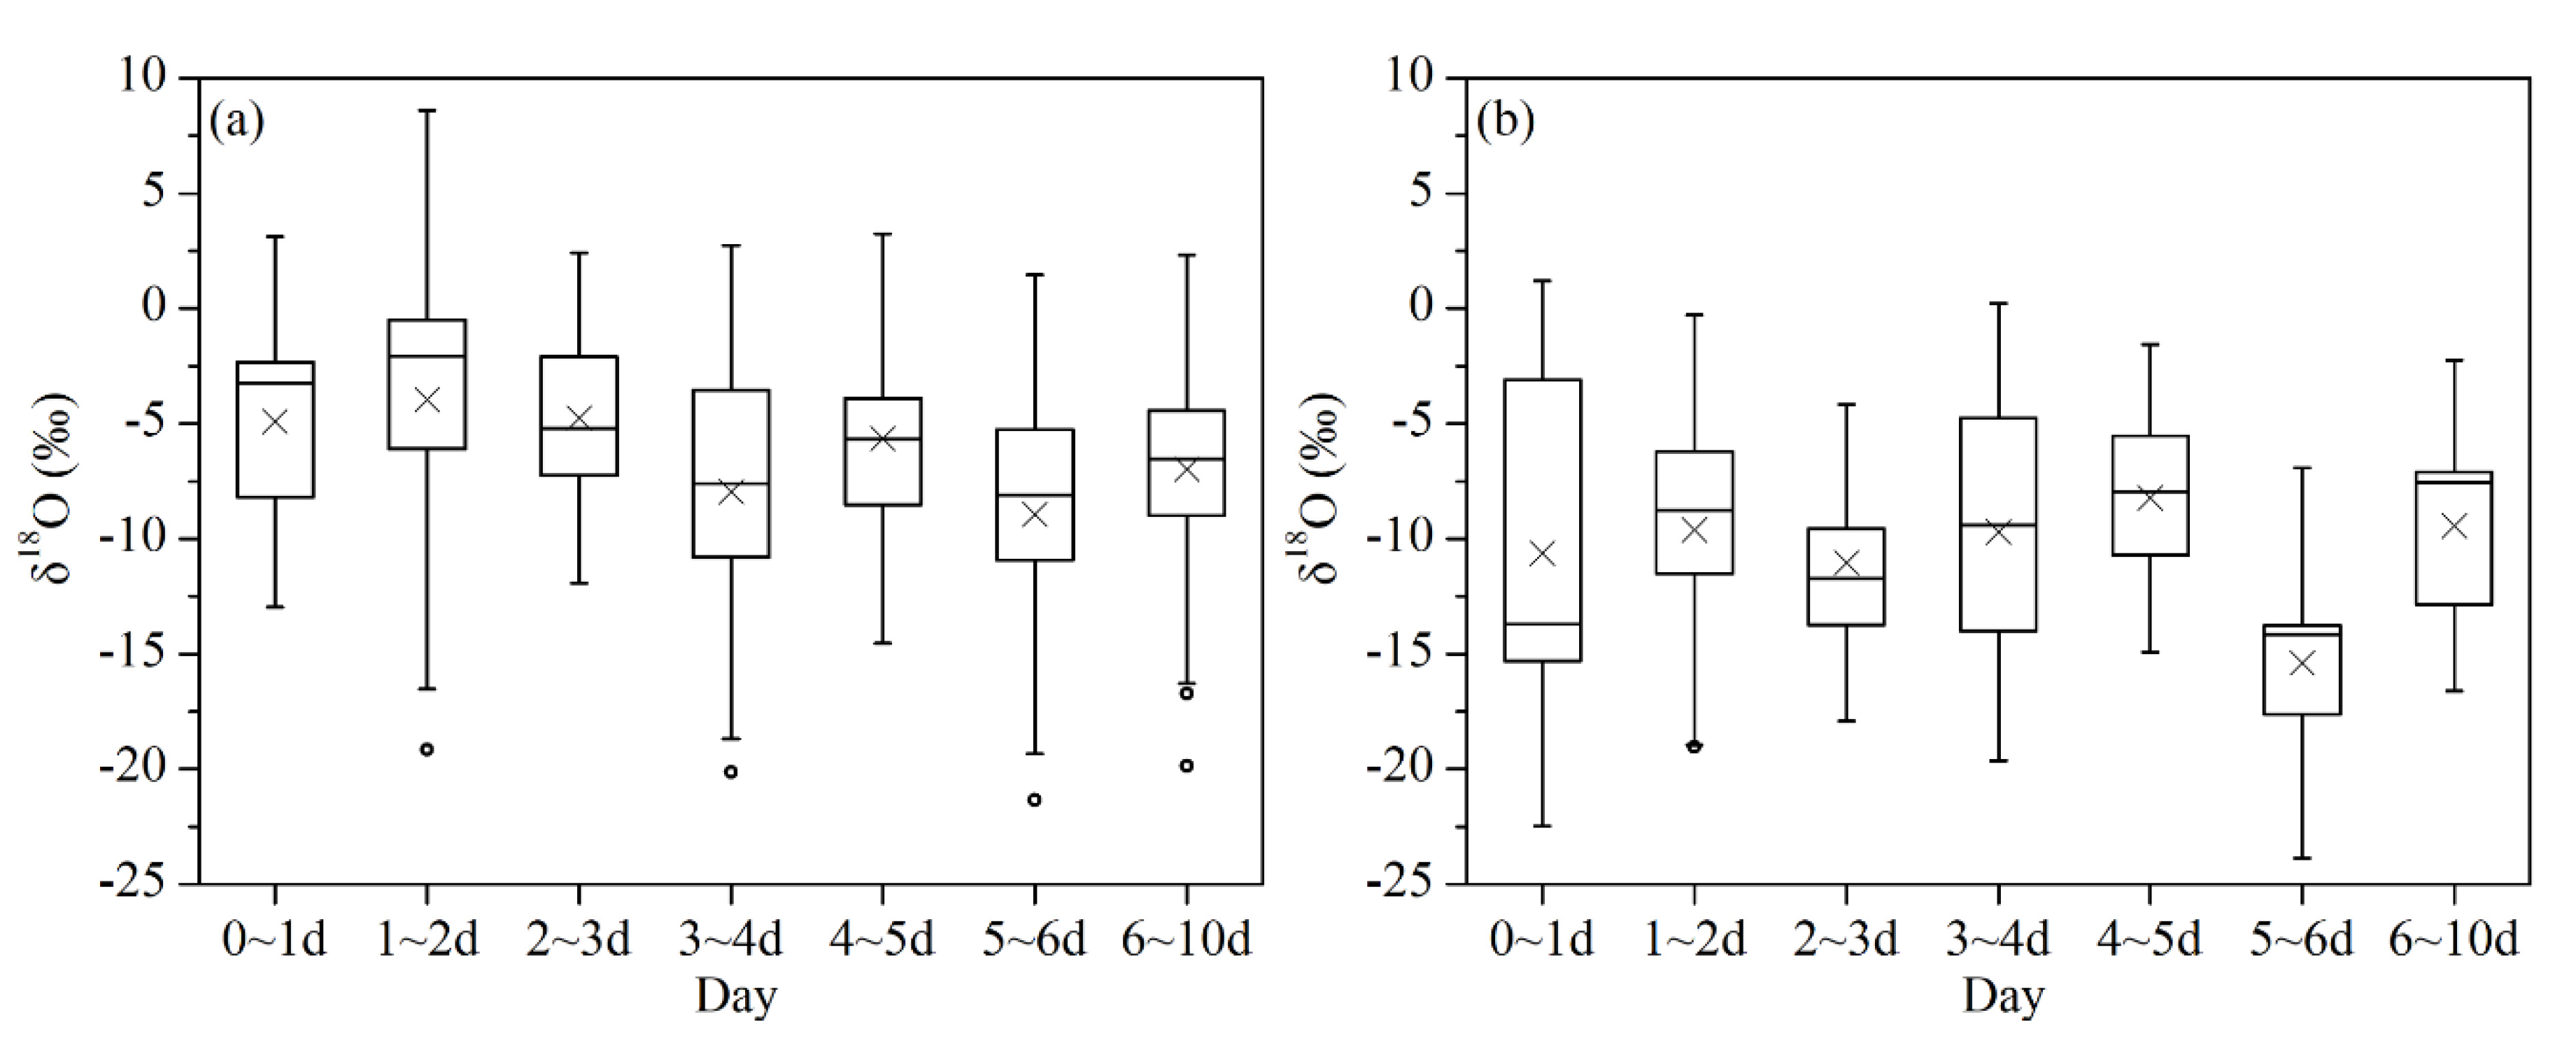
3.3.2. Effect of Water Vapor Transport Time on Precipitation Isotopes
3.3.3. Effect of Water Vapor Transport Height on Precipitation Isotopes
3.4. Influence of Local Recycled Vapor on Precipitation Isotopes
4. Conclusions
Supplementary Materials
Author Contributions
Funding
Data Availability Statement
Acknowledgments
Conflicts of Interest
References
- Bowen, G.J.; Cai, Z.Y.; Fiorella, R.P.; Putman, A.L. Isotopes in the water cycle: Regional- to global-scale patterns and applications. Annu. Rev. Earth Planet. Sci. 2019, 47, 453–479. [Google Scholar] [CrossRef] [Green Version]
- Sayemuzzaman, M.; Jha, M.K. Seasonal and annual precipitation time series trend analysis in north carolina, united states. Atmos. Res. 2014, 137, 183–194. [Google Scholar] [CrossRef]
- Klein, E.S.; Nolan, M.; Mcconnell, J.; Sigl, M.; Cherry, J.; Young, J.; Welker, J.M. Mccall glacier record of arctic climate change: Interpreting a northern alaska ice core with regional water isotopes. Quat. Sci. Rev. 2016, 131, 274–284. [Google Scholar] [CrossRef]
- Hu, J.; Julien, E.-G.; Tabor, C.; Nusbaumer, J.; Partin, J. Deciphering oxygen isotope records from chinese speleothems with an isotope-enabled climate model. Paleoceanogr. Paleoclimatol. 2019, 34, 2098–2112. [Google Scholar] [CrossRef]
- Gui, J.; Li, Z.X.; Feng, Q.; Yuan, R.F.; Ning, T.T.; Zhang, B.J.; Xue, J.; Gao, W.D.; Nan, F.S.; Ding, W.X.; et al. Environmental effect and spatiotemporal pattern of stable isotopes in precipitation on the transition zone between the Tibetan Plateau and arid region. Sci. Total Environ. 2022, 605, 127350. [Google Scholar] [CrossRef]
- IPCC. Climate change 2021—The physical science basis. Chem. Int. 2021, 43, 22–23. [Google Scholar] [CrossRef]
- Wang, T.; Chen, J.S. Long-term trend of precipitation stable isotopic compositions under global warming conditions. J. Radioanal. Nucl. Chem. 2020, 325, 557–565. [Google Scholar] [CrossRef]
- Zheng, J.; Fan, J.L.; Zhang, F.C. Spatiotemporal trends of temperature and precipitation extremes across contrasting climatic zones of china during 1956–2015. Theor. Appl. Climatol. 2019, 138, 1877–1897. [Google Scholar] [CrossRef]
- Dansgaard, W. Stable isotopes in precipitation. Tellus 1964, 16, 436–468. [Google Scholar] [CrossRef]
- Yao, T.D.; Masson-Delmotte, V.; Gao, J.; Yu, W.S.; Yang, X.X.; Risi, C.; Sturm, C.; Werner, M.; Zhao, H.B.; He, Y.; et al. A review of climatic controls on δ18O in precipitation over the Tibetan Plateau: Observations and simulations. Rev. Geophys. 2013, 51, 525–548. [Google Scholar] [CrossRef]
- Xia, C.C.; Liu, G.D.; Mei, J.; Meng, Y.C.; Liu, W.; Hu, Y. Characteristics of hydrogen and oxygen stable isotopes in precipitation and the environmental controls in tropical monsoon climatic zone. Int. J. Hydrog. Energy 2019, 44, 5417–5427. [Google Scholar] [CrossRef]
- Gou, J.F.; Qu, S.M.; Guan, H.D.; Shi, P.; Su, Z.G.; Lin, Z.H.; Liu, J.T.; Zhu, J. Relationship between precipitation isotopic compositions and synoptic atmospheric circulation patterns in the lower reach of the Yangtze River. J. Hydrol. 2022, 605, 127289. [Google Scholar] [CrossRef]
- Tian, L.D.; Yao, T.D.; MacClune, K.; White, J.W.C.; Schilla, A.; Vaughn, B.; Vachon, R.; Ichiyanagi, K. Stable isotopic variations in west China: A consideration of moisture sources. J. Geophys. Res. Atmos. 2007, 112, 380. [Google Scholar] [CrossRef]
- Wei, R.; Tian, L.D.; Shao, L.L. Regional moisture sources and Indian summer monsoon (ISM) moisture transport from simultaneous monitoring of precipitation isotopes on the southeastern and northeastern Tibetan Plateau. J. Hydrol. 2021, 601, 126836. [Google Scholar] [CrossRef]
- Wu, S.Y.; Bedaso, Z. Quantifying the effect of moisture source and transport on the precipitation isotopic variations in northwest Ethiopian Highland. J. Hydrol. 2022, 605, 127322. [Google Scholar] [CrossRef]
- Yu, W.S.; Wei, F.L.; Ma, Y.M.; Liu, W.J.; Zhang, Y.Y.; Luo, L.; Tian, L.D.; Xu, B.Q.; Qu, D.M. Stable isotope variations in precipitation over deqin on the southeastern margin of the Tibetan Plateau during different seasons related to various meteorological factors and moisture sources. Atmos. Res. 2016, 170, 123–130. [Google Scholar] [CrossRef]
- Guan, H.D.; Zhang, X.P.; Skrzypek, G.; Sun, Z.A.; Xu, X. Deuterium excess variations of rainfall events in a coastal area of South Australia and its relationship with synoptic weather systems and atmospheric moisture sources. J. Geophys. Res. Atmos. 2013, 118, 1123–1138. [Google Scholar] [CrossRef]
- Uemura, R.; Matsui, Y.; Yoshimura, K.; Motoyama, H.; Yoshida, N. Evidence of deuterium excess in water vapor as an indicator of ocean surface conditions. J. Geophys. Res. Atmos. 2008, 113, 210. [Google Scholar] [CrossRef] [Green Version]
- Wang, S.J.; Zhang, M.J.; Che, Y.J.; Zhu, X.F.; Liu, X.M. Influence of below-cloud evaporation on deuterium excess in precipitation of arid central Asia and its meteorological controls. J. Hydrometeorol. 2016, 17, 1973–1984. [Google Scholar] [CrossRef]
- Kong, Y.L.; Pang, Z.H. A positive altitude gradient of isotopes in the precipitation over the Tianshan Mountains: Effects of moisture recycling and sub-cloud evaporation. J. Hydrol. 2016, 542, 222–230. [Google Scholar] [CrossRef]
- Crawford, J.; Hughes, C.E.; Parkes, S.D. Is the isotopic composition of event based precipitation driven by moisture source or synoptic scale weather in the Sydney Basin, Australia? J. Hydrol. 2013, 507, 213–226. [Google Scholar] [CrossRef]
- Shi, Y.D.; Wang, S.J.; Wang, L.W.; Zhang, M.J.; Argiriou, A.A.; Song, Y.; Lei, S.J. Isotopic evidence in modern precipitation for the westerly meridional movement in Central Asia. Atmos. Res. 2021, 259, 105698. [Google Scholar] [CrossRef]
- Wang, S.J.; Zhang, M.J.; Crawford, J.; Hughes, C.E.; Du, M.X.; Liu, X.M. The effect of moisture source and synoptic conditions on precipitation isotopes in arid central Asia. J. Geophys. Res. Atmos. 2017, 122, 2667–2682. [Google Scholar] [CrossRef]
- Van der Ent, R.J.; Savenije, H.H.; Schaefli, B.; Steele-Dunne, S.C. Origin and fate of atmospheric moisture over continents. Water Resour. Res. 2010, 46, 449. [Google Scholar] [CrossRef] [Green Version]
- Gao, Y.H.; Chen, F.; Miguez-Macho, G.; Li, X. Understanding precipitation recycling over the Tibetan Plateau using tracer analysis with WRF. Clim. Dyn. 2020, 55, 2921–2937. [Google Scholar] [CrossRef]
- Wang, S.J.; Zhang, M.J.; Che, Y.J.; Chen, F.L.; Qiang, F. Contribution of recycled moisture to precipitation in oases of arid central Asia: A stable isotope approach. Water Resour. Res. 2016, 52, 3246–3257. [Google Scholar] [CrossRef] [Green Version]
- Kong, Y.L.; Pang, Z.H.; Froehlich, K. Quantifying recycled moisture fraction in precipitation of an arid region using deuterium excess. Tellus B Chem. Phys. Meteorol. 2013, 65, 19251. [Google Scholar] [CrossRef]
- Zhang, Z.X.; Zhu, G.F.; Pan, H.X.; Sun, Z.G.; Sang, L.Y.; Liu, Y.W. Quantifying recycled moisture in precipitation in Qilian Mountains. Sustainability 2021, 13, 12943. [Google Scholar] [CrossRef]
- Chen, F.L.; Zhang, M.J.; Wu, X.X.; Wang, S.J.; Argiriou, A.A.; Zhou, X.; Chen, J.F. A Stable Isotope Approach for Estimating the Contribution of Recycled Moisture to Precipitation in Lanzhou City, China. Water 2021, 13, 1783. [Google Scholar] [CrossRef]
- Wu, X.X.; Chen, F.L.; Liu, X.Y.; Wang, S.J.; Zhang, M.J.; Zhu, G.F.; Zhou, X.; Chen, J.F. The Significance of Hydrogen and Oxygen Stable Isotopes in the Water Vapor Source in Dingxi Area. Water 2021, 13, 2374. [Google Scholar] [CrossRef]
- Li, X.F.; Lu, A.G.; Feng, Q.; Li, Z.; Liu, W.G.; Wang, S.J.; Tripathee, L.; Wang, X.Y.; Cao, J.J. Recycled moisture in an enclosed basin, Guanzhong Basin of Northern China, in the summer: Contribution to precipitation based on a stable isotope approach. Environ. Sci. Pollut. Res. 2020, 27, 27926–27936. [Google Scholar] [CrossRef] [PubMed]
- Chen, F.L.; Zhang, M.J.; Ma, Q.; Wang, S.J.; Li, X.Y.; Zhu, X.F. Stable isotopic characteristics of precipitation in Lanzhou City and its surrounding areas, Northwest China. Environ. Earth Sci. 2015, 73, 4671–4680. [Google Scholar] [CrossRef]
- Sun, C.J.; Chen, W.; Chen, Y.N.; Cai, Z.Y. Stable isotopes of atmospheric precipitation and its environmental drivers in the Eastern Chinese Loess Plateau, China. J. Hydrol. 2020, 581, 124404. [Google Scholar] [CrossRef]
- Cai, Z.Y.; Tian, L.D.; Bowen, G.J. ENSO variability reflected in precipitation oxygen isotopes across the Asian Summer Monsoon region. Earth Planet. Sci. Lett. 2017, 475, 25–33. [Google Scholar] [CrossRef]
- Berberan-Santos, M.N.; Bodunov, E.N.; Pogliani, L. On the barometric formula. Am. J. Phys. 1997, 65, 404–412. [Google Scholar] [CrossRef]
- Barnes, S.L. An empirical shortcut to the calculation of temperature and pressure at the lifted condensation level. J. Appl. Meteorol. Climatol. 1968, 7, 511. [Google Scholar] [CrossRef]
- Yang, K.; Koike, T.; Fujii, H.; Tamura, T.; Xu, X.; Bian, L.; Zhou, M. The daytime evolution of the atmospheric boundary layer and convection over the Tibetan Plateau: Observations and simulations. J. Meteorol. Soc. Japan. Ser. II 2004, 82, 1777–1792. [Google Scholar] [CrossRef] [Green Version]
- Sodemann, H.; Schwierz, C.; Wernli, H. Interannual variability of Greenland winter precipitation sources: Lagrangian moisture diagnostic and North Atlantic Oscillation influence. J. Geophys. Res. Atmos. 2008, 113, 256. [Google Scholar] [CrossRef] [Green Version]
- Jiang, H.M.; Li, Z.Q.; Zhang, X.; Wang, F.T.; Zhou, X.; Wang, F.L.; Zhang, Y.F.; Zheng, C.Y.; Song, M.Y.; Chen, T.T. Chemical components characteristics and source analysis of PM2.5 over Lanzhou city in winter and summer. J. Environ. Sci. 2021, 41, 1690–1702. [Google Scholar] [CrossRef]
- Wang, R.; Ding, J.L.; Ma, W.; Zhang, J.Y.; Han, L.J. Analysis of atmospheric particulates source in Urumqi based on PSCF and CWT model. J. Environ. Sci. 2021, 41, 3033–3042. [Google Scholar] [CrossRef]
- Xu, X.; Akhtar, U.S. Identification of potential regional sources of atmospheric total gaseous mercury in Windsor, Ontario, Canada using hybrid receptor modeling. Atmos. Chem. Phys. 2010, 10, 7073–7083. [Google Scholar] [CrossRef] [Green Version]
- Zeng, Y.; Hopke, P.K. A study of the sources of acid precipitation in Ontario, Canada. Atmos. Environ. 1989, 23, 1499–1509. [Google Scholar] [CrossRef]
- Meng, H.F.; Zhang, M.J.; Wang, S.J.; Qiu, X.; Du, M.X.; Zhang, Y.N.; Yu, X.X.; Zhou, S.E. Isotopic characteristics of water vapor and its sources during day and night along the Heihe River in summer. Arid. Lang Geogr. 2020, 43, 360–370. [Google Scholar]
- Wan, H.; Liu, W.G.; Xing, M. Isotopic composition of atmospheric precipitation and its tracing significance in the Laohequ Basin, Loess plateau, China. Sci. Total Environ. 2018, 640, 989–996. [Google Scholar] [CrossRef] [PubMed]
- Chen, F.L.; Zhang, M.J.; Wang, S.J.; Qiu, X.; Du, M.X. Environmental controls on stable isotopes of precipitation in Lanzhou, China: An enhanced network at city scale. Sci. Total Environ. 2017, 609, 1013–1022. [Google Scholar] [CrossRef]
- Li, Z.X.; Feng, Q.; Song, Y.; Wang, Q.J.; Jiao, Y.; Li, Y.G.; Li, J.G.; Cuo, X.Y. Stable isotope composition of precipitation in the south and north slopes of Wushaoling Mountain, northwestern China. Atmos. Res. 2016, 182, 87–101. [Google Scholar] [CrossRef]
- Wang, D.; Tian, L.D.; Cai, Z.Y.; Shao, L.L.; Guo, X.Y.; Tian, R.; Li, L.K.; Chen, Y.L.; Yuan, C. Indian monsoon precipitation isotopes linked with high level cloud cover at local and regional scales. Earth Planet. Sci. Lett. 2020, 529, 115837. [Google Scholar] [CrossRef]
- Gao, J.; Masson-Delmotte, V.; Risi, C.; He, Y.; Yao, T.D. What controls precipitation δ18O in the southern Tibetan Plateau at seasonal and intra-seasonal scales? A case study at Lhasa and Nyalam. Tellus B Chem. Phys. Meteorol. 2013, 65, 21043. [Google Scholar] [CrossRef]
- Wang, S.J.; Jiao, R.; Zhang, M.J.; Crawford, J.; Hughes, C.E.; Chen, F.L. Changes in below-cloud evaporation affect precipitation isotopes during five decades of warming across China. J. Geophys. Res. Atmos. 2021, 126, e2020JD033075. [Google Scholar] [CrossRef]
- Yu, W.S.; Yao, T.D.; Tian, L.D.; Ma, Y.; Wen, R.; Devkota, L.P.; Wang, W.C.; Qu, D.M.; Chhetri, T.B. Short-term variability in the dates of the Indian monsoon onset and retreat on the southern and northern slopes of the central Himalayas as determined by precipitation stable isotopes. Clim. Dyn. 2016, 47, 159–172. [Google Scholar] [CrossRef]
- Guo, X.Y.; Tian, L.D.; Wen, R.; Yu, W.S.; Qu, D.M. Controls of precipitation δ18O on the northwestern Tibetan Plateau: A case study at Ngari station. Atmos. Res. 2017, 189, 141–151. [Google Scholar] [CrossRef]


| Correlation Coefficient and Related Meteorological Parameters | Summer Half-Year | Winter Half-Year |
|---|---|---|
| Correlation coefficient (all precipitation) | 0.45 ** | 0.49 ** |
| Correlation coefficient (P ≤ 5mm) | 0.29 * | 0.42 ** |
| Correlation coefficient (P ≤ 3mm) | 0.32 * | 0.43 * |
| Average cloud bottom height/m | 520.80 | 421.25 |
| Average relative humidity/% | 84.66 | 86.34 |
| Average temperature/°C | 12.35 | 4.43 |
| Average raindrop diameter/mm | 1.14 | 1.00 |
Publisher’s Note: MDPI stays neutral with regard to jurisdictional claims in published maps and institutional affiliations. |
© 2022 by the authors. Licensee MDPI, Basel, Switzerland. This article is an open access article distributed under the terms and conditions of the Creative Commons Attribution (CC BY) license (https://creativecommons.org/licenses/by/4.0/).
Share and Cite
Yue, X.; Zhang, M.; Qu, D.; Wang, S.; Chen, F.; Zhang, Y.; Tian, Y. Backward Trajectory Analysis Based on Specific Humidity Correction for the Influence of Moisture Sources on Precipitation Isotopes in the Western Loess Plateau, China. Water 2022, 14, 3452. https://doi.org/10.3390/w14213452
Yue X, Zhang M, Qu D, Wang S, Chen F, Zhang Y, Tian Y. Backward Trajectory Analysis Based on Specific Humidity Correction for the Influence of Moisture Sources on Precipitation Isotopes in the Western Loess Plateau, China. Water. 2022; 14(21):3452. https://doi.org/10.3390/w14213452
Chicago/Turabian StyleYue, Xiaobo, Mingjun Zhang, Deye Qu, Shengjie Wang, Fenli Chen, Yu Zhang, and Yuanyuan Tian. 2022. "Backward Trajectory Analysis Based on Specific Humidity Correction for the Influence of Moisture Sources on Precipitation Isotopes in the Western Loess Plateau, China" Water 14, no. 21: 3452. https://doi.org/10.3390/w14213452