Article

Enhancement of Groundwater Recharge from Wadi Al Bih Dam, UAE

1
National Water and Energy Center, United Arab Emirates University, Al Ain P.O. Box 15551, United Arab Emirates
2
School of Interdisciplinary Studies, University Glasgow, Dumfries DG1 4ZL, UK
3
James Watt School of Engineering, University Glasgow, Glasgow G12 8QQ, UK
4
Geoscience Department, College of Science, United Arab Emirates University, Al Ain P.O. Box 15551, United Arab Emirates
5
Civil and Environmental Engineering Department, Faculty of Engineering, United Arab Emirates University, Al Ain P.O. Box 15551, United Arab Emirates
*
Author to whom correspondence should be addressed.
Water 2022, 14(21), 3448; https://doi.org/10.3390/w14213448
Submission received: 2 September 2022 / Revised: 22 September 2022 / Accepted: 27 October 2022 / Published: 29 October 2022

Abstract

:
Groundwater and harvested rainwater represent the only conventional freshwater resources in the United Arab Emirates (UAE). Groundwater resources in Wadi Al Bih, UAE, are sustainable due to the low exploitation rate for domestic and agricultural purposes. Thus, the groundwater depletion in this area is far less than in other parts of the country. The Wadi Al Bih area is very important for achieving water security in UAE. Therefore, the possible measures of increasing groundwater recharge (e.g., managed aquifer recharge (MAR) methods) are investigated in this paper. The available water resource data were collected, reviewed, validated, and stored in a GIS database. Then, a GIS-based water budget model (WBM) was developed to evaluate the available groundwater resources in Wadi Al Bih and recharge sources. The analyses showed that only 49% of the accumulated rainwater behind the dam is recharging the underlying aquifer. Due to the absence of any direct recharge techniques, the remaining 51% is lost by direct evaporation (15%), and as soil moisture increases in the unsaturated zone (36%), it will subsequently evaporate or percolate depending on the precipitation pattern and air temperature. The results of the WBM indicated that the freshwater resources were decreasing at an alarming rate of approximately thirty-five million cubic meters (MCM) per year until 2019. The groundwater storage and salinity were governed by the rates and patterns of precipitation. For example, the recharge resulting from the two consecutive maximum monthly precipitation events in December 2019 and January 2020 has significantly increased the fresh groundwater reserve and slightly retreated the saline/brackish water toward the shoreline. Moreover, a Mann–Kendall trend analysis was conducted to assess the influence of precipitation, temperature, and evaporation on groundwater recharge. The outcomes suggested that climate variables had a significant effect on groundwater supplies. The mitigation measures include revising groundwater withdrawal rates based on the annual recharge and enhancing recharge using different MAR techniques and dam operation plans.

1. Introduction

United Arab Emirates (UAE) has limited conventional renewable water resources. The rampant increase in groundwater exploitation has caused a decline in the groundwater levels of the Quaternary aquifers. The groundwater depletion problem is aggravated by the prevailing drought conditions and climate change [1]. Several recharge dams were constructed in the main to augment the groundwater recharge of the upper aquifer. The local groundwater recharge is reflected through the water table rise in nearby observation wells. However, as the floodwater is detained, the sediments settle down, causing the pore spaces to clog in the upper layers of the reservoir subsurface. While the deposition of silts and sediments on the reservoir bottom leads to a reduction in infiltration rates and storage volumes, it also contributes to the increase in evaporation rates. Recent studies indicated that due to the clogging problem, only 7–49% of the accumulated surface water in the ponding areas behind dams in the UAE reaches the target aquifer depending on the physiographic conditions and precipitation pattern [2,3]. Before the construction of a desalination plant in 1998, groundwater abstraction was the only source of freshwater for domestic use in the city of Ras Al Khaimah, UAE. Fresh groundwater resources in the Wadi Al Bih catchment (Figure 1) are still used for the partial domestic supply of the city and continue to represent the source of water security for the city and its surrounding suburbs.
Climate change will have adverse impacts on water resource availability, agricultural production, precipitation patterns, human health, and biodiversity [4,5]. The impacts on water resources include an increase in crop irrigation requirements and a decrease in groundwater recharge. In the long term, there might be a decline in groundwater recharge; however, extensive rainfall variability could cause regular and protracted periods of low or high-water levels. Climate change affects not only groundwater quantity but also groundwater quality. A review paper on regional atmospheric and water modeling qualitative research [6] indicated that summer and winter temperatures in the UAE might increase up to 2 °C to 3 °C, and agricultural water use may increase due to the resulting increase in evaporation in the UAE [3,7,8].
Under climate change, sea level rise may lead to saltwater intrusion into coastal aquifers, affecting groundwater quality in the western part of the Wadi outlet area. Once the saltwater has intruded into the fresh groundwater water system, it is difficult to remedy groundwater.
Planning is going on by water authorities in the UAE to mitigate the negative impacts of climate change in many ways. This includes the improvement of the dam’s management in the country and introducing the possible managed aquifer recharge methods to minimize the evaporation component as much as possible to increase the recharge percentage from the accumulated water behind dams and increase rainfall events by cloud seeding. With this goal in mind, the present study aims to:
  • Develop a local-scale GIS-based groundwater budget model (GWBM) for the Wadi Al Bih area to determine the available groundwater resources;
  • Estimate the other sources of groundwater recharge, such as internal flow and return flow;
  • Determine the influence of rainfall, temperature, and potential evaporation on total groundwater storage in the Wadi Al Bih area.

2. Materials and Methods

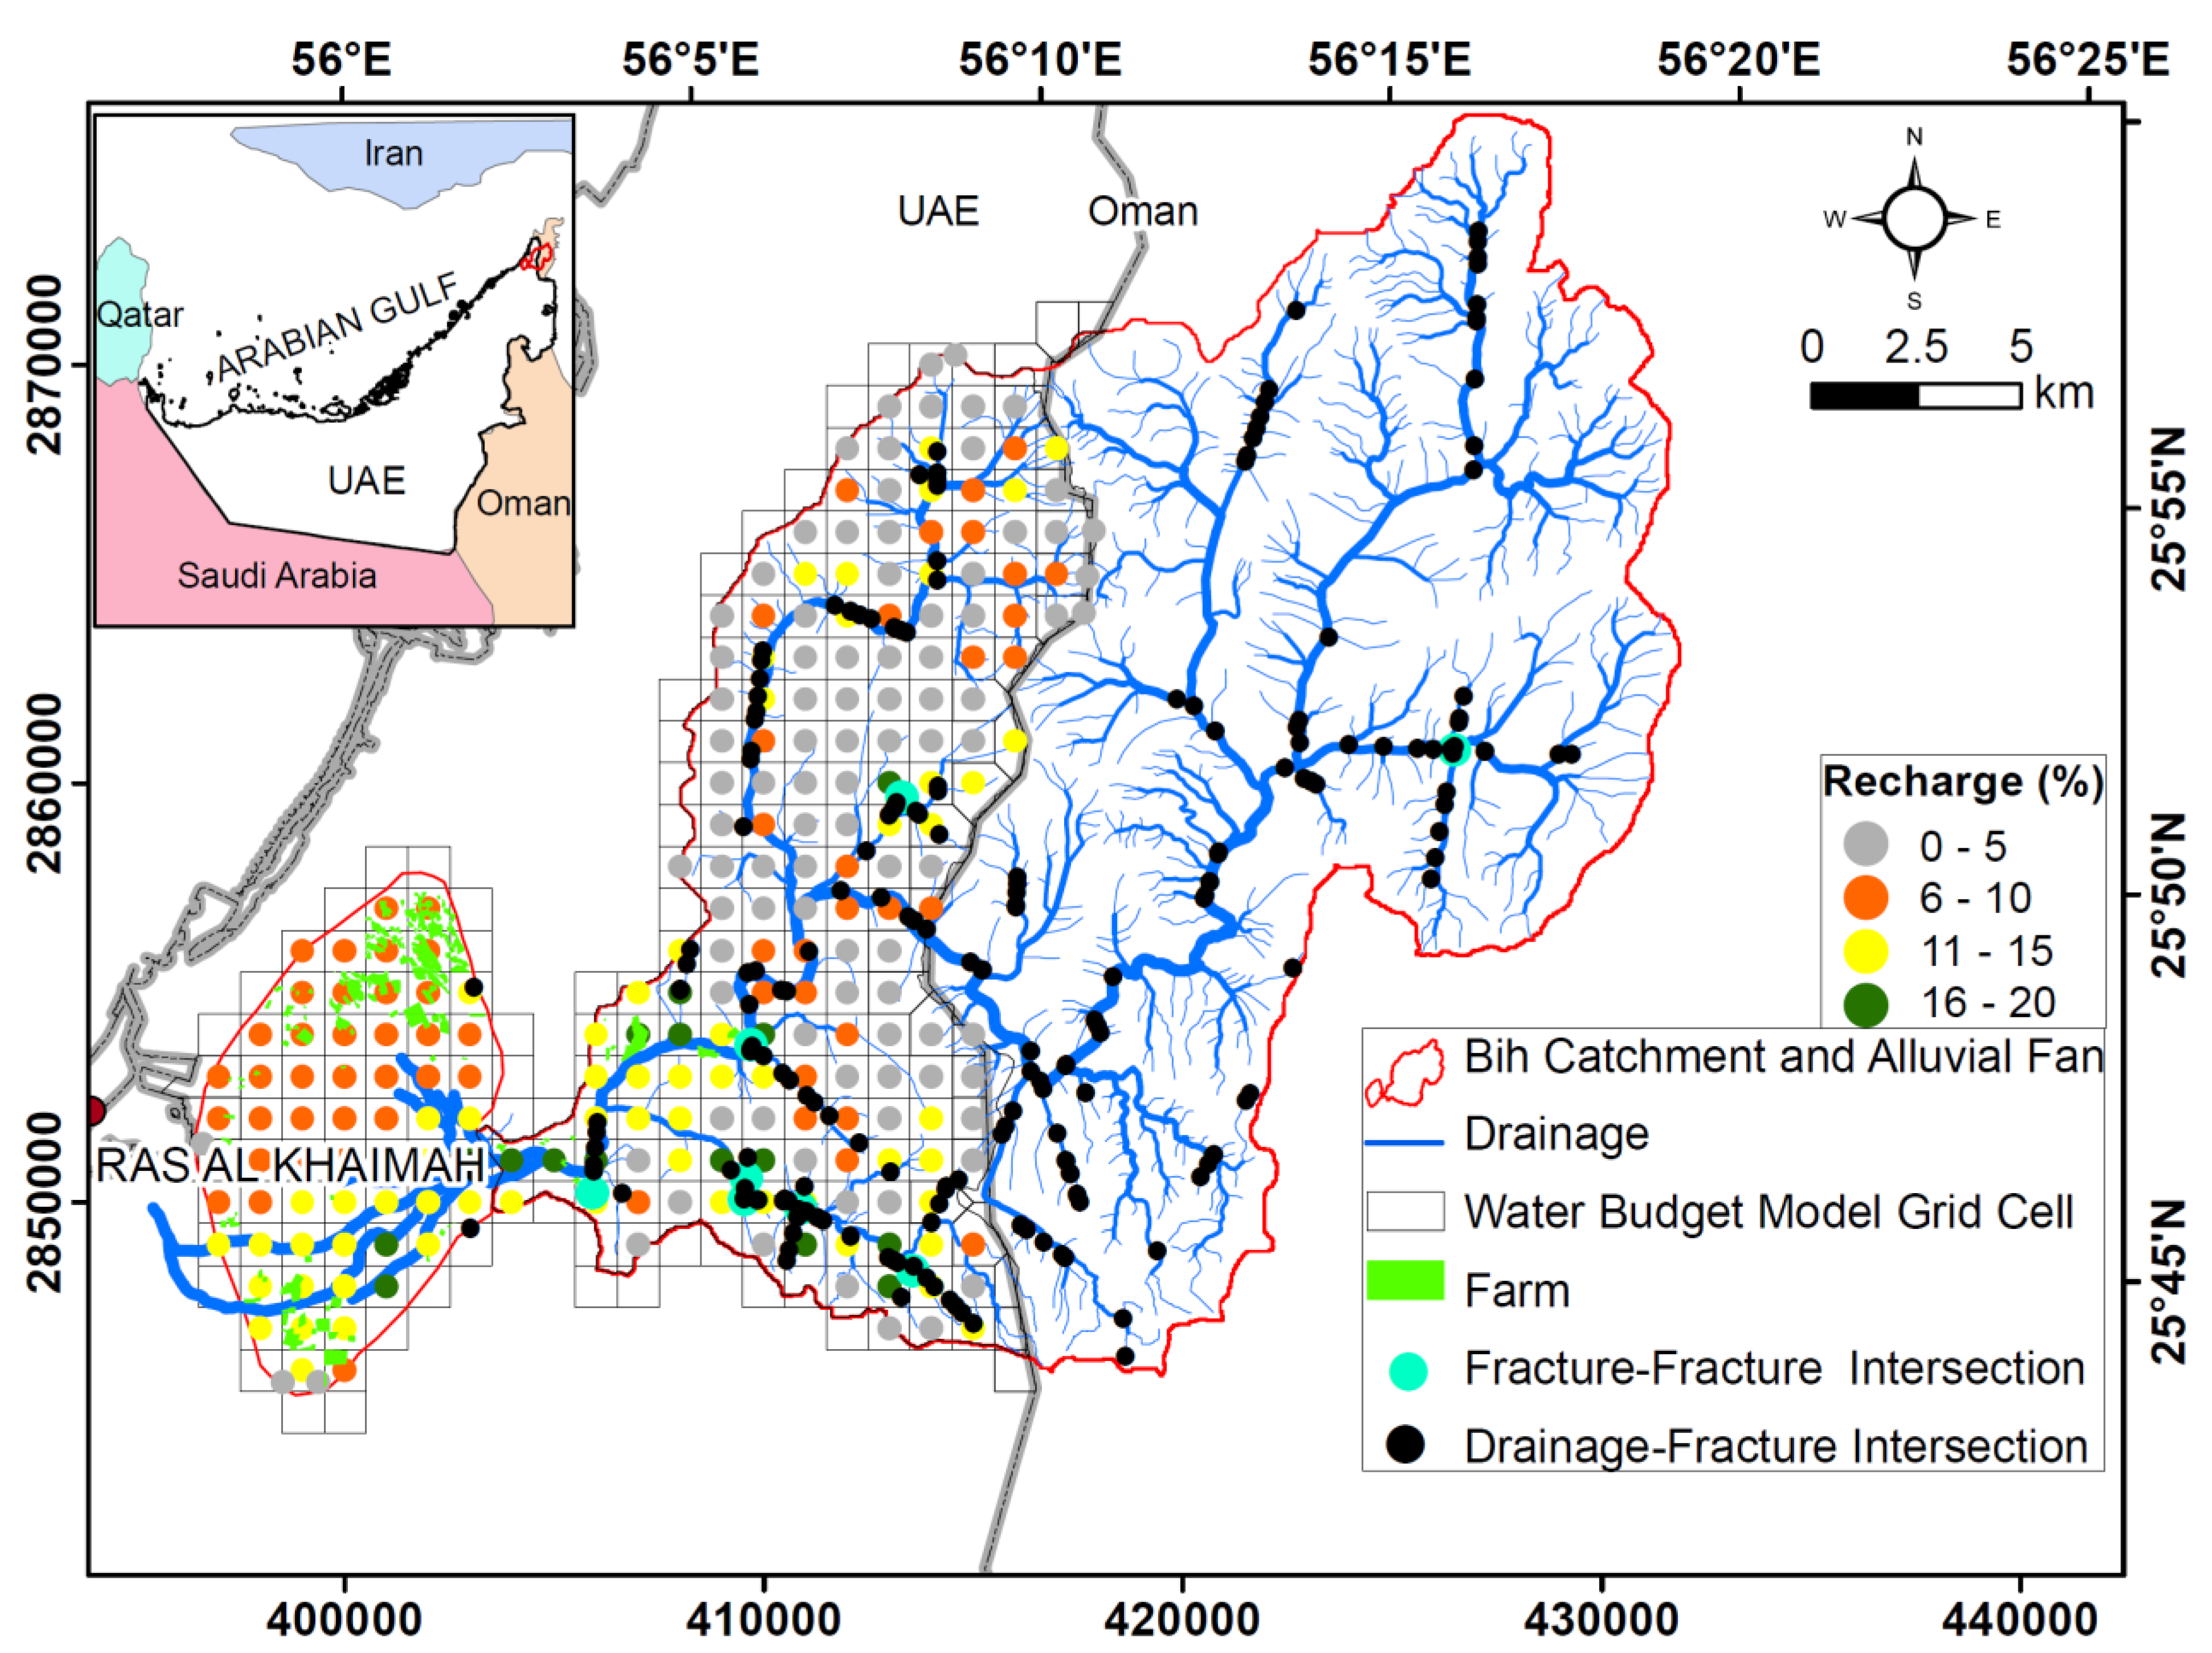
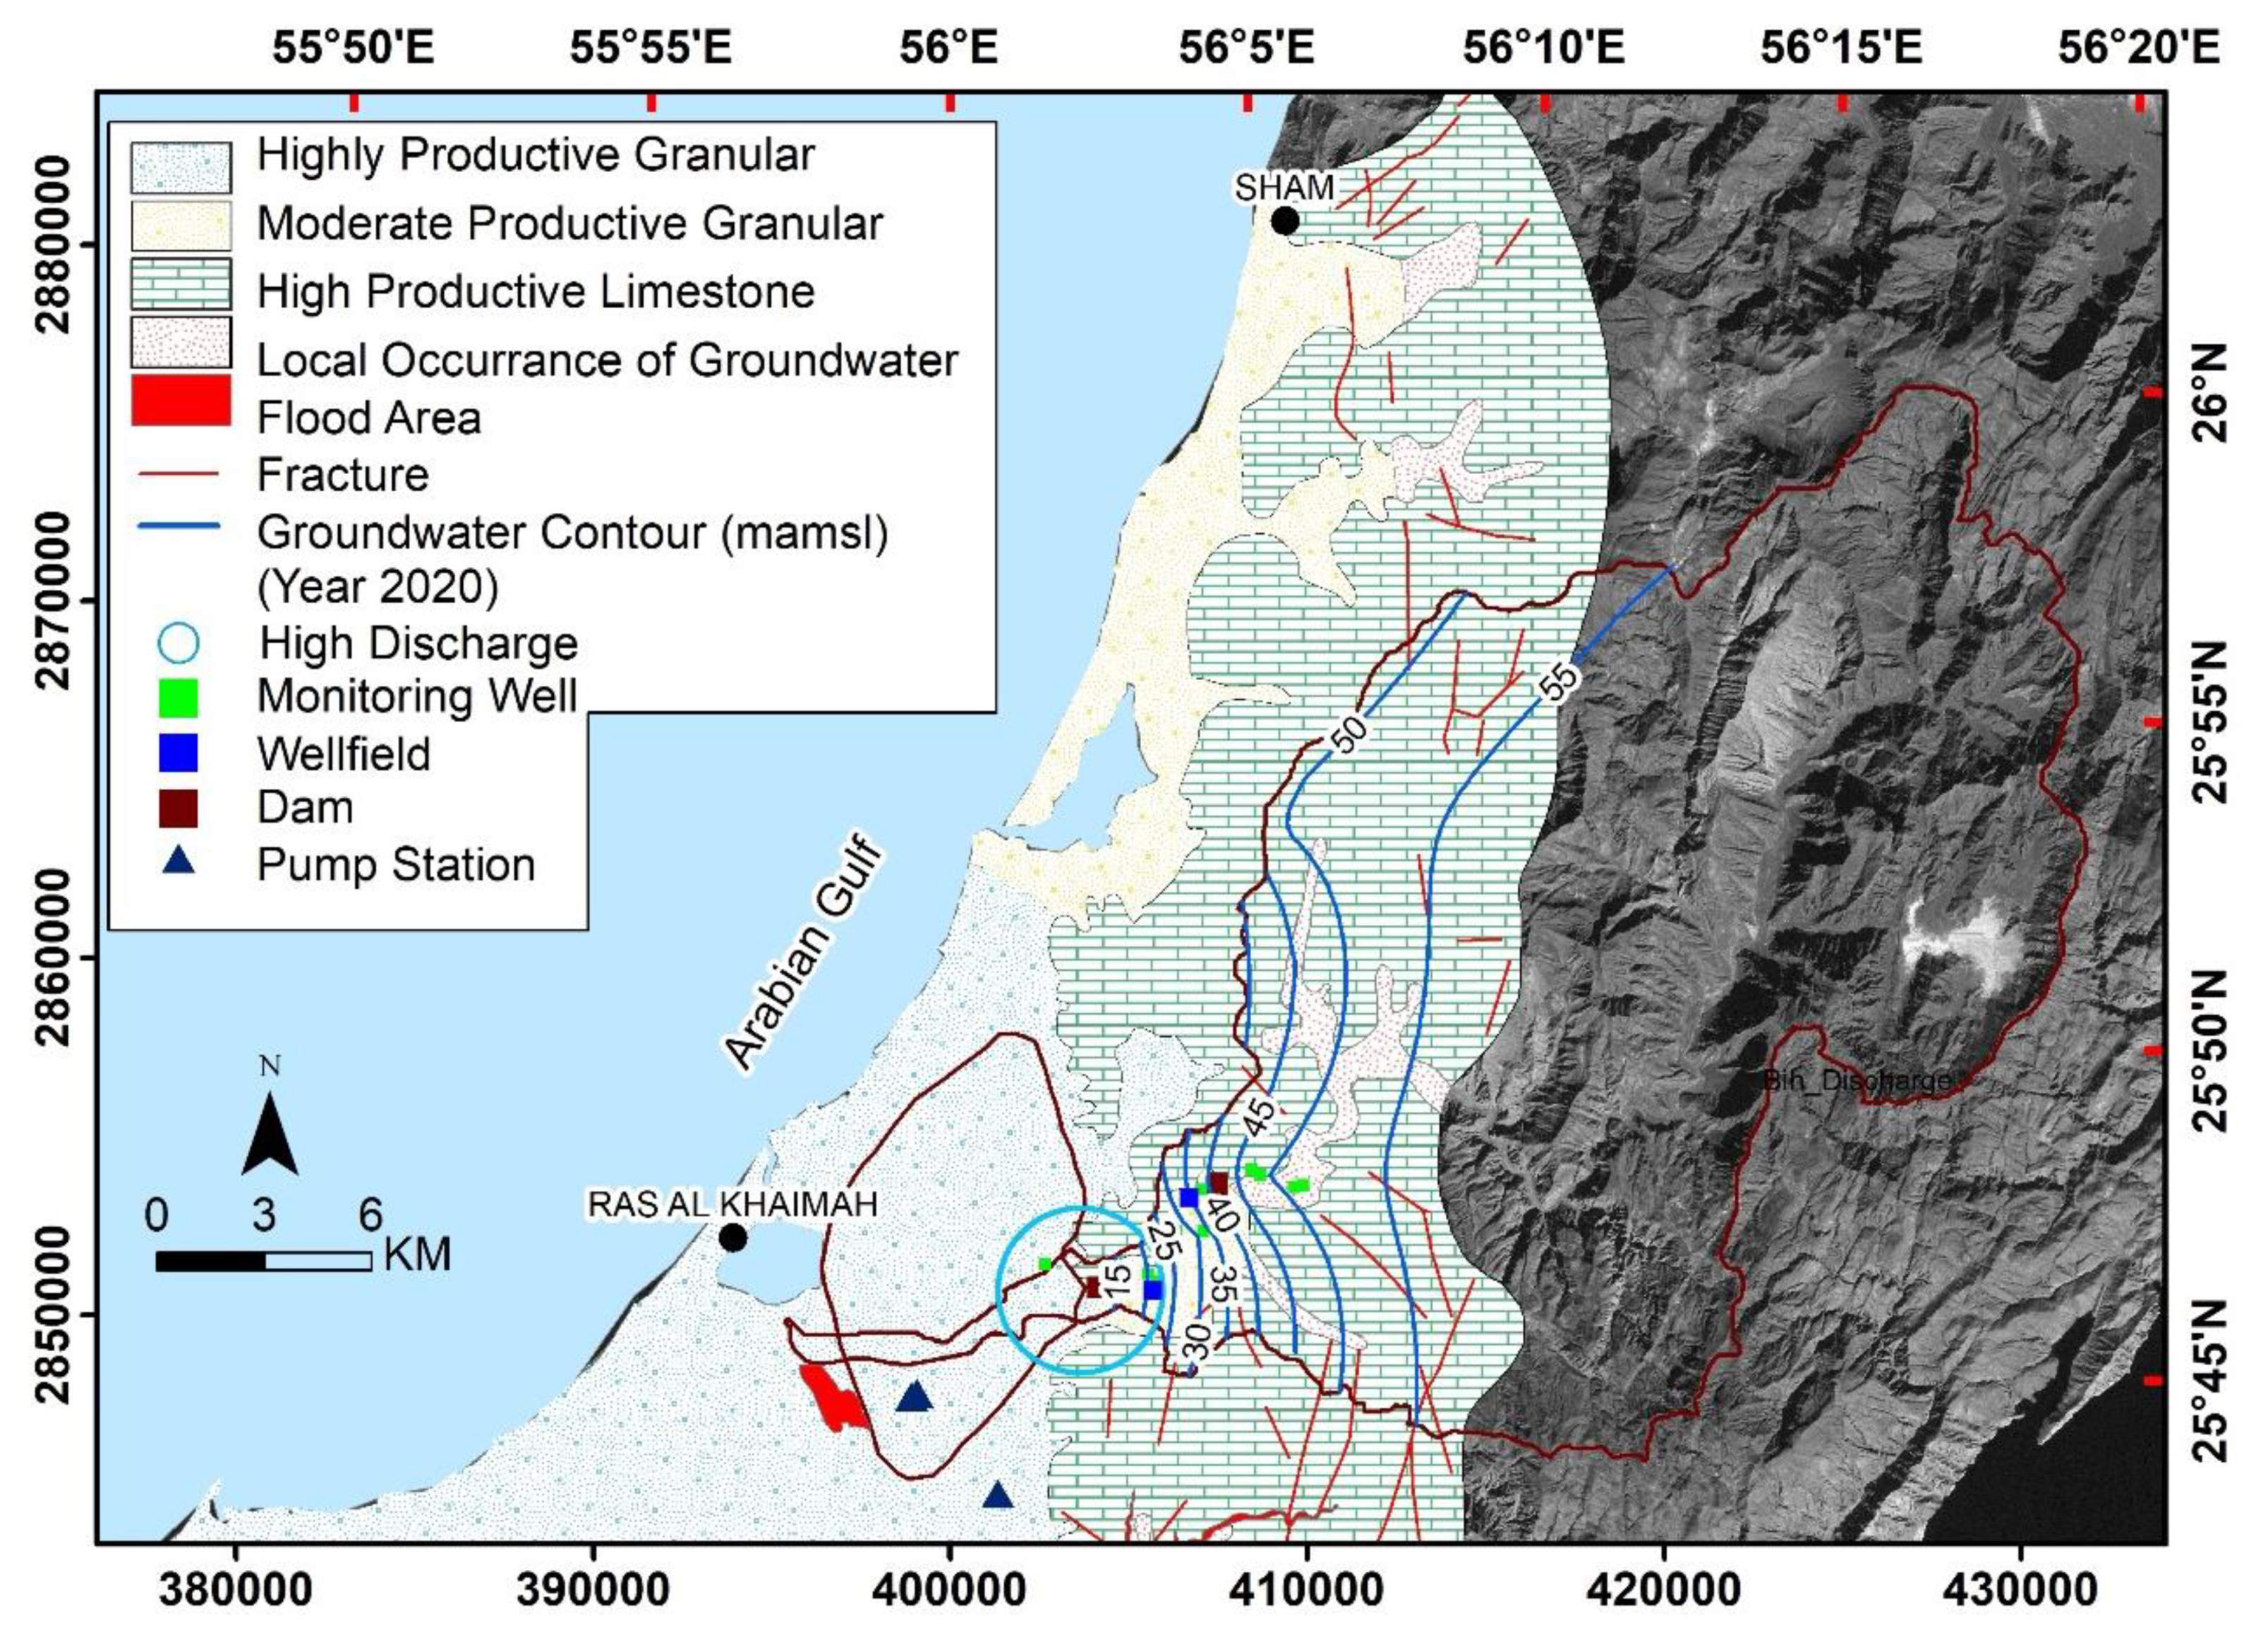
2.1. Site Description

2.1.1. Location

Wadi Al Bih is one of the large valleys in the northern emirates of the UAE. It constitutes a vast network of valleys having a land area of 470.58 km2 (Figure 1). The catchment area of Wadi Al Bih is divided into a) the UAE part (172.32 km2) and b) the Oman part (298.26 km2). The alluvial fan area is 60.52 km2, which lies totally within the UAE. The maximum elevation in Wadi Al Bih is 2087 m above mean sea level (AMSL). Burairat is at a minimum elevation (65 AMSL) and is located close to the outlet. The catchment has very little vegetation, and the topography is very rugged, having steep slopes (average gradient is 1:250).
Geologic structures usually govern the well-developed drainage net of the Wadi Al-Bih. The hydrologic evaluation reveals a higher degree of flash flood hazards despite the moderate nature of the Wadi Al Bih drainage. The Al Bih dam was constructed in 1983 and is situated at an elevation of 110 m above mean sea level. The length, height, and total capacity of the dam are 160 m, 18 m, and 7.8 MCM, respectively. The total capacity of the dam has been increased to 10 MCM by drilling one deep pond (300 m × 300 m × 25 m) in the main dam reservoir area. The dam has largely contributed to minimizing the flashfloods and enhancing the potential of groundwater recharge in the surrounding areas. The accumulated volume of surface water behind the dam is a function of the precipitation volume and pattern.
The average total annual precipitation in the period 1980–2015 ranged from 110–150 mm (Figure 2a). While in an average wet year, such as the water year 2019–2020, it ranged from 140–350 mm/year (Figure 2b). In that year and in almost the whole area, the total annual precipitation was 2–3-fold its average value. The amount of rain that can fall in a single storm may exceed the total rainfall of a dry year (e.g., 35.80 mm in 1984). The Abu Dhabi Global Environmental Data Initiative (AGEDI) (2015) also documented that under climate change, rain events will be more intense but with longer dry spells. This may be due to the influence of warming in the air [9]. Warm air holds more moisture and, as a result, more evaporation and vapor condensation. Thus, when a rain event occurs, it will be more extreme due to added moisture [10].

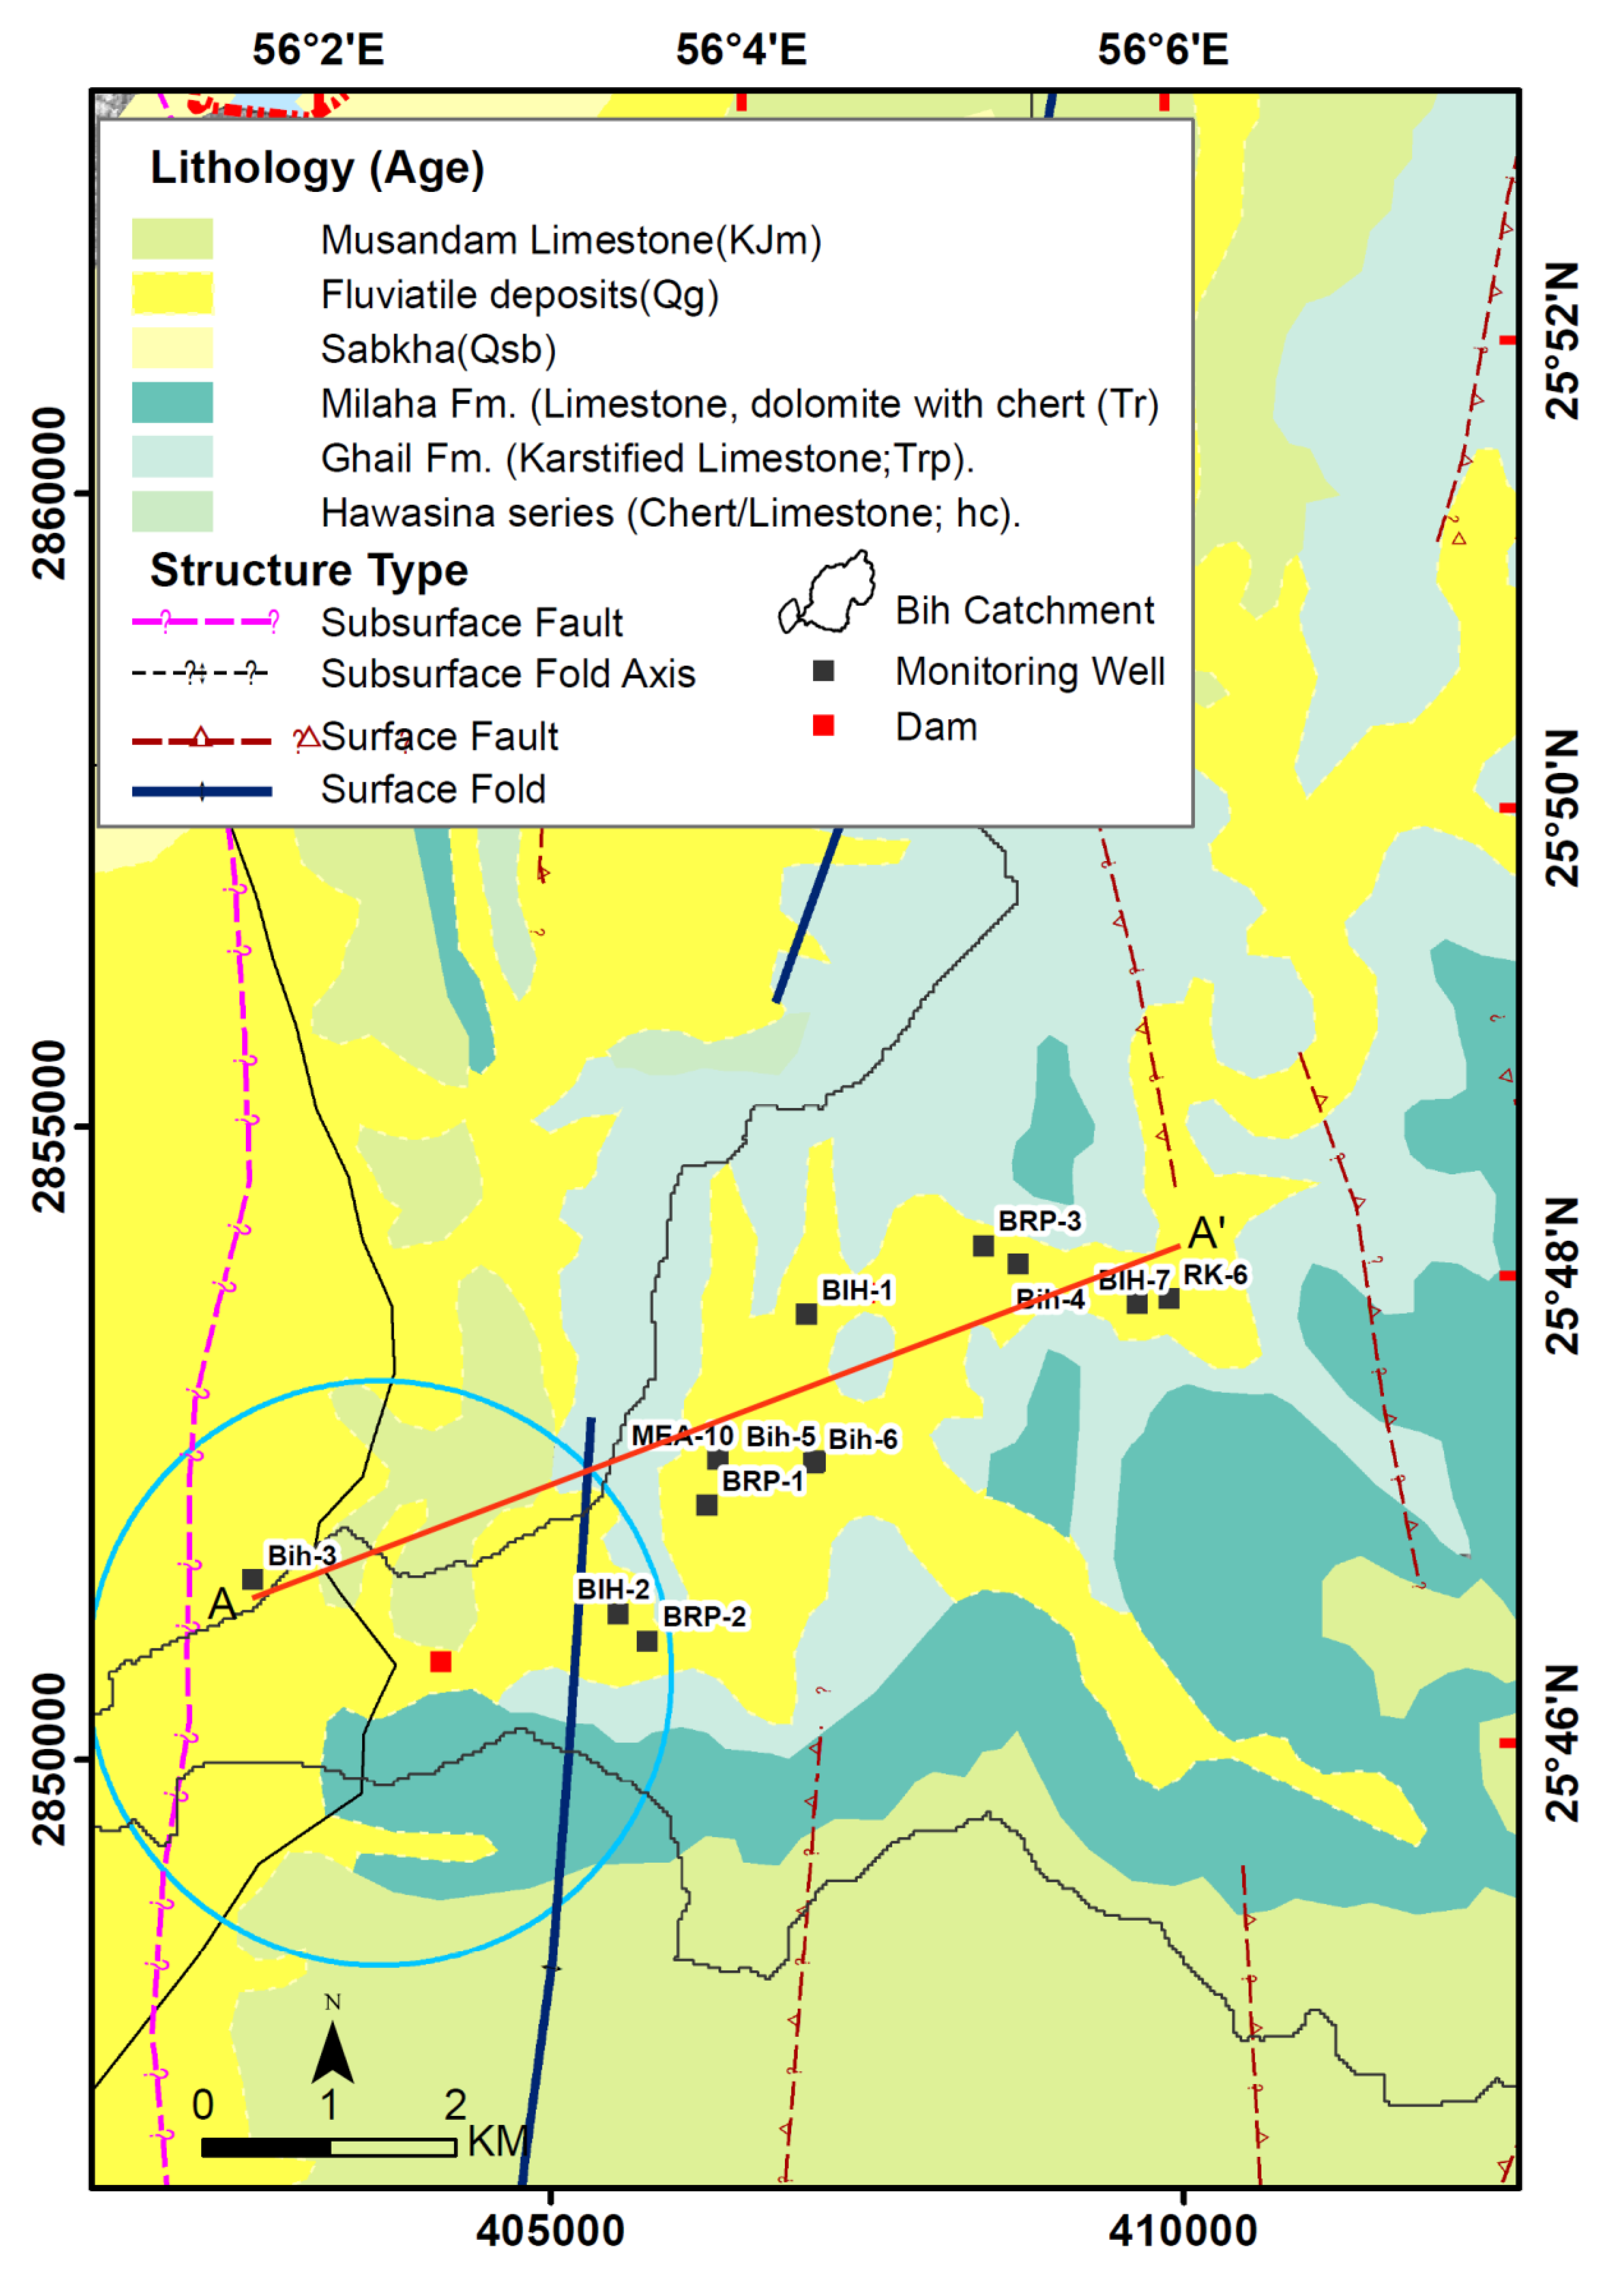
2.1.2. Geological Setting

The geology of Wadi Al Bih infers that Permian Early Triassic dolomites and dolomitic limestones of the Russ al Jibal Group are predominant around Wadi Al Bih (Figure 3). The existing drilling data of nine monitoring water wells was exploited to illustrate various subsurface geologic cross-sections (an example is shown in Figure 4). In addition to the available drilling information, several geoelectric cross-sections based on the results of geophysical data from time-domain electromagnetic (TDEM) and earth resistivity imaging surveys [11,12] were also used to approximate subsurface stratigraphy in the area where no drilling information was available. The alluvial cover generally differs in thickness but most of the time exceeds 80 m and is comprised of two units. Loose superficial Wadi gravels make up the upper unit and have thicknesses ranging from 15 to 20 m (yellow color in Figure 3). The lower unit is comprised of debris in size varying from gravel to boulder and is partly cemented by calcite and silica (orange color in Figure 3). The depth of this base layer ranges from 80 to 160 m below ground level over the Wadi Al Bih area (orange color in Figure 4). This layer can be considered a transition zone between the base sequence of the alluvial gravels and the weathered top surface of the limestone basement (Figure 4). The sediments in the Russ al Jibal Group were accumulated on the Arabian continental margin and can be classified into the following (Figure 4).
  • Ghail Formation (blue color in Figure 4): The age is Triassic. The environment of deposition is thought to be in the tidal zone, conforming to dolomite deposition in the present-day sabkhas in the Emirates. The formation consists of a thick fractured dolomitized limestone and represents the upper layer of the deep aquifer.
  • Hagil Formation (light green color in Figure 4): The Hagil Formation agreeably overlies the Bih formations having lithology of light-colored, fine-grained argillaceous.
  • Limestone with shale separations and sporadic shale beds, dolomitized limestone, and slight oolitic limestones. This formation age ranges from the late Permian to the Early Triassic. From the structural point of view, the eastward-dipping dolomite close to the main dams constitutes some eastern limb portions of the anticline, which plummets to the south [11,13].
  • Bih Formation (light brown color in Figure 4): Age-wise, the Bih Formation is Permian and has a thickness ranging between 200 m and 650 m [11,12].

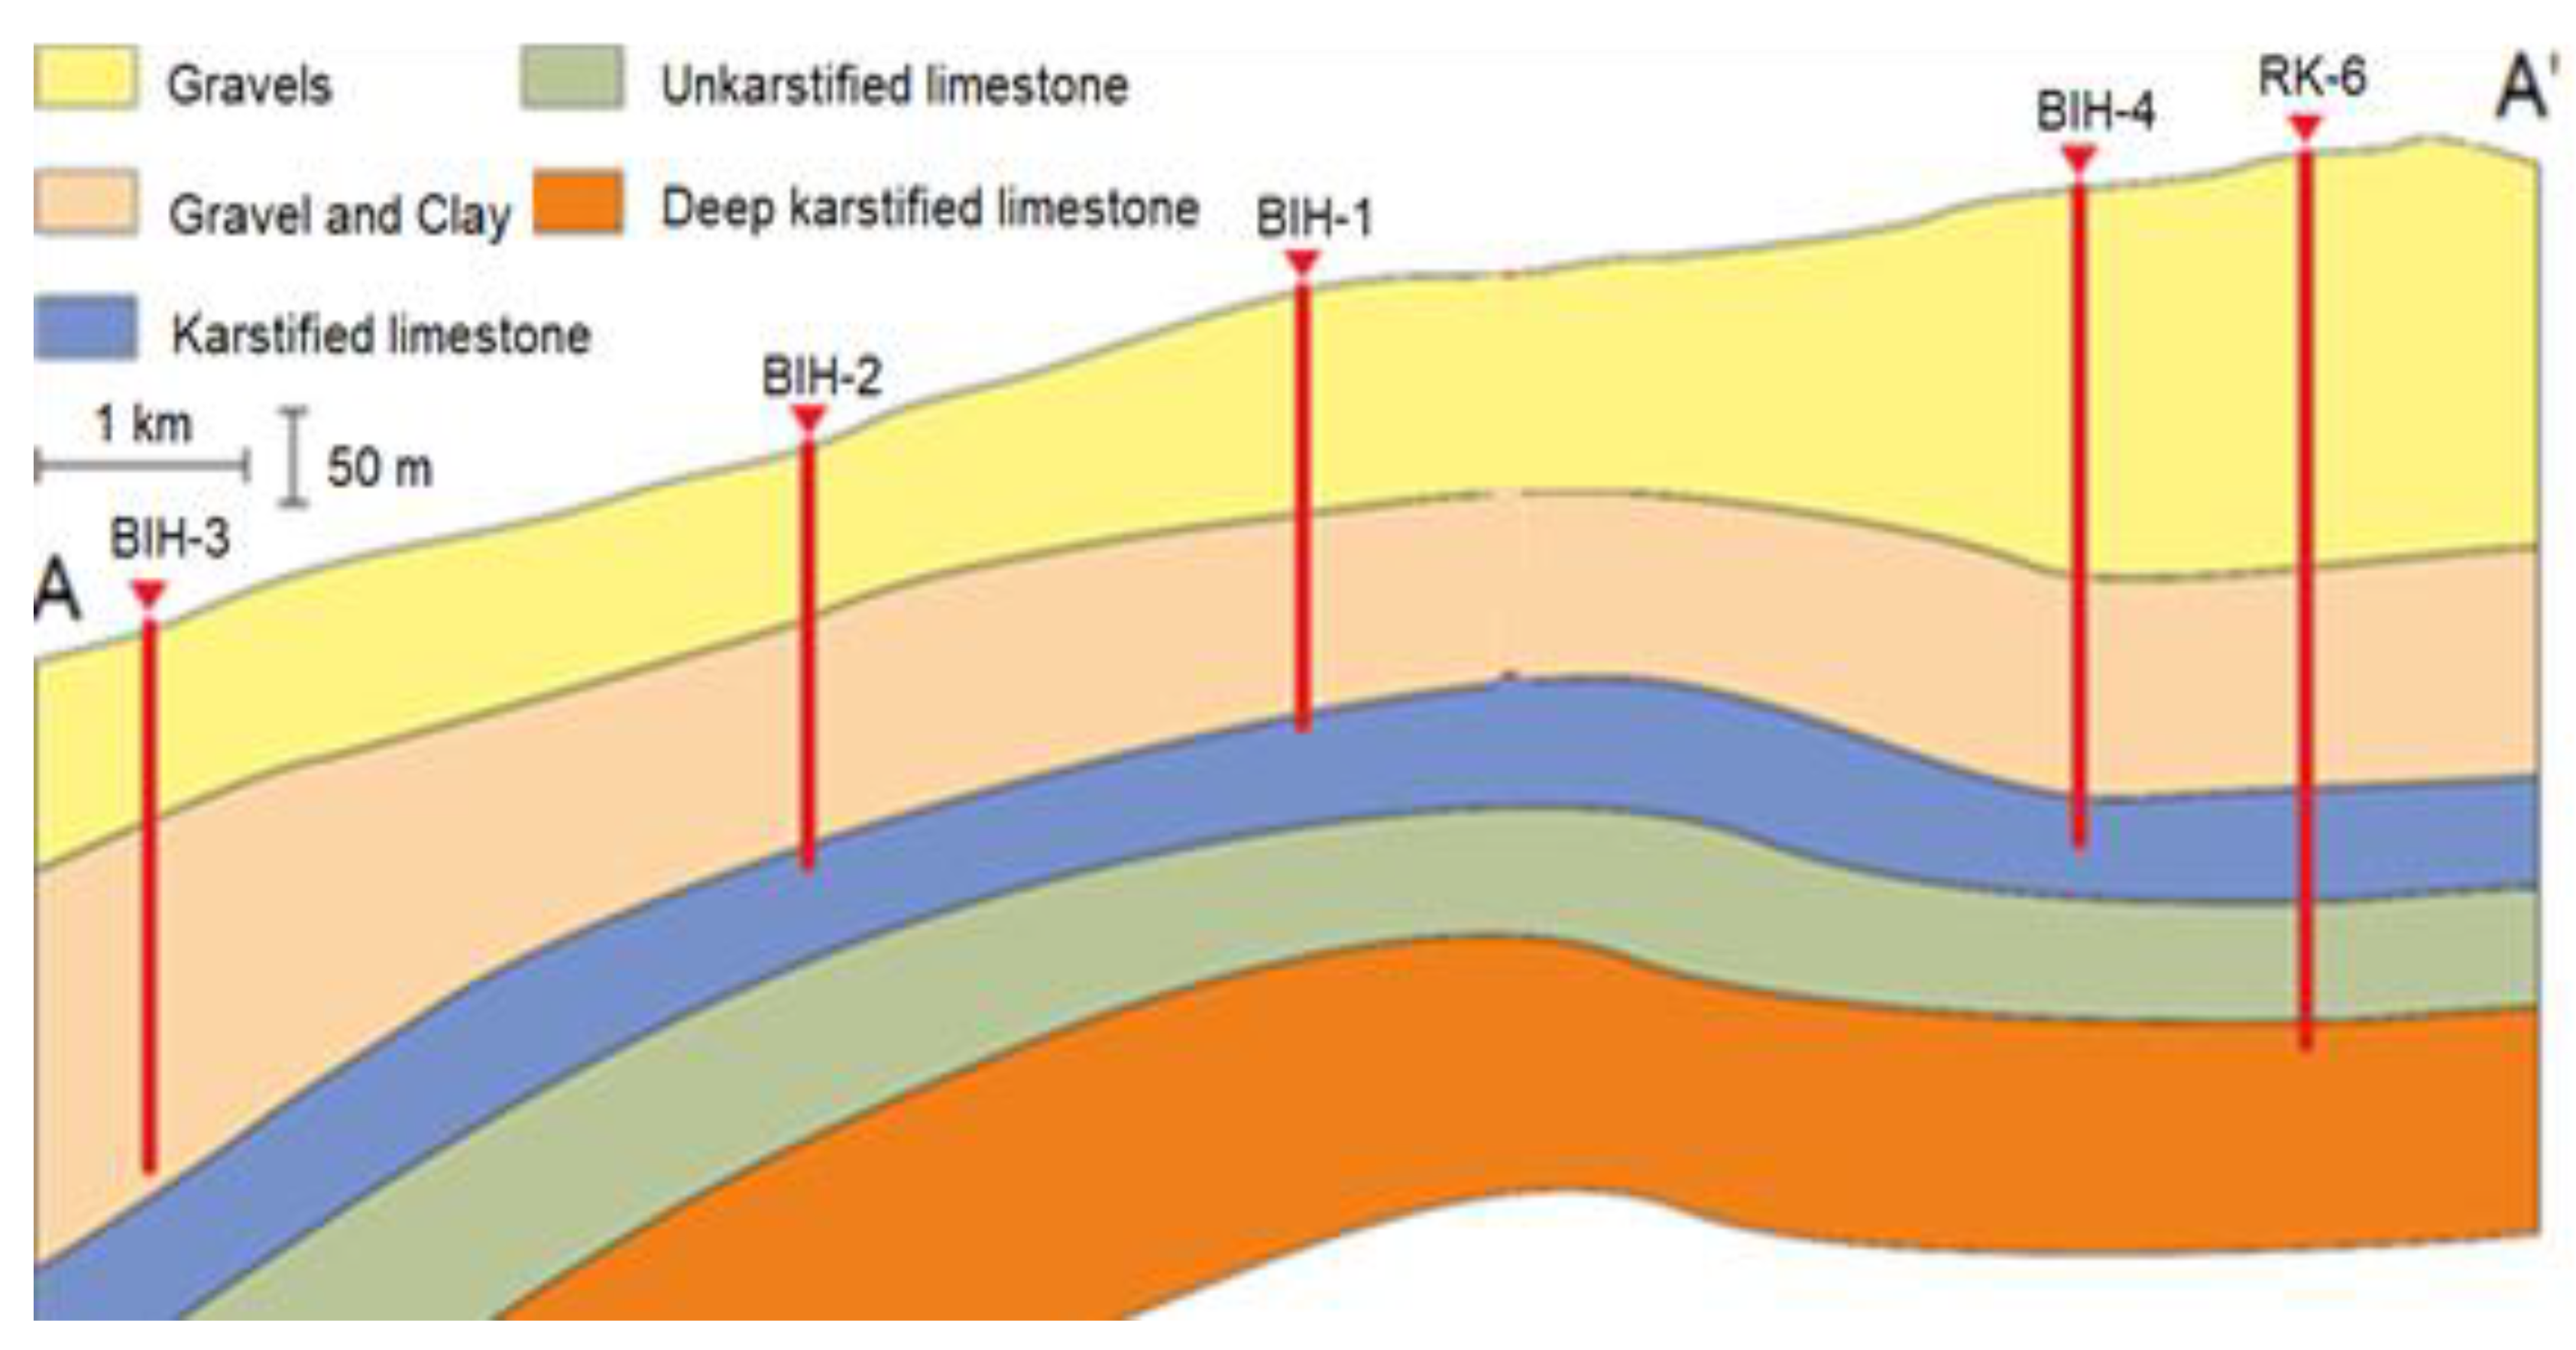
2.1.3. Hydrogeological Setting

The existence of rounded fragments and fracture zones in the caliper logs of some wells (e.g., Well-RK-6) is considered an indication of the presence of karst features in the Bih Formation. Lithological logs (e.g., RK-6) reveal that the carbonate sequence contains groundwater underlying the dry alluvial gravels. Therefore, the upper part of the Bih Formation, along with the overlying Hagil Formation, represents the most important groundwater aquifer in the area, and its potential depends on the degree of karstification (Figure 4). The thickness of the Wadi gravel and the weathered zone of limestone is approximately 150 m. This means that the depth of the limestone bottom surface is approximately 150 m from the ground surface in the area between the two dams. It is also observed from the cross-sections that the limestone basement conforms with the surface topography. Based on the above interpretation, the aquifer system in the Wadi Al Bih Dam area can be divided into two subunits, namely, gravels and the underlying weathered and karstified limestone, which have relatively good groundwater potential (Figure 5). The gravel layer can be sub-divided into recent gravels (silty and sand gravel with some cobbles), young gravels (silty sandy gravels with plenty of cobbles and boulders, and old gravels, which are silty sandy gravels with many cobbles and boulders that are weathered and cemented. The hydraulic conductivity values of the unconsolidated recent and young gravels tend to be very high, typically 0.86 to 86 m/day, and a specific yield of 0.15–0.22 [12]. Hydraulic conductivity of the old gravels with evidence of cementation where its value ranges between 0.0086 m/d and 0.086 m/d. In the uncemented gravels, the primary porosity is very high. Where the gravels start to become slightly cemented, fissures may occur, and these fissures could be important.

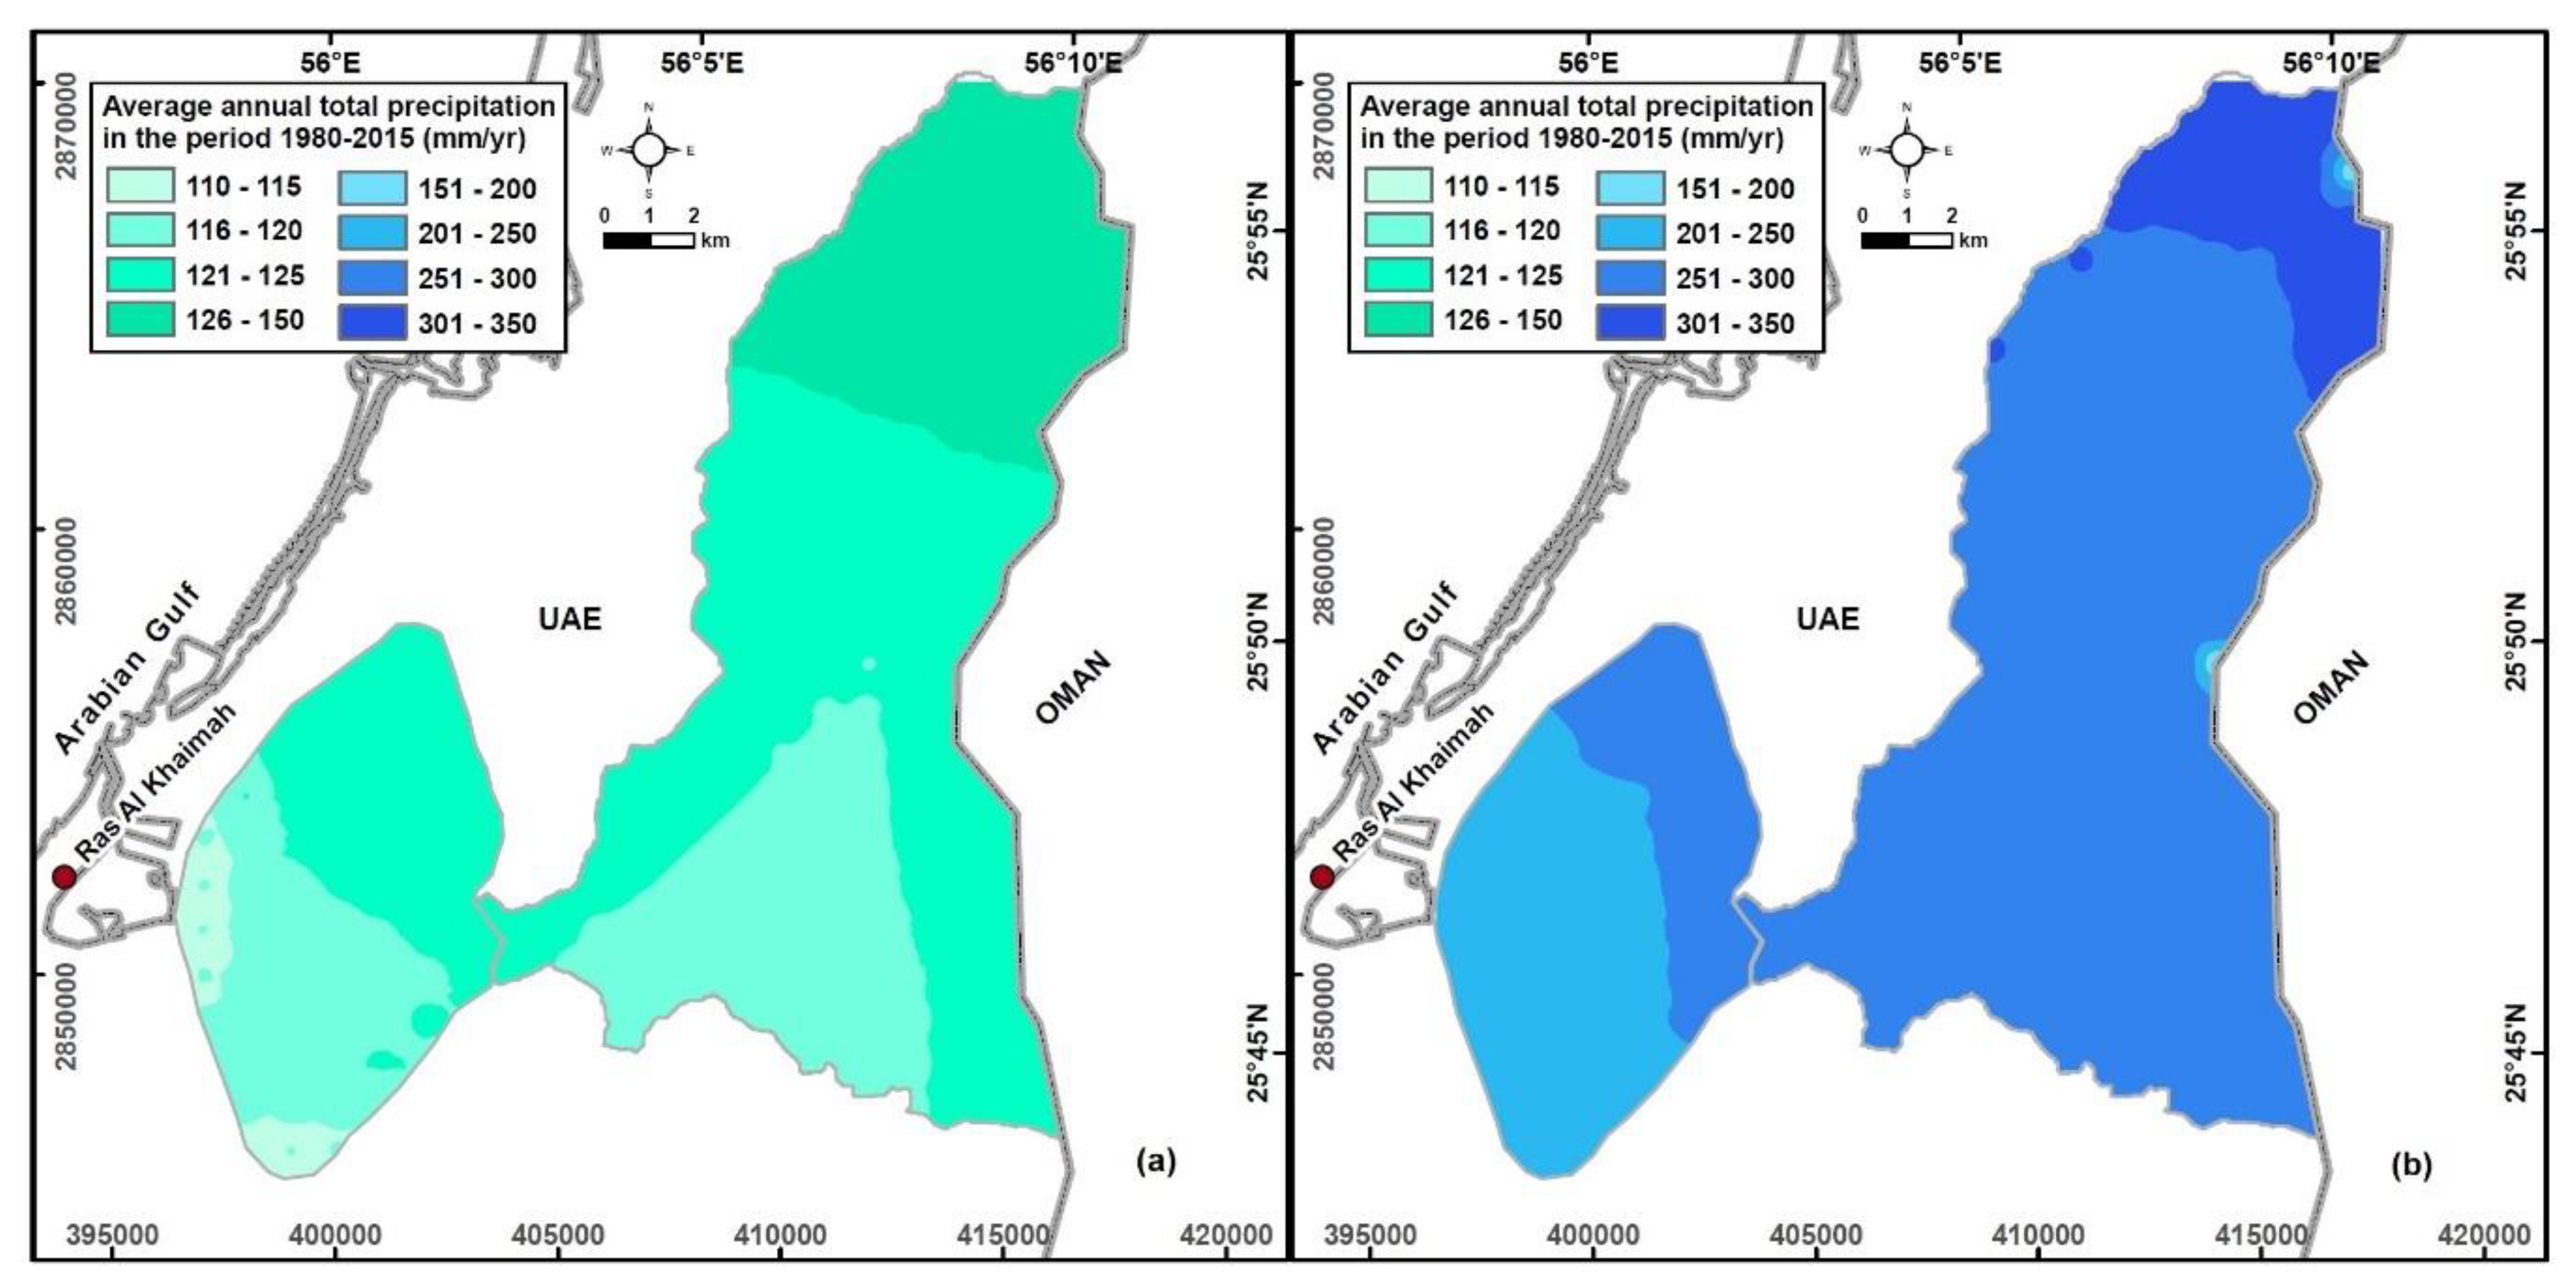
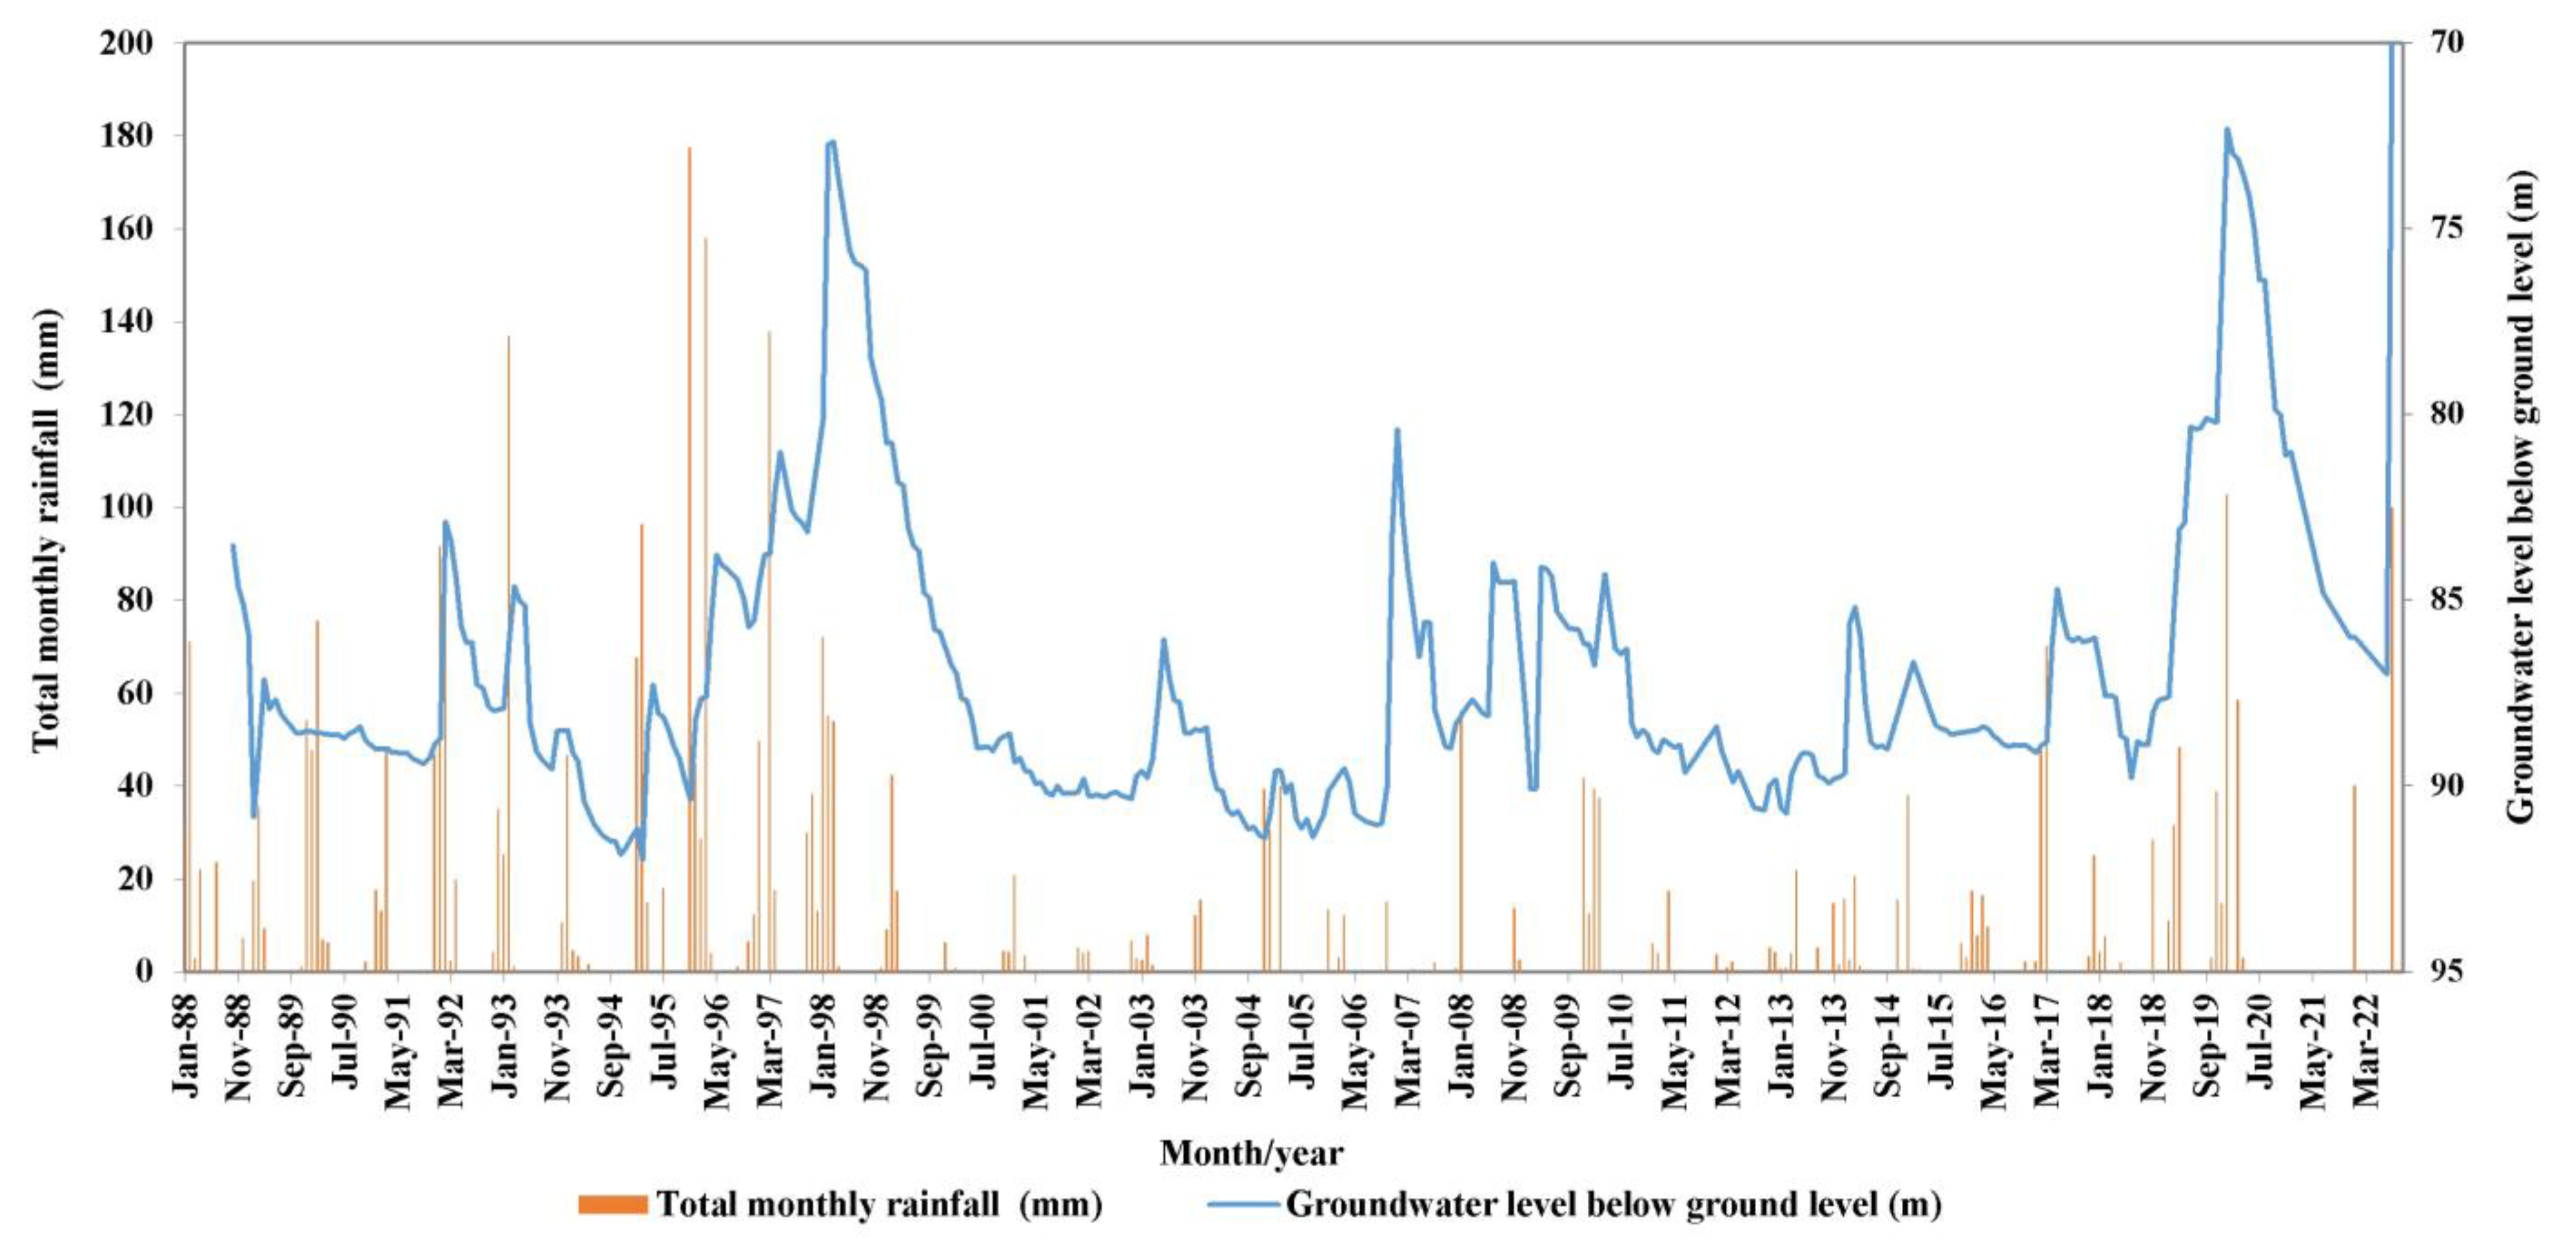
2.2. Data Collection

The primary data were collected from several authorities, organizations, and previous studies [11,12,14,15]. The geological maps of the Northern Emirates, 8 lithological logs of wells with a maximum total drilled depth of 200 m below the ground surface, available subsurface geological sections, and several newly constructed subsurface geological cross-sections were validated before storage in a GIS database to facilitate spatial and temporal analysis using the groundwater budget model as input. In addition, several hydrogeological and geophysical investigations were conducted in the Wadi Al Bih area [11,12,14]. These studies have documented detailed data on geoelectrical cross-sections, geophysical and lithological logs, sub-surface geological cross-sections, types of the aquifer and their geometric settings, water-table elevation records, and pumping tests. Ten monitoring wells are available with all the lithological logs and drilling details. These wells cover the majority of the Wadi Al Bih area (green squares in Figure 5), and all of them have been constantly used to examine water table elevations (an example is shown in Figure 6) and groundwater quality since 1988. Climate change affects the groundwater system in many ways [16]. In hydrological cycle terminology, climate change affects soil infiltration, percolation, deep percolation, and, thus, groundwater storage. The increase in evaporation due to higher temperatures also limits recharge. Thus, to assess the effect of these major variables, such as rainfall, temperature, and potential evaporation (due to the non-availability of in situ evaporation data), we obtained the potential evaporation data from [17] and the rainfall and temperature data from the National Climate Meteorology (NCM), UAE rain gauge network. NCM gauges measure rainfall electronically with a threshold of 0.2 mm. The groundwater recharge estimation was performed based on a water budget model approach.
The updated and validated water resource data for Wadi Al Bih were saved in a GIS database. The database includes thematic layers for each parameter (e.g., topographic elevation (m, AMSL); average annual total precipitation (mm); water table elevation (m, AMSL); water table depth (m, AMSL); Sy (%); hydraulic conductivity, K (m/d); aquifer base elevation (m, AMSL); soil type; land use; water infrastructure; geological units and structure; groundwater potentiality; aquifer type; total dissolved solids (TDS) of 1969, 2005, 2015, and 2020 (mg/l); etc.). Considering the spatial location, all the layers were merged into a distinct layer with a single table of attributes (each parameter having one column). Supplementary features were incorporated for saturated thickness and groundwater storage (in 1969, 2005, 2010, 2015, and 2020) to calculate the groundwater storage of each water type (fresh/brackish/saline) for the study area. The above process was accomplished using the querying modules of the Geomorphological Information System (GIS) environment. This thematic layer helped to produce a raster map of each parameter for the Wadi Al Bih area.

2.3. Variogram Testing

The UAE part of Wadi Al Bih was divided into a grid of equal squares with an area of 1 km2 (Figure 1). The Kriging technique with the appropriate variogram models was used to assign the values of aquifer base elevation, water table elevation, and saturated thickness (in 1969, 2005, 2010, and 2015), safe yield (sy), and groundwater salinity for 1969, 2005, 2015, and 2020 (Figure 7) for each of the 229 grid cells (Figure 1). Sy for the Quaternary aquifer in the study area was calculated from the pumping test experiments for nine wells. An exact/approximate interpolator was implemented by the gridding techniques based on the goals of the study. A suitable variogram model was selected to fit the Kriging method to the observed data (Figure 1). This step was done to avoid the under or over-estimation of the parameters at any cell by utilizing suitable control points (e.g., constant salinity points in the Arabian Gulf). The variogram testing and stochastic modeling process were repetitively used with each parameter to prevent the requirement for sensitivity analysis.

2.4. Water Budget Model

A GIS-based water budget model (WBM) was developed to estimate the total water storage using Equation (1). This was primarily to evaluate the status of groundwater resources and recharge sources in the Wadi Al Bih area to provide a quick decision on the future impacts of changes on these groundwater resources and to determine feasible managed aquifer recharge (MAR) techniques to increase the current dam efficiency (49%). Groundwater storage at each grid cell is calculated as follows:
G W V i , j = S p e c i f i c   Y i e l d   o f   c e l l i , j × A r e a i , j × S a t u r a t e d   t h i c k n e s s i , j
where G W V i , j is the groundwater storage in grid cell (i, j) for which the aquifer storativity and saturated thickness are predetermined and stored in the GIS database. Groundwater storage in the Quaternary aquifer ( G W V ) in the Wadi Al Bih area is equal to i j G W V ( i , j ) .

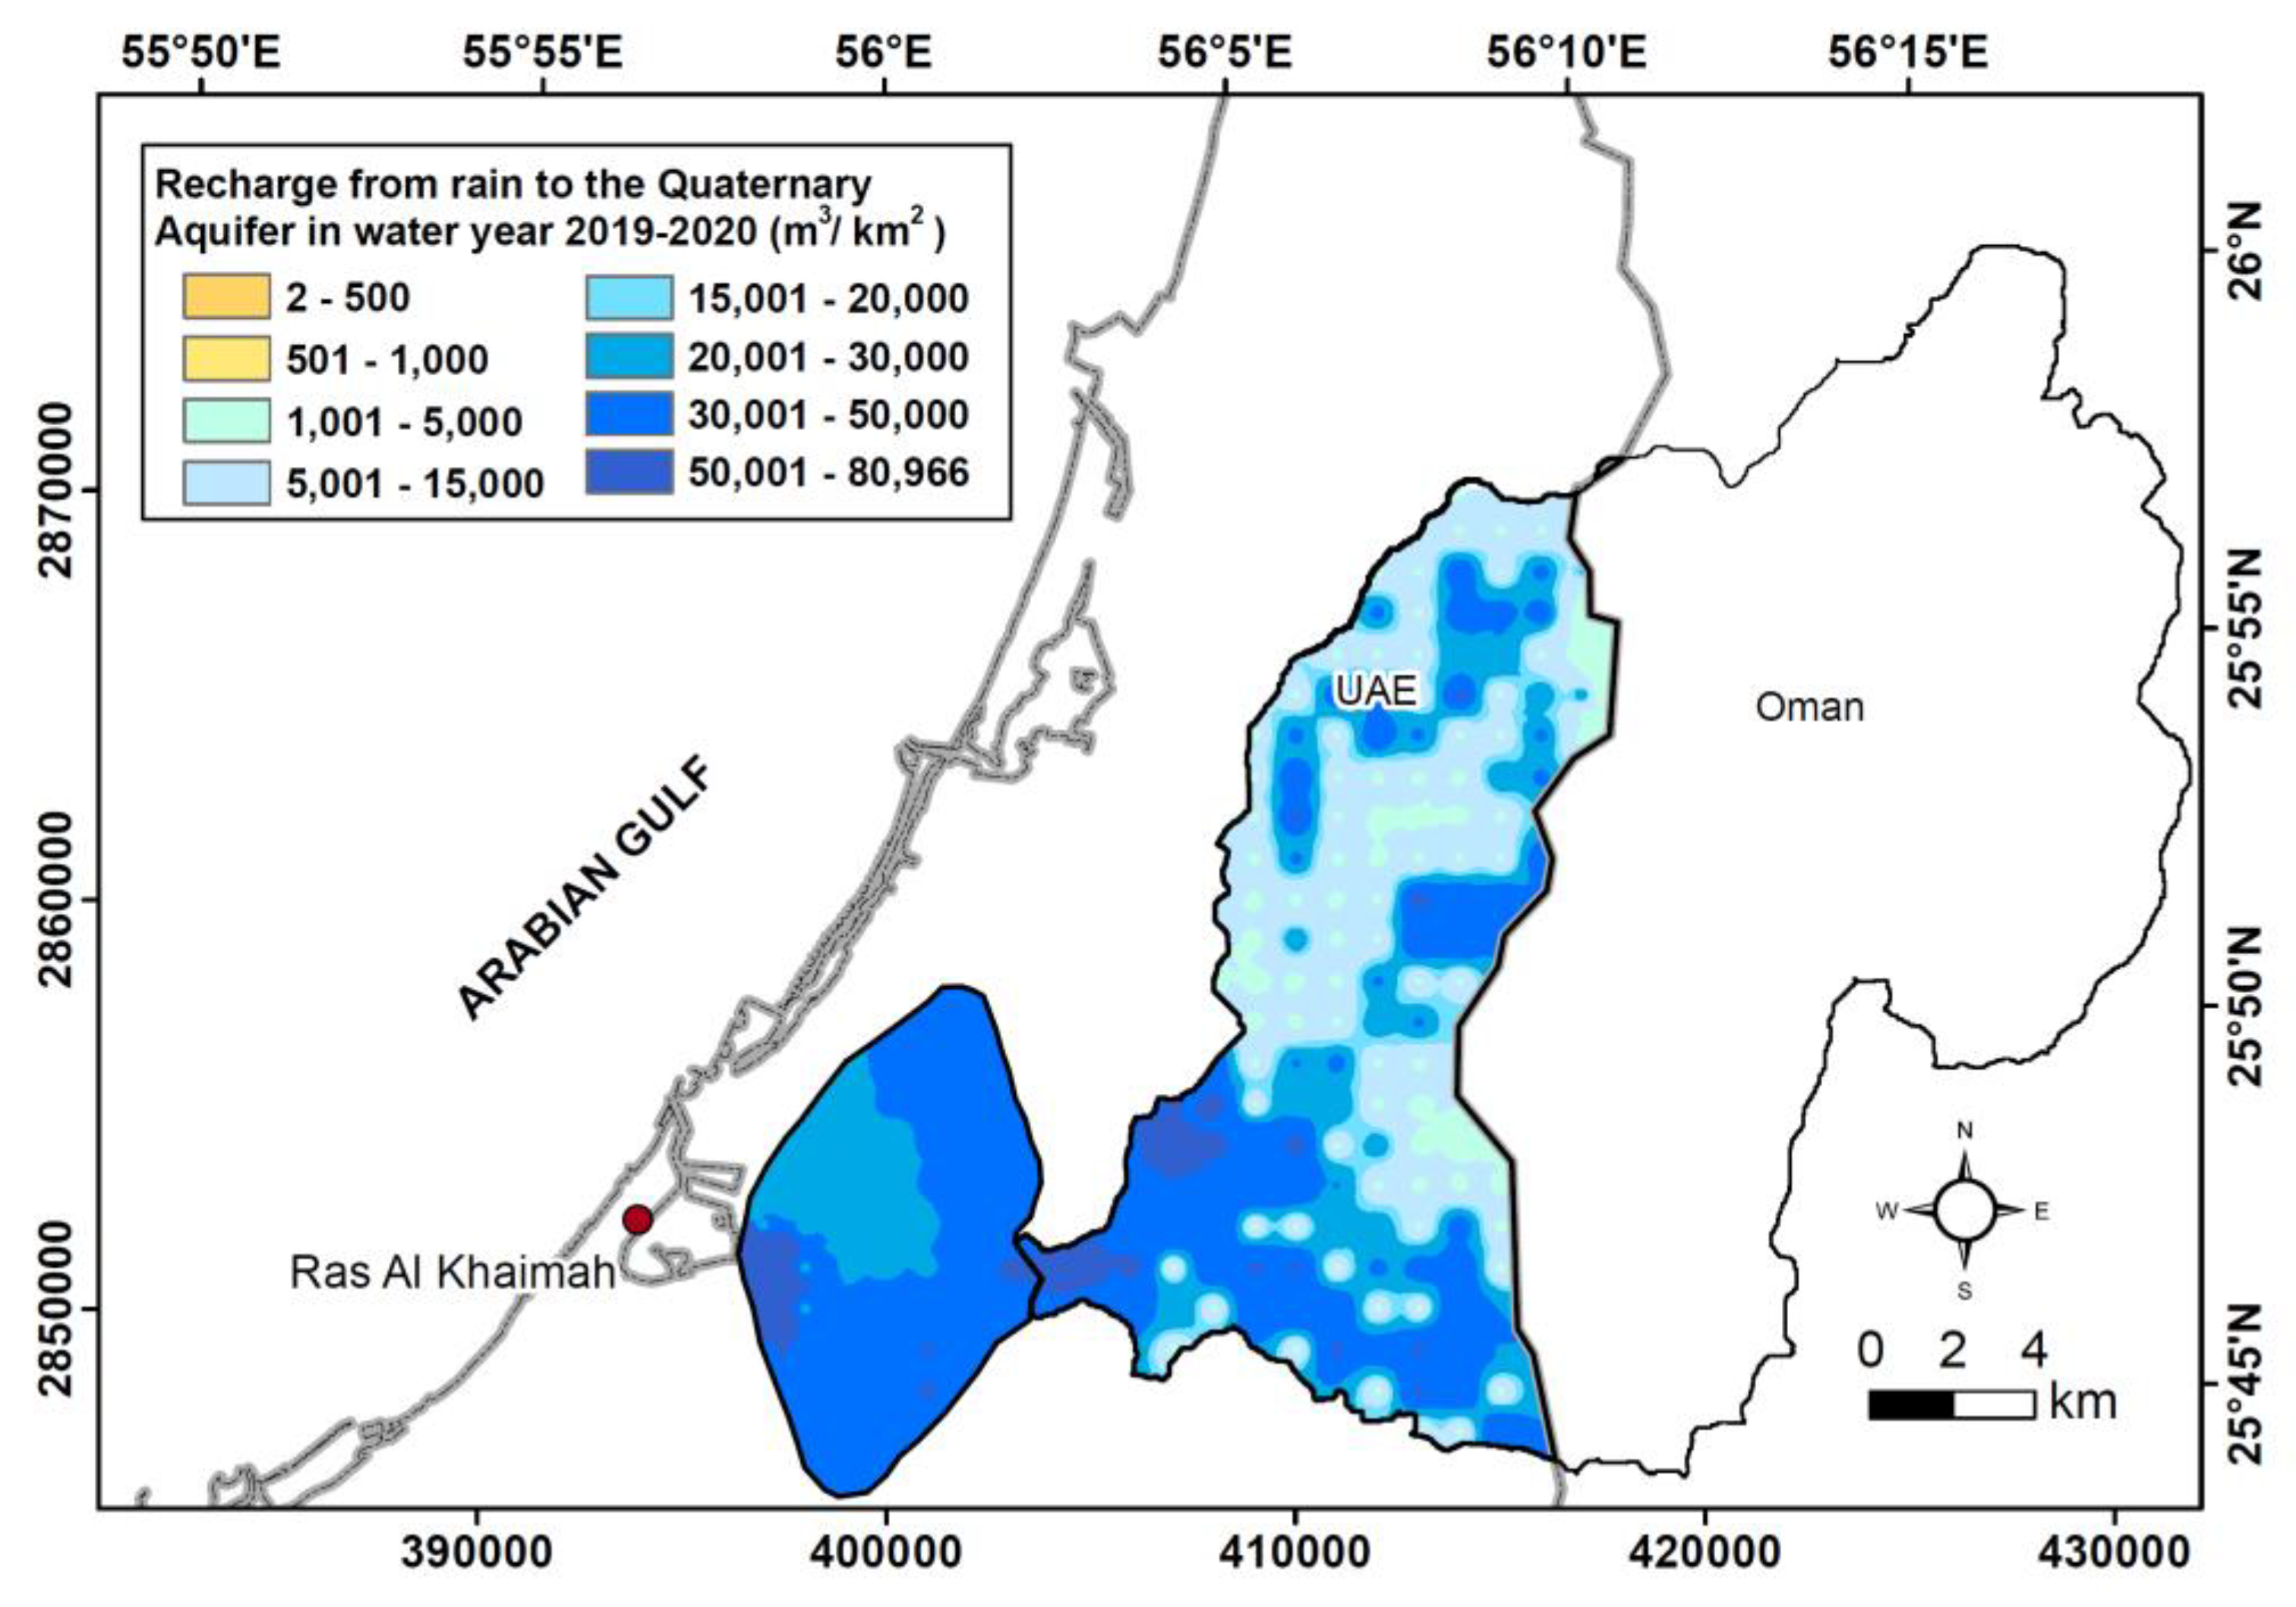
2.5. Groundwater Recharge Estimation

Numerous techniques, including the Water Table Fluctuation Method (WTF), the Potential Method, and numerical methods, can be used to estimate recharge depending on the data that are available and the site conditions. However, choosing one of these techniques over another is not always easy, so it is advised to use several techniques to lower uncertainty. In unconfined aquifers, for instance, WTF is frequently used to describe short-term water level rises caused by recharge water entering the water table following each storm [3,18,19,20]. The safe yield value (Sy) and water table measurements’ precision determine how accurate the estimate will be. The interpretation of pumping test data for nine wells in the Wadi Al Bih area led to the calculation of Sy for the Quaternary aquifer [21]. The WTF method was employed in this investigation because the rate of precipitation was sufficient to cause measurable changes in the height of the water table. The safe yield value (Sy) was assigned to each grid cell utilizing the most advanced statistical software and procedures, including variogram testing, in order to determine the recharge depth (hi). The potential recharge % at each grid cell was calculated using an Analytical Hierarchy Process (AHP) based on the lithology type, land use, geological features, and augmentation factor.

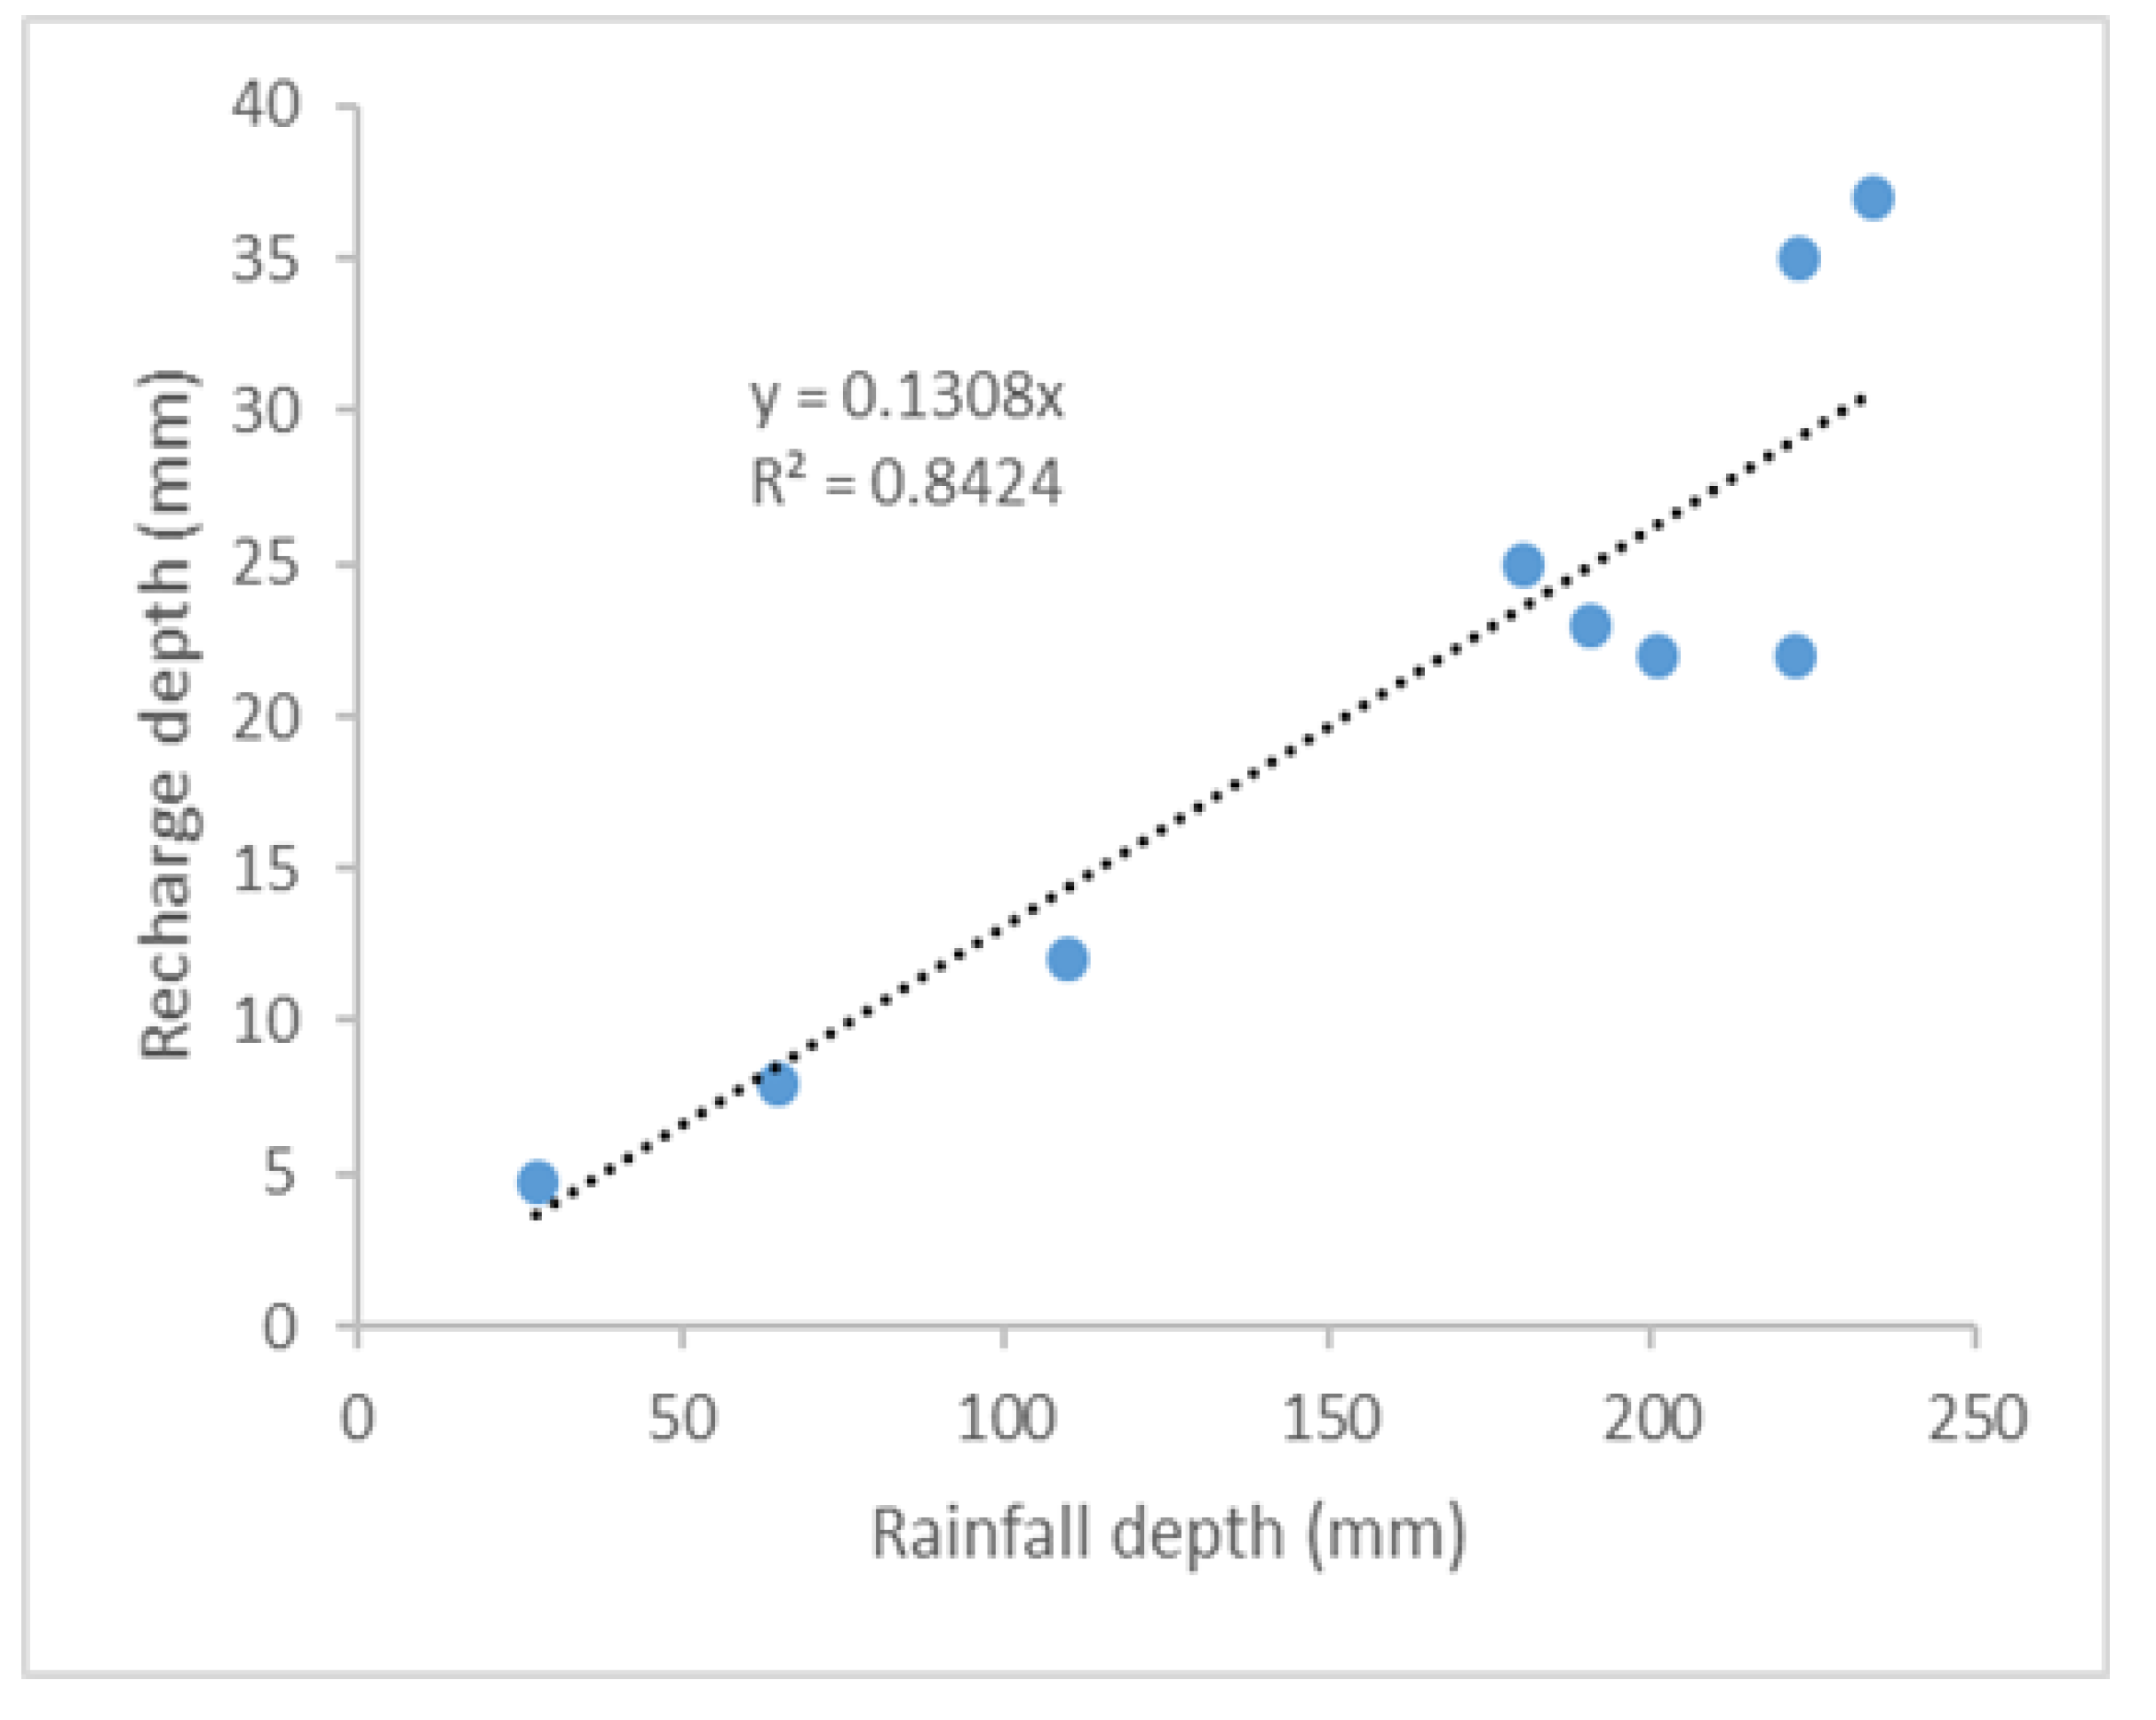
2.5.1. Water Table Fluctuation Method

Estimation of recharge rates is usually accomplished by considering groundwater level-based techniques. This can be ascribed to the richness of existing groundwater level data and the ease of approximating recharge values from temporal or spatial patterns of groundwater levels. The WTF method is best applied for unconfined aquifers experiencing short-term water-level rises following each storm [18,19,22]. The WTF method is primarily based on the assumption that an increase in groundwater levels in unconfined aquifers is mainly because of recharge water reaching the water table [18,19,22]. Recharge is calculated as:
R = S y ( d h d t ) = S y ( Δ h Δ t )
where Sy depicts the specific yield, water table height [L] is denoted by h, and t is time. Moon et al. (2004) recommended a revised WTF technique to approximate groundwater recharge by the following equation [23]:
R e c h a r g e f a c t o r = ( h 1 + h 2 + ...... h n P 1 + P 2 + ...... P n ) ; S y = ( Δ h i P i )
where Δ hi is the water level rise for each time interval and Pi is the rainfall at each time interval.

2.5.2. Potential Method

The current pressure on groundwater resources has indicated the need to accurately estimate recharge to measure the sustainability of groundwater use in the Wadi Al Bih area. Gross recharge is the amount of water that goes through the root zone and reaches the water table plane, while the percentage of groundwater recharge that is not subject to evapotranspiration is referred to as net recharge. The 1-D SVAT Model WAVES is commonly used to simulate unsaturated zone water transport at various control points that include the precipitation gradient across the area [20,24]. The potential recharge method is based on applying the Analytical Hierarchy Process (AHP) for a reliable and feasible evaluation of groundwater recharge potential [20,24]. Principally, the easiest method to estimate potential (gross) recharge R is:
R = 0.01 I p P
where IP indicates the percentage of infiltration (integers from 0–100) and P is the mean yearly rainfall rate in millimeters. Equation (4) was slightly modified by [20,24] according to the UAE environment and the limited database as follows:
R i = [ ( I i I max R P max ) + C f ] × 0.00001 P i A i
C f = D I G S + G S S + L I + L U
where Ri depicts the potential recharge volume (m3) for ith cell with an area Ai (1 km2). While RPmax denotes the maximum reported natural recharge percentage, Pi is the mean yearly rainfall rate at cell i (mm), Ii is the infiltration rate at ith cell, and Imax is the highest infiltration rate registered for UAE in mm/hr. Cf constitutes the summation of the contributions of the coefficients set, namely, ground surface slope (GSS), geological structure (DIGS), land use (LU), and lithology and soil type (LI). Geo-potential maps were delineated for mean annual rainfall, infiltration rate, soil types, and land use. Parameter values in Equations (4) and (5) were assigned by using these raster maps.

2.5.3. Estimation of Return Flow from Irrigation

The irrigation return flow Rir is calculated to form the following empirical relationship by [25,26].
R i r = ( 1 E c E a ) Q i r  
where Qir indicates the gross irrigation water demand (cubic meters per year) known from groundwater abstraction. The coefficients Ec (0.95) and Ea (0.9) are UAE conveyance and application efficiencies, respectively [25]. After applying Ec and Ea, the equation becomes R i r = 0.145 × Q i r . Few studies reported a similar percentage of irrigation return flow to the applied irrigation volume of approximately 15% [3,27]. However, a better estimation of irrigation return flow can be made by using weighing lysimeters to determine the ‘net’ infiltration from irrigation and the amount of evaporation between irrigations.

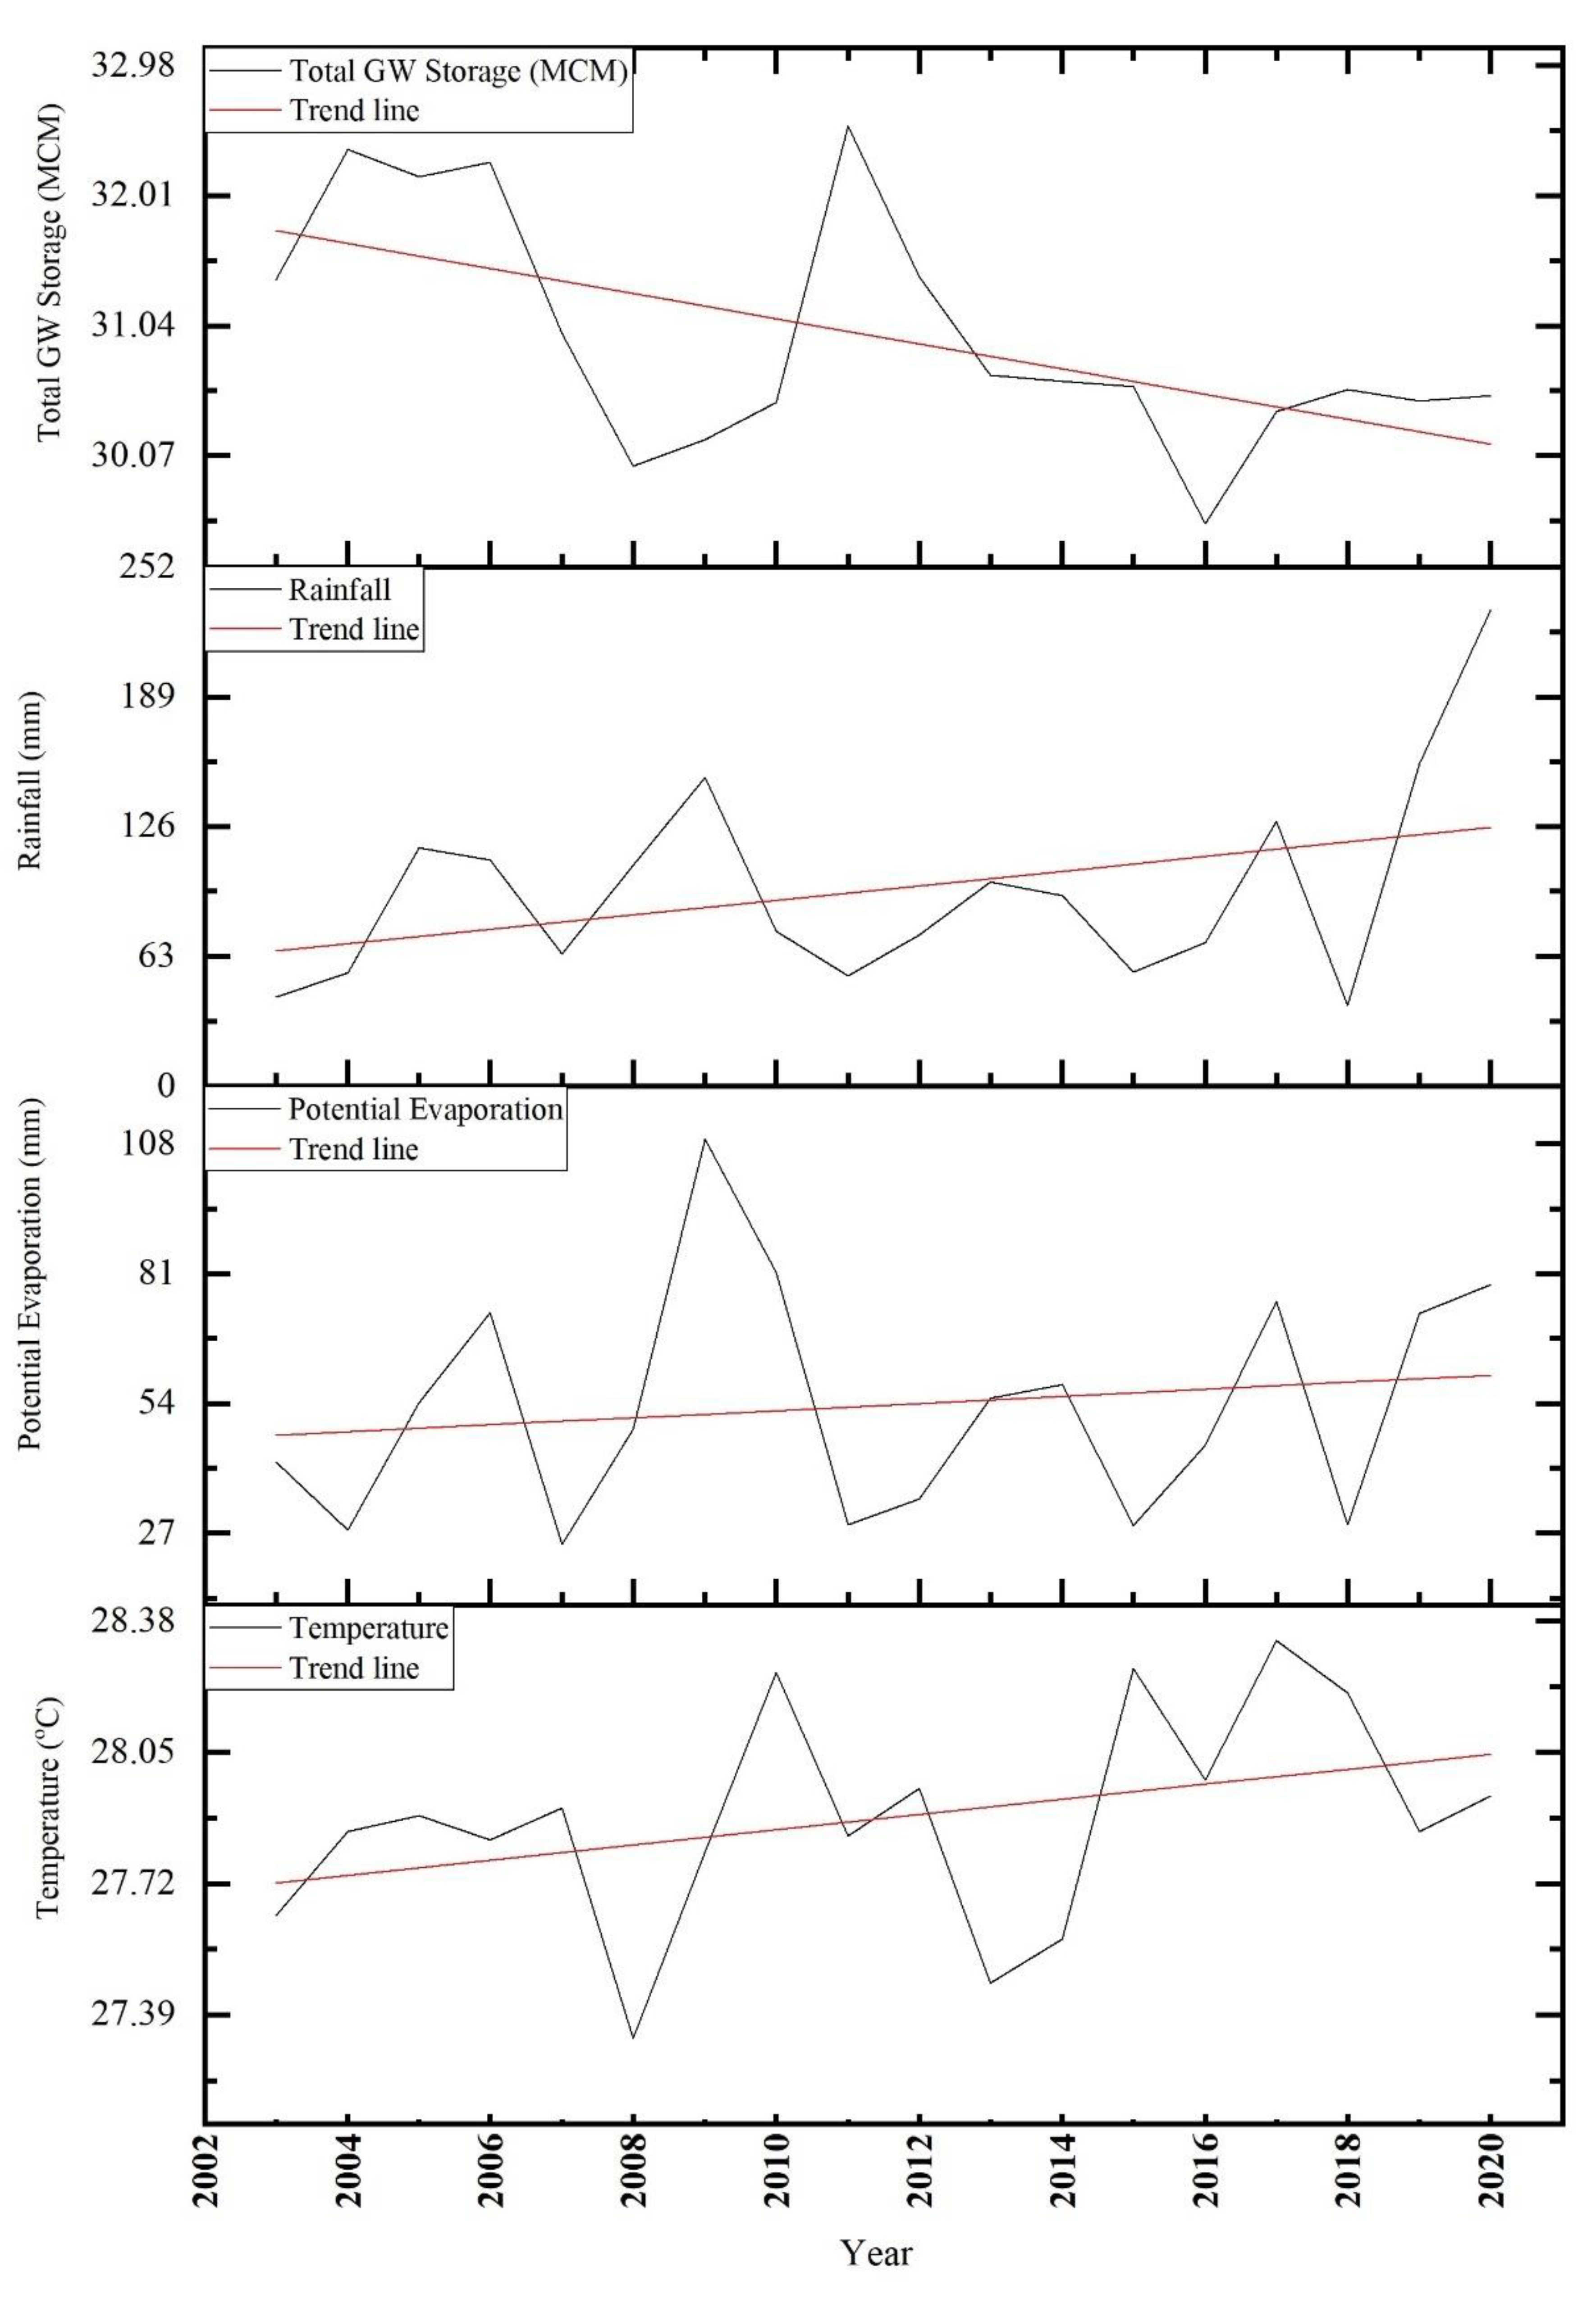
2.6. Effect of Climate-Related Variables on Total Groundwater Storage
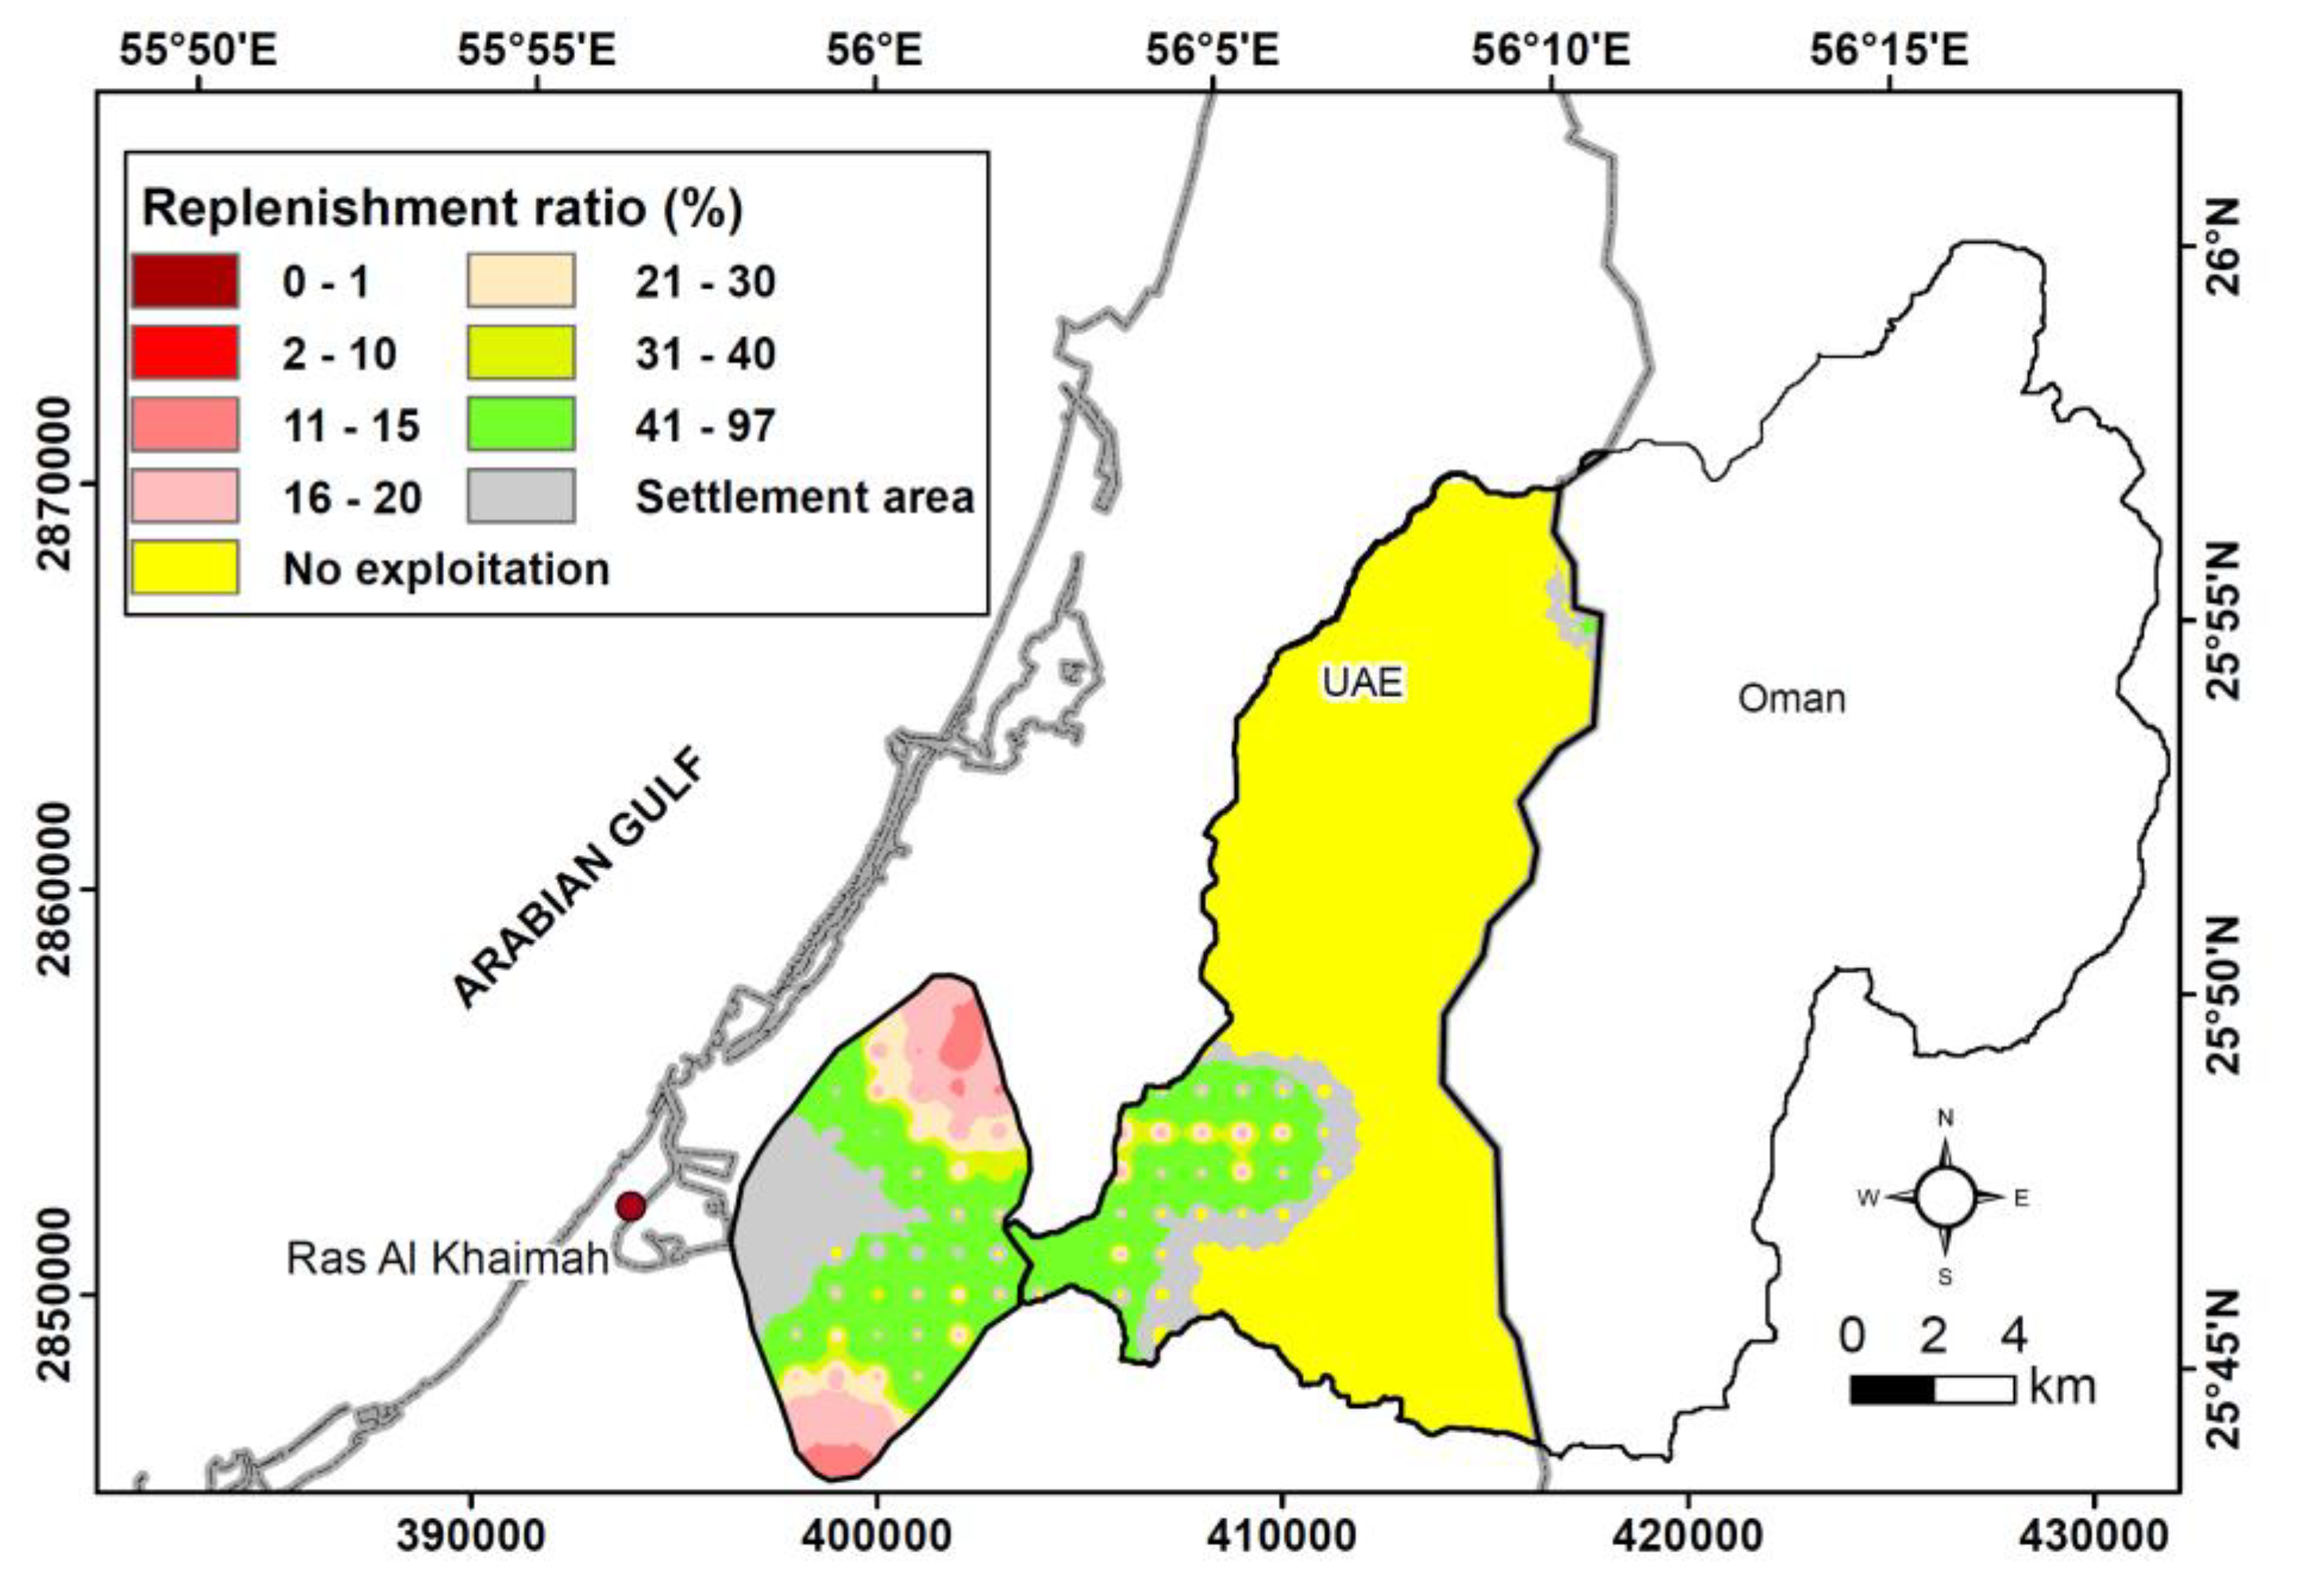
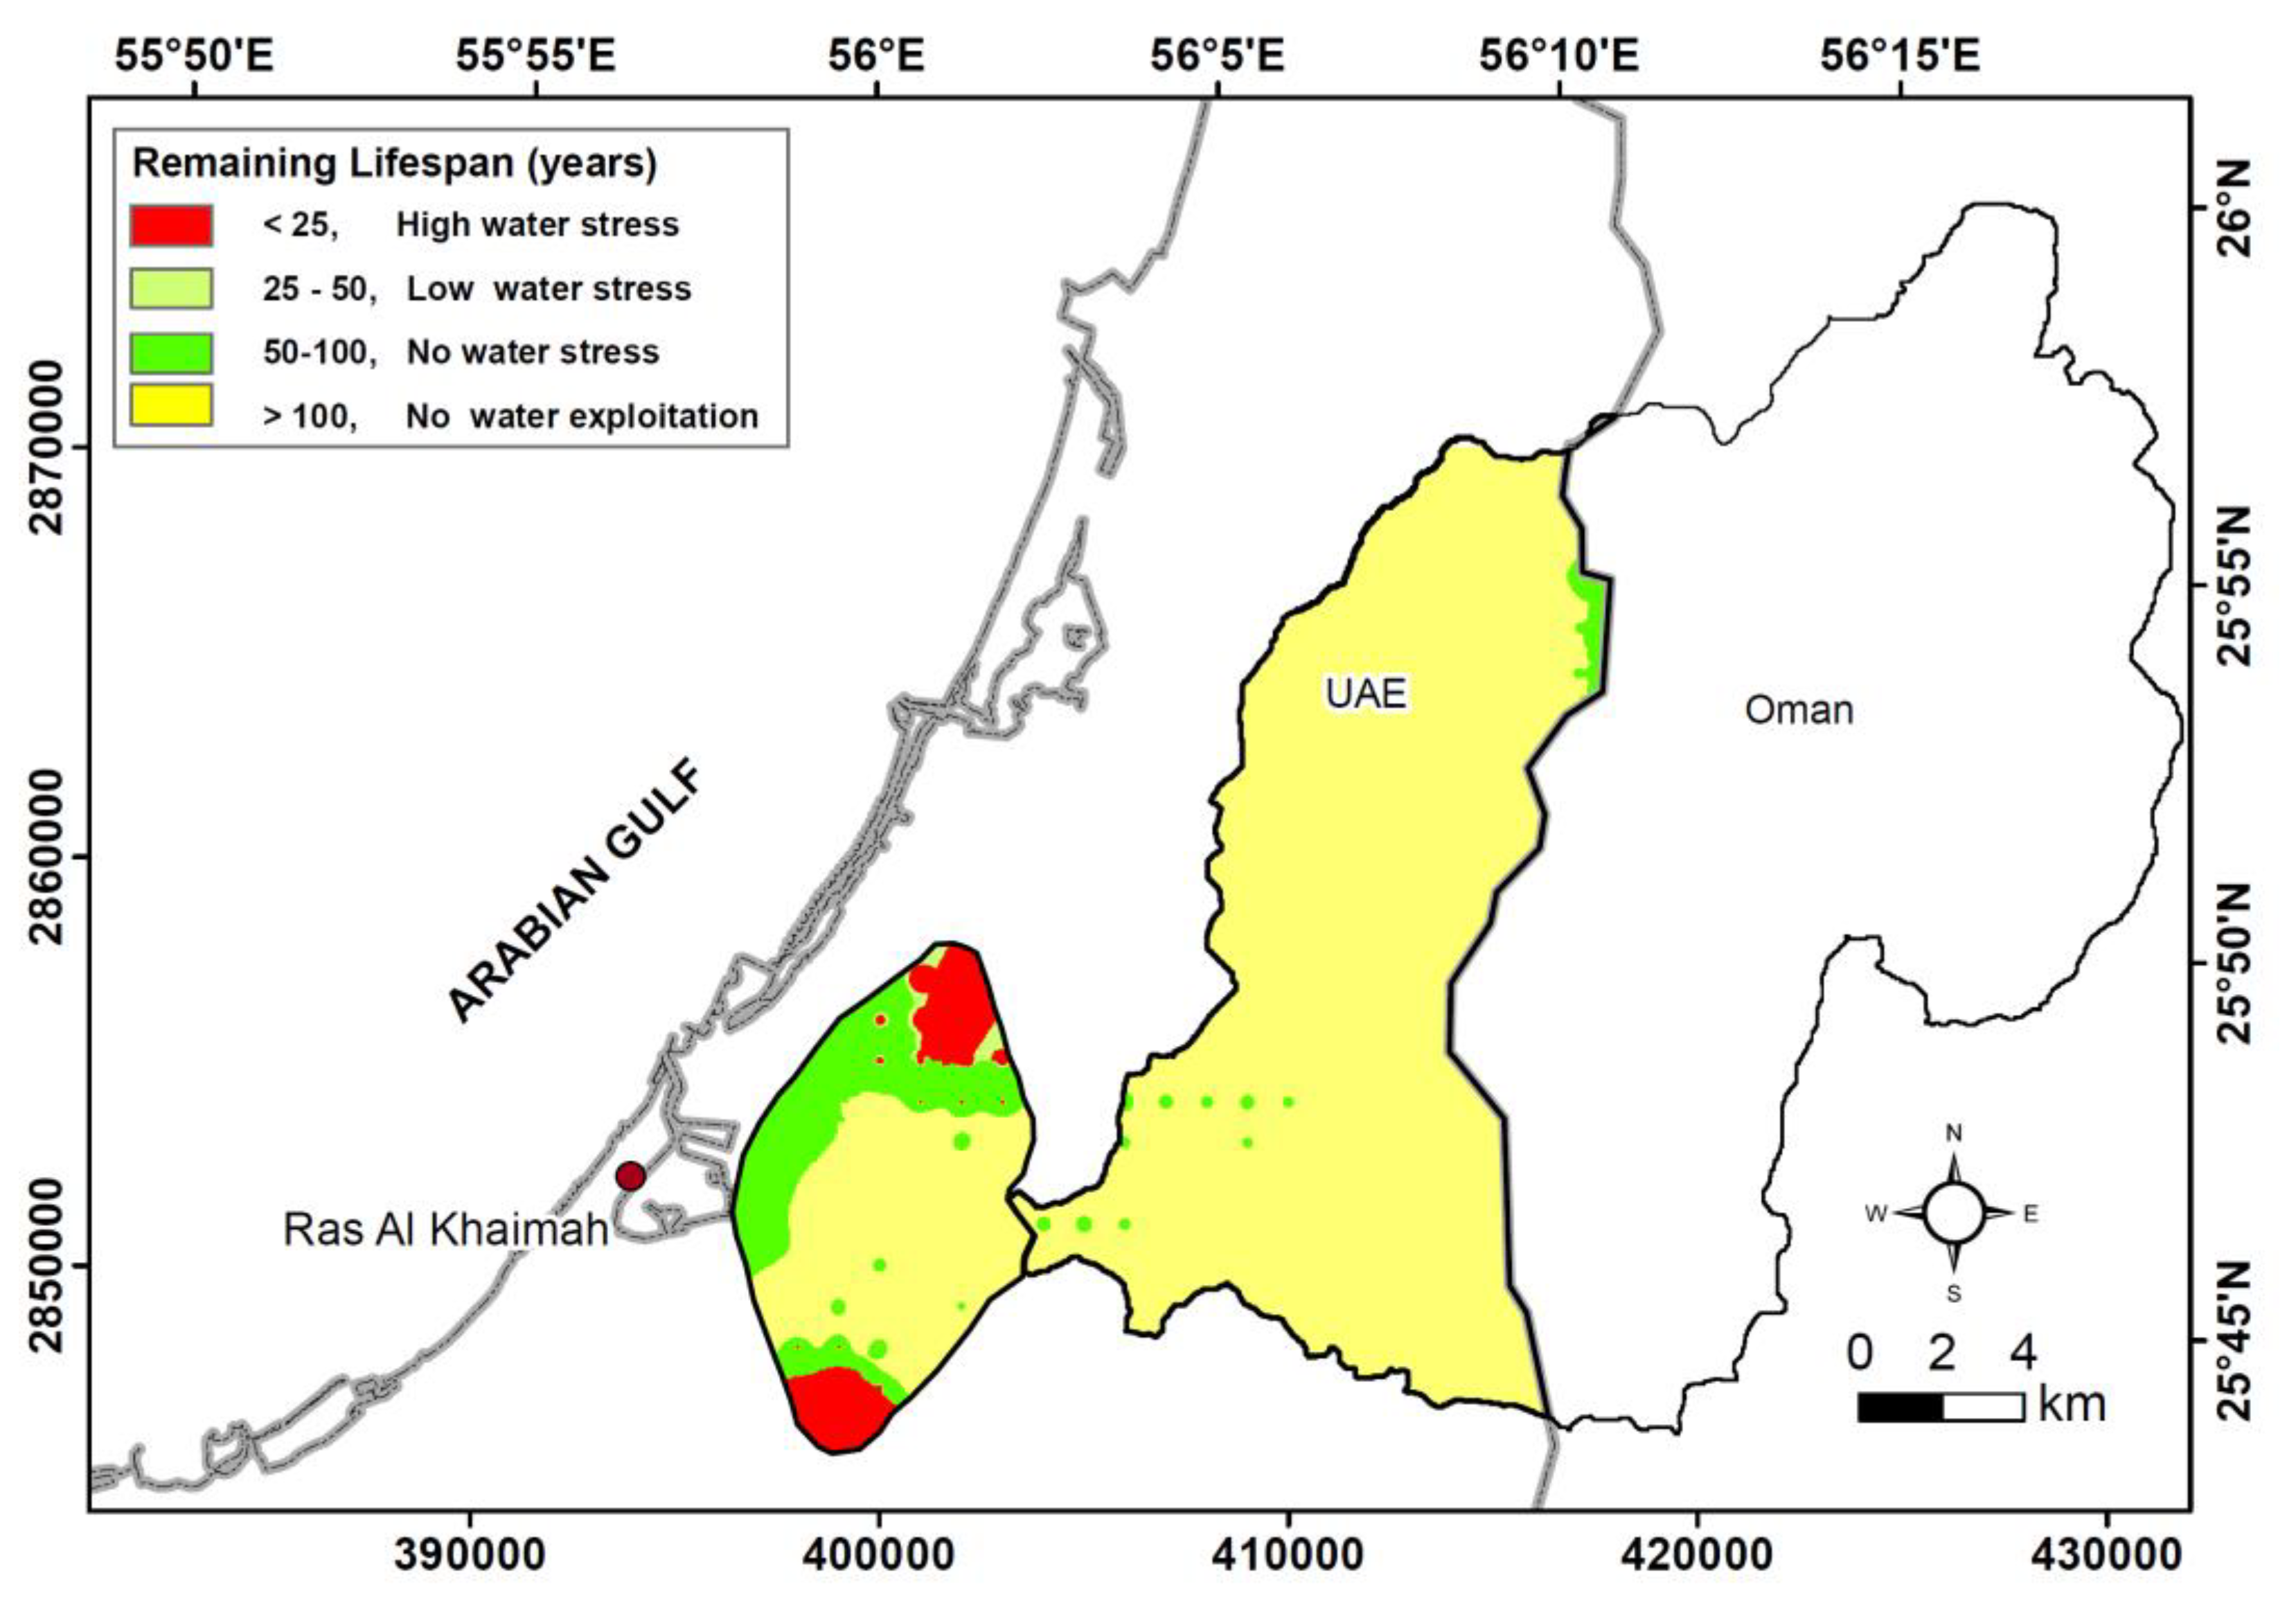
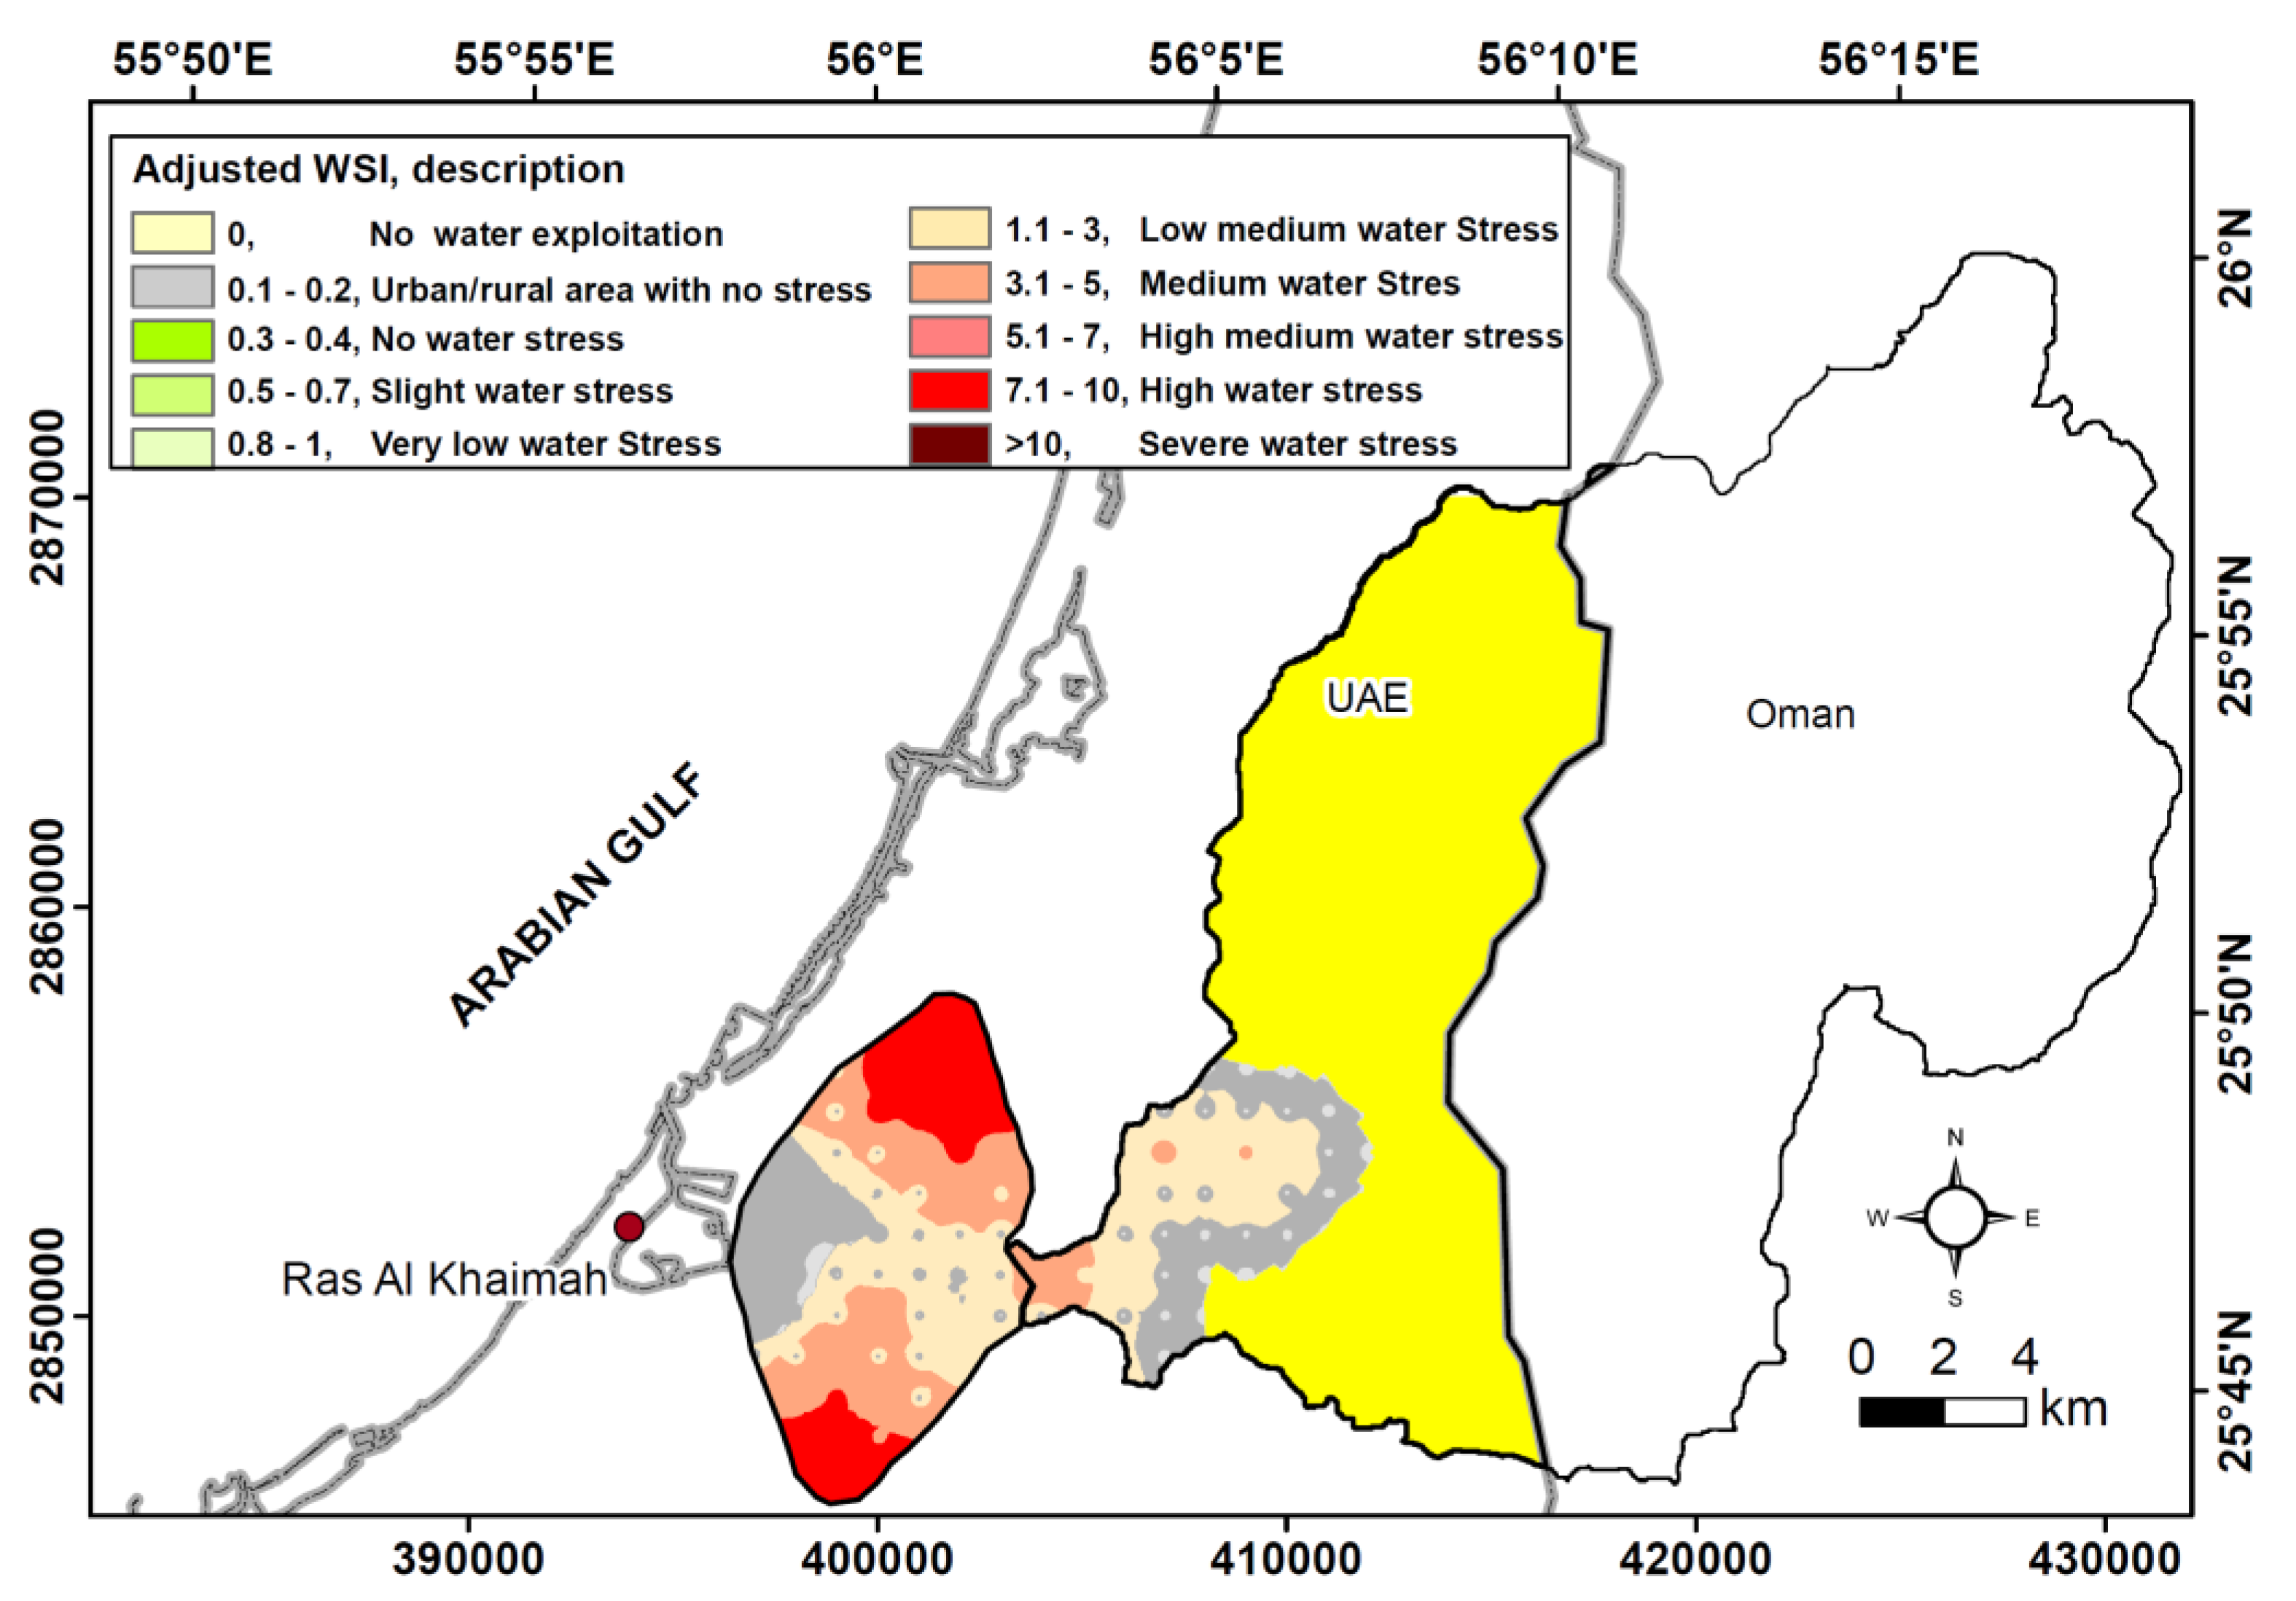
In hydrological cycle terminology, climate variables affect soil infiltration and, thus, groundwater recharge. The increase in evaporation due to higher temperatures also limits recharge [28,29]. To understand the effect of rainfall, evaporation, and temperature on total groundwater storage, we applied the Mann–Kendall test [30]. The Mann–Kendall test statistic is robust when dealing with time series with missing values and nonnormally distributed data [31].

2.7. Water Security

There is no single worldwide definition for ‘water security’. In general, the water scarcity/water security index (WSI) is defined to express how much available water is taken up by the demand [32,33]. The commonly used water scarcity index (WSI) is defined as the ratio of total water withdrawal (including both surface water and renewable groundwater use for agriculture and livestock) to water availability (including aquifers recharge) and considering environmental flow requirements [34]. In the calculation of environmental performance indicators, in 2010, the UNDEP and Yale University used the following procedure developed by (United Nations, 1997; Vorosmarty et al., 2000) [35,36] for calculating the water scarcity index for each country (EPI 2010):
  • Calculation of the fraction of freshwater withdrawal from the renewable water available (not including desalinated water or treated wastewater) using the following equation:
F r e s w a t e r   f r a c t i o n = F r e s h w a t e r   w i t h d r a w a l R e n e w a b l e   w a t e r   a v a i l a b l e    
The target for the fraction above is 0.4, based on expert judgment.
2.
Calculation of water overuse, derived by subtracting the target use fraction of 0.4 from the freshwater fraction.
Water overuse = Freshwater fraction − 0.4
3.
Calculation of the overuse weight as a fraction of freshwater withdrawal from the total water withdrawals.
W e i g h t = F r e s h w a t e r   w i t h d r a w a l F r e s h w a t e r   w i t h d r a w a l + D e s a l i n a t e d   w a t e r + t r e a t e d   w a s t e w a s t e r
4.
Calculation of weighted overuse (final WSI indicator) as a product of water overuse and overuse weight.
WSI = Water overuse * Weight
However, several authors (e.g., Wada et al. 2011, Wada et al. 2014, Gain et al. 2016 to cite just a few) [34,36,37,38] modified Equation (10) to include common factors such as availability, accessibility, affordability, quality, and safety.
W S I i = ( W w , i A w , i E w , i )
where Ww,i is the water withdrawal, Aw,i is the water availability, and Ew,i is the environmental flow requirement. Considering these key aspects and the absence of perennial surface water resources in UAE as an arid country, ‘water security can be defined as the conditions in which enough water resources (conventional and non-conventional) are available and accessible of adequate quality. Due to the absence of environmental flow requirements in UAE, they were not considered in the WSI calculation, and its term was eliminated from the denominator of Equation (11). Additionally, due to the absence or incompleteness of monthly data, the stress is evaluated annually, considering only the annual variability in water withdrawal, availability, and quality using Equation (12).
W S I i = ( W w , i A w , i )
With the water budget net with a one-kilometer interval, the stress was calculated differently depending on the land use. For example, in agricultural areas (the most water-stressed areas in UAE), the denominator of Equation (12) was changed three times. The available water resources were set to equal to the renewable conventional water resources only, renewable conventional water resources plus the available fossil groundwater resources with TDS up to 5000 mg/l, and finally, renewable conventional water resources plus the available fossil groundwater resources with TDS up to 10,000 mg/l to assess groundwater depletion [39].
In the above equations, nonrenewable or fossil groundwater and non-conventional water resources (e.g., desalinated and treated wastewater) have not been considered in WSI. Therefore, the water scarcity indicator was further developed to account for spatially explicit desalination uses and treated wastewater reuses [32,33,39], and Equation (12) can be modified as follows:
W S I i = ( D T n e t   i ( D S W i + N R G W i ) S F W A i )
where DTneti is the net total water demand from all the sectors (it is the sum of livestock, irrigation, industrial, and domestic water demand), DSW is the desalinated water use, NRGW is the fossil groundwater abstraction, and SFWA is the surface freshwater availability. Since there is no perennial surface water in UAE and, thus, in Wadi Al Bih, the term SFWAi in the denominator was replaced by the total recharge from all sources.

3. Results and Discussion

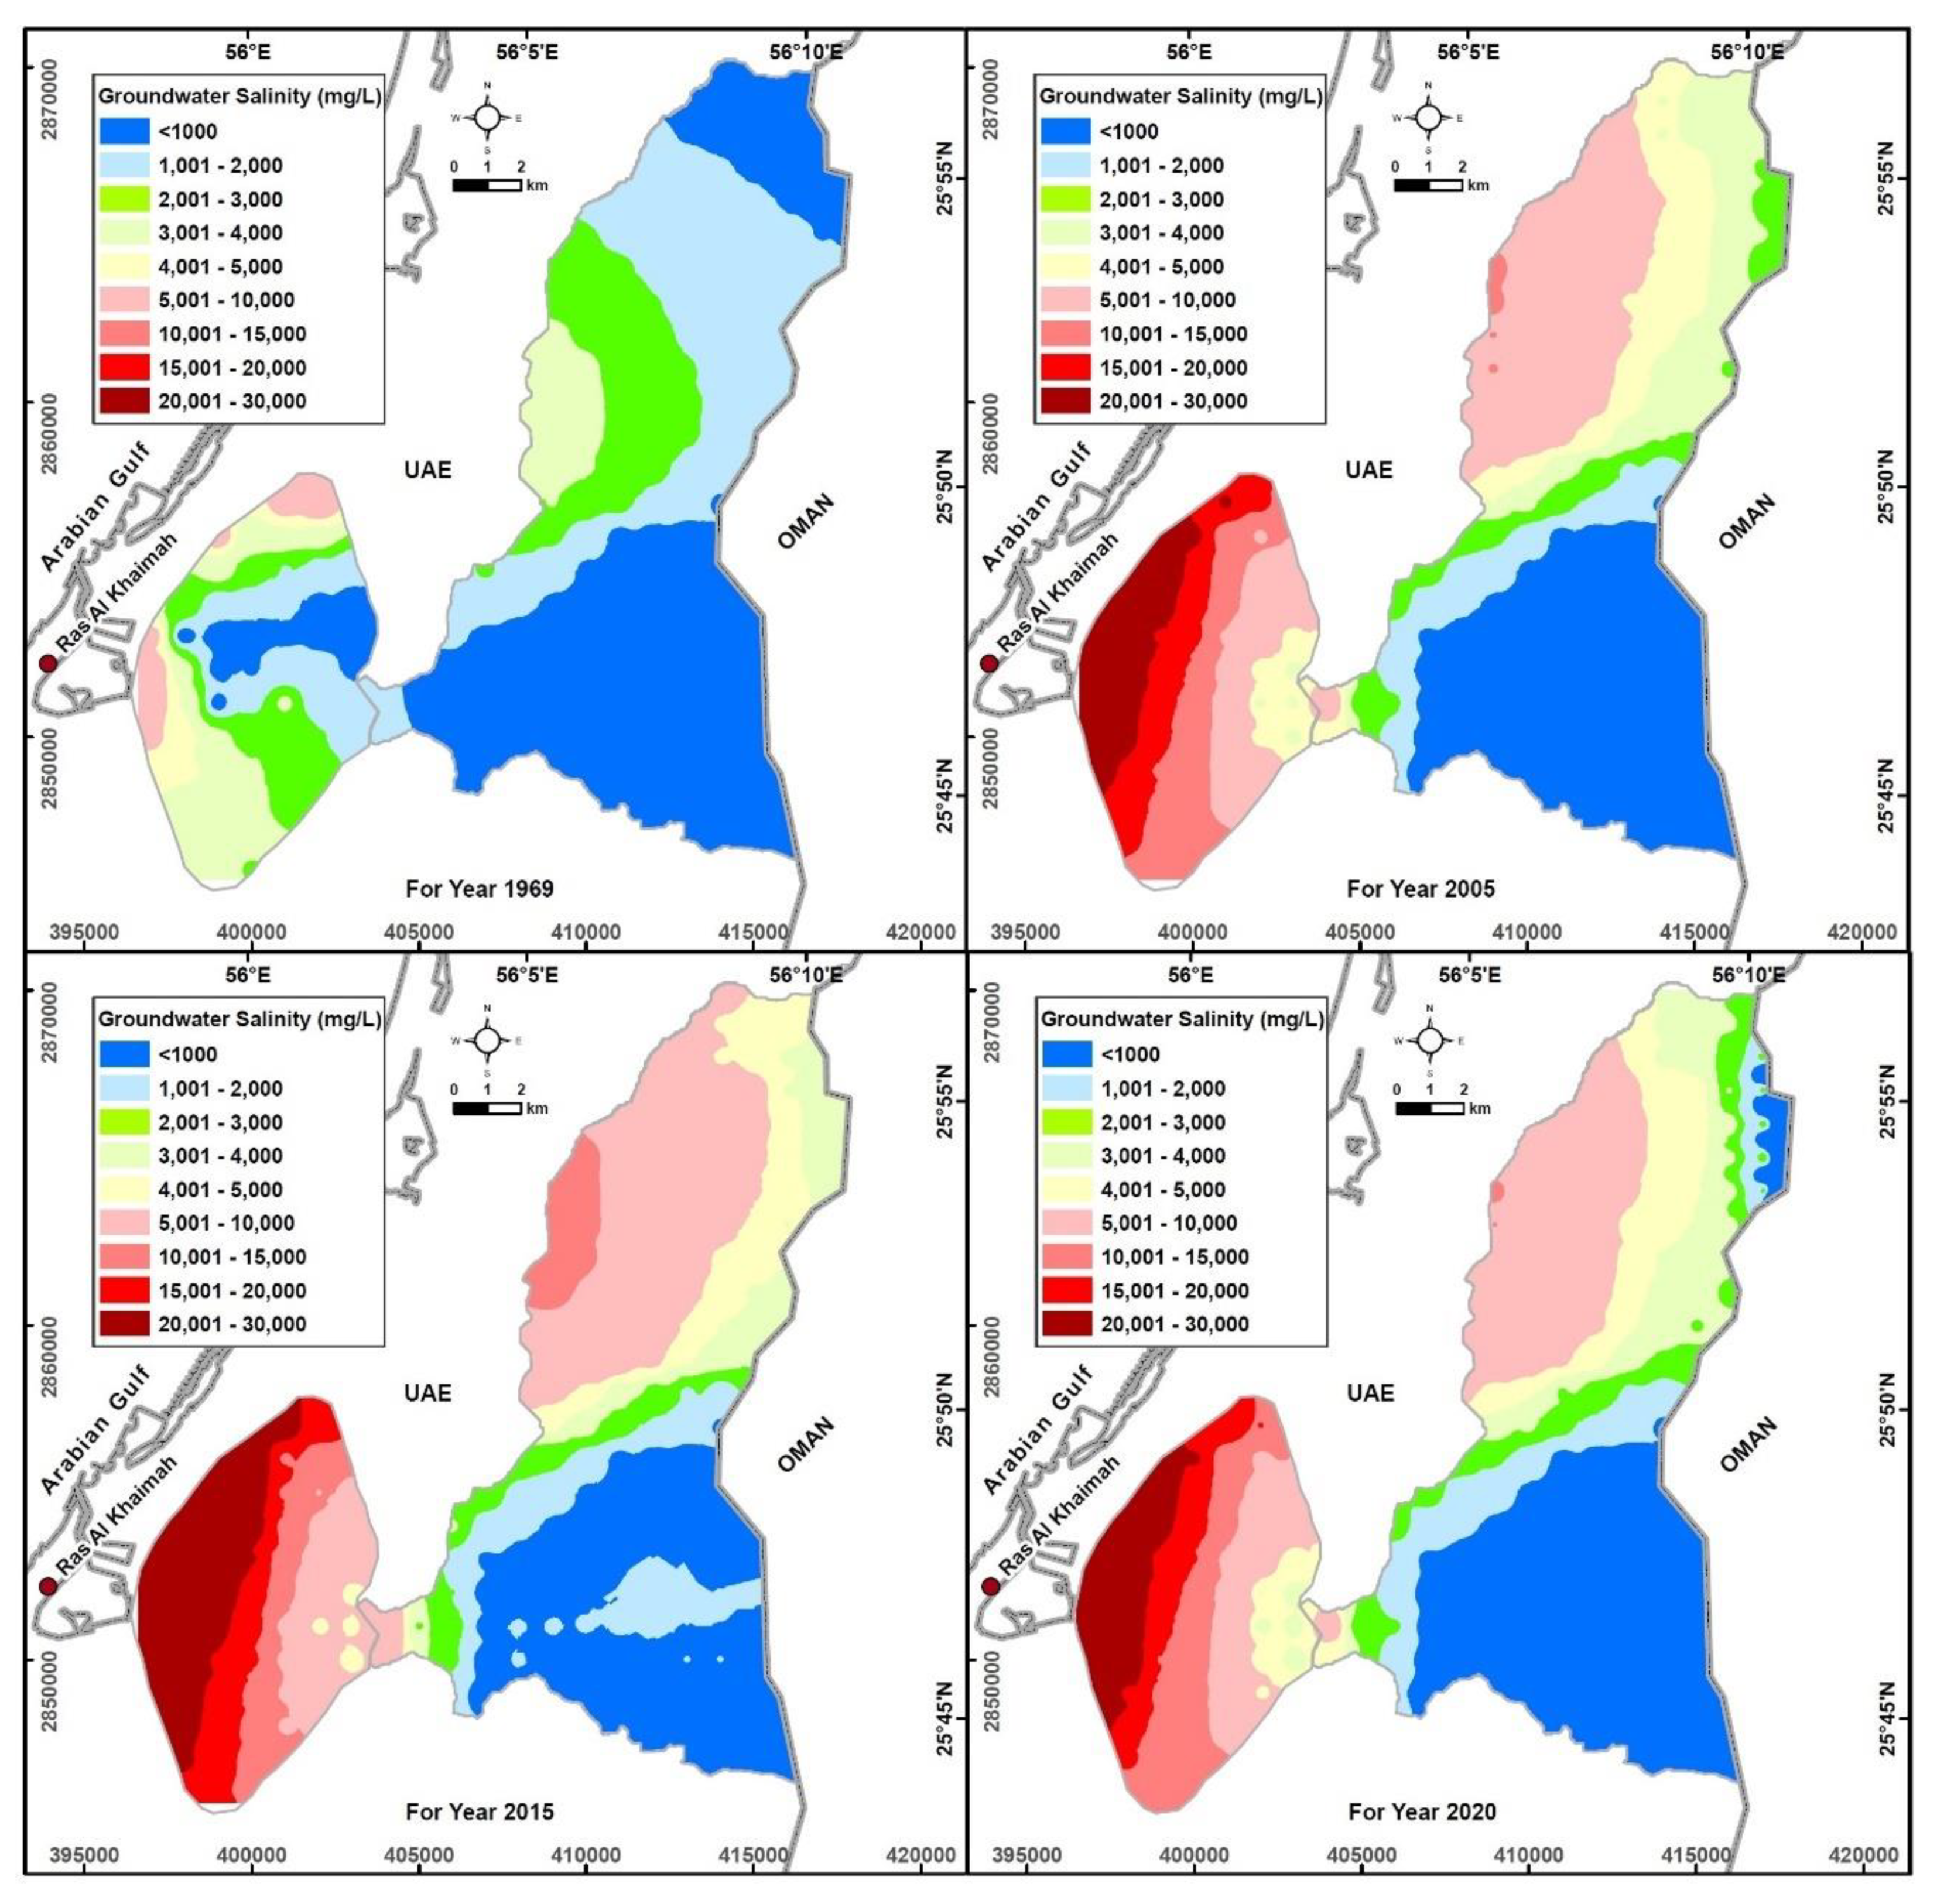
3.1. Status of Groundwater Resources

The function of water availability in Wadi Al Bih includes the two main components of surface water and groundwater. The assigned salinity (Figure 7), the saturated thickness (m) in 1969, 2005, 2015, and 2020 and Sy (%) for each grid cell (Figure 1) were entered into Equation (1) to estimate groundwater storage at that cell in 1969, 2005, 2015, and 2020 and its water type. GIS techniques were used to calculate this for the 229 grid cells (Figure 1).

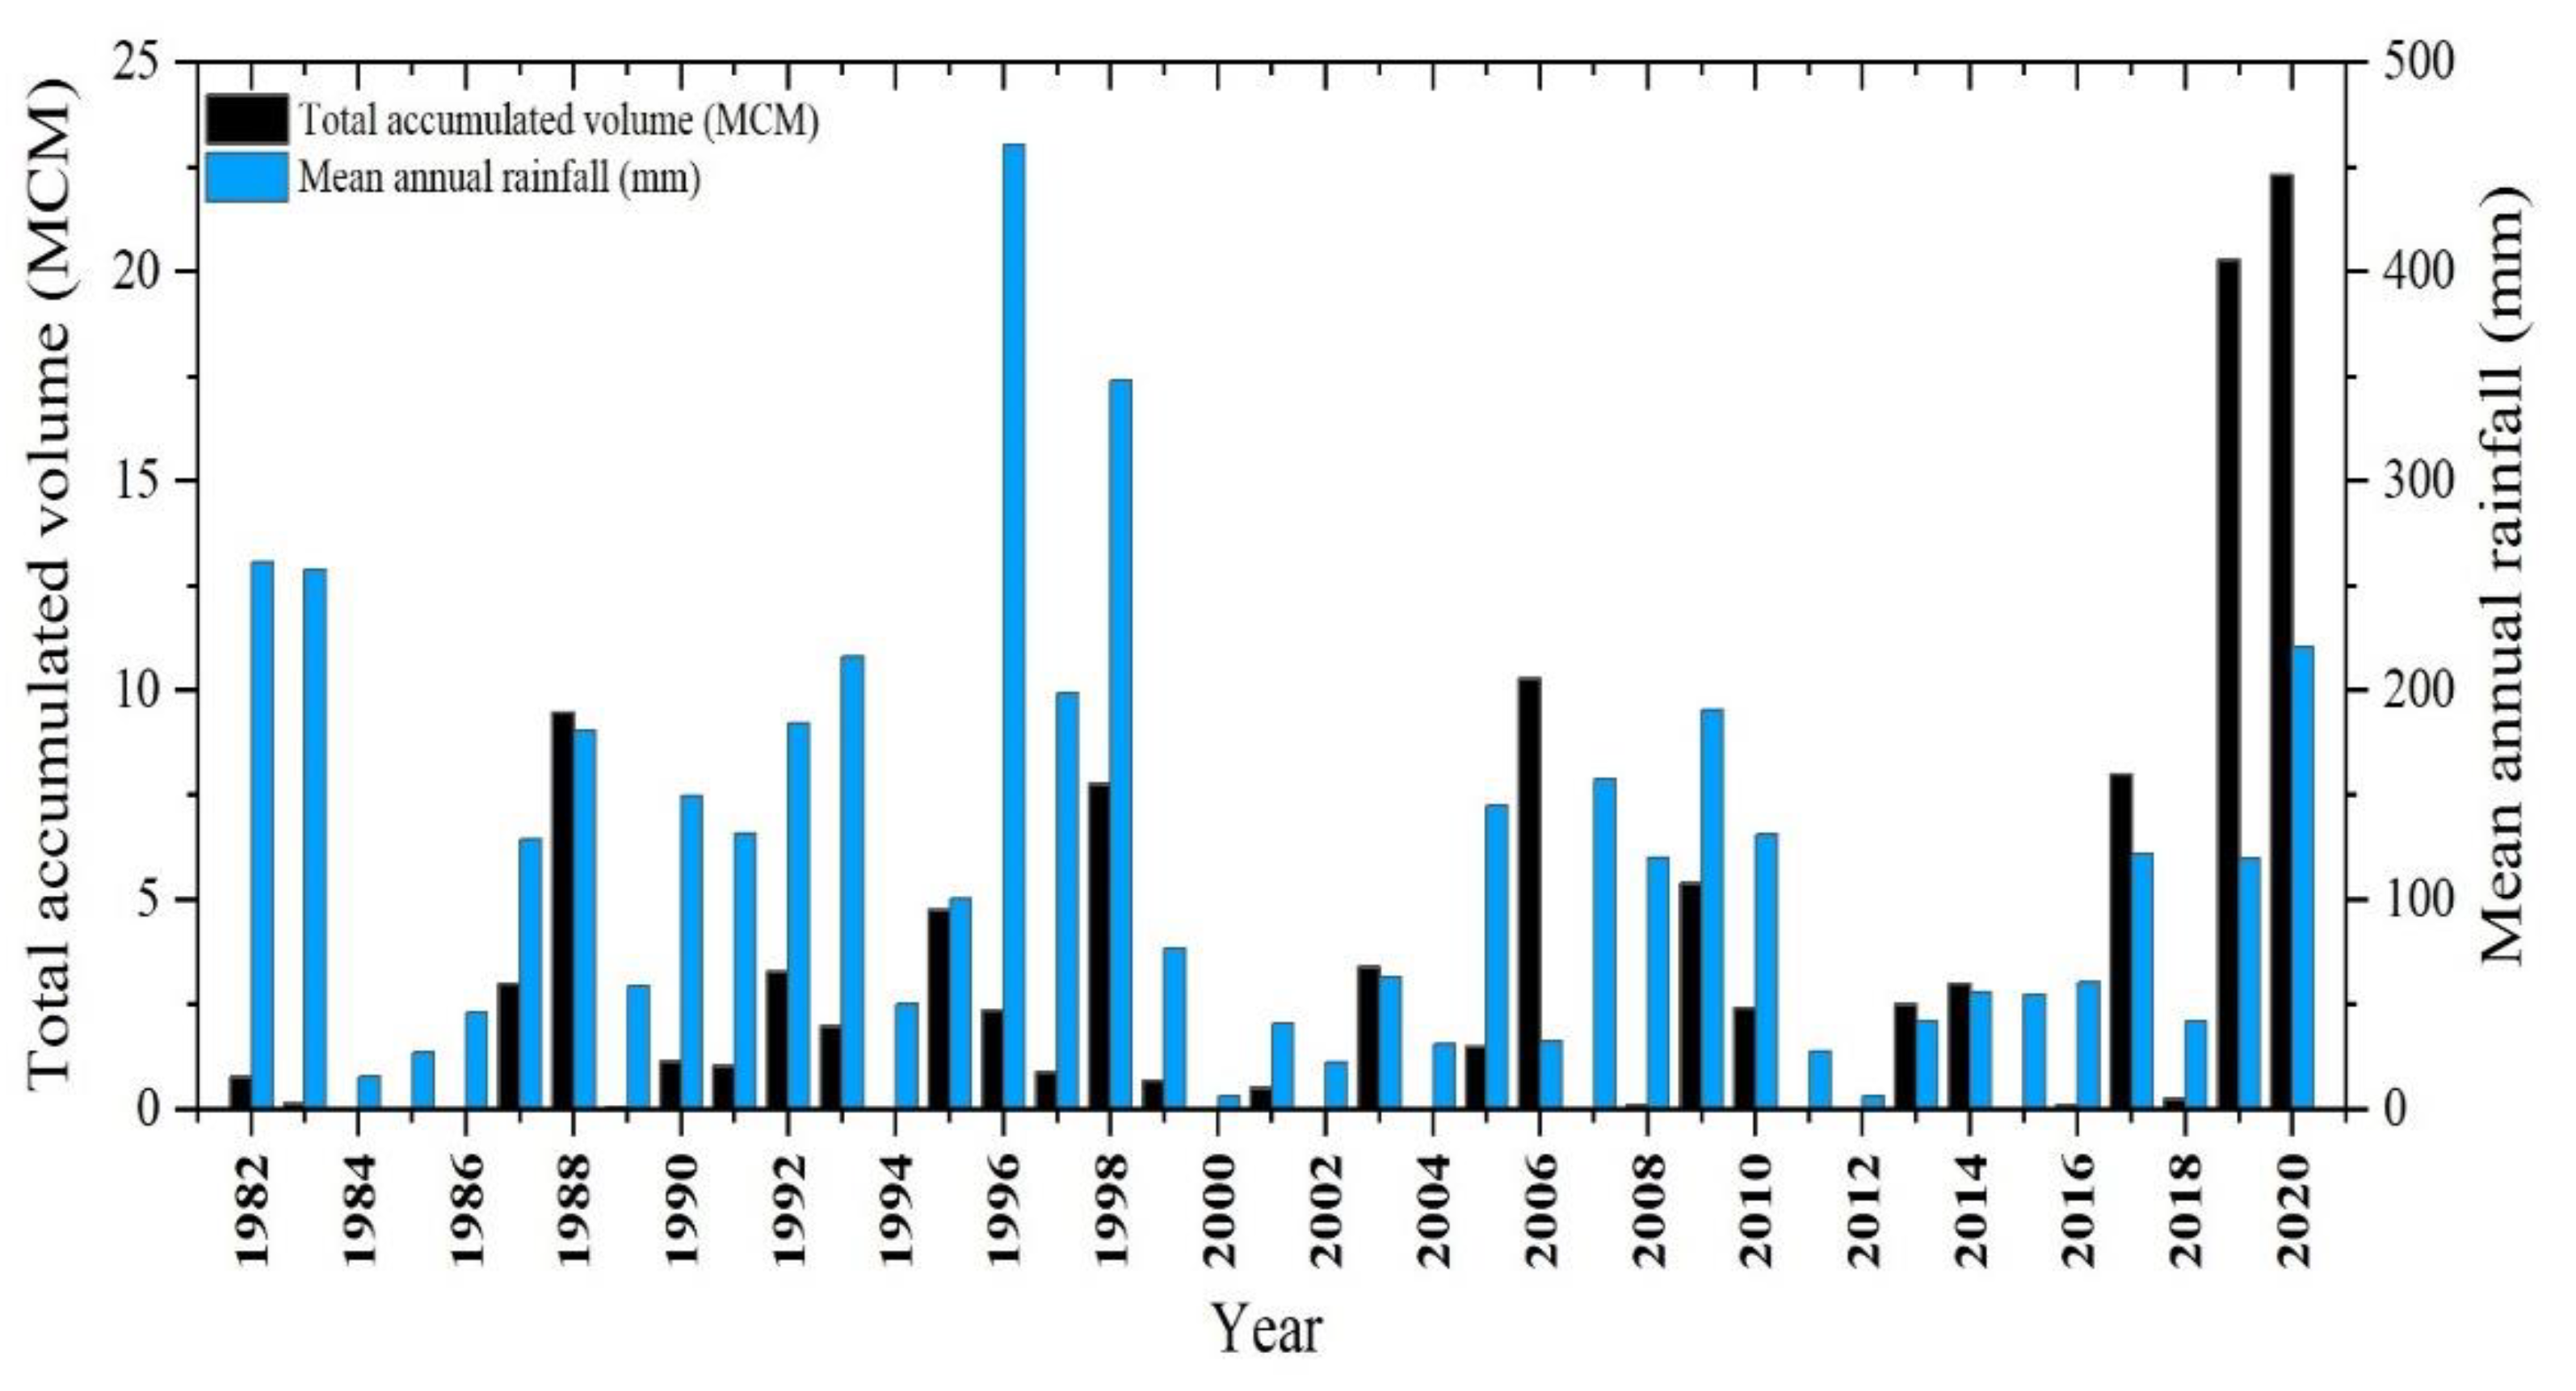
3.2. Groundwater Storage

The Wadi Al Bih region is usually dry during the whole year; however, it can experience surface water runoff during rainy days. The recorded accumulated water behind the dam is variable over the years depending on the precipitation amount and patterns (Figure 8). The accumulated water volume in a single day ranged from zero in the dry year to 23.8 MCM in the wet years (e.g., 1 January 2020). The annual accumulated volume of rainwater behind the dam ranged from 3 MCM in 1982 to 23.8 MCM in 2020. The overall rainfall is projected to increase over much of the UAE and the Hajar Mountains [21,25,27]. An increase of 25% from the current amount is expected for portions of Ras Al Khaimah emirate, including Wadi Al Bih [1,9]. The groundwater budget calculations (Table 1) revealed that the total water recharge to the system during the period 2015–2020 was about 84 MCM (44:internal flux below the mountain gap and 40 MCM from direct percolation of rainwater). The direct recharge from the ponding area was 27.4 MCM which is 49% [40] of the accumulated water behind the dam in this period (56.45 MCM) and 67% of the total recharge from rain (40 MCM) in the same period. The results from the potential recharging technique showed that the percentage of recharge from rain ranges from less than 5% upstream to 20% in the dam area, with an average of 13%, which is consistent with the value from the WTF approach (Figure 9). The evaporation loss from the storage in the ponding area is generally in the order of 15% or less of the total storage in the ponding area. This is mainly attributed to the low evaporation rate during the main flood season (5–8 mm/d), December through April [2]. The remaining 36% of the water storage is mostly held in the unsaturated zone causing a significant increase in the soil moisture content and subsequent recharge or evaporation depending on the precipitation pattern and temperature in the other months of the year. The efficiency of the dam calculated as the ratio between the total recharge from the ponding area and the total storage during a specified period is around 49% based on the recharge from rainwater percolation and the subsequent recharge from the water held in the unsaturated zone [3]. Sherif et al. 2022 reported that recharge under the ponding area is around 70% of the total recharge from rain in the whole area [40]. Thus, recharge from rain in the ponding area in the period 2015–2020 is about 28 MCM which indicate that at least 17% of 53% of the water storage held in the unsaturated zone was contributed as addition recharge and thus dam efficiency was 49% not 32%. Under climate change, the evaporation percentage is projected to increase, and therefore, the optimum MAR and/or direct use of this volume of surface water is needed for this area.
The obtained results from the WBM (Table 1 and Table 2) indicate that despite the major decrease in the abstraction rate for domestic use after the construction of the desalination plant in 1998 in Ras Al Khaimah, freshwater groundwater resources are still decreasing at an alarming rate of 11 MCM/year in the normal rainy years. However, this deficit will decrease to 6.5 after ceasing groundwater extraction for domestic use in the year 2026.
Due to the heavy rainwater in two consecutive months (December 2019 and January 2020), the volumes of fresh and slightly brackish water increased and exceeded their volumes in 2005 (Table 1). Groundwater quality has also improved substantially (Figure 7). This indicates the mixing extent between saline seawater intruding from the west and freshwater resources from the east in the alluvial fan area (Burairat area). The total irrigation volume within the UAE part of the Wadi Al Bih catchment is 1.353 MCM/year. Thus, the return flow is approximately 202,983 m3/year. However, if the farms in the alluvial fan are also considered, then the total irrigation would be 14.4 MCM/yr, and the return flow would be approximately 2.16 MCM/year (Table 2).
The Hajar aquifer extends northward and southward from Wadi Al Bih and crops out in an area of approximately 640 km2. The northern part of the aquifer contains brackish groundwater at a relatively shallow depth. The average thickness of the freshwater layer in this area is approximately 150 m. In the southern part, the thickness of the freshwater layer is approximately 300 m [11]. The storage in the northern portion area (370 km2) is estimated at 6,000 MCM, and in the southern portion area (270 km2) at 8,000 MCM. Hence, the total amount of groundwater stored is estimated at 14,000 MCM, and the annual recharge is approximately 10 MCM per year [3,11,12]. In our calculations, an effective porosity range of 10–20% was applied in the groundwater storage calculations based on [11]).
The existing observation wells in the karstified limestone aquifer are very rare, and thus, water level and electrical conductivity readings are insufficient to build consistent potentiometric surfaces or to delineate groundwater salinity maps for this aquifer. It can be deduced that the Hajar aquifer in the UAE part of the catchment almost returned to steady-state conditions in January 2020 due to the heavy rainwater in the two consecutive months. The water table rise in some of the wells exceeded 15 m between February 2019 and February 2020 (Figure 6). Agricultural groundwater extraction in the alluvial fan area (13 MCM) far exceeds the recharge rate (3 MCM). The inputs and outputs of the upper aquifer in the alluvial fan and the UAE part of the Wadi Al Bih catchment are summarized in Table 2.
The estimated recharge percentage by the potential method ranges from 5% to 20% (only in the dam pond; Figure 1), with an average of 13%, which is a good match with the range obtained by the WTF method (an example is shown in Figure 9), with an average of 11.8%. However, all the monitoring wells are in the Wadi course, while potential methods cover the whole catchment area in Wadi Al Bih.

3.3. Effect of Climate Variables on Groundwater Storage under a Changing Climate

The effect of climate variables (rainfall, temperature, and potential evaporation) on estimated groundwater storage using groundwater levels was identified by applying the Mann–Kendall trend test from 2003 to 2020. The trend of each variable for groundwater recharge is presented in Figure 10. The results showed a significant increase in temperature and rainfall (Z values 1.85 and 1.97) and a nonsignificant positive in evaporation (Z value 0.98) over the study area. The total groundwater storage showed a Z value (−2.12), which was statistically significant at the 0.05 level (two-sided). From 2016 to 2017, rainfall showed an upward trend, and total groundwater storage also slightly increased, while evaporation and temperature were on the upward side, which agrees with the water budget calculations (Table 1). This indicated that precipitation patterns directly influenced the total groundwater storage, and climate change might have a positive impact on the water resources of this area.
During the analysis, we also found a nonsignificant positive trend in the total mean rainfall and an increasing trend in temperature over the study area. Some previous studies (e.g., AGEDI, 2015a, b) [1,9] also documented the same scenario. In that study, overall, rainfall is projected to increase over much of UAE and Hajar Mountain, including the study area. An increase of 50–100% from the current amount is expected for portions of Dubai, Sharjah, and northern Abu Dhabi. The downward trend of total accumulative groundwater storage indicated that although rainfall is high compared to the previous year in 2016–2017, storage is on the decline side. This might indicate that the groundwater extraction rate was high, which showed that the use of groundwater was not sustainable in the study area. Sherif et al. (2022) also found that the exploitation rate is high in the Wadi Al Bih area, which leads to a negative water balance which agrees with the results of the water budget model (Table 2) [40]. Therefore, adaptation is necessary for groundwater resources. Second, under a changing climate, groundwater sustainability can be secured by taking some important measures on the demand and supply sides in Wadi Al Bih. For example, groundwater withdrawals could be revised by considering the accurate calculation of renewable resources. Enhancing groundwater recharge by soil management can be used as an adaptation measure on the supply side as well. Likewise, the demand side can be managed by enhancing recharge measures considering rainfall variations under climate change, improving irrigation methods, enhancing water use efficiency, and metering groundwater abstractions. Furthermore, MAR needs much greater attention because of different and uneven episodes of rainfall due to climate change. Under rising temperatures, groundwater demand for human consumption and irrigated agriculture may certainly increase, which could hasten the depletion rate of aquifer reserves. Thus, groundwater management systems need effective management and high priority for climate change adaptation.

3.4. Water Security

According to the UAE water conservation policy and UAE water strategy (2017), the limited groundwater abstraction for domestic use (currently 6 MCM/yr) will be ceased starting in 2026. Additionally, it is observed that there has been a remarkable increase in precipitation starting from the year 2017. For example, the total annual average precipitation in the water year 2019–2020 in Wadi Al Bih is more than two folds of its historical average (120 mm/yr.). The recharge to the Quaternary aquifer in that year was estimated using the potential method and the GWBM model developed by Sherif et al. 2018 (Figure 11) [26]. The total estimated recharge from the rain was estimated at a value of 8.8 MCM, and this is almost double the current groundwater abstraction for domestic use in Wadi Al Bih. Freshwater resources in this area have been playing an important role in the water security of Ras Al Khaimah emirate and will continue to if properly managed. Ensuring water security is one of the United Nations’ seventeen sustainable development goals (SDGs). Water security is rooted not only in the physical availability of freshwater resources relative to water demand but also in social and economic factors [38].
The results of the WBM were used with the blue water scarcity index (WSI) equation (Equation (11)) to construct the water scarcity map shown in Figure 12. The available water resources were set to only equal the recharge of the Quaternary aquifer from all sources (direct rainwater percolation, horizontal flux from Oman mountains, and return flow from all sources, whether irrigation or network leakage). In the locations of agricultural activities, groundwater abstraction ranges from 4 to 7 folds of groundwater recharge even in a wet year such as 2019/2020 (purple and red colors in Figure 12). In these areas, groundwater replenishment ranges from less than 1% to 20% (brown and purple areas in Figure 13). Under the business-as-usual scenario, the remaining lifespan of the depleting groundwater resources is less than 25 years in the farm’s area (Figure 14). In this water-stressed area, irrigation must rely on fossil groundwater of salinity up to 5,000 mg/l. The blue water scarcity index map with the consideration of non-conventional water resources [32] is shown in Figure 15. Additionally, the alluvial fan area (except the urban area) is suffering from one degree or another of water stress. The comparison of Figure 12 and Figure 15 for the blue water scarcity index (WSI) with and without the consideration of non-conventional water resources indicates that the settlement and urban areas have high water security or very low water stress.

4. Conclusions

The Wadi Al Bih is unique in the UAE, as its groundwater depletion problem is not as intensive as that in other agricultural areas (e.g., Al Ain. Al Dhaid). The area is blessed with fresh groundwater resources and a substantial amount of recharge. Although the Hajar aquifer is currently under transient conditions, it is still feasible to return the aquifer to near steady-state condition after ceasing groundwater abstraction for domestic use in 2026, with adequate water resource management, particularly in the catchment area. Thus, the possible measures of increasing groundwater recharge (e.g., managed aquifer recharge (MAR) methods) were investigated. A GIS-based water budget model (WBM) was employed to evaluate the available groundwater resources in Wadi Al Bih and recharge sources. The analyses showed that only 49% of the accumulated rainwater behind the dam is recharging the underlying aquifer. The results of the WBM indicate the fast response of the aquifer to water percolation from rain, indicating that there is much room for increased recharge using the intentional recharge methods. Results also suggested that groundwater storage and salinity were governed by the rates and patterns of precipitation. For example, the recharge resulting from the two consecutive maximum monthly precipitation events in December 2019 and January 2020 has significantly increased the fresh groundwater reserve and slightly retreated the saline/brackish water toward the shoreline. The Mann–Kendall trend analysis showed that the influence of climate variables had a significant effect on groundwater supplies.
An adaptation plan should be made to minimize the severe impact of evaporation under changing climate on total groundwater storage. The developed plan should also mitigate the predicted increase in precipitation patterns and more extreme weather events caused by climate change, which can lead to flash floods that directly affect the regional infrastructure. In addition to minimizing the risk of aquifer depletion during long periods of groundwater droughts, adaptation should also be made to indirect climate change impacts, such as the intensification of human activities and land-use changes, increasing the demand for groundwater.
A complete management and maintenance plan is recommended for the dam to improve the recharge rate by developing means of maintaining a better percolation rate and preventing any overflows and flooding due to high flash rainstorms by considering different dam operation alternatives. The estimation of groundwater recharge of 8 MCM in the wet year of 2019–2020, which is almost 3-fold of its value in the average rainy year, indicates the managed aquifer recharge can successfully be used to improve the water security index in the farm areas which are not far from the dam area.

Author Contributions

Conceptualization, M.S., M.A.-R., A.S. and A.A.E.; methodology, M.S., A.A.E., X.S. and M.A.F.; software, M.S., A.A.E., A.S. and M.A.F.; validation, M.S., X.S., K.A. and A.A.E.; formal analysis M.S., A.A.E., and M.A.F.; investigation, M.S., X.S., A.S., K.A., M.B.A. and A.A.E. writing—original draft preparation, A.A.E., M.A.F., A.S., M.B.A. and F.B.; writing—review and editing, X.S., M.A.-R., D.A., F.B.; supervision, M.S.; funding acquisition, M.S. and D.A. All authors have read and agreed to the published version of the manuscript.

Funding

This research is funded by the Office of the Associate Provost for Research, United Arab Emirates University. The presented materials are part of the outcomes of the project titled “Simulation of Managed Aquifer Recharge from Dams in UAE and KSA”.

Institutional Review Board Statement

Not applicable.

Informed Consent Statement

Not applicable.

Data Availability Statement

Not applicable.

Acknowledgments

Thanks are due to the Ministry of Energy and Infrastructure and Ras Al-Khaimah Municipality for providing relevant data.

Conflicts of Interest

Authors declare no conflict of interest.

References

  1. AGEDI. Final Technical: Regional Desalination and Climate Change; Local, National and Regional Climate Change Programme, CCRG/IO; AGEDI: Milano, Italy, 2016. [Google Scholar]
  2. Sherif, M.; Ebraheem, A.; Shetty, A. Groundwater recharge from dams in United Arab Emirates. In World Environmental and Water Resources Congress 2017; American Society of Civil Engineers: Reston, VI, USA, 2017. [Google Scholar]
  3. Sherif, M.; Sefelnasr, A.; Ebraheem, A.A.; Al Mulla, M.; Alzaabi, M.; Alghafli, K. Spatial and Temporal Changes of Groundwater Storage in the Quaternary Aquifer, UAE. Water 2021, 13, 864. [Google Scholar] [CrossRef]
  4. Beniston, M. Climatic change in mountain regions: A review of possible impacts. In Climate Variability and Change in High Elevation Regions: Past, Present & Future; Springer: Berlin/Heidelberg, Germany, 2003; pp. 5–31. [Google Scholar]
  5. Patz, J.; Corvalan, C.; Horwitz, P.; Campbell-Lendrum, D.; Watts, N.; Maiero, M.; Olson, S.; Hales, J.; Miller, C.; Campbell, K.; et al. Our Planet, Our Health, Our Future. Human Health and the Rio Conventions: Biological Diversity, Climate Change and Desertification; World Health Organization: Geneva, Switzerland, 2012. [Google Scholar]
  6. Mfarrej, M.F.B. Climate change patterns in the UAE: A qualitative research and review. Nat. Environ. Pollut. Technol. 2019, 18, 261–268. [Google Scholar]
  7. Sherif, M.; Almulla, M.; Shetty, A.; Chowdhury, R.K. Analysis of rainfall, PMP and drought in the United Arab Emirates. Int. J. Climatol. 2014, 34, 1318–1328. [Google Scholar] [CrossRef]
  8. Sherif, M.; Akram, S.; Shetty, A. Rainfall analysis for the northern wadis of United Arab Emirates: A case study. J. Hydrol. Eng. 2009, 14, 535–544. [Google Scholar] [CrossRef] [Green Version]
  9. AGEDI. Regional Atmospheric Modelling for the Arabian Gulf Region—Future Scenarios and Capacity Building; Local, National and Regional Climate Change Programme; AGEDI: Milano, Italy, 2015; Available online: https://www.researchgate.net/publication/299234015_Technical_Report_Regional_Downscaled_Climate_Change_Atmospheric_Modeling_Results (accessed on 28 August 2022).
  10. Patz, J.A.; Grabow, M.L.; Limaye, V.S. When it rains, it pours: Future climate extremes and health. Ann. Glob. Health 2014, 80, 332–344. [Google Scholar] [CrossRef] [Green Version]
  11. Ebraheem, A.M.; Sherif, M.M.; Al Mulla, M.M.; Akram, S.F.; Shetty, A.V. A geoelectrical and hydrogeological study for the assessment of groundwater resources in Wadi Al Bih, UAE. Environ. Earth Sci. 2012, 67, 845–857. [Google Scholar] [CrossRef]
  12. Ebraheem, A.M.; Al Mulla, M.M.; Sherif, M.M.; Awad, O.; Akram, S.F.; Al Suweidi, N.B.; Shetty, A. Mapping groundwater conditions in different geological environments in the northern area of UAE using 2D earth resistivity imaging survey. Environ. Earth Sci. 2014, 72, 1599–1614. [Google Scholar] [CrossRef]
  13. Electrowatt, E. Wadi Bih dam and Groundwater Recharge Facilities; Internal Report; 1981; Available online: https://scholar.google.com.hk/scholar?hl=zh-CN&as_sdt=0%2C5&q=Wadi+Bih+dam+and+Groundwater+Recharge+Facilities&btnG= (accessed on 20 October 2022).
  14. Halcrow, S. Trucial States Council. Report on the Water Resources of the Trucial States; Engineering Report for the Trucial States Council; Water Resources Survey; Ministry of Agriculture and Fisheries: Dubai, United Arab Emirates, 1969. [Google Scholar]
  15. IWACO; Study, G. Drilling of Deep-Water Wells at Various Locations in the UAE; Ministry of Environment and Water: Dubai, United Arab Emirates, 1986. [Google Scholar]
  16. Elasha, B.O. Mapping of climate change threats and human development impacts in the Arab region. In UNDP Arab Development Report–Research Paper Series; UNDP Regiona Bureau for the Arab States: Amman, Jordan, 2010. [Google Scholar]
  17. Martens, B.; Miralles, D.G.; Lievens, H.; van der Schalie, R.; de Jeu, R.A.; Fernández-Prieto, D.; Beck, H.E.; Dorigo, W.A.; Verhoest, N.E. GLEAM v3: Satellite-based land evaporation and root-zone soil moisture. Geosci. Model Dev. 2017, 10, 1903–1925. [Google Scholar] [CrossRef] [Green Version]
  18. Crosbie, R.S.; McCallum, J.L.; Harrington, G.A. Estimation of groundwater recharge and discharge across northern Australia. In Proceedings of the 18th World IMACS Congress and MODSIM09 International Congress on Modelling and Simulation, Cairns, Australia, 13–17 July 2009. [Google Scholar]
  19. Sharda, V.N.; Kurothe, R.S.; Sena, D.R.; Pande, V.C.; Tiwari, S.P. Estimation of groundwater recharge from water storage structures in a semi-arid climate of India. J. Hydrol. 2006, 329, 224–243. [Google Scholar] [CrossRef]
  20. Zghibi, A.; Mirchi, A.; Msaddek, M.H.; Merzougui, A.; Zouhri, L.; Taupin, J.D.; Chekirbane, A.; Chenini, I.; Tarhouni, J. Using analytical hierarchy process and multi-influencing factors to map groundwater recharge zones in a semi-arid Mediterranean coastal aquifer. Water 2020, 12, 2525. [Google Scholar] [CrossRef]
  21. Van Vliet, M.T.; Jones, E.R.; Flörke, M.; Franssen, W.H.; Hanasaki, N.; Wada, Y.; Yearsley, J.R. Global water scarcity including surface water quality and expansions of clean water technologies. Environ. Res. Lett. 2021, 16, 024020. [Google Scholar] [CrossRef]
  22. Sophocleous, M. Groundwater recharge estimation and regionalization: The Great Bend Prairie of central Kansas and its recharge statistics. J. Hydrol. 1992, 137, 113–140. [Google Scholar] [CrossRef]
  23. Moon, S.-K.; Woo, N.C.; Lee, K.S. Statistical analysis of hydrographs and water-table fluctuation to estimate groundwater recharge. J. Hydrol. 2004, 292, 198–209. [Google Scholar] [CrossRef]
  24. Abijith, D.; Saravanan, S.; Singh, L.; Jennifer, J.J.; Saranya, T.; Parthasarathy, K.S. GIS-based multi-criteria analysis for identification of potential groundwater recharge zones-a case study from Ponnaniyaru watershed, Tamil Nadu, India. HydroResearch 2020, 3, 1–14. [Google Scholar] [CrossRef]
  25. Rohwer, J.; Gerten, D.; Lucht, W. Development of Functional Irrigation Types for Improved Global Crop Modelling; Potsdam-Institut fuer Klimafolgenforschung, e.V.: Potsdam, Germany, 2007. [Google Scholar]
  26. Sherif, M.M.; Ebraheem, A.M.; Al Mulla, M.M.; Shetty, A.V. New system for the assessment of annual groundwater recharge from rainfall in the United Arab Emirates. Environ. Earth Sci. 2018, 77, 412. [Google Scholar] [CrossRef]
  27. Al-Muaini, A.; Green, S.; Dakheel, A.; Abdullah, A.H.; Abou Dahr, W.A.; Dixon, S.; Kemp, P.; Clothier, B. Irrigation management with saline groundwater of a date palm cultivar in the hyper-arid United Arab Emirates. Agric. Water Manag. 2019, 211, 123–131. [Google Scholar] [CrossRef]
  28. Taylor, R.G.; Scanlon, B.; Döll, P.; Rodell, M.; van Beek, R.; Wada, Y.; Longuevergne, L.; Leblanc, M.; Famiglietti, J.S.; Edmunds, M.; et al. Ground water and climate change. Nat. Clim. Change 2013, 3, 322–329. [Google Scholar] [CrossRef] [Green Version]
  29. Cuthbert, M.O.; Taylor, R.G.; Favreau, G.; Todd, M.C.; Shamsudduha, M.; Villholth, K.G.; MacDonald, A.M.; Scanlon, B.R.; Kotchoni, D.O.; Vouillamoz, J.M.; et al. Observed controls on resilience of groundwater to climate variability in sub-Saharan Africa. Nature 2019, 572, 230–234. [Google Scholar]
  30. Hamed, K.H.; Rao, A.R. A modified Mann-Kendall trend test for autocorrelated data. J. Hydrol. 1998, 204, 182–196. [Google Scholar] [CrossRef]
  31. Hirsch, R.M. A perspective on nonstationarity and water management. JAWRA J. Am. Water Resour. Assoc. 2011, 47, 436–446. [Google Scholar] [CrossRef]
  32. Falkenmark, M. Meeting water requirements of an expanding world population. Philos. Trans. R. Soc. Lond. Ser. B Biol. Sci. 1997, 352, 929–936. [Google Scholar] [CrossRef] [Green Version]
  33. Falkenmark, M.; Berntell, A.; Jägerskog, A.; Lundqvist, J.; Matz, M.; Tropp, H. On the Verge of a New Water Scarcity: A Call for Good Governance and Hyman Ingenuity; Stockholm International Water Institute (SIWI): Stockholm, Sweden, 2007. [Google Scholar]
  34. Wada, Y.; van Beek, L.P.; Viviroli, D.; Dürr, H.H.; Weingartner, R.; Bierkens, M.F. Global monthly water stress: 2. Water demand and severity of water stress. Water Resour. Res. 2011, 47. [Google Scholar] [CrossRef]
  35. United Nations. Comprehensive Assessment of the Freshwater Resources of the World; overview document; World Meteorological Organization: Geneva, Switzerland, 1997. [Google Scholar]
  36. Vorosmarty, C.J.; Green, P.; Salisbury, J.; Lammers, R.B. Global water resources: Vulnerability from climate change and population growth. Science 2000, 289, 284–288. [Google Scholar] [CrossRef] [PubMed] [Green Version]
  37. Wada, Y.; Gleeson, T.; Esnault, L. Wedge approach to water stress. Nat. Geosci. 2014, 7, 615–617. [Google Scholar] [CrossRef]
  38. Gain, A.K.; Giupponi, C.; Wada, Y. Measuring global water security towards sustainable development goals. Environ. Res. Lett. 2016, 11, 124015. [Google Scholar] [CrossRef]
  39. Wada, Y.; van Beek, L.P.; Sperna Weiland, F.C.; Chao, B.F.; Wu, Y.H.; Bierkens, M.F. Past and future contribution of global groundwater depletion to sea-level rise. Geophys. Res. Lett. 2012, 39. [Google Scholar] [CrossRef]
  40. Sherif, M.; Ebraheem, A.A.; Shetty, A.; Sefelnasr, A.; Alghafli, K.; Al Asam, M. Evaluation of the effect of the Wadi Bih dam on groundwater recharge, UAE. In Wadi Flash Floods; Springer: Berlin/Heidelberg, Germany, 2022; p. 509. [Google Scholar]
Figure 1. Location map of the Wadi Al Bih area showing the catchment, drainage pattern, fracture–fracture and fracture–drainage intersections, dams, farms, water budget model grid, and recharge percentage from rain for each grid cell.
Water 14 03448 g001
Figure 2. (a) Average total annual rainfall in the period 1980–2015 (mm/yr), (b) average total annual rainfall in the water year 2019–2020 as an average wet year (mm/yr.).
Water 14 03448 g002
Figure 3. Geological map of Wadi Al Bih (modified from [11]). Kjm: Cretaceous–Jurassic; Qg: Quaternary gravels; Qsb: Quaternary sabkha; Tr: Triassic. Locations of the monitoring wells and the main dam are also shown.
Water 14 03448 g003
Figure 4. Subsurface hydrogeological cross-section along direction AA’. The cross-section location is shown in Figure 3.
Water 14 03448 g004
Figure 5. Hydrogeological map of the Wadi Al Bih area in the UAE.
Water 14 03448 g005
Figure 6. Water table fluctuations in monitoring well (BIH-1) to variations in the total monthly precipitation.
Water 14 03448 g006
Figure 7. Saltwater intrusion progress with time due to groundwater depletion in the upper aquifer. The high precipitation in the water year 2019–2020 resulted in a retreat of saline/brackish/fresh interfaces westward and hence increases in fresh and brackish groundwater reserves.
Water 14 03448 g007
Figure 8. Accumulated water volumes behind Wadi Al Bih Dam in the period 1982–2020 (Source MoEI).
Water 14 03448 g008
Figure 9. Correlation between the estimated recharge depth and rainfall depth in Wadi Al Bih.
Water 14 03448 g009
Figure 10. The trend of total mean precipitation, average annual potential evaporation, average annual temperature, and total groundwater (GW) storage in the study area.
Water 14 03448 g010
Figure 11. Estimated recharge from rain (m3–km2) in water year 2019–2020.
Water 14 03448 g011
Figure 12. Map of the adjusted blue water scarcity index (WSI) in the wet year 2019–2020.
Water 14 03448 g012
Figure 13. Map of the replenishment ratio (%) in the wet year 2019–2020.
Water 14 03448 g013
Figure 14. Map of the remaining lifespan (years) based on the quantity and quality of the available groundwater in the year 2020.
Water 14 03448 g014
Figure 15. The adjusted blue water scarcity index map with the consideration of nonconventional water resources.
Water 14 03448 g015
Table 1. Groundwater reserves in the Quaternary aquifer as determined from the GWBM (MCM) for 1969, 2005, 2015, and 2020.
WHO Water TypeSalinity (mg/L)1969 *200520152020
Fresh (MCM)(<1500)2009402322406
Brackish (MCM)(>1500–20,000)2124232618471965
Saline (MCM)(>20,000–65,000)nil541876438
Brine (MCM)(>65,000)nilnilnilnil
Total (MCM) 4133326930452809
* 1969 is the baseline of the steady-state condition.
Table 2. Estimated inflow and outflow volumes in the Wadi Al Bih catchment (UAE part) with and without the alluvial fan area for the average wet year.
Discharge (MCM/yr.)UAE Part of the Catchment +Alluvial FanUAE Part of the Catchment Only
Outflow
Irrigation abstraction14.41.35
Domestic and industrial abstraction4.5 (was 12 before 1998)
(Going to be ceased in 2026)
4.5
Evaporation from inland sabkhas10
Groundwater flows across boundaries and toward the sea1.51.5
Subtotal Discharge (MCM/yr.)21.47.35
Input
Inflow (MCM/yr.)
Recharge from rain with dam augmentation
(Recharge from the rain without dam augmentation)
8.6
(5.6)
5.13
(3.3)
Inflow across Oman Mountain, above and below mountain gaps using Darcy’s Law8.88.8
Groundwater-fed irrigation return flow2.10.196
Subtotal recharge (with dam augmentation) in MCM/yr.
Subtotal recharge (without dam augmentation) in MCM/yr.
19.5
16.5
14.126
12.296
Publisher’s Note: MDPI stays neutral with regard to jurisdictional claims in published maps and institutional affiliations.

