
HYPROP-FIT to Model Rock Water Retention Curves Estimated by Different Methods

CNR National Research Council, IRSA Water Research Institute, Via Francesco De Blasio 5, 70132 Bari, Italy
*
Author to whom correspondence should be addressed.
Water 2022, 14(21), 3443; https://doi.org/10.3390/w14213443
Submission received: 13 September 2022
/
Revised: 19 October 2022
/
Accepted: 23 October 2022
/
Published: 29 October 2022
(This article belongs to the Special Issue Unsaturated Zone: Advances in Experimental and Theoretical Investigations)
Abstract
:The water retention curve, which relates the matric potential, ψ, to the water content, θ, is essential to describe the flow processes in the unsaturated zone and provides useful information for environmental and engineering applications. There are few studies devoted to measuring the rock water retention curves due to the rock’s tightness, which makes it more technically difficult to use specific methods. In this study, we tested four different methods to measure water retention curves of two lithotypes of carbonate porous rocks with the aim to find the most effective to be applied to rock samples. Suction table, evaporation, Quasi-Steady Centrifuge, and WP4-T dewpoint potentiameter methods have been applied. The Quasi-Steady Centrifuge method proved to be the only one capable of determining water retention curves in the entire water content range and capturing the bimodality of the tested media with respect to the other methods. The measured water retention data were fitted with HYPROP-FIT software that allows us to accurately describe the WRCs and obtain critical parameters for the numerical simulation of flow and transport through the vadose zone, which plays a key role in various environmental issues.
1. Introduction
The unsaturated zone, the portion between the land surface and the top of the phreatic zone, is critical because (i) it controls the water movement from the land surface to the groundwater, (ii) it strongly affects the aquifer recharge rate, and (iii) it controls, in terms of flow rates and chemical reactions, whether, where, and how fast contaminants reach the groundwater. Understanding the flow and transport processes in the unsaturated zone is therefore crucial in determining the quantity and quality of groundwater available for human use.
Knowledge of the water retention function, ψ(θ), which correlates the matric potential, ψ (kPa), to the water content, θ (m3·m−3), yields information for evaluating, analyzing, and predicting unsaturated flow [1].
Several methodologies have been tested over the years to estimate the water retention curves (WRCs). These methods typically work well for unconsolidated media, generally soils, but the experimental determination of the rock water retention curve is still very difficult [2]. Because the unsaturated zone is often constituted by different layers of rock, it is important to increase the knowledge of the applicability of various experimental methods to rock samples and investigate better models to fit the measured data.
For this reason, in recent decades, several studies consisting of WRCs determination on rock samples with different aims have been carried out. Luquot et al. [3] monitored the WRCs and other hydraulic properties of carbonate rocks during different dissolution experiments. They used the centrifugal method and reported on dissolution experiments induced by injecting water with different pH values into four core samples. Rotting et al. [4] investigated the change in WRCs of sedimentary carbonate rocks attacked by permeation with hydrochloric acid at different pH values. Several dissolution–characterization cycles were performed in order to study the evolution of the WRC. Al-Mukhtar et al. [5] measured the WRCs for two limestones, commonly used in the construction of several French monuments. They used different techniques, such as tensiometric plates and osmotic solutions with different concentrations, to measure the matric potential. They successively applied van Genuchten (vG) [6] and Fredlund and Xing [7] equations for fitting the WRCs. Koubaa et al. [8] estimated the WRCs of porous limestone with varying porosity by using the osmotic and salt solution methods. Pirastru and Niedda [9] determined rock water retention parameters by means of evaporation experiments in the laboratory and the tension infiltrometer in the field, in order to simulate the water flow towards the vadose zone to the groundwater. Lipovetsky et al. [10] estimated the WRCs by using the evaporation and chilled-mirror dew point methods on two samples of Indiana Limestone carbonate. They fitted the experimental data by applying the unimodal and bimodal vG and Peters–Durner–Iden (PDI) functions. With respect to the mentioned works in this study, we determined the WRCs of two lithotypes of carbonate porous rock by comparing, for the first time, four different methods with the aim to find the most suitable one to test the rock samples and describe the behavior of the selected rocks within the entire range of water content. The experimental rock water retention data were fitted with HYPROP-FIT software, which allows us to consider both unimodal and bimodal water retention functions in order to find the one that better described the measured WRCs and obtain hydraulic parameters critical for the numerical simulation of flow and transport through the vadose zone.
2. Materials and Methods
The investigated samples were collected in the Apulia region, southern Italy, and belong to two lithotypes of sedimentary rock of marine origin. This rock, widespread in the southern part of the peninsula, often forms a thick layer of the unsaturated zone. It also constitutes the building material of relevant historical monuments that require protection due to deterioration caused by water action [11,12].
The WRCs were measured by means of the suction table, evaporation, Quasi-Steady Centrifuge (QSC), and dewpoint potentiameter methods. These four methods were chosen to find the most suitable for the rock samples, with all being designed for soils except the QSC, and uncover the one that allows us to capture the behavior of the sample in the entire range of water content from saturation to very dry conditions.
For each lithotype, 5 samples were used for the suction table, 1 sample for both evaporation and QSC, and 10 samples for dewpoint potentiameter tests, for a total of 34 investigated samples.
Specifically, the two investigated lithotypes, C and M, belong to the same geological formation named “Calcarenite di Gravina” (Middle Pliocene–Early Pleistocene). Lithotype C was collected from quarry districts known as “Le Tufarelle”, in Canosa di Puglia (41°09′4.85″ N, 15°59′24.92″ E), while lithotype M was collected from “Caprocetta”, in Massafra (40°33′29.25″ N, 17°08′32.83″ E).
They are typical of shallow marine temperate waters and foreshore, shoreface, and offshore environments. They constitute calcite with a low magnesium content (CaCO3 ≥ 97%). Minor constituents form the insoluble residue, which is commonly represented by clay minerals with negligible quartz, feldspar, and hydrous iron and aluminum oxides. Their main physical properties are reported in Table 1.
The Calcarenite di Gravina formation consists of biocalcarenites, which are carbonate sediments that constitute bioclasts, irregularly, and in places weakly, cemented [13].
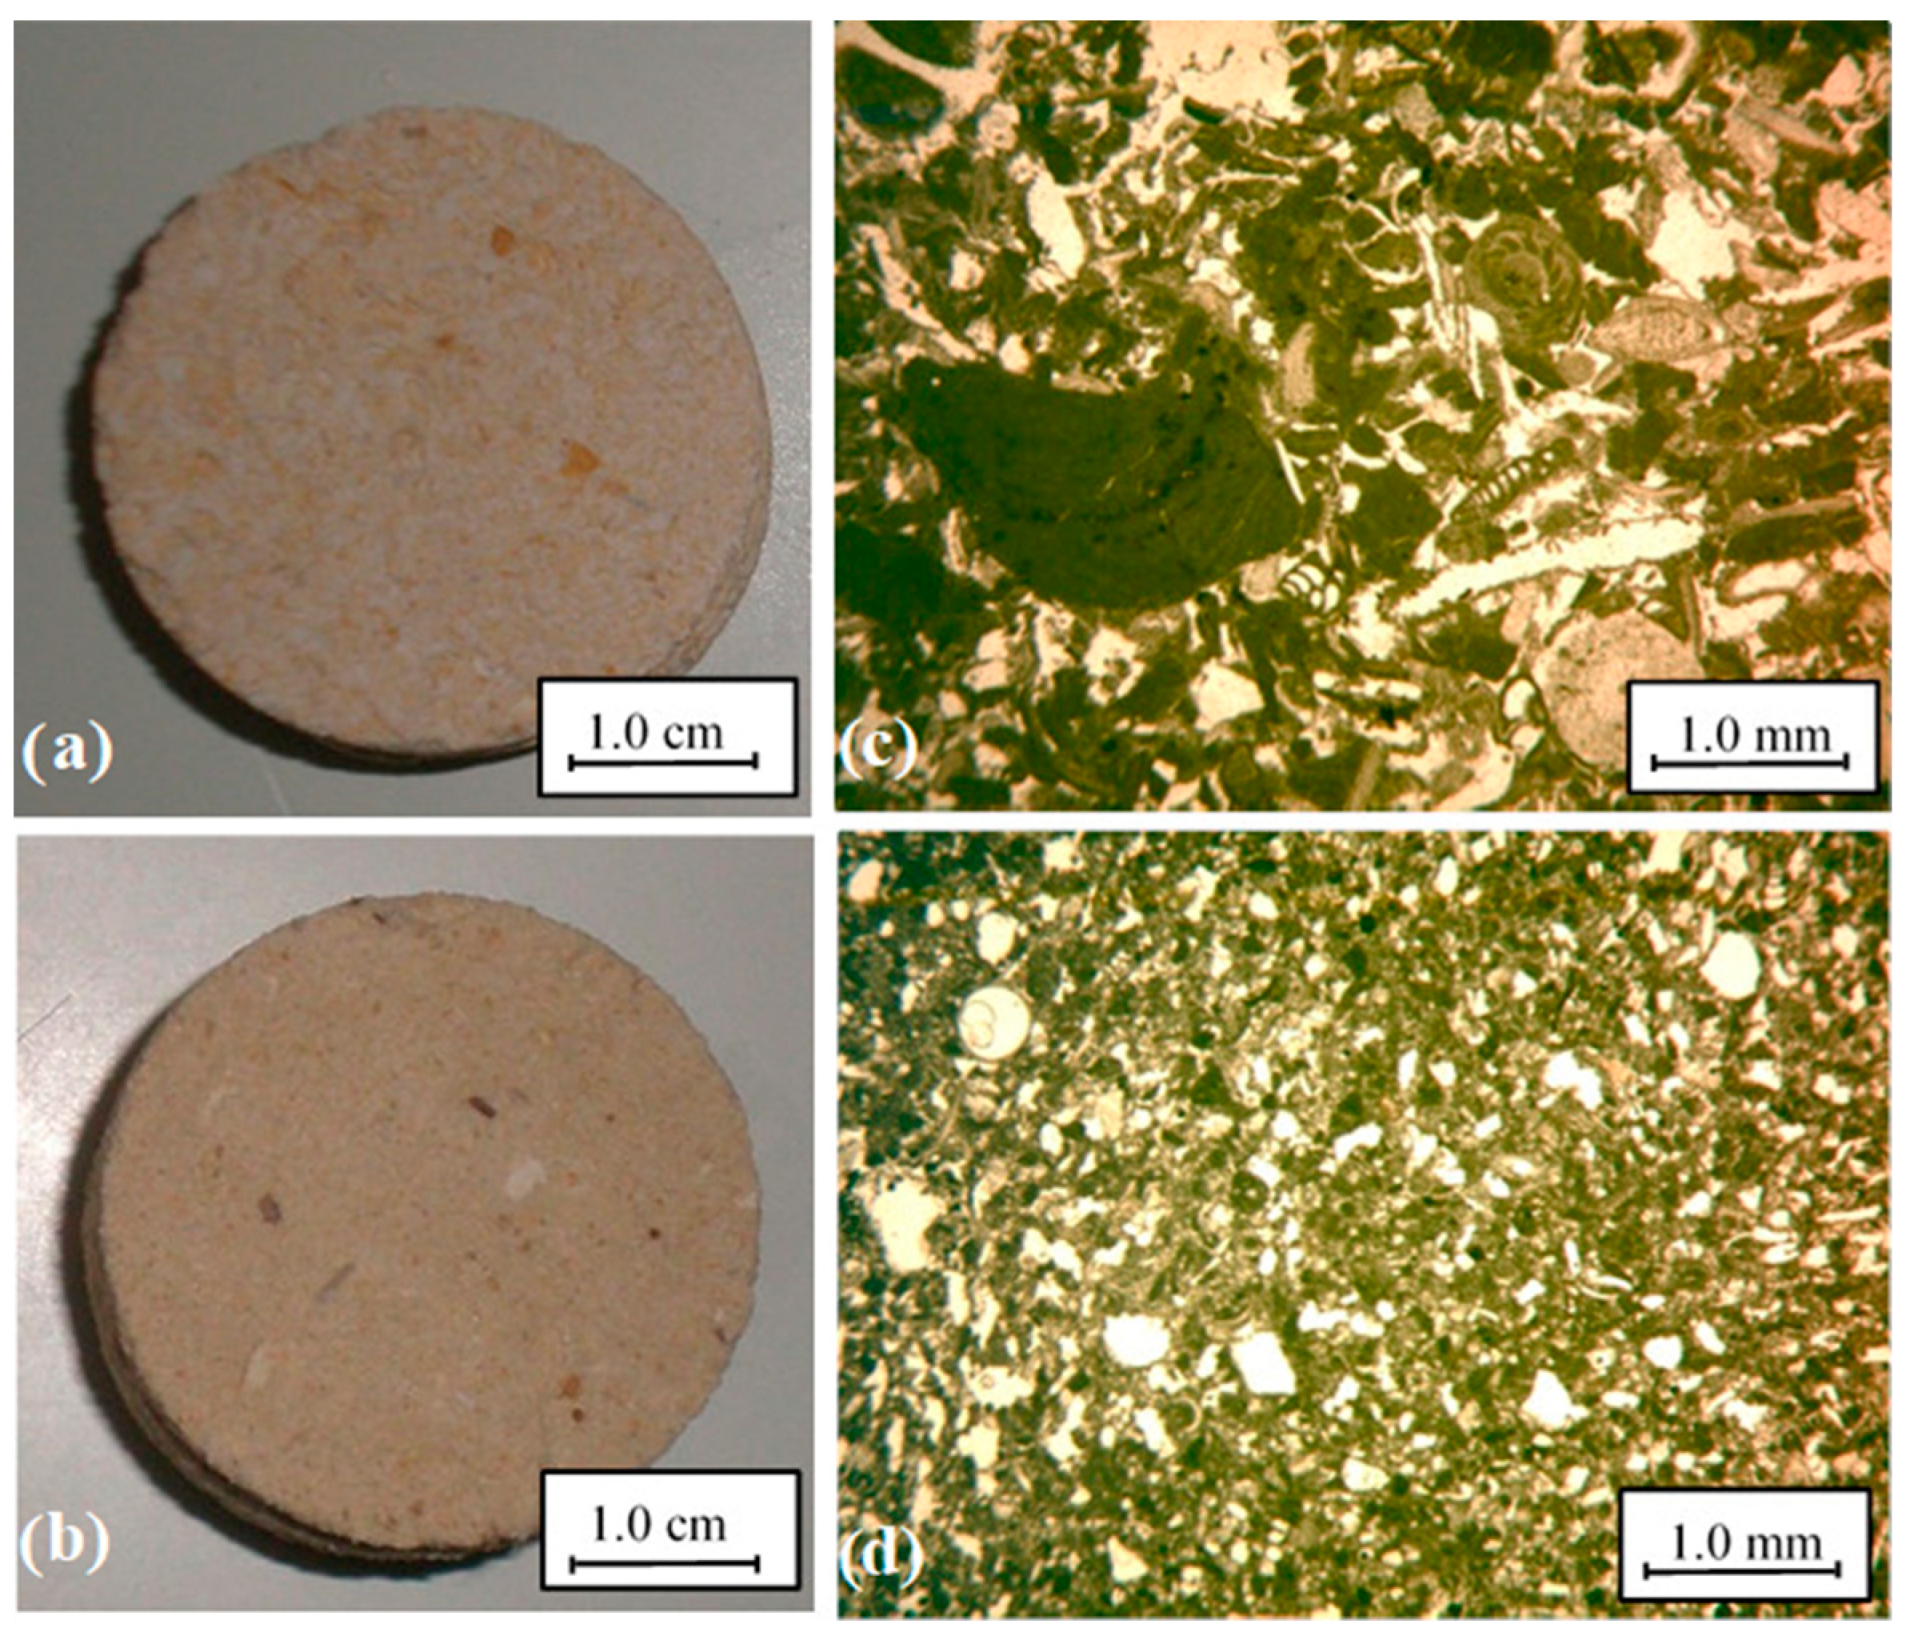
This formation consists of a self-supporting granular framework. Specifically, lithotype C is straw-yellow medium-grained grainstone, while lithotype M is whitish fine-grained packstone, as observed by macroscopic analysis and optical petrographic microscopy with transmitted light on standard thin sections (Figure 1).
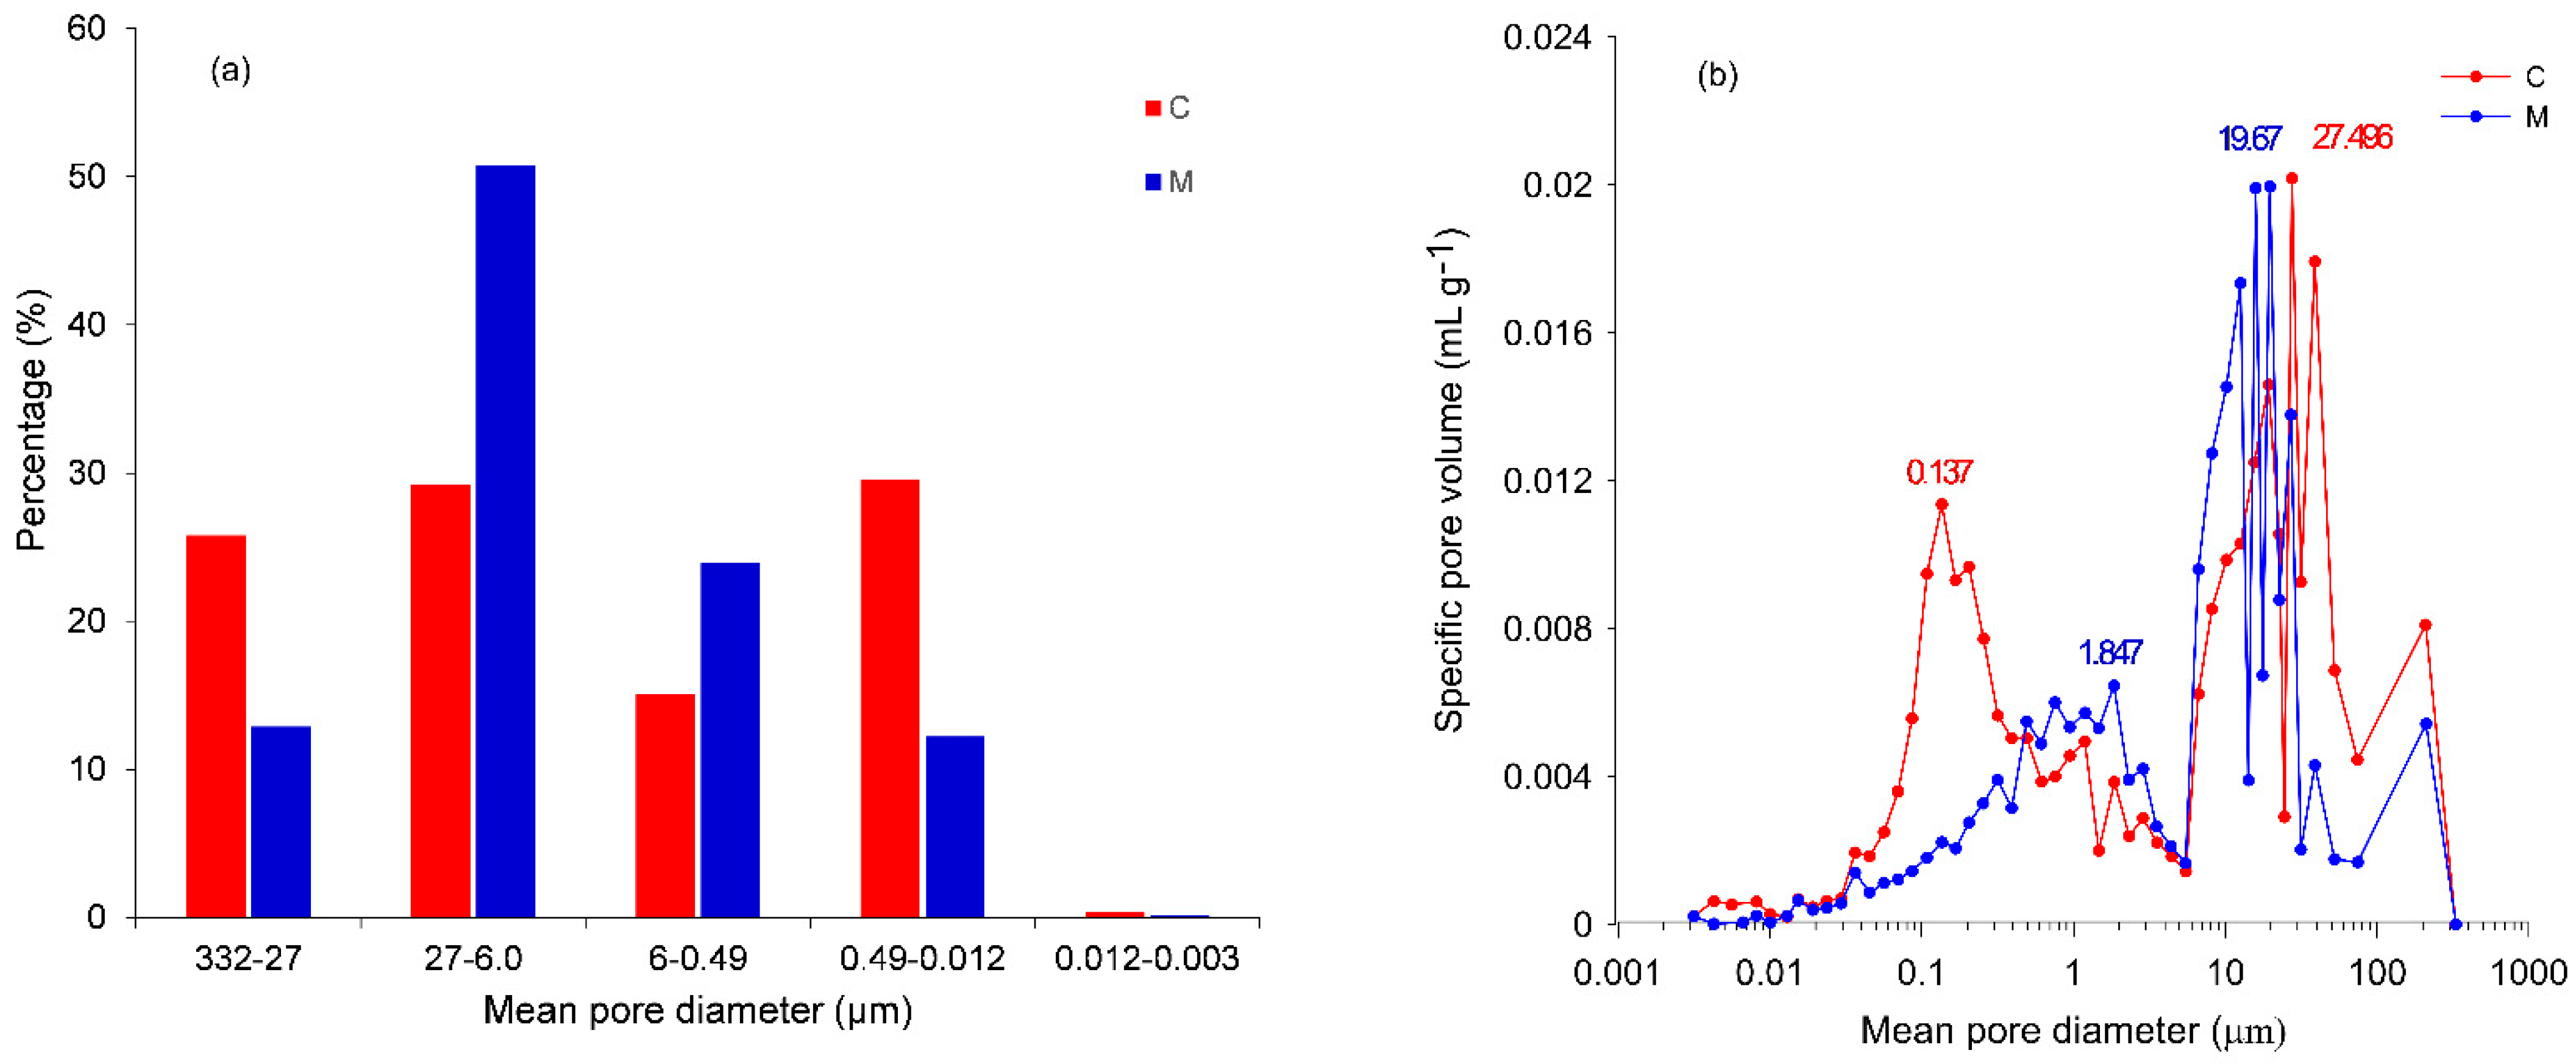
The micritic matrix, resulting from the mechanical abrasion of bioclasts, is more abundant in M than in C. Both are poorly and irregularly cemented, even though the amount of calcite cement is greater in C than in M. For both lithotypes, the fabric is open so that all pores are interconnected, continuous, and accessible [12]. Particularly, both lithotypes are characterized by bimodal behavior in terms of pore-size distribution (Figure 2) as observed using the mercury intrusion porosimetry (MIP) technique described in Turturro et al. [14].
2.1. The Suction Table Method
The suction table method [15] enables the assessment of the drying WRC in the high ψ values range. The sandbox Eijkelkamp Agrisearch Equipment model 08.01 was used to measure ψ in a range of 0 to −10 kPa. Five samples for C and for M, 5 cm in height and 3.5 cm in diameter, were laterally waterproofed by epoxy resin so as to have unidimensional flow during the test. This preparation procedure implied choosing, among several materials, the most appropriate one able to seal the rough lateral surface of the rock core sample to make it waterproof by avoiding the intrusion of the material itself in the pores that causes a reduction in the area of the top and bottom ends of the core sample orthogonal to the direction of water flow during the test. This required testing several materials to find the right one. Starting from samples saturated under vacuum, a series of static equilibria between the water inside the samples and the free water body contained in a suction control system at known ψ were established. Upon achieving equilibrium when the sample weight became steady, θ was measured at the corresponding ψ value. The pairs of values (θ, ψ) were obtained as an average computed on 5 tested rock samples.
2.2. The Evaporation Method
The evaporation method [16] was used to measure the drying WRC for ψ values ranging between 0 and −80 kPa. One core sample for each lithotype, 8 cm in diameter and 12 cm in height and laterally waterproofed by epoxy resin, was used. The test started with samples saturated under a vacuum. Values of ψ were measured by needle tensiometers (SDEC France; [17]) by horizontally inserting the ceramic cup in three equidistant holes, 2.45 cm in length and 1.22 cm in diameter, drilled along the core sample height. This operation is very tricky because the holes should be large enough to insert the tensiometers and avoid breaking them and, in the meantime, ensure good contact between the ceramic cup and the walls of the hole to guarantee the correct functioning of the tensiometers themselves. During the experiment, the sample changed in weight and the water content decreased due to the evaporation, also decreasing the ψ value as read by the tensiometers.
2.3. The Quasi-Steady Centrifuge (QSC)
The QSC method [18] tested one core sample for each lithotype, 8 cm in diameter and 6 cm in height, by using centrifugal acceleration ranging between 230 and 2000 revolutions per minute, which allowed the measurement of WRCs with ψ ranging between 0 and −50 kPa. The QSC method uses an experimental apparatus that fits into a swinging centrifuge bucket. The upper part of the apparatus rests on the sample and consists of a reservoir, which controls the water flow by means of a layer of specific granular material, the conductance of which determines the flow rate. The lower part of the apparatus, located below the sample, includes a ceramic plate placed on the outflow dish, which rests on the bottom of the centrifuge bucket. The granular materials used for testing the rocks were kaolinite, silica flour, and silica sands, and different combinations of them. The QSC method needs a contact tensiometer for measuring ψ. This method enables the measuring of rock WRC in the whole water content range by simply changing the combination of the angular speed and the duration of the run in the centrifuge with various granular materials and their thickness, which the flow rate depends on.
2.4. Dewpoint Potentiometer
The WP4-T dewpoint potentiameter [19] enables the estimation of the wetting WRC in the low ψ values range. This method is based on the chilled-mirror dewpoint technique and allows measurements of ψ at the equilibrium between the liquid-state water in the sample and gas-state water in a chamber surrounding the sample by using the Kelvin equation. The dewpoint potentiameter allows measurements of ψ between 0 and −3.0 × 10⁵ kPa with an accuracy of ±100 kPa from 0 to −1 × 10⁴ kPa, and 1% from −1 × 10⁴ to −3.0 × 10⁵ kPa. Cylindrical samples, 3.5 cm in diameter and 0.6 cm in height, were used. The value of θ corresponding to each ψ value identifies the experimental data points of the WRC. For each lithotype, the pair values (θ, ψ) were obtained as an average computed for each θ value on 10 tested rock samples.
2.5. Model
The measured data pairs (θ, ψ) experimentally obtained with suction table, evaporation, QSC, and WP4-T dewpoint potentiameter methods were fitted using HYPROP-FIT software [20,21], by importing the values as data for fitting only. HYPROP-FIT was chosen because it is a quick, accurate, and versatile software for fitting hydraulic functions to retention data. Specifically, retention data, measured by different methods, can be easily imported and fitted with several hydraulic models (Brooks and Corey, Kosugi and van Genuchten) both in their traditional form and as bimodal functions. In addition, HYPROP-FIT is particularly useful because all models are available in PDI variants, which allow us to describe hydraulic functions across the full measurement range. Rock WRCs were fitted with four different models: S1, the unimodal vG model (Equation (1)); S2, the unimodal PDI model (Equations (2) and (3)); S3, the bimodal vG model (Equation (4)); and S4, the bimodal PDI model (Equation (5)). With models S3 and S4, we explored the dual-porosity behavior of the water retention to account for the presence of distinct but interacting macroporous and microporous regions resulting from the mercury intrusion porosimetry tests (Figure 2).
The unimodal vG model is given by:
where α, m, and n are the curve shape parameters with m = 1 − 1/n, θr is the maximum water content for the water adsorption, and θs is the saturated water content.
The unimodal PDI model is represented by:
where θcap (ψ) is a capillary retention term, θad(ψ) is an adsorptive retention term, and Scap and Sad are the capillary and the water adsorption saturation functions.
By substituting Scap by , that is, the basic saturation function for the vG model, Equation (2) becomes:
where Γ and Γ0 is the basic function at ψ = ψ0 where the water content reaches zero, and
where xa and x0 are pF log values at ψa and ψ0, respectively, where ψa is the matric potential at air entry value for the adsorptive retention, and b is the shape parameter given by:
The bimodal-vG model expression is represented by the unscaled weighted sum of the two unimodal subfunctions (Equation (2)) without adsorption (Sad = 1):
where wi is the weighting factor for the subfunction i and is 0 < wi < 1 and ∑wi = 1.
The bimodal-PDI model expression is the scaled weighted sum of the two unimodal subfunctions by considering the adsorption saturation function Sad:
where all the parameters have already been defined [22].
For both the unimodal and bimodal PDI models, the ψ0 parameter is set in HYPROP-FIT equal to 106.8 pF (pF = −log|ψ| with ψ expressed in cm), which is the matric potential at oven dryness for 105 °C [23].
HYPROP-FIT uses the Root Mean Square Error (RMSEθ) to evaluate the difference between the measured (θim) and estimated (θie) water contents:
where np indicates the number of data points.
HYPROP-FIT uses the corrected Akaike Information Criterion (AICc) equal to 2(L + k), where L is the likelihood function and k is the number of fitting parameters used to support the choice of the most appropriate model. The AICc value accounts for the different number of adjustable parameters when selecting the best model. The greater the AICc value, the lower the RMSEθ, and the more accurate the model.
3. Results and Discussion
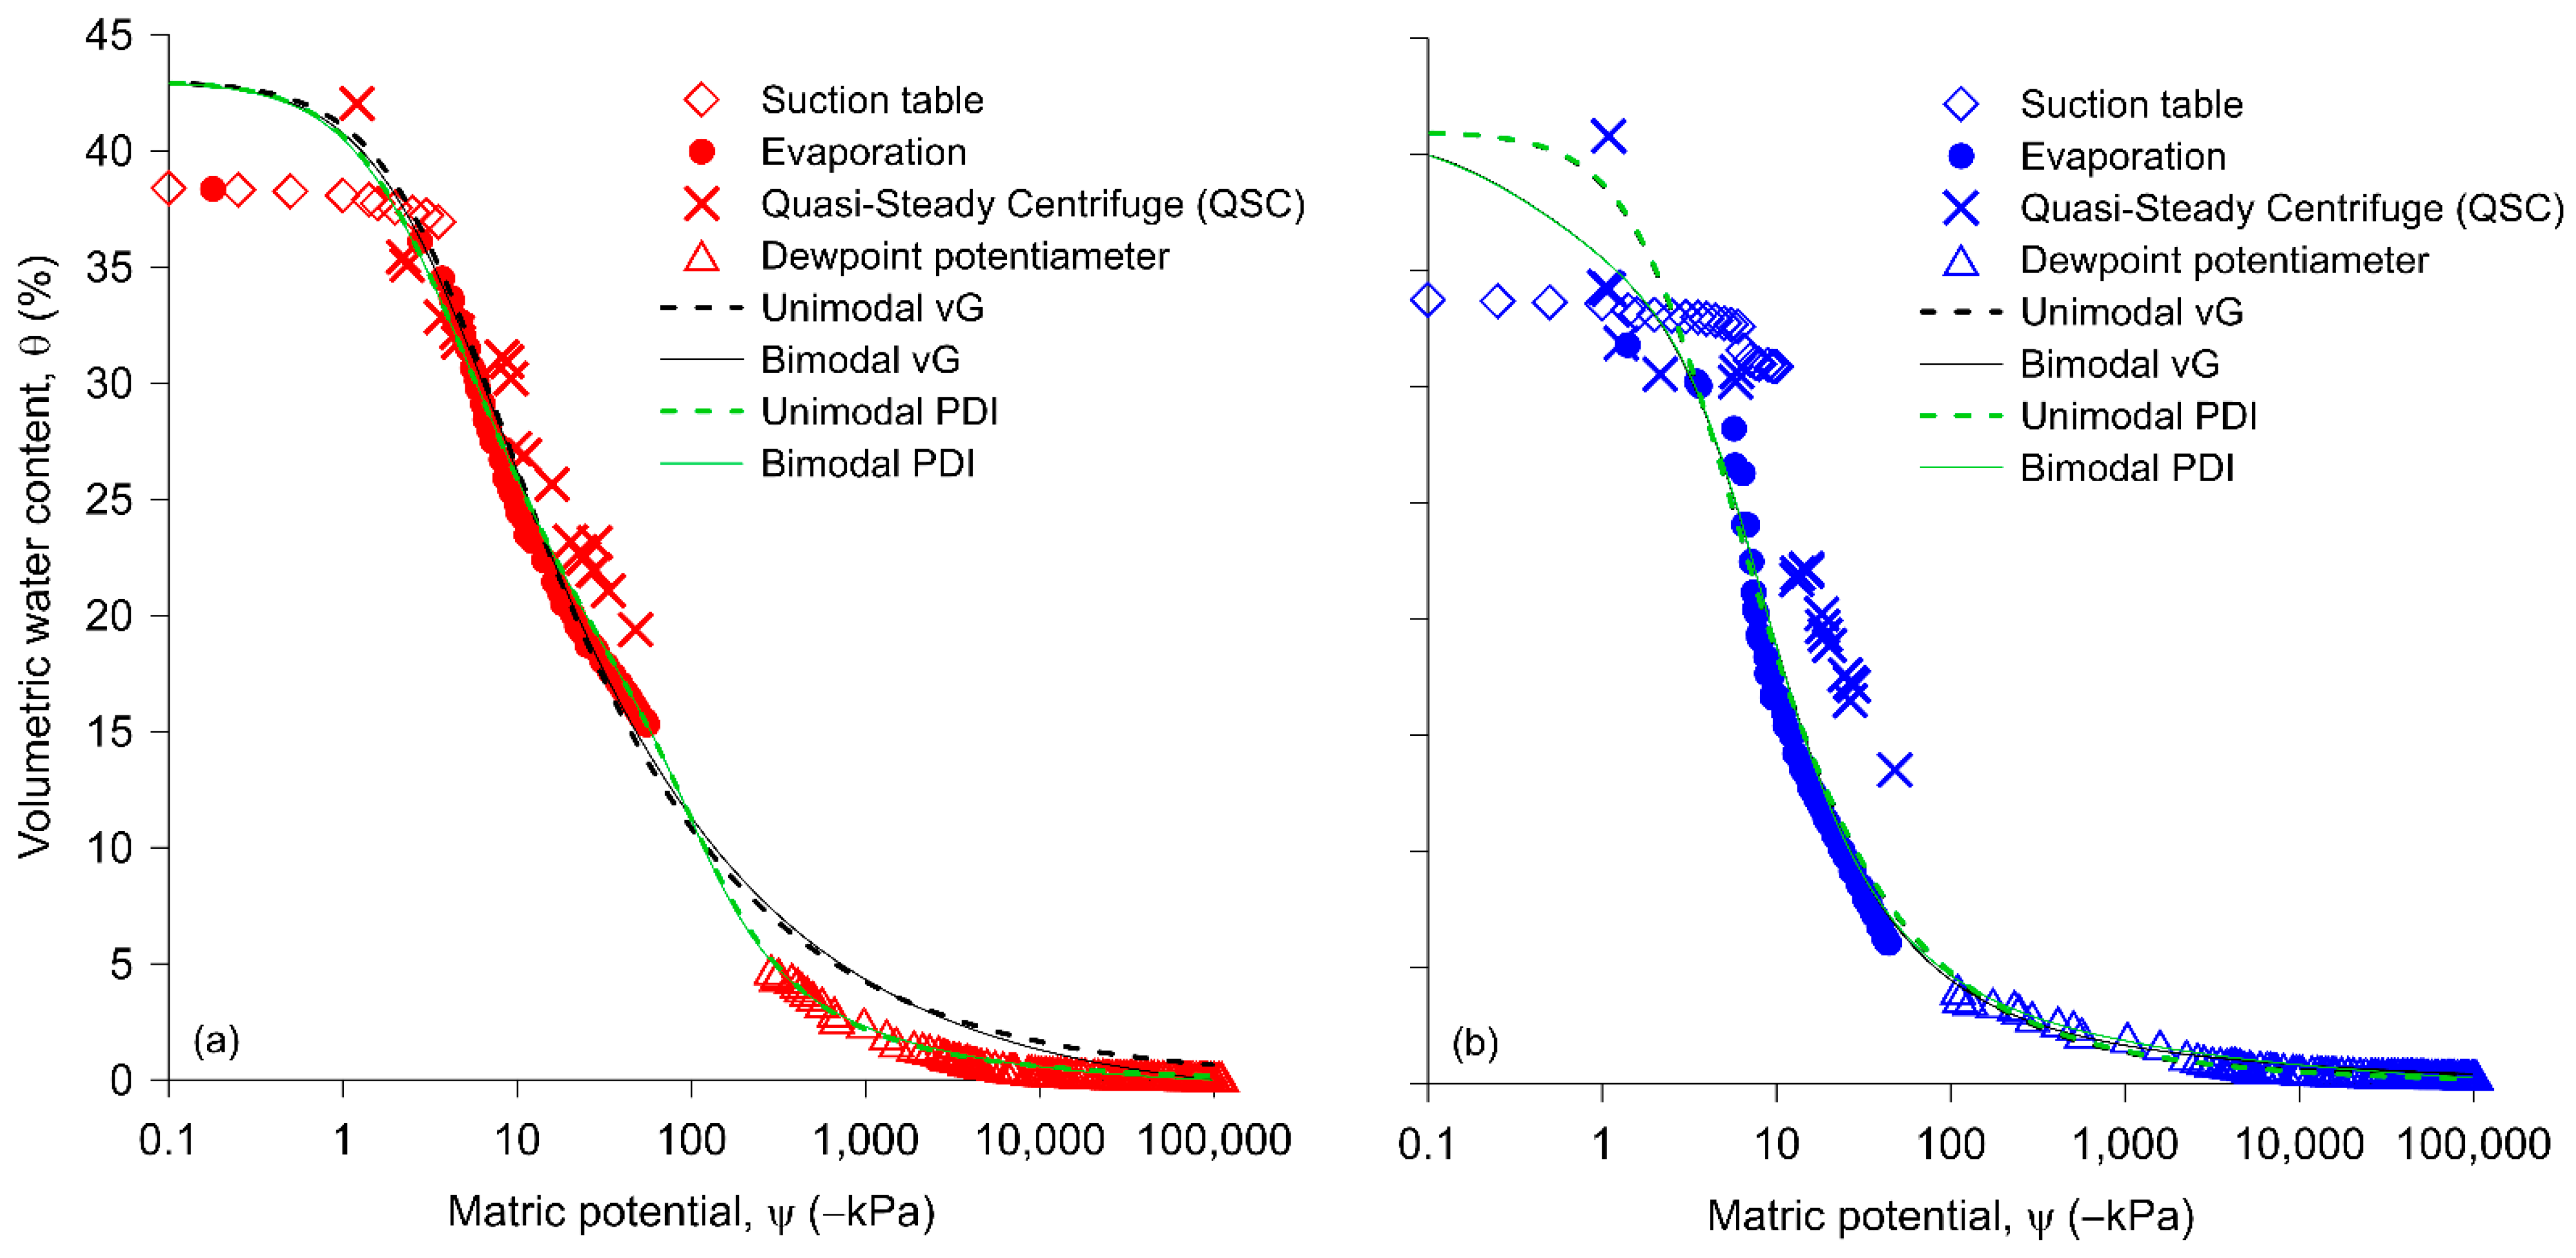
The graphs depicted in Figure 3 show both the WRCs of C and M lithotypes and the fitting curves computed by considering the four different models mentioned above (unimodal and bimodal vG, and unimodal and bimodal PDI).
3.1. Rock Water Retention Data
Figure 3 illustrates θ (m3 m−3) versus ψ (kPa), represented on a logarithmic scale, measured by suction table, evaporation, QSC, and WP4-T dewpoint potentiameter methods.
The suction table allows setting ψ values ranging from −0.1 up to −10 kPa, which correspond to θ values between 0.384 and 0.369 m3·m−3 for C, and between 0.338 and 0.309 m3·m−3 for M. This method, in fact, allows one to measure retention data near the saturation even if not exactly the θs value.
The evaporation method, instead, measures lower ψ values ranging from −0.18 to −55.85 kPa for C and from −1.40 to −44.34 kPa for M, corresponding to θ values ranging from 0.383 to 0.153 m3·m−3 and from 0.318 to 0.060 m3·m−3 for C and M, respectively.
The ψ values measured by the QSC method range from −1.19 to −46.94 kPa, which, for C, correspond to θ = 0.420 m3·m−3 and θ = 0.193 m3·m−3, respectively. For M, the measured ψ values range from −1.07 to −46.91 kPa corresponding to θ = 0.408 m3·m−3 and θ = 0.135 m3·m−3, respectively. It is important to highlight that the QSC method can expand the measurement range by simply increasing the combinations of cakes, the run speed, and the duration of the run in the centrifuge.
The dewpoint potentiameter allows ψ measurements from −287 to −1.34 × 10⁵ kPa and from −110 to 1.33 × 10⁵ kPa for C and M, respectively; that is, in the very dry range of the WRCs. The corresponding θ values range between 0.047 and 0.001 m3 m−3 and between 0.041 to 0.003 m3·m−3 for C and M, respectively.
Generally, Figure 3 shows the maximum measured θ value is greater for C than for the M lithotype, the first having a greater porosity than M, with all pores of both these rocks being interconnected [11].
It is evident that there is an overlap of the data obtained by the suction table and evaporation methods in the high ψ values range of the WRCs for both the lithotypes, while visible gaps can be seen between the points obtained by the evaporation and dewpoint potentiameter methods. These gaps are related to the different bimodal pore-size distributions, more evident for C than for M. In fact, both the lithotypes exhibit a bimodal pore-size distribution characterized by two pore diameter peaks that, for C, correspond to 0.137 and 27.496 µm, while for M they correspond to 1.847 and 19.670 µm (Figure 2b). This is due to the integrity of the bioclasts, responsible for the larger pores, and a greater proportion of inter-granular cement, responsible for the smallest pores in lithotype C compared to M. For this reason, lithotype C has a range of large pores that the evaporation and dewpoint potentiameter methods are not able to investigate. Specifically for C, the evaporation method seems to not capture the pores for ψ ≤ −50 kPa at all. In fact, lithotype C, having larger pores than M, loses water mainly due to gravity rather than evaporation. However, for M, which has fewer large pores, θ decreases mainly due to evaporation, and the evaporation method allows measurements of points for ψ ≥ −44 kPa. This explains the smaller gap between retention data points obtained by the evaporation method and the dewpoint potentiameter method for M compared to C.
It is clear that the evaporation method works better with M, that is, a fine-grained packstone, compared to C, a medium-grained grainstone, underlining that the effectiveness of the method also depends on the texture of the investigated media.
Overall, Figure 3 shows that the QSC is a unique method that measures a maximum θ value close to θs, hence close to the porosity value, with these rocks having all pores interconnected, as mentioned above [11]. Specifically, the maximum θ values measured by QSC, which are 0.420 m3 m−3 for C and 0.408 m3 m−3 for M, are almost equal to the porosity values, Φ = 0.432 and Φ = 0.410 for C and M, respectively. This is because, according to the QSC method, water is supplied to the sample continuously from the upper reservoir [18], thus keeping the θ value high in the sample before starting the runs in the centrifuge. Differently, the maximum θ values measured by the other methods are far from the θs value because of the water loss by gravity that occurs when handling the samples, in almost saturated conditions, during the preliminary sample preparation methods.
It is important to highlight that the visible gap between the retention data points obtained by the QSC and dewpoint potentiameter methods could be easily filled using different combinations, among various granular materials, of their thickness, angular speed, and run duration, so as to have data points covering the entire low ψ values range of WRCs, making the QSC method capable of measuring the rock WRC in the whole θ range [18].
By comparing the WRCs measured by all methods, it arises that, in the middle range, which corresponds to medium-sized pores, the two curves measured by QSC and evaporation methods do not overlap for ψ ≤ −3.92 kPa and θ ≤ 0.35 m3 m−3, especially for M. This discrepancy is due to the different way of measuring θ and ψ values in the mentioned methods. In fact, the evaporation method measures θ and ψ values quasi-continuously, whereas the QSC method measures (θ, ψ) pair values when the sample reaches equilibrium.
Furthermore, only the data points obtained by the QSC method show two inflection points that describe the bimodal behavior of both lithotypes by clearly reflecting the bimodal pore-size distributions shown in Figure 2.
It is advisable to consider the QSC method that, in comparison to the others, allows the measurement of a maximum water content θ close to θs to determine the WRCs in the whole θ range and capture the bimodality of the pore-size distribution of the studied rocks. This result implies future studies in order to test the QSC method with fractured rocks in order to verify its capability to capture multiple porosity scales of actual rocks and support numerical investigations with laboratory tests [24,25].
3.2. Fitting Functions and Statistical Parameters
The fitting and statistical parameters of the WRCs computed for each of the four models by HYPROP-FIT software are listed in Table 2.
Overall, the bimodal functions fit the retention data better than the unimodal ones. In fact, the RMSEθ for bimodal functions is always lower than the corresponding unimodal ones. Specifically, the goodness of fit is higher or equal for the bimodal PDI model compared to the bimodal vG one.
The RMSEθ is affected due to the non-equidistance of experimental points measured by the QSC method. In addition, since the greater the number of methods combined to determine WRCs, the greater the RMSEθ value, it is advisable to choose only one method among several that measure points in the same range of WRCs. This consideration suggests that either the evaporation or QSC data points should be used for a better fit.
Moreover, the RMSEθ is also affected by the data points measured by the suction table such that, by depicting the saturated range of WRCs with θ values lower than θs, the fitting is worse. For this reason, the suction table method should be avoided, thus reducing the experimental test time.
The HYPROP-FIT, chosen because it is an accurate and versatile software for fitting retention data by different methods, both in traditional and bimodal form, was proved to accurately fit the bimodality of the measured WRCs capable of describing hydraulic behavior across the full measurement range.
4. Conclusions
In this study, we measured the water retention curves of two lithotypes of carbonate porous rock by comparing, for the first time, four different methods and testing 34 samples. The outcomes demonstrated that the methods commonly used with soils are also applicable to rocks, adopting specific precautions. The retention data obtained by suction table, evaporation, QSC, and dewpoint potentiameter methods were combined to estimate rock water retention curves.
Each method enables one to cover a limited range of the WRC, except for the QSC, which is the only one capable of covering the entire water content range and obtaining a data point closest to the saturated water content value, θs. In addition, the QSC method is the only one able to capture the bimodal behavior of the tested media with respect to the others.
The efficiency of the method is affected by the texture of the tested rock such that the evaporation method works better with the M lithotype, which is a fine-grained packstone, compared to C, a medium-grained grainstone.
The experimental rock WRCs were fitted with HYPROP-FIT software by considering the unimodal and bimodal models of both vG and PDI functions.
Both bimodal vG and PDI models fit better than the unimodal ones, as corroborated by RMSEθ and AICc values.
The novelty of the study consists of the fact that the QSC method alone proved to be capable of measuring water retention data that allow for describing the hydraulic behavior of the tested porous rocks within the entire water content range, from saturation to very dry conditions. Future studies will aim to test the QSC method with fractured rocks to see if is applicable and useful to capture multiple porosity scales of actual rocks.
The HYPROP-FIT software, by allowing us to accurately fit the bimodality of measured WRCs, yields hydraulic parameters critical for the numerical modelling of flow and transport processes, allowing one to solve environmental and engineering issues.
Author Contributions
Conceptualization, M.C.C.; methodology, M.C.C. and A.C.T.; software, A.C.T.; validation, M.C.C. and A.C.T.; formal analysis, A.C.T.; investigation, M.C.C. and A.C.T.; resources, M.C.C. and L.D.C.; data curation, M.C.C. and A.C.T.; writing—original draft preparation, M.C.C. and A.C.T.; writing—review and editing, M.C.C., A.C.T. and L.D.C.; visualization, M.C.C., A.C.T. and L.D.C.; supervision, M.C.C.; project administration, M.C.C.; funding acquisition, M.C.C. and L.D.C. All authors have read and agreed to the published version of the manuscript.
Funding
This research was partially funded by the ITALIAN MINISTRY OF FOREIGN AFFAIRS AND INTERNATIONAL COOPERATION (MAECI) within the project “Predictive methods for unsaturated zone preferential flow in porous and fractured rock”.
Data Availability Statement
Not Applicable.
Acknowledgments
We are grateful for John R. Nimmo and Kim S. Perkins from the U.S. Geological Survey (USGS), for their support in carrying out the centrifugal measurements.
Conflicts of Interest
The authors declare no conflict of interest. The funders had no role in the design of the study; in the collection, analyses, or interpretation of data; in the writing of the manuscript; or in the decision to publish the results.
References
- Šimůnek, J.; Nimmo, J.R. Estimating soil hydraulic parameters from transient flow experiments in a centrifuge using parameter optimization technique. Water Resour. Res. 2005, 41, 9. [Google Scholar] [CrossRef] [Green Version]
- Rouxel, M.; Ruiz, L.; Molénat, J.; Hamon, Y.; Chirié, G.; Michot, D. Experimental Determination of Hydrodynamic Properties of Weathered Granite. Vadose Zone J. 2012, 11, vzj2011-0076. [Google Scholar] [CrossRef] [Green Version]
- Luquot, L.; Rötting, T.S.; Carrera, J. Characterization of flow parameters and evidence of pore clogging during limestone dissolution experiments. Water Resour. Res. 2014, 50, 6305–6321. [Google Scholar] [CrossRef]
- Rötting, T.S.; Luquot, L.; Carrera, J.; Casalinuovo, D.J. Changes in porosity, permeability, water retention curve and reactive surface area during carbonate rock dissolution. Chem. Geol. 2015, 403, 86–98. [Google Scholar] [CrossRef]
- Al-Mukhtar, M.; Beck, K.; Van, T.; Vanapalli, S. Water retention characteristics of two limestones. Geotech Spec. Pub. 2006, 147, 1833–1844. [Google Scholar] [CrossRef]
- Van Genuchten, M.T. A Closed-form Equation for Predicting the Hydraulic Conductivity of Unsaturated Soils. Soil Sc. Soc. Am. J. 1980, 44, 892–898. [Google Scholar] [CrossRef] [Green Version]
- Fredlund, D.G.; Xing, A. Equations for the soil-water characteristic curve. Can. Geotech. J. 1994, 31, 517–532. [Google Scholar] [CrossRef]
- Koubaa, Y.; Jamei, M.; Guiras, H. Hydro-mechanical properties of highly porous limestone rock used for historic monuments in North-East Tunisia. J. Civil Environ. Eng. 2018, 8, 11. [Google Scholar] [CrossRef]
- Pirastru, M.; Niedda, M. Field monitoring and dual permeability modelling of water flow through unsaturated calcareous rocks. J. Hydrol. 2010, 392, 40–53. [Google Scholar] [CrossRef]
- Lipovetsky, T.; Zhuang, L.; Teixeira, W.G.; Boyd, A.; Pontedeiro, E.M.; Moriconi, L.; Alves, J.L.D.; Couto, P.; van Genuchten, M.T. HYPROP measurements of the unsaturated hydraulic properties of a carbonate rock sample. J. Hydrol. 2020, 591, 125706. [Google Scholar] [CrossRef]
- Andriani, G.F.; Walsh, N. The effects of wetting and drying, and marine salt crystallization on calcarenite rocks used as building material in historic monuments. Geol. Soc. Lond. Spec. Publ. 2007, 271, 179–188. [Google Scholar] [CrossRef]
- Andriani, G.F.; Walsh, N. Petrophysical and mechanical properties of soft and porous building rocks used in Apulian monuments (south Italy). Geol. Soc. Lond. Spec. Publ. 2010, 333, 129–141. [Google Scholar] [CrossRef]
- Tropeano, M.; Sabato, L. Filling and cannibalization of a foredeep: The Bradanic Trough, Southern Italy. Geol. Soc. London Spec. Pub. 2002, 191, 55–79. [Google Scholar] [CrossRef]
- Turturro, A.C.; Caputo, M.C.; Gerke, H.H. Mercury intrusion porosimetry and centrifuge methods for extended-range retention curves of soil and porous rock samples. Vadose Zone J. 2021, 21, e20176. [Google Scholar] [CrossRef]
- Stakman, W.P.; Valk, G.A.; van der Harst, G.G. Determination of Soil Moisture Retention Curves, I, 3rd ed.; Institute for Land and Water Management Research: Wageningen, The Netherlands, 1969. [Google Scholar]
- Wind, G.P. Capillary conductivity data estimated by a simple method. In Water in Unsaturated Zone, Proceedings of the Wageningen Symposium; Rijtema, P.E., Wassink, H., Eds.; IASH Gentbrugge/UNESCO: Paris, France, 1968; Volume 1, pp. 181–191. [Google Scholar]
- Young, M.H.; Sisson, J. Tensiometry. In Methods of Soil Analysis. Part 4: Physical Methods; Dane, J.H., Topp, C.G., Eds.; SSSA: Madison, WI, USA, 2002; pp. 600–620. [Google Scholar] [CrossRef]
- Caputo, M.C.; Nimmo, J.R. Quasi-steady centrifuge method of unsaturated hydraulic properties. Water Resour. Res. 2005, 41, W11504. [Google Scholar] [CrossRef] [Green Version]
- Campbell, G.S.; Smith, D.M.; Teare, B.L. Application of a dew point method to obtain the soil water characteristic. In Experimental Unsaturated Soil Mechanics; Schanz, T., Ed.; Springer Proceedings in Physics: Berlin, Germany, 2007; Volume 112, pp. 71–77. [Google Scholar] [CrossRef]
- Priesak, E.; Durner, W. Closed-form expression for the multi-modal unsaturated conductivity function. Vadose Zone J. 2006, 5, 121–124. [Google Scholar] [CrossRef]
- Pertassek, T.; Peters, A.; Durner, W. HYPROP-FIT Software User’s Manual, V.3.0; UMS GmbH: München, Germany, 2015; 66p. [Google Scholar]
- Haghverdi, A.; Najarchi, M.; Öztürk, H.S.; Durner, W. Studying unimodal, bimodal, PDI and bimodal-PDI variants of multiple soil water retention models: I. Direct model fit using the extended evaporation and dewpoint methods. Water 2020, 12, 900. [Google Scholar] [CrossRef] [Green Version]
- Schneider, M.; Goss, K.U. Prediction of the water sorption isotherm in air dry soils. Geoderma 2012, 170, 64–69. [Google Scholar] [CrossRef]
- Yan, X.; Huang, Z.; Zhang, Q.; Fan, D.; Yao, J. Numerical Investigation of the Effect of Partially Propped Fracture Closure on Gas Production in Fractured Shale Reservoirs. Energies 2020, 13, 5339. [Google Scholar] [CrossRef]
- Zhang, Q.; Yan, X.; Li, Z. A mathematical framework for multiphase poromechanics in multiple porosity media. Computers and Geotechnics 2022, 146, 104728. [Google Scholar] [CrossRef]
Figure 1.
Macroscopic appearance of studied calcarenites: (a) lithotype C, medium-grained grainstone, and (b) lithotype M, fine-grained packstone. Microscopic appearance in plane-polarized light of thin sections: (c) Lithotype C and (d) lithotype M.
Figure 1.
Macroscopic appearance of studied calcarenites: (a) lithotype C, medium-grained grainstone, and (b) lithotype M, fine-grained packstone. Microscopic appearance in plane-polarized light of thin sections: (c) Lithotype C and (d) lithotype M.

Figure 2.
Pore-size distributions for the rock samples, C and M, measured by the mercury intrusion porosimetry (MIP) method expressed as (a) percentage of pore volume with respect to porosity; (b) specific pore volume (mL·g−1), that is the incremental pore volume occupied from the mercury during the MIP test (Turturro et al., 2021).

Figure 3.
Measured and fitted rock water retention curves of lithotypes C (a) and M (b).


Table 1.
Physical properties of rock lithotypes.
| Lithotype | C * | M * |
|---|---|---|
| Bulk density, ρb (g/cm3) | 1.50 | 1.56 |
| Particle density, ρp (g/cm3) | 2.65 | 2.65 |
| Porosity, Φ | 0.43 | 0.41 |
“Note(s): * C and M refer to the two lithotypes belonging to the Calcarenite di Gravina formation, collected in different quarry districts: Canosa and Massafra, respectively.
Table 2.
Fitted parameters values and statistical analysis for the vG and PDI unimodal and bimodal water retention functions. Fixed values are indicated by an asterisk (*).
Table 2.
Fitted parameters values and statistical analysis for the vG and PDI unimodal and bimodal water retention functions. Fixed values are indicated by an asterisk (*).
| Parameter (Unit) | C | M | ||||||
|---|---|---|---|---|---|---|---|---|
| Unimodal vG | Bimodal vG | Unimodal PDI | Bimodal PDI | Unimodal vG | Bimodal vG | Unimodal PDI | Bimodal PDI | |
| α (1/cm) | 0.028 | - | 0.0298 | - | 0.0329 | - | 0.0329 | - |
| n | 1.41 | - | 1.389 | - | 1.626 | - | 1.635 | - |
| θr (cm3/cm3) | 0.001 | 0.0001 | 0.001 | 0.0001 | 0.003 | 0.0001 | 0.008 | 0.0001 |
| θs (cm3/cm3) | 0.432 * | 0.432 * | 0.432 * | 0.432 * | 0.410 * | 0.410 * | 0.410 * | 0.410 * |
| w2 | - | 0.225 | - | 0.791 | - | 0.655 | - | 0.385 |
| α1 (1/cm) α2 (1/cm) | - | 0.0389 0.00117 | - | 0.00113 0.0391 | - | 0.5 0.0169 | - | 0.0165 0.5 |
| n1 n2 | - | 1.492 2.263 | - | 2.379 1.473 | - | 1.267 1.944 | - | 2.017 1.233 |
| RMSEθ | 0.016 | 0.0118 | 0.016 | 0.0118 | 0.0223 | 0.0207 | 0.0224 | 0.0207 |
| AICc | −1657 | −1773 | −1657 | −1774 | −1553 | −1577 | −1552 | −1578 |
Publisher’s Note: MDPI stays neutral with regard to jurisdictional claims in published maps and institutional affiliations. |
© 2022 by the authors. Licensee MDPI, Basel, Switzerland. This article is an open access article distributed under the terms and conditions of the Creative Commons Attribution (CC BY) license (https://creativecommons.org/licenses/by/4.0/).
Share and Cite
MDPI and ACS Style
Caputo, M.C.; De Carlo, L.; Turturro, A.C. HYPROP-FIT to Model Rock Water Retention Curves Estimated by Different Methods. Water 2022, 14, 3443. https://doi.org/10.3390/w14213443
AMA Style
Caputo MC, De Carlo L, Turturro AC. HYPROP-FIT to Model Rock Water Retention Curves Estimated by Different Methods. Water. 2022; 14(21):3443. https://doi.org/10.3390/w14213443
Chicago/Turabian StyleCaputo, Maria Clementina, Lorenzo De Carlo, and Antonietta Celeste Turturro. 2022. "HYPROP-FIT to Model Rock Water Retention Curves Estimated by Different Methods" Water 14, no. 21: 3443. https://doi.org/10.3390/w14213443
Note that from the first issue of 2016, this journal uses article numbers instead of page numbers. See further details here.