

The Municipal Water Quality Investigations Program: A Retrospective Overview of the Program’s First Three Decades

1
Tetra Tech, Lafayette, CA 94549, USA
2
Independent Researcher, La Verne, CA 91750, USA
3
Palencia Consulting Engineers, Fullerton, CA 92835, USA
*
Author to whom correspondence should be addressed.
Water 2022, 14(21), 3426; https://doi.org/10.3390/w14213426
Submission received: 10 September 2022
/
Revised: 14 October 2022
/
Accepted: 22 October 2022
/
Published: 28 October 2022
(This article belongs to the Special Issue Decision Support Tools for Water Quality Management)
Abstract
:This paper presents the history and evolution of the California Department of Water Resources’ Municipal Water Quality Investigations (MWQI) program. This program tracks source water quality in the Sacramento–San Joaquin Delta (Delta) for drinking water supply for nearly two-thirds of California. The program provides early warning of changing conditions in source water quality, provides data and knowledge-based support for operational decision making, and provides scientific support to a variety of urban water users. This retrospective (i) documents program formation, (ii) describes its evolution in response to regulations and technological advances in water treatment and field monitoring, and (iii) notes how the development of federal drinking water quality regulations such as the Disinfection By-Products Rule impacted the program. The MWQI program is believed to be the first drinking water supply program in the United States to conduct continuous, real-time monitoring of organic carbon, bromide, and other anions and to report these data on the internet. In addition to its regular use for operational decision making, the data may be used for evaluating long-term trends and responses to specific changes in the Delta and its watershed. Future program directions will likely be guided by factors that may trigger changes in treatment plant processes and operations, such as emerging contaminants, changes in land and water management practices, permanent Delta island flooding, sea level rise, and climate change. While this retrospective focuses on one region, its multi-decade interplay of science, treatment and monitoring technology, and regulations (as well as practical aspects of managing such a large-scale program) are broadly relevant to professionals engaged in drinking water quality management in other urbanized and developed regions of the world.
1. Introduction
Estuaries, which provide freshwater for drinking water consumption and agricultural production, have historically served as outstanding locations for human communities. Estuaries provide access to both rivers and oceans, thereby enhancing opportunities for trade and communication [1]. Because they are highly productive, estuaries have also been an important food source for human habitation [2]. In fact, the earliest civilizations in the world developed around estuaries. Many modern cities have grown near estuaries, including Jakarta, New York City, and Tokyo. Of the 32 largest cities in the world in the early 1990s, 22 were located on estuaries [3].
Estuaries, by definition, exhibit a water quality spectrum between seawater and riverine that varies with freshwater inflows and geometry [1]. The riverine ends of estuaries are often used as drinking water resources for the communities that have grown around them. However, because of the proximity to population centers, these waters tend to exhibit high concentrations of nutrients, pathogens, and other contaminants (in addition to ocean-derived salts and organic matter from contributing watersheds), which create a challenge to drinking water suppliers that treat such waters for human consumption.
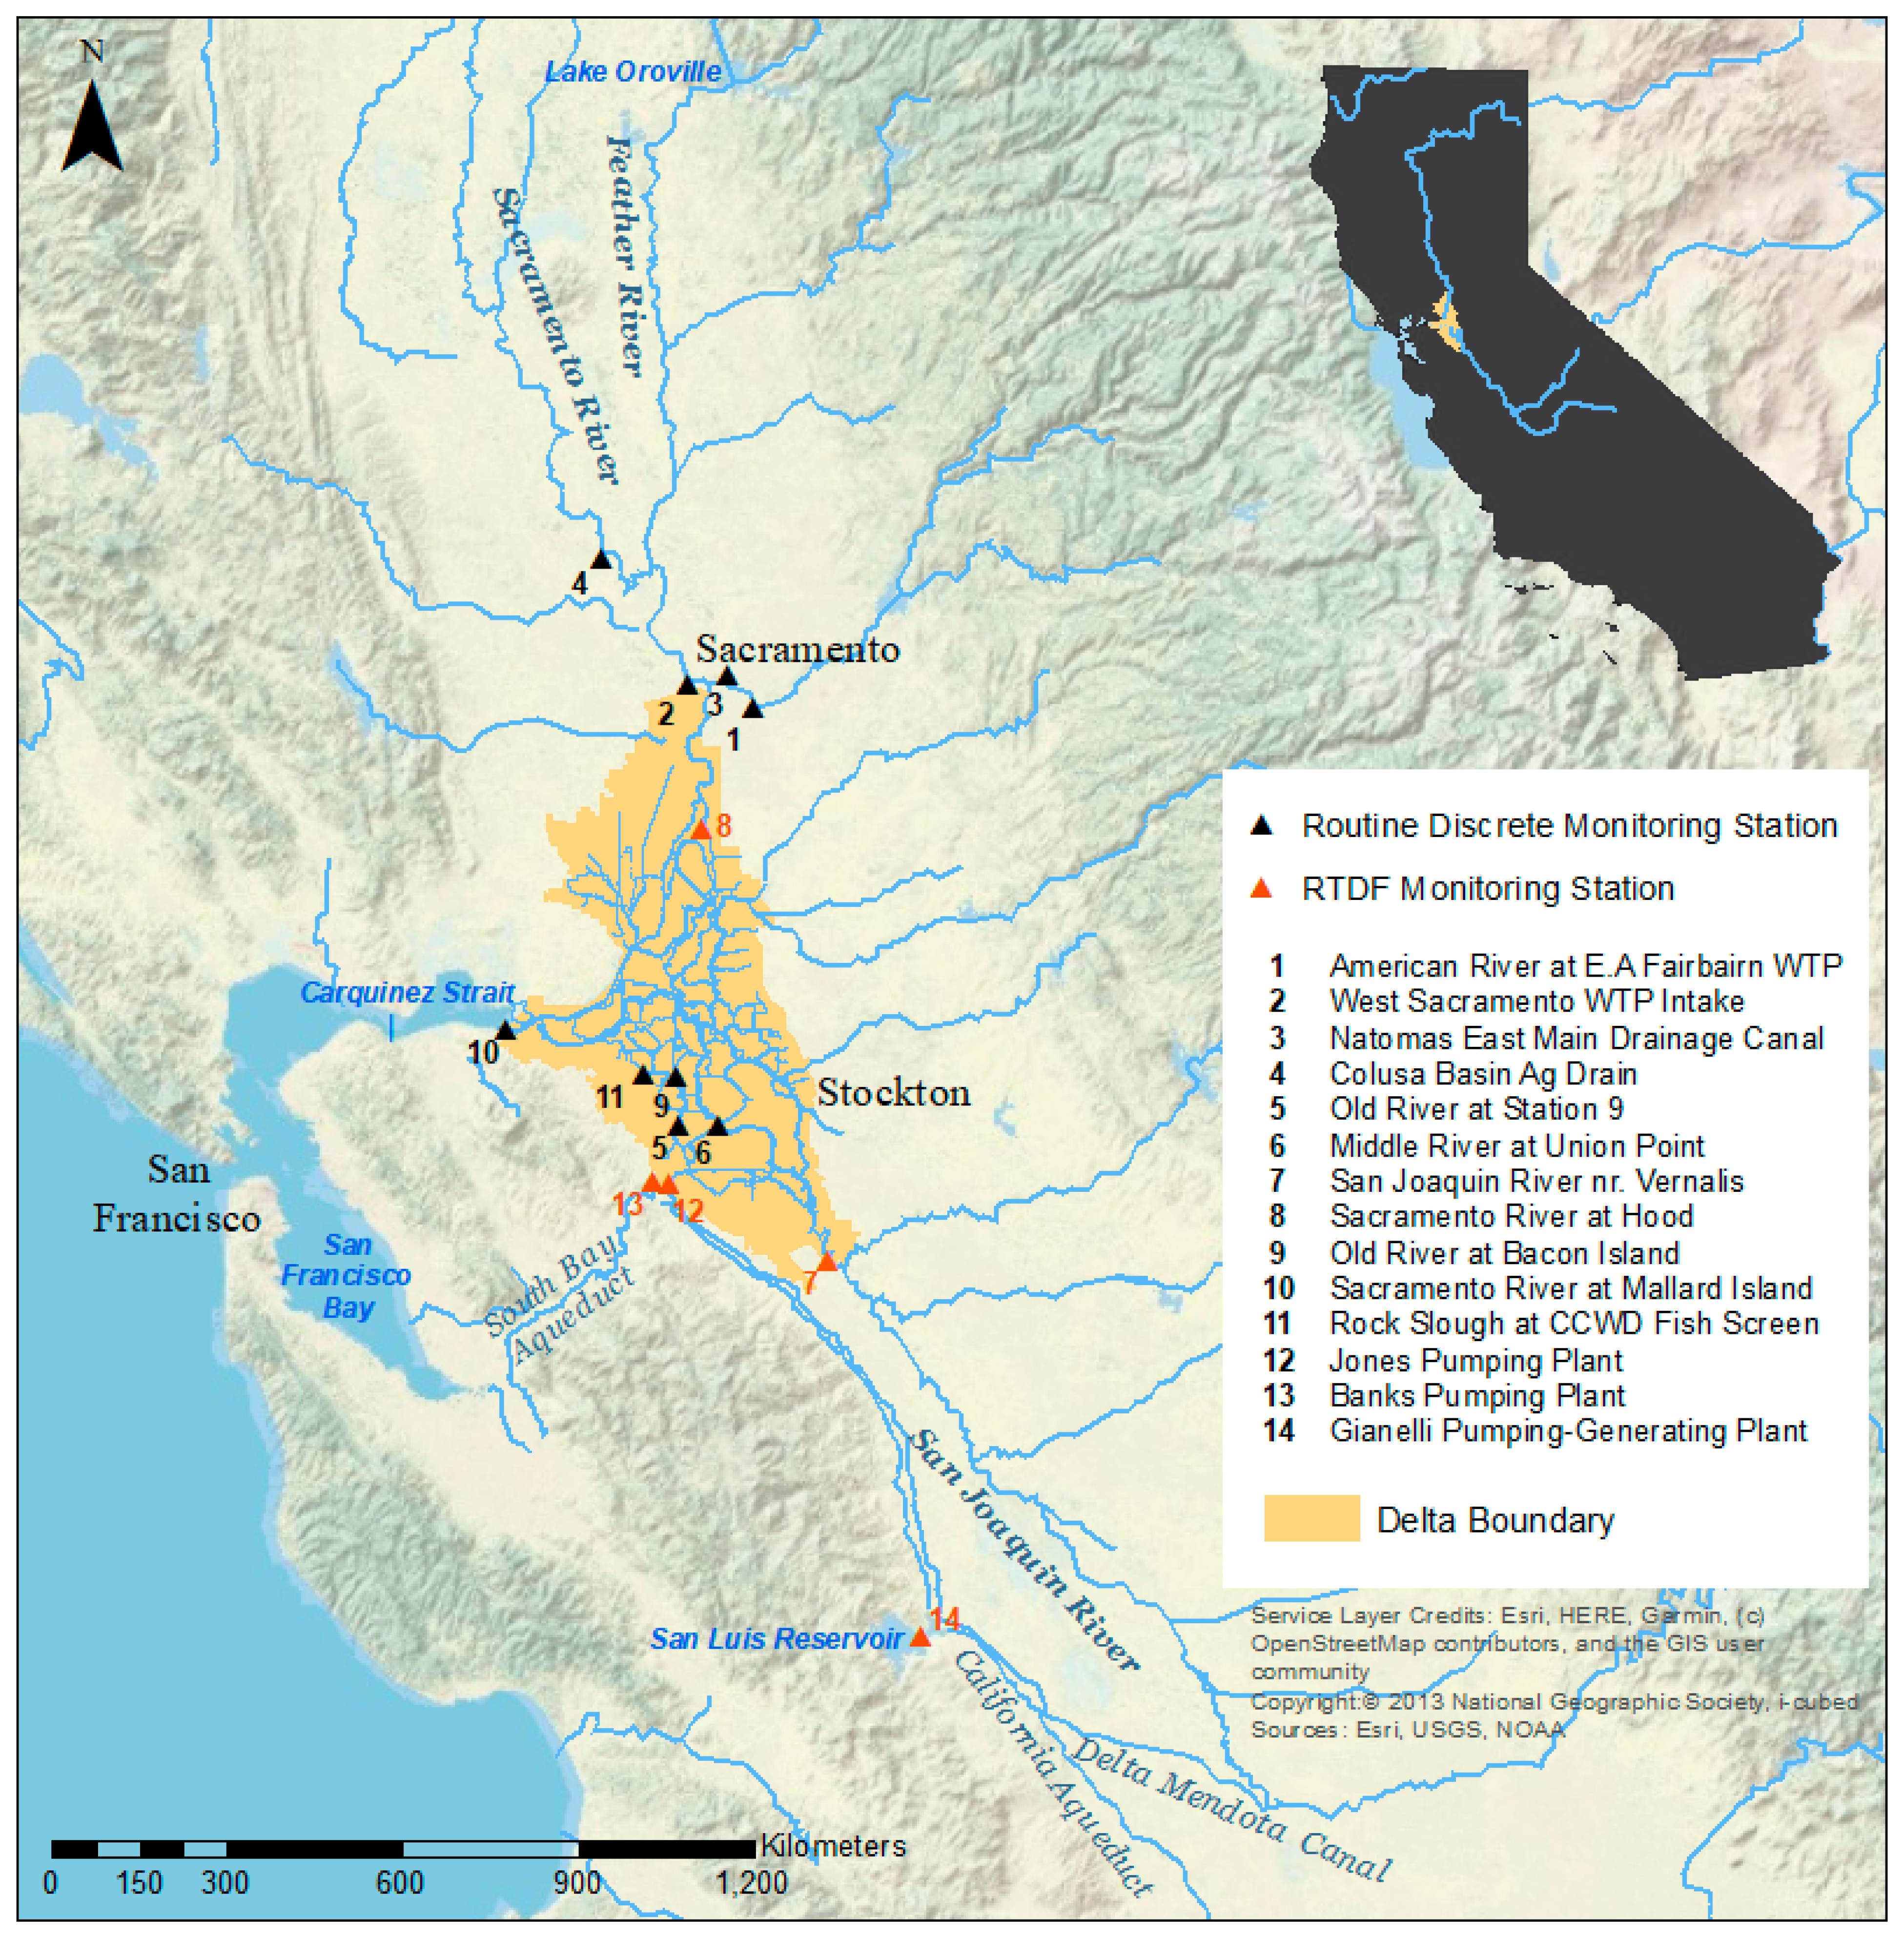
The San Francisco Estuary, including the delta formed by the Sacramento and San Joaquin Rivers (hereafter Delta) (Figure 1), plays a major role in California’s prosperity and is shaped by the large population centers that have developed around it. In addition to serving as an important habitat to more than 750 animal and plant species [4], the Delta is the largest single water supply source in California and its waters are transported across river basin boundaries to support major urban and agricultural centers in the state. To accomplish these inter-basin transfers, large water projects were constructed in the 1940s by the federal government (i.e., the Central Valley Project or CVP) and in the 1960s by the State of California (i.e., the State Water Project or SWP) [5]. These projects consist of a network of dams in upper elevations of the Delta watershed, combined with aqueducts and pump stations for long-range conveyance. The CVP generally serves agricultural water users, whereas the SWP is primarily devoted to municipal supply (approximately 70%). The largest source of SWP water is the Feather River, which is impounded by Lake Oroville [5]. SWP water, exported from the Delta via the California, North Bay, and South Bay Aqueducts for irrigation and municipal use [6], is allocated through long-term contracts to 29 water agencies (termed “contractors”) who are responsible for water delivery to communities and irrigation districts within their jurisdiction [5]. Allocations are developed by the California Department of Water Resources (CDWR) early in each water year (which begins on 1 October) and updated as additional hydrologic information becomes available. Releases from Lake Oroville are managed by CDWR for water exports and to meet various water quality standards in the Delta, notably standards mandated to limit the intrusion of saline water [7]. The SWP is one of the largest water conveyance systems in the world, with an average of 2.9 million acre-feet of water delivered annually in the decade ending in 2016 [5].
Collectively, Delta exports from the SWP and CVP support a $32 billion agricultural industry and serve as an important source of drinking water to almost 27 million residents [4]. Saltwater intrusion was one of the earliest water quality concerns for human uses of Delta water. In 1920, the City of Antioch sued upstream irrigators to protect the city’s intake from salinity intrusion [8,9]. In response to this lawsuit, the State of California implemented a monitoring program and published the first authoritative review of Delta salinity and its control in 1931 [10]. Early plans envisaged control of Delta salinity by means of storage regulation on the Sacramento River [10] and a saltwater barrier in the estuary near Carquinez Strait (see Figure 1) [8,11]. Later, as part of the SWP planning process, the California Water Plan [12] and subsequent investigations considered re-routing low salinity Sacramento River flows through and around the Delta (see additional discussion in [8]).
Water quality concerns broadened over time to include a suite of chemical constituents related to natural and anthropogenic sources in the Delta and its watershed. Water quality management in the Delta occurs through a complex framework of federal and state laws, such as the Clean Water Act (1973), the state Porter-Cologne Water Quality Control Act (1969), and the Safe Drinking Water Act (1974), with the goals of supporting beneficial uses for ecosystems, municipal use, and agricultural use. Here, we focus on a program that has evolved to track a subset of constituents in Delta waters that are of concern from the standpoint of drinking water supply.
Since the late 1970s and early 1980s, Delta water quality concerns have included natural organic matter (NOM) [13] and bromide [14]. NOM and bromide are persistent in Delta waters due to agricultural return flows from the region’s organic peat soils and seawater intrusion, respectively. NOM promotes the formation of trihalomethanes (THMs) and other carcinogenic disinfection by-products (DBPs) when Delta waters are chlorinated during drinking water treatment [15,16]. In the presence of bromide, brominated DBPs are also formed [17]. Bromine-containing DBPs are of greater health concern than their chlorine-containing analogs [18]. In addition, the estuary receives wastewater discharges from more than 9 million people along its periphery and other pollutant loads (including pesticides, herbicides, and nutrients) from the developed watersheds upstream [19,20].
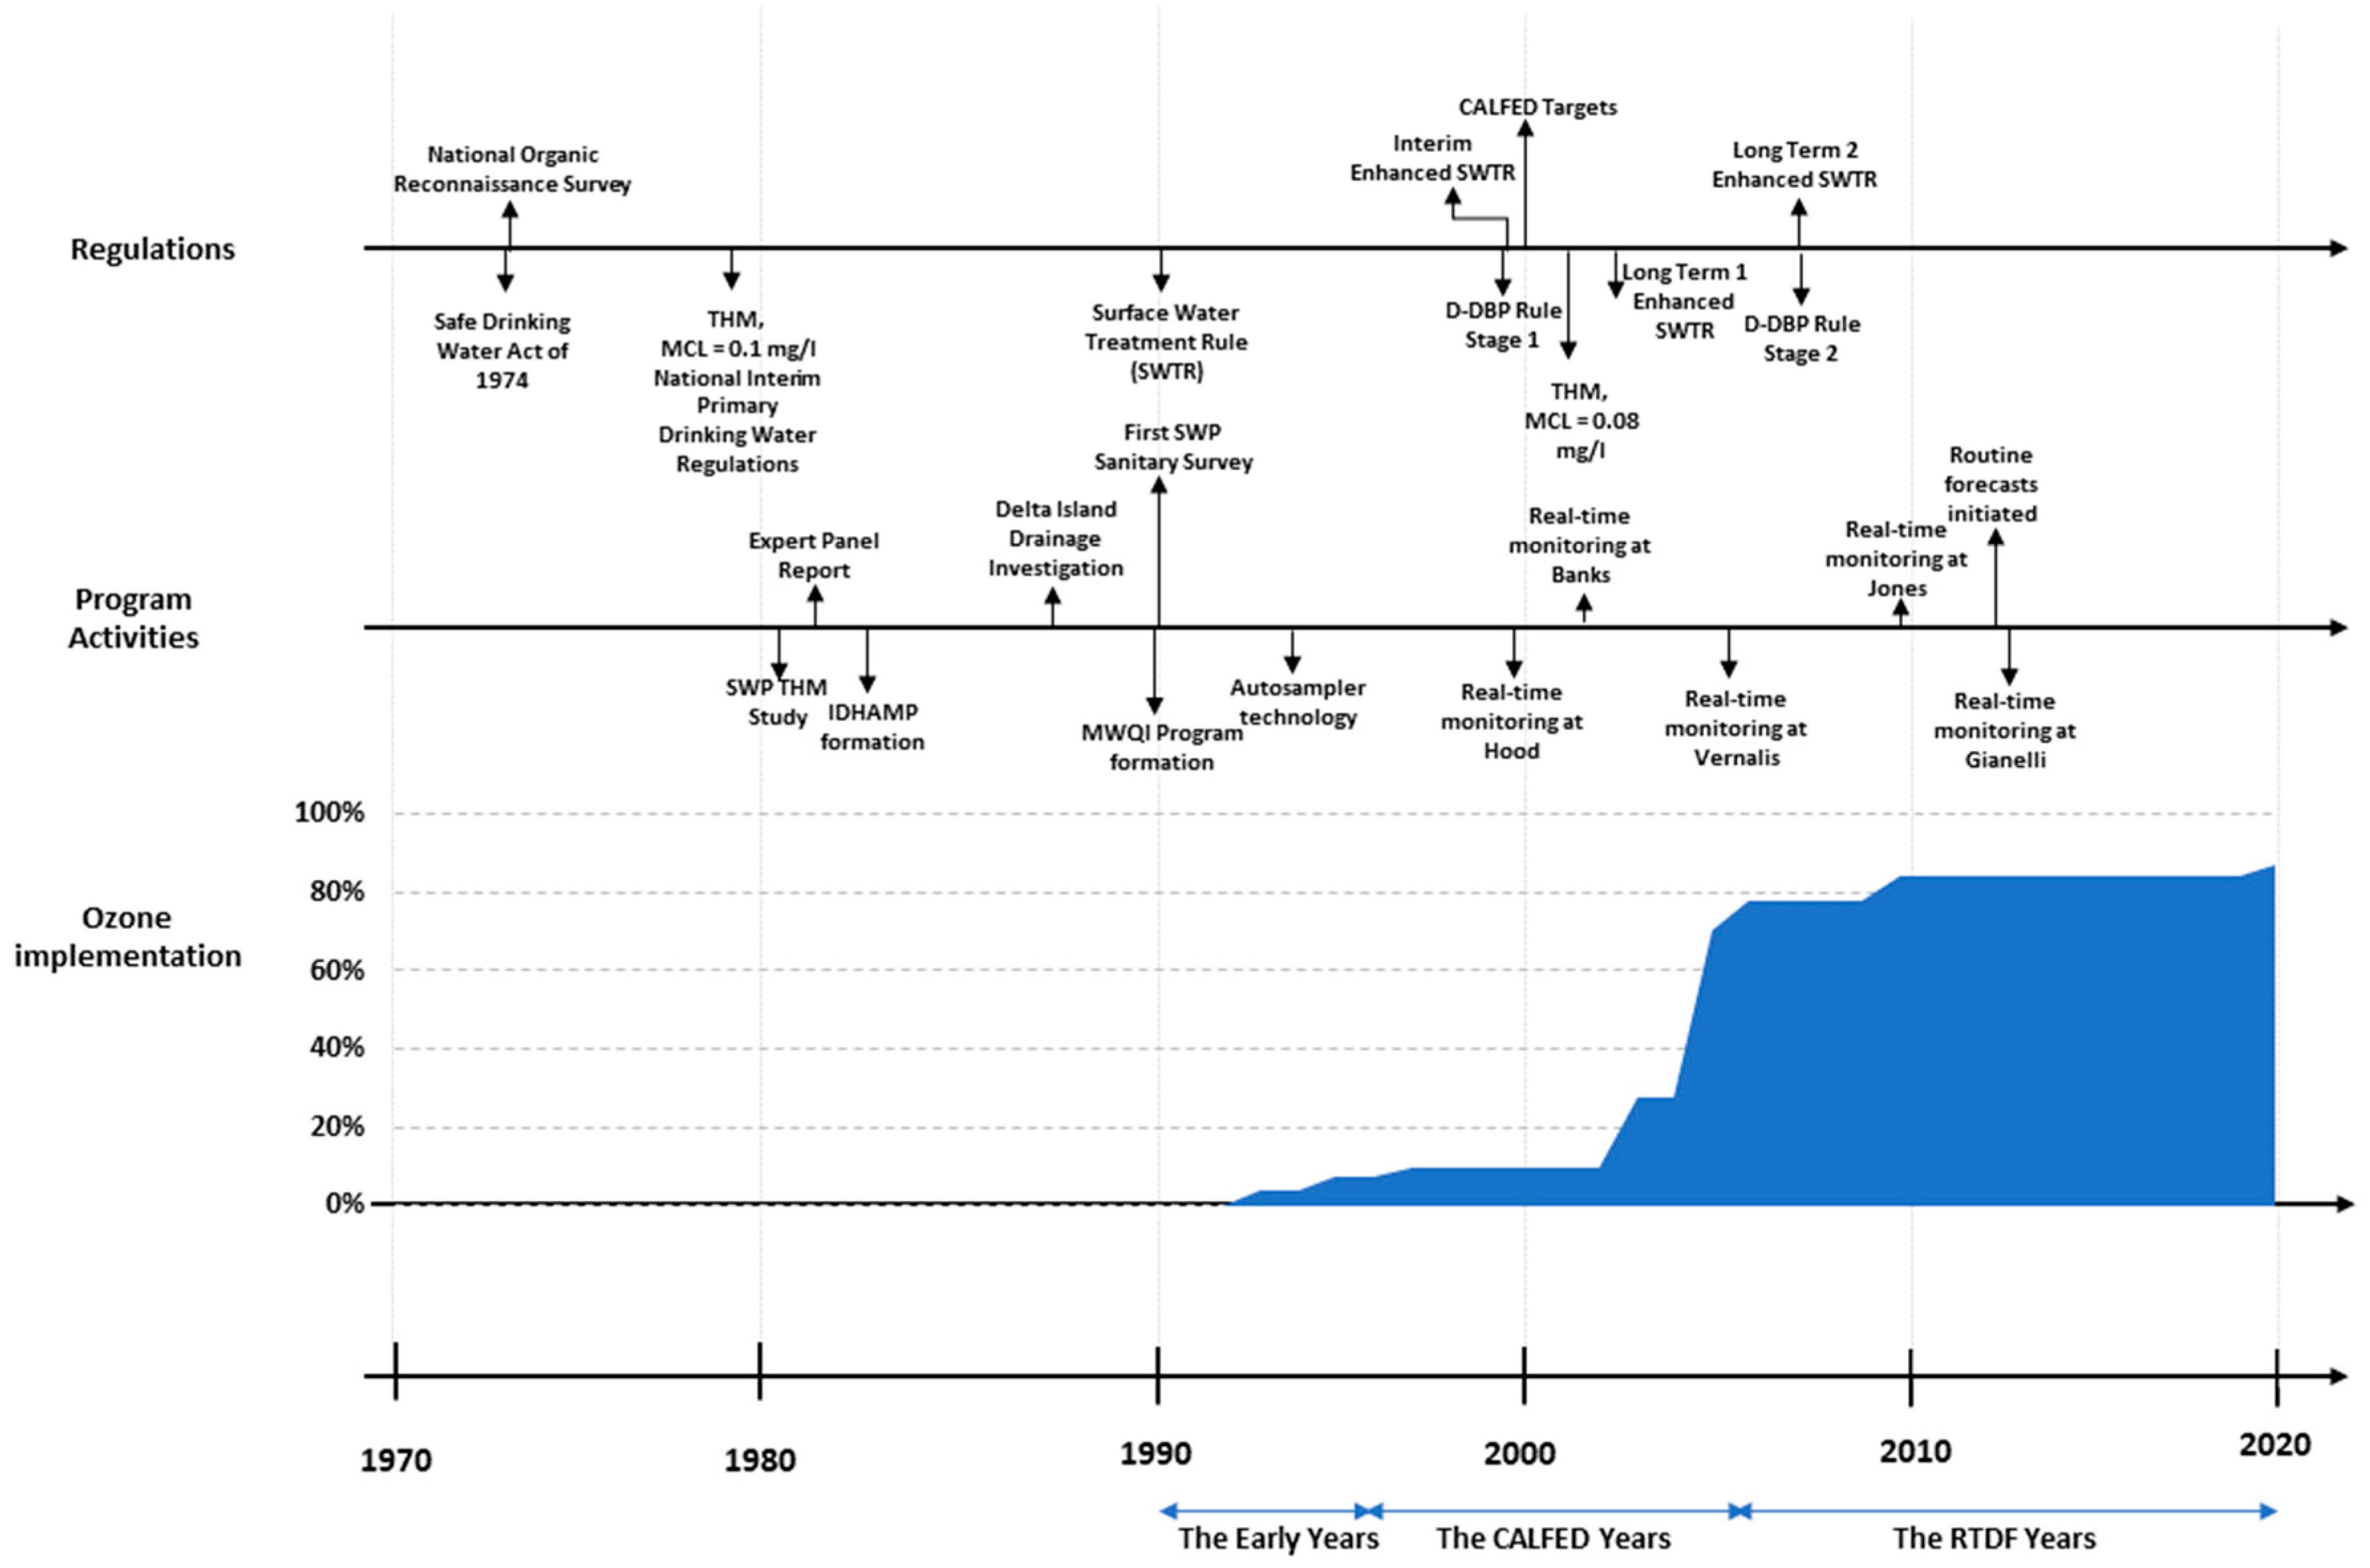
Given this confluence of factors, water quality in the estuary related to constituents of drinking water interest has been extensively studied (e.g., [13,15,21,22,23,24]). Among all state and local agencies monitoring water quality in the Delta and its tributaries, CDWR’s Municipal Water Quality Investigations (MWQI) program is the most extensive and cohesive program established to investigate the quality of Delta source water with respect to its suitability for production of drinking water. MWQI program elements have evolved over three decades in response to advances in science, water treatment technology and regulations, and emerging contaminants, paralleling major investments made by local water supply agencies (Figure 2).
The primary objective of this paper is to provide a retrospective overview of CDWR’s MWQI program, highlighting its evolution in response to changing understanding of Delta water quality water constituents, regulatory drivers, and new technologies. It is not our intention to provide a subjective critique of the program’s perceived utility, benefits, successes, and/or failures. This retrospective builds on a prior summary of the program’s history [25] with a focus on program evolution and its utility to SWP operations, drinking water quality regulators, and organizations responsible for municipal water supply. Here, we describe the program, including purpose, organization and funding, and key elements. This description is followed by a historical account of the program origin, which can be traced back to federal and state regulatory activities in the 1970s and early studies by CDWR and other state and local agencies in the 1980s. We then chronicle how the program evolved from its formation in 1990 to its current configuration. We conclude this paper with a discussion of key program accomplishments and future directions. This paper is focused on program-level activities, rather than specific study results or interpretation of data collected through the program. Although this paper focuses on one region, its multi-decade interplay of science, treatment and monitoring technology, and regulations (as well as practical aspects of managing such a large-scale program) are broadly relevant to professionals engaged in drinking water quality management in other urbanized and developed regions of the world.
2. Program Description
The MWQI program supports the use of SWP water for municipal supply through monitoring, forecasting, and reporting of Delta and SWP water quality data. The program provides early warning of changing conditions in source water quality, provides data and knowledge-based support for SWP operational decision-making, and provides scientific support to CDWR, water contractors, and other governmental entities.
2.1. Program Organization & Funding
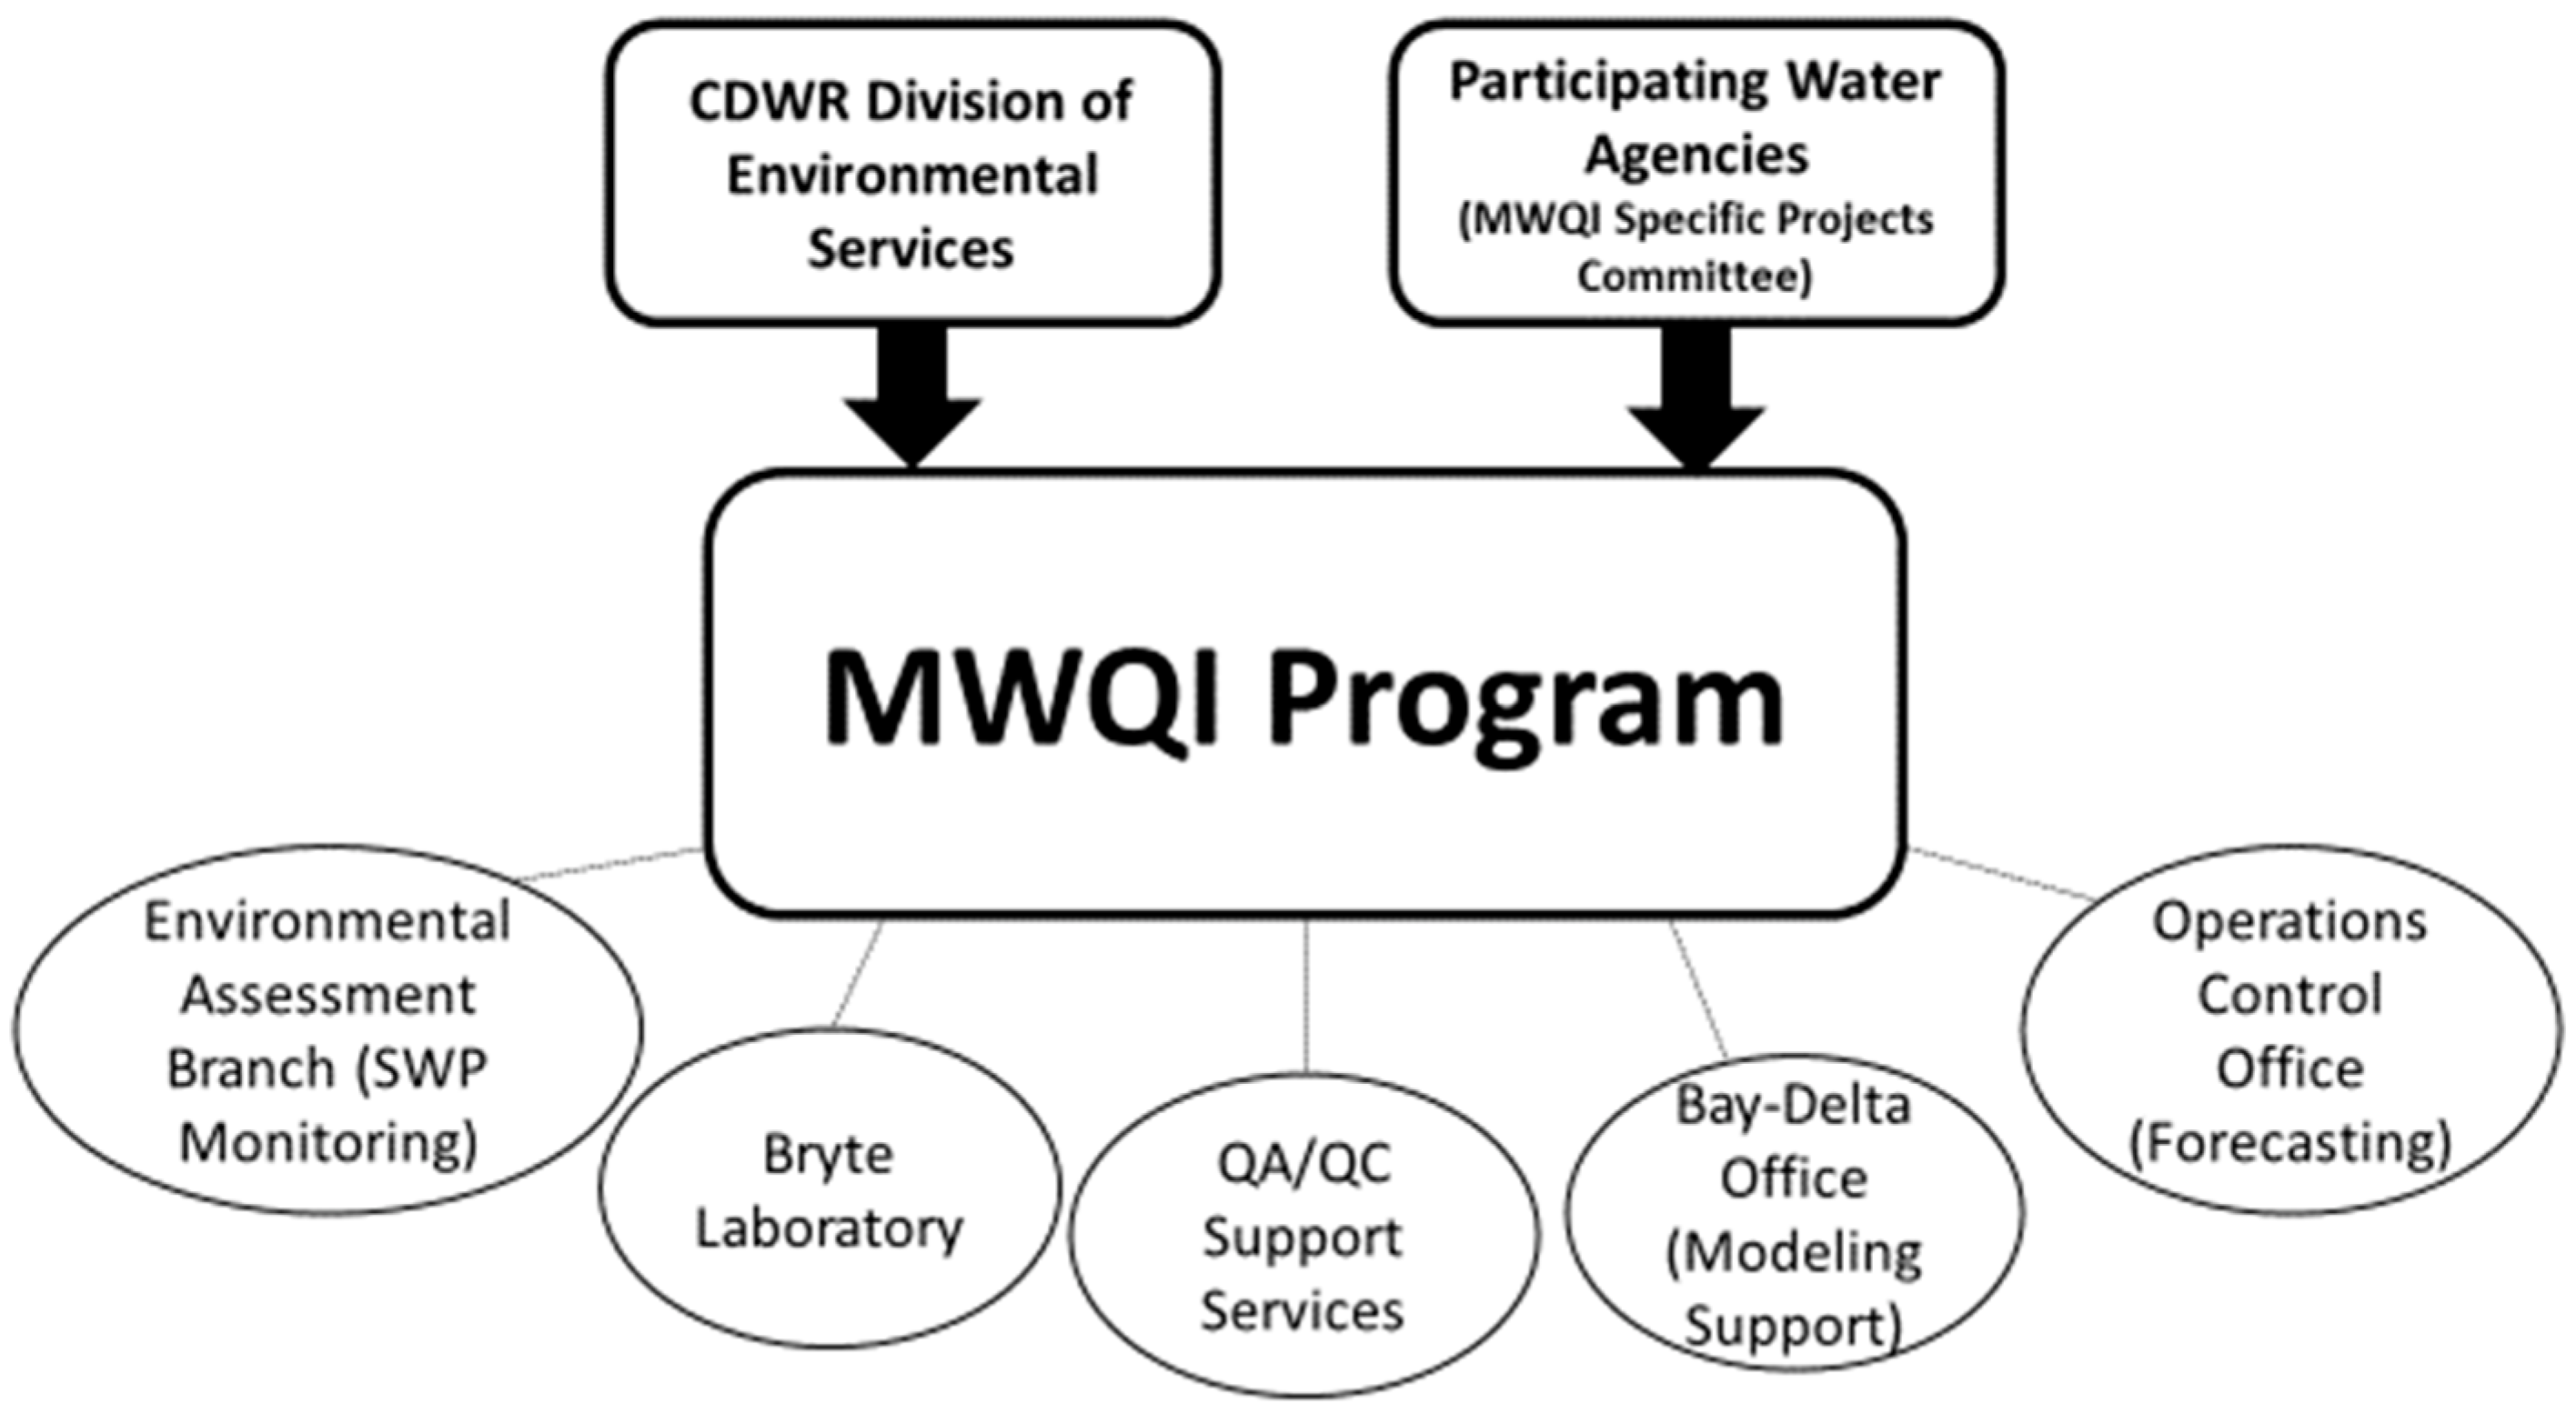
The MWQI program activities include water quality monitoring, water quality forecasts, and data management. Data generated by the MWQI program, along with related data generated by other programs, are distributed via daily and weekly electronic reports at: http://rtdf.info/ (accessed on 8 October 2022). Program staff administer tasks such as data quality assurance and quality control and participate in other multi-agency water quality management activities across the Delta. MWQI program organization is shown schematically in Figure A1 (see Appendix A) and includes support from groups within CDWR that perform monitoring, laboratory analysis, and modeling. The MWQI program budget was approximately $3.1 million in 2020 [26]. CDWR manages the MWQI program with input and funding from participating urban water agencies.
2.2. Program Elements
In its early years, the focus of MWQI was to establish and maintain a discrete or grab-sample monitoring program that could identify sources of contaminants to the Delta, elucidate how contaminants from each source are transported through the system, and evaluate how they affect concentrations at drinking water intakes. Program data were used to build scientific understanding and to inform a variety of regulatory efforts such as SWP watershed sanitary surveys. As the program evolved, its scope has expanded to include real time data collection, water quality forecasting, and targeted scientific studies.
2.3. Watershed Sanitary Surveys
Watershed sanitary surveys are required under the California Surface Water Treatment Rule (SWTR) and are submitted to the CSWRCB’s Division of Drinking Water, formerly the California Department of Public Health and the California Department of Health Services. In February 1988, the California Department of Health Services requested that a sanitary survey of the SWP be conducted to enable Department of Health Services and water agencies treating SWP water to appraise the effectiveness of the operation of existing water treatment plants and to adequately evaluate new treatment plant design requirements. The SWC decided to conduct a single survey of the entire SWP watershed rather than conducting independent surveys when they applied for new water supply permits or amended existing permits. As a result, SWP watershed sanitary surveys cover almost two thirds of the State of California, starting with the upper reaches of the Sacramento and San Joaquin River watersheds and extending to the terminal reservoirs of the SWP in southern California. Since 1990, SWP watershed sanitary surveys have nominally been conducted every five years; this 1990 survey and its updates are summarized in Table A1 (see Appendix A).
3. Program Genesis
As far back as the early 20th century, salinity and inorganic constituents have been the primary constituents of concern in the municipal and agricultural beneficial uses of Delta source waters. Federal legislation in the 1970s, including the Clean Water Act of 1972 [27] and the Safe Drinking Water Act of 1974 [28] led to the regulation of a broad range of water quality constituents of concern in drinking water supplies and in treated drinking water. Coincident with this period, researchers demonstrated the formation of THMs during chlorination [29,30], a conventional treatment process for disinfecting drinking water. Later investigations suggested a potential relationship between THM occurrence and increased incidence of cancer among exposed populations [31]. In 1979, the USEPA promulgated a maximum contaminant level (MCL) of 100 µg/L for total THMs [32].
3.1. SWP THM Study
In anticipation of this new federal THM regulation, the California Department of Health Services (now CSWRCB’s Division of Drinking Water), Contra Costa Water District, and the Metropolitan Water District of Southern California conducted independent studies of Delta source waters [14,33]. These studies found that Delta source waters had significant potential to produce THMs when chlorinated as part of conventional water treatment processes. Furthermore, these studies found that treated Delta waters, especially during drought conditions when bromine-containing THMs sharply increased, could exceed the MCL established under the 1979 regulation. These findings led to questions concerning the sources and magnitudes of THM precursors in the SWP and the possible benefits of a peripheral canal or other through-Delta conveyance facility in reducing precursor concentrations in the SWP. To answer these and other questions, CDWR conducted a study from September 1981 to January 1982 to determine the sources of THM precursors in the Sacramento River, Delta, and the SWP [33]. This study, which confirmed high concentrations of THM precursors in Delta source waters, concluded that waters exported from the southern Delta are higher in THM-producing substances than are waters tributary to the northern Delta. Specifically, the study identified Delta island agricultural drainage and seawater intrusion as key contributors of NOM and bromide, respectively, in southern Delta channels and drinking water intakes. Because Delta island peat soils are rich in NOM, they are high in THM precursors [13,21]. The drainage from these islands is higher in THM precursors than the channel waters. Because seawater is very high in bromide, seawater intrusion significantly raises the level of bromide in Delta water [15]. Chlorination of bromide forms bromine, which is more reactive in forming THMs than chlorine [34]. Moreover, bromine-containing THMs weigh more than chlorine-containing THMs, a significant fact given that the MCL is regulated on a weight-based total. Confirming earlier work, the study concluded that a peripheral canal would provide a source water to the SWP with reduced concentrations of THM precursors relative to baseline conditions. The report recommended that a monitoring program be initiated for the measurement of THM formation potential in the Delta and the SWP [33]. Formation potential, an indicator of precursor levels under laboratory conditions, does not measure formation under full-scale water treatment operations.
3.2. Expert Panel Report
Motivated by the findings of its SWP THM study [33], CDWR assembled an independent expert panel in 1982 to evaluate the consequences of using Delta source waters for domestic purposes. Panel findings were documented in a report [35] and are summarized here. The panel concluded that:
The current Delta water monitoring program… was developed primarily to monitor quality from an ecological perspective specifically directed towards fishery resources and not to assess human health aspects with respect to drinking water. The program as presently constituted… is not entirely adequate to assess the present or projected suitability of these waters as a source of drinking water supply [35].
The panel opined that drinking water quality “… should be given a much higher priority in decisions about the Delta.” While some of the panel members believed that the traditional public health practice of obtaining drinking water from the best source available should be adhered to (providing support for a peripheral canal), other panel members believed that advanced water treatment could provide adequate public health protection. The panel unanimously agreed that public health should be more broadly considered in decisions about Delta water management.
The expert panel recommended that a monitoring program be initiated to identify the sources of drinking water contaminants in the Delta (e.g., THM precursors, sodium, asbestos, pesticides, and heavy metals), how contaminants are transported through the system, and how contaminant sources impact water quality at drinking water diversions. Furthermore, the panel recommended that information from the monitoring program be incorporated into a comprehensive modeling framework that would support public health decision-making as it related to Delta water management.
3.3. Interagency Delta Health Aspects Monitoring Program
The expert panel recommendation was implemented by CDWR in July 1983 with commencement of the Interagency Delta Health Aspects Monitoring Program (IDHAMP) [36,37,38,39]. The program, initially established as an 18-month investigation (and subsequently extended), was conducted in cooperation with the U. S. Bureau of Reclamation, the City of Stockton, East Bay Municipal Utility District, Contra Costa Water District, and several SWP water contractors.
Program participants provided funding as well as technical guidance through a standing committee, with participation by other relevant parties such as the California Department of Public Health and the CSWRCB. The program initially focused on monitoring drinking water quality contaminants identified in the expert panel report [35]. Monthly samples were collected from 15 to 18 stations in areas representing urban drinking water diversions, Delta inflows, in-Delta agricultural drainage, in-Delta channels and sloughs, and the Sacramento–San Joaquin River confluence. As analytical methods became more sophisticated, new and previously unidentified water quality concerns emerged and were monitored by the program, including selenium in the San Joaquin River watershed, rice herbicides in the Sacramento River watershed, and insecticides and waterborne pathogenic protozoa (Giardia and Cryptosporidium) in both watersheds [25].
3.4. Delta Island Drainage Investigation
Data collected under IDHAMP showed high THM formation potential in Delta island drainage. Delta island drainage refers to return flows collected from lands in the Delta and pumped into surrounding channels. Pumping of drainage is needed because organic-rich soils in the Delta lowlands are subsided relative to water levels in surrounding channels. Motivated by this finding, the Delta Island Drainage Investigation was initiated in 1987 to assess the impacts of Delta island drainage on the quality of drinking water supplies taken from the Delta [39]. Goals of the investigation were to (i) evaluate the quality and quantity of island drainage, (ii) identify processes that affect quality and quantity of island drainage, (iii) determine potential impacts of island drainage on water quality in Delta channels and at drinking water supply intakes, and (iv) explore potential mitigation strategies.
The investigation concluded that Delta island drainage had a higher potential to form THMs than water from Delta channels. While THM formation potential was found to vary from island to island, in general, drainage was found to have four times greater THM formation potential than Delta channel samples. Based on mass balance calculations, island drainage was estimated to contribute 40–50% of the THM formation potential in Delta waters during periods of irrigation and winter leaching [39]. Amy et al. [13], in conjunction with CDWR, corroborated the investigation’s conclusion that Delta island drainage has a higher THM formation potential relative to the surrounding Delta channels. Through investigation of the chemical composition of water samples, the authors found distinct differences between Delta island drainage and channel waters, with drainage samples exhibiting higher average molecular weights. Amy et al. [13] also conducted a mass balance analysis and concluded that, on average, island drainage could contribute as much as 20% of the THM formation potential found in the SWP.
3.5. Formation of the MWQI Program
Local water agencies, recognizing that source water quality improvements would have significant consumer cost and public health benefits, commissioned a study to evaluate various Delta water management alternatives for meeting existing and proposed state and federal drinking water quality standards [40]. In addition to placing more stringent requirements on water treatment, the Surface Water Treatment Rule (SWTR) [41] promulgated by USEPA also emphasized watershed protection. Robbins et al. [42] concluded that, based on a national survey of surface water systems, a three-tiered approach that combines watershed controls, reservoir management, and water treatment is often necessary to meet public health objectives for drinking water protection. Arriving at a similar conclusion for the Delta water supplies, Krasner et al. [15] advocated DBP control strategies that included watershed management in addition to water treatment components.
As fundamental understanding of Delta source water quality issues coalesced (based on data made available through the various independent efforts of the 1980s) and regulatory pressures mounted, the need for a unified program to provide water quality data in support of management decisions affecting Delta water supplies was identified. The SWP water contactors, regarding IDHAMP as a model of interagency cooperation and a successful vehicle for public health decision support, requested that CDWR create a standing program that would provide information on known and emerging threats to drinking water quality [25]. Responding to this request, CDWR initiated the MWQI Program in 1990, unifying activities being conducted under IDHAMP and the Delta Island Drainage Investigation [43].
4. Program Evolution
The MWQI program was established as a flexible and pro-active collaboration between CDWR and participating water agencies to address new concerns as they arise [25]. Accordingly, the program has evolved in response to regulatory drivers, technology innovations, and an ever-increasing knowledge base. Here, we chronicle the evolution of the MWQI program by distilling the past 30 years into three eras: the early years (1990–1995), the CALFED years (1996–2005), and the RTDF years (2006–present). The CALFED Bay-Delta Program, a cooperative state-federal planning effort created as part of the 1994 Bay-Delta Accord [8,16], was tasked with developing a 30-year plan that addressed key problem areas in the Delta, including water quality. Although this goal was not achieved under the expired CALFED program, the Delta Stewardship Council (a state agency stemming from the CALFED program and created under the 2009 Delta Reform Act) developed a plan for the long-term management of the Delta’s water and environmental resources [4].
4.1. Defining Baseline Conditions: The Early Years (1990–1995)
In 1990, CDWR merged IDHAMP, the Delta Islands Drainage Investigation, and other drinking water quality activities into the MWQI Program. The primary goal of this newly formed program was to assist water agencies in protecting and improving Delta drinking water supplies and to guide research on optimal water treatment processes. In the early years of the MWQI program, nominally between 1990 and 1995, this goal was achieved through continuity and expansion of previous monitoring activities (including monitoring key Delta channel and river stations and agricultural drains for constituents such as pesticides, arsenic, selenium, sodium, and THM formation potential) to characterize baseline conditions in the Delta. Efforts to fully characterize baseline conditions were confounded by persistent drought conditions: California endured a severe six-year drought spanning 1987–1992 with a brief return to drought in 1994. During this period, following a recommendation from the 1982 expert panel report [35], the MWQI program expanded efforts to incorporate information from the monitoring program into a comprehensive modeling framework. Finally, during this period, the program conducted its first SWP watershed sanitary survey. A summary of these early activities is provided below.
4.1.1. Water Treatment Technology and Regulations
During this period, THMs were the only regulated category of DBPs. However, new USEPA regulations were anticipated—i.e., the DBP Rule [44,45]—prompting water agencies to initiate research on advanced water treatment technologies such as ozonation [46] or granular activated carbon (GAC) adsorption [47] and to expand testing for additional DBPs [48] in their finished waters. At the time, chlorine and chloramines were generally the preferred primary and secondary disinfectants, respectively, because of relatively low cost, control of THM formation (significantly reduced during post-chloramination) [49], and high effectiveness in controlling bacterial growth in water distribution systems. Among the water agencies participating in the MWQI program, most were employing these conventional water treatment technologies during the early years of the MWQI program; less than 10 percent of the combined treatment capacity of the agencies employed ozonation (Figure 2).
The DBP Rule, which was promulgated in 1998 [44], lowered the total THM standard from 100 µg/L to 80 µg/L and set limits on other DBPs, including a 60 µg/L limit on the sum of five species of haloacetic acids (HAAs) (another chlorination by-product) and a 10 µg/L limit on bromate, an ozone by-product formed from bromide. The Rule also requires removal of total organic carbon (TOC) via enhanced coagulation or softening. The best available technologies identified for meeting the DBP Rule requirements for THMs and HAAs include enhanced coagulation, enhanced softening, or GAC; ozonation process optimization was identified as the best available technology for meeting the bromate standard. Water agencies anticipated the need for extensive research, retrofitting and upgrading of treatment facilities to meet the DBP Rule. Moreover, the specter of a more stringent Rule magnified the urgency to understand the possible effectiveness of source control in addition to new treatment technologies.
It was clear that water agencies charged with protecting the public health through treating drinking water from the Delta would face serious problems in meeting anticipated regulations [50]. The water agencies recognized that the degree of success they would experience in complying with the new rule would depend, in part, on how well DBP precursors could be reduced in the raw water supply. By reducing the concentration of these precursors in the raw water supply, the formation of known and unknown DBPs (regulated and unregulated DBPs) can be lowered. Moreover, controlling DBPs involves balancing risk/risk tradeoff issues with disinfection requirements. The SWTR had removal requirements for Giardia and viruses [41]. An Enhanced SWTR, developed along with the DBP Rule [44,51,52], included removal requirements for Cryptosporidium, which can be inactivated with ozone but not with chlorine.
4.1.2. Data Collection & Analysis
The MWQI program has conducted discrete water quality monitoring in the Delta since its inception in 1990 [25]. The spatial and temporal extent of this monitoring has varied in response to program needs and system understanding [25]. Currently (as of 2022), the program conducts routine discrete monitoring at ten locations (see Figure 1) and collects data at other locations in support of special studies. Discrete sampling has typically been conducted at a monthly interval and currently measures organic carbon (total and dissolved), standard minerals (i.e., major anions and cations), bromide, nutrients, and chlorophyll. TOC and dissolved organic carbon (DOC) are quantitative indicators of NOM content. Throughout its history, the MWQI program has evaluated several additional water quality parameters as part of routine monitoring and special studies, including trihalomethane (THM) formation potential, ultraviolet absorbance at 254 nm (UV-254) (a surrogate for the humic portion of the NOM), metals, selenium, pesticides, and herbicides [25].
The discrete water quality monitoring network, the backbone of the MWQI program in its early years, expanded dramatically at program inception. While IDHAMP had maintained a network of 15 to 18 sampling locations [39], in 1990, the MWQI program was collecting water quality samples at about 40 Delta urban intake and channel locations and about 30 agricultural drainage locations [43]. Discrete sampling frequency was typically monthly. Foreshadowing the program’s later adoption of real time monitoring, beginning in 1993 the program experimented with the use of autosampler technology to increase sampling frequency in a cost-effective manner. These devices were programmed to collect samples at variable frequencies (i.e., daily and sub-daily), which were subsequently analyzed in a laboratory. Autosamplers were later replaced by auto-analyzers, devices that could analyze selected water quality constituents in near real time (typically within minutes). Highlights of the program’s data collection and analysis efforts are summarized below; published program annual reports provide greater detail [43,53,54,55,56]. During this period, a parallel effort was undertaken by others [57] to evaluate loadings of key drinking water contaminants to Delta tributaries and to determine if there were source control measures that, if implemented, would improve drinking water quality at Delta intakes.
Measurement of cations and anions in Delta source waters continued under the MWQI program, thereby providing continuity with previous IDHAMP monitoring. The intended purpose of these data was to characterize the major water types in the Delta (e.g., freshwater inflows, seawater intrusion, and agricultural drainage) and their sources. By developing a chemical fingerprint or profile of specific water types, the program planned to assess the movement and degradation of water under specific hydrologic conditions in the Delta. Cation and anion data also assisted modelers and planners in the examination of alternatives to improve the management and distribution of Delta water supplies [43]. A comprehensive analysis of these data, along with related legacy data available on CDWR’s Water Data Library website http://www.water.ca.gov/waterdatalibrary/ (accessed on 1 November 2020), was undertaken more recently [58,59].
During this period, several advancements were made in the measurement and understanding of THM precursors and THM formation potential and their relationship to actual THM formation in treated water. Measurements of source water THM precursors, such as bromide, TOC, and DOC became routine. The resulting data showed consistent relationships between TOC and DOC and confirmed that seawater intrusion was the primary source of bromide in Delta waters [15]. Starting in 1990, water samples were also measured for UV-254, another indicator of NOM content, which was found to correlate with DOC in most water samples. UV-254 measurements were conducted for several years, with the intent of providing a quick and inexpensive measurement useful in assessing THM precursor levels in the Delta. In 1992, a modified chemical testing procedure was developed and adopted to improve measurement of THM formation potential in high DOC water samples [53]. This modified procedure was needed because the original THM formation potential assay method was shown to underestimate precursor levels in high DOC samples common in agricultural drainage [60]. Analysis of the program’s THM formation potential data revealed a consistent relative distribution of the four THM compounds as a function of bromine incorporation factor [61] and strong correlations were found between precursor concentrations, THM formation potential data, and THM formation in simulated distribution system samples [62,63]. Krasner et al. [21] studied water samples from the Delta and other locations to evaluate research approaches for characterizing NOM, including its source and nature in watersheds, its response to seasonal variations, and its potential to form DBPs.
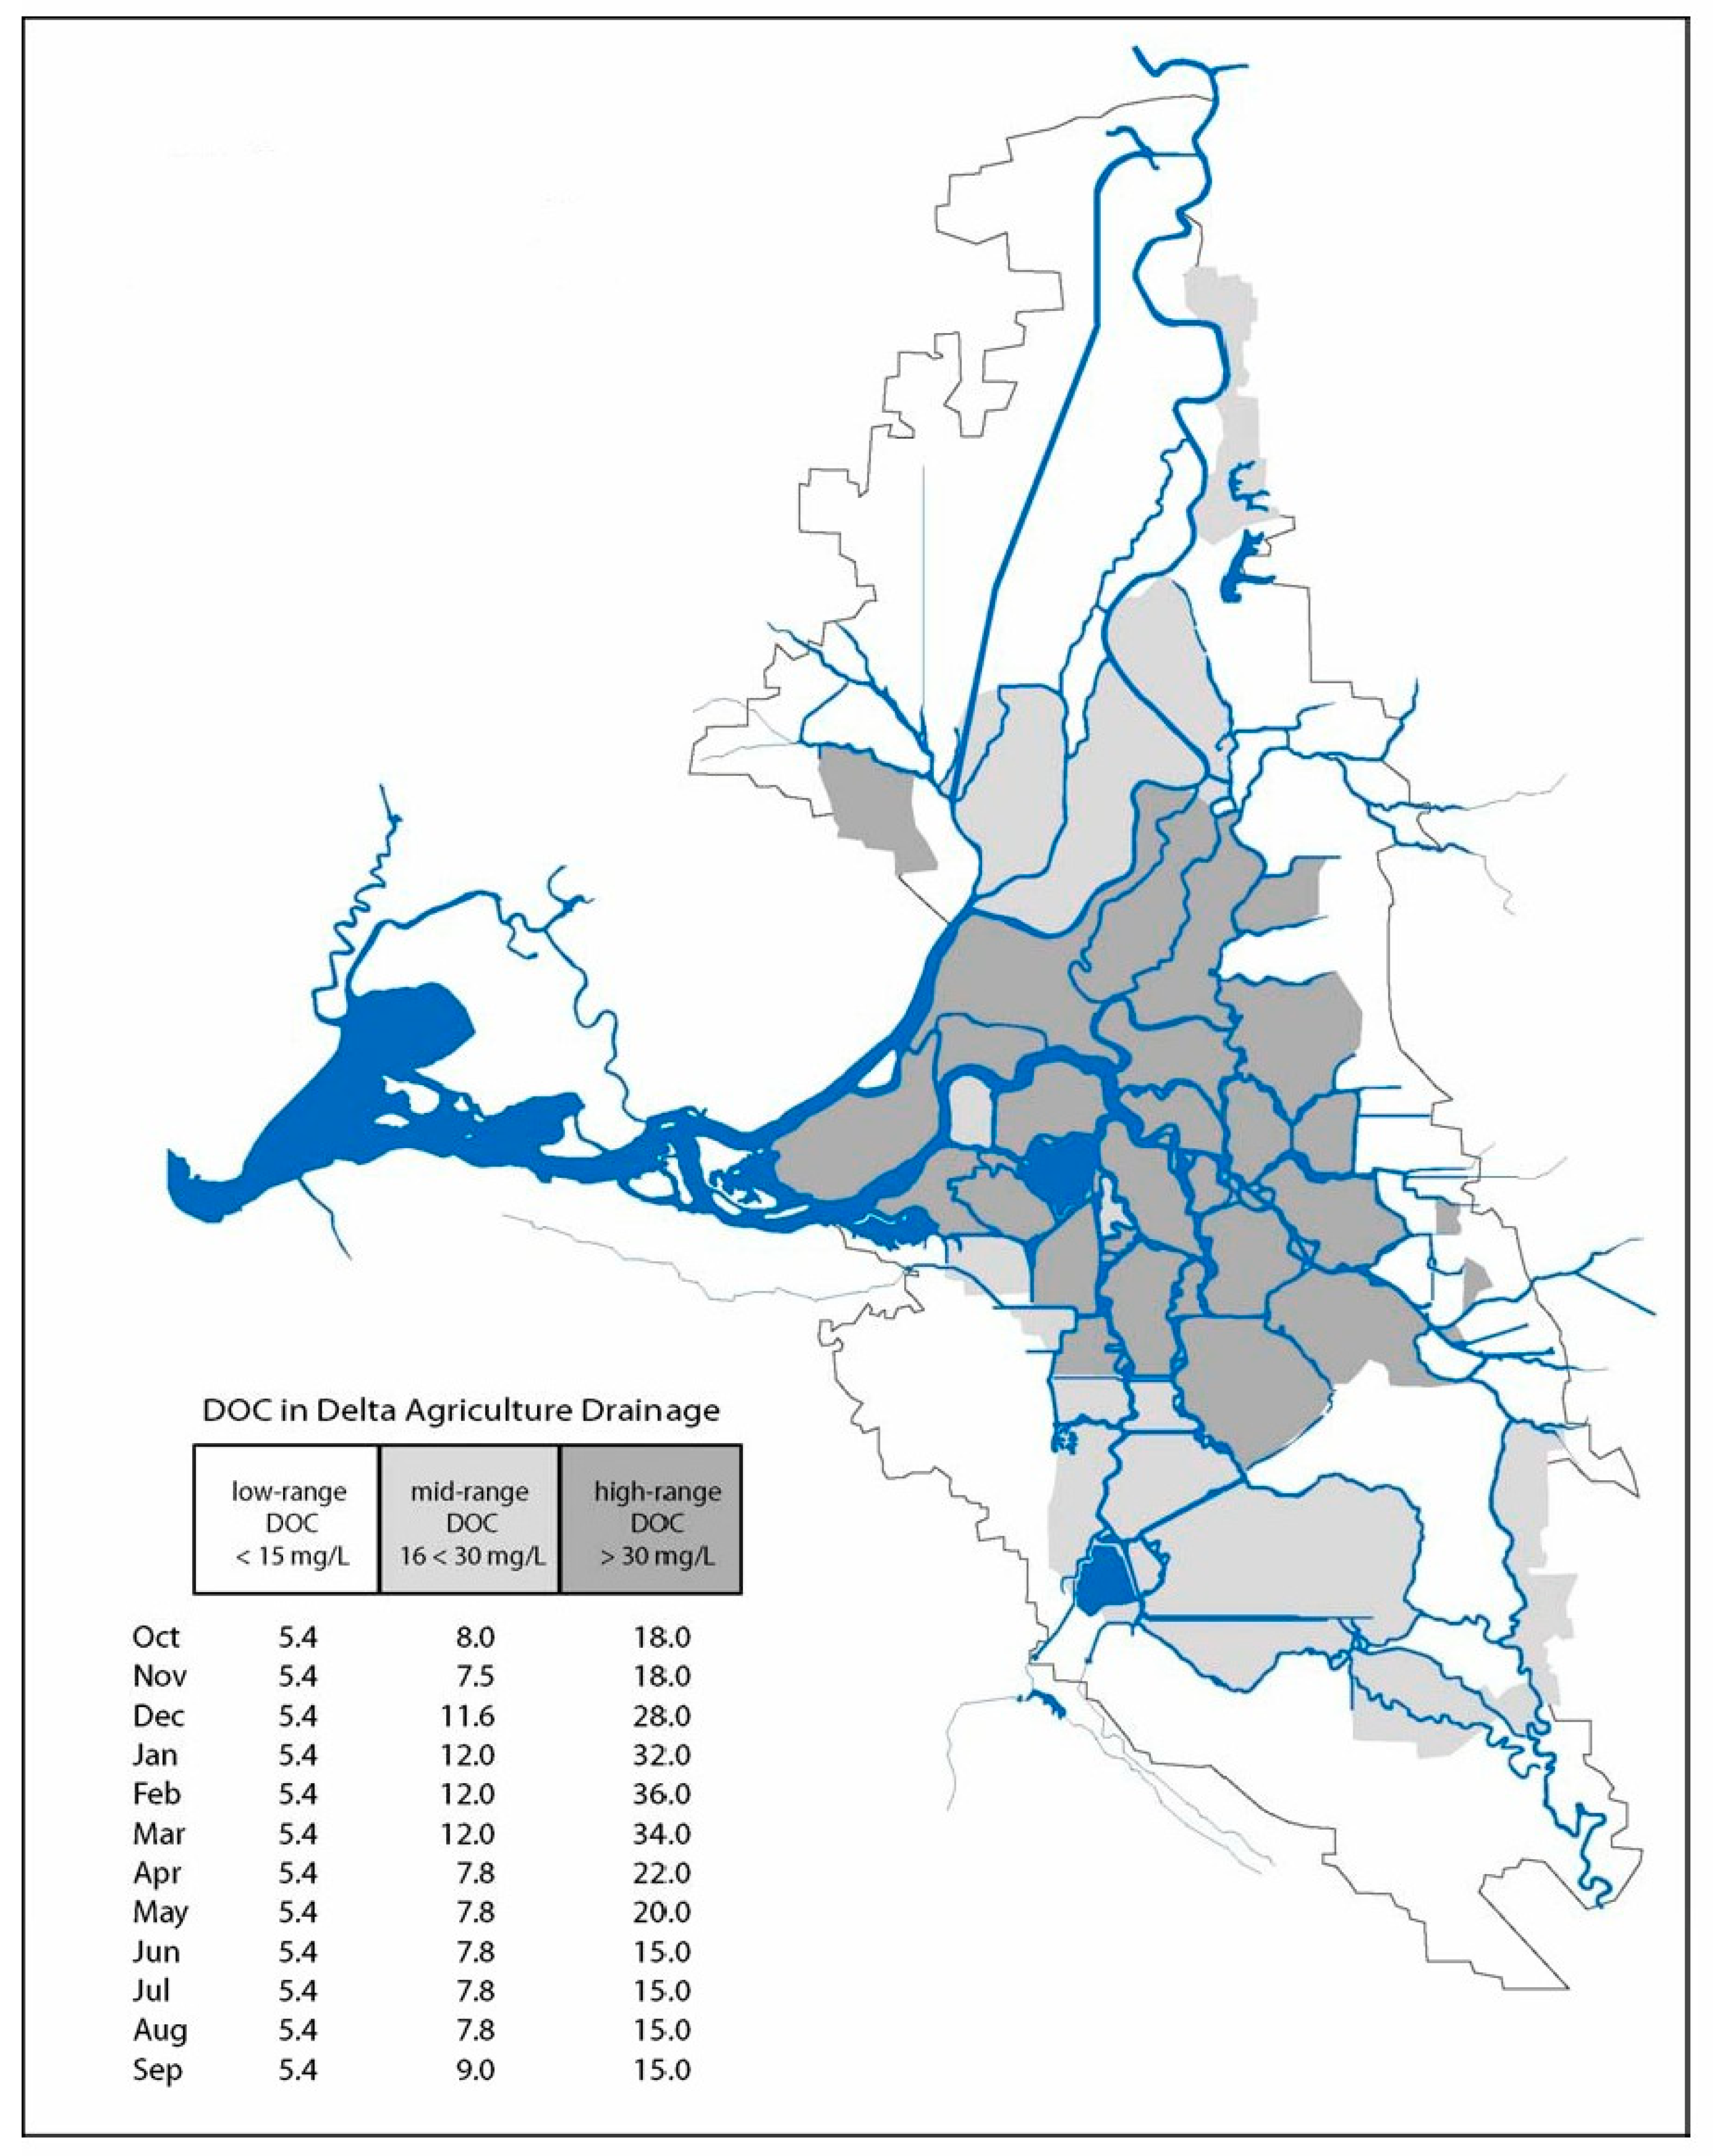
The relationship between Delta agricultural drainage and Delta source water quality became clearer as the MWQI program maintained and expanded monitoring initiated under the Delta Island Drainage Investigation program. The volume and quality of drainage was found to correlate with seasonal farming activities and regional soils. High drainage volumes were associated with farming activities centered on two periods. In the late fall and early winter, fields are flooded to leach out salt accumulations from the soil, resulting in high drainage volume and high DOC concentrations in the drainage, especially from organic soil areas. The second peak drainage period was observed during summer irrigation. DOC concentrations were found to be lower during the irrigation peak relative to the leaching peak; this difference was thought to be caused by less soil-to-water contact time and a lower water table that resulted in lower soil moisture. High DOC and THM formation potential levels were found to be associated with the organic content of the drained soils. The highest concentrations were typically found in drains located on peat soil areas and the lowest from mineral soil areas [53]. Following statistical analysis of drainage data and soil classifications proposed in CDWR [53], characteristic monthly values of DOC, THM formation potential, and UV-254 were proposed for organic soils (i.e., high-range DOC soils), intermediate organic soils (i.e., mid-range DOC soils), and mineral soils (i.e., low-range DOC soils); these are documented in CDWR [64] and summarized in Figure A2 (see Appendix A).
4.1.3. Modeling
Prior to 1990, efforts to develop a comprehensive modeling framework—following a recommendation from the 1982 expert panel report [35]—was limited to testing available software from USEPA, including a pesticide model (EXAMS) and two water quality transport models (QUAL2E and WASP3) [37]. Absent a transport model, a simple water balance approach was utilized to estimate Delta drainage contributions to THM formation potential in channel waters during the leaching and irrigation periods of water year 1988 [39]. Beginning in 1990, the MWQI program collaborated with the CDWR Delta Modeling Section to develop a framework for modeling THM precursor fate and transport in the Delta. Early model development was documented in a CDWR Division of Planning report [65], the CDWR Delta Modeling Section’s “Methodology for Flow and Salinity Estimates in the Sacramento–San Joaquin Delta and Suisun Marsh” series [66,67,68,69,70,71], and other publications [72,73,74,75,76]. Aspects of this early model development that focused on organic precursor fate and transport provided a foundation for today’s MWQI forecasting work.
4.2. Evaluating Potential Baseline Changes: The CALFED Years (1996–2005)
The CALFED years, nominally spanning 1996 through 2005, reflect a period of change from the early years of the MWQI program. Prior to 1996, most of the work done by the program was completed in response to water agency concerns over the contaminants in the source water of the Delta and focused on existing problem definition and possible solutions. With the 1994 Bay-Delta Accord among state and federal agencies with management responsibilities over the Delta, and expansion of the interagency CALFED process [16], the MWQI program expanded its scope to address potential changes in land use, water storage, and conveyance. A summary of program activities during this era is provided below.
4.2.1. Water Treatment Technology and Regulations
During the CALFED years, two clusters of USEPA drinking water regulations were promulgated: the Enhanced SWTRs [44,51,52] and the DBP Rule [44,45]. In response to these rules, the CALFED program established targets for providing safe, reliable, and affordable drinking water as either: (i) average bromide concentrations of 50 μg/L and 3.0 mg/L TOC concentrations at southern and central Delta drinking water intakes or (ii) an equivalent level of public health protection using a cost-effective combination of alternative source waters, source control, and treatment technologies [77]. The CALFED targets were predicated, in part, on data and information developed through the MWQI program.
Because the CALFED targets could not be feasibly achieved in the short time frame required to comply with the promulgated rules, water agencies participating in the MWQI program generally adopted advanced treatment technologies during this era that went beyond the best available technologies outlined in response to the new USEPA drinking water regulations. Typical advanced treatment technologies included GAC adsorption with chlorine as the primary and secondary disinfectant or ozone and chloramines as the primary and secondary disinfectants, respectively. By the end of 2005, more than 70 percent of the combined treatment capacity of the agencies employed ozonation (Figure 2), including Metropolitan’s 326 million gallon per day (mgd) Mills plant and 750 mgd Jensen plant, which treat Delta water from the east and west branches of the California Aqueduct, respectively. Nonetheless, continued efforts to develop a Delta “fix” were made to address a possible future tightening of the USEPA regulations and/or to reduce the costs of operating the advanced treatment technologies in place.
4.2.2. Data Collection & Analysis
The MWQI discrete water quality monitoring network was scaled back during the CALFED years, resulting in a network of 11 routine sampling locations by 2005 [78] that was more reflective of the IDHAMP network of the late 1980s. During this time, analysis of organic DBP precursors in channel waters shifted away from formation potential testing and the surrogate UV-254 measurement. THM formation potential testing was discontinued in 1998, reflecting a growing concern that it did not adequately represent formation in drinking water and could be misinterpreted [79]. While UV-254 data continued to be collected, their use for analysis was deemphasized because consistent spatial and temporal relationships with DOC could not be found [79] and was observed to vary from one NOM type to another. For example, agricultural drainage from peat soils (high in humic content) was found to have a UV-254:DOC ratio of 0.044–0.050 cm−1/mg/L, whereas agricultural drainage from mineralized soils (lower in humic content) was found to have a ratio of 0.035–0.370 cm−1/mg/L [21]. To place these ranges in context, the Sacramento and San Joaquin rivers are characterized by UV-254:DOC ratios of approximately 0.022 and 0.027 cm−1/mg/L, respectively. The Colorado River, outside the study area watershed, represents a source water low in humic content and has a ratio of 0.015 cm−1/mg/L. Discrete monitoring of nutrients was resumed in 2002 after being discontinued for several years. Greater emphasis was placed on data analysis, given interest in (i) potential adverse effects of nutrients on finished drinking water quality, (ii) examining their seasonal and spatial trends [20], and (iii) studying their effects on in-channel production of organic carbon [80]. Published program annual reports provide greater detail on MWQI’s discrete water quality monitoring during the CALFED years [79,80,81,82,83].
MWQI program efforts to conduct real time monitoring and disseminate the data on the internet were initiated during the CALFED years. The first TOC analyzer was installed along the Sacramento River at Hood in 1999 in support of a pilot study of real time organic carbon monitoring [84]. TOC analyzers were later installed at Banks Pumping Plant in 2001 and along the San Joaquin River at Vernalis in 2005. The capabilities of several instruments were evaluated [85]. Anion analyzers were also installed at these locations to collect continuous data on bromide, chloride, nitrate, and sulfate [86]. These installations are believed to be the first to take continuous measurements of organic carbon, bromide, and other anions in United States waters and to publish the data immediately on the internet [87].
MWQI program staff published several peer-reviewed journal articles on laboratory methods during the CALFED years. While most of these articles related to measurement of THM precursors from organic soils [88,89,90,91], one focused on measurement of microbial contamination in natural waters [92]. The latter examined Giardia and Cryptosporidium, which are pathogens of concern in the Enhanced SWTR.
4.2.3. Modeling
The CALFED Delta Drinking Water Council recommended a multi-faceted assessment program that included preliminary establishment of baseline Delta water quality conditions [93]. A workgroup was formed in 1999 and tasked with developing a model simulation of historical water quality conditions in the Delta [94] to (i) develop confidence in a previously developed hydrodynamic and water quality model of the Delta to establish baseline conditions for salt and organic carbon transport and (ii) establish error bounds for future simulation results. The model in question was the Delta Simulation Model version 2 (referred to as DSM2) [95]. CDWR [96] documents a DSM2 model validation study conducted in support of this CALFED effort. The validation study simulated transport of DOC and UV-254 from October 1990 through December 1997 and employed an approach documented in Jung [94] to characterize Delta island return water quality; this approach built upon earlier work documented in CDWR [64].
CDWR’s Delta Modeling Section, acting as a program partner to the MWQI program, continued DSM2 model development for simulating DBP organic precursor transport throughout the CALFED years. Model development activities included formulating planning-level precursor boundary conditions [97] and implementing an algorithm to simulate the transfer of DOC from peat soils to Delta channels (due to leaching and microbial decay) when Delta islands are flooded [98,99]. This algorithm was used for evaluation of the proposed Delta Wetlands project, a project to store water on two Delta islands [100] and a major levee break in 2004 on the Jones Tract in the Delta [101].
Following the MWQI program’s early success implementing real time monitoring in the Delta, proof-of-concept efforts were launched to utilize available modeling tools to forecast drinking water quality constituents of concern, notably bromide and DOC [102,103,104]. To support water quality forecasting capabilities beyond the Delta region, the DSM2 modeling platform was used for initial development of a water quality transport model of the California Aqueduct, South Bay Aqueduct, and Delta-Mendota Canal systems [105,106]. These nascent efforts ushered in a new MWQI program focus on providing decision support for SWP operation, as described in Section 4.3.
4.2.4. Targeted Science Studies
Scaling back of the MWQI discrete water quality monitoring network during the CALFED years was accompanied by a greater program emphasis on targeted science studies related to a broad range of Delta drinking water issues. These studies tended to focus on specific aspects of source waters, contaminant loading, measurement methods and instrumentation, and climate and hydrology. They were conducted to: (i) investigate the origins, fate, transport, and, in some cases, loads of current and emerging contaminants of concern; (ii) investigate seasonal patterns and trends of constituents and examine circulation patterns of contaminants; (iii) refine modeling assumptions; and (iv) assess the impacts of increasing urbanization on levels of water quality constituents of concern. Key studies conducted by the MWQI program, some in collaboration with outside agencies and/or consultants, are listed chronologically in Table A2 (see Appendix A). For example, Jung and Weisser [107] studied flooded peat soil environments, as there were various proposed projects (e.g., the Delta Wetlands project) that were considering using flooded islands for water storage.
4.3. Providing Decision Support for SWP Operations: The RTDF Years (2006–Present)
The MWQI program was expanded during 2002–2006 with the incorporation of real time data collection and water quality forecasting. The expansion occurred in phases as new sensors and data dissemination were deployed (e.g., [108]); these new program elements are collectively referred to as Real Time Data and Forecasting (RTDF). For the purpose of this narrative, 2006 is defined as the first year when these elements were in stable operation. The objective of RTDF was to enhance the ability of drinking water agencies to make informed operational decisions based on observed and forecasted changes in Delta water quality [24]. Program activities during this contemporary era were documented in CDWR’s Bulletin 132 series beginning in 2012 [5,109,110,111].
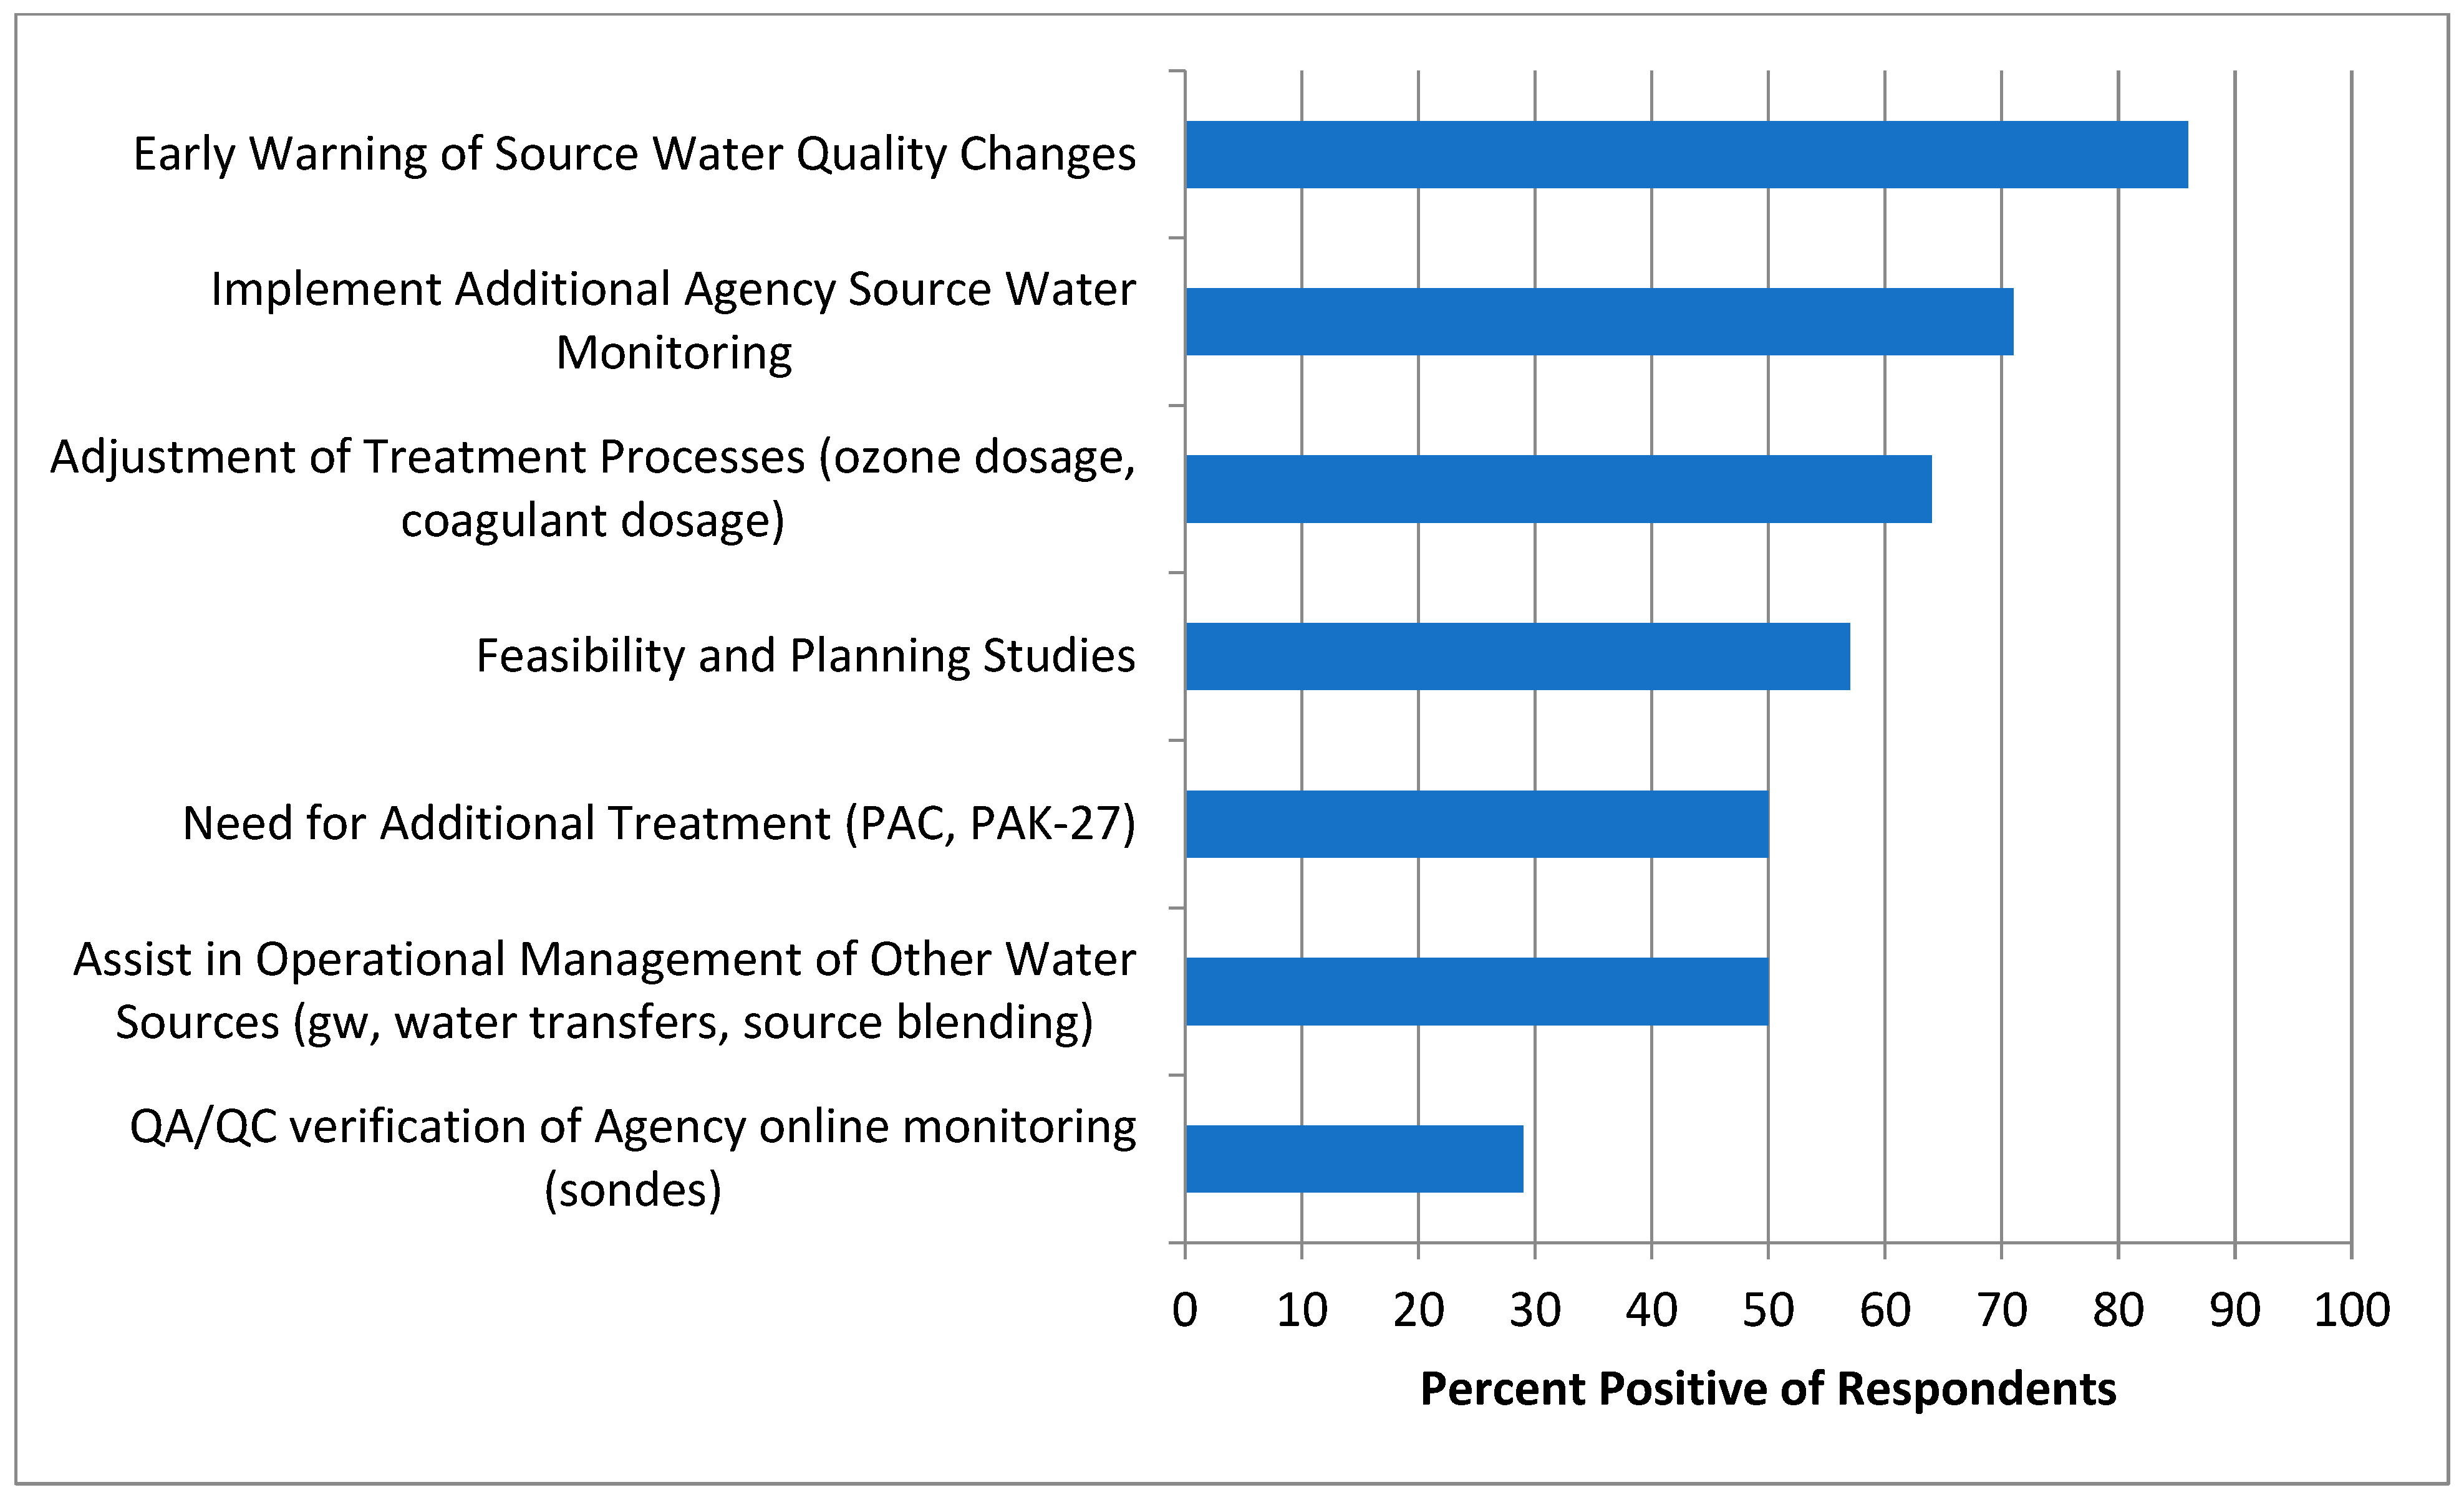
As part of this work, 14 participating water contractors were surveyed to understand their current use of MWQI’s real time and forecast data. The survey asked each contractor about the locations where they monitor water quality and how their agency used the water quality data. Responses were then categorized and compiled as shown in Figure A3 (see Appendix A). The survey revealed that use of the RTDF website to check on current conditions was commonplace, especially data reported through real time sensors. The main use of MWQI water quality data is to provide an early warning of changes in source water quality. Contractors also reported special interest in metrics that might affect their water treatment processes, particularly over short-term horizons. Specific examples of contractor uses of RTDF data, obtained in the survey responses, include tracking (i) bromide concentrations to allow adjustment of ozone dosage during treatment, (ii) cyanobacteria levels to address potential taste and odor concerns, (iii) pH and alkalinity, which can affect treatment effectiveness, (iv) organic carbon concentrations (and related measurements) to plan for coagulant dosage, and (v) the contribution of San Luis Reservoir releases, which can affect water quality in the California Aqueduct relative to flows coming directly from the Delta.
To satisfy additional real time water quality data needs by the participating water contractors, monitoring of taste and odor compounds and cyanobacteria was initiated by the MWQI program during this era. Taste and odor compounds are sampled weekly all year throughout the SWP (at selected reservoirs, Delta pump station inlets and at selected locations on the California Aqueduct). Cyanotoxins are collected across the SWP system monthly in May and April, and twice a month from June to October. If toxins are detected, the sampling frequency is increased to weekly. These data have helped inform water contractor operations. Specifically, given that most of the participating water contractors have a defined trigger level for source water taste-and-odor compounds, such timely information can inform decisions related to real time water treatment. The MWQI program is currently evaluating real time sensors for chlorophyll and phycocyanin to possibly serve as early warning detection of harmful algal blooms.
The well-established MWQI program has also provided a unique environment for participating water contractors and CDWR to interact on a regular basis. It has become a forum where the contractors can bring their source water quality concerns to address either a new or proposed regulation or to seek assistance on issues related to the operation of the SWP. Ultimately, these issues may be resolved with other CDWR personnel outside of the MWQI Program, but the MWQI program serves as a resource for locating assistance. For example, water contractors received notification about a new herbicide (Endothall), which would be used to treat aquatic vegetation in the SWP. Due to water quality concerns about the residual herbicide concentration, the contractors and CDWR discussed the issue extensively at MWQI meetings and ultimately developed a monitoring plan to study the fate and transport of the herbicide in the SWP, which was implemented and supported by CDWR.
As another example of interagency coordination, CDWR periodically receives requests from water agencies to transport non-SWP water (typically groundwater) or to transfer water between agencies through the California Aqueduct. These are generally referred to as non-project water turn-ins. The water contractors have raised concerns about such requests in the past; these concerns have related primarily to groundwater quality. To address these concerns, the contractors collaborated with CDWR to establish a facilitation group, which sets an approval process (including minimum water quality criteria) for each turn-in request. An annual report is produced by CDWR to document turn-ins and their impact on downstream water quality [112].
4.3.1. Water Treatment Technology and Regulations
While drinking water regulations have continued to evolve since 2006, they have had varied influence on the treatment of Delta source waters. The shift from chlorination as a primary disinfectant toward ozonation has continued since 2005. By 2020, about 85 percent of the combined treatment capacity of the participating agencies employed ozonation (Figure 2). In the current era, drinking water regulations have played a reduced role in driving MWQI program activities. However, that trend would likely reverse if new regulations were implemented. Examples of new DBPs being considered for regulation include four additional brominated HAAs and nitrosamines (such as N-nitrosodimethylamine or NDMA) [113]. In waters high in bromide, such as Delta waters, the five currently regulated HAAs may only represent around half of the concentration of the nine HAAs [114]. Certain pharmaceuticals discharged from wastewater treatment plants react with chloramines to form NDMA in drinking water [115]. The participating MWQI agencies that use ozone as the primary disinfectant use chloramines as the secondary disinfectant; thus, NDMA is produced at many of their water treatment plants.
4.3.2. Data Collection & Analysis
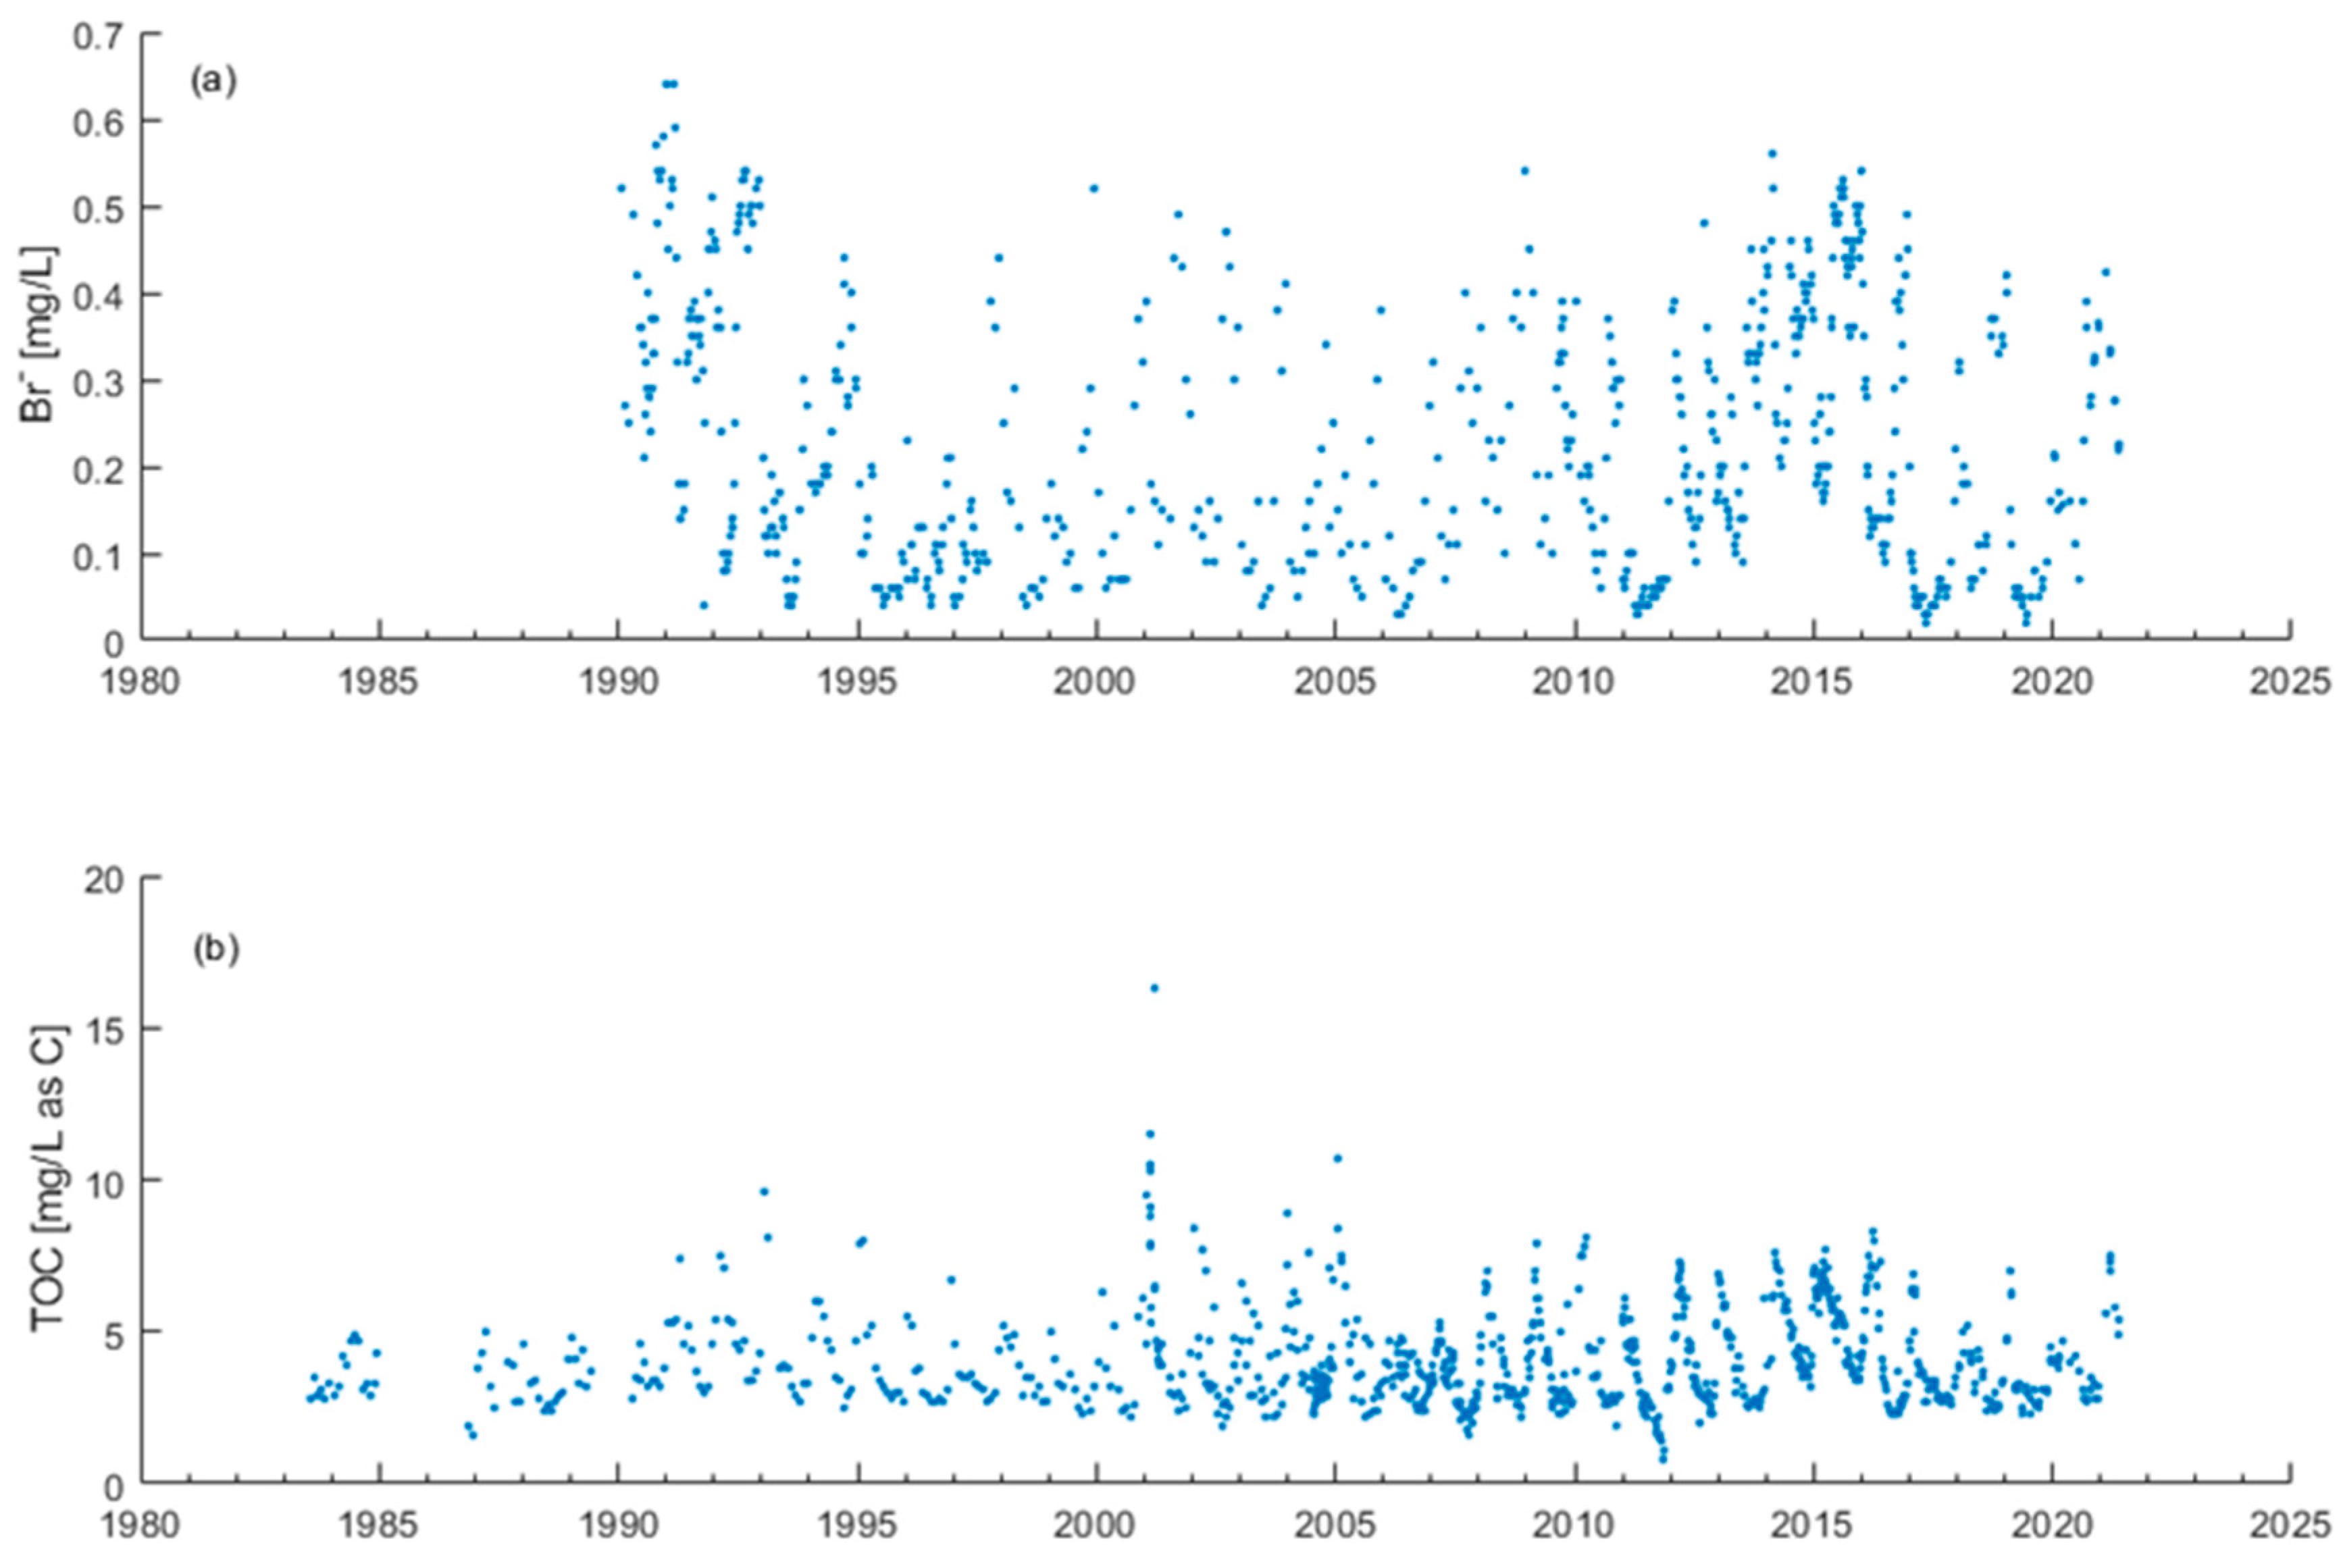
The MWQI discrete monitoring network has changed little since the CALFED years (Figure 1), with routine monitoring locations sampling for bromide, TOC, DOC, nutrients, standard minerals, and chlorophyll on a monthly basis [78,116]. The total number of discrete monitoring locations may change year to year based on need of special studies. The MWQI program discontinued publication of its annual data reports after water year 2009; however, the program continues to make its data available online through the CDWR Water Data Library. Representative time series of discrete sample bromide and TOC data from Banks Pumping Plant are shown in Figure 3.
The MWQI program was expanded during 2002–2006 with the initiation of real time data collection and water quality forecasting. The key elements of this expansion include construction and on-going management of real time monitoring sites, systematic production of water quality forecasts, and management and dissemination of information generated by the program expansion [24]. The objective of this program expansion was to enhance the ability of drinking water treatment plant operators to make informed operational decisions based on observed and forecasted changes in Delta water quality [117].
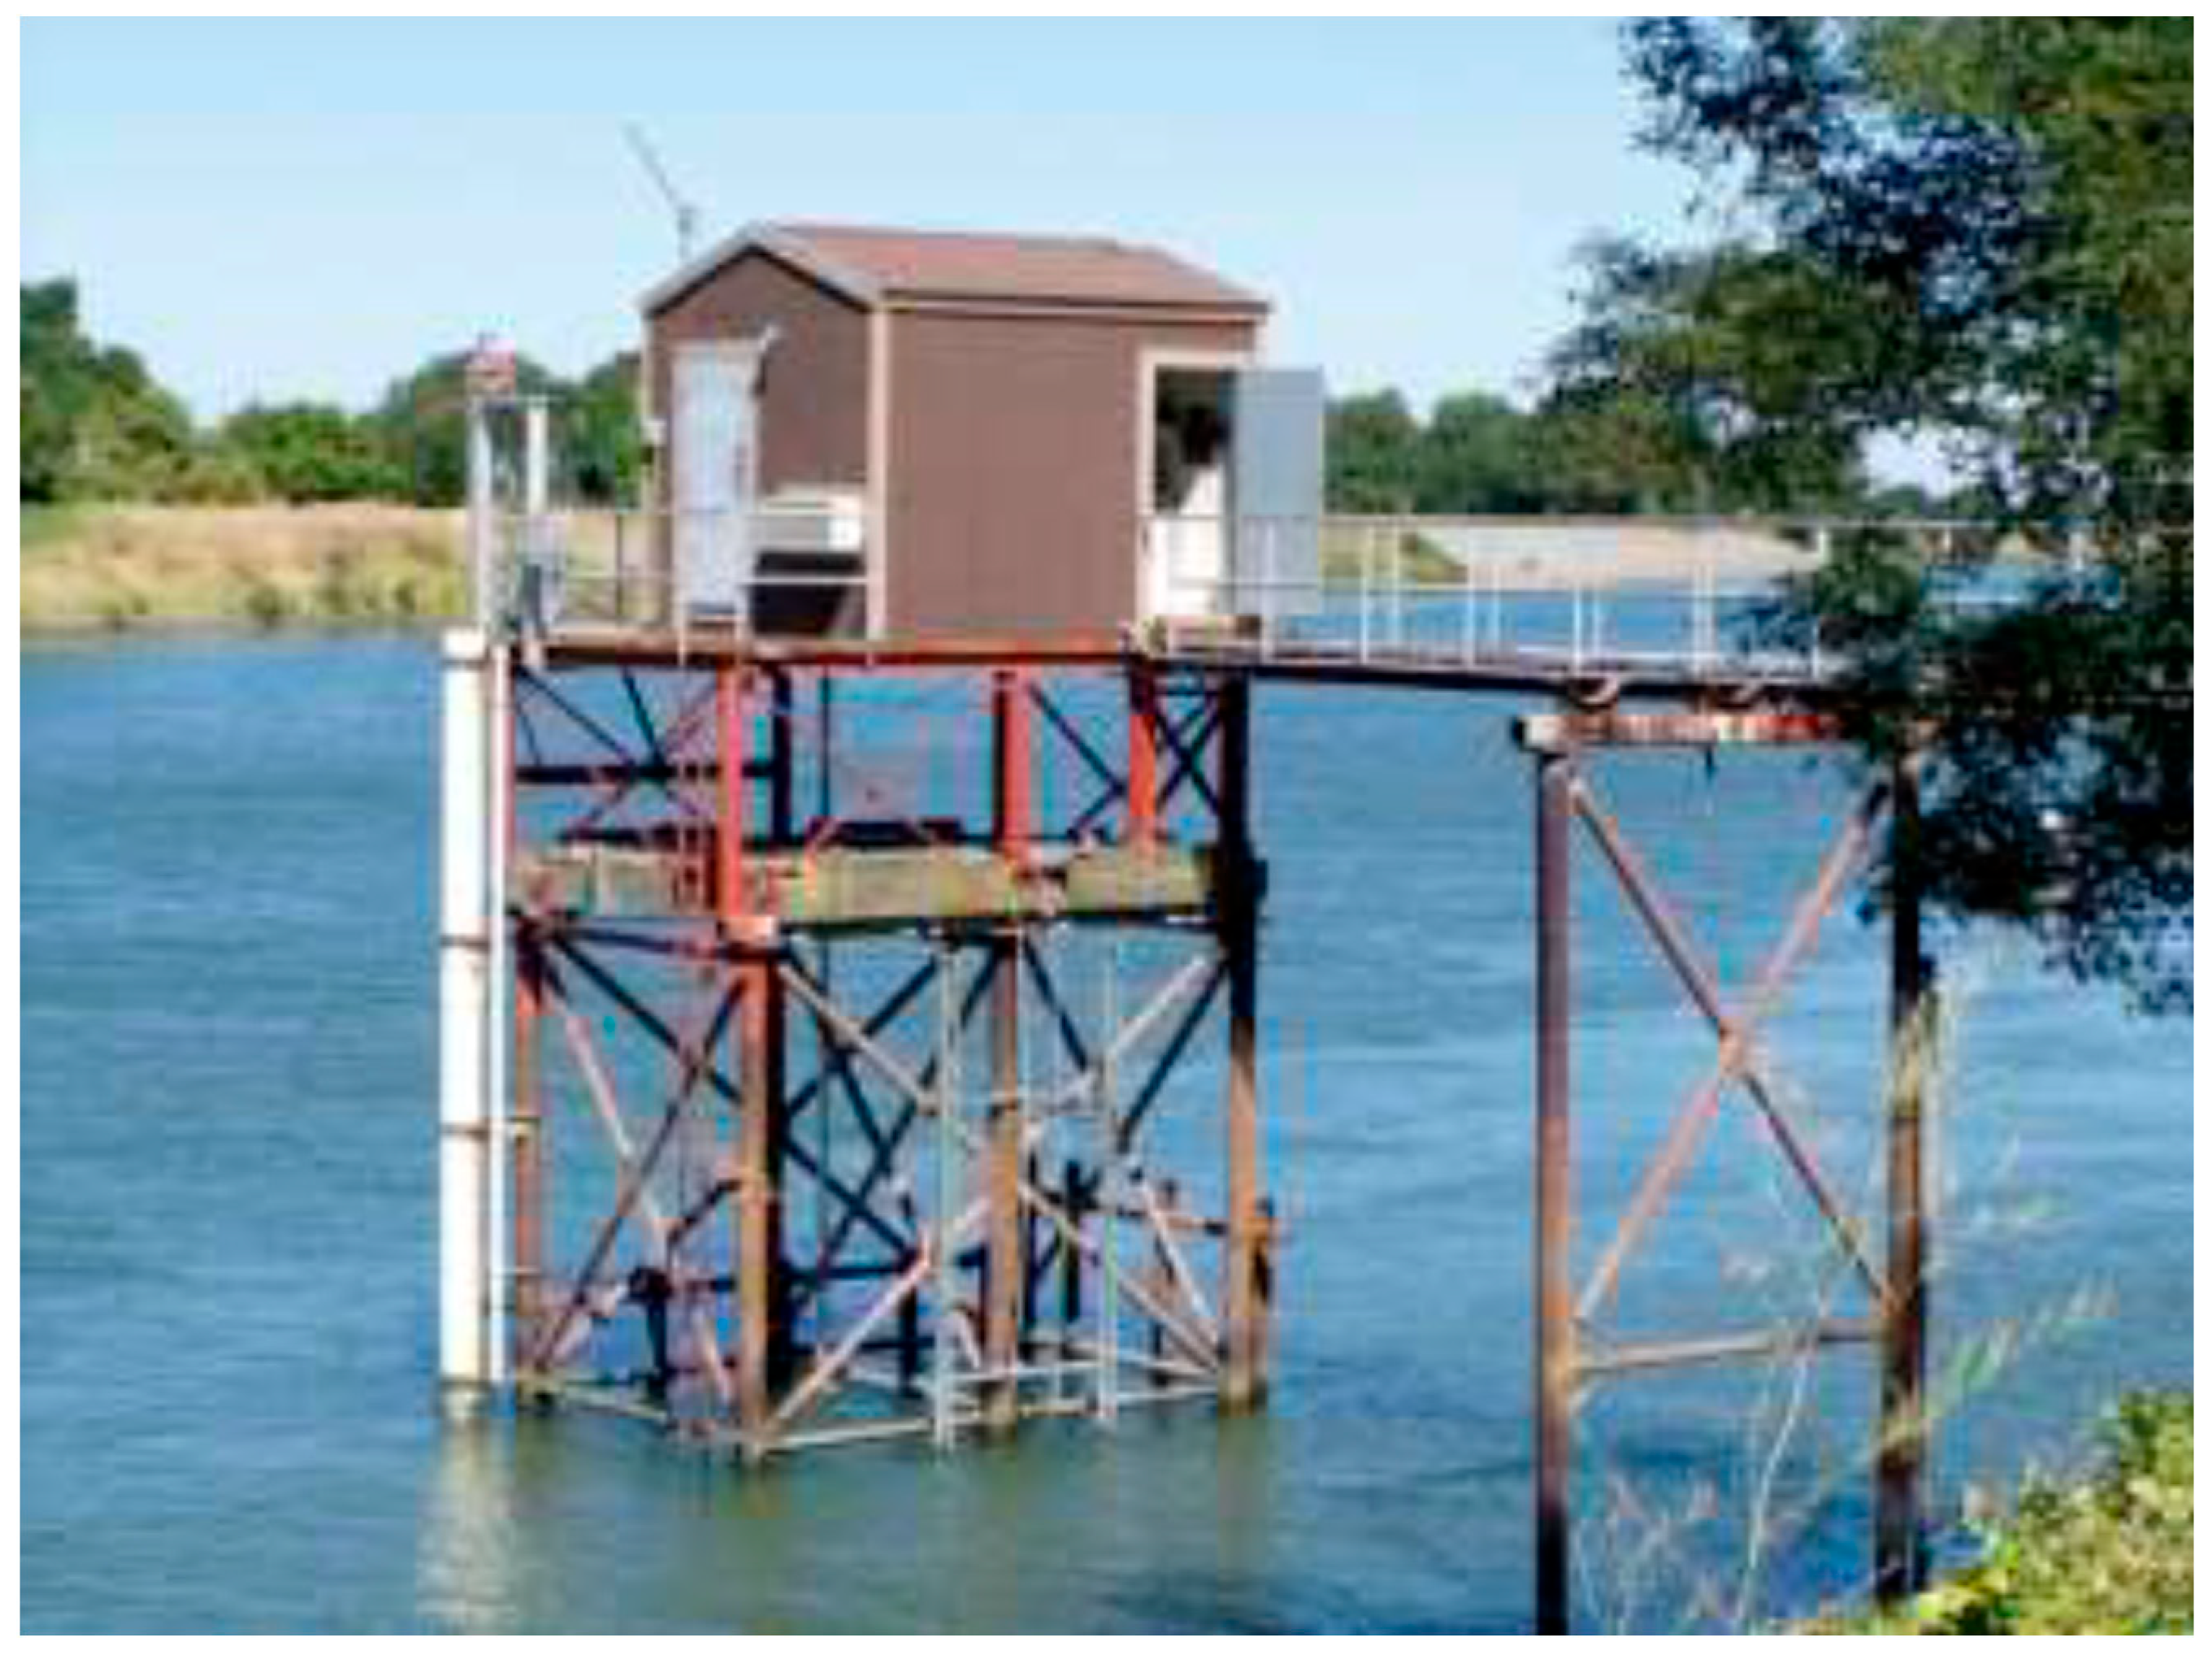
Five real time monitoring stations are operated and maintained by the MWQI program; four of the stations are located in the Delta and one is located south of the Delta (Figure 1). The Delta stations include Hood (located on the Sacramento River near the town of Hood upstream of most Delta influences—see Figure A4 in Appendix A), Vernalis (located on the San Joaquin River near the town of Vernalis upstream of most Delta influences), Banks Pumping Plant (located at the head of the SWP), and Jones Pumping Plant (located at the head of the Delta-Mendota Canal, which provides water to the CVP). The southern station, Gianelli, is located along the SWP at the Gianelli Pumping-Generating Plant on O’Neill Forebay below San Luis Reservoir. Data, collected from 46 field sensors at the five monitoring stations, measure several key water quality constituents, with organic carbon (both TOC and DOC) and bromide being the primary focus. Of the 46 sensors, 31 are operated by the MWQI program while the remaining sensors are operated by other entities such as the U.S. Geological Survey, the San Luis Delta Mendota Water Authority, and other CDWR programs. Table 1 summarizes MWQI real time station names, California Data Exchange Center (CDEC) identifications, and water quality parameters collected by the MWQI program and other entities; parameters collected by other entities are referred to as “non-program” parameters in the table.
Although the MWQI program discontinued measurement of UV-254 as a surrogate for organic carbon, efforts continue to find a useful real time surrogate. Recent efforts have focused on the use of fluorescence of dissolved organic matter (FDOM) as a real time surrogate for DOC; preliminary results appear promising [118]. The U.S. Geological Survey has been using FDOM sensors in the Delta since 2014 and has found it to be a strong predictor of DOC concentration [119,120]. Real time monitoring data, along with the daily water quality report, are posted on the SWC RTDF web page at http://rtdf.info/ (accessed on 8 October 2022). This web page provides links to CDWR’s Water Data Library, CDEC, and the daily MWQI water quality report.
4.3.3. Modeling
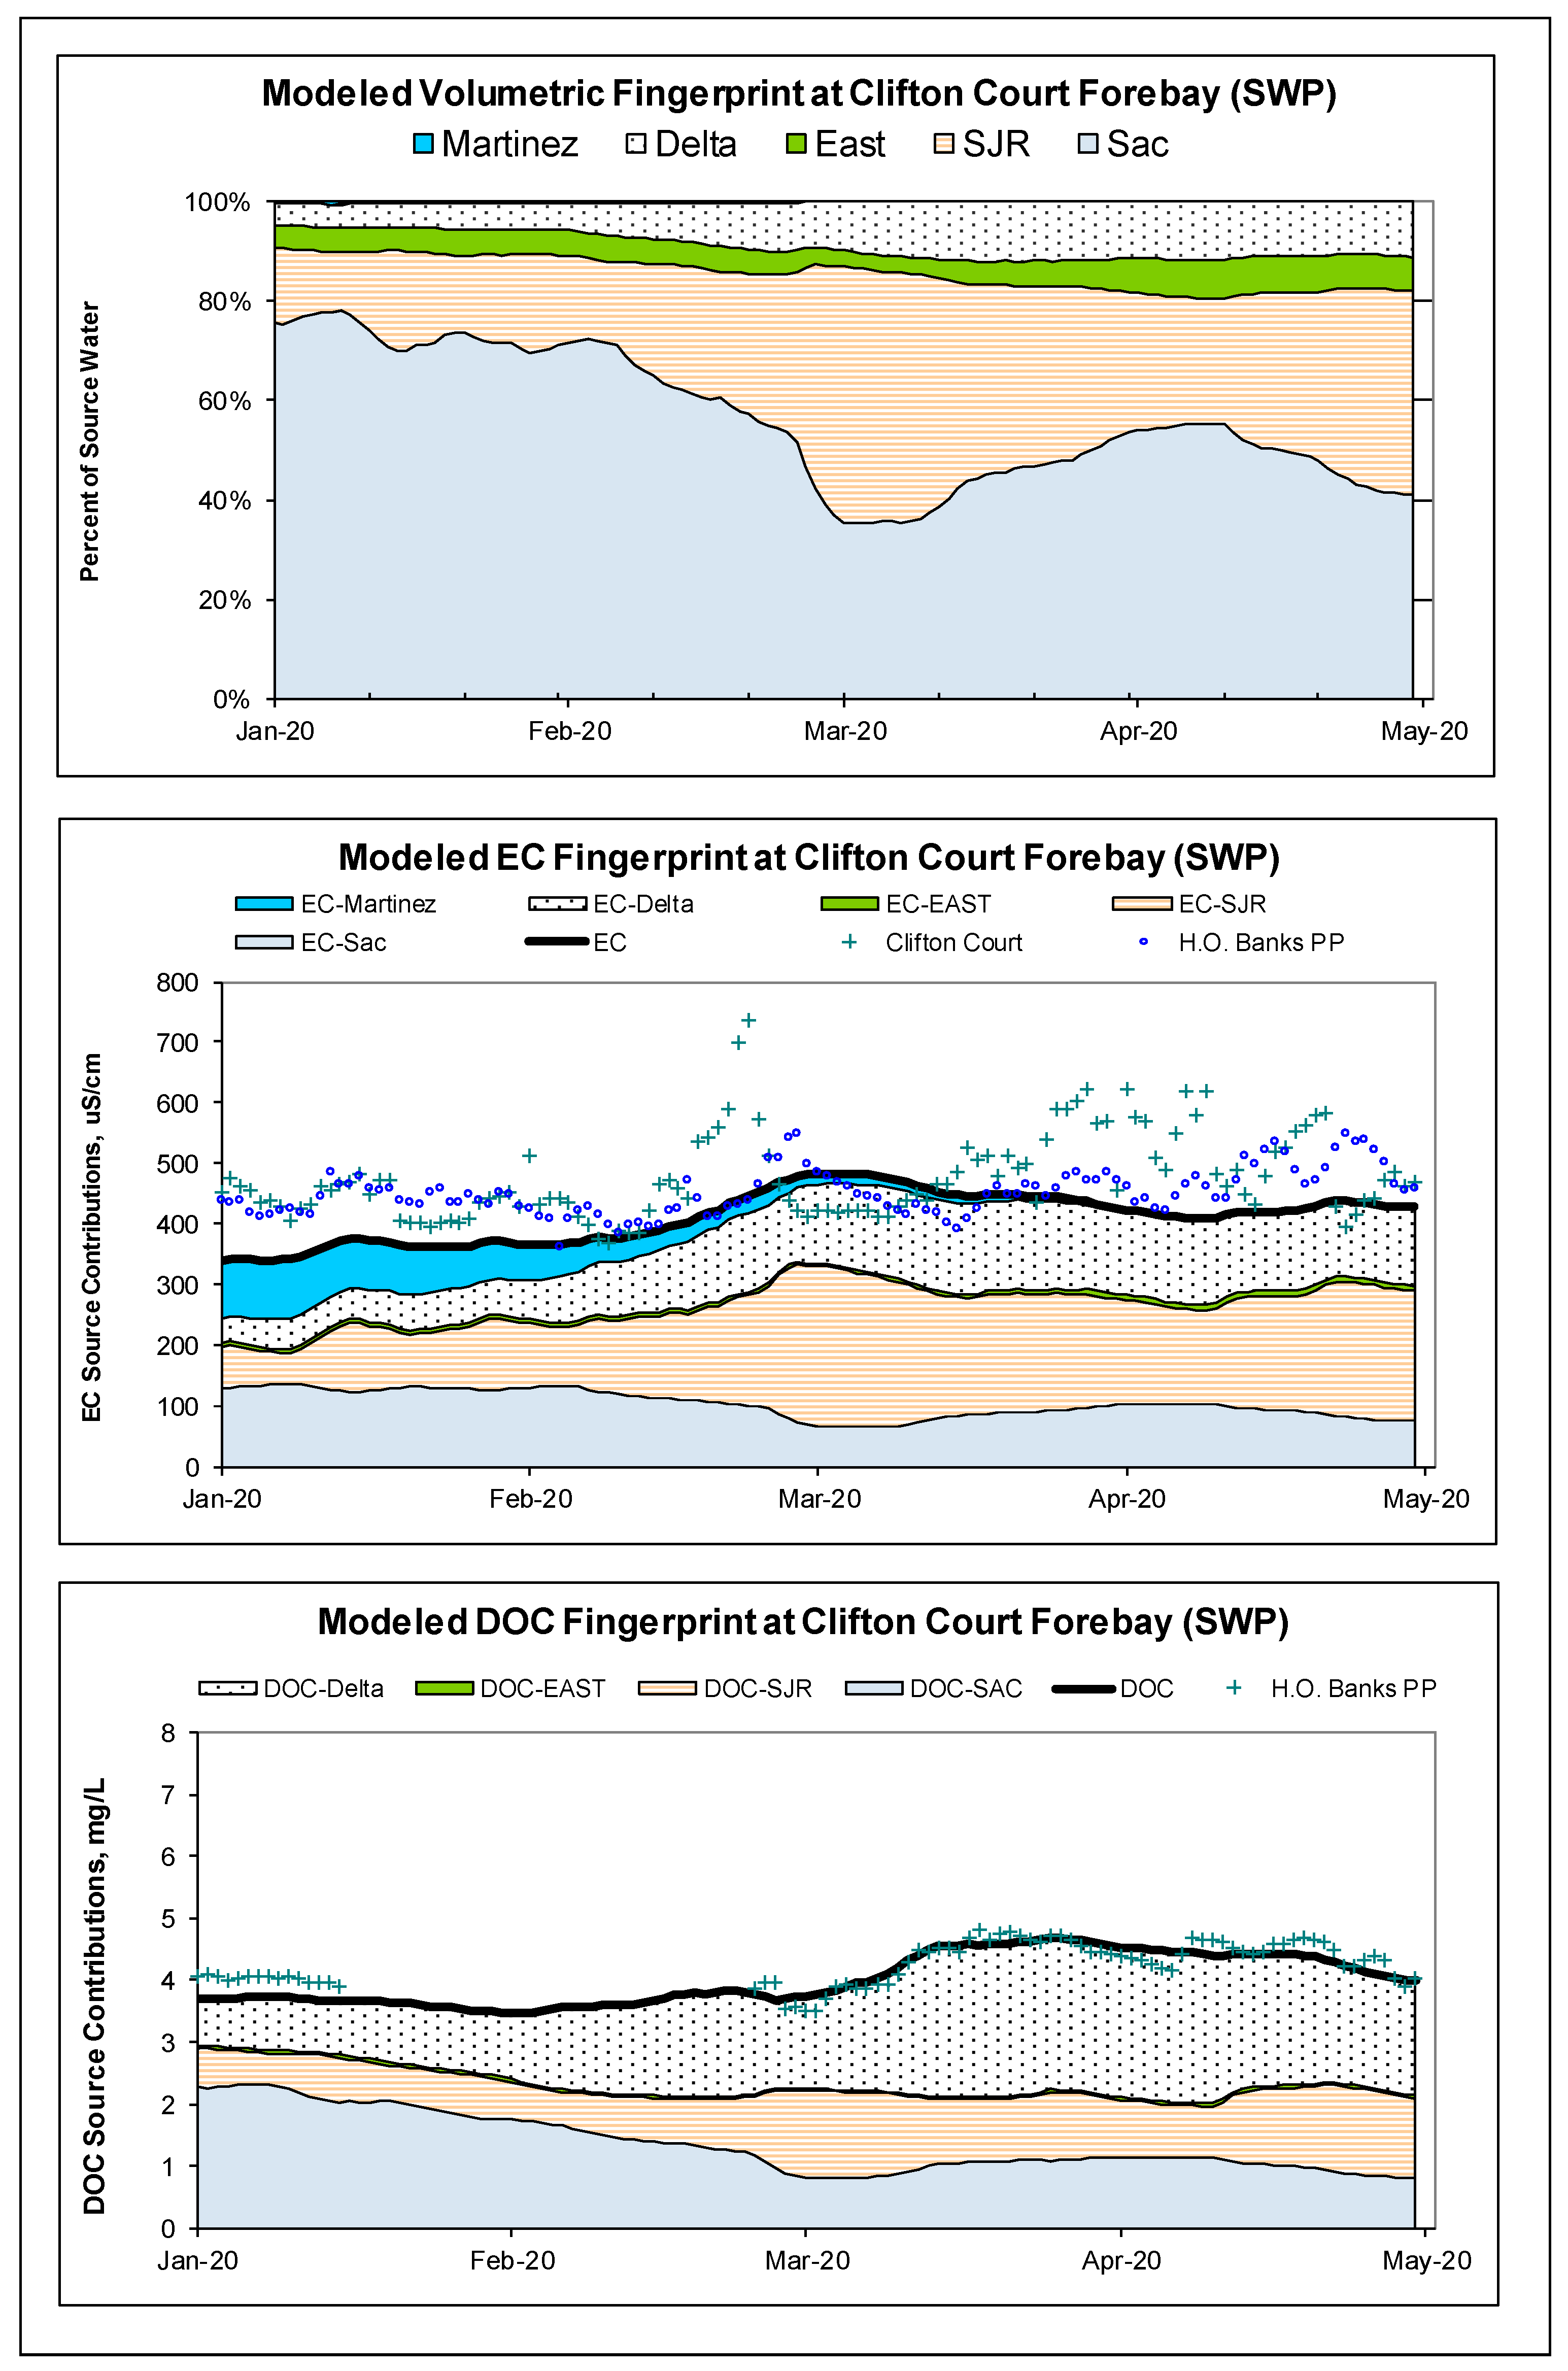
Modeling during the early RTDF years focused on developing and enhancing DSM2 forecast simulation capabilities for salinity (specific conductance), bromide, and DOC in the Delta and the downstream aqueduct systems [106,121,122,123] and conducting tool validation [124]. Most of this work was conducted by CDWR’s Delta Modeling Section. As modeling tools matured, CDWR’s Division of Operations & Maintenance (O&M) became a program partner and began producing water quality retrospective simulations and 21-day forecasts on a routine basis [125]. The retrospective simulations also characterize Delta water quality through fingerprints that quantify different source contributions (e.g., Sacramento River inflow, San Joaquin River inflow, Delta agricultural drainage) at fixed locations [126,127]. The fingerprint technique has also been used to estimate the fraction of Sacramento and San Joaquin River inflows that are wastewater-derived [22]. The program has also routinely produced “seasonal” water quality forecasts for conditions several months into the future. However, based on several years of experience, the utility of these seasonal forecasts has been questioned (due to large uncertainty) and production of these forecasts was discontinued [128].
Participating water contractors commissioned the development of a DSM2 emulator that employed artificial neural network technology, a common machine learning technique [129]. This model was developed to provide an alternate, easy-to-use tool with greatly reduced run times. However, to date, the tool has not been adopted as part of the MWQI suite of forecasting tools.
Concerns about low alkalinity levels in exported Delta waters have been raised by participating MWQI agencies, prompting the program to develop capabilities to simulate and forecast bicarbonate fate and transport in the Delta. While moderately low alkalinity levels can improve the effectiveness of the coagulation process in water treatment plants, especially when aluminum sulfate is used as a coagulant, extremely low alkalinity levels can depress pH levels and can result in TOC re-stabilization [130]. These new forecasting capabilities were implemented in 2021.
Information from MWQI’s routine monitoring and modeling efforts are disseminated in a variety of ways. Discrete and real time data are posted in CDWR’s Water Data Library and in CDEC (https://cdec.water.ca.gov/ accessed on 8 October 2022), respectively. A daily water quality report, distributed electronically via email, contains a summary table of real time station data, links to water quality forecasts, and a brief synopsis of current events in and around the Delta. The summary table is updated daily and provides mean daily values, seven-day averages and the percent change over the seven days. Finally, monitoring data and model output, along with the daily water quality report, are posted on the SWC Real Time Data and Forecasting web page at http://rtdf.info/ (accessed on 8 October 2022). This web page provides links to CDEC and the daily MWQI water quality report. Figure 4 provides an example of observed and simulated data at Clifton Court Forebay (located upstream of Banks Pumping Plant) that are routinely updated as part of the MWQI program.
4.3.4. Targeted Science Studies
With an increasing emphasis on providing decision support for SWP operations since 2006, the MWQI program has commensurately placed a decreasing emphasis on targeted science studies in recent years. In spite of this shift in priorities, several important studies have been conducted by the MWQI program (some in collaboration with outside agencies and/or consultants) during the RTDF years; these are listed chronologically in Table A2 along with relevant citations to illustrate the breadth of study. The MWQI program additionally provided support to two key studies that examined wastewater discharges as sources of NDMA and NDMA precursors in the Delta [22,131].
5. Program Accomplishments & Future Directions
CDWR’s MWQI program is the most extensive and cohesive program established to investigate the quality of Delta source water with respect to its suitability for production of drinking water. The program has met this goal over its first three decades of existence by evolving in response to regulatory drivers, technology innovations, and an ever-increasing knowledge base developed through monitoring, targeted scientific studies, and computer modeling. In its successful quest to follow the recommendations set forth by an expert panel in the early 1980s [34], the MWQI program has accumulated several notable accomplishments:
- A monitoring program for constituents of human health significance was instituted, resulting in several long-term, open access discrete water quality data sets of value to scientists and engineers working in the Delta. The monitoring program has successfully balanced the competing needs of maintaining long-term data sets while allowing for on-going adjustments in response to new science and measurement technologies.
- A computer modeling framework for the transport of DBP precursors was developed and, along with data analysis, has been successfully employed to identify sources of key chemical constituents, determine how contaminants from each source are transported through the system, and determine how they affect concentrations at the points where water is diverted from the Delta and along the SWP.
- The MWQI program has provided key information for making decisions on how to manage the Delta and treat its waters to protect public health. For example, real time data on DBP precursors (i.e., DOC and bromide) have provided water agencies with information on how to best operate advanced water treatment plants. This information has supported participating water agencies in their decisions to adopt new water treatment technology; it has also supported the development and update of watershed sanitary surveys of the SWP.
- Real time data collection and water quality forecasting was initiated to enhance the ability of drinking water agencies to make informed operational decisions based on observed and forecasted changes in Delta water quality. Key elements of this operational support include construction and on-going management of five real time monitoring sites, systematic production of water quality forecasts, and management and dissemination of generated information. The MWQI program is believed to be the first in the United States to conduct continuous, real-time monitoring of organic carbon, bromide, and anions and to publish the data immediately on the internet.
The MWQI program, an on-going collaboration between CDWR and participating water agencies, has been designed and managed to be flexible and pro-active in order to address new drinking water quality challenges as they arise. The program’s monitoring network, its frequency of data analysis and reporting, and its modeling tools—all of which have evolved over the past three decades—are collectively an effective “finger on the pulse” for Delta and SWP water quality that allow program participants to proactively manage risks by adjusting treatment processes, changing source water blends, or applying other operational tools to obtain optimal source water quality. Given the program’s founding principles that drinking water quality concerns will continue to change and that it must adapt to address new challenges, future directions will likely be guided by a host of factors that may trigger changes in treatment plant processes and operations and Delta source water quality, including (but not limited to) identification of emerging contaminants, changes in land and water management practices, Delta island flooding, sea level rise, and climate change [132].
Author Contributions
P.H.H.; S.B.R.; S.W.K. and L.P. have contributed to the writing of this manuscript. All authors have read and agreed to the published version of the manuscript.
Funding
Funding for this work was provided by the State Water Contractors MWQI Specific Projects Committee.
Data Availability Statement
This work does not include primary data; all data referred to are available from their original publications or from the public websites that are cited.
Acknowledgments
The authors wish to acknowledge Bruce Macler (USEPA retired) for sharing his expertise related to the evolution of adopted water treatment technology and regulatory environment. We thank Richard Breuer (CSWRCB, retired), Carol DiGiorgio (CDWR, retired), Kevin Donhoff (MWDSC), Tony Liudzius (MWDSC), Cindy Messer (CDWR), and Shaun Philipart (CDWR) for their review of an early draft of the manuscript. We also thank Greg Gartrell (CCWD retired) for his review of an interim draft of the manuscript and his perspective on the early years of the MWQI program. Finally, we wish to thank members of the MWQI Specific Projects Committee for input on their current use of RTDF data.
Conflicts of Interest
The authors declare no conflict of interest.
Abbreviations
| CDEC | California Data Exchange Center |
| CDWR | California Department of Water Resources |
| CSWRCB | California State Water Resources Control Board |
| CVP | Central Valley Project |
| DBP | Disinfection By-Product |
| DOC | Dissolved Organic Carbon |
| DSM2 | CDWR’s Delta Simulation Model 2 |
| EC | Electrical Conductivity or Specific Conductance |
| FDOM | Fluorescence of Dissolved Organic Matter |
| GAC | Granular Activated Carbon |
| HAA | Haloacetic Acid |
| IDHAMP | Interagency Delta Health Aspects Monitoring Program |
| MCL | Maximum Contaminant Level |
| MWQI | Municipal Water Quality Investigations |
| NDMA | N-Nitrosodimethylamine |
| NOM | Natural Organic Matter |
| QA/QC | Quality Assurance/Quality Control |
| RTDF | Real Time Data and Forecasting |
| SWP | State Water Project |
| SWTR | Surface Water Treatment Rule |
| THM | Trihalomethane |
| TOC | Total Organic Carbon |
| USEPA | United States Environmental Protection Agency |
| UV-254 | Ultraviolet Absorbance at 254 nm |
| WTP | Water Treatment Plant |
Appendix A
Figure A1.
The MWQI program organization structure includes CDWR management, CDWR program participants, and participating urban water agencies.
Figure A1.
The MWQI program organization structure includes CDWR management, CDWR program participants, and participating urban water agencies.

Figure A2.
Delta island drainage DOC values used in DSM2 [133]. The islands are divided into three groups, each corresponding to specific ranges in DOC (low, medium, and high).
Figure A2.
Delta island drainage DOC values used in DSM2 [133]. The islands are divided into three groups, each corresponding to specific ranges in DOC (low, medium, and high).

Figure A3.
Survey results from 14 water contractors on how they use MWQI real time and forecast data in their regular operations.
Figure A3.
Survey results from 14 water contractors on how they use MWQI real time and forecast data in their regular operations.

Figure A4.
Sacramento River at Hood Real-Time Monitoring Station.


Table A1.
SWP Watershed Sanitary Surveys.
| MWQI Era | Year | Focus | Reference(s) |
|---|---|---|---|
| Early Years | 1990 | This survey focused on reviewing available water quality data and providing an inventory of contaminant sources in the Sacramento, San Joaquin, and Tulare watersheds and along the aqueducts, with minimal focus on the contaminant sources in the SWP reservoir watersheds. The survey determined that the most significant water quality degradation in the SWP system occurs between the Sacramento River at Greene’s Landing near Hood and the south Delta export facilities at Banks and Jones Pumping Plants (see Figure 1). The major sources of this degradation were identified as agricultural drainage from Delta islands, sea water intrusion, inflow from the San Joaquin River, and local discharges in the Stockton area and into Cache Slough. | [134] |
| CALFED Years | 1996 | This update focused on the recommendations from the 1990 survey and major changes in the watersheds between 1990 and 1996. The update also provided more details on contaminant sources in several reservoir watersheds (Del Valle, San Luis, Pyramid, Castaic, Silverwood, and Perris), the North Bay Aqueduct Barker Slough watershed, and the open canal section of the Coastal Branch of the California Aqueduct. | [135] |
| 2001 | This update, which provided more details on contaminant sources in the watersheds of the SWP reservoirs and along the aqueducts, contained a detailed analysis of pathogen and indicator micro-organism data from the SWP. A major objective of the update was to provide information needed to comply with the California Department of Public Health’s Drinking Water Source Assessment Program requirements. | [136] | |
| RTDF Years | 2006 | This update, in addition to reviewing significant changes to the watersheds and their impacts on water quality, focused on the Jones Tract levee failure and emergency response procedures and efforts to coordinate pathogen monitoring in response to USEPA’s Enhanced SWTR. | [137] |
| 2011 | Similar to the 2006 update, this update concentrated on the key water quality issues that challenge the SWP contractors. This update discussed effects of the 2008 U.S. Fish and Wildlife Service and 2009 National Marine Fishery Service biological opinions, recent droughts and non-SWP aqueduct inflows on water quality, subsidence along the California aqueduct, and monitoring conducted to comply with the Enhanced SWTR. In addition, this update assessed long-term data trends at several locations in the Delta and along the aqueducts. | [138] | |
| 2016 | This update, in addition to evaluating key SWP water quality constituents, evaluated water quality impacts associated with grazing and the drought spanning 2012 to 2015. A separate report on contaminants in the San Joaquin River watershed was prepared (CDWR, 2015a). | [139] |
Table A2.
Cross Section of Applied Science Studies Conducted under the MWQI Program.
| MWQI Era | Study Name | Reference |
|---|---|---|
| CALFED Years | Characterization of DOC from Delta Island Soils | [81,140] |
| Coordinated Pathogen Monitoring Program for SWP | [81,82] | |
| Treatment of Delta Island Drainage to Reduce TOC Loads | [81] | |
| Delta Drainage, Surface Withdrawal, and Land Use Data | [141] | |
| Delta Island Drainage Volume Estimates 1954–1955 verses 1995–1996 | [142] | |
| The North Bay Aqueduct Barker Slough Watershed Water Quality Phase 1 Report | [143] | |
| Candidate Delta Regions for Treatment to Reduce Organic Carbon Loads | [144] | |
| Environmental Study of Dredged Materials: Grant Line Canal | [145] | |
| Seasonal Water Quality Changes in Flooded Peat Soil Environments Due to Peat Soil, Water Depth, and Water Exchange Rate | [107] | |
| Water Quality Investigations of the Barker Slough Watershed, 1997–2001: North Bay Aqueduct Summary | [146] | |
| Natomas East Main Drainage Canal Water Quality Investigation | [147,148] | |
| Movement of Diuron and Hexazinone | [149] | |
| RTDF Years | Staten Island Wildlife-Friendly Farming Demonstration—Water Quality Monitoring | [150] |
| Steelhead Creek Water Quality Investigation | [151] | |
| Jones Tract Flood Water Quality Investigations | [152] | |
| Identifying Sources of DOC using Radiocarbon Age Dating | [153] | |
| Source, Fate, and Transport of Endocrine Disruptors, Pharmaceuticals, and Personal Care Products | [131] | |
| Travel Time and Longitudinal Dispersion Rates in the California State Water Project | [154] | |
| Lathrop Urban Runoff Study | [155] | |
| Delta Salinity Constituent Analysis | [58,59] | |
| Nitrosamine Precursors and Wastewater Indicators in Discharges in the Sacramento–San Joaquin Delta | [22] | |
| Limnology of the State Water Project Nutrient Budget Study: Nutrients at the Hood Water Quality Station | [156] | |
| FDOM Final Report: A Two-Year Comparison of Dissolved Organic Carbon to Fluorescence of Dissolved Organic Matter | [118] |
References
- McClusky, D.S.; Elliott, M. The Estuarine Ecosystem: Ecology, Threats and Management; OUP Oxford: Oxford, UK, 2004. [Google Scholar]
- Adey, W.H.; Loveland, K. Chapter 22: Estuaries Ecosystem Modeling and Restoration, in Dynamic Aquaria: Building and Restoring Living Ecosystems; Elsevier: Amsterdam, The Netherlands, 2007. [Google Scholar]
- Ross, D.A. Introduction to Oceanography; Harper Collins College Publishers: New York, NY, USA, 1995; ISBN 978-0-673-46938-0. [Google Scholar]
- Delta Stewardship Council. The Delta Plan. 2013. Available online: https://deltacouncil.ca.gov/delta-plan/ (accessed on 1 November 2020).
- California Department of Water Resources (CDWR). Management of the California State Water Project, Bulletin; CDWR: Sacramento, CA, USA, 2017; p. 132-16.
- Lund, J.R.; Hanak, E.; Fleenor, W.E.; Bennett, W.A.; Howitt, R.E.; Mount, J.F.; Moyle, P.B. Comparing futures for the Sacramento–San Joaquin Delta; University of California Press: Berkeley, CA, USA, 2010. [Google Scholar]
- California State Water Resources Control Board (CSWRCB). Water Rights Decision; CSWRCB: Sacramento, CA, USA, 2000.
- Lund, J.; Hanak, E.; Fleenor, W.; Howitt, R.; Mount, J.; Moyle, P. Envisioning Futures for the Sacramento–San Joaquin Delta; Public Policy Institute of California: San Francisco, CA, USA, 2007; Available online: http://www.ppic.org/main/publication.asp?i=671 (accessed on 1 November 2020).
- Gross, E.S.; Hutton, P.H.; Draper, A.J. A Comparison of Outflow and Salt Intrusion in the Pre-development and Contemporary San Francisco Estuary. San Fr. Estuary Watershed Sci. 2018, 16. [Google Scholar] [CrossRef] [Green Version]
- California Department of Public Works (CDPW). Division of Water Resources, Bulletin 27. Variation and Control of Salinity in the Sacramento–San Joaquin Delta and Upper San Francisco Bay. 1931. Available online: http://www.water.ca.gov/waterdatalibrary/docs/historic/Bulletins/Bulletin_27/Bulletin_27__1931.pdf (accessed on 1 November 2020).
- Edmonston, A.D.; Matthew, R.; Blackie, E.E. Bulletin No. 28, Economic Aspects of a Salt Water Barrier Below Confluence of Sacramento and San Joaquin Rivers. 1931. Available online: https://cawaterlibrary.net/document/bulletin-no-28-economic-aspects-of-a-salt-water-barrier-below-confluence-of-sacramento-and-san-joaquin-rivers/ (accessed on 9 September 2022).
- California Department of Water Resources (DWR). Bulletin No. 3 The California Water Plan. 1957. Available online: https://cawaterlibrary.net/document/bulletin-no-3-the-california-water-plan/ (accessed on 9 September 2022).
- Amy, G.L.; Thompson, J.M.; Tan, L.; Davis, M.K.; Krasner, S.W. Evaluation of THM Precursor Contributions from Agricultural Drains. J. AWWA 1990, 82, 57–64. [Google Scholar] [CrossRef]
- Lange, A.L.; Kawczynski, E. Controlling Organics: The Contra Costa County Water District Experience. J. AWWA 1978, 70, 653–660. [Google Scholar] [CrossRef]
- Krasner, S.W.; Schlimenti, M.J.; Means, E.G. Quality Degradation: Implications for DBP Formation. J. AWWA 1994, 86, 34–47. [Google Scholar] [CrossRef]
- Water Education Foundation. Layperson’s Guide to the Delta; Water Education Foundation: Sacramento, CA, USA, 2007. [Google Scholar]
- Najm, I.N.; Krasner, S.W. Effects of Bromide and NOM on By-Product Formation. J. AWWA 1995, 87, 106. [Google Scholar] [CrossRef]
- Wagner, E.D.; Plewa, M.J. CHO Cell Cytotoxicity and Genotoxicity Analyses of Disinfection By-Products: An Updated Review. J. Environ. Sci. 2017, 58, 64–76. [Google Scholar] [CrossRef]
- Kuivila, K.M.; Barnett, H.D.; Edmunds, J.L. Herbicide concentrations in the Sacramento-San Joaquin Delta, California. US Geological Survey Toxic Substances Hydrology Program: Contamination of Hydrologic Systems and Related Ecosystems. 1999; p. 69. Available online: https://ca.water.usgs.gov/archive/reports/wrir994018/CA-0218.pdf (accessed on 9 September 2022).
- Heidel, K.; Roy, S.; Creager, C.; Chung, C.; Grieb, T. Conceptual Model for Nutrients in the Central Valley and Sacramento-San Joaquin Delta, Prepared for USEPA Region IX and Central Valley Drinking Water Policy Workgroup; Tetra Tech: Pasadena, CA, USA, 2006. [Google Scholar]
- Krasner, S.W.; Croue, J.; Buffle, J.; Perdue, E.M. Three Approaches for Characterizing NOM. J. AWWA 1996, 88, 66–79. [Google Scholar] [CrossRef]
- Lee, C.T.; Krasner, S.W.; Sclimenti, M.J.; Prescott, M.; Guo, Y.C. Chapter 7: Nitrosamine Precursors and Wastewater Indicators in Discharges in the Sacramento-San Joaquin Delta. In Recent Advances in Disinfection By-Products; ACS Symposium Series; American Chemical Society: Washington, DC, USA, 2015. [Google Scholar] [CrossRef]
- Schemel, L.E. Salinity, Alkalinity, and Dissolved and Particulate Organic Carbon in the Sacramento River Water at Rio Vista, California, and at Other Locations in the Sacramento-San Joaquin Delta, 1980; Water Resources Investigations Report: 83-4059; US Geological Survey: Sacramento, CA, USA, 1984.
- Richardson, C.M.; Fackrell, J.K.; Kraus, T.E.; Young, M.B.; Paytan, A. Lateral Carbon Exports from Drained Peatlands: An Understudied Carbon Pathway in the Sacramento-San Joaquin Delta, California. J. Geophys. Res. Biogeosciences 2020, 125, e2020JG005883. [Google Scholar] [CrossRef]
- CDWR. Municipal Water Quality Investigations Program History and Studies 1983–2012, Division of Environmental Services. 2013. Available online: www.rtdf.info (accessed on 1 November 2020).
- CDWR. MWQI Work Plan: January–December 2020, Division of Environmental Services. 2019. Available online: www.rtdf.info (accessed on 9 September 2022).
- United States. 86 Stat. 816—An Act to Amend the Federal Water Pollution Control Act. 1972. Available online: https://www.govinfo.gov/app/details/STATUTE-86/STATUTE-86-Pg816 (accessed on 9 September 2022).
- United States. 88 Stat. 1660—Safe Drinking Water Act. 1974. Available online: https://www.govinfo.gov/app/details/STATUTE-88/STATUTE-88-Pg1660-2 (accessed on 1 November 2020).
- Rook, J.J. Formation of haloforms during chlorination of natural waters. Water Treat. Exam. 1974, 23, 234–243. [Google Scholar]
- Bellar, Τ.A.; Lichtenberg, J.J.; Kroner, R.C. The Occurrence of Organohalides in Chlorinated Drinking Waters. J. AWWA 1974, 66, 703–706. [Google Scholar] [CrossRef]
- Villanueva, C.M.; Cantor, K.P.; Cordier, S.; Jaakkola, J.J.; King, W.D.; Lynch, C.F.; Porru, S.; Kogevinas, M. Disinfection byproducts and bladder cancer: A pooled analysis. Epidemiology 2004, 15, 357–367. [Google Scholar] [CrossRef] [PubMed]
- U.S. Environmental Protection Agency (USEPA). Federal Register Volume 44, Issue 231 (29 November 1979). Available online: https://www.govinfo.gov/app/details/FR-1979-11-29 (accessed on 9 September 2022).
- CDWR. State Water Project Trihalomethane Study, Central District. April 1982. Available online: www.rtdf.info (accessed on 1 November 2020).
- Amy, G.L.; Tan, L.; Davis, M.K. The Effects of Ozonation and Activated Carbon Adsorption on Trihalomethane Speciation. Water Res. 1991, 25, 191. [Google Scholar] [CrossRef]
- McCarty, P.; DeFalco, P.; Doull, J.; Greenberg, A.; Miller, B.J.; O’Connor, D.; Pearl, E. Public Health Aspects of Sacramento-San Joaquin Delta Water Supplies: A Panel Report for the California Department of Water Resources. 31 December 1982. Available online: www.rtdf.info (accessed on 1 November 2020).
- CDWR. Interagency Delta Health Aspects Monitoring Program Project Report, Central District. May 1985. Available online: www.rtdf.info (accessed on 1 November 2020).
- CDWR. Interagency Delta Health Aspects Monitoring Program Project Report, Central District. December 1986. Available online: www.rtdf.info (accessed on 1 November 2020).
- CDWR. The Delta as a Source of Drinking Water: Monitoring Results 1983 to 1987, Interagency Delta Health Aspects Monitoring Program, Central District. August 1989. Available online: www.rtdf.info (accessed on 1 November 2020).
- CDWR. Project Report of The Interagency Delta Health Aspects Monitoring Program (Municipal Water Quality Investigations Program): Summary of Monitoring Results (January 1988–December 1989), Division of Local Assistance. October 1990. Available online: www.rtdf.info (accessed on 9 September 2022).
- Brown & Caldwell. Delta Drinking Water Quality Study, Technical Report Prepared for the California Urban Water Agencies. May 1989. Available online: https://static1.squarespace.com/static/5a565e93b07869c78112e2e5/t/5a9a0faa71c10b1a7df4a37c/1520046332824/DeltaDrinkingWaterQuality1989.pdf (accessed on 9 September 2022).
- USEPA. Federal Register Volume 54, Issue 77 (24 April 1989). Available online: https://www.govinfo.gov/app/details/FR-1989-04-24 (accessed on 9 September 2022).
- Robbins, R.W.; Glicker, J.L.; Bloem, D.M.; Niss, B.M. Effective Watershed Management for Surface Water Supplies. J. AWWA 1991, 83, 34–44. [Google Scholar] [CrossRef]
- CDWR. Annual Report of The Municipal Water Quality Investigations Program: Summary of Monitoring Results January 1990-December 1990, Division of Local Assistance. February 1993. Available online: www.rtdf.info (accessed on 1 November 2020).
- USEPA. National Primary Drinking Water Regulations: Disinfectants and Disinfection Byproducts. 1998. Available online: https://www.federalregister.gov/documents/1998/12/16/98-32887/national-primary-drinking-water-regulations-disinfectants-and-disinfection-byproducts (accessed on 9 September 2022).
- USEPA. National Primary Drinking Water Regulations: Stage 2 Disinfectants and Disinfection Byproducts Rule. 1998. Available online: https://www.federalregister.gov/documents/2006/01/04/06-3/national-primary-drinking-water-regulations-stage-2-disinfectants-and-disinfection-byproducts-rule (accessed on 9 September 2022).
- Jacangelo, J.G.; Patania, N.L.; Reagan, K.M.; Aieta, E.M.; Krasner, S.W.; McGuire, M.J. Ozonation: Assessing Its Role in the Formation and Control of Disinfection By-Products. J. AWWA 1989, 81, 74–84. [Google Scholar] [CrossRef]
- McGuire, M.J.; Davis, M.K.; Tate, C.H.; Aieta, E.M.; Howe, E.W.; Crittenden, J.C. Evaluating GAC for Trihalomethane Control. J. Am. Water Work. Assoc. 1991, 83, 38–48. [Google Scholar] [CrossRef]
- Krasner, S.W.; McGuire, M.J.; Jacangelo, J.G.; Patania, N.L.; Reagan, K.M.; Aieta, E.M. The Occurrence of Disinfection By-Products in U.S. Drinking Water. J. AWWA 1989, 81, 41. [Google Scholar] [CrossRef]
- Diehl, A.C.; Speitel, G.E., Jr.; Symons, J.M.; Krasner, S.W.; Hwang, C.J.; Barrett, S.E. DBP Formation During Chloramination. J. AWWA 2000, 92, 76. [Google Scholar] [CrossRef]
- State of California. Delta Water Quality: A Report to the Legislature on Trihalomethanes and the Quality of Drinking Water Available from the Sacramento-San Joaquin Delta. October 1991. Available online: https://link.sfpl.org/portal/Delta-water-quality--a-report-to-the-legislature/iD5C56mrWV4/ (accessed on 9 September 2022).
- USEPA. Perfluoroalkyl Sulfonates; Significant New Use Rule. 2002. Available online: https://www.govinfo.gov/content/pkg/FR-2002-12-09/pdf/02-31011.pdf (accessed on 9 September 2022).
- USEPA. National Primary Drinking Water Regulations: Stage 2 Disinfectants and Disinfection Byproducts Rule. 2006. Available online: https://www.federalregister.gov/documents/2006/01/04/06-3/national-primary-drinking-water-regulations-stage-2-disinfectants-and-disinfection-byproducts-rule (accessed on 9 September 2022).
- CDWR. Five-Year Report of The Municipal Water Quality Investigations Program: Summary and Findings During Five Dry Years (January 1987–December 1991), Division of Local Assistance. November 1994. Available online: www.rtdf.info (accessed on 1 November 2020).
- CDWR. 1992–1993 Biennial Memorandum Report of The Municipal Water Quality Investigations Program, Division of Local Assistance. April 1995. Available online: www.rtdf.info (accessed on 9 September 2022).
- CDWR. Data Report of The Municipal Water Quality Investigations Program: Summary of Monitoring Results Water Year 1994, Division of Local Assistance. July 1995. Available online: www.rtdf.info (accessed on 1 November 2020).
- CDWR. Municipal Water Quality Investigations Program Annual Report Water Year 1995, Division of Local Assistance. August 1996. Available online: www.rtdf.info (accessed on 9 September 2022).
- Study of Drinking Water Quality in Delta Tributaries. 1995. Available online: https://www.cuwa.org/publications-archive/r9wypzpbmbrbhcxtsarfwrg7p3msrk (accessed on 9 September 2022).
- Denton, R.A. Delta Salinity Constituent Analysis, Prepared for the State Water Project Contractors Authority. February 2015. Available online: https://www.baydeltalive.com/assets/588ee18bdb51ef1619ac6fd28b97f694/application/pdf/Denton_2015_Delta_Salinity_Constituents_Report.pdf (accessed on 9 September 2022).
- Hutton, P.H.; Sinha, A.; Roy, S.B. Simplified Approach for Estimating Salinity Constituent Concentrations in the San Francisco Estuary & Sacramento-San Joaquin River Delta: A User Guide, Report Prepared for the State Water Contractors. July 2022. Available online: https://rtdf.info/ (accessed on 1 November 2020).
- Krasner, S.W.; Sclimenti, M.J. Characterization of Natural Organic Matter: Disinfection By-Product Analysis. In Proceedings of the Proc. Workshop on Natural Organic Matter in Drinking Water: Origin, Characterization, and Removal (AWWARF & Lyonnaise des Eaux-Dumez), Chamonix, France, 1 January 1993; pp. 105–113. [Google Scholar]
- Hutton, P.H.; Chung, F.I. Bromine Distribution Factors in THM Formation. J. Water Resour. Plan. Manag. ASCE 1994, 120, 1–16. [Google Scholar] [CrossRef]
- Koch, B.; Krasner, S.W.; Sclimenti, M.J.; Schimpff, W.K. Predicting the Formation of DBPs by the Simulated Distribution System. J. AWWA 1991, 83, 62–70. [Google Scholar] [CrossRef]
- Hutton, P.H.; Chung, F.I. Correlating Trihalomethane Data. J. Environ. Eng. ASCE 1994, 120, 219–241. [Google Scholar] [CrossRef]
- CDWR. Representative Delta Island Return Flow Quality for Use in DSM2. Division of Planning, Modeling Support Branch. May 1995. Available online: https://www.sfei.org/sites/default/files/biblio_files/Appendix%206%20Updating%20DSM2%20nutrient%20calibration.pdf (accessed on 9 September 2022).
- CDWR. Trihalomethane Formation Potential in the Sacramento-San Joaquin Delta: Mathematical Model Development, Division of Planning. October 1991. [Google Scholar]
- CDWR. Chapter 3: Trihalomethane Formation Potential Modeling, in Methodology for Flow and Salinity Estimates in the Sacramento-San Joaquin Delta and Suisun Marsh, 12th Annual Progress Report. April 1991. Available online: https://water.ca.gov/Library/Modeling-and-Analysis/Bay-Delta-Region-models-and-tools/Delta-Simulation-Model-II (accessed on 1 November 2020).
- CDWR. Chapter 9: Trihalomethane Formation Potential Modeling, in Methodology for Flow and Salinity Estimates in the Sacramento-San Joaquin Delta and Suisun Marsh, 13th Annual Progress Report. June 1992. Available online: https://water.ca.gov/Library/Modeling-and-Analysis/Bay-Delta-Region-models-and-tools/Delta-Simulation-Model-II (accessed on 1 November 2020).
- CDWR. Chapter 7: Trihalomethane Formation Potential Modeling, in Methodology for Flow and Salinity Estimates in the Sacramento-San Joaquin Delta and Suisun Marsh, 14th Annual Progress Report. June 1993. Available online: https://water.ca.gov/Library/Modeling-and-Analysis/Bay-Delta-Region-models-and-tools/Delta-Simulation-Model-II (accessed on 1 November 2020).
- CDWR. Chapter 5: Disinfection By-Product Formation Modeling, in Methodology for Flow and Salinity Estimates in the Sacramento-San Joaquin Delta and Suisun Marsh, 15th Annual Progress Report. June 1994. Available online: https://water.ca.gov/Library/Modeling-and-Analysis/Bay-Delta-Region-models-and-tools/Delta-Simulation-Model-II (accessed on 1 November 2020).
- CDWR. Chapter 8: Disinfection By-Product Formation, in Methodology for Flow and Salinity Estimates in the Sacramento-San Joaquin Delta and Suisun Marsh, 16th Annual Progress Report. June 1995. Available online: https://water.ca.gov/Library/Modeling-and-Analysis/Bay-Delta-Region-models-and-tools/Delta-Simulation-Model-II (accessed on 1 November 2020).
- CDWR. Chapter 3: Impact of Delta Islands on Water Quality, in Methodology for Flow and Salinity Estimates in the Sacramento-San Joaquin Delta and Suisun Marsh, 17th Annual Progress Report. June 1996. Available online: https://water.ca.gov/Library/Modeling-and-Analysis/Bay-Delta-Region-models-and-tools/Delta-Simulation-Model-II (accessed on 1 November 2020).
- Hutton, P.H.; Chung, F.I. Simulating THM Formation Potential in Sacramento Delta: Part I. J. Water Resour. Plan. Manag. ASCE 1992, 118, 513–529. [Google Scholar] [CrossRef]
- Hutton, P.H.; Chung, F.I. Simulating THM Formation Potential in Sacramento Delta: Part II. J. Water Resour. Plan. Manag. ASCE 1992, 118, 530–542. [Google Scholar] [CrossRef]
- Hutton, P.H.; Enright, C. Simulating THM Precursors Transport with DWRDSM. In Proceedings of the Hydraulics Engineering ‘93: Proceedings of the 1993 Conference, San Francisco, CA, USA, 25–30 July 1993; pp. 821–826. [Google Scholar]
- Hutton, P.H.; Sandhu, N.; Chung, F.I. Predicting THM Formation with Artificial Neural Networks. In Proceedings of the 1996 North American Water and Environment Congress, ASCE, Anaheim, CA, USA, 22–28 June 1996. [Google Scholar]
- Hutton, P.H.; Mahadevan, N.; Chung, F.I. Simulating DBP Precursor Transport in Sacramento Delta. In Proceedings of the Proceedings 1996 North American Water and Environment Congress, ASCE, Anaheim, CA, USA, 22–28 June 1996. [Google Scholar]
- CALFED Bay-Delta Program, 2000. Programmatic Record of Decision. Available online: https://www.ccwater.com/DocumentCenter/View/3213/CALFED-Programmatic-ROD--Aug-28-2000?bidId= (accessed on 1 November 2021).
- CDWR. The Municipal Water Quality Investigations Program Summary and Findings of Data Collected from the Sacramento-San Joaquin Delta Region, October 2005 through September 2007, Division of Environmental Services. June 2008. Available online: www.rtdf.info (accessed on 1 November 2020).
- CDWR. The Municipal Water Quality Investigations Program Summary and Findings from Data Collected August 1998 through September 2001, Division of Environmental Services. July 2003. Available online: www.rtdf.info (accessed on 1 November 2020).
- CDWR. The Municipal Water Quality Investigations Program Summary and Findings from Data Collected October 2001 through September 2003, Division of Environmental Services. June 2005. Available online: www.rtdf.info (accessed on 1 November 2020).
- CDWR. Municipal Water Quality Investigations Program Annual Report October 1995-December 1996, Division of Planning and Local Assistance. December 1997. Available online: www.rtdf.info (accessed on 1 November 2020).
- CDWR. Municipal Water Quality Investigations Program Annual Report 1997–1998, Division of Planning and Local Assistance. October 2000. Available online: www.rtdf.info (accessed on 1 November 2020).
- CDWR. The Municipal Water Quality Investigations Program Summary and Findings of Data Collected from the Sacramento-San Joaquin Delta Region, October 2003 through September 2005, Division of Environmental Services. December 2006. Available online: www.rtdf.info (accessed on 1 November 2020).
- CDWR. Real-Time Monitoring of Organic Carbon in the Sacramento River and California State Water Project Using Process Analyzers, Division of Planning & Local Assistance. May 2001. Available online: www.rtdf.info (accessed on 1 November 2020).
- Ngatia, M.; Pimental, J. Comparisons of Organic Carbon Analyzers and Related Importance to Water Quality Assessments. San Fr. Estuary Watershed Sci. 2007, 5. [Google Scholar] [CrossRef] [Green Version]
- CDWR. Real-Time, Continuous Monitoring of Bromide and Nutrients at Harvey O. Banks Pumping Plant and San Joaquin River near Vernalis, Division of Environmental Services. July 2008. Available online: www.rtdf.info (accessed on 1 November 2020).
- Sickman, J.; OGonzalez, D.; San Julian, S. Real-time monitoring of organic carbon in the Sacramento River and California State Water Project Using Process Analyzers, prepared for CDWR MWQI program. 11 April 2005. Available online: www.rtdf.info (accessed on 1 November 2020).
- Chow, A.T.; Guo, F.; Gao, S.; Breuer, R.S. Trihalomethane Formation Potential of Filter Isolates of Electrolyte-Extractable Soil Organic Carbon. J. Environ. Qual. 2005, 34, 1992–1997. [Google Scholar] [CrossRef] [PubMed]
- Chow, A.T.; Guo, F.; Gao, S.; Breuer, R.; Dahlgren, R.A. Filter pore size selection for characterizing dissolved organic carbon and trihalomethane precursors from soils. Water Res. 2005, 39, 1255–1264. [Google Scholar] [CrossRef]
- Chow, A.T.; Guo, F.; Gao, S.; Breuer, R.S. Trihalomethane Reactivity of Water- and Sodium Hydroxide–Extractable Organic Carbon Fractions from Peat Soils. J. Environ. Qual. 2006, 35, 114–121. [Google Scholar] [CrossRef] [Green Version]
- Chow, A.T.; Guo, F.; Gao, S.; Breuer, R.S. Size and XAD fractions of trihalomethane precursors from soils. Chemosphere 2006, 62, 1636–1646. [Google Scholar] [CrossRef]
- DiGiorgio, C.L.; Gonzalez, D.A.; Huitt, C.C. Cryptosporidium and Giardia Recoveries in Natural Waters by Using Environmental Protection Agency Method 1623. Appl. Environ. Microbiol. 2002, 68, 5952–5955. [Google Scholar] [CrossRef] [Green Version]
- Woodard, R. Sources and Magnitudes of Water Quality Constituents of Concern in Drinking Water Supplies Taken from the Sacramento-San Joaquin Delta; Technical Report; CALFED Bay-Delta Program: West Sacramento, CA, USA, 2000.
- Jung, M. Revision of Representative Delta Island Return Flow Quality for DSM2 and DICU Model Runs, prepared for the CALFED Ad-Hoc Workgroup to Simulate Historical Water Quality Conditions in the Delta, Consultant’s Report to the CDWR MWQI Program. December 2000. Available online: www.rtdf.info (accessed on 1 November 2020).
- CDWR. DSM2: Delta Simulation Model II. 2020. Available online: https://water.ca.gov/Library/Modeling-and-Analysis/Bay-Delta-Region-models-and-tools/Delta-Simulation-Model-II (accessed on 1 November 2020).
- CDWR. Chapter 3: Simulation of Historical DOC and UVA Conditions in the Delta, in Methodology for Flow and Salinity Estimates in the Sacramento-San Joaquin Delta and Suisun Marsh, 22nd Annual Progress Report. August 2001. Available online: https://water.ca.gov/Library/Modeling-and-Analysis/Bay-Delta-Region-models-and-tools/Delta-Simulation-Model-II (accessed on 1 November 2020).
- CDWR. Chapter 7: Generating Monthly Dissolved Organic Carbon and UVA at DSM2 Boundaries, in Methodology for Flow and Salinity Estimates in the Sacramento-San Joaquin Delta and Suisun Marsh, 23rd Annual Progress Report. June 2002. Available online: https://water.ca.gov/Library/Modeling-and-Analysis/Bay-Delta-Region-models-and-tools/Delta-Simulation-Model-II (accessed on 1 November 2020).
- CDWR. Chapter 9: DOC Growth in QUAL, in Methodology for Flow and Salinity Estimates in the Sacramento-San Joaquin Delta and Suisun Marsh, 23rd Annual Progress Report. June 2002. Available online: https://water.ca.gov/Library/Modeling-and-Analysis/Bay-Delta-Region-models-and-tools/Delta-Simulation-Model-II (accessed on 1 November 2020).
- CDWR. Chapter 7: Implementation of a New DOC Growth Algorithm in DSM2-QUAL, in Methodology for Flow and Salinity Estimates in the Sacramento-San Joaquin Delta and Suisun Marsh, 24th Annual Progress Report. August 2003. Available online: https://water.ca.gov/Library/Modeling-and-Analysis/Bay-Delta-Region-models-and-tools/Delta-Simulation-Model-II (accessed on 1 November 2020).
- CALFED Bay-Delta Program. In-Delta Storage Program, Draft Summary Report. May 2002. Available online: https://cawaterlibrary.net/wp-content/uploads/2017/05/CALFED-Staff-review-of-Delta-Conveyance-Reports.pdf (accessed on 9 September 2022).
- CDWR. Chapter 3: Jones Tract 2004 Levee Break DSM2 Simulation, in Methodology for Flow and Salinity Estimates in the Sacramento-San Joaquin Delta and Suisun Marsh, 26th Annual Progress Report. October 2005. Available online: https://water.ca.gov/Library/Modeling-and-Analysis/Bay-Delta-Region-models-and-tools/Delta-Simulation-Model-II (accessed on 1 November 2020).
- Liudzius, T. California Aqueduct Water Quality Modeling Results for Proof of Concept Water Quality Forecast, MWDSC Memorandum Report. 1 December 2003. Available online: www.rtdf.info (accessed on 1 November 2020).
- Hutton, P. Seasonal Water Quality Forecast Proof of Concept, MWDSC Memorandum to MWQI RTDF Steering Committee. 22 January 2004. Available online: www.rtdf.info (accessed on 1 November 2020).
- CDWR. Chapter 8: Real-Time Data and Forecasting Proof of Concept and Development, in Methodology for Flow and Salinity Estimates in the Sacramento-San Joaquin Delta and Suisun Marsh, 25th Annual Progress Report. October 2004. Available online: https://water.ca.gov/Library/Modeling-and-Analysis/Bay-Delta-Region-models-and-tools/Delta-Simulation-Model-II (accessed on 1 November 2020).
- CH2MHill. DSM2 Extension for the California Aqueduct, South Bay Aqueduct, and Delta-Mendota Canal Phase 2, prepared for State Water Contractors and MWQI Program. June 2005. Available online: www.rtdf.info (accessed on 1 November 2020).
- CH2MHill. DSM2 Extension for the California Aqueduct, South Bay Aqueduct, and Delta-Mendota Canal Phase 2 Analysis, prepared for State Water Contractors and CDWR’ MWQI Program. June 2008. Available online: www.rtdf.info (accessed on 1 November 2020).
- Jung, M.; Weisser, L. Seasonal Water Quality Changes in Flooded Peat Soil Environments Due to Peat Soil, Water Depth, and Water Exchange Rate, prepared for CDWR Division of Planning & Local Assistance. December 2000. Available online: www.rtdf.info (accessed on 9 September 2022).
- Breuer, R. Real Time Data and Forecasting Project Water Quality Weekly Report; Office of Water Quality, Department of Water Resources: Sacramento, CA, USA, 2004; Volume 1. [Google Scholar]
- CDWR. Management of the California State Water Project; Bulletin 132-13. April 2015. Available online: https://ostromworkshop.indiana.edu/pdf/seriespapers/2021spr-colloq/chaudhry.pdf (accessed on 9 September 2022).
- CDWR. Management of the California State Water Project, Bulletin 132-14. November 2015. Available online: https://water.ca.gov/-/media/DWR-Website/Web-Pages/Programs/State-Water-Project/Management/Bulletin-132/Bulletin-132/Files/Bulletin-132-14-r.pdf (accessed on 9 September 2022).
- CDWR. Management of the California State Water Project, Bulletin 132-15. July 2016. Available online: https://water.ca.gov/programs/state-water-project/management/bulletin-132 (accessed on 9 September 2022).
- CDWR. Water Quality Assessment of Non-Project Turn-ins to the California Aqueduct, 2015; Division of Operations & Maintenance. December 2016. Available online: https://www.scwa2.com/wp-content/uploads/2020/01/N21e.2017-SWP-Sanitary-Survey-Update_reduced_version-ID-253435.pdf (accessed on 9 September 2022).
- USEPA. Contaminant Candidate List 3 (CCL3). 2009. Available online: http://water.epa.gov/scitech/drinkingwater/dws/ccl/ccl3.cfm (accessed on 1 November 2020).
- Cowman, G.A.; Singer, P.C. Effect of Bromide Ion on Haloacetic Acid Speciation Resulting from Chlorination and Chloramination of Aquatic Humic Substances. Environ. Sci. Technol. 1996, 30, 16. [Google Scholar] [CrossRef]
- Shen, R.; Andrews, S.A. Demonstration of 20 pharmaceuticals and personal care products (PPCPs) as nitrosamine precursors during chloramine disinfection. Water Res. 2011, 45, 944–952. [Google Scholar] [CrossRef]
- CDWR. The Municipal Water Quality Investigations Program Summary and Findings of Data Collected from the Sacramento-San Joaquin Delta Region, October 2007—September 2009, Division of Environmental Services. June 2010. Available online: www.rtdf.info (accessed on 1 November 2020).
- Bettencourt, M. Get the Data Out: Real Time Data Dissemination from Isolated Monitoring Stations within the Delta. In Proceedings of the AWWA Cal-Nevada Section 2013 Fall Conference, San Diego, CA, USA, 1 October 2013. [Google Scholar]
- Del Cid, J. FDOM Final Report: A Two-Year Comparison of Dissolved Organic Carbon to Fluorescence of Dissolved Organic Matter; Unpublished Report. MWQI, 2019. Available online: https://rtdf.info/public_docs/Miscellaneous%20RTDF%20Web%20Page%20Information/Other%20MWQP%20and%20DWR%20Publications/FDOM%20Final%20Report_pdf.pdf (accessed on 9 September 2022).
- Downing, B.D.; Pellerin, B.A.; Bergamaschi, B.A.; Saraceno, J.F.; Kraus, T.E.C. Seeing the light: The effects of particles, dissolved materials, and temperature on in situ measurements of DOM fluorescence in rivers and streams: Effects and compensation for in situ DOM fluorescence, Limnology and Oceanography. Limnol. Oceanogr. Methods 2012, 10, 767–775. [Google Scholar] [CrossRef]
- Downing, B.D.; Bergamaschi, B.A.; Kraus, T.E.C. Synthesis of Data from High-Frequency Nutrient and Associated Biogeochemical Monitoring for the Sacramento–San Joaquin Delta, Northern California; Scientific Investigations Report; US Geological Survey: Sacramento, CA, USA, 2017; pp. 2017–5066. 28 p. [CrossRef] [Green Version]
- CDWR. Chapter 2: Data Quality Associated with EC Values in the DICU Model, in Methodology for Flow and Salinity Estimates in the Sacramento-San Joaquin Delta and Suisun Marsh, 30th Annual Progress Report. June 2009. Available online: https://water.ca.gov/Library/Modeling-and-Analysis/Bay-Delta-Region-models-and-tools/Delta-Simulation-Model-II (accessed on 1 November 2020).
- CDWR. Chapter 3: DSM2 Dissolved Organic Carbon Boundary Condition Improvement, in Methodology for Flow and Salinity Estimates in the Sacramento-San Joaquin Delta and Suisun Marsh, 32nd Annual Progress Report. August 2011. Available online: https://water.ca.gov/Library/Modeling-and-Analysis/Bay-Delta-Region-models-and-tools/Delta-Simulation-Model-II (accessed on 1 November 2020).
- CDWR. Chapter 2: Extension of DSM2 for the South Bay and California Aqueducts and Delta Mendota Canal, in Methodology for Flow and Salinity Estimates in the Sacramento-San Joaquin Delta and Suisun Marsh, 34th Annual Progress Report. June 2013. Available online: https://water.ca.gov/Library/Modeling-and-Analysis/Bay-Delta-Region-models-and-tools/Delta-Simulation-Model-II (accessed on 1 November 2020).
- CDWR. Chapter 9: DOC Validation with DSM2, in Methodology for Flow and Salinity Estimates in the Sacramento-San Joaquin Delta and Suisun Marsh, 32nd Annual Progress Report. August 2011. Available online: https://water.ca.gov/Library/Modeling-and-Analysis/Bay-Delta-Region-models-and-tools/Delta-Simulation-Model-II (accessed on 1 November 2020).
- Uecker, I. Development of a Multiple Linear Regression Forecast Model for Dissolved Organic Carbon DSM2 Boundary Conditions, internal CDWR memorandum. 2020. Available online: https://link.springer.com/article/10.1007/s40899-020-00377-9 (accessed on 9 September 2022).
- CDWR. Chapter 14: DSM2 Fingerprinting Methodology, in Methodology for Flow and Salinity Estimates in the Sacramento-San Joaquin Delta and Suisun Marsh, 23rd Annual Progress Report. June 2002. Available online: https://water.ca.gov/Library/Modeling-and-Analysis/Bay-Delta-Region-models-and-tools/Delta-Simulation-Model-II (accessed on 1 November 2020).
- CDWR. Chapter 6: Fingerprinting: Clarifications and Recent Applications, in Methodology for Flow and Salinity Estimates in the Sacramento-San Joaquin Delta and Suisun Marsh, 26th Annual Progress Report. October 2005. Available online: https://water.ca.gov/Library/Modeling-and-Analysis/Bay-Delta-Region-models-and-tools/Delta-Simulation-Model-II (accessed on 1 November 2020).
- Hutton, P.; Chen, L.; Roy, S. Assessment of MWQI Seasonal Water Quality Forecasts; Final Report; MWQI Specific Project Committee: West Sacramento, CA, USA, 2020. [Google Scholar]
- Chen, L.; Roy, S.B.; Hutton, P.H. Emulation of a Process-Based Estuarine Hydrodynamic Model. Hydrol. Sci. J. 2018, 63, 783–802. [Google Scholar] [CrossRef]
- Krasner, S.W.; Amy, G.L. Jar-Test Evaluations of Enhanced Coagulation. J. AWWA 1995, 87, 93–107. [Google Scholar] [CrossRef]
- Guo, Y.C.; Krasner, S.W.; Fitzsimmons, S.; Woodside, G.; Yamachika, N. Source, Fate, and Transport of Endocrine Disruptors, Pharmaceuticals, and Personal Care Products in Drinking Water Sources in California—Final Project Report; Water Research Institute: Fountain Valley, CA, USA, 2010. [Google Scholar]
- Chen, W.; Haunschild, K.; Lund, J.R.; Fleenor, W.E. Current and Long-Term Effects of Delta Water Quality on Drinking Water Treatment Costs from Disinfection Byproduct Formation. San Fr. Estuary Watershed Sci. 2010, 8. [Google Scholar] [CrossRef] [Green Version]
- Suits, B. DSM2 DOC Modeling Results for MWQI’s Study of DOC in Agricultural Drainage Contribution to DOC at Delta Exports, Internal CDWR memorandum. 2003. Available online: https://water.ca.gov/Library/Modeling-and-Analysis/Bay-Delta-Region-models-and-tools/Delta-Simulation-Model-II (accessed on 9 September 2022).
- Brown & Caldwell. Sanitary Survey of the State Water Project; State Water Contractors: Sacramento, CA, USA, 1990. [Google Scholar]
- CDWR. Sanitary Survey Update Report 1996, prepared for the State Water Contractors. May 1996. Available online: www.rtdf.info (accessed on 9 September 2022).
- CDWR. Sanitary Survey Update Report 2001, Prepared for the State Water Contractors. December 2001. Available online: www.rtdf.info (accessed on 9 September 2022).
- Archibald Consulting, Richard Woodard Water Quality Consultants, and Palencia Consulting Engineers, California State Water Project Watershed Sanitary Survey 2006 Update, Prepared for the SWP Contractors Authority. June 2007. Available online: www.rtdf.info (accessed on 9 September 2022).
- Archibald Consulting, Palencia Consulting Engineers, and Starr Consulting. California State Water Project Watershed Sanitary Survey 2011 Update, prepared for the SWP Contractors Authority and CDWR. June 2012. Available online: www.rtdf.info (accessed on 1 November 2020).
- Palencia Consulting Engineers and Starr Consulting. California State Water Project 2016 Watershed Sanitary Survey Update, prepared for the State Water Project Contractors Authority. June 2017. Available online: www.rtdf.info (accessed on 1 November 2020).
- Fujii, R.; Ranalli, J.A.; Aiken, G.R.; Bergamaschi, B. Dissolved Organic Carbon Concentrations and Compositions, and Trihalomethane Formation Potentials in Waters from Agricultural Peat Soils, Sacramento-San Joaquin Delta, California: Implications for Drinking-Water Quality; US Geological Survey: Sacramento, CA, USA, 1998.
- Templin, W.E.; Cherry, D.E. Drainage-Return, Surface-Water Withdrawal, and Land-Use Data for the Sacramento-San Joaquin Delta, with Emphasis on Twitchell Island, California; Open-File Report 97-350; US Geological Survey: Sacramento, CA, USA, 1997.
- Jung, M.; Tran, Q. Delta Island Drainage Volume Estimates 1954–1955 Verses 1995–1996, Prepared for DWR Division of Planning & Local Assistance. January 1998. Available online: www.rtdf.info (accessed on 1 November 2020).
- CDWR. The North Bay Aqueduct Barker Slough Watershed Water Quality Phase 1 Report, Division of Planning & Local Assistance, Division of O&M. July 1998. Available online: www.rtdf.info (accessed on 1 November 2020).
- Jung, M.; Tran, Q. Candidate Delta Regions for Treatment to Reduce Organic Carbon Loads, prepared for DWR’s Division of Planning & Local Assistance. January 1999. Available online: www.rtdf.info (accessed on 1 November 2020).
- CDWR. Environmental Study of Dredged Materials: Grant Line Canal, Office of SWP Planning, Division of Planning and Local Assistance. January 2000. Available online: www.rtdf.info (accessed on 1 November 2020).
- CDWR. Water Quality Investigations of the Barker Slough Watershed, 1997-2001: North Bay Aqueduct Summary, Division of Environmental Services. May 2002. Available online: www.rtdf.info (accessed on 1 November 2020).
- CDWR. Natomas East Main Drainage Canal Water Quality Investigation: Initial Technical Report, prepared for the State Water Contractors, Division of Environmental Services. November 2003. Available online: www.rtdf.info (accessed on 1 November 2020).
- Sickman, J.O.; Zanoli, M.J.; Mann, H.L. Effects of Urbanization on Organic Carbon Loads in the Sacramento River, California. Water Resour. Res. 2007, 43, W11422. [Google Scholar] [CrossRef] [Green Version]
- Prichard, T.; Troiano, J.; Marade, J.; Guo, F.; Canevari, M. Movement of Diuron and Hexazinone in Clay Soil and Infiltrated Pond Water. J. Environ. Qual. 2005, 34, 2005–2017. [Google Scholar] [CrossRef]
- CDWR. Staten Island Wildlife-Friendly Farming Demonstration—Water Quality Monitoring: Final Report, prepared under CALFED Grant #ERP-02-P08, MWQI Unit, 18 June 2007. Available online: www.rtdf.info (accessed on 1 November 2020).
- CDWR. Steelhead Creek Water Quality Investigation: Final Technical Report, Division of Environmental Services. February 2008. Available online: www.rtdf.info (accessed on 1 November 2020).
- CDWR. Jones Tract Flood Water Quality Investigations, Division of Environmental Services. July 2009. Available online: www.rtdf.info (accessed on 1 November 2020).
- Sickman, J.O.; DiGiorgio, C.L.; Davisson, M.L.; Lucero, D.M.; Bergamaschi, B. Identifying sources of dissolved organic carbon in agriculturally dominated rivers using radiocarbon age dating: Sacramento-San Joaquin River Basin, California. Biodegradation 2009, 99, 79–96. [Google Scholar] [CrossRef]
- CDWR. Travel Time and Longitudinal Dispersion Rates in the California State Water Project, Division of Environmental Services. December 2012. Available online: www.rtdf.info (accessed on 1 November 2020).
- CDWR. Lathrop Urban Runoff Study: Final Technical Report, Division of Environmental Services. February 2015. Available online: www.rtdf.info (accessed on 1 November 2020).
- CDWR. Limnology of the State Water Project Nutrient Budget Study: Nutrients at the Hood Water Quality Station, Division of Environmental Services. September 2017. Available online: www.rtdf.info (accessed on 1 November 2020).
Figure 1.
Map of study area identifying MWQI routine discrete and real time monitoring locations (noted as RTDF stations, for real time data forecasting).
Figure 1.
Map of study area identifying MWQI routine discrete and real time monitoring locations (noted as RTDF stations, for real time data forecasting).

Figure 2.
Timeline showing the evolution of drinking water regulations, MWQI program activities, and ozone implementation by participating MWQI water contractors.
Figure 2.
Timeline showing the evolution of drinking water regulations, MWQI program activities, and ozone implementation by participating MWQI water contractors.

Figure 3.
Representative data from the MWQI Program at the Banks Station: (a) Bromide (Br−) and (b) TOC. Data are downloaded from the California Water Data Library (WDL Water Quality Data (ca.gov), accessed 21 July 2021).
Figure 3.
Representative data from the MWQI Program at the Banks Station: (a) Bromide (Br−) and (b) TOC. Data are downloaded from the California Water Data Library (WDL Water Quality Data (ca.gov), accessed 21 July 2021).

Figure 4.
Representative fingerprint charts for Clifton Court Forebay using the DSM2 model. Sources tracked by the model include seawater intrusion (Martinez), in-Delta agricultural return flows (Delta), Cosumnes and Mokelumne Rivers (East), San Joaquin River at Vernalis (SJR), and Sacramento River at Hood (Sac). Symbols show the observed concentrations at these stations.

Table 1.
MWQI Real Time Stations and Parameters.
| Station Name | CDEC ID | Installation Date | MWQI Program Parameters | Non-Program Parameters (Collected by Non-MWQI Programs) |
|---|---|---|---|---|
| Sacramento River at Hood | SRH | 1999 | TOC, DOC | Water: Chlorophyll, EC, Dissolved Oxygen, pH, Temperature, Turbidity Atmospheric: Solar Radiation, Temperature, Wind Speed and Direction |
| San Joaquin River at Vernalis | SJR | 2005 | TOC, DOC, Bromide, Chloride, Nitrate, Sulfate | Water: Chlorophyll, EC, Dissolved Oxygen, pH, Temperature, Turbidity Atmospheric: Solar Radiation, Temperature, Wind Speed and Direction |
| Banks Pumping Plant | HRO | 2001 | TOC, DOC, Bromide, Chloride, Nitrate, Sulfate, EC, Temperature, Dissolved Oxygen, pH, FDOM, Algal Fluorescence | Water: EC, pH, Temperature, Turbidity, Fluorescence, Pump Discharge Atmospheric: Temperature, Wind Speed and Direction |
| Jones Pumping Plant | TRP | 2009 | TOC, DOC, Bromide, Chloride, Nitrate, Sulfate, EC, Temperature, Dissolved Oxygen, pH, FDOM, Algal Fluorescence | Water: EC, Temperature, Pump Discharge |
| Gianelli | ONG | 2012 | TOC, DOC, Bromide, Chloride, Nitrate, Sulfate, EC, Temperature, Dissolved Oxygen, pH, FDOM, Algal Fluorescence | Water: Pump and Generation Discharge |
Note: Abbreviations and definitions: EC = electrical conductivity (surrogate for salinity); TOC = total organic carbon; DOC = dissolved organic carbon; FDOM = Fluorescent Dissolved Organic Matter (refers to the fraction of organic matter that fluoresces). Algal fluorescence refers to the detection of cyanobacterial and algal cells via measurement of fluorescence from specific pigments.
Publisher’s Note: MDPI stays neutral with regard to jurisdictional claims in published maps and institutional affiliations. |
© 2022 by the authors. Licensee MDPI, Basel, Switzerland. This article is an open access article distributed under the terms and conditions of the Creative Commons Attribution (CC BY) license (https://creativecommons.org/licenses/by/4.0/).
Share and Cite
MDPI and ACS Style
Hutton, P.H.; Roy, S.B.; Krasner, S.W.; Palencia, L. The Municipal Water Quality Investigations Program: A Retrospective Overview of the Program’s First Three Decades. Water 2022, 14, 3426. https://doi.org/10.3390/w14213426
AMA Style
Hutton PH, Roy SB, Krasner SW, Palencia L. The Municipal Water Quality Investigations Program: A Retrospective Overview of the Program’s First Three Decades. Water. 2022; 14(21):3426. https://doi.org/10.3390/w14213426
Chicago/Turabian StyleHutton, Paul H., Sujoy B. Roy, Stuart W. Krasner, and Leslie Palencia. 2022. "The Municipal Water Quality Investigations Program: A Retrospective Overview of the Program’s First Three Decades" Water 14, no. 21: 3426. https://doi.org/10.3390/w14213426
Note that from the first issue of 2016, this journal uses article numbers instead of page numbers. See further details here.