

Environmental Assessment of Surface Seawater in Al-Uqair Coastline, Eastern Saudi Arabia

1
Geology and Geophysics Department, College of Science, King Saud University, Riyadh 11451, Saudi Arabia
2
Abdullah Alrushaid Chair for Earth Science Remote Sensing Research, Geology and Geophysics Department, College of Science, King Saud University, Riyadh 11451, Saudi Arabia
*
Author to whom correspondence should be addressed.
Water 2022, 14(21), 3423; https://doi.org/10.3390/w14213423
Submission received: 8 October 2022
/
Revised: 25 October 2022
/
Accepted: 26 October 2022
/
Published: 27 October 2022
(This article belongs to the Special Issue Coastal Processes and Climate Change)
Abstract
:The contamination of seawater with anthropogenic factors is a global challenge because of its negative impacts on marine environments and coastal societies. Therefore, assessing water contamination is crucial. The present work uses pollution indices and multivariate statistical analyses to document high-level heavy metal concentrations and identify potential polluters by analyzing 35 seawater samples collected from Al-Uqair coastline, Arabian Gulf, Saudi Arabia. The total content of heavy metals (HMs) (μg/L) ranged from 7109 to 7398 for Sr, 7.00–14.50 for Cr, 3.30–9.90 for Zn, 3.00–8.80 for Fe, 4.40–7.60 for As, 1.20–6.90 for Ni, 2.30–4.70 for V, 1.10–3.80 for Cu, 2.50–3.10 for Se, 0.31–1.43 for Al, 0.18–1.10 for Hg, 0.04–0.08 for Cd, 0.09–0.43 for Pb, and 0.02–0.10 for Sb. The recorded average concentrations of HMs were below the maximal admissible concentration of the World Health Organization (WHO). The heavy-metal pollution index (HPI) indicates that 14.29% of the water samples were below medium pollution, and 85.71% were below high pollution. All seawater samples were categorized under low contamination and good water on the basis of the degree of contamination (Cd) and water pollution index (PIj), respectively. Multivariate analysis indicates mixed anthropogenic and natural sources for the investigated metals, with increasing control of the anthropogenic factors for Cr, Zn, As, V, Ni, Se, Cu, Hg, Pb, Sb, and Cd; and the control of natural factors for Sr, Fe, and Al.
1. Introduction
Heavy metals (HMs) released into the environment by ever-increasing industrial and domestic human activities profoundly affect ecosystems [1,2]. Even low levels of As, Pb, Hg, Cd, and Ni are classified as mutagens and human carcinogens [3]. Abnormally high concentrations of HMs pose grave environmental risks, negatively affecting animals, plants, and humans alike [4,5]. HMs sourced from natural sources are usually found in the environment at low concentrations, whereas anthropogenically sourced HMs are characterized by higher concentrations with severe negative environmental impacts [6,7]. For instance, eutrophication in aquatic ecosystems is caused by the accumulation of nutrients in lakes and coastal waters from agricultural pollution sources, and critically impacts biodiversity and fisheries [8].
Extensive development along coastal regions often has a negative impact due to the production of waste pollutants in the coastal and marine resources [9,10,11,12,13]. HM pollutants are not evenly dispersed in the sea, but are mainly concentrated in coastal waters. Human settlements, industries, and farming are considered to be major contributors to water pollution [8]. Other causes of marine pollution include: accidental spillages (chemical and oil spills), operational discharges, emissions from antifouling paints, medicinal products (antibiotics, parasiticides, anesthetics, disinfectants), and off-shore oil and gas mining operations [14,15]. HMs also circulate in nature through rock weathering, airborne sediment particles, and volcanic eruption processes, where they are transferred from land to rivers to ocean. HMs then adsorb onto the particles and sink into the sediment [15]. Metal contamination is ecotoxicologically important in coastal marine regions because of its toxicity and long-term stay in these environments [2,16,17,18].
Sediments along the Saudi Arabian Gulf coasts and associated environments were intensely investigated [18,19,20,21,22,23,24,25,26,27,28,29]. The ecological impact of the heavy-metal contamination in sediment samples from Al-Uqair beach was assessed and valuated [30]. The authors concluded that the sediments were enriched to the contamination level with Se, Hg, As, and Cd. The authors attributed the enrichment of the metals to anthropogenic sources linked to agricultural runoff and sewage leakage. However, the environmental and quality assessment of surface seawater along the Saudi Arabian Gulf coasts have not been fully investigated, and studies in this regard are scarce. The present study, therefore, aims to assess HM pollution in the surface seawater of Al-Uqair coastline using pollution indices, and to pinpoint potential HM sources using different statistical parameters.
2. Materials and Methods
2.1. Sampling
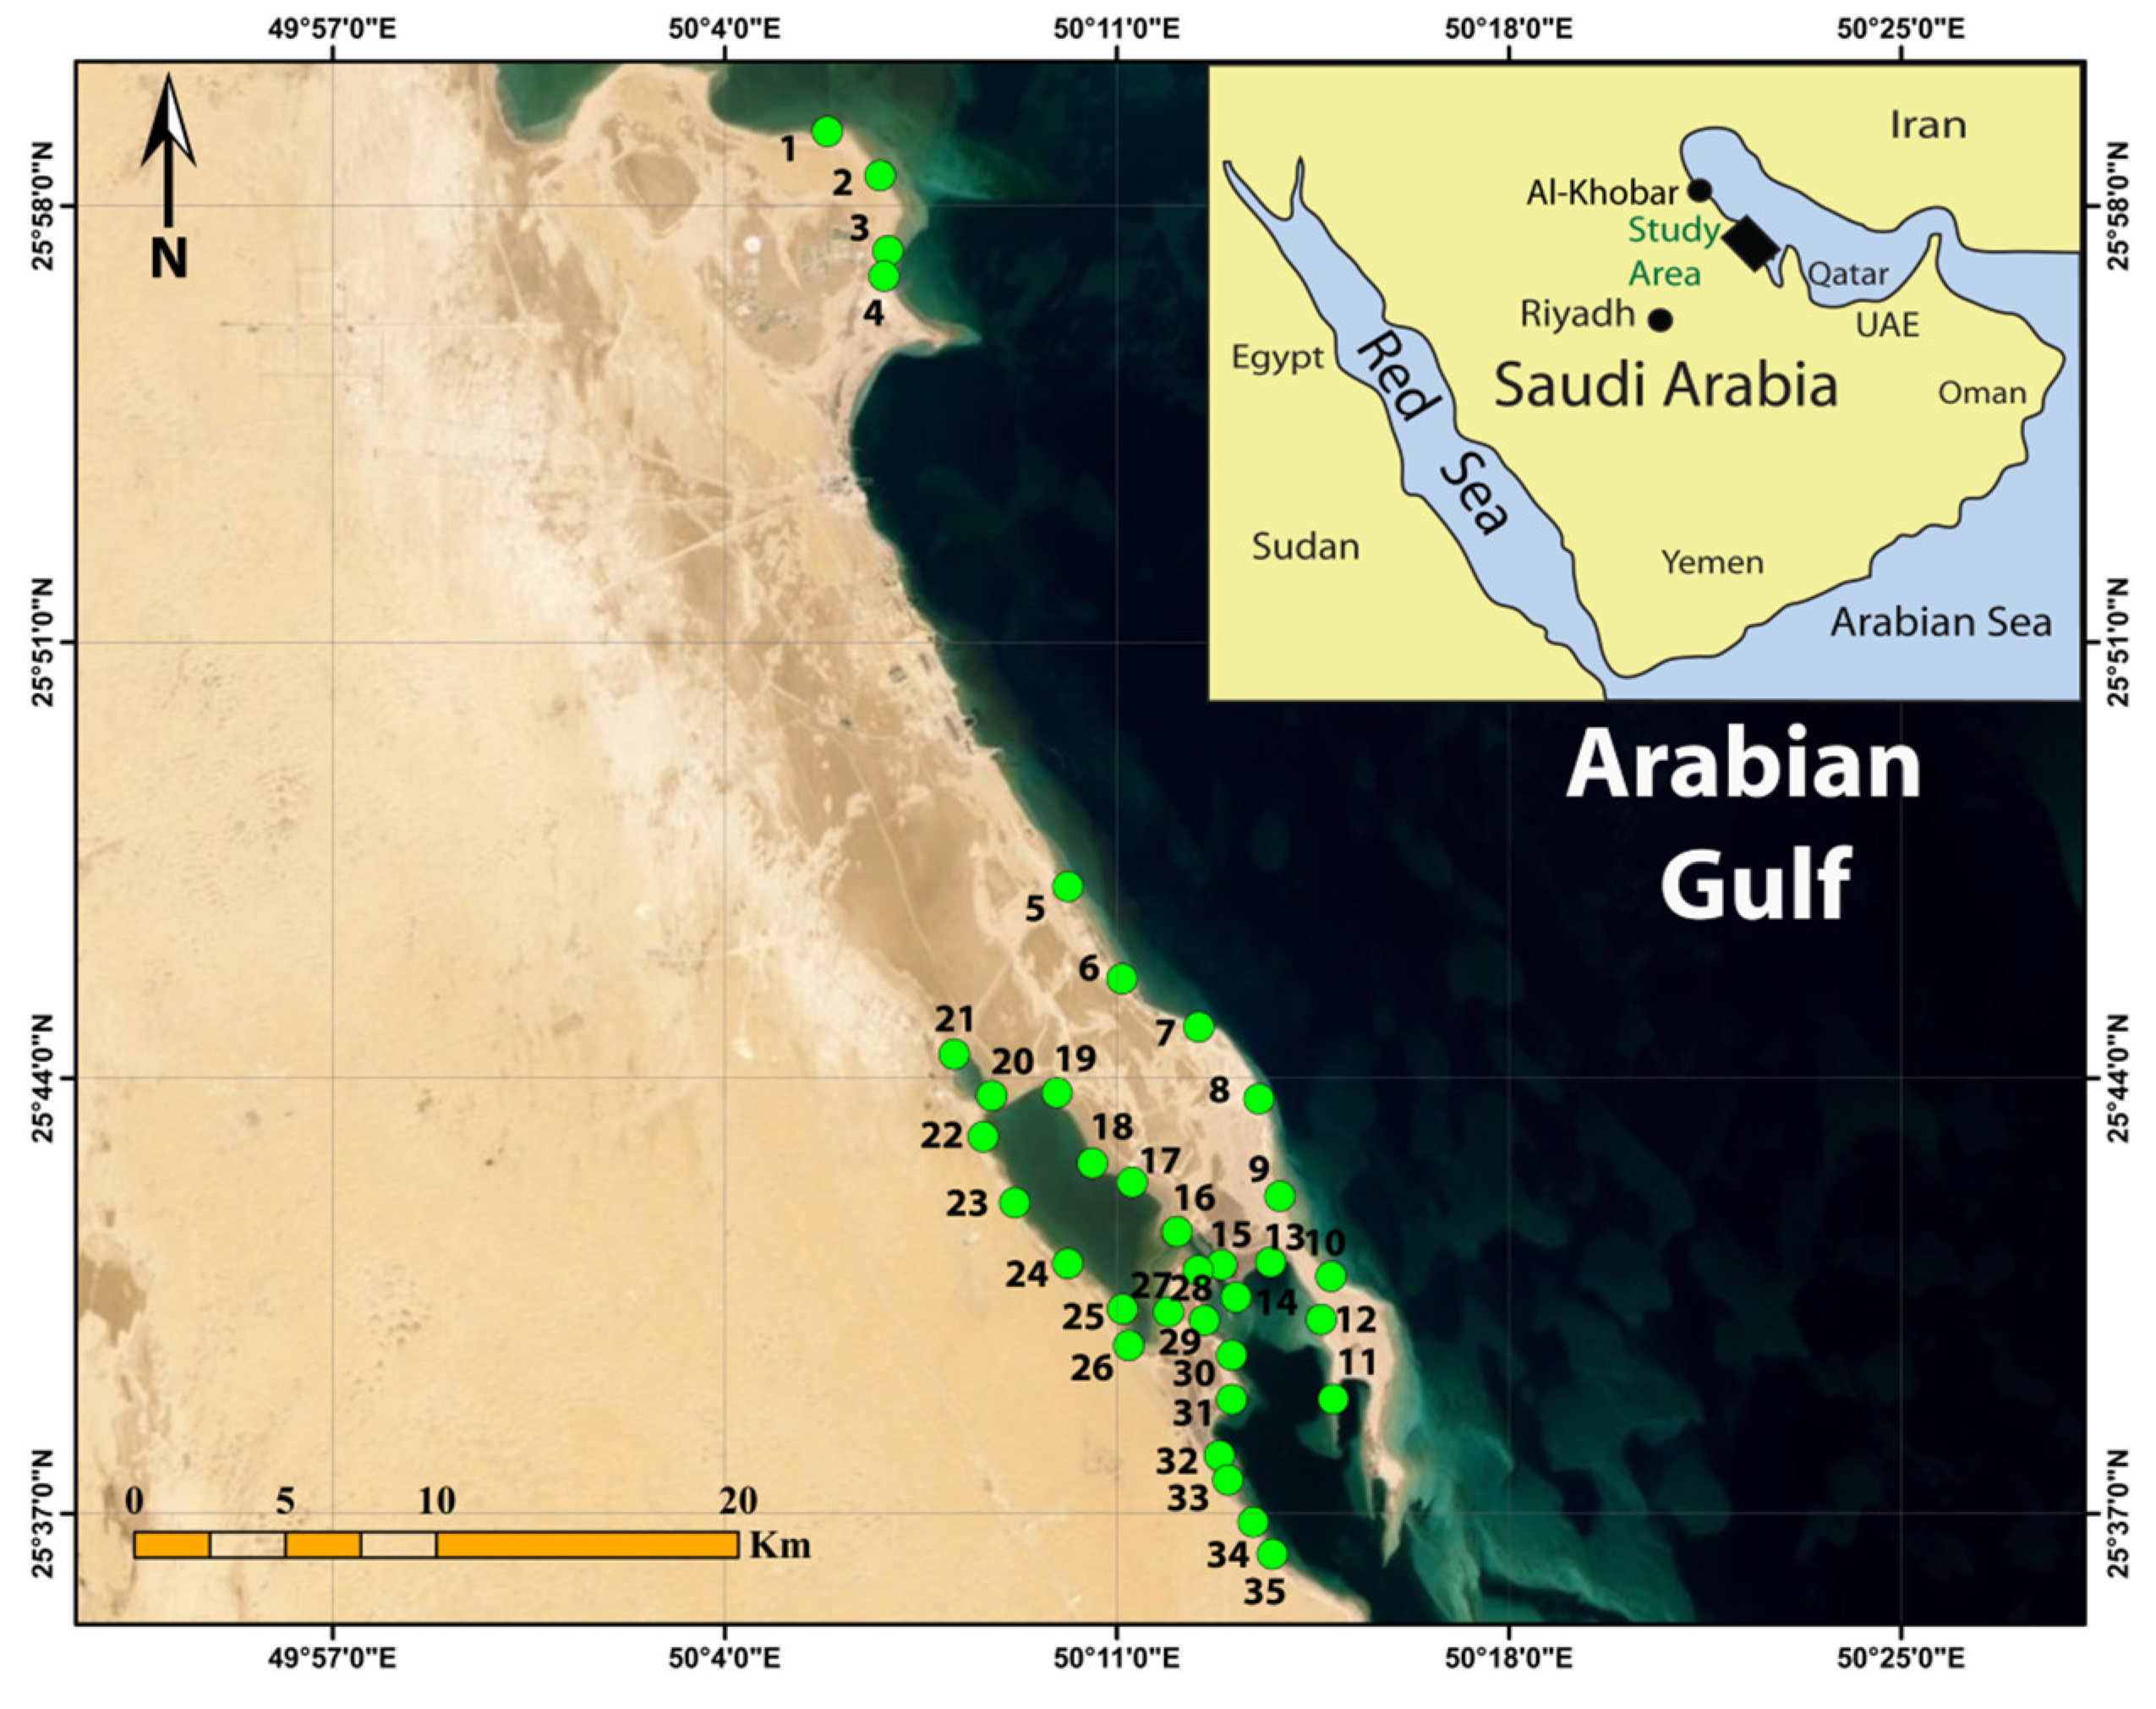
Al-Uqair beach is part of the Arabian Gulf coast, eastern Saudi Arabia. It lies 55 km south of Al-Khobar between 50°00′–50°25′ E and 25°58′–25°23′ N (Figure 1). The coastal area mainly consists of Pleistocene and recent unconsolidated deposits of sand and gravel sheets that, in turn, rest on Miocene and Pliocene rocks of sandy limestone, calcareous sandstone, clay interbeds, and sandstone. Three sediment-based types of shores along Al-Uqair can be distinguished: sand-dominated shores of fine- to very-coarse-grained sand mixed with minor amounts of broken and intact shells, gravel- and mud-dominated shores, and skeletal-dominated shores of macro- and microseashells [30]. The seashells were drifted by tidal currents, and are often mixed with sand and pebbles. Private protected areas were encountered during sampling along the studied coastline, especially the area between samples 5 and 6. We obtained 35 samples from Al-Uqair surface seawater (Figure 1). The exact locations of sampling sites are provided in Supplementary Table S1.
2.2. Metal Content, Quality Assurance, and Statistics
Direct measurements of electrical conductivity (EC) and pH were conducted on site by using EC and pH meters (Model: EZ-9902, GoolRC, China). Water samples (approximately 1 L each) were contained in plastic bottles and transferred for analysis. For elemental and metal analyses, the collected seawater samples were treated with 70% grade nitric acid (HNO3), and approximately 50 mL of each treated sample was then digested with concentrated nitric acid (HNO3; 5 mL) and perchloric acid (CHlO4; 2 mL). In order to achieve complete digestion, the solution was left overnight, followed the next day by gradual heating from 100 to 225 °C over a 6 h period. Each digested sample solution was diluted with the addition of up to 50 mL of distilled water before being filtered, following wastewater examination standards [31].
Inductively coupled plasma mass spectrometer (ICP–MS), NexION 300 D (Perkin Elmer, Waltham, MA, USA) was utilized in the measurement of Sr, Fe, Cr, As, Zn, V, Ni, Se, Cu, Hg, Al, Pb, Cd, and Sb concentrations. The measurement was conducted at King Saud University. An internal quality assurance standard and calibrated equipment with acceptable uncertainties were employed during metal content analysis. Internal quality control is based on the measurement of different levels of concentrations (e.g., 12.5, 25, 50, 100, and 1000 μg/L). Relative standard deviation (RSD) values were less than 5%. The main parameters used in the pollution assessment are: water pollution index (PIj), degree of contamination (Cd), and heavy-metal pollution index (HPI) (Table 1). Statistical analyses such as dendrograms, principal components, and Pearson’s correlation coefficient were used to determine the probable sources of the heavy metals in the study area. This was achieved by using Microsoft Excel 2016 and SPSS 16.0 statistical software.
3. Results and Discussion
3.1. EC, pH, and HMs
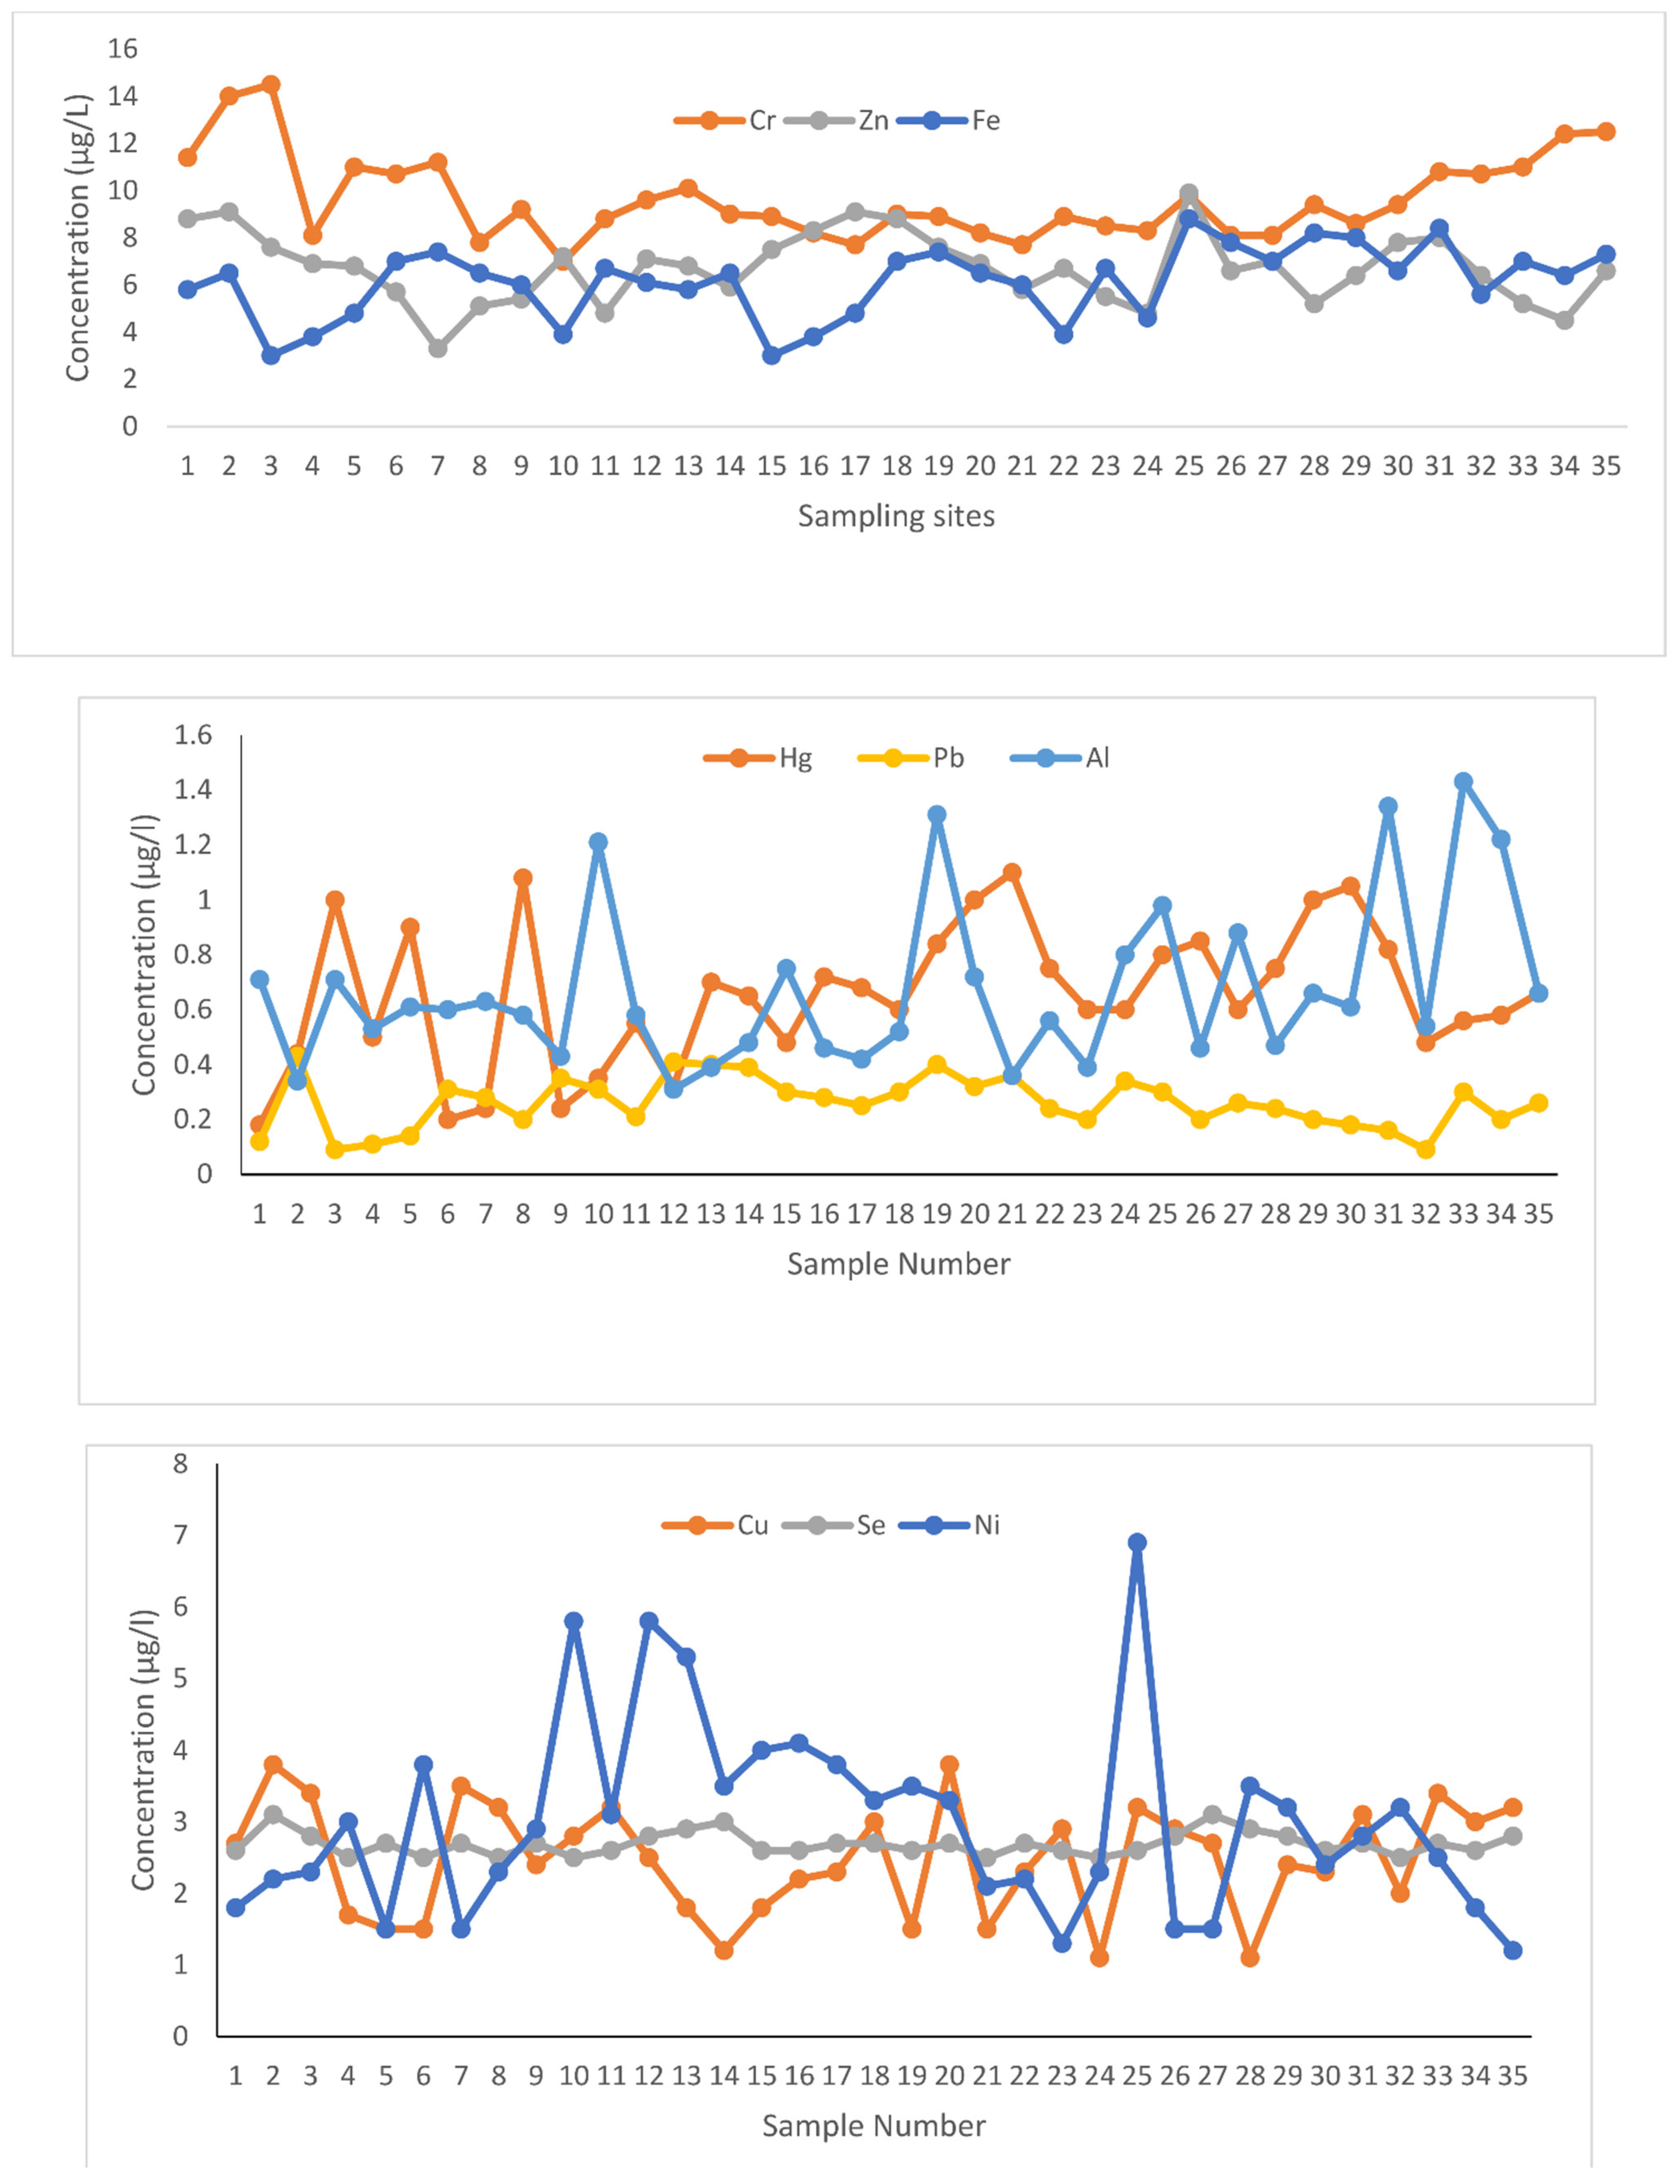
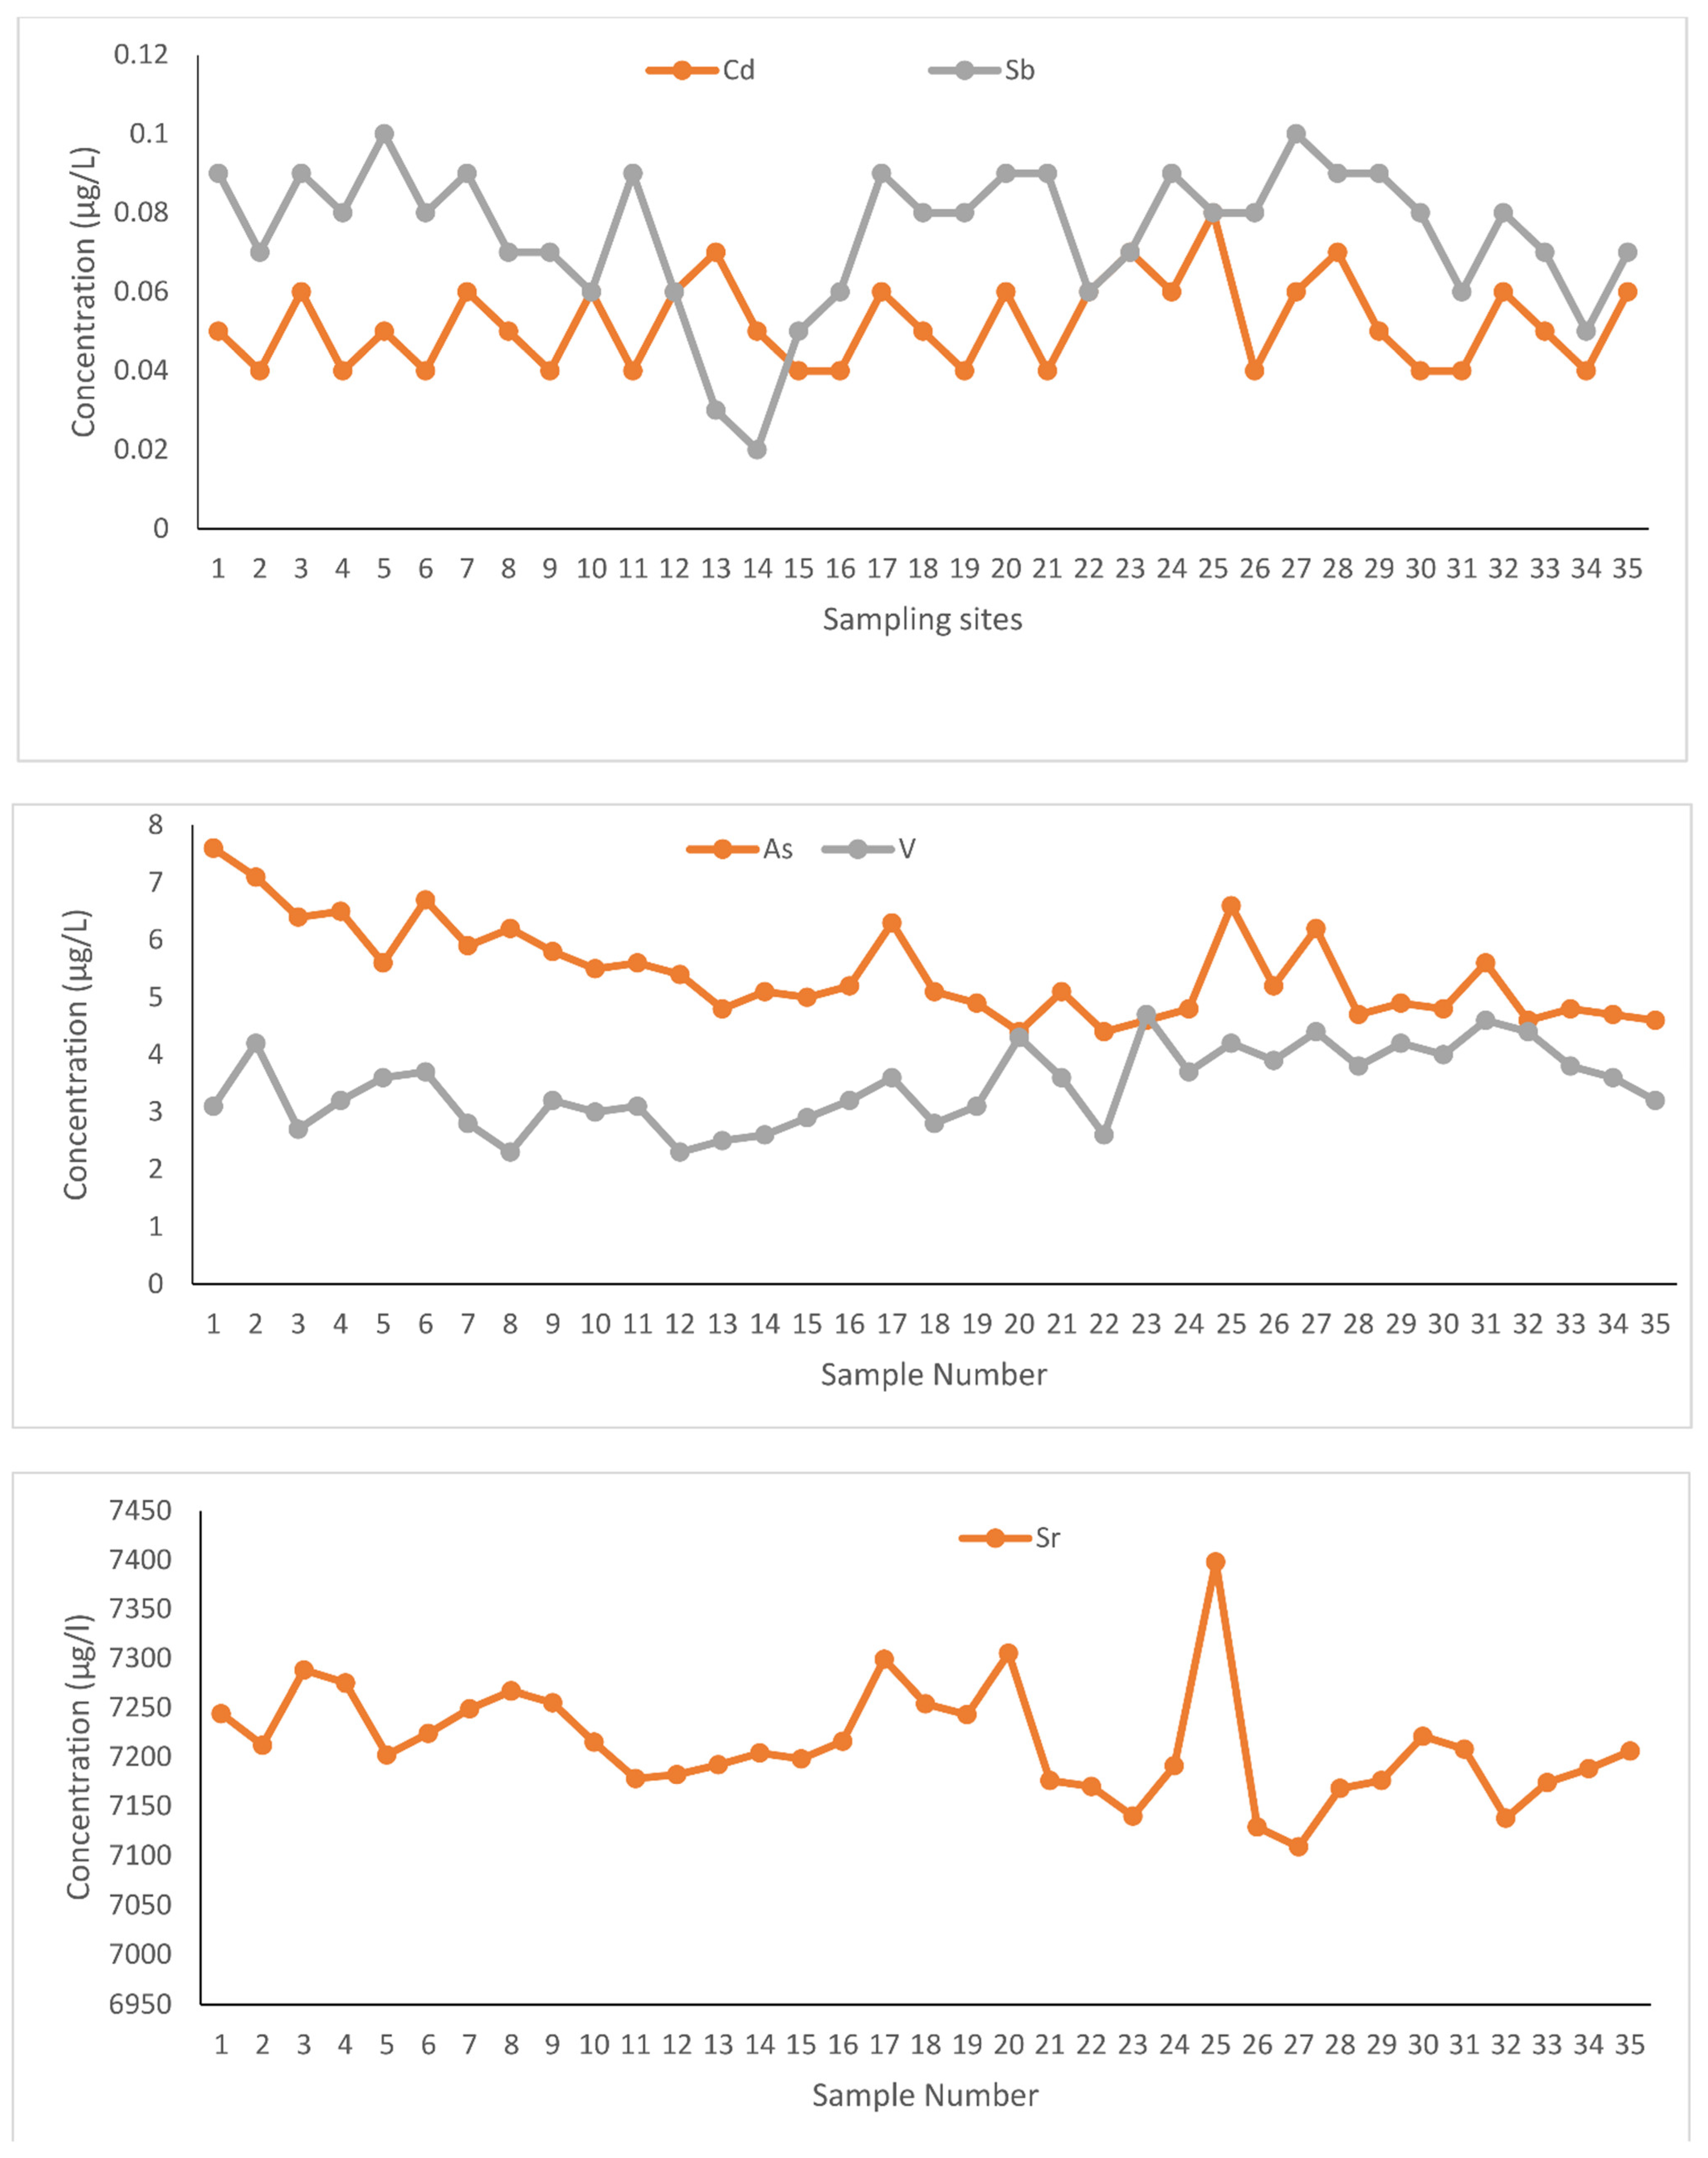
Electrical conductivity (EC) values (dS/m) widely ranged from 72.4 (Sample 33) to 122.5 (Sample 25), with an average value of 81.04. The pH values ranged from 8.1 to 8.17, averaging at around 8.12. The average amounts of HMs had the following order: Sr (average 7214 μg/L) > Cr (9.64) > Zn (6.72) > Fe (6.13) > As (5.45) > V (3.45) > Ni (3.01) > Se (2.69) > Cu (2.48) > Hg (0.65) > Al (0.68) > Pb (0.26) > Sb (0.07) > Cd (0.05). Table 2 presents the different concentration levels of HMs found in Al-Uqair samples as compared with the maximal admissible concentration (MAC) as outlined by the World Health Organization [35]. The distribution of HMs along the investigated coastline shows a fluctuating pattern (Figure 2 and Figure 3) with higher levels found in Samples 1 (As), 2 (Cu, Pb, Se), 3 (Cr), 5 (Sb), 21 (Hg), 23 (V), 25 (Cd, Fe, Zn, Ni, Sr), and 33 (Al). EC, pH, and HM concentration values, and the results of the calculated pollution indices are presented in Supplementary Table S1.
The average values of Sr, As, and V exceeded the averages found in surface seawaters of Al-Khobar and Al-Khafji coastlines further north [17,25], and Rosetta coastline, Mediterranean Sea [33] (Table 3). The high Sr values can be attributed to factors such as the hypersaline nature of the Gulf waters and the aragonite contribution from scleractinian corals and carbonate bed dissolution due to water acidification, and sources related to continental crust weathering [25,36,37]. Average values of Cr in the analyzed samples were relatively high compared to averages recorded in seawater samples from many locations around the world (Table 3), with the exception of Tarut Island [18]. The average values of Pb, Cd, Zn, Ni, Cu, and Hg fluctuated compared to those global average values listed in Table 3.
3.2. Pollution Indices and Multivariate Analyses
The quality of surface seawater and heavy-metal contamination in the area were assessed using three quantitative methods, namely, the heavy-metal pollution index (HPI), water pollution index (PIj), and degree of contamination (Cd). The measured average concentrations of the heavy metals were all below the maximal admissible concentration set by the WHO [32].
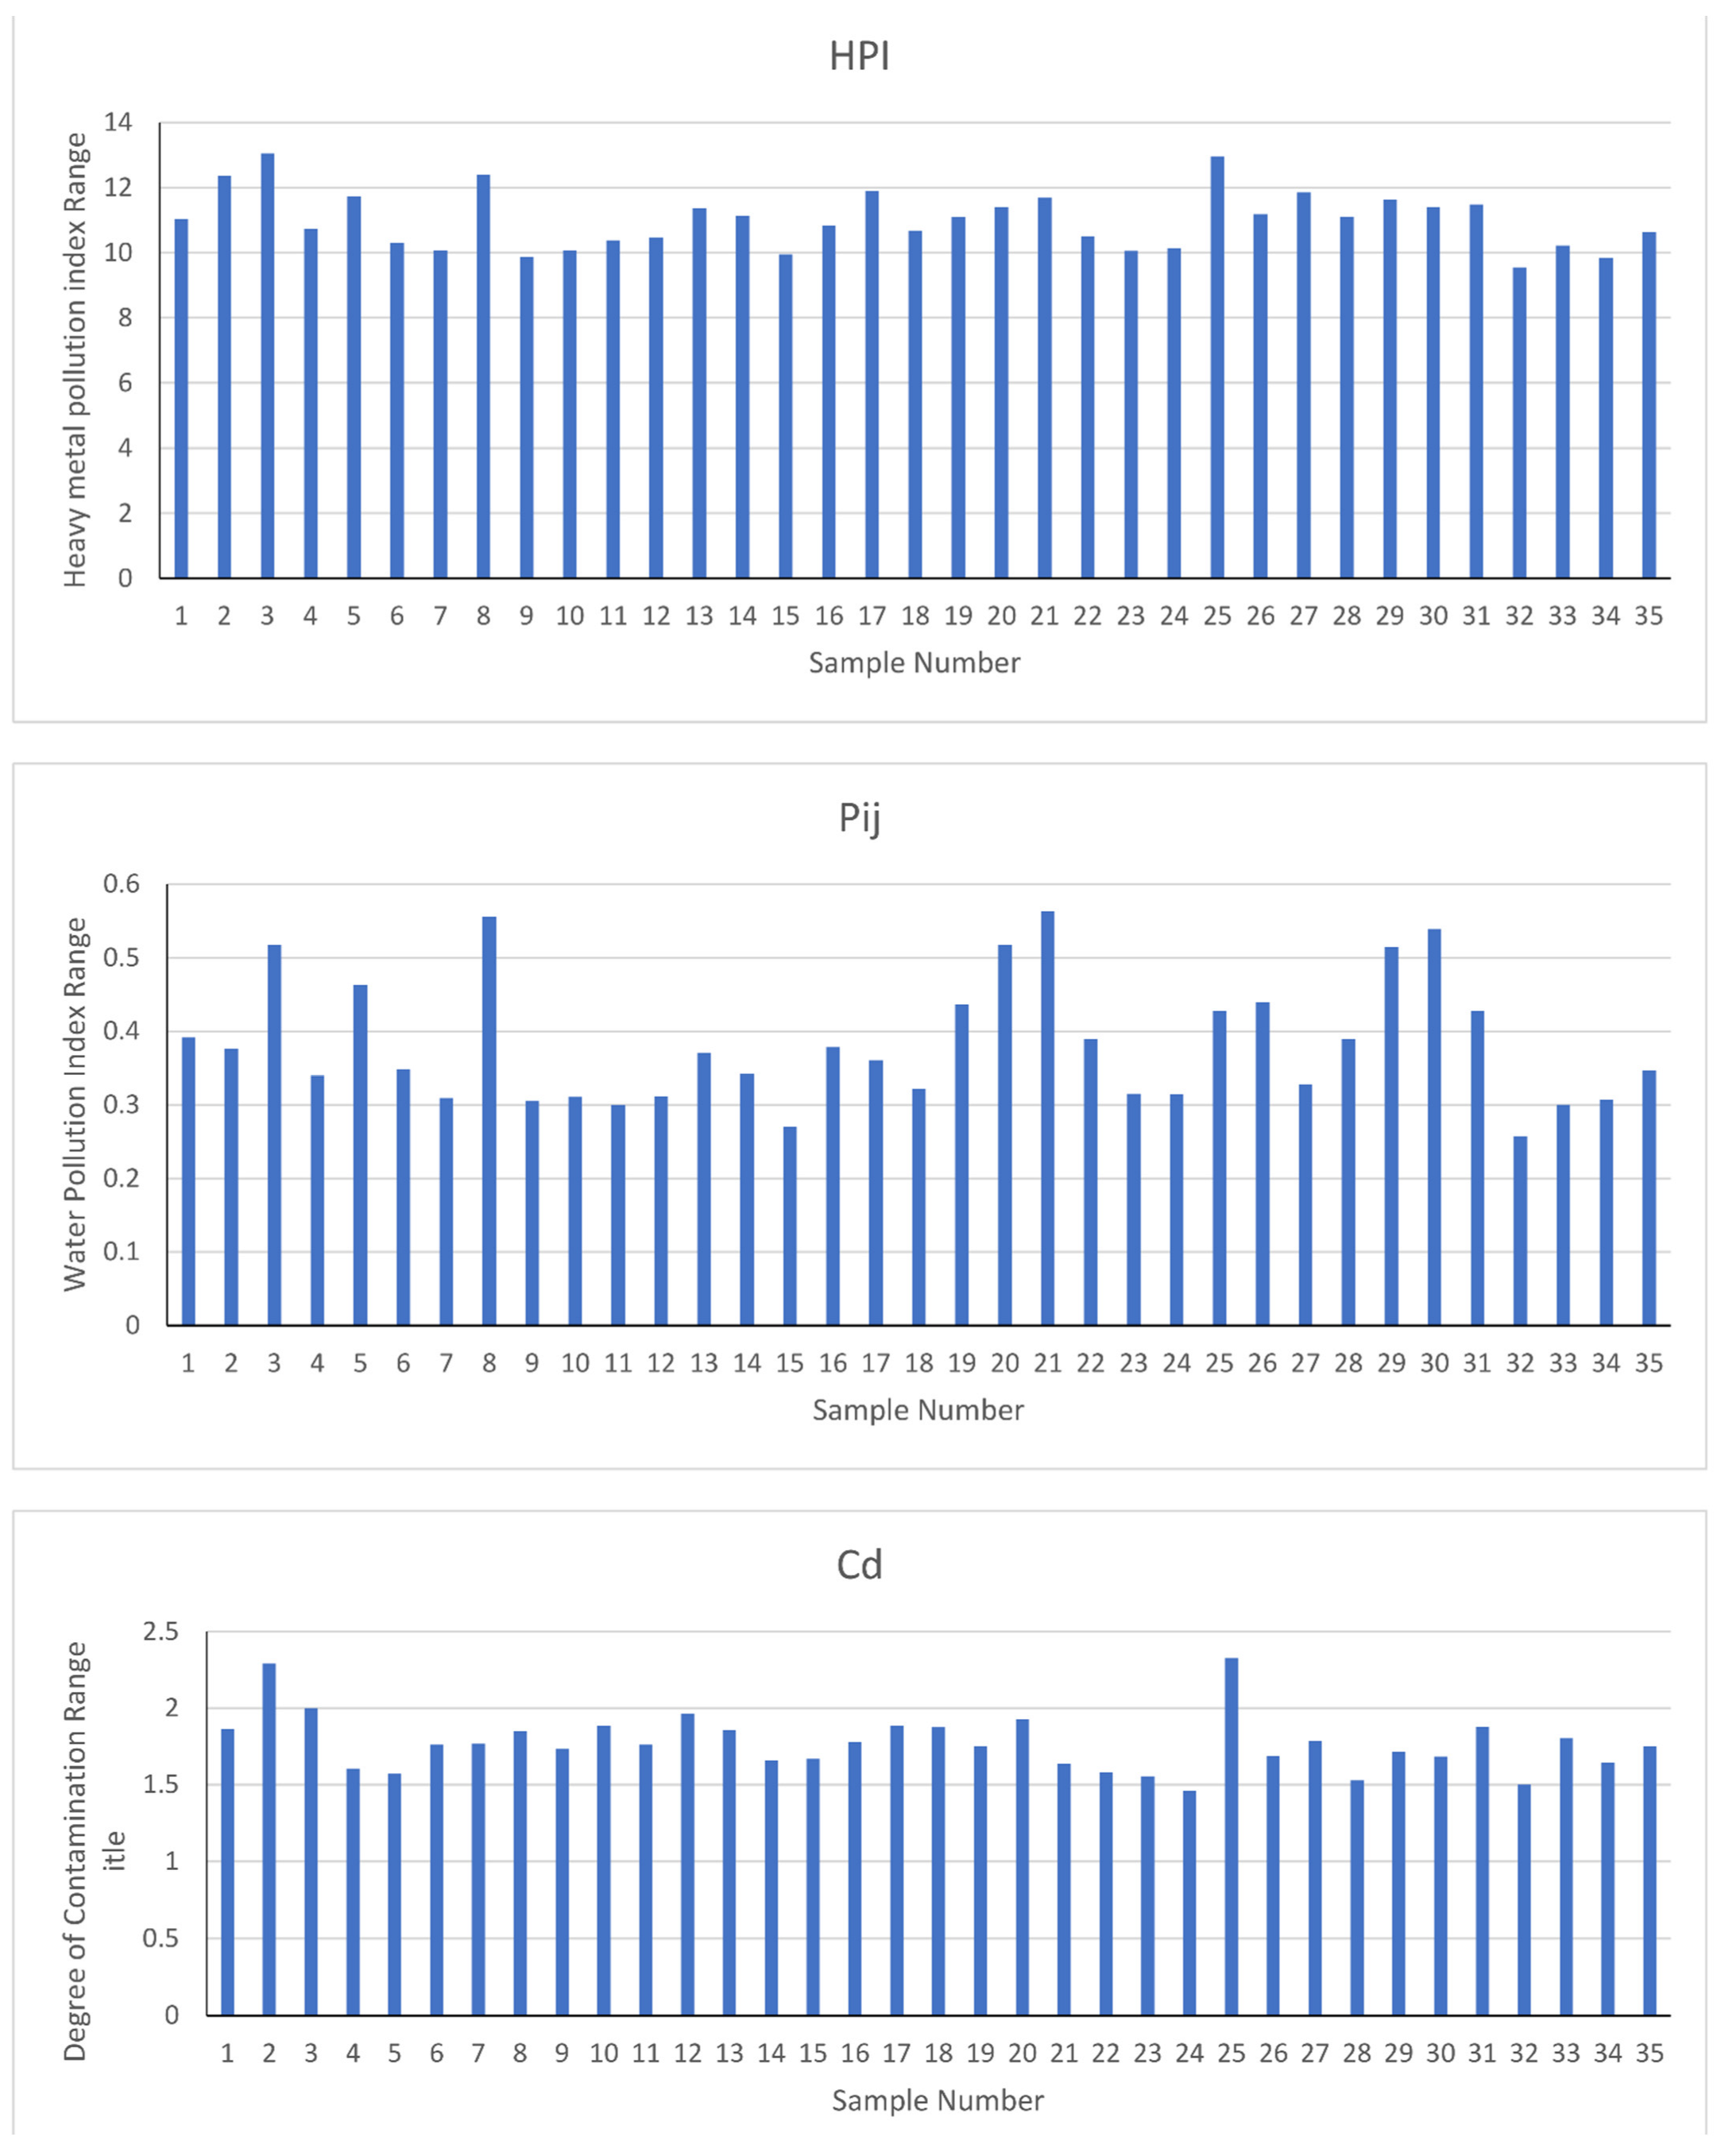
The spatial distribution of HPI (Figure 4) mostly accepts the spatial distribution of HMs (Figure 2 and Figure 3). HPI levels spatially varied from 9.55 in the south to 13.04 as we moved north along the shores of the study area, with an average value of 11.01 (Supplementary Table S1). Five water samples (14.29%) were under medium pollution (HPI = 5–10), and the remaining 30 samples (85.71%) fell under high pollution (HPI > 10). The degrees of contamination (Cd) also varied spatially from 1.46 in the south to 2.33 in the northernmost part of the study area, with an average of 1.78. All seawater samples were categorized under low contamination (Cd < 4). The levels of the pollution index (PIj) varied from 2.01 to 4.22. PIj is a water quality parameter, and, on the basis of its measured values, all the analyzed seawater samples were within the range of good quality (1 ≤ PIj ≤ 5) [34].
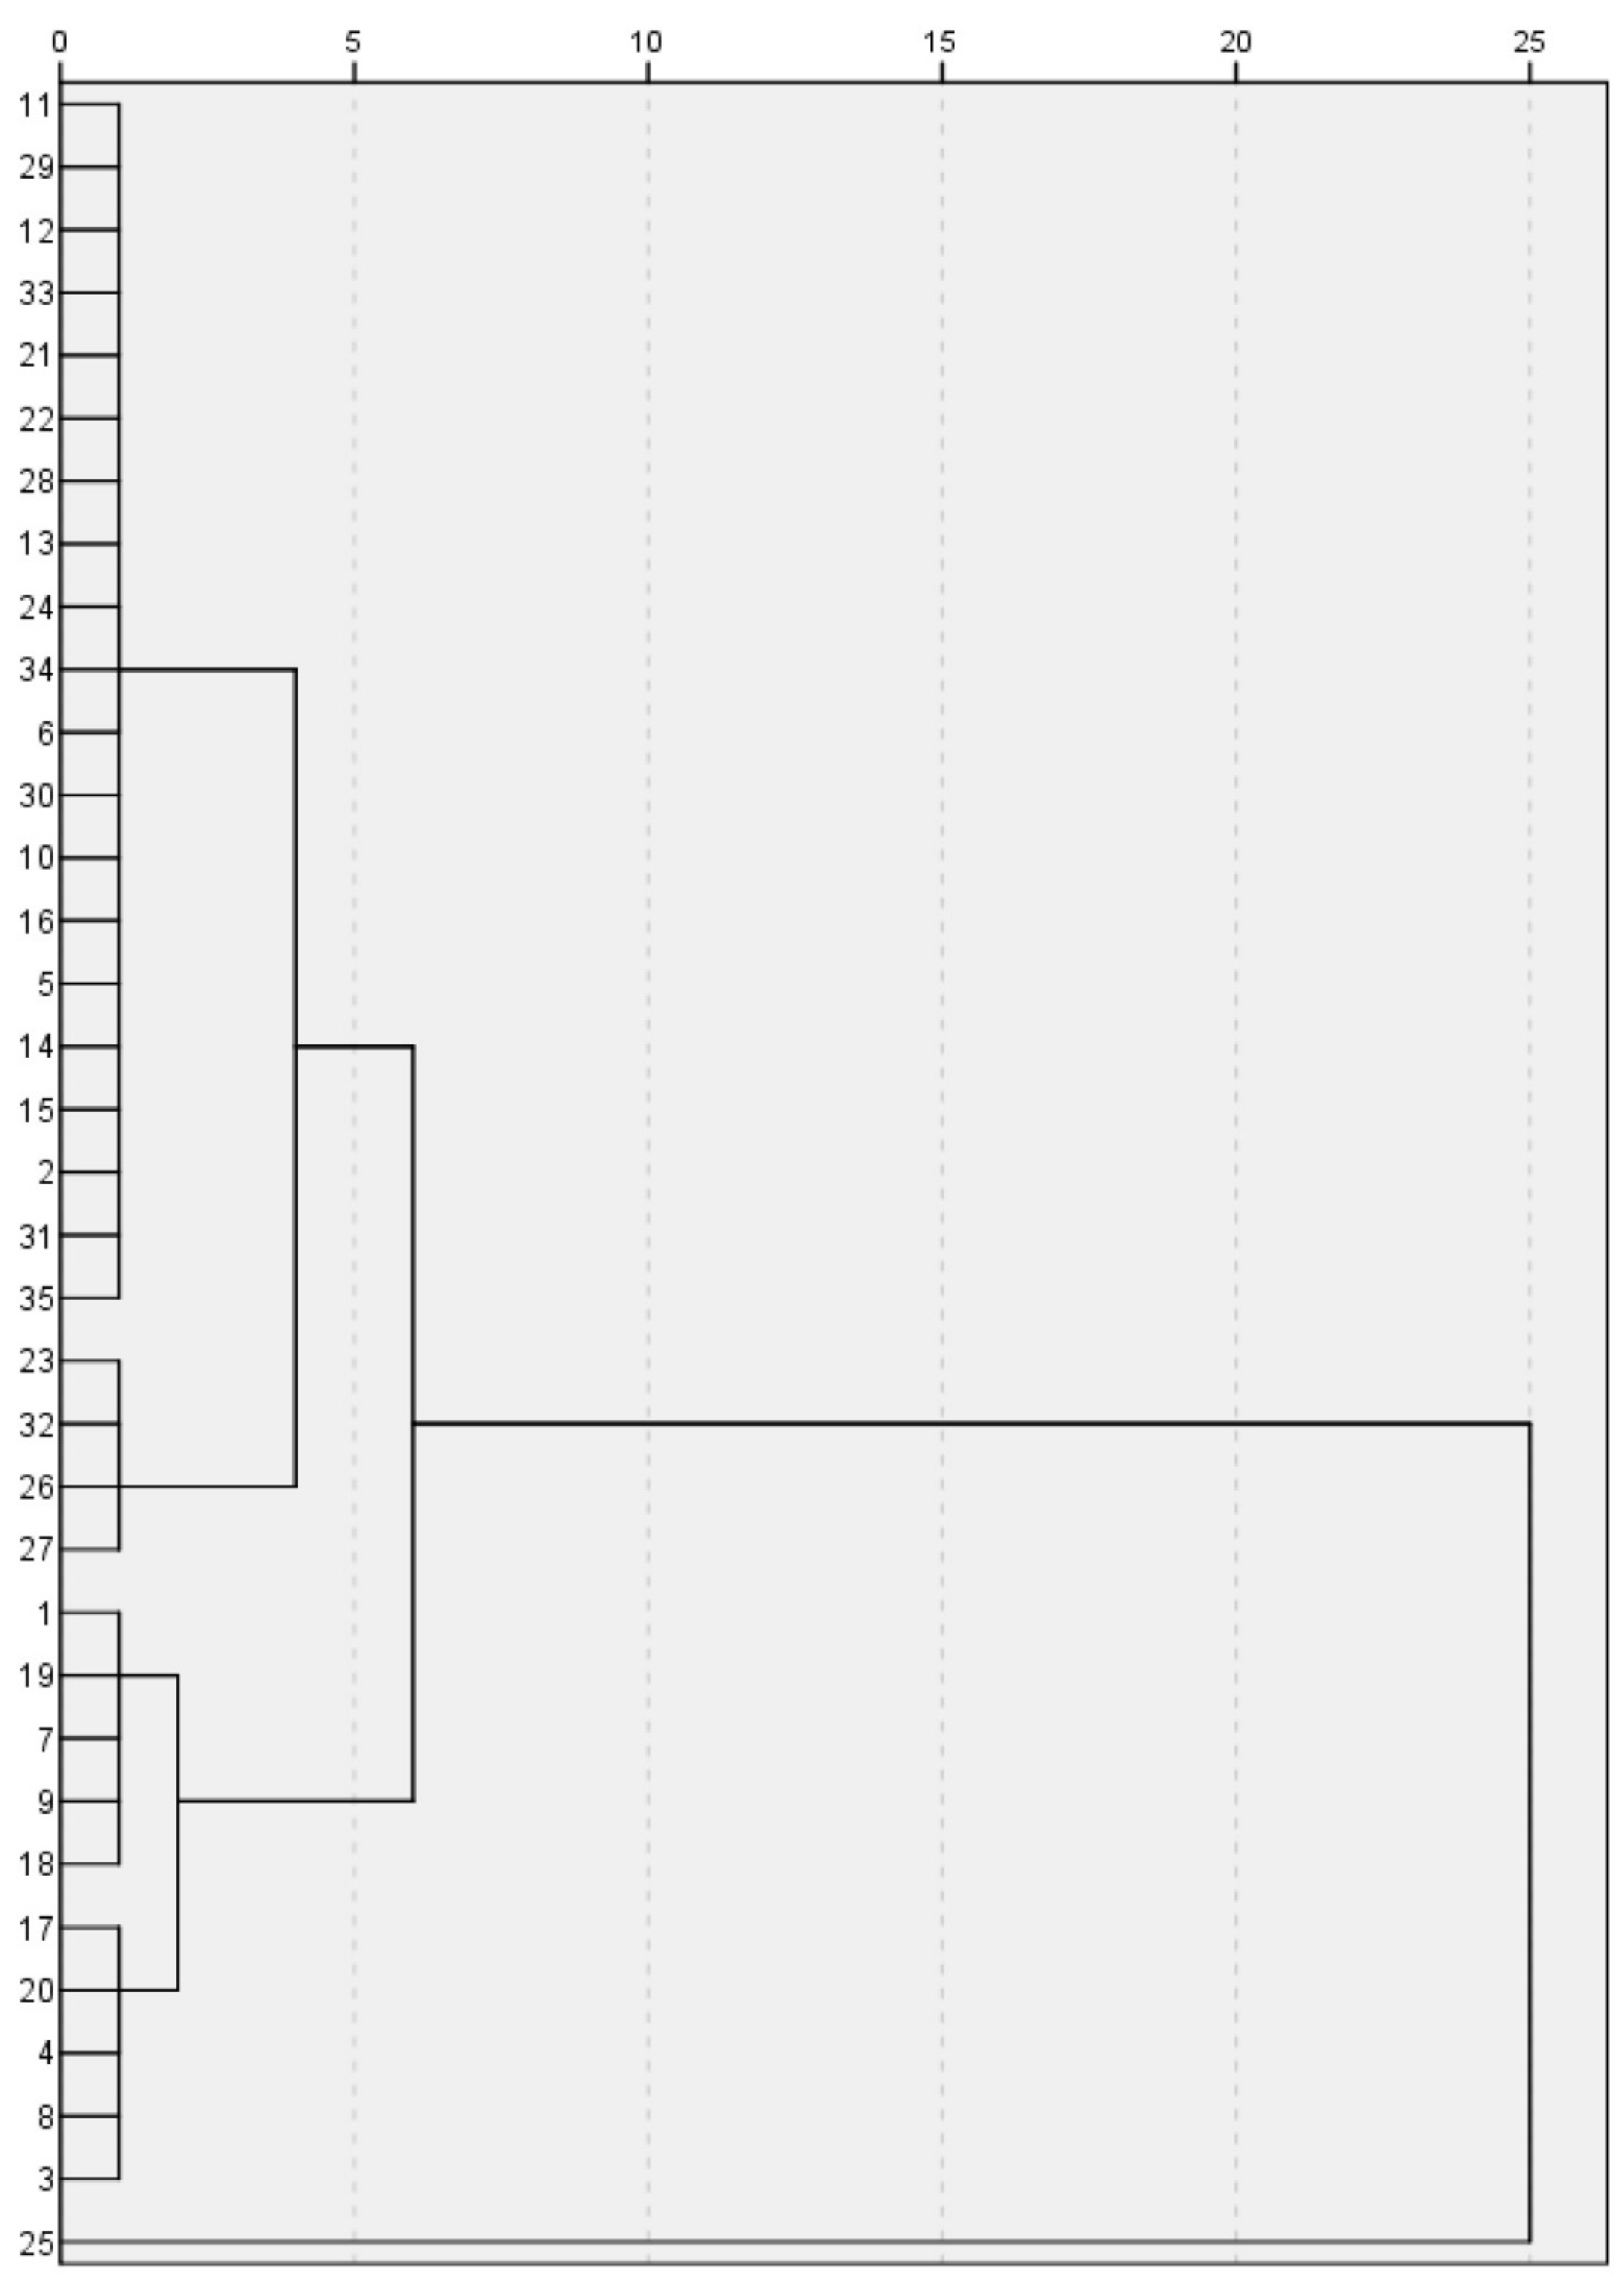
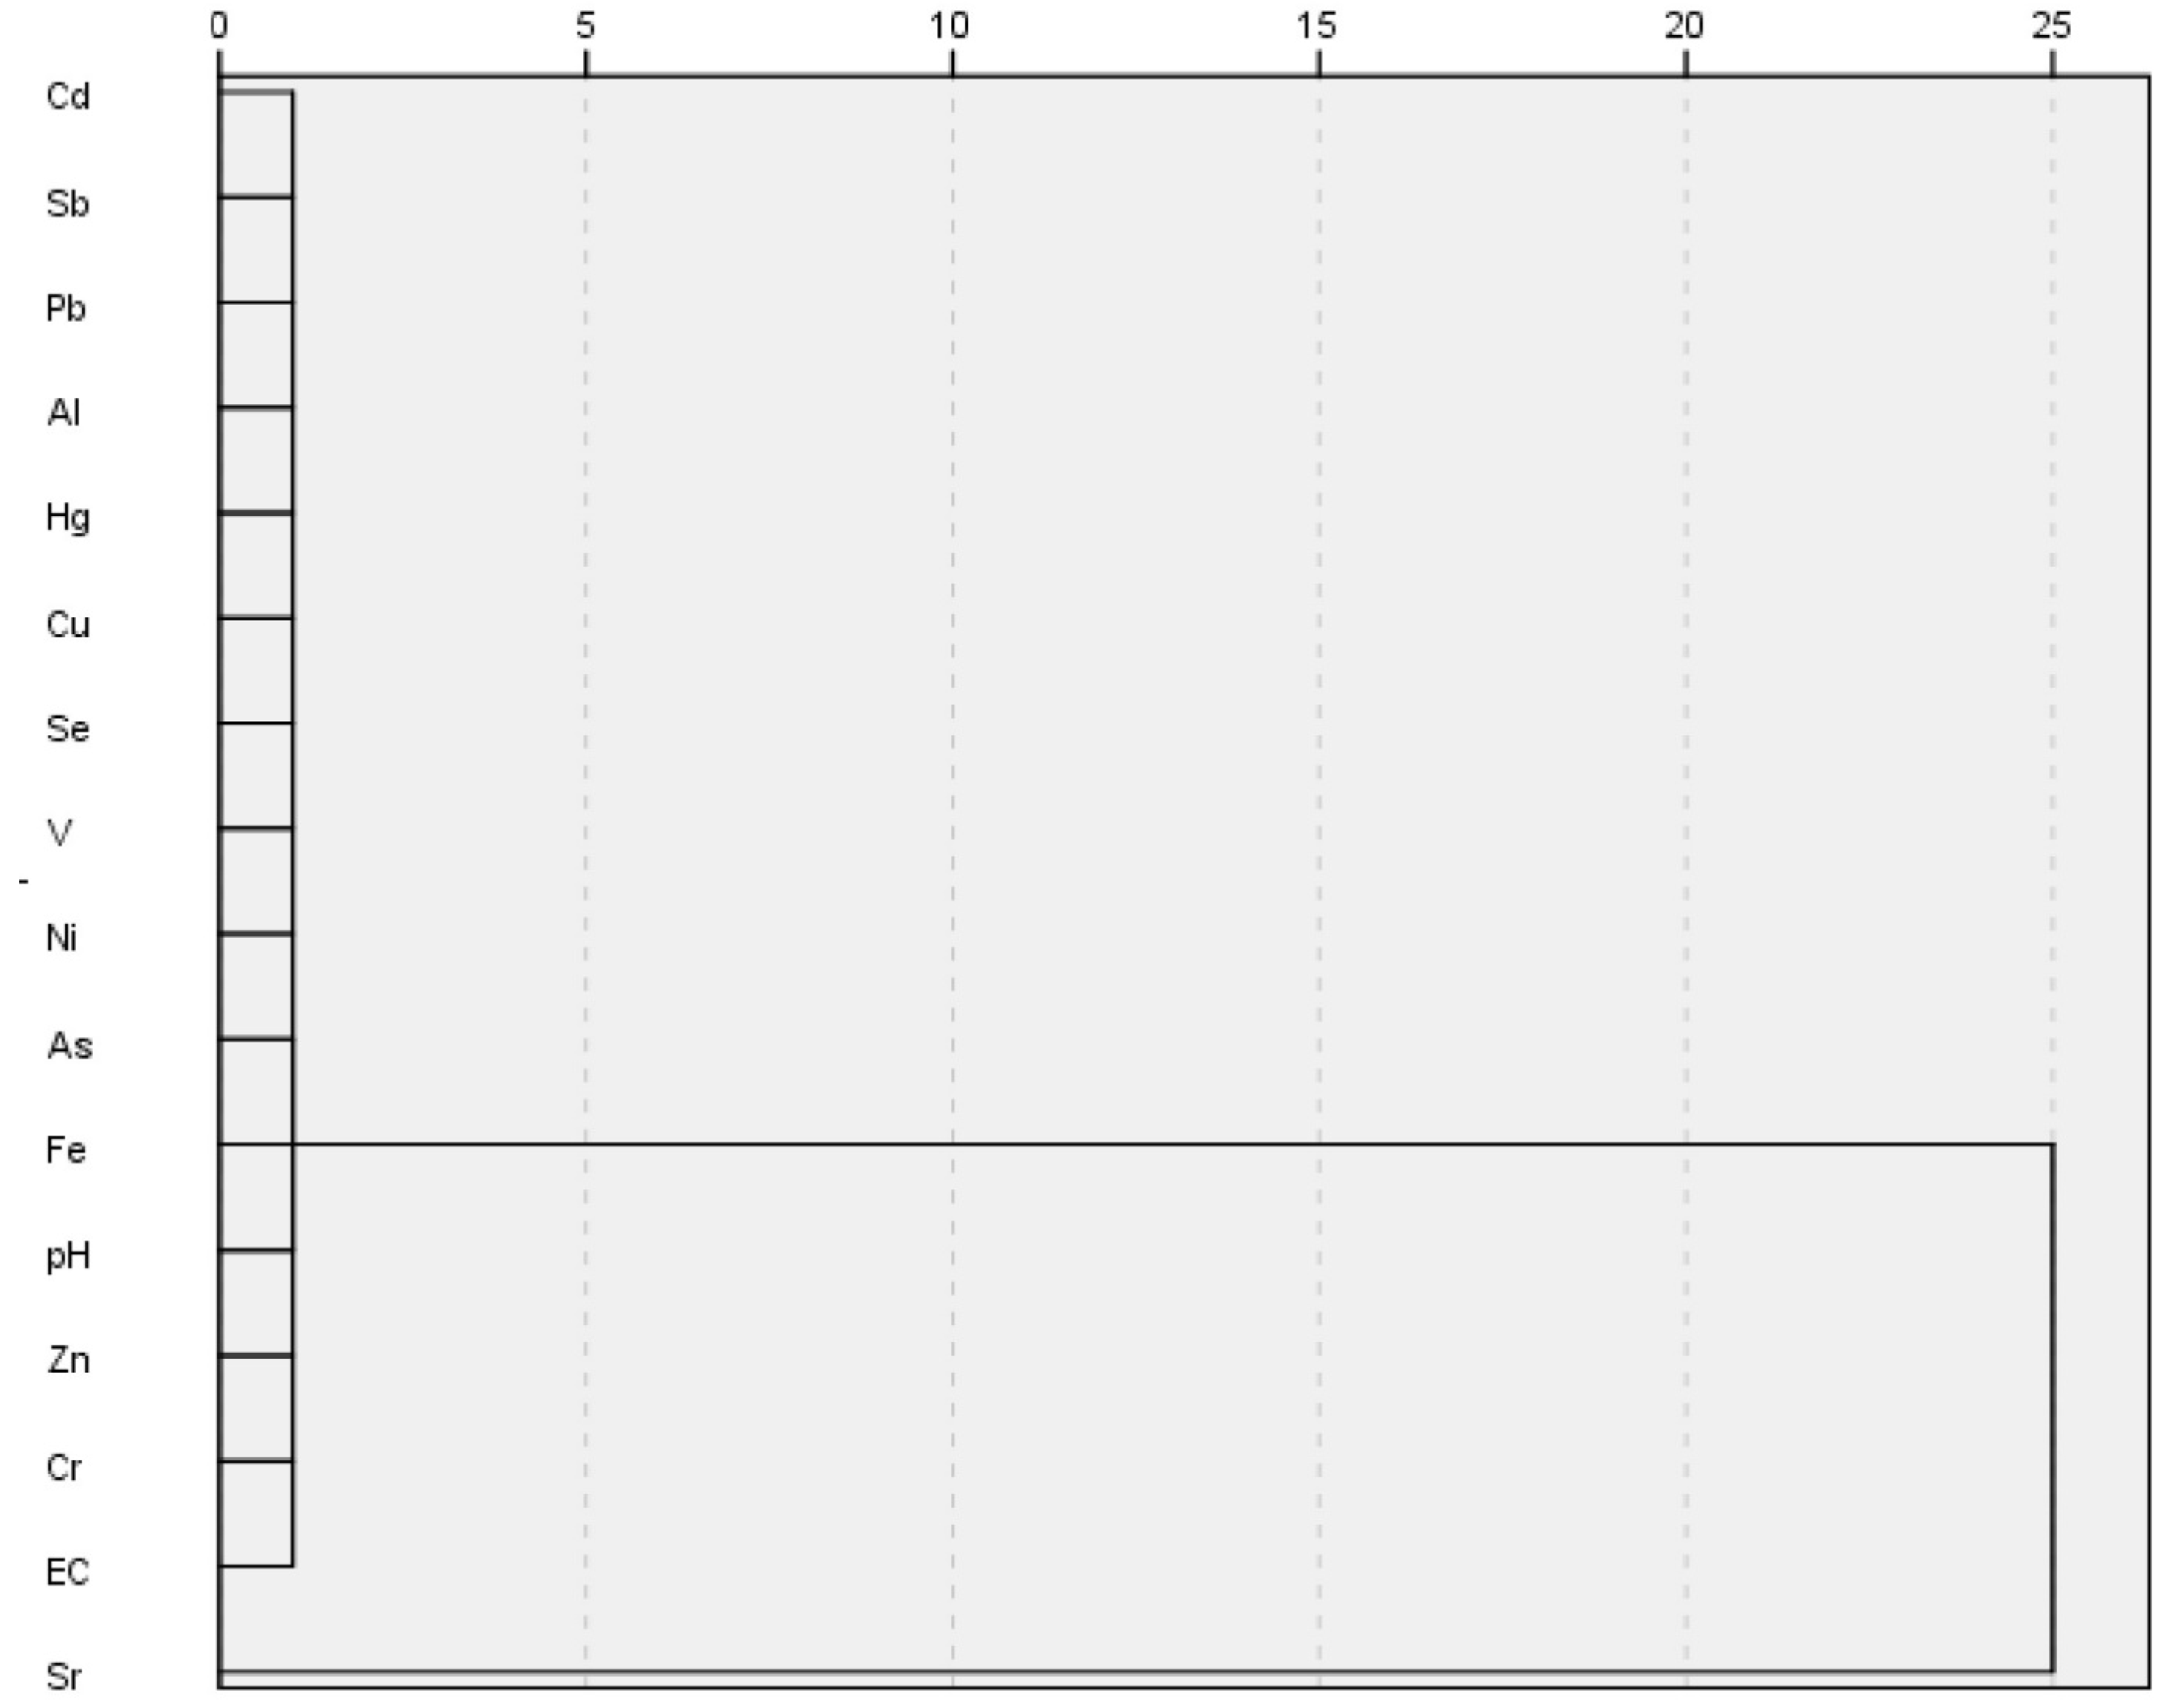
HMs are transformed in seawater under the effect of water dynamics and are not persistent. Consequently, the sources of HMs in seawater bodies appear to be more complex [10,45,46]. Q-mode HCA clustered the 35 studied localities into 2 clusters that had distinctive HM characteristics (Figure 5). The first cluster, which includes only Sample 25, contained the highest concentrations of Cd, Fe, Zn, Ni, Sr, and EC. The remaining 34 samples constitute the second cluster, which was further subdivided into two clusters (Figure 6). The first cluster group comprised pH, EC, Al, As, Cd, Cr, Cu, Fe, Hg, Pb, Sb, Se, V, Zn, and Ni, whereas the second cluster group only contains Sr. The sources of HMs were determined with Pearson’s correlation [47], which suggested the low positive correlations of Sr–EC, Sr–As, Sr–Ni, and Sr–Zn; V–Fe and V–Sb. (Table 4). The presence of V was correlated with Fe and Sb, implying that these metals might have originated from combined geogenic and anthropogenic sources, and are associated with oxides and hydroxides of Fe during rock weathering [48,49]. Moreover, the positive correlations of Cu–Cr, Cr–Se, Ni–Pb, Ni–Zn, and Zn–As suggest anthropogenic sources from industrial and agricultural effluents apart from their natural sources [50,51]. The absence of strong positive correlations among many heavy-metal elemental pairs indicate that these HMs are derived from different contamination sources [52].
Six principal components were extracted from PCA. The variances of these six components are 16.19%, 13.15%, 13.15%, 11.82%, 8.86%, and 8.35% (Table 5). PC1 presented a high loading for pH, EC, Ni, Zn, and Sr. PC3 presented positive high loading for As and Cr, whereas PC6 showed high loading for Hg. The aforementioned high loadings reflect anthropogenic sources from zinc production, and associated bronze and brass manufacturing, alloys, paint pigments, and antifouling paint [53]. The increased Sr concentration in the Arabian Gulf waters is possibly linked to the release of strontium stored in carbonate buildups such as corals as these carbonates are bleached due to increasing water acidity. Increasing acidification in the area is associated with desalination activity and the fact that the Gulf is a semienclosed sea affected by high evaporation rates [34,35]. Arsenic toxicity is mainly associated with the enzymes in the human body causing metabolic disorders, skin hyperpigmentation and hyperkeratosis of the skin. The PC2 component presented high loading for EC, Fe, Sb, V, PC4 presented a high loading for Fe and Se, and PC5 showed high loading for Al. The presence of Sb, V, and Se, with Fe and Al may be attributed to combined geogenic and anthropogenic sources for these heavy metals from rock weathering and industrial activities such as electrical power production, steel manufacturing, algaecides, and antifouling paint [53].
4. Conclusions
After the application of pollution indices and multivariate analyses to document HM contamination and identify their potential sources in 35 seawater samples along Al-Uqair beach of eastern Saudi Arabia, the average concentrations of heavy metals (μg/L) were in the following descending order: Sr > Cr > Zn > Fe > As >Ni > V > Cu > Se > Al > Hg > Cd > Pb > Sb. The spatial distribution of HMs showed a fluctuating pattern, with certain samples showing higher concentrations of the same metals. Nonetheless, the average HM concentrations in these samples were less than the maximal admissible concentration of the WHO [32]. Furthermore, on the basis of HPI, 5 of the water samples fell under medium pollution, and 30 fell under high pollution. All seawater samples were categorized under low contamination and good water on the basis of Cd and PIj, respectively. Multivariate analysis indicates mixed anthropogenic and natural sources for the investigated metals, with an increasing role of anthropogenic factors for Cr, Zn, As, V, Ni, Se, Cu, Hg, Pb, Sb, and Cd, and natural factors for Sr, Fe, and Al.
Supplementary Materials
The following supporting information can be downloaded at: https://www.mdpi.com/article/10.3390/w14213423/s1. Table S1: Coordinates of sampling sites, EC, pH, and HM concentration, and the results of the pollution indices.
Author Contributions
Conceptualization, M.H.A.-H. and A.S.E.-S.; methodology, A.S.E.-S.; software, F.A.; validation, M.H.A.-H., A.S.E.-S. and F.A.; formal analysis, M.H.A.-H.; investigation, A.S.E.-S.; resources, M.H.A.-H. and F.A.; data curation, F.A.; writing—original draft preparation, M.H.A.-H. and A.S.E.-S.; writing—review and editing, F.A.; visualization, F.A.; supervision, A.S.E.-S.; project administration, S.Q.; funding acquisition, F.A. All authors have read and agreed to the published version of the manuscript.
Funding
This research was funded by the Abdullah Alrushaid Chair for Earth Science Remote Sensing Research, Geology and Geophysics Department, King Saud University, Saudi Arabia.
Data Availability Statement
Not applicable.
Acknowledgments
The authors extend their appreciation to Abdullah Alrushaid Chair for Earth Science Remote Sensing Research for the funding.
Conflicts of Interest
The authors declare no conflict of interest. The funders had no role in the design of the study; in the collection, analyses, or interpretation of data; in the writing of the manuscript; or in the decision to publish the results.
References
- Akoto, O.; Bismark, E.F.; Darko, G.; Adei, E. Concentrations and health risk assessments of heavy metals in fish from the Fosu Lagoon. Int. J. Environ. Res. (IJER) 2014, 8, 403–410. [Google Scholar]
- Hanfi, M.Y.; Seleznev, A.A.; Yarmoshenko, I.V.; Malinovsky, G.; Konstantinova, E.Y.; Alsafi, K.G.; Sakr, A.K. Poten-tially harmful elements in urban surface deposited sediment of Ekaterinburg, Russia: Occurrence, source appointment and risk assessment. Chemosphere 2022, 307 Pt 2, 135898. [Google Scholar] [CrossRef] [PubMed]
- Bello, S.; Nasiru, R.; Garbab, N.N.; Adeyemoc, D.J. Carcinogenic and non-carcinogenic health risk assessment of heavy metals exposure from Shanono and Bagwai artisanal gold mines, Kano state, Nigeria. Sci. Afr. 2019, 6, e00197. [Google Scholar] [CrossRef]
- Liu, M.; Chen, J.; Sun, X.; Hu, Z.; Fan, D. Accumulation and transformation of heavy metals in surface sediments from the Yangtze River estuary to the East China Sea shelf. Environ. Pollut. 2019, 245, 111–121. [Google Scholar] [CrossRef] [PubMed]
- Silva, L.F.O.; Hower, J.C.; Dotto, G.L.; Oliveira, M.L.S.; Pinto, D. Titanium nanoparticles in sedimented dust ag-gregates from urban children’s parks around coal ashes wastes. Fuel 2021, 285, 119162. [Google Scholar] [CrossRef]
- Chen, H.; Lu, X.; Li, L.Y. Spatial distribution and risk assessment of metals in dust based on samples from nursery and primary schools of Xi’an, China. Atmos. Environ. 2014, 88, 172–182. [Google Scholar] [CrossRef]
- Kalani, N.; Riazi, B.; Karbassi, A.R.; Moattara, F. Measurement and ecological risk assessment of heavy metals ac-cumulated in sediment and water collected from Gomishan international wetland, Iran. Water Sci. Technol. 2021, 84, 1498–1508. [Google Scholar] [CrossRef]
- Mateo-Sagasta, J.; Zadeh, S.; Turral, H.; Burke, J. Water Pollution from Agriculture: A Global Review; Food and Agriculture Organization of the United Nations: Rome, Italy; International Water Management Institute: Colombo, Sri Lanka, 2017; p. 29. [Google Scholar]
- Spanton, P.I.; Saputra, A. Analysis of sea water pollution in coastal marine district Tuban to the quality standards of sea water with using storet method. J. Kelaut. 2017, 10, 103–112. [Google Scholar] [CrossRef] [Green Version]
- El-Sorogy, A.S.; Youssef, M. Pollution assessment of the Red Sea-Gulf of Aqaba seawater, northwest Saudi Arabia. Environ. Monit. Assess. 2021, 193, 141. [Google Scholar] [CrossRef]
- Tan, W.H.; Tair, R.; Ali, S.A.M.; Sualin, F.; Payus, C. Distribution of heavy metals in seawater and surface sediment in coastal area of Tuaran, Sabah. Trans. Sci. Technol. 2016, 3, 114–122. [Google Scholar]
- Alharbi, T.; Alfaifi, H.; El-Sorogy, A.S. Metal pollution in Al-Khobar seawater, Arabian Gulf, Saudi Arabia. Mar. Pollut. Bull. 2017, 119, 407–415. [Google Scholar] [CrossRef]
- Youssef, M.; El-Sorogy, A.S.; Al-Kahtany, K.; Madkour, H. Status of trace metals in surface seawater of Sharm Al-Kharrar lagoon, Saudi Arabia. Arab. J. Geosci. 2021, 14, 748. [Google Scholar] [CrossRef]
- Tornero, V.; Hanke, G. Chemical contaminants entering the marine environment from sea-based sources: A review with a focus on European seas. Mar. Pollut. Bull. 2016, 112, 17–38. [Google Scholar] [CrossRef]
- Lloyd-Smith, M.; Immig, J. Ocean Pollutants Guide Toxic Threats to Human Health and Marine Life; IPEN: Bangalow, Australia, 2018; p. 107. [Google Scholar]
- Claisse, D.; Alzieu, C. Copper contamination as a result of antifouling paint regulations? Mar. Pollut. Bull. 1993, 26, 395–397. [Google Scholar] [CrossRef]
- Millward, G.E.; Turner, A. Metal pollution. In Encyclopaedia of Ocean Sciences; Steele, J.H., Thorpe, S.A., Turekian, S.A., Eds.; Academic: San Diego, CA, USA, 2001; pp. 1730–1737. [Google Scholar]
- El-Sorogy, A.S.; Youssef, M.; Al-Kahtany, K. Integrated assessment of the Tarut Island coast, Arabian Gulf, Saudi Ara-bia. Environ. Earth Sci. 2016, 75, 1336. [Google Scholar] [CrossRef]
- El-Sorogy, A.S.; Youssef, M.; Al-Kahtany, K.; Al-Otaibi, N. Assessment of arsenic in coastal sediments, seawaters and molluscs in the Tarut Island, Arabian Gulf, Saudi Arabia. J. Afr. Earth Sci. 2016, 113, 65–72. [Google Scholar] [CrossRef]
- Alharbi, T.; Al-Kahtany, K.; Nour, H.E.; Giacobbe, S.; El-Sorogy, A.S. Contamination and health risk assessment of arsenic and chromium in coastal sediments of Al-Khobar area, Arabian Gulf, Saudi Arabia. Mar. Pollut. Bull. 2022, 185, 114255. [Google Scholar] [CrossRef] [PubMed]
- El-Sorogy, A.; Al-Kahtany, K.; Youssef, M.; Al-Kahtany, F.; Al-Malky, M. Distribution and metal contamination in the coastal sediments of Dammam Al-Jubail area, Arabian Gulf, Saudi Arabia. Mar. Pollut. Bull. 2018, 128, 8–16. [Google Scholar] [CrossRef] [PubMed]
- El-Sorogy, A.S.; Alharbi, T.; Richiano, S. Bioerosion structures in high-salinity marine environments: A case study from the Al–Khafji coastline, Saudi Arabia. Estuar. Coast. Shelf Sci. 2018, 204, 264–272. [Google Scholar] [CrossRef]
- El-Sorogy, A.S.; Alharbi, T.; Almadani, S.; Al-Hashim, M. Molluscan assemblage as pollution indicators in Al-Khobar coastal plain, Arabian Gulf, Saudi Arabia. J. Afr. Earth Sci. 2019, 158, 103564. [Google Scholar] [CrossRef]
- El-Sorogy, A.; Youssef, M.; Al-Kahtany, K.; Saleh, M.M. Distribution, source, contamination and ecological risk status of heavy metals in the Red Sea-Gulf of Aqaba coastal sediments, Saudi Arabia. Mar. Pollut. Bull. 2020, 158, 111411. [Google Scholar] [CrossRef] [PubMed]
- Alharbi, T.; El-Sorogy, A.S. Assessment of seawater pollution of the Al-Khafji coastal area, Arabian Gulf, Saudi Arabia. Environ. Monit. Assess. 2019, 191, 383. [Google Scholar] [CrossRef]
- El-Sorogy, A.S.; Youssef, M. Assessment of heavy metal contamination in intertidal gastropod and bivalve shells from central Arabian Gulf coastline, Saudi Arabia. J. Afr. Earth Sci. 2015, 111, 41–53. [Google Scholar] [CrossRef]
- Youssef, M.; El-Sorogy, A.S.; Al-Kahtany, K. Distribution of mercury in molluscs, seawaters and coastal sedi-ments of Tarut Island, Arabian Gulf, Saudi Arabia. J. Afr. Earth Sci. 2016, 124, 365–370. [Google Scholar] [CrossRef]
- Al-Kahtany, K.; Youssef, M.; El-Sorogy, A. Geochemical and foraminiferal analyses of the bottom sediments of Dammam coast, Arabian Gulf, Saudi Arabia. Arab. J. Geosci. 2015, 8, 11121–11133. [Google Scholar] [CrossRef]
- Al-Kahtany, K.; Youssef, M.; El-Sorogy, A.S.; Al-Kahtany, F. Benthic foraminifera as bioindicators of environmental quality of Dammam Al-Jubail area, Arabian Gulf, Saudi Arabia. Arab. J. Geosci. 2020, 13, 427. [Google Scholar] [CrossRef]
- Al-Hashim, M.H.; El-Sorogy, A.S.; Al Qaisi, S.; Alharbi, T. Contamination and ecological risk of heavy metals in Al-Uqair coastal sediments, Saudi Arabia. Mar. Pollut. Bull. 2021, 171, 112748. [Google Scholar] [CrossRef] [PubMed]
- APHA Standard Methods for the Examination of Water and Wastewater, 21st ed.; American Public Health Association/American Water Works Association/Water Environment Federation: Washington, DC, USA, 2005.
- Backman, B.; Bodis, D.; Lahermo, P.; Rapant, S.; Tarvainen, T. Application of a groundwater contamination index in Finland and Slovakia. Environ. Geol. 1997, 36, 55–64. [Google Scholar] [CrossRef]
- Prasanna, M.V.; Praveena, S.M.; Chidambaram, S.; Nagarajan, R.R.; Elayaraja, A. Evaluation of water quality pollu-tion indices for heavy metal contamination monitoring: A case study from Curtin Lake, Miri City, East Malaysia. Environ. Earth Sci. 2012, 67, 1987–2001. [Google Scholar] [CrossRef]
- Tanjung, R.H.R.; Hamuna, B.; Alianto, A. Assessment of water quality and pollution index in coastal waters of Mimika, Indonesia. J. Ecol. Eng. 2019, 20, 87–94. [Google Scholar]
- World Health Organization (WHO). Guidelines for Drinking-Water Quality: Fourth Edition Incorporating the First Addendum; World Health Organization: Geneva, Switzerland, 2017. [Google Scholar]
- Uddin, S.; Gevao, B.; Al-Ghadban, A.N.; Nithyandan, M.; Al-Shamroukh, D. Acidification in Arabian Gulf – insights from pH and temperature measurements. J. Environ. Monit. 2012, 14, 1479–1482. [Google Scholar] [CrossRef] [PubMed]
- Uddin, S.; Al-Ghadban, A.N.; Behnahani, M. Baseline concentration of strontium and 90Sr in seawater from the north-ern Gulf. Mar. Pollut. Bull. 2013, 75, 301–304. [Google Scholar] [CrossRef] [PubMed]
- Broecker, W.; Peng, T. Tracers in the Sea. In Lamont-Doherty Geological Observatory; Columbia University: New York, NY, USA, 1982. [Google Scholar]
- Donat, J.R.; Bruland, K.W. Trace Elements in the Oceans. In Trace Elements in Natural Waters; Salbu, B., Steinnes, E., Eds.; CRC Press: Boca Raton, FL, USA, 1995; pp. 247–292. [Google Scholar]
- Shriadah, M.A.; Okbah, M.A.; El-Deek, M.S. Trace metals in the water columns of the Red Sea and the Gulf of Aqaba, Egypt. Water Air Soil Pollut. 2004, 153, 115–124. [Google Scholar] [CrossRef]
- Ali, A. Sudanese Coastal Water—Composition and Some Environmental Aspects. Master’s Thesis, Universitas Bergensis, Bergen, Norway, 2012. [Google Scholar]
- Al-Taani, A.A.; Batayneh, A.; Nazzal, Y.; Ghrefat, H.; Elawadi, E.; Zaman, H. Status of trace metals in surface seawater of the Gulf of Aqaba, Saudi Arabia. Mar. Pollut. Bull. 2014, 86, 582–590. [Google Scholar] [CrossRef] [PubMed]
- El-Sorogy, A.; Attiah, A. Assessment of metal contamination in coastal sediments, seawaters and bivalves of the Medi-terranean Sea coast, Egypt. Mar. Pollut. Bull. 2015, 101, 867–871. [Google Scholar] [CrossRef] [PubMed]
- Abadi, M.; Zamani, A.; Parizanganeh, A.; Khosravi, Y.; Badiee, H. Heavy metals and arsenic content in water along the southern Caspian coasts in Iran. Environ. Sci. Pollut. Res. 2018, 25, 23725–23735. [Google Scholar] [CrossRef]
- Sun, Q.; Gao, F.; Chen, Z.; Wang, Y.; Li, D. The content and pollution evaluation of heavy metals in surface seawater in Dalian Bay. In IOP Conference Series: Earth and Environmental Science; IOP Publishing: Bristol, UK, 2019; Volume 227, p. 062021. [Google Scholar]
- Alshehri, F.; Almadani, S.; El-Sorogy, A.S.; Alwaqdani, E.; Alfaifia, H.J.; Alharbi, T. Influence of seawater intrusion and heavy metals contamination on groundwater quality, Red Sea coast, Saudi Arabia. Mar. Pollut. Bull. 2021, 165, 112094. [Google Scholar] [CrossRef]
- Javed, J.; Ahmad, N.; Mashiatullah, A. Heavy metals contamination and ecological risk assessment in surface sediments of Namal Lake, Pakistan. Pol. J. Environ. Stud. 2018, 27, 675–688. [Google Scholar] [CrossRef]
- Vrhovnik, P.; Šmuc, N.R.; Dolenec, T.; Serafimovski, T.; Dolenec, M. An evaluation of trace metal distribution and envi-ronmental risk in sediments from the Lake Kalimanci (FYR Macedonia). Environ. Earth Sci. 2013, 70, 761–775. [Google Scholar] [CrossRef]
- Hao, J.; Ren, J.; Tao, L.; Fang, H.; Gao, S.; Chen, Y. Pollution evaluation and sources identification of heavy metals in surface sediments from upstream of Yellow River. Pol. J. Environ. Stud. 2021, 30, 1161–1169. [Google Scholar] [CrossRef]
- Obinna, I.B.; Ebere, E.C. A Review: Water pollution by heavy metal and organic pollutants: Brief review of sources, ef-fects and progress on remediation with aquatic plants. Anal. Methods Environ. Chem. J. 2019, 2, 5–38. [Google Scholar] [CrossRef] [Green Version]
- Kumar, S.B.; Padhi, R.K.; Mohanty, A.K.; Satpathy, K.K. Distribution and ecological- and health-risk assessment of heavy metals in the seawater of the southeast coast of India. Mar. Pollut. Bull. 2020, 161, 111712. [Google Scholar] [CrossRef] [PubMed]
- Chen, X.; Lu, X. Contamination characteristics and source apportionment of heavy metals in topsoil from an area in Xi’an city, China. Ecotoxicol. Environ. Saf. 2018, 151, 153–160. [Google Scholar] [CrossRef]
- Arikibe, J.E.; Prasad, S. Determination and comparison of selected heavy metal concentrations in seawater and sediment samples in the coastal area of Suva, Fiji. Mar. Pollut. Bull. 2020, 157, 111157. [Google Scholar] [CrossRef] [PubMed]
Figure 1.
Study area map showing the locations of surface seawater samples.

Figure 2.
Distribution of Cr, Zn, Fe, Hg, Pb, Al; Cu, Se, and Ni in seawater samples.

Figure 3.
Distribution of Cd, Sb, As, V, and Sr in seawater samples.

Figure 4.
Q-mode HCA of Al-Ugair surface seawater samples.

Figure 5.
R-mode HCA of HMs in seawater samples.

Figure 6.
Distribution of water pollution index (PIj), degree of contamination (Cd), and heavy-metal pollution index (HPI) of Al-Ugair surface seawater samples.
Figure 6.
Distribution of water pollution index (PIj), degree of contamination (Cd), and heavy-metal pollution index (HPI) of Al-Ugair surface seawater samples.


Table 1.
Indices used in the analysis of HM contamination levels and water quality assessment.
| Indices | Classifications | ||||||
|---|---|---|---|---|---|---|---|
| Degree of contamination (Cd) | CF = C (heavy metal)/C (Background) Cd = ∑CF where CF is the contamination factor, C (heavy metal) is the analytical value and C (Background) is the upper permissible concentration for the ith component. Three degrees of contamination were classified [32]: | ||||||
| Cd < 4 | Cd = 4–8 | Cd > 8 | |||||
| Low contamination | Medium contamination | High contamination | |||||
| Heavy metal pollution index (HPI) | HPI = where Qi is the subindex of the ith parameter, and Wi is the unit weight for the ith parameter. Qi = where Mi, Ii, and Si are the measured heavy-metal, ideal, and standard values of the ith parameter, respectively. “-“, numerical difference of the two values. Three classes of HPI were classified [33]: | ||||||
| HPI < 5 | HPI = 5–10 | HPI > 10 | |||||
| Low | Medium | High | |||||
| Water Pollution Index (PIj) | PIj = where Lij is the standard water quality parameter for each parameter at a specific quality purpose; Ci is the measured water quality parameters; (Ci/Lij) M is the maximal value of Ci/Lij; (Ci/Lij) R is the average value of Ci/Lij. The water pollution index has four categories [34]: | ||||||
| 0 ≤ PIj ≤ 1 | 1 ≤ PIj ≤ 5 | 5 ≤ PIj ≤ 10 | PIj > 10 | ||||
| Excellent water quality | Good water quality | Poor water quality | Very poor water quality | ||||
Table 2.
Statistics of HMs measured in Al-Ugair surface seawater samples as compared to the maximal admissible concentration (MAC) of WHO [35].
Table 2.
Statistics of HMs measured in Al-Ugair surface seawater samples as compared to the maximal admissible concentration (MAC) of WHO [35].
| Minimum | Maximum | Mean | Standard Deviation | MAC | |
|---|---|---|---|---|---|
| pH | 8.1 | 8.17 | 8.12 | 0.08 | 7–8.5 |
| EC (dS/m) | 72.4 | 122.5 | 81.04 | 3.39 | |
| Al (μg/L) | 0.31 | 1.43 | 0.68 | 0.301 | 200 |
| As (μg/L) | 4.40 | 7.60 | 5.45 | 0.822 | 10 |
| Cd (μg/L) | 0.04 | 0.08 | 0.05 | 0.0113 | 3 |
| Cr (μg/L) | 7.00 | 14.50 | 9.64 | 1.785 | 50 |
| Cu (μg/L) | 1.10 | 3.80 | 2.48 | 0.786 | 2000 |
| Fe (μg/L) | 3.00 | 8.80 | 6.13 | 1.522 | 200 |
| Hg (μg/L) | 0.18 | 1.10 | 0.65 | 0.257 | 6 |
| Pb (μg/L) | 0.09 | 0.43 | 0.26 | 0.094 | 10 |
| Sb (μg/L) | 0.02 | 0.10 | 0.07 | 0.018 | 20 |
| Se (μg/L) | 2.50 | 3.10 | 2.69 | 0.163 | 40 |
| V (μg/L) | 2.30 | 4.70 | 3.45 | 0.677 | NA |
| Zn (μg/L) | 3.30 | 9.90 | 6.72 | 1.489 | 40 |
| Ni (μg/L) | 1.20 | 6.90 | 3.01 | 1.360 | 20 |
| Sr (μg/L) | 7109 | 7398 | 7214.11 | 56.989 | NA |
Table 3.
Comparison between HM levels in the investigated seawaters and those in other global sites.
Table 3.
Comparison between HM levels in the investigated seawaters and those in other global sites.
| Se | V | Pb | Cd | Zn | Ni | Cr | Cu | Hg | As | Sr | Reference | |
|---|---|---|---|---|---|---|---|---|---|---|---|---|
| Uqair coastaline, Saudi Arabia | 2.69 | 3.45 | 0.26 | 0.05 | 6.72 | 3.01 | 9.64 | 2.48 | 0.65 | 5.45 | 7214 | Present study |
| Sharm Al-Kharrar lagoon, Saudi Arabia | 0.28 | 0.06 | 4.19 | 5.76 | 0.26 | 1.24 | 2.07 | [13] | ||||
| Gulf of Aqaba, Red Sea, Saudi Arabia | 1.31 | 0.05 | 5.51 | 2.45 | 0.26 | 2.34 | 0.008 | 2.43 | [24] | |||
| Al-Khobar beach, Saudi Arabia | 0.38 | 1.25 | 0.04 | 0.11 | 16.21 | 4.36 | 1.38 | 5.24 | 0.68 | 2.41 | 200.9 | [12] |
| Al-Khafji beach, Saudi Arabia | 2.86 | 0.28 | 0.07 | 1.53 | 4.40 | 2.44 | 2.44 | 0.06 | 1.74 | 1513 | [25] | |
| Average oceanic concentration | 0.001 | 0.07 | 0.4 | - | 0.33 | 0.12 | - | - | [38] | |||
| North Atlantic | 125 | 5.5 | 0.15 | 2 | 3.5 | 1.15 | 1–7 | 20 | [39] | |||
| North Pacific | 32 | 5.5 | 0.15 | 2 | 3 | 0.9 | 0.5–10 | 20 | [39] | |||
| Gulf of Aqaba | 0.32 | 0.57 | 0.24 | 0.22 | - | 0.14 | - | - | [40] | |||
| Red sea coast, Egypt | 0.03 | 0.06 | 5.5 | 0.76 | 0.18 | 0.97 | - | - | [41] | |||
| Gulf of Aqaba, Saudi Arabia | 0.20 | 0.03 | 3.32 | - | 0.96 | 6.18 | 0.06 | 0.82 | [42] | |||
| Tarut coastline, Saudi Arabia | 1.52 | 0.48 | 0.03 | 0.97 | - | 12.95 | 2.65 | 0.30 | 11.13 | [18] | ||
| Rosetta coast, Mediterranean Sea, Egypt | 0.426 | - | 1.694 | 1.92 | 0.133 | - | - | 0.30 | 5860 | [43] | ||
| Caspian beach, Iran | 1.67 | 0.27 | 16.94 | 9.93 | - | 5.02 | - | - | [44] |
Table 4.
Correlation matrix of the investigated HMs.
| pH | EC | Al | As | Cd | Cr | Cu | Fe | Hg | Pb | Sb | Se | V | Zn | Ni | Sr | |
|---|---|---|---|---|---|---|---|---|---|---|---|---|---|---|---|---|
| pH | 1.0 | |||||||||||||||
| EC | –0.084 | 1.0 | ||||||||||||||
| Al | 0.010 | 0.043 | 1.0 | |||||||||||||
| As | –0.002 | 0.039 | –0.077 | 1.0 | ||||||||||||
| Cd | –0.045 | 0.460 ** | –0.073 | –0.121 | 1.0 | |||||||||||
| Cr | 0.222 | –0.310 | 0.117 | 0.261 | –0.009 | 1.0 | ||||||||||
| Cu | 0.077 | 0.025 | 0.206 | 0.208 | 0.083 | 0.346 * | 1.0 | |||||||||
| Fe | –0.306 | 0.282 | 0.167 | –0.046 | 0.095 | 0.062 | 0.236 | 1.0 | ||||||||
| Hg | –0.051 | 0.272 | 0.028 | –0.346 * | 0.024 | –0.174 | –0.012 | 0.110 | 1.0 | |||||||
| Pb | 0.169 | 0.178 | –0.077 | –0.129 | 0.032 | –0.161 | –0.123 | 0.142 | –0.182 | 1.0 | ||||||
| Sb | –0.212 | 0.150 | –0.024 | 0.272 | 0.054 | –0.029 | 0.108 | 0.135 | 0.153 | –0.381 * | 1.0 | |||||
| Se | 0.057 | –0.031 | –0.203 | 0.056 | 0.184 | 0.300 | 0.157 | 0.261 | 0.027 | 0.292 | –0.155 | 1.0 | ||||
| V | –0.337 * | 0.286 | 0.199 | –0.066 | 0.043 | 0.017 | 0.131 | 0.420 * | 0.168 | –0.227 | 0.385 * | 0.047 | 1.0 | |||
| Zn | 0.358 * | 0.412 * | 0.001 | 0.364 * | 0.042 | 0.061 | 0.127 | –0.115 | 0.119 | 0.010 | 0.011 | 0.146 | 0.111 | 1.0 | ||
| Ni | 0.356 * | 0.420 * | 0.056 | 0.048 | 0.297 | –0.264 | –0.155 | –0.049 | –0.128 | 0.403 * | –0.341 * | –0.106 | –0.214 | 0.381 * | 1.0 | |
| Sr | 0.299 | 0.388 * | 0.095 | 0.441 ** | 0.148 | 0.084 | 0.241 | –0.039 | 0.084 | 0.041 | 0.109 | –0.240 | –0.181 | 0.418 * | 0.394 * | 1.0 |
*. Correlation is significant at the 0.05 level (2-tailed). **. Correlation is significant at the 0.01 level (2-tailed).
Table 5.
Principal component loadings along with six variances for the components.
| Component | ||||||
|---|---|---|---|---|---|---|
| 1 | 2 | 3 | 4 | 5 | 6 | |
| pH | 0.55 | –0.33 | 0.30 | 0.03 | 0.26 | 0.37 |
| EC | 0.53 | 0.60 | –0.44 | –0.02 | –0.08 | –0.02 |
| Al | –0.01 | 0.23 | 0.08 | –0.02 | 0.80 | –0.27 |
| As | 0.28 | 0.21 | 0.65 | –0.11 | –0.42 | –0.33 |
| Cd | 0.31 | 0.29 | –0.29 | 0.23 | –0.19 | 0.05 |
| Cr | –0.07 | 0.04 | 0.71 | 0.40 | 0.13 | 0.11 |
| Cu | 0.05 | 0.40 | 0.49 | 0.30 | 0.26 | 0.01 |
| Fe | –0.14 | 0.54 | –0.20 | 0.51 | 0.11 | –0.28 |
| Hg | –0.06 | 0.36 | –0.32 | –0.15 | 0.20 | 0.69 |
| Pb | 0.40 | –0.31 | –0.35 | 0.48 | –0.02 | –0.24 |
| Sb | –0.25 | 0.61 | 0.17 | –0.35 | –0.30 | 0.003 |
| Se | 0.01 | 0.03 | 0.079 | 0.82 | –0.29 | 0.29 |
| V | –0.30 | 0.70 | −0.134 | 0.09 | 0.06 | –0.02 |
| Zn | 0.65 | 0.29 | 0.219 | –0.04 | –0.07 | 0.30 |
| Ni | 0.81 | –0.11 | –0.297 | –0.01 | 0.09 | –0.19 |
| Sr | 0.69 | 0.28 | 0.283 | –0.27 | 0.07 | –0.07 |
| % of Variance | 16.19 | 13.15 | 13.15 | 11.82 | 8.86 | 8.35 |
| Cumulative % | 16.19 | 29.34 | 42.48 | 54.31 | 63.17 | 71.52 |
Publisher’s Note: MDPI stays neutral with regard to jurisdictional claims in published maps and institutional affiliations. |
© 2022 by the authors. Licensee MDPI, Basel, Switzerland. This article is an open access article distributed under the terms and conditions of the Creative Commons Attribution (CC BY) license (https://creativecommons.org/licenses/by/4.0/).
Share and Cite
MDPI and ACS Style
Al-Hashim, M.H.; El-Sorogy, A.S.; Alshehri, F.; Qaisi, S. Environmental Assessment of Surface Seawater in Al-Uqair Coastline, Eastern Saudi Arabia. Water 2022, 14, 3423. https://doi.org/10.3390/w14213423
AMA Style
Al-Hashim MH, El-Sorogy AS, Alshehri F, Qaisi S. Environmental Assessment of Surface Seawater in Al-Uqair Coastline, Eastern Saudi Arabia. Water. 2022; 14(21):3423. https://doi.org/10.3390/w14213423
Chicago/Turabian StyleAl-Hashim, Mansour H., Abdelbaset S. El-Sorogy, Fahad Alshehri, and Saleh Qaisi. 2022. "Environmental Assessment of Surface Seawater in Al-Uqair Coastline, Eastern Saudi Arabia" Water 14, no. 21: 3423. https://doi.org/10.3390/w14213423
Note that from the first issue of 2016, this journal uses article numbers instead of page numbers. See further details here.