
A Framework for Sustainable Groundwater Management
by
 , , and
Aavudai Anandhi
1,* ,
,
D. Karunanidhi
2,
G. Muthu Sankar
3,
Sudhanshu Panda
4 and
Narayanan Kannan
5 1
Biological Systems Engineering, College of Agriculture and Food Sciences, Florida State A&M University, Tallahassee, FL 32307, USA
2
Centre for Geoinformatics and Water Technology, Department of Civil Engineering, Sri Shakthi Institute of Engineering and Technology, Coimbatore 641062, Tamil Nadu, India
3
French Institute of Pondicherry IFP, UMIFRE 21 CNRS-MAEE/USR 3330, 11, St. Louis Street, P.B. 33, Pondicherry 605001, Tamil Nadu, India
4
Institute of Environmental Spatial Analysis, University of North Georgia, 3820 Mundy Mill Road, Oakwood, GA 30566, USA
5
Formerly, Texas Institute for Applied Environmental Research, Tarleton State University, Stephenville, TX 76402, USA
*
Author to whom correspondence should be addressed.
Water 2022, 14(21), 3416; https://doi.org/10.3390/w14213416
Submission received: 2 September 2022
/
Revised: 14 October 2022
/
Accepted: 22 October 2022
/
Published: 27 October 2022
(This article belongs to the Section Water Quality and Contamination)
Abstract
:This manuscript aims to present the framework for the development of a four-stage tool for sustainable groundwater management as one of the highly interactive three-day workshop products. The four stages in the tool are (1) representing the target system, (2) description of the target system using components of DPSIR framework (drivers, pressures, state, impact, responses), (3) development of causal chains/loops, and (4) identifying knowledge gaps and articulating next steps. The tool is an output from the two-day Indo-US bilateral workshop on "Integrated Hydrochemical Modeling for Sustainable Development and Management of Water Supply Aquifers”. Four case studies from the invited talks, panel discussions, and breakout sessions were selected to demonstrate the developed four-stage framework to a coastal aquifer (India) and in high plains in Floridian, Piedmont, and Blueridge aquifers (United States of America). The developed tool can be practically used in the development of strategies for the sustainable use of groundwater in various regions around the world (e.g., planning/building/maintaining groundwater recharging structures). Continued work can result in establishing a center for excellence as well as developing a network project. The recommendations from the workshop were: (1) developing vulnerability analysis models for groundwater managers; (2) treatment and new ways of using low-quality groundwater; (3) adopting groundwater recharge; (4) mitigating pollutants getting into the aquifer; and (5) reducing groundwater use. This study provides a framework for future researchers to study the groundwater table related to the effectiveness of water recharging structures, developing a quantitative model from the framework. Finally, recommendations for a future study are more data collection on groundwater quality/recharge as well as enhancing outreach activities for sustainable groundwater management.
1. Introduction
Groundwater accounts for 98% of accessible freshwater [1]. This critical environmental resource supplies water to billions of people [2] and has played a pivotal role in the global agricultural economy producing about one-fifth of the world’s food [3]. Agricultural production has increased 2.5 to 3 times during the past 50 years globally, whereas cultivated area has increased by only 12%, utilizing 70% of the water supply withdrawn with declined soil quality and biodiversity [4]. Despite global efforts to achieve water and food security, approximately 0.9 billion people do not have sufficient access to safe water [5]. This number can vary; as of 2016, 2.1 billion people are estimated to lack access to safely managed drinking water [6]. About 1.8 billion people rely on a drinking water source that is fecally contaminated [4]. In developing country contexts, 2.1 billion people still lack access to safely managed water [7].
While the demands for water and food are estimated to increase by 40% and 35%, respectively, by 2030 [8], global demand for a certain group of the population is estimated to increase by over 50% by 2050, compared with 2015 [9]. There is an extra 60% and 80% global demand expected by 2050 for food and energy, respectively, causing an increase in water withdrawals by 50% in just the next few years [5]. The difference between groundwater withdrawal and the subsequent recharging in the US [10] and India (both study areas), including the entire globe [11], has been consistently in the negative territory. Thus, locations where agriculture mostly depends on groundwater supply, especially in the Midwest and Southeastern US, and Tamilnadu in India, are waiting for a disaster to happen in the next few decades, i.e., no more groundwater available on an economical basis for agricultural production.
Therefore, groundwater conservation is one of the main groundwater management objectives [12]. Groundwater managers need information useful for groundwater management and groundwater protection [13]. To address the concerns mentioned above, the Indo–US bilateral workshop on “Integrated Hydrochemical Modeling for Sustainable Development and Management of Water Supply Aquifers” was held during 2–4 January 2020 at the Department of Civil Engineering, Sri Shakthi Institute of Engineering and Technology, Coimbatore, India. Funding from the Indo-US Science and Technology Forum (IUSSTF), New Delhi, supported the 3-day workshop. The workshop’s overall goal was to bring together researchers, practitioners, and students from Indian and US universities/organizations to provide a platform to exchange knowledge and experiences for the sustainable development and management of water supply aquifers.
Generally, groundwater management tools perform one of two functions: reduce demand or increase supply [14]. The tools often use modeling, and their advantages and disadvantages are described in [15]. For example, modeling tools are used to increase water-use efficiency (e.g., improved irrigation technology), which result in conservation or reduced demand on water supplies. Modeling tools are used for artificial aquifer recharge such as injection of treated water [14]. A recent study on stakeholder perspectives [16] emphasized the need for developing tools to formulate management that support decision-making on groundwater management with limited resources. This reinforces the need emphasized by the workshop participants.
To address this need, a four-stage tool for sustainable groundwater management was developed during the IUSSTF workshop. The objective of this manuscript is to present the developed tool and its applications. For the application, four case studies from the invited talks, panel discussions, and breakout sessions were used to demonstrate the developed four-stage framework in a coastal aquifer (India) and in high plains: the Floridian, Piedmont, and Blueridge aquifers (United States of America). Three of the case studies were related to groundwater replenishment through changing land uses, creating water harvesting structures, and providing resources to stakeholders for precision agriculture and thus decreasing agricultural water consumption. The fourth case study was presented in the form of automated geospatial models in the line of DRASTIC to determine groundwater contamination vulnerability and sinkhole formation vulnerability due to depletion with suggested remedials from these geohazards.
2. Materials and Methods
The Framework for a Sustainable Groundwater Development Tool
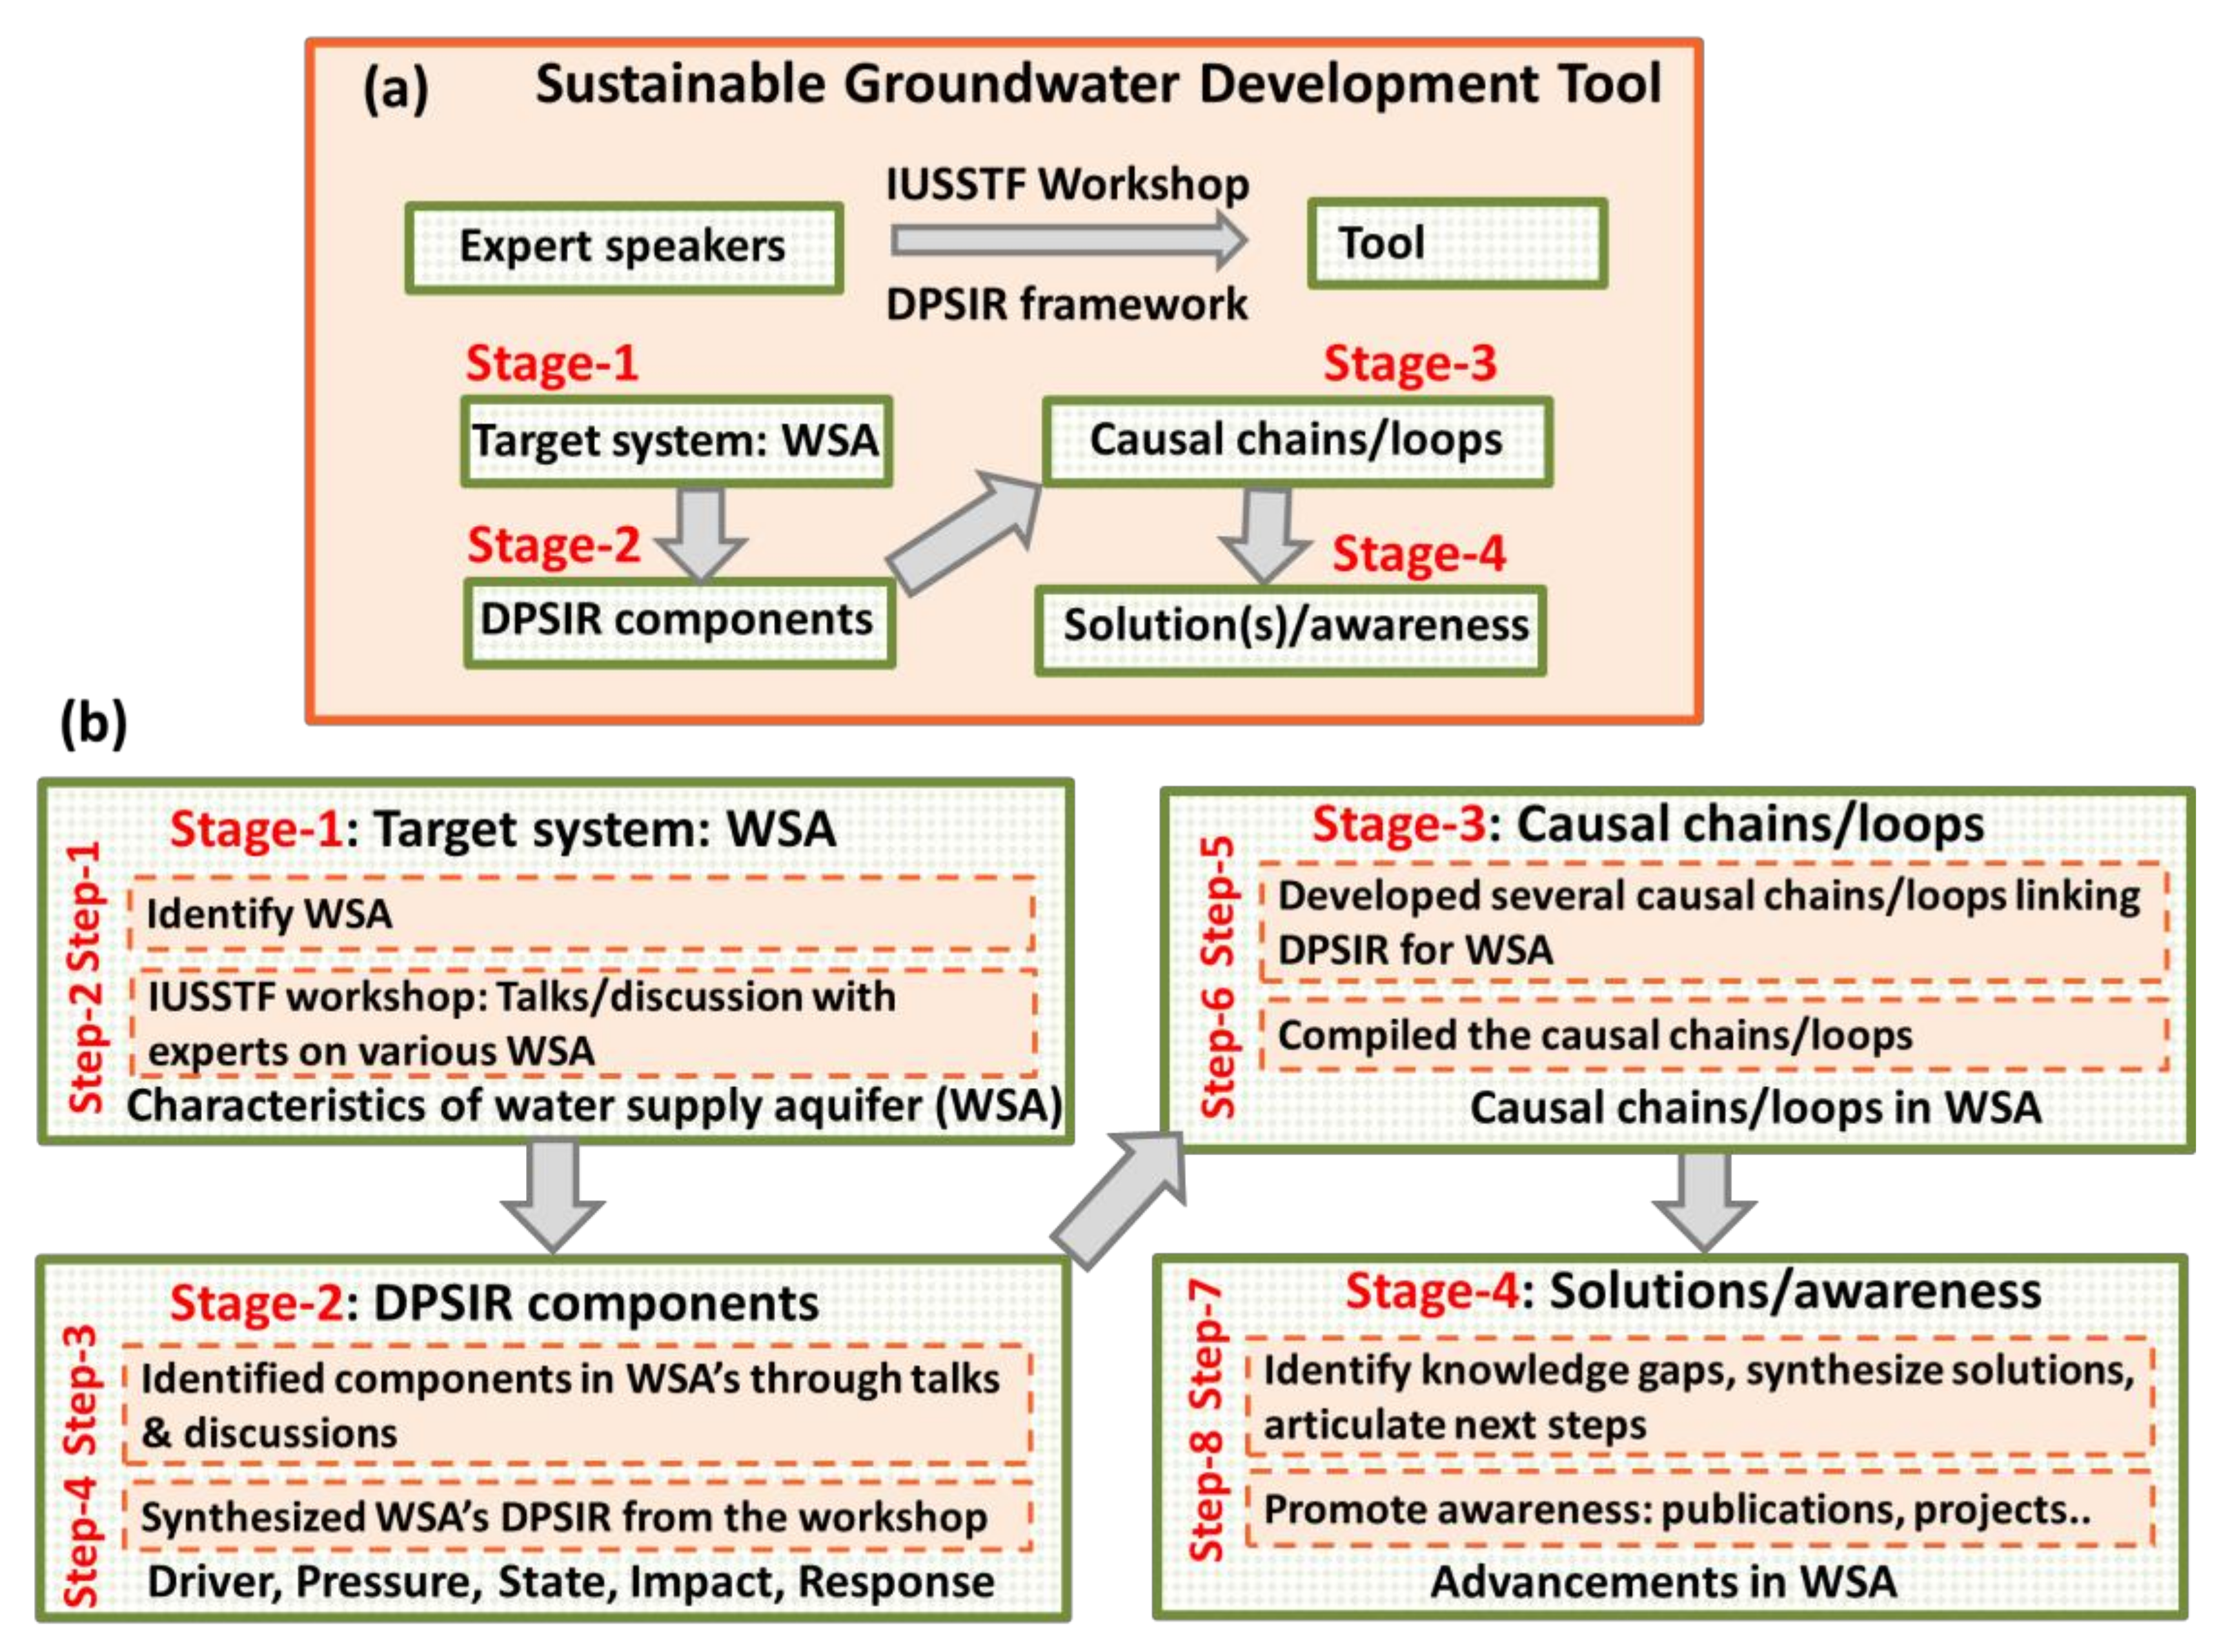
The knowledge-based sustainable groundwater development tool was developed as in Figure 1, and it has a four-stage framework. It is one of the outputs of the workshop. The four case studies are presented to demonstrate the application of the tool.
Stage 1: Through talks and discussions that started before the workshop and continued during and after the workshop, the characteristics of water supply aquifers were synthesized as coastal, bedrock, confined, and unconfined.
Stage 2: The DPSIR components: drivers, pressures, state, impact, and responses in each of the water supply aquifers were synthesized.
Stage 3: The causal chains/loop(s) were developed connecting the DPSIR components. The type of data and some results are provided.
Stage 4: The knowledge gaps in the water supply aquifers (WSAs) and potential solutions provided were synthesized. In this step, awareness and collaborations were increased.
3. Results and Discussion: Framework Application
The developed framework is demonstrated by applying it to case studies presented at the workshop.
3.1. Case Study 1: Framework Application for the Coastal Aquifer, India
Stage 1: The target system is a coastal aquifer in India. The South Indian state of Tamil Nadu has a long coastline with lagoons, marshes, beaches, and deltas rich in a mangrove forest. The northern coastal region of Tamil Nadu (360 km) receives an average of two cyclonic storms every year, with flooding, beach erosion, cyclones, and storm surges making this area more vulnerable to coastal hazards. One such example is the 2004 tsunami, which significantly affected this coastal region. The vulnerability to coastal flooding increases dramatically where inland freshwater systems are threatened by saltwater intrusion. Moreover, the rapid growth of population, urbanization, domestic sewage, industrialization, nuclear plant, thermal power station, and tourism developmental activities are putting increasing pressure on this coastal aquifer [17]. In particular, the Nagapattinam district has been categorized as salty. There is a large-scale conversion of wetlands and agricultural land to shrimp farm culture [18]. The pollution waste and chemicals used during intensive aquaculture lead to environmental hazards in the region. The overall changes in land use and land cover due to various physical, climatic, and socio-economic factors directly influence the coastal aquifers.
Stage 2: Components of the DPSIR framework were identified. Drivers in the coastal aquifer were classified as physical and anthropogenic. The specific physical drivers were current energy, wave energy, cyclones, storm surges, tidal, tsunami, etc. The specific anthropogenic drivers were land-use/land-cover changes, changes in population (increase), tourism, beach resorts, aquaculture, urbanization, industrialization, over-exploitation of groundwater, upstream river dam construction, etc.
Assessment of coastal aquifer was performed using the GALDIT model, which was developed by [19] within the framework of the EU–India INCO-DEV COASTIN project. This model has been first applied in the coastal regions of Goa in India and Algarve in Portugal by [20] and [21], respectively. GALDIT is the indexing method to classify the areas vulnerable to salt water intrusion using ranges, classes and weights. The classification is based on the following six parameters [19,22,23]: groundwater occurrence (G); aquifer hydraulic conductivity (A); depth of groundwater level from sea level (L); distance from the shore (D) (distance inland perpendicular from shoreline); impact of existing status of seawater intrusion (I); and thickness of the aquifer being mapped (T). Each of these six indicators has attributed fixed weight and rate that reflects its level of importance to SWI. The final GALDIT index is reached by overlaying the individual parameter scores and summing them and dividing by the total weight as per the following equation [20,24]:
where Wi is the weight of the ith parameter and Ri is the rating of the ith parameter. The GALDIT vulnerability classes vary between less than 5 (<5) and greater than 7.5 (>7.5). The greater the GALDIT-index value, the higher the vulnerability to seawater intrusion and vice versa. Hence, the areas vulnerable to SWI were classified into three classes, viz., low vulnerability, moderate vulnerability and high vulnerability.
Impacts: The impacts were classified into physical and social impacts.
The physical impacts observed in the target system are:
- Seawater intrusion;
- Groundwater depletion;
- Coastal storm surge;
- Coastal erosion;
- Reduction in sand dunes and natural ecosystems;
- Inundation risk analysis;
- Coastal flooding and erosion caused by changes in current energy and wave energy, cyclones, storm surges, tidal, tsunami;
- Mangroves impacted by check dams as well as seawater/freshwater flow dynamics change;
- Wetland biodiversity destruction.
The social impacts observed in the target system are:
- Fishermen’s access to the beach is impacted;
- Agriculture land and drinking water quality are reduced;
- Some of the developed policies have negative impacts, e.g., reduction in coastal regulation.
Response: Some of the responses are documented. Firstly, there is a reduction and restriction in pumping and rearranging pumping wells (e.g., Pondicherry) in the region. Secondly, there is an increase in groundwater recharge in coastal aquifer systems through check dams, recharge ponds/tanks, and spreading channels. Thirdly, a check dam was constructed at the river’s tail-end to reduce surface seawater intrusion (e.g., Cauvery delta area). Fourthly, groin and sea wall structures for reducing erosion for shore protection were constructed. Finally, there was a restoration of mangrove wetlands (e.g., Pichavaram).
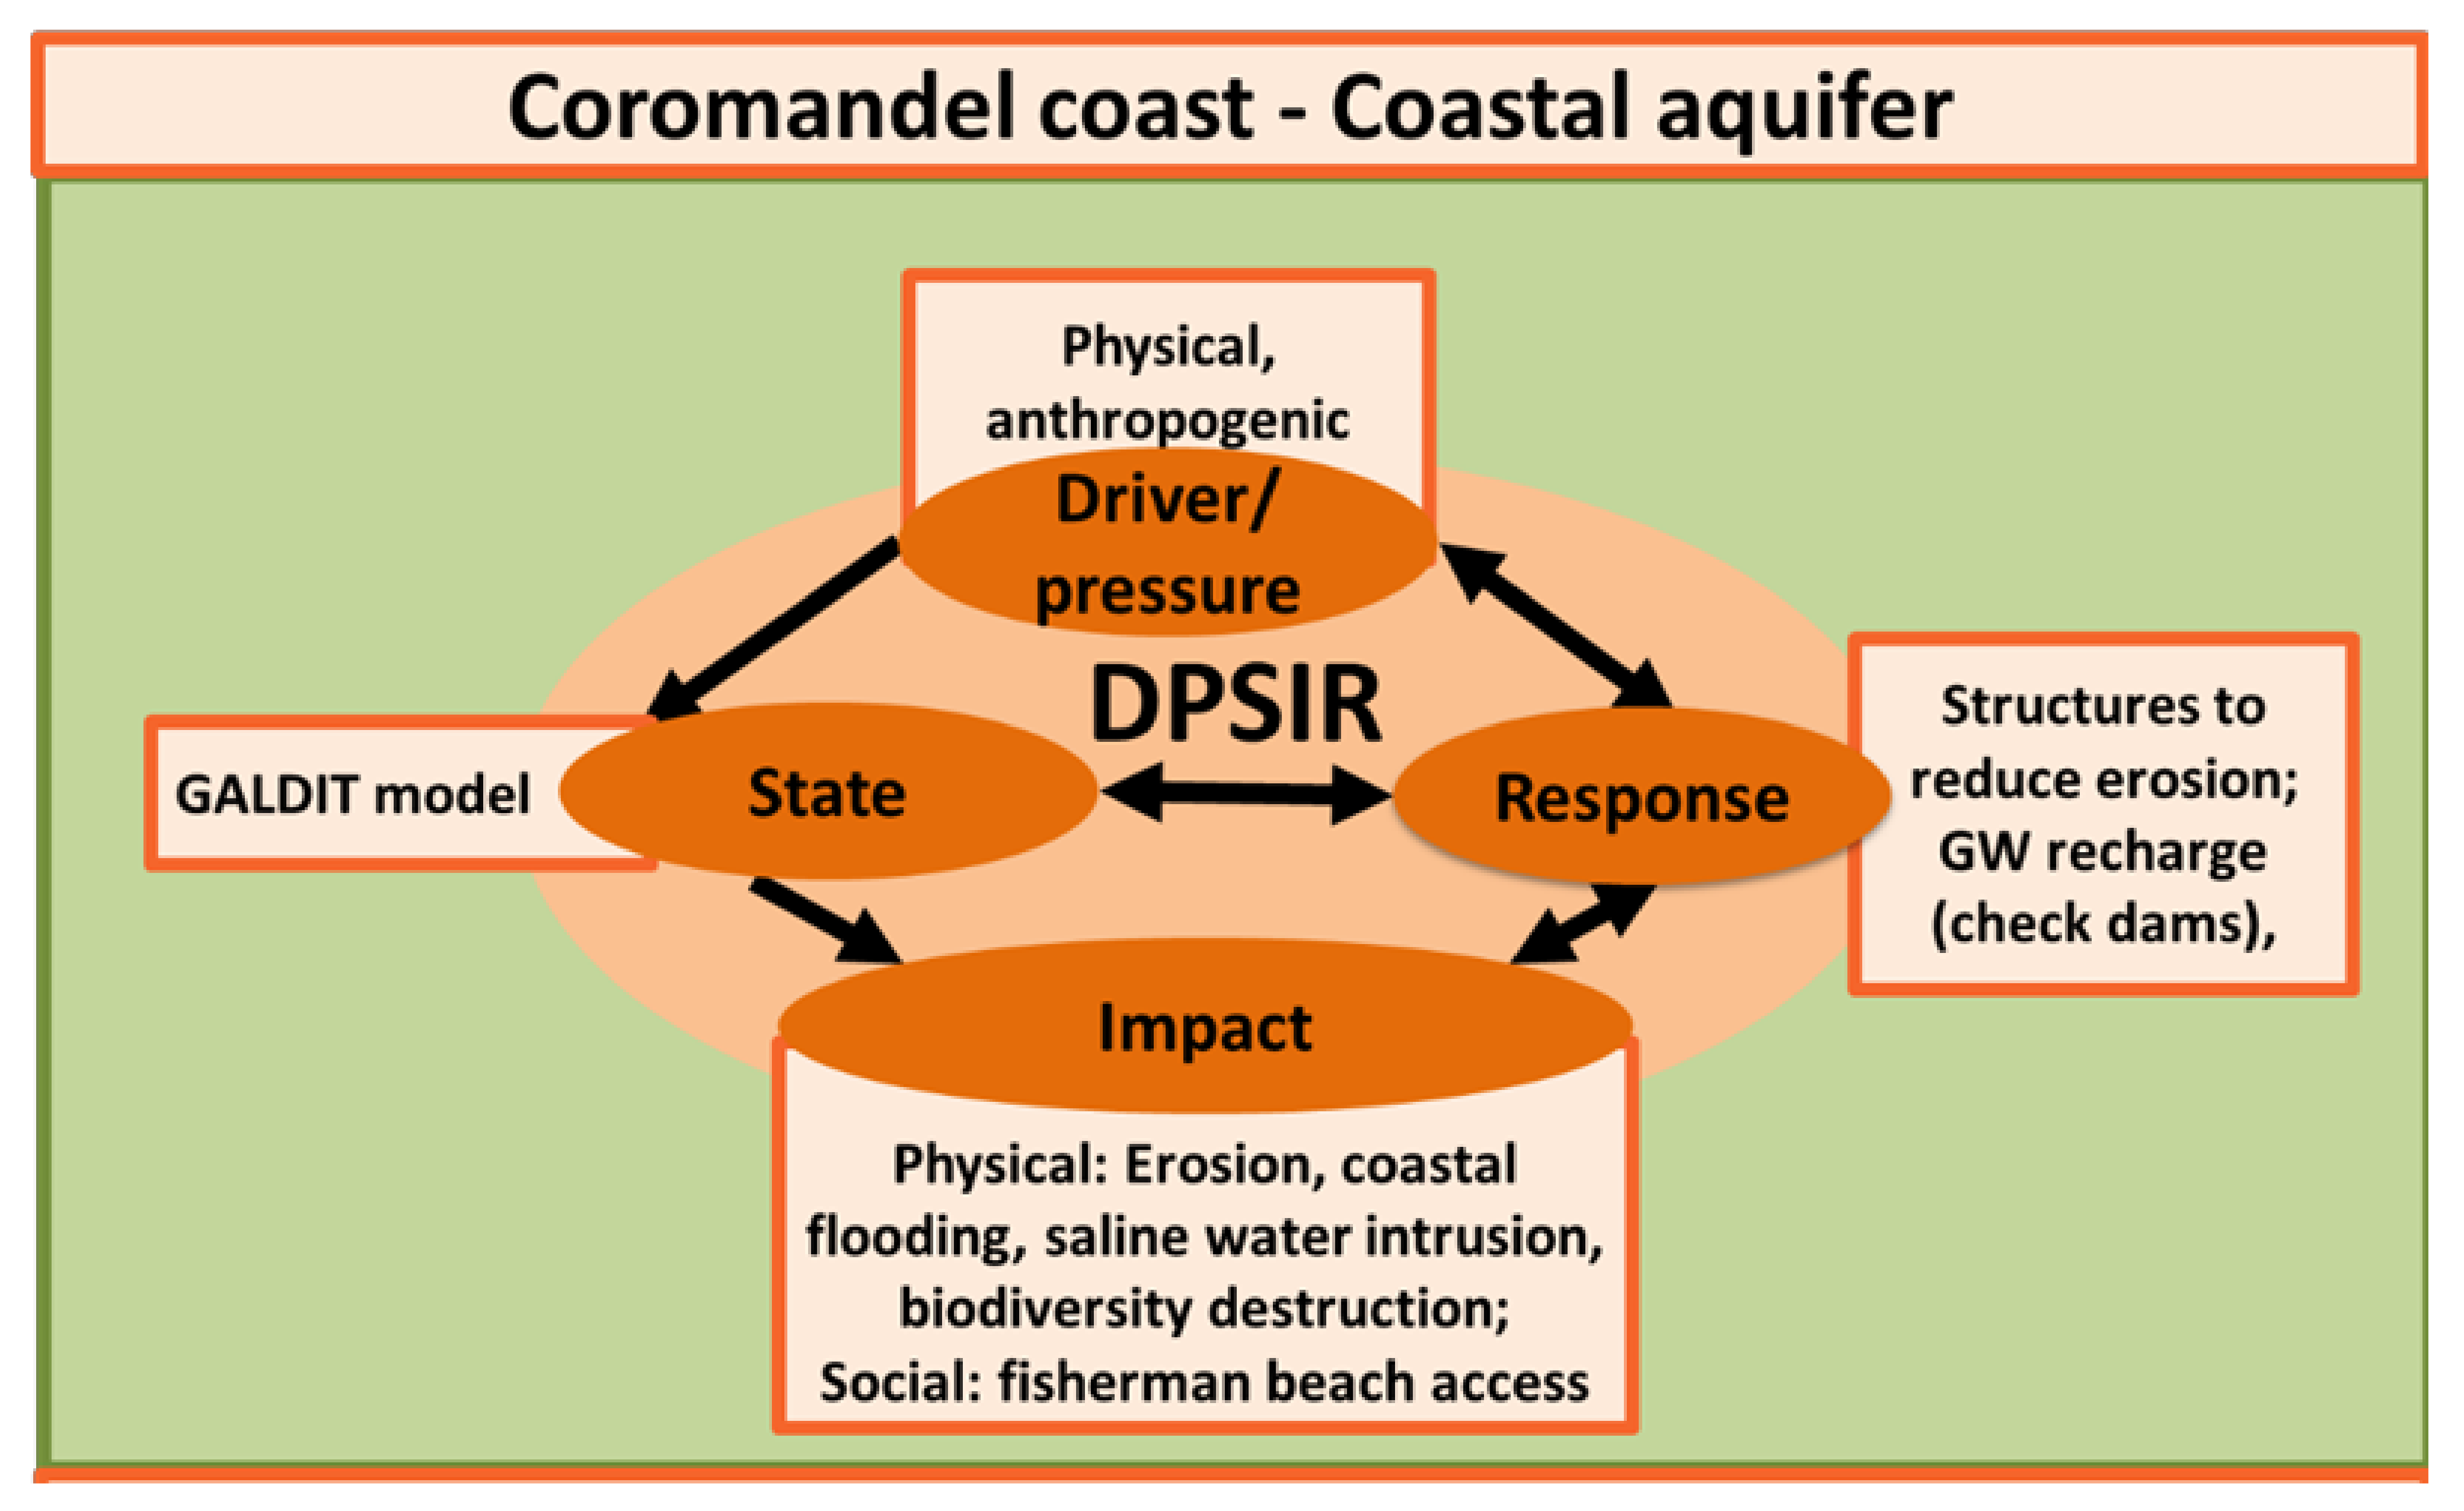
Stage 3: Causal chains/loops were developed between the driver/pressure–state–impact–response as provided in Figure 2. Major drivers are physical and anthropogenic pressures. Thus, coastal aquifer systems have several impacts, such as erosion, coastal flooding, saline water intrusion, and destruction of coastal ecosystems (Figure 2). The primary responses to prevent saline water intrusion were groundwater recharge structures and groins and sea wall construction to prevent sea erosion.
Stage 4: Identify knowledge gaps, articulate steps. The knowledge gaps in the coastal region seem to be: (a) lack of monitoring improper land-use conversion; (b) most of the farmers are still farming water-intensive crops such as paddy and sugarcane; (c) the need for exploring ways to reduce groundwater usages; (d) identifying novel strategies for groundwater recharge; (e) increasing more monitoring wells, particularly near coastal zones; and (f) guidelines to mitigate pollutants of industrial and aquaculture wastewater.
3.2. Case Study 2: Dockum Aquifer in Texas, United States (US)
Stage 1: Dockum aquifer (Figure 3) is a part of the High Plains aquifer systems in the US [24]. It is a minor aquifer overlain by Ogallala aquifer in most places and underlain by Permian System red-bed shales [25]. The aquifer can be confined or unconfined, depending on the site of reference. The depth to base varies from 96 to 595 m. The discharge potential is about 212 to 3107 L/min from 293 active wells (http://www.twdb.texas.gov/, accessed 2 September 2022; [24]. Water from the aquifer is used for crop irrigation, municipal supply, and energy production [26]. The recharge in most of the aquifer depends on the overlying Ogallala aquifer [27].
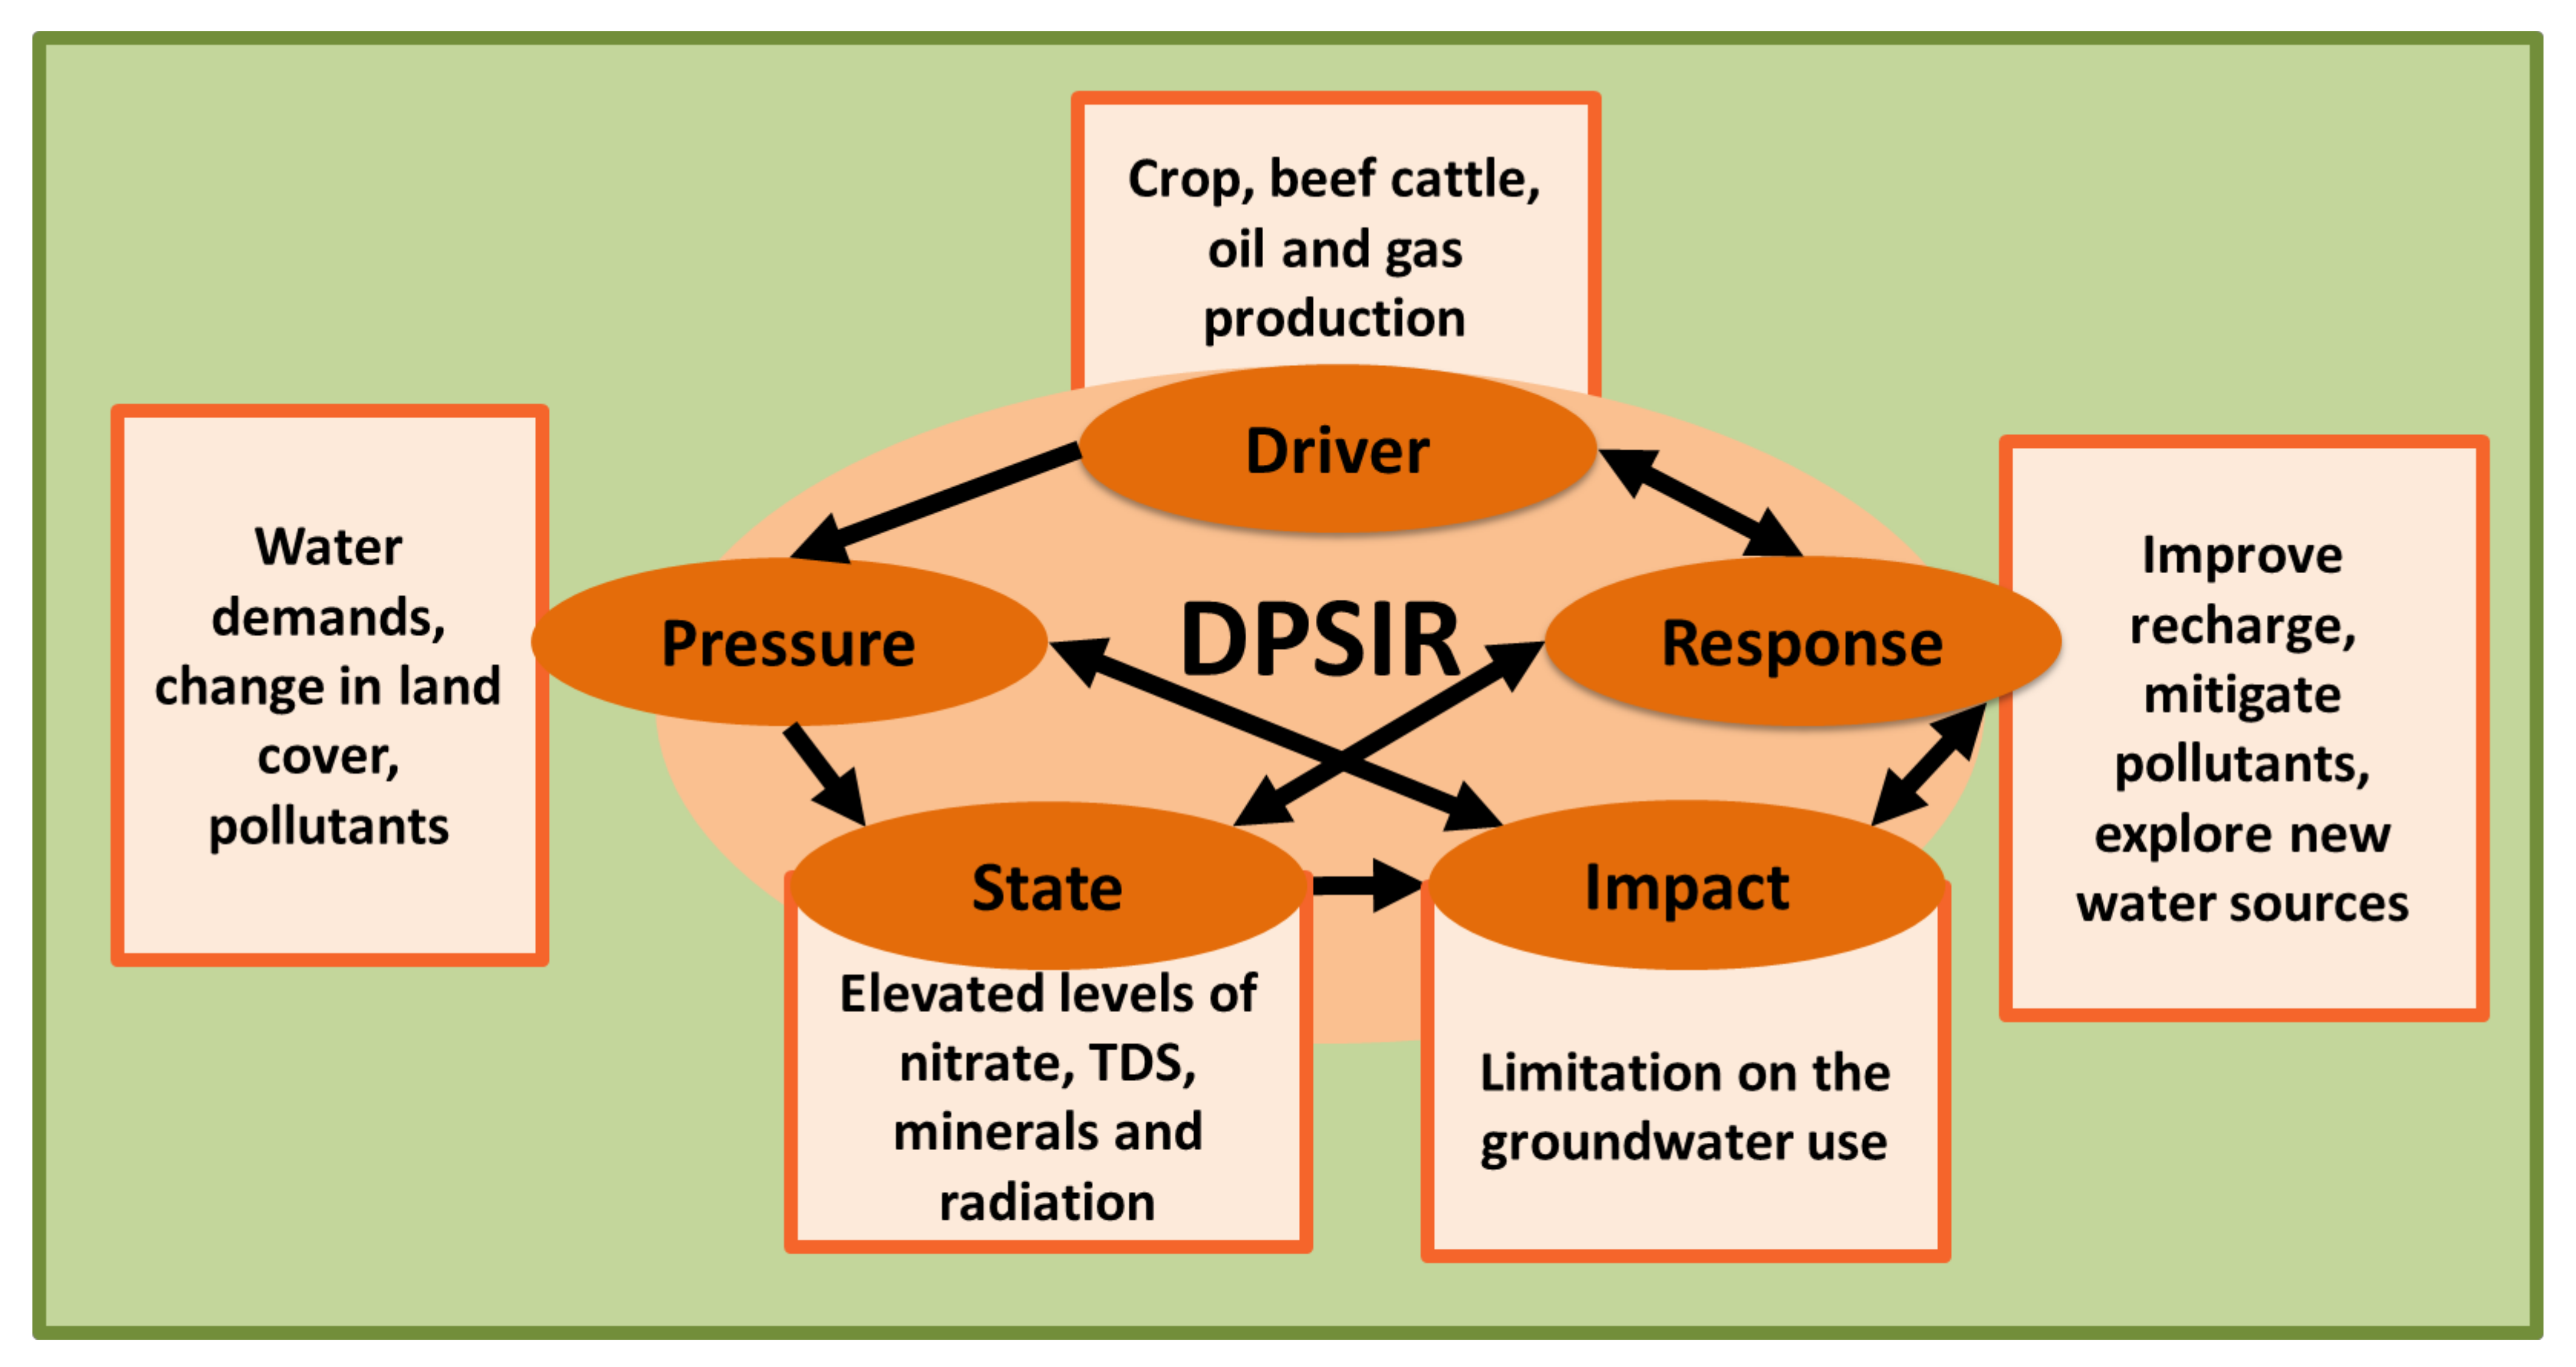
Stage 2: Components of the DPSIR framework identified. Driver: Soils in Texas High Plains are productive and support crop production. However, precipitation (400–500 mm/year) is limited [28,29,30], and therefore water is drawn from the aquifers (including Dockum) for irrigating crops [31]. Additionally, the area is a part of the largest cattle-feeding region in the US. It is home to several thousand beef cattle [32]. The region is also actively supporting a growing oil and gas industry (about 4600 km2 of the mineral area) (http://www.twdb.texas.gov/, accessed 2 September 2022).
Pressure: Crop production, raising beef cattle, and oil and gas exploration activities (a) use water from the aquifer; (b) change the land cover; and (c) discharge pollutants to the soil, groundwater, surface water, and air.
State: About 10% of the Dockum aquifer wells show nitrate concentrations exceeding the drinking water standards. The groundwater does not meet the secondary drinking water standards for chloride, fluoride, iron, sulfate, and total dissolved solids (TDS), although most of the problem is due to the minerals present in the aquifer [26]. TDS increase with depth. In addition to the issues mentioned above, naturally occurring radioactivity from uranium is also present in the groundwater [26,33]. With all the available data, the aquifer water quality’s current state can be explained by the widely-used GALDIT (Chachadi and Lobo-Ferreira, 2001) or DRASTIC (Mfumu Kihumba et al., 2016) modeling framework.
Impact: The water quality in the aquifer is generally low with high hardness. Nitrate concentrations exceed drinking water standards in some places [26]. These factors limit the Dockum aquifer’s current water use in addition to the naturally occurring radiation [26,33] and the declining groundwater recharge [34].
Response: The authorities managing the aquifer system are looking for options to improve (a) groundwater recharge; (b) reduce the pollutants getting into the aquifer; (c) treat the low-quality groundwater and make it usable; and (d) explore additional sources of water for various uses.
Stage 3: The developed causal loop is provided in Figure 3.
Stage 4: The knowledge gaps in the watershed appear to be (a) the collection of more groundwater quality data, (b) ways of improving groundwater recharge, (c) strategies to mitigate pollutants, and (d) outreach activities to improve the recharge and groundwater quality in the aquifer.
3.3. Case Study 3: Piedmont and Blueridge Aquifer in Georgia, US
Stage 1: The target systems are Piedmont and Blueridge aquifers in Georgia, US [35]. The area has a large-scale agricultural land use. Farmers and other city managers withdraw around 11 inches of water per year, but minimal (approximately 1 –inches) groundwater recharge happens in the area.
Stage 2: Components of the DPSIR framework identified. Drivers of land subsistence, groundwater depletion, and groundwater contamination vulnerability: Increasing land and water resources’ development threatens to exacerbate existing land-subsidence problems and initiate new ones. Land development activities include large-scale agriculture (row crop to horticultural crops), construction and development of land in the region, and waste management and superfund site development, including coal ash pond development. Additionally, changing the natural water-drainage patterns, developing new water-diversion systems, or creating industrial and runoff-storage ponds, are creating groundwater depletion issues. Excessive pumping of such aquifer systems has resulted in permanent subsidence and related ground failures [36]. Groundwater depletion is in the range of 9–12 inches per year in the study area and the surrounding area. Groundwater contamination is another big issue that accelerates in the study area due to groundwater volume depletion, unscientific agriculture practices and waste management and superfund site development. Pollution is another driver.
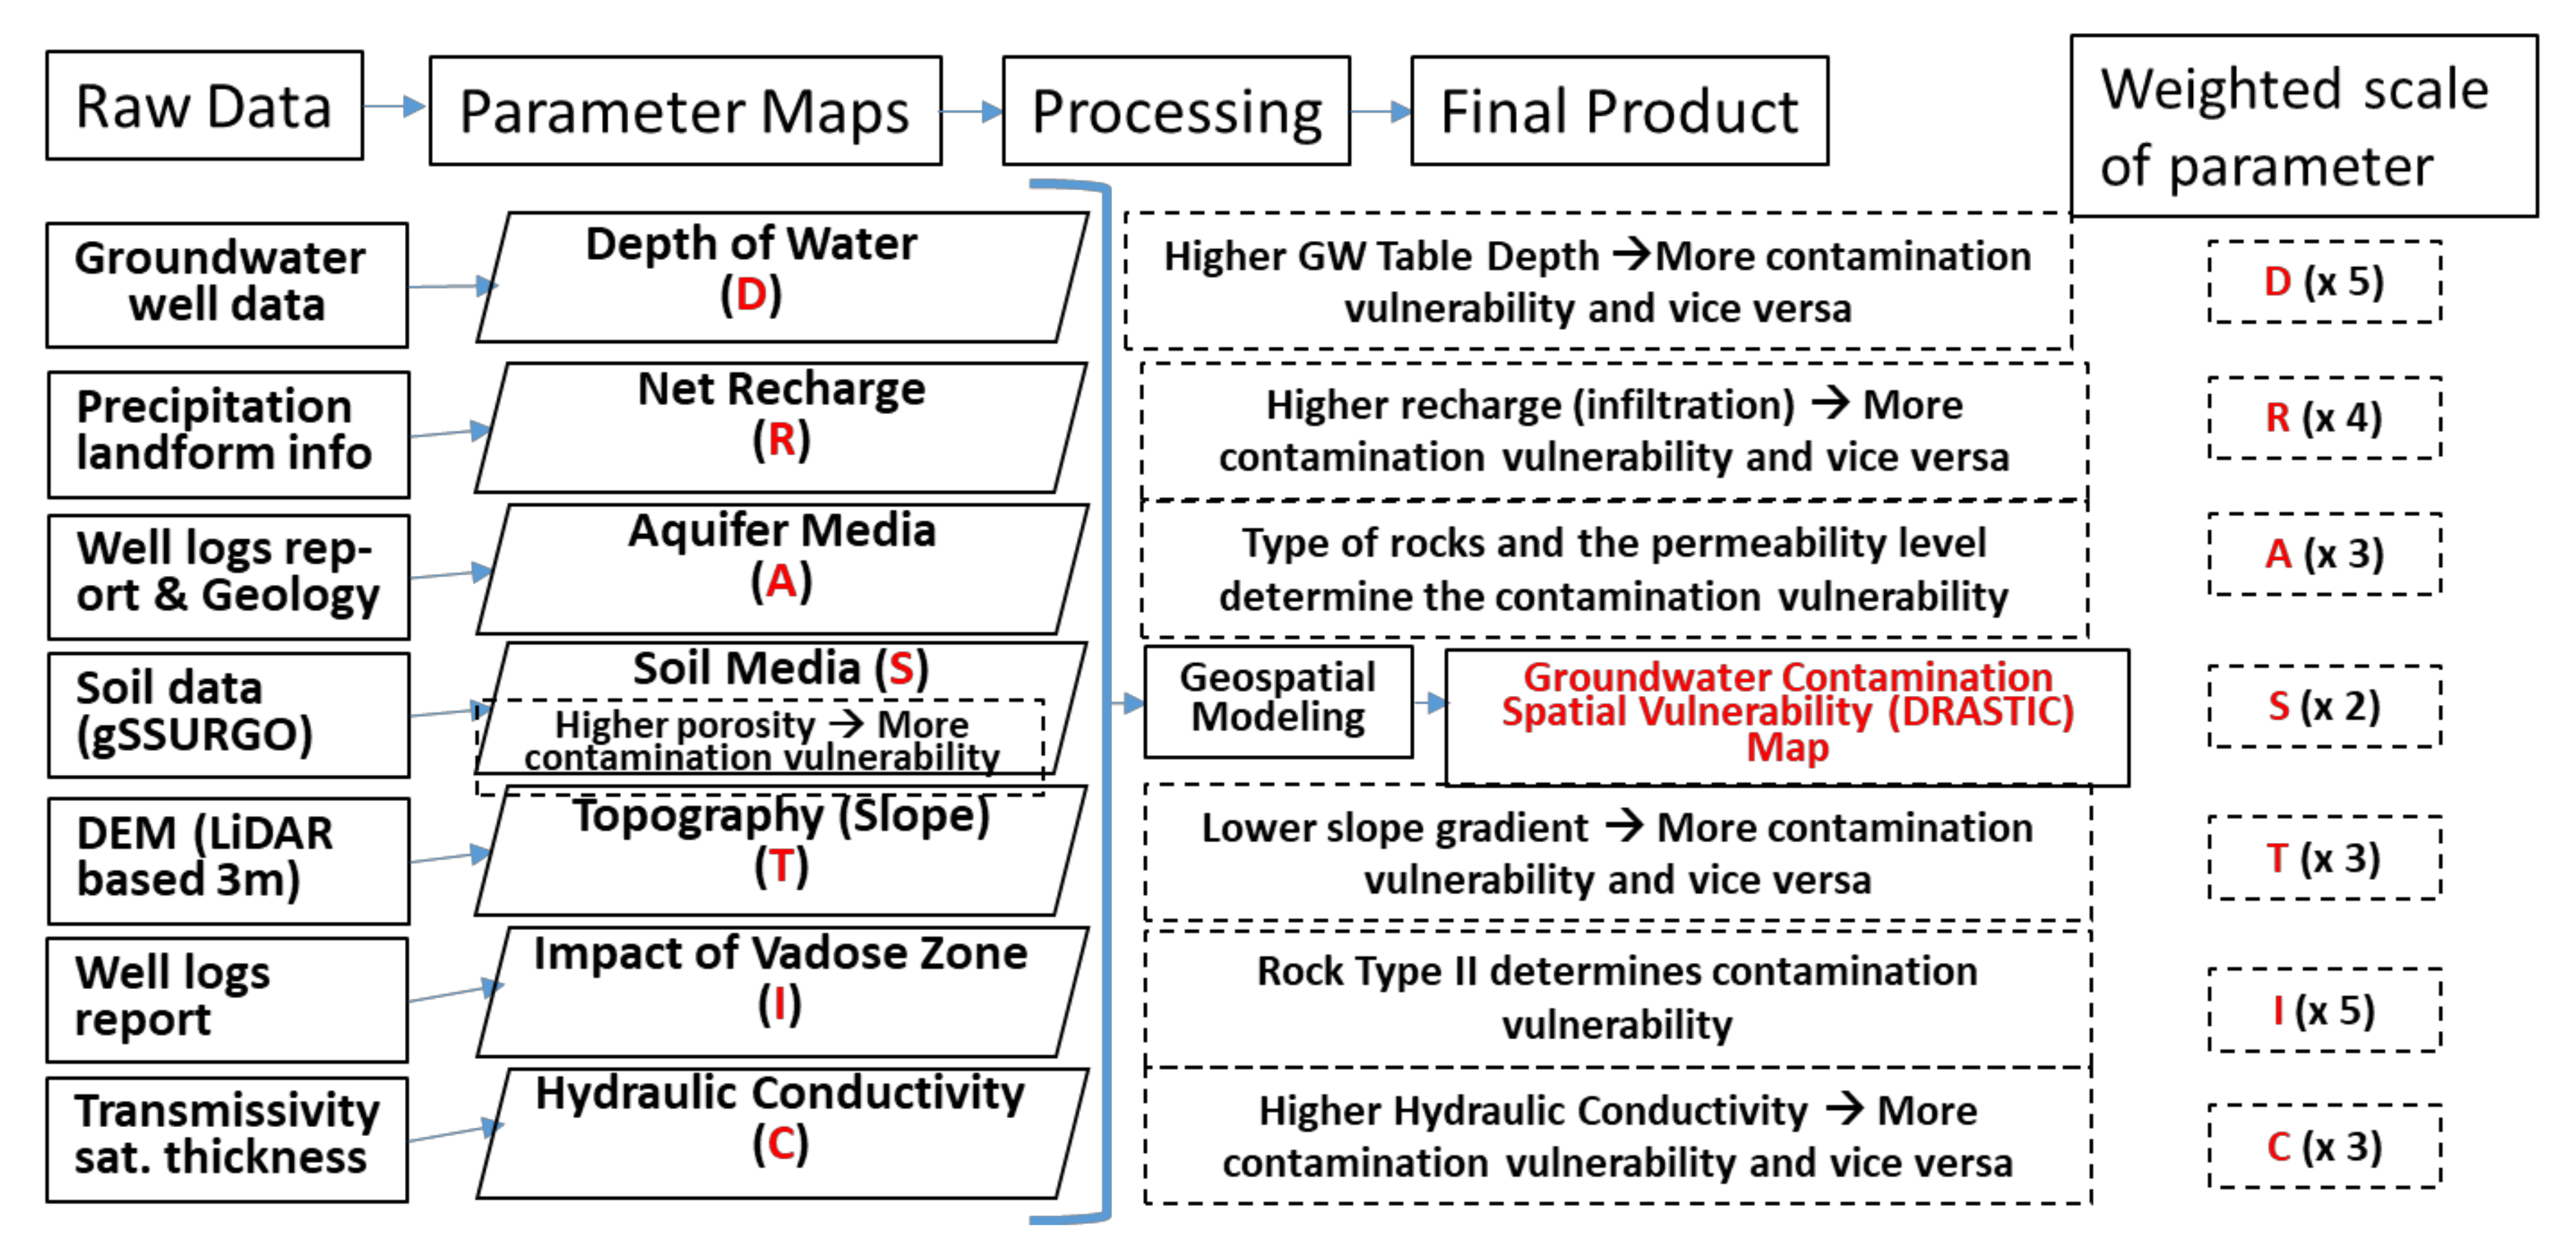
The state of the aquifer was represented using hydrogeologic factors that influence pollution potential. The hydrogeologic factors include depth to water (D), net recharge (R), aquifer media (A), soil media (S), topography (T), the impact of the Vadose zone (I), and hydraulic conductivity (C). These factors were later used in the DRASTIC model. The DRASTIC model, a fully automated geospatial model in ArcGIS Model Builder using associated spatial parameters, developed by Dr. Panda [37,38], was used to evaluate the relative vulnerability of areas to groundwater contamination by focusing on hydrogeologic factors that influence pollution potential by soil subsidence study, using a temporal digital elevation model (DEM)-based ground elevation change analysis. Optimization of weights and ratings of DRASTIC model parameters are discussed in [15].
Additionally, contrast analysis of historical United States Geological Survey (USGS) topographic maps supported the developed digital elevation model (DEM), and present-day LiDAR-based DEM suggests an average 0.1–1 m soil subsidence in the study area. Figure 4 below explains the DRASTIC model development processes. The automated groundwater contamination susceptibility determination geospatial model is provided in [39].
Impacts: Groundwater depletion causes soil subsidence and, consequently, sinkhole formation. Excessive groundwater pumping causes compaction of soils in the aquifer systems that can accompany one of the largest causes of subsidence [40,41]. When large amounts of water are pumped in some systems, the subsoil compacts, thus reducing in size and number the open pore spaces in the soil that previously held water; this can result in a permanent reduction in the total storage capacity of the aquifer system [40,41].
As the underground aquifer level of depletion increases, there is less water for dilution of pollutants seeping through the soils, and hence the contamination vulnerability increases. Groundwater is very susceptible to contamination from pollutants from storage tanks, septic tanks, uncontrolled hazardous wastes, agricultural fertilizer and pesticides, landfills, chemicals, and road salts, and atmospheric contaminants [35].
The model determines the groundwater contamination spatial susceptibility (GWSS) in an 8-digit hydrologic unit catalog (HUC) of Georgia by focusing on hydrogeologic factors according to their pollution potential. The model also shows a procedure to determine soil-subsidence-affected spatial locations. This project’s goal was not to pinpoint contamination sources but to analyze characteristics that affect groundwater contamination and show groundwater depletion vagaries. Another study output in the form of a probability sinkhole vulnerability map was useful in locating locations that were most critical in the study area.
Response: This vulnerability analysis and the maps obtained will be useful for the following:
- (1)
- The automated models developed through the case study have the simple ability to be replicated by other scientists/researchers in any other watersheds of the world.
- (2)
- The final product of the DRASTIC model is a geospatial map showing the groundwater contamination vulnerability with a scale of very low to very high. Thus, watershed managers would obtain management decision support for constructing any superfund site, locating any waste management project, demarcating locations for industrial waste deposition, and above all prohibiting excessive groundwater withdrawal and many more groundwater-usage-related decisions.
- (3)
- The soil subsidence analysis process, developed through the developed automated geospatial model that uses historical USGS topographic maps, supported by the developed digital elevation model (DEM) and present-day light detection and ranging (LiDAR)-based DEM, would help watershed managers to dissuade stakeholders from drawing more groundwater for domestic and agricultural usages and persuading/encourage them to help conserve water through the construction of water harvesting structures and replenishing groundwater to the depleting aquifer. Thus, probably the process of soil subsidence would subside.
- (4)
- Above all, the study would provide quality decision support for environmental managers, land-use planners, and other stakeholders.
Stage 3: Causal chains/loops were developed between the drivers, such as soil subsidence, groundwater depletion through excessive withdrawal, and less or no recharge. A link between the soil subsidence and groundwater depletion in North and South Georgia was established. The study results were validated with the highway structures and the groundwater depletion data for USGS groundwater monitoring well locations.
Stage 4: Identify knowledge gaps, articulate steps. Automated geospatial technology-supported environmental management decision support models require advanced geospatial skill. These models can easily combine various contributing parameters at a defined weighted scale and provide final spatial vulnerability/susceptibility/probability maps. However, the models developed through the case studies can easily be replicated with a little knowledge in geospatial technology. The study did not include any validation with aquifer contamination field data.
3.4. Case Study 4: Floridian Aquifer in Northwest Florida, US
Stage 1: The target systems were the surficial aquifer system of the Floridian aquifer in Northwest Florida, US [42]. The study area is predominantly urban-sprawl- and agriculture-dominated. The region’s aquifer is often covered by limestone or dolomite carbonate rock, made up of minerals that can dissolve in water under the right conditions. Anthropogenic changes are leading to an increased risk of sinkholes in susceptible areas. The formation of these geologic features is hastened by the improper management of groundwater, the increase in watershed pollution and runoff, and the mismanagement of underground fresh and wastewater pipes and structures. The automated geospatial model developed determines a potentially high risk for sinkholes in the study area.
Stage 2: Components of the DPSIR framework identified. Drivers of sinkhole formation and groundwater contamination problem enhancement: increasing urbanization and agricultural density enhancement escalates excess groundwater usage in the study area. During record cold, farmers used a considerable amount of water to save the orange and other fruit crops from frosting. At any one time in the Floridian aquifer spatial area, farmers use 1 billion gallons of water daily, causing many sinkholes [43]. Subsidence is caused by the depletion of groundwater and saltwater intrusion into the aquifer [44]. Groundwater contamination is another big issue in the studied aquifer area due to excessive use of fertilizers, pesticides, insecticides, and urban waste mismanagement.
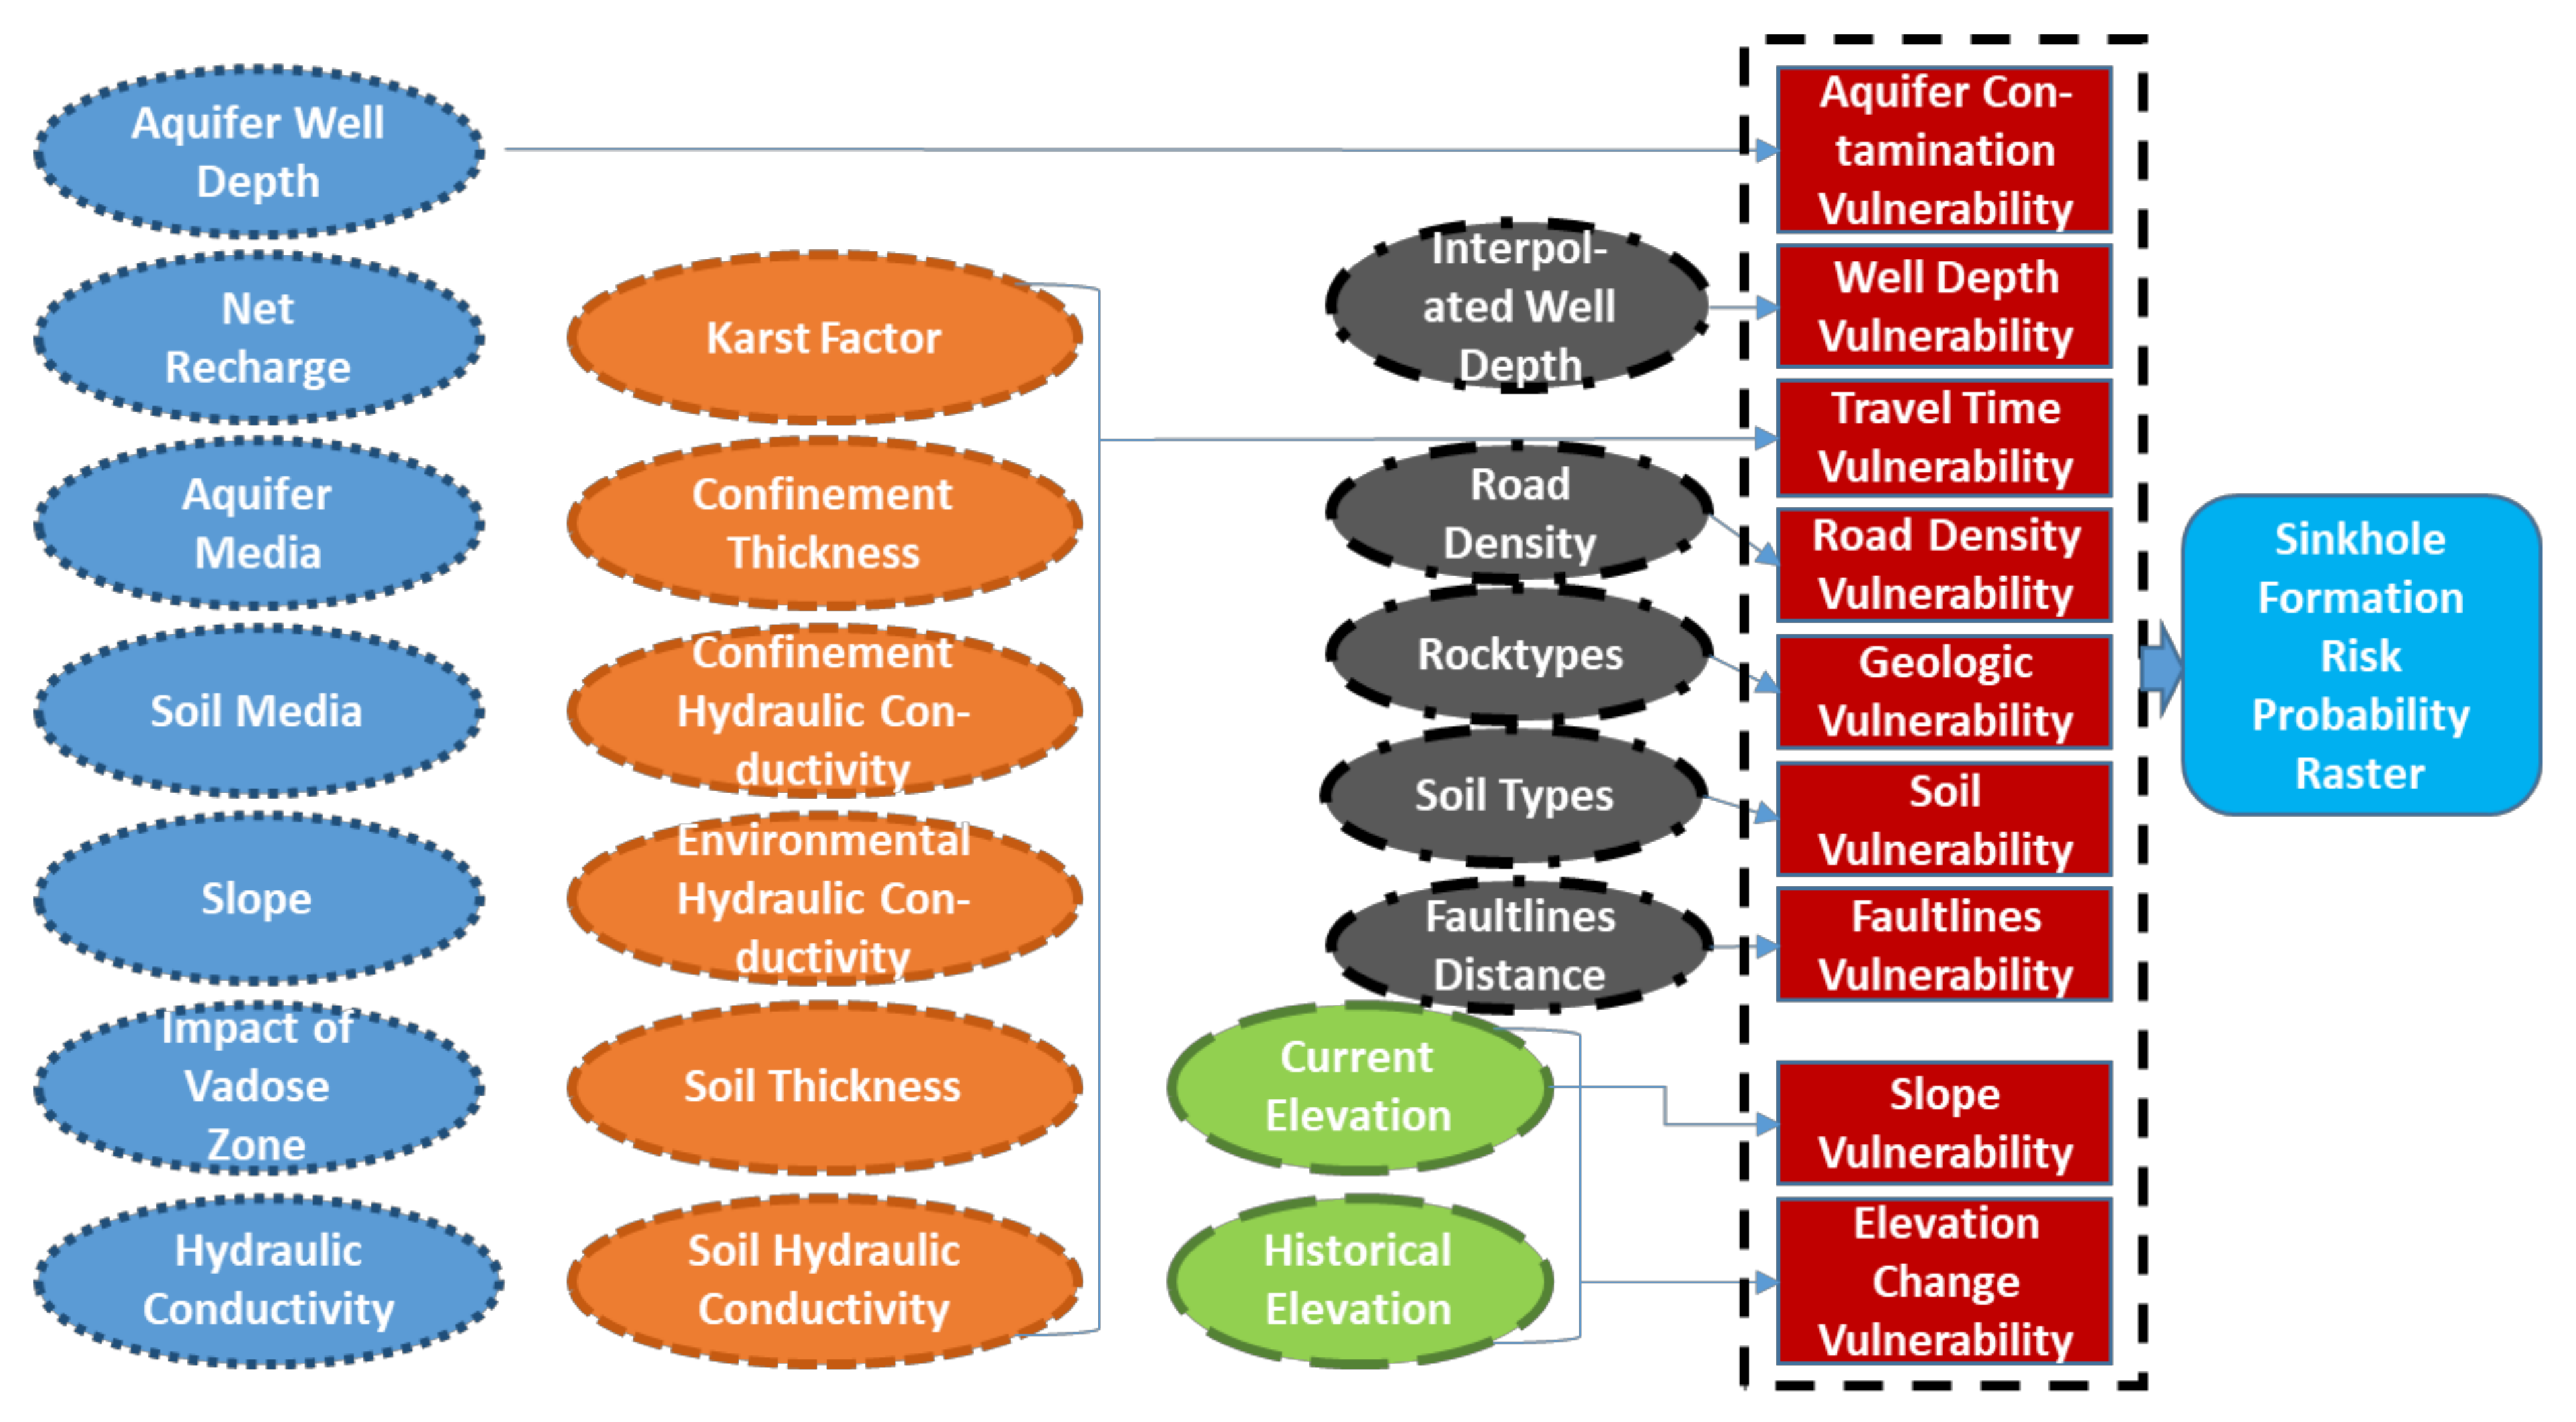
The aquifer’s state was represented using hydrogeologic factors that influence pollution potential and determine sinkhole formation vulnerability. Eleven types of geospatial data were collected, processed, and analyzed in ArcGIS Pro Model Builder to calculate sinkhole vulnerability in the study area. The eleven data types were geology, soil, land use, aquifer, groundwater measurements, road, fault line, elevation precipitation, and evapotranspiration. From this data, ten sinkhole vulnerability layers were produced: (1) subsidence or surface change, (2) average aquifer well depth, (3) groundwater vulnerability (DRASTIC), (4) road density, (5) groundwater travel time, (6) aquifer media (Suwannee Limestone), (7) geology type, (8) slope, (9) land use, and (10) distance from fault lines. Each layer was reclassified and reassigned a value from 1 to 10 according to its sinkhole vulnerability. The weighted layers were analyzed interpretively using ArcGIS Pro’s weighted sum tool producing a sinkhole risk probability raster. The sampling tool was used for accuracy assessment by comparing the obtained result with historical sinkhole data. This method showed 77% accuracy between known sinkholes and those shown on the sinkhole’s probability raster. This study is useful to environmental planners/managers and other stakeholders for decision support. Figure 5 shows the modeling flow chart that explains the formation of the sinkhole of vulnerability in the study area. The automated sinkhole formation vulnerability geospatial model is provided in Panda et al. [45].
Response: This vulnerability analysis and the maps obtained will be useful for the following:
- (1)
- Similar to the previous case study, from this study, the automated models developed through the case study have the simple ability to be replicated by other scientists/researchers in any other watersheds of the world.
- (2)
- The sinkhole probability spatial map could help decision makers guide stakeholders in the mitigation of sinkhole-forming bad management practices.
- (3)
- As it is already observed that groundwater fluctuation is a significant component of sinkhole formation, groundwater managers need to provide prudent decision support towards decreasing their probability of formation.
- (4)
- Above all, the study would provide quality decision support for environmental managers, land-use planners, and other stakeholders.
Stage 3: Causal chains/loops were developed between the driver, such as sinkhole formation probability, soil subsidence, and groundwater depletion through excessive withdrawal and less or no water recharge. A link between the soil subsidence, groundwater depletion, aquifer geology, saltwater intrusion, and sinkhole formation in the southeast US was developed. The study results were validated with the historical sinkhole spatial location data obtained from USGS.
Stage 4: Identify knowledge gaps, articulate steps. Automated geospatial technology-supported environmental management decision support models are not at a layman’s comfort level. Advanced geospatial skill is essential to develop such models. These models can easily combine various other contributing parameters at a defined weighted scale and provide final spatial vulnerability/susceptibility/probability maps. However, the models developed through the case studies can easily be replicated with a little knowledge in geospatial technology. The study did not include any validation with aquifer contamination field data.
4. Summary and Conclusions
Because of the ever-increasing demands for water for agriculture, industry, and drinking, stress on groundwater is in upswing, especially in the form of serious depletion and contamination. Groundwater depletion in the US and India, as well as the entire world, may create a serious impact on agricultural production in the next few decades. Over-exploitation of groundwater resources is the most vital human-induced process that enhances seawater intrusion in the coastal region. Other serious consequences of groundwater depletion is soil subsidence and sinkhole formation at an alarming rate. Contaminated groundwater is a major drawback in agricultural production, as it creates human health risk and causes human death. Therefore, the objective of this manuscript is to present the developed four-stage framework. The framework of a tool for sustainable groundwater management was developed during the IUSSTF workshop, as well as to demonstrate its application, using four case studies representing a coastal aquifer (India), and the high plains of the Floridian, Piedmont and Blueridge aquifers (United States of America). The four-stage tool (1) represents the target system, (2) describes the target system quantitatively as well as qualitatively in terms of various DPSIR components, (3) develops the causal chains/loops among the components, and (4) identifies the knowledge gaps, as well as articulates the next steps. Four case studies from the workshop are presented to demonstrate the developed four-stage framework. Three of the case studies were related to groundwater depletion and its replenishment strategy development. The fourth case study provided automated geospatial models determining groundwater contamination susceptibility and sinkhole formation vulnerability due to its depletion. The tool’s adaptability is demonstrated through its application to various case studies ranging from a coastal aquifer in India to the high plains in Midwest US and the Floridian, Piedmont, and Blueridge aquifers in the southeastern United States; thus, it would help in the strategic sustainable management of groundwater in various regions around the world.
The recommendations from the workshop were: (1) with the vulnerability analysis models, groundwater quantity and quality managers would be able to undertake measures on a spatial basis so that its depletion may not create problems with property damages and human health implications; (2) treat the low-quality groundwater and explore opportunities to use it; (3) adopt all possible methods of groundwater recharge and mitigate pollutants getting into aquifer; (4) reduce the over-draft of groundwater and utilize surface and rain water more; and (5) renovate and install different recharge structures to help in ground water recharge in the coastal areas. In general, all these four case studies suggested remedials in the form of changing land uses, creating water harvesting structures, providing resources to stakeholders for precision agriculture, and suggesting cropping design for arid and semi-arid conditions and thus decreasing agricultural water consumption, etc.
This study provides a framework for future researchers to study the groundwater table related to the effectiveness of planning and implementation of water recharging structures. In India, this can be studied with actual records, as water harvesting structures (WHSs) have been constructed throughout the country quickly to recharge the runoff water since the late 1980s, as both government- and non-government-sponsored projects. In South India, Western Odisha, and Central India, the quantitative analyses can be performed using temporal records of ground water tables before the WHSs are created and after they become fully operational. In the United States, such WHSs are not being constructed much, but rechargeable pond construction has become the norm for any new urban structure development. Groundwater depth enhancement should be studied in those urban areas in the US.
Additionally, development of the framework with quantitative values will differ for future research. Establishing a center for excellence as well as developing a network project will also differ for future work. Finally, the future study recommendations are to collect more data on groundwater quality and recharge, as well as enhance outreach activities on improving groundwater recharge and reducing aquifer pollution.
Author Contributions
Conceptualization, methodology, writing—original draft preparation, A.A.; validation and writing—review and editing, all listed co-authors; formal analysis, authors in individual case studies; funding acquisition, D.K. and A.A. All authors have read and agreed to the published version of the manuscript.
Funding
This article is based upon work partially supported by IUSSTF, National Science Foundation Grant no. 1735235 awarded as part of the National Science Foundation Research Traineeship, USDA-NIFA capacity building grants 2017–38821–26405 and 2022-38821-37522, USDA-NIFA Evans-Allen Project, Grant 11979180/2016–01711, and USDA-NIFA grant no. 2018–68002–27920. Additionally, the support from the participants and panelists attending the workshop is acknowledged.
Institutional Review Board Statement
Not applicable.
Informed Consent Statement
Not applicable.
Data Availability Statement
The authors confirm that the data supporting the findings of this study are available within the article.
Conflicts of Interest
The authors declare no conflict of interest. The funders had no role in the design of the study; in the collection, analyses, or interpretation of data; in the writing of the manuscript, or in the decision to publish the results.
References
- Hu, B.; Teng, Y.; Zhang, Y.; Zhu, C. The projected hydrologic cycle under the scenario of 936 ppm CO2 in 2100. Hydrogeol. J. 2019, 27, 31–53. [Google Scholar] [CrossRef]
- Schreiner-McGraw, A.P.; Ajami, H.; Vivoni, E.R. Extreme weather events and transmission losses in arid streams. Environ. Res. Lett. 2019, 14, 084002. [Google Scholar] [CrossRef]
- Turner, S.W.; Hejazi, M.; Yonkofski, C.; Kim, S.H.; Kyle, P. Influence of groundwater extraction costs and resource depletion limits on simulated global nonrenewable water withdrawals over the twenty-first century. Earth’s Future 2019, 7, 123–135. [Google Scholar] [CrossRef] [Green Version]
- Keairns, D.; Darton, R.; Irabien, A. The energy-water-food nexus. Annu. Rev. Chem. Biomol. Eng. 2016, 7, 239–262. [Google Scholar] [CrossRef] [PubMed]
- Mannan, M.; Al-Ansari, T.; Mackey, H.R.; Al-Ghamdi, S.G. Quantifying the energy, water and food nexus: A review of the latest developments based on life-cycle assessment. J. Clean. Prod. 2018, 193, 300–314. [Google Scholar] [CrossRef]
- Mitra, B.K.; Pham, N.-B.; Amanuma, N.; Yoshida, T. Chapter 5: Governing a Water-Energy-Food Nexus Approach: Creating Synergies and and Managing Trade-offs. In Governance for Integrated Solutions to Sustainable Development and Climate Change; IGES: Kanagawa, Japan, 2018; pp. 93–115. ISBN 9.78-4-88788-209-6. [Google Scholar]
- Carrard, N.; Foster, T.; Willetts, J. Groundwater as a source of drinking water in Southeast Asia and the Pacific: A multi-country review of current reliance and resource concerns. Water 2019, 11, 1605. [Google Scholar] [CrossRef] [Green Version]
- Endo, A.; Burnett, K.; Orencio, P.M.; Kumazawa, T.; Wada, C.A.; Ishii, A.; Tsurita, I.; Taniguchi, M. Methods of the water-energy-food nexus. Water 2015, 7, 5806–5830. [Google Scholar] [CrossRef] [Green Version]
- Zhang, C.; Chen, X.; Li, Y.; Ding, W.; Fu, G. Water-energy-food nexus: Concepts, questions and methodologies. J. Clean. Prod. 2018, 195, 625–639. [Google Scholar] [CrossRef]
- Scanlon, B.R.; Faunt, C.C.; Longuevergne, L.; Reedy, R.C.; Alley, W.M.; McGuire, V.L.; McMahon, P.B. Groundwater depletion and sustainability of irrigation in the US High Plains and Central Valley. Proc. Natl. Acad. Sci. USA 2012, 109, 9320–9325. [Google Scholar] [CrossRef] [PubMed] [Green Version]
- Famiglietti, J.S. The global groundwater crisis. Nat. Clim. Chang. 2014, 4, 945–948. [Google Scholar] [CrossRef]
- Mirnezami, S.J.; de Boer, C.; Bagheri, A. Groundwater governance and implementing the conservation policy: The case study of Rafsanjan Plain in Iran. Environ. Dev. Sustain. 2020, 22, 8183–8210. [Google Scholar] [CrossRef]
- White, E.; Costelloe, J.; Peterson, T.; Western, A.; Carrara, E. Do groundwater management plans work? Modelling the effectiveness of groundwater management scenarios. Hydrogeol. J. 2019, 27, 2447–2470. [Google Scholar] [CrossRef]
- Augino, L. Groundwater Management in the Raymond Basin: A Study of the Efficacy and Sustainability of Management Tools from 1984 to 2019; California State Polytechnic University, Pomona: Claremont, CA, USA, 2022; Available online: https://scholarworks.calstate.edu/downloads/cj82kd52r (accessed on 21 October 2022).
- Sharma, R.; Kumar, P.; Bhaumik, S.; Thakur, P. Optimization of weights and ratings of DRASTIC model parameters by using multi-criteria decision analysis techniques. Arab. J. Geosci. 2022, 15, 1–16. [Google Scholar] [CrossRef]
- Bonì, R.; Teatini, P.; Zoccarato, C.; Guardiola-Albert, C.; Ezquerro, P.; Bru, G.; Tomás, R.; Valdes-Abellan, J.; Pla, C.; Navarro-Hernández, M.I. Stakeholders’ Perspective on Groundwater Management in Four Water-Stressed Mediterranean Areas: Priorities and Challenges. Land 2022, 11, 738. [Google Scholar] [CrossRef]
- Muthusankar, G.; Proisy, C.; Balasubramanian, D.; Bautès, N.; Bhalla, R.S.; Mathevet, R.S.; Ricout, A.; Senthil Babu, D.; Vasudevan, S. When socio-econmic plans exacerbate vulnerability to physical coastal processes on the south east coast of India. Coastal Education and Research Foundation. J. Coast. Res. 2018, 85, 1446–1450. [Google Scholar] [CrossRef]
- Muthusankar, G. Multi Hazard Risk Assessment and Management Strategies for Nagapattinam Coastal Zone, Tamil Nadu. Ph.D. Thesis, Bharathidasan University, Tamil Nadu, India, 2011; 147p. [Google Scholar]
- Chachadi, A.; Lobo-Ferreira, J. Seawater Intrusion Vulnerability Mapping of Aquifers Using GALDIT Method. COASTIN: A Coastal Policy Research News-Letter; TERI: New Delhi, India, 2001; Available online: http://www.teriin.org/teri-wr/coastin/newslett/coastin4.pdf (accessed on 2 September 2022).
- Chachadi, A.; Lobo-Ferreira, J. Assessing aquifer vulnerability to sea-water intrusion using GALDIT method: Part 2—GALDIT indicator descriptions. In IAHS and LNEC, Proceedings of the Fourth Inter Celtic Colloquium on Hydrology and Management of Water Resources, Guimarães, Portugal, 11–13 July 2005; Universidade do Minho: Guimarães, Portugal, 2005. [Google Scholar]
- Lobo-Ferreira, J.P.; Chachadi, A.; Diamantino, C.; Henriques, M. Assessing Aquifer Vulnerability to Seawater Intrusion Using GALDIT Method. Part 1: Application to the Portuguese Aquifer of Monte Gordo. 2005. Available online: http://irgu.unigoa.ac.in/drs/handle/unigoa/1733 (accessed on 2 September 2022).
- Chachadi, A.; Lobo-Ferreira, J. Seawater intrusion vulnerability mapping of aquifers using GALDIT method. In Proc. Workshop Modeling in Hydrogeology; Anna University: Chennai, India, 2001; pp. 143–156. [Google Scholar]
- Chachadi, A.; Lobo-Ferreira, J. Assessing Aquifer Vulnerability to Seawater Intrusio Using GALDIT Method: Part 2, GALDIT Indicators Description. 2007, pp. 172–180. Available online: https://www.aprh.pt/celtico/PAPERS/26.PDF (accessed on 2 September 2022).
- Ewing, J.E.; Jones, T.L.; Yan, T.; Vreugdenhil, A.M.; Fryar, D.G.; Pickens, J.F.; Gordon, K.; Nicot, J.; Scanlon, B.R.; Ashworth, J.B.; et al. Groundwater Availability Model for the Dockum Aquifer; Texas Water Development Board: Austin, TX, USA, 2008. [Google Scholar]
- Ashworth, J.B.; Hopkins, J. Aquifers of Texas; Report No. 345; Texas Water Development Board: Austin, TX, USA, 1995. [Google Scholar]
- Bradley, R.G.; Kalaswad, S. The Groundwater Resources of the Dockum Aquifer in Texas; Report No. 359; Texas Water Development Board: Austin, TX, USA, 2003. [Google Scholar]
- Nativ, R. Hydrogeology and Hydrochemistry of the Ogallala Aquifer, Southern High Plains, Texas Panhandle and Eastern New Mexico; Report of Investigations No. 177; The University of Texas at Austin, Bureau of Economic Geology: Austin, TX, USA, 1988. [Google Scholar]
- Larkin, T.J.; Bomar, G.W. Climatic Atlas of Texas; Report LP-192; Texas Department of Water Resources: Austin, TX, USA, 1983. [Google Scholar]
- Oregon State University. 2.5-Arc Minute 1971–2000 Mean annual Precipitation Grids for the Conterminous United States; Spatial Climate Analysis Service, Oregon State University: Corvallis, OR, USA, 2002. [Google Scholar]
- Texas Water Development Board. Evaporation/Precipitation Data for Texas; Texas Water Development Board: Austin, TX, USA, 2008. [Google Scholar]
- Ale, S.; Omani, N.; Himanshu, S.K.; Bordovsky, J.P.; Thorp, K.R.; Barnes, E.M. Determining optimum irrigation termination periods for cotton production in the Texas High Plains. Trans. ASABE 2020, 63, 105–115. [Google Scholar] [CrossRef]
- USDA National Agricultural Statistics Service (NASS). 2017 Census of Agriculture. 2019. Available online: www.nass.usda.gov/AgCensus (accessed on 2 September 2022).
- McGowen, J.H.; Granata, G.E.; Seni, S.J. Depositional Systems, Uranium Occurrence and Postulated Groundwater History of the Triassic Dockum Group, Texas Panhandle-Eastern New Mexico; Contract Report Prepared for the United States Geological Survey; The University of Texas at Austin, Bureau of Economic Geology: Austin, TX, USA, 1977. [Google Scholar]
- Freese and Nichols. Regional Water Plan for the Panhandle Water Planning Area: Prepared for the Panhandle Regional Planning Commission; Freese and Nichols: Fort Worth, TX, USA, 2006. [Google Scholar]
- Chapman, M.J.; Cravotta, C.A.; Szabo, Z.; Lindsey, B.D. Naturally Occurring Contaminants in the Piedmont and Blue Ridge Cystalline-Rock Aquifers and Piedmont Early Mesozoic Basin Siliciclastic-Rock Aquifers, Eastern United States, 1994–2008; US Department of the Interior: Washington, DC, USA; US Geological Survey Reston: Reston, VA, USA, 2013. [Google Scholar]
- Leake, S.A. Land Subsidence from Ground-Water Pumping. 2021. Available online: https://geochange.er.usgs.gov/sw/changes/anthropogenic/subside/ (accessed on 2 September 2022).
- Moore, L.; Panda, S.S. Lake Tahoe Aquifer Contamination Susceptibility Analysis through Fully-Automated DRASTIC Groundwater Assessment Model Development. In Proceedings of the 17th Annual Meeting of the American Ecological Engineering Society, Athens, GA, USA, 23–25 May 2017. [Google Scholar]
- Panda, S.S.; Palmer, M.; Ouyang, Y.; Grace, J. Automated DRASTIC Groundwater Assessment Model Development for Contamination Susceptibility Determination. AGU Fall Meeting Abstracts. 2019, p. H51K-1629. Available online: https://ui.adsabs.harvard.edu/abs/2019AGUFM.H51K1629P/abstract (accessed on 21 October 2022).
- Reeves, Z.; Panda, S.S.; Ouyang, Y.; Grace, J.M.; Amatya, D.M. Groundwater & Surface Water Contamination Susceptibility Determination through Automated Geospatial Models using Combined Modeling Approach of DRASTIC and RUSLE. In Proceedings of the Seventh Interagency Conference on Research in the Watersheds (ICRW), Tifton, GA, USA, 16–19 November 2020. [Google Scholar]
- Kindinger, J.G.; Flocks, J.G. Geologic Controls on the Formation of Florida Sinkhole Lakes; 2331-1258; US Department of the Interior, US Geological Survey: Washington, DC, USA, 2000; Available online: https://pubs.usgs.gov/of/2000/0294/report.pdf (accessed on 21 October 2022).
- Galloway, D.L.; Jones, D.R.; Ingebritsen, S.E. Land Subsidence in the United States; US Geological Survey: Washington, DC, USA, 1999; Volume 1182, Available online: https://pubs.usgs.gov/circ/circ1182/ (accessed on 21 October 2022).
- Miller, J.A. Hydrogeologic Framework of the Floridan Aquifer System in Florida and Parts of Georgia, Alabama, and South Carolina; Department of the Interior, US Geological Survey: Washington, DC, USA, 1986; Volume 1, Available online: https://books.google.com/books?hl=en&lr=&id=jjBUbgQjJp0C&oi=fnd&pg=PR6&dq=Hydrogeologic+Framework+of+the+Floridan+Aquifer+System+in+Florida+and+Parts+of+Georgia,+Alabama,+and+South+Carolina%3B&ots=0f3cguFdeH&sig=WrW9k5B9fZ9WRLBK0VOeIADFaM8#v=onepage&q=Hydrogeologic%20Framework%20of%20the%20Floridan%20Aquifer%20System%20in%20Florida%20and%20Parts%20of%20Georgia%2C%20Alabama%2C%20and%20South%20Carolina%3B&f=false (accessed on 21 October 2022).
- Jsq. Sinkholes in Florida, and in Lowndes County, Georgia. 2013. Available online: https://www.l-a-k-e.org/blog/2013/03/sinkholes-in-florida-and-in-lowndes-county-georgia.html (accessed on 14 October 2022).
- Kindinger, J.L.; Davis, J.B.; Flocks, J.G. Subsurface Characterization of Selected Water Bodies in the St. Johns River Water Management District, Northeast Florida. 2000. Available online: https://digitalcommons.usf.edu/cgi/viewcontent.cgi?article=1100&context=kip_talks#page=132 (accessed on 6 October 2022).
- Panda, S.S.; Robertson, J.; Pilgrim, Z.; Ouyang, Y.; Grace, J.M.; Amatya, D.M. Geospatial Modeling Approach to Determine Potential Sinkholes Risk Probability and Soil Subsidence Analysis. In Proceedings of the Seventh Interagency Conference on Research in the Watersheds (ICRW), Tifton, GA, USA, 16–19 November 2020. [Google Scholar]
Figure 1.
(a) Overview of the sustainable groundwater development tool. (b) Brief description of the four stages. WSA in the figure refers to water supply aquifers.
Figure 1.
(a) Overview of the sustainable groundwater development tool. (b) Brief description of the four stages. WSA in the figure refers to water supply aquifers.

Figure 2.
Causal chain/loops developed in framework application for the coastal aquifer, India.

Figure 3.
Causal chains and loops in case study 2.0.

Figure 4.
Explanation of each parameter of DRASTIC and its contamination vulnerability scale. Last column explains the DRASTIC model spatial parameter weighted scale. Note: Each parameter is also scaled with a scale of 1–10 (lowest–highest vulnerability) before being combined as the weighted scale. Optimization of weights and ratings of the model parameters are explained in [21].

Figure 5.
Geospatial modeling framework for determining sinkhole formation vulnerability.

Publisher’s Note: MDPI stays neutral with regard to jurisdictional claims in published maps and institutional affiliations. |
© 2022 by the authors. Licensee MDPI, Basel, Switzerland. This article is an open access article distributed under the terms and conditions of the Creative Commons Attribution (CC BY) license (https://creativecommons.org/licenses/by/4.0/).
Share and Cite
MDPI and ACS Style
Anandhi, A.; Karunanidhi, D.; Sankar, G.M.; Panda, S.; Kannan, N. A Framework for Sustainable Groundwater Management. Water 2022, 14, 3416. https://doi.org/10.3390/w14213416
AMA Style
Anandhi A, Karunanidhi D, Sankar GM, Panda S, Kannan N. A Framework for Sustainable Groundwater Management. Water. 2022; 14(21):3416. https://doi.org/10.3390/w14213416
Chicago/Turabian StyleAnandhi, Aavudai, D. Karunanidhi, G. Muthu Sankar, Sudhanshu Panda, and Narayanan Kannan. 2022. "A Framework for Sustainable Groundwater Management" Water 14, no. 21: 3416. https://doi.org/10.3390/w14213416
Note that from the first issue of 2016, this journal uses article numbers instead of page numbers. See further details here.