_Dionysiou.jpg)

Efficient Removal of Micropollutants by Novel Carbon Materials Using Nitrogen-Rich Bio-Based Metal-Organic Framework (MOFs) as Precursors
School of Materials, Advanced Research Institute of Multidisciplinary Science, Beijing Institute of Technology, Beijing 100081, China
*
Author to whom correspondence should be addressed.
Water 2022, 14(21), 3413; https://doi.org/10.3390/w14213413
Submission received: 29 September 2022
/
Revised: 20 October 2022
/
Accepted: 21 October 2022
/
Published: 27 October 2022
(This article belongs to the Special Issue Advanced Oxidation Processes for Emerging Contaminant Removal)
Abstract
:Eliminating pharmaceuticals with trace concentrations in water is crucial in water purification. Developing an effective adsorbent for removing micropollutants from water has aroused great research interest. In this study, the feasibility of nitrogen-rich bio-based metal–organic framework (MOF)-derived carbon as an effective material to eliminate micropollutants from the water environment is discussed. A mixed ligand approach has been applied to synthesize IISERP-MOF27 successfully via the solvothermal method. Adenine, which is non-toxic, easily obtained, and cheap, was introduced into the structure. The novel heterogeneous porous carbon was produced by pyrolyzation with an extremely high surface area (SBET = 980.5 m2/g), which is 12.8 times higher than that of pristine MOFs. Studies show that the highest surface area and abundant mesoporous structures (Vpore = 0.496 cm3/g) can be obtained when the MOFs are pyrolyzed at 900 °C. The saturated adsorption amount for sulfamethylthiazole (SMX) over MOF-derived carbon can reach 350.90 mg/g with a fast initial adsorption rate of 315.29 (mg/g·min). By adding the second linker adenine as the precursor, the adsorption performance for SMX was made extremely better than that of traditional active carbon (AC) and pyrolyzed ZIF-8(ZIF-8-C), one of the most classic Zn-MOFs. The adsorption capacity calculated by the Langmuir model (R2 = 0.99) for SMX over bio-C-900 was 4.6 and 13.3 times more than those of AC and ZIF-8-C, respectively. The removal percentage of six representative pharmaceuticals can be well correlated to the structural parameter log Kow of each pharmaceutical, indicating the hydrophobic interaction should be one of the major mechanisms for the adsorption in water. This study offers a strategy to develop novel carbon materials to remove pharmaceuticals.
1. Introduction
In recent years, regular testing of micropollutants in tap water, river water, and municipal wastewater has received increasing attention [1]. This kind of pollutant includes antibiotics, anti-inflammatory medications, and a variety of chemicals [2]. They have adverse environmental impacts such as mutagenicity, carcinogenicity, aquatic toxicity, and other harmful effects on both humans and the ecosystem [3,4]. For instance, the frequently used antibiotic sulfamethoxazole (SMX) is difficult entirely eliminate in wastewater treatment plants (WWTPs), leading to the transformation of its metabolites and product residues into components of surface water [5]. It has been proven that prolonged exposure to such pollutants may have negative effects on individuals, such as liver failure and genetic damage [5,6]. Therefore, it is of great significance to remove PPCPs from aquatic ecosystems greenly and efficiently.
To remove these contaminants in water, several tertiary treatments have been used, such as photocatalytic degradation [7], the Fenton reaction [8], biodegradation [9], and membrane filtration [10]. Among these, adsorption technology, which is easy to operate and low-cost, has been considered a promising advanced water treatment process for eliminating micropollutants in wastewater. To date, a large number of adsorbents have been investigated to remove micropollutants, including porous carbon [11], cyclodextrin polymer [12], and zeolites [13]. The carbon-based ones among these adsorbents are considered major materials in the water treatment process because of their high water/thermal stability and surface areas [14]. However, according to previous studies, their removal efficiency of SMX still needs to be improved compared to traditional materials (including activated carbon). Normally, about 54.34 ± 2.35% of SMX can be removed by treatment at WWTPs, but SMX content ranging from 0.3 ng L−1 to 783 ng L−1 is still detected after removal [15].
In recent years, MOFs with high specific surface areas and high porosities have been considered promising precursors to constructing adsorbents in water [16]. MOFs derived from carbon have been employed for the adsorption of water pollutants [17]. For example, results show that heavy metals, herbicides, and organic dyes can be effectively removed by carbon materials derived from Fe-MOFs [14,18,19,20]. Due to the especially low boiling point of the Zn atom, derived porous carbon can be created after the evaporation of metal based on Zn-based MOFs, such as ZIF-8, MOF-5, etc. [21,22,23]. On the other hand, bio-MOFs such as IISERP-MOF27(bio-27) and IISERP-MOF26 [24] with biological linkers should be promising in constructing MOFs because of their non-toxic, easily available, and inexpensive properties [25]. However, to the best of our knowledge, Zn-MOFs with mixed linkers-derived carbon have not been reported yet.
In this study, for the first time, bio-27-derived carbon was synthesized for the removal of micropollutants from water. The major characterization shows that this bio-MOF-derived carbon has obvious heterogeneous pores ranging from 1 nm to 6 nm. The precursors were pyrolyzed at 500~1000 °C (bio-C-500~bio-C-1000). The adsorption capacities and initial adsorption rates were evaluated by analyzing the removal performance for SMX over different bio-MOFs. The kinetic data were fitted using the Elovich model. Langmuir and Freundlich’s models were applied to compare the capacities. The operational parameters were studied. To further evaluate the adsorption performance for pharmaceuticals with diverse structures, the adsorption behaviors for six pharmaceuticals—ketoprofen (KP), antipyrine (AT), ibuprofen (IBU), chloramphenicol (CAP), paracetamol (PC), and sulfamethoxazole (SMX)—were studied.
2. Experimental Section
2.1. Chemical Agents
Zn(NO3)2·6H2O (CAS, 10196-18-6), dimethylformamide (DMF, 99%), and methanol (MeOH, CAS, 67-56-1) were purchased from Sinopharm (Beijing, China). Adenine (CAS, 73-24-5) and terephthalic acid (CAS, 100-21-0) were purchased from Energy Chemical (Beijing, China) (>99%). Active carbon was purchased from Energy Chemical Co. Ltd. (CAS, 7440-44-0). Sulfamethoxazole and other chemicals were all obtained from Sigma–Aldrich with a purity of >99%. Water was obtained from a Milli-Q system with 18.2 MΩ·cm−1. The target compounds can be found in Table 1. Kow, which is the ratio of the concentration of molecules in the octanol phase to their concentration in the aqueous phase, is widely used to describe the hydrophobicity of drugs [26]. A drug’s greater hydrophobicity is indicated by a larger log Kow value [27].
2.2. Synthesis of Bio-27 and Its Derivatives Bio-C Materials
Bio-27 and its derivatives were synthesized via a solvothermal method [24]. Zn(NO3)2·6H2O (260.86 mg, 0.87 mmol), adenine (AD; 117.38 mg, 0.87 mmol), and terephthalic acid (H2BDC; 72.60 mg, 0.435 mmol) were mixed with 10.8 mL DMF, H2O, and MeOH (v/v/v = 1:1:0.6) and dispersed by ultrasonic processing for 30 min. Then, a white dispersion was obtained. The mixed solution was transferred to a 50 mL Teflon-lined autoclave and kept in an oven at 120 °C for 48 h. DMF and methanol were used to wash the sample before it was dried at 60 °C. A specific amount of bio-27 was evenly distributed in the center of the quartz boat and heated by 5 °C min−1 for 3 h in nitrogen after 6 h of vacuum activation at 120 °C. The materials obtained at the different temperatures of T (T = 500~1000 °C) are named bio-C-T. As the furnace chamber cooled to room temperature, bio-C-T compounds were generated. Some basic characterization was conducted to select a suitable material for further application in removing pharmaceuticals from water. The schematic diagram can be found in Figure 1.
2.3. Synthesis of ZIF-8 and Its Derivatized Carbon-Based Materials (ZIF-8-C)
ZIF-8 was synthesized based on the previous report [28]. Zn(NO3)2·6H2O (743.8 mg, 2.5 mmol) and dimethylimidazole (821.0 mg,10 mmol) were mixed with 50 mL MeOH and put into a 100 mL Shuniu bottle, where they were and continuously and evenly stirred for 24 h at room temperature. After standing for precipitation, the materials were separated and washed three times with fresh MeOH. Then, the materials were dried at 60 °C.
2.4. Characterization
The X-ray diffraction pattern was studied by a multipurpose, high-efficiency X-ray diffractometer (PXRD, Rigaku MiniFlEX600) (λ = 0.154 nm). The scan rate was 10°/min at room temperature. The adsorption–desorption curve was measured by an automatic specific surface and pore analyzer (Quanta chrome ASiQMVH002-5). Materials were activated in vacuum at 120 °C for 12 h. The Brunel–Emmett–Teller (BET) equation was used for measuring the specific surface area. The chemical state was obtained by X-ray photoelectron spectroscopy (XPS, PHI QUANTERA-II SXM, ULVAC-PHI, USA), and the X-ray source was Al-Ka (1486.6 eV, line width 0.68 eV). The zeta potential of bio-C was tested using a nanoparticle size and zeta potential analyzer (DLS, Malvern Zetasizer Nano ZS90, Worcestershire, UK).
2.5. Adsorption Experiment
The adsorption experiments for removing pharmaceuticals with two concentrations, 10 mg/L and 400 μg/L, were conducted separately. The solution was prepared with ultrapure water. Amounts equal to 4.5 mg of different adsorbents were added to a 50 mL glass vial containing 50 mL of a simulated solution of PPCPs at pH 7.0. All the batch adsorption experiments were performed on a multi-point stirrer at 500 rpm and 25 °C. At each time interval, the solution was sampled and then filtered with a PES filter. The adsorption experiments were conducted for 45 min. The pseudo-second-order kinetic model is shown in Equations (1) and (2), where Qt represents the adsorption amount at time t, and μg/g is the unit. Qe is the equilibrium adsorption amount, and μg/g is the unit. v0 represents the initial adsorption rate, and μg/(g·min) is the unit. k is the intraparticle diffusion rate constant.
2.6. Instrumental Analysis for Pharmaceuticals
Pharmaceuticals with concentrations of 10 mg/L were separated and detected using HPLC-UV with an Agilent 1260 system. The column was an Agilent SB-C18 column (2.7 μm, 4.6 mm × 150 mm). The mobile phase was water containing 0.1% formic acid and 1 mM ammonium acetate ((NH4)2AC) (60%), as well as MeOH (40%). The temperature in the column was 30 °C. The UV light’s detecting wavelength was 270 nm. Triple quadrupole mass spectrometry (Agilent 1290, 6465 QQQ, Santa Clara, CA, USA) and ultra-performance liquid chromatography were used to measure the drugs with trace concentrations. The column was an Eclipse Plua C18 RRHD (2.1 × 50 mm 1.8 μm). The mobile phases were water with 0.1% formic acid and 2 mM ammonium acetate (A) and acetonitrile (B). The flow rate was set at 0.2 mL/min. The dilute gradient was 0–2 min (10% B), 2–10 min (10~45% B), 10~13 min (45~90% B), 13~14 min (90% B), and 14.1 min (10% B). The injection volume was 20 µL. The flow rate was 0.2 mL/min. The peak areas of each pharmaceutical were quantitively analyzed by the Quant-My-Way software, developed by Agilent.
3. Results and Discussion
3.1. Characterizations of Bio-C-T
3.1.1. Structural and Porous Properties
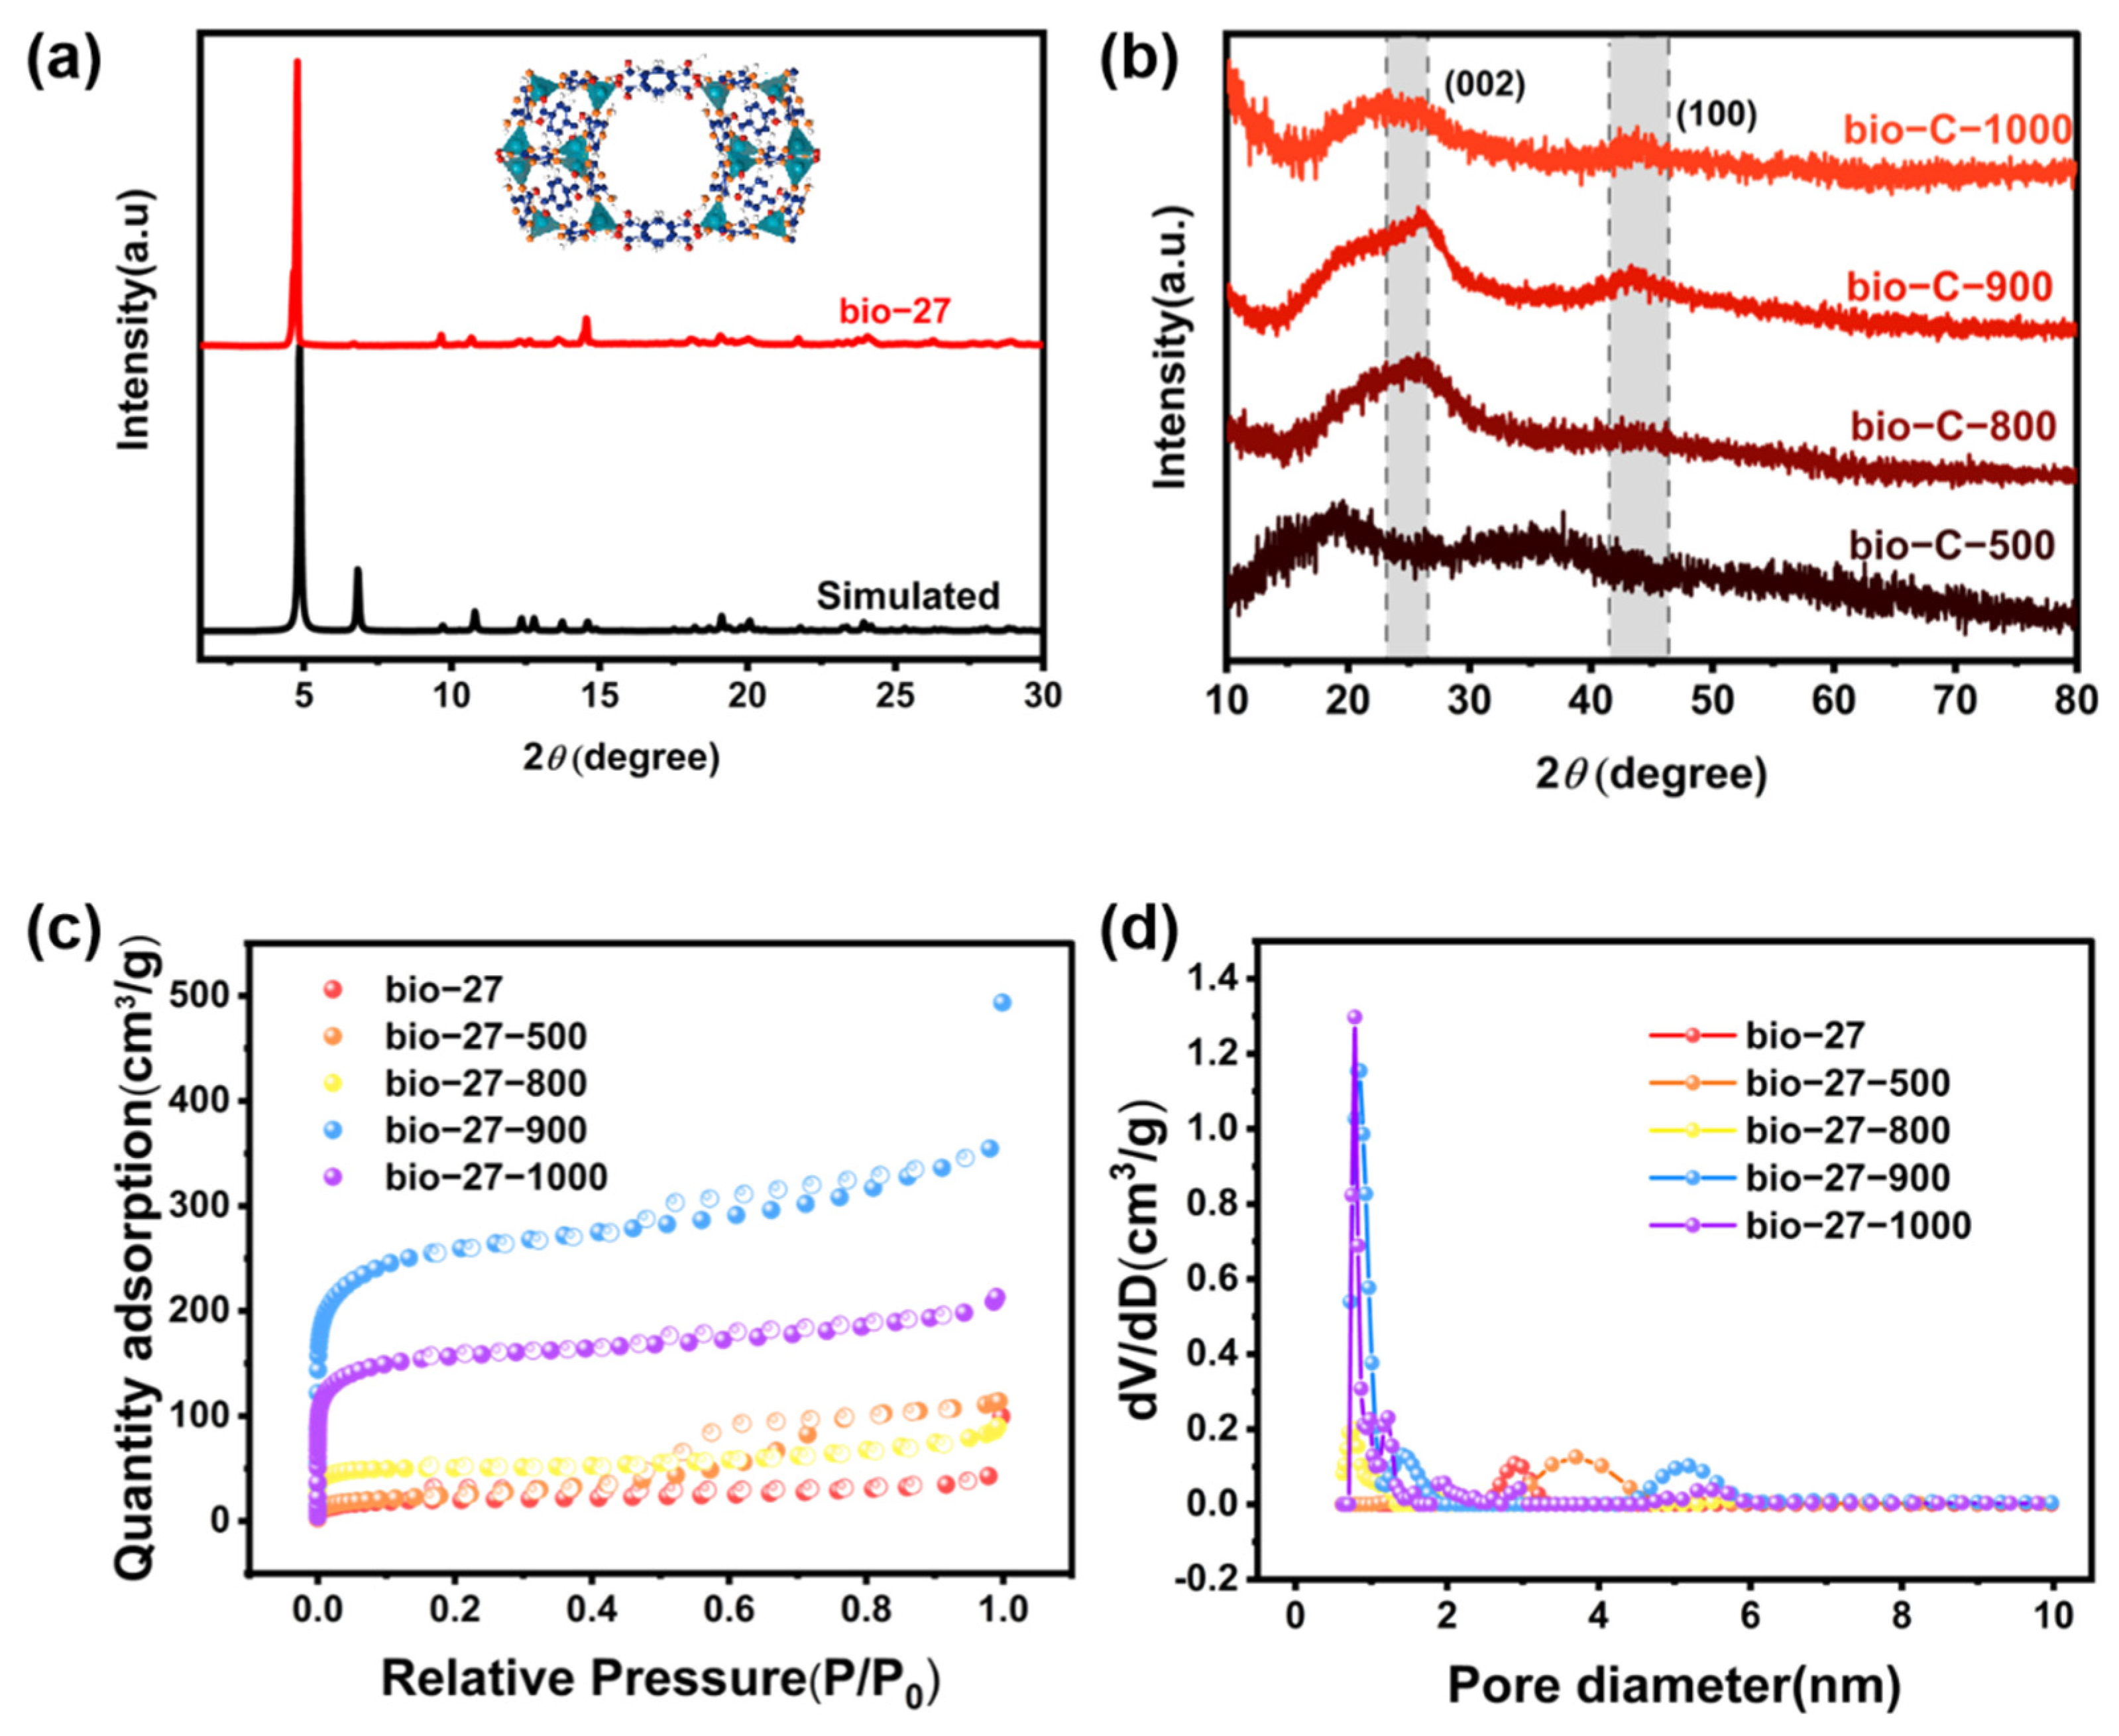
As shown in Figure 2a, the PXRD patterns of bio-27 were consistent with the simulation, with the main characteristic peaks at 5°, 9°, and 15° [24], indicating the metal–organic framework (MOF) called bio-27 was synthesized successfully. The PXRD pattern of bio-C-T can be found in Figure 2b, indicating that all the synthesized carbons are in an amorphous state. It is to be noted that bio-C-800, 900, and 1000 showed two broad peaks at 24° and 43°, corresponding to the diffraction peaks of the (002) crystal plane and (100) crystal plane, respectively [29]. The observed peaks move slightly to smaller angles with increased activation temperatures, indicating the distance of the interlayer could gradually increase. According to previous studies, this shift could be caused by defects during carbonization [30]. However, bio-C-500 may not be carbonized completely based on the positions of characteristic peaks in the PXRD spectrum. On the other hand, the colors of bio-C-800, bio-C-900, and bio-C-1000 are black, consistent with the color of carbon black. This could also confirm the completeness of the carbonization of the four materials. The nitrogen adsorption isotherm in Figure 2c reveals a mixture of type I and IV isotherms. Obviously, the adsorption curve of bio-C-900 has a hysteresis loop, indicating that the material has a hierarchical porous structure and a relatively more mesoporous structure.
In comparison, the hysteresis loops of bio-C-800 and bio-C-1000 are not obvious, and the adsorption curves are more in line with the type I adsorption isotherm. The surface area and pore volume show an upward trend with increased carbonization temperature. Still, the specific surface area of bio-C-1000 was lower than that of bio-C-900, which may be due to the partial collapse of the mesoporous structure at high temperature due to the complete evaporation of Zn atoms (Table 2).
The pore size distribution curve calculated in the microporous region (Figure 2d) shows that all catalysts are dominated by micropores with a pore size of 0.8 nm. Although the microporous area of bio-C-500 accounts for a small proportion, the pore volume of bio-C-500 is higher than that of bio-C-800 due to the wider distribution of the mesoporous area. The surface area of the pure MOF (bio-27) is 76.4 m2/g, as shown in Table 2. However, bio-27-C has much higher surface areas ranging from 204.2 m2/g to 980.4 m2/g.
On the other hand, the pore volume of bio-27-C-900 is the greatest, with a value of 0.496 cm3/g. The pore width of the bio-C-900 is the greatest, with a value of 0.852 nm, among all the materials. The well-developed pore structure in the adsorbent may provide more adsorption sites for SMX, which should be beneficial for reducing diffusion resistance.
3.1.2. Morphology of the Samples
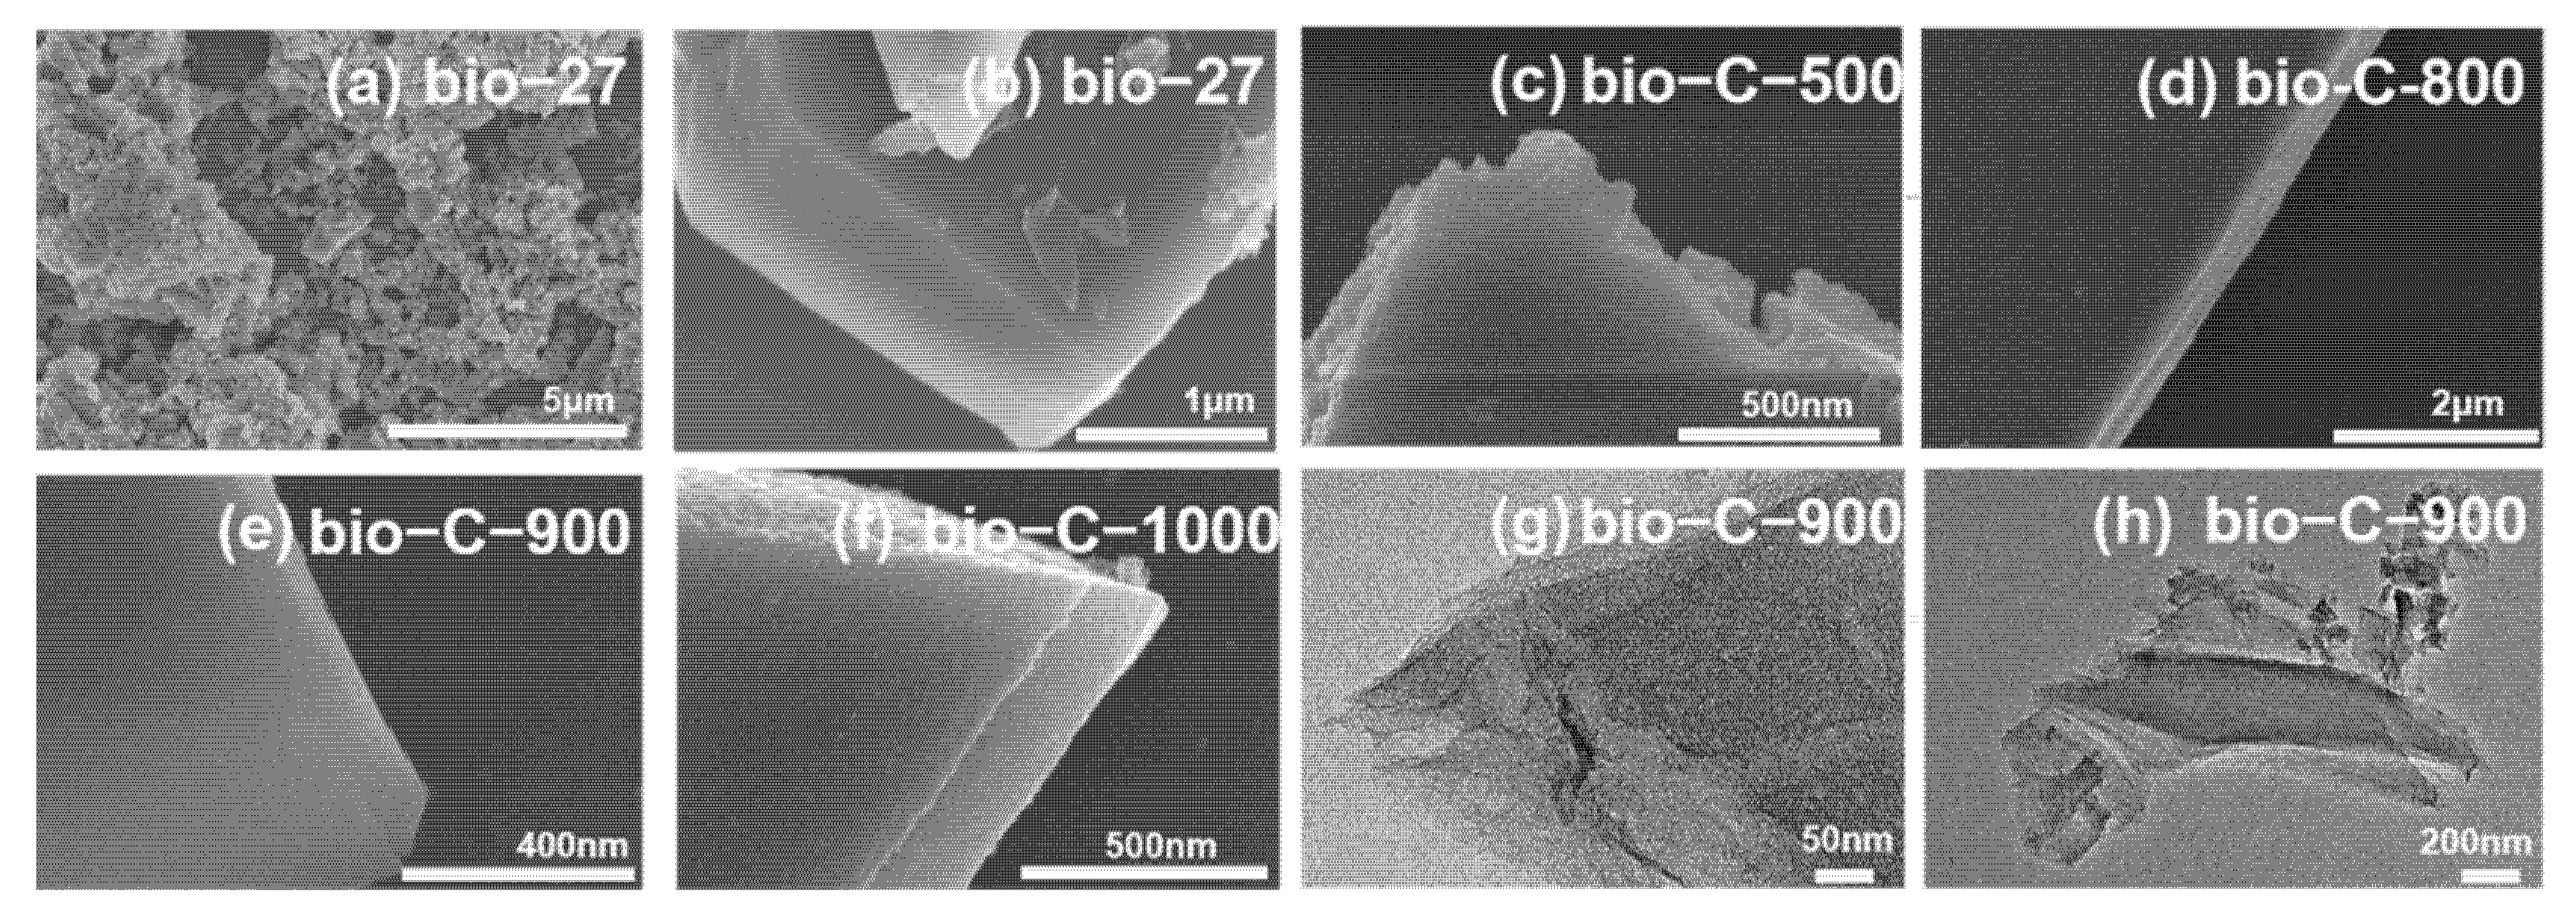
In Figure 3a,b, the precursor bio-27 has an irregular two-dimensional sheet structure, but the thickness is too large. With increasing pyrolysis temperatures, the edge morphology of bio-C-500 becomes irregular (Figure 3c), but it can be observed that it exists in the form of sheet-like stacking, and the scale becomes thinner. While bio-C-800, bio-C-900, and bio-C-1000 (Figure 3d–f) exhibit changes in longitudinal scale, the edges are more regular, and the ordered sheet-like stacking structure is favorable for the mass transfer process [31]. The jagged edges of bio-C-1000 may be due to the collapse of the internal structure. HRTEM was used to further characterize the morphology and microstructure of the catalyst. In the bright field image (Figure 3g), it can be observed that the surface of the catalyst with sheet-like morphology has uniformly distributed mesopores and only short-range ordered ones. N-doped carbon fringes do not exhibit any long-range ordered lattice fringes, indicating no crystalline species in the catalyst, which is mutually confirmed by the results of PXRD, as discussed above. The results show that the prepared bio-C-900 material has abundant pore structures.
3.1.3. Fourier Transform Infrared (FTIR) Spectrum of Bio-27-Derived Carbon
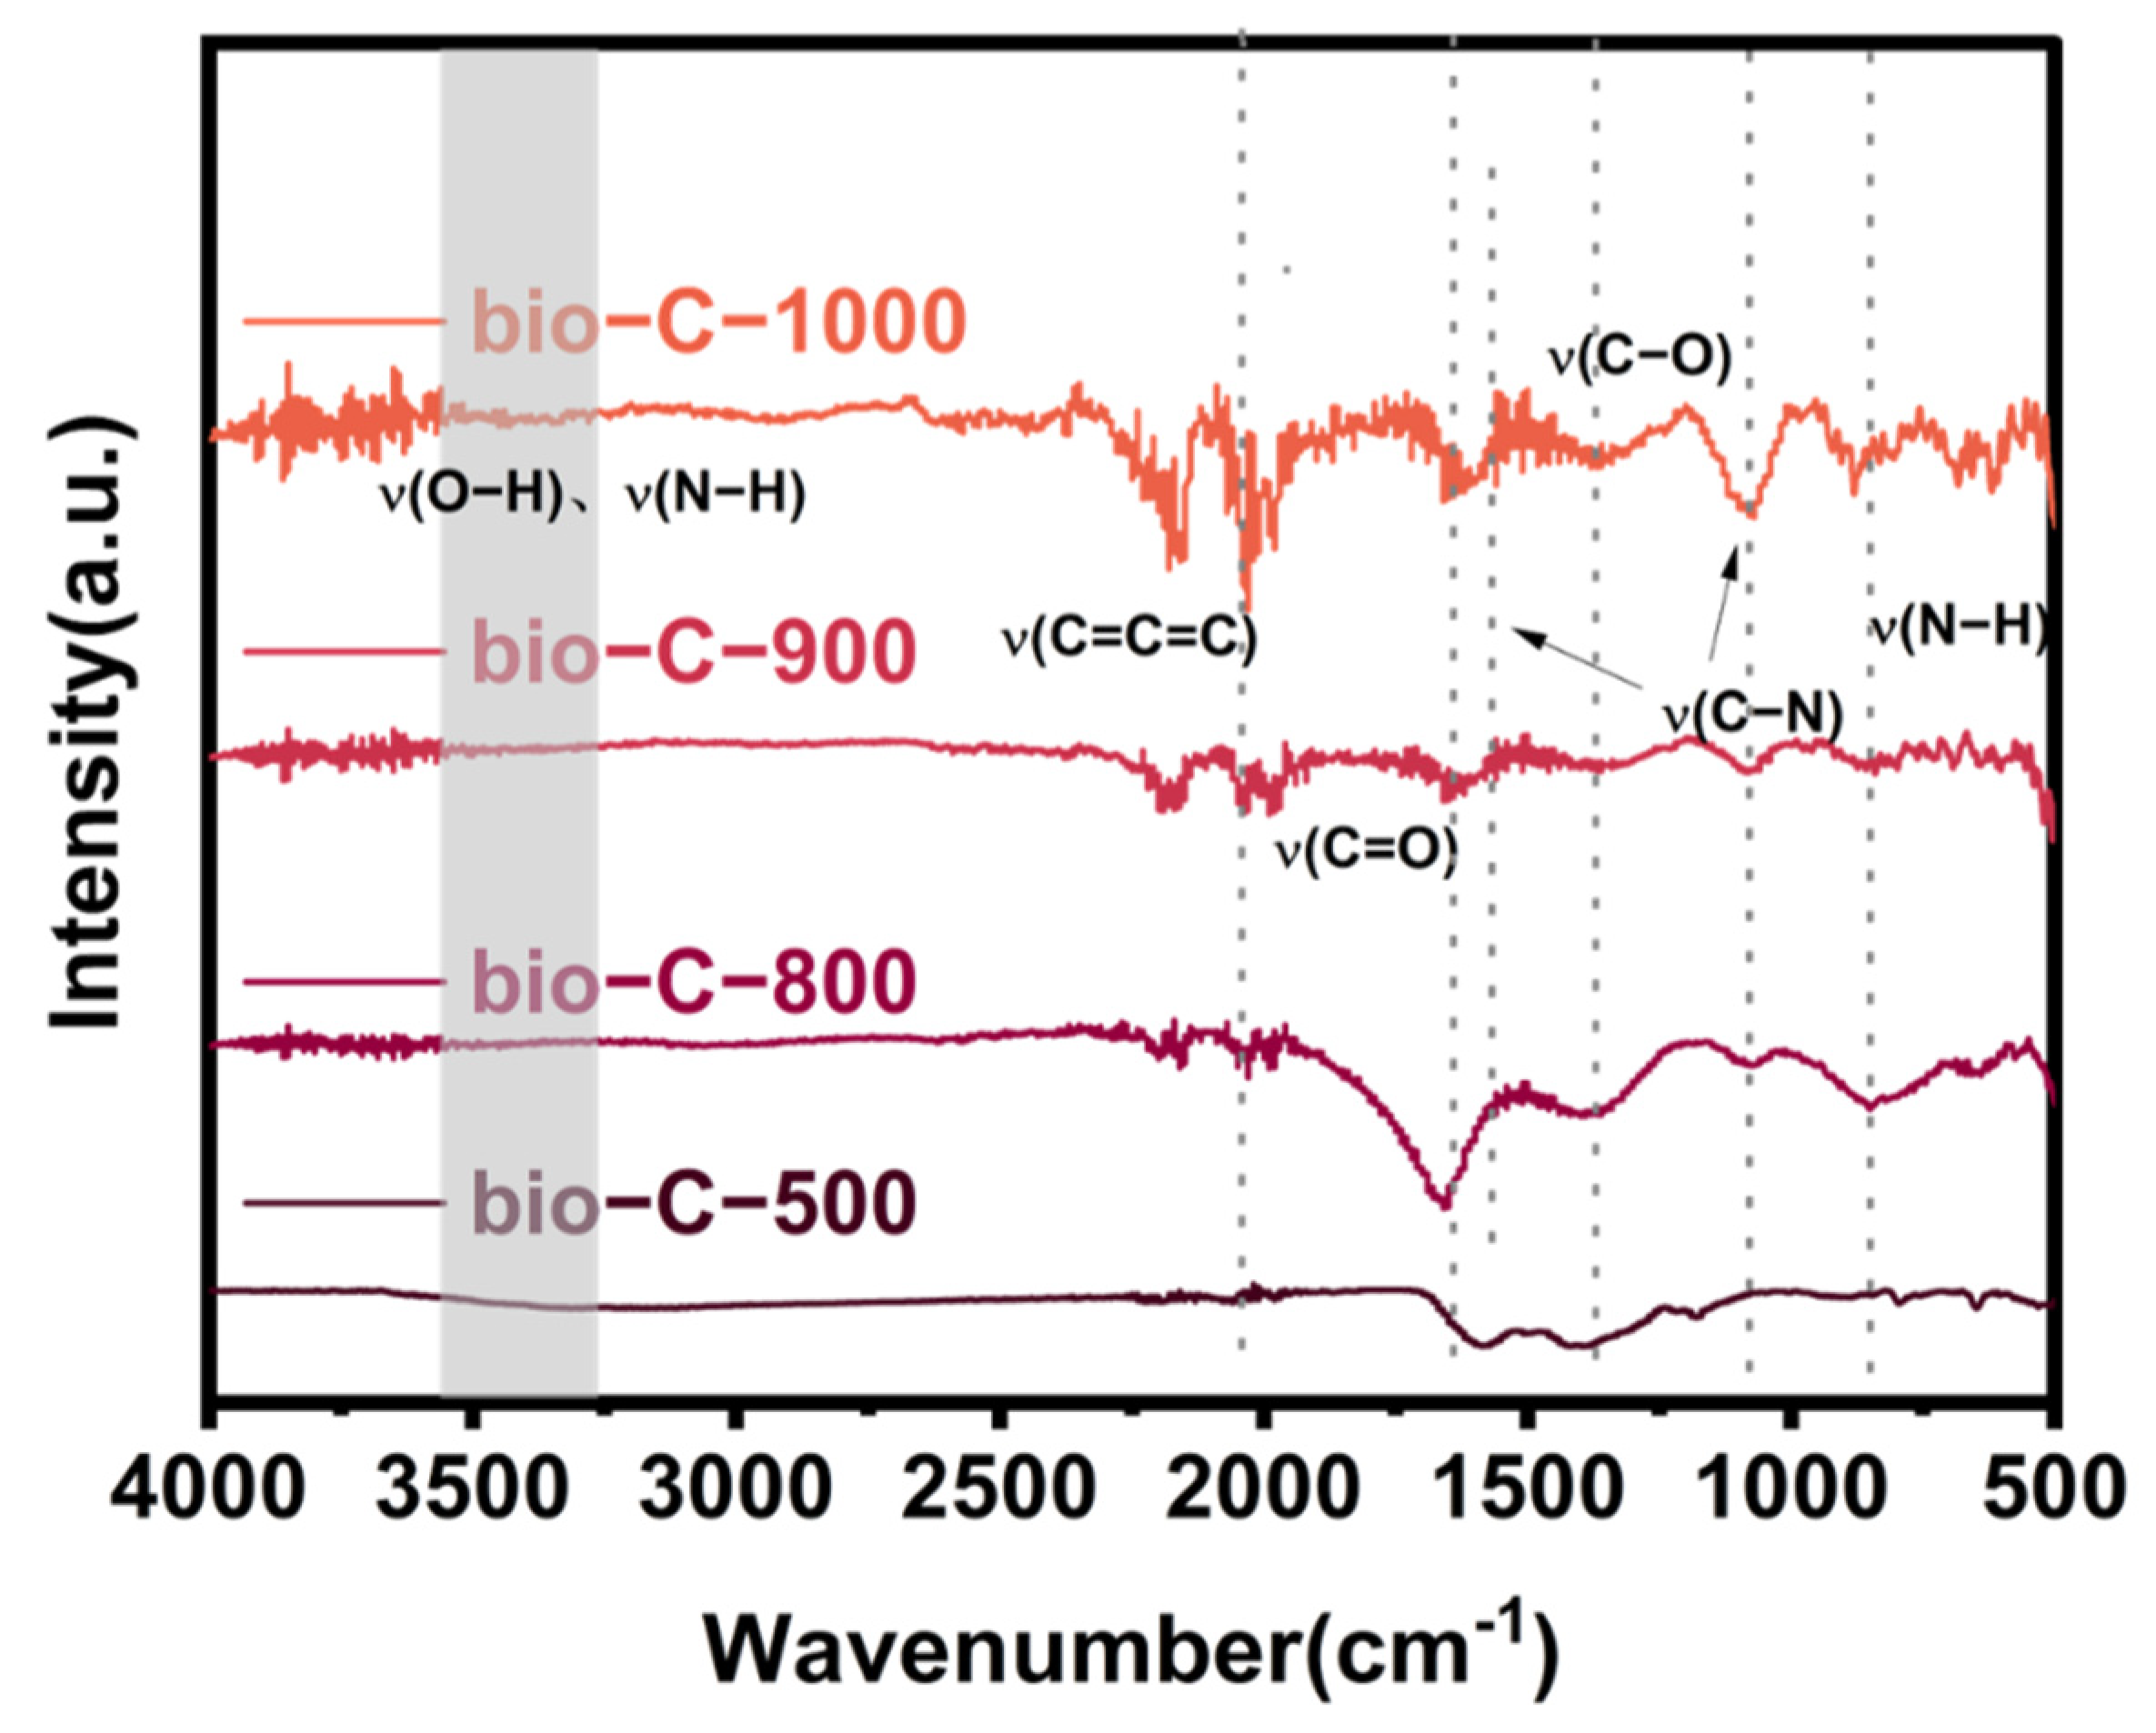
Analysis via FTIR spectroscopy was carried out in order to investigate the various surface functional groups. According to Figure 4, the stretching vibrations of O-H and N-H can be found at around 3400 cm−1 [32]. The band at 2100 cm−1 is ascribed to the C=C=C stretching vibration [33]. The C=O stretching vibration is responsible for the band at 1650 cm−1 [32], while the N-H in-plane and out-of-plane bending vibrations are responsible for the bands at 1580 cm−1 and 850 cm−1, respectively [32]. Furthermore, the bands at 1380 cm−1 and 1070 cm−1 are attributed to C-O stretching vibrations and C-N stretching vibrations [32,34], respectively, indicating the existence of nitrogen and oxygen functional groups on bio-C.
3.2. Adsorption Experiments
3.2.1. Pseudo-Second-Order Adsorption Kinetics of SMX
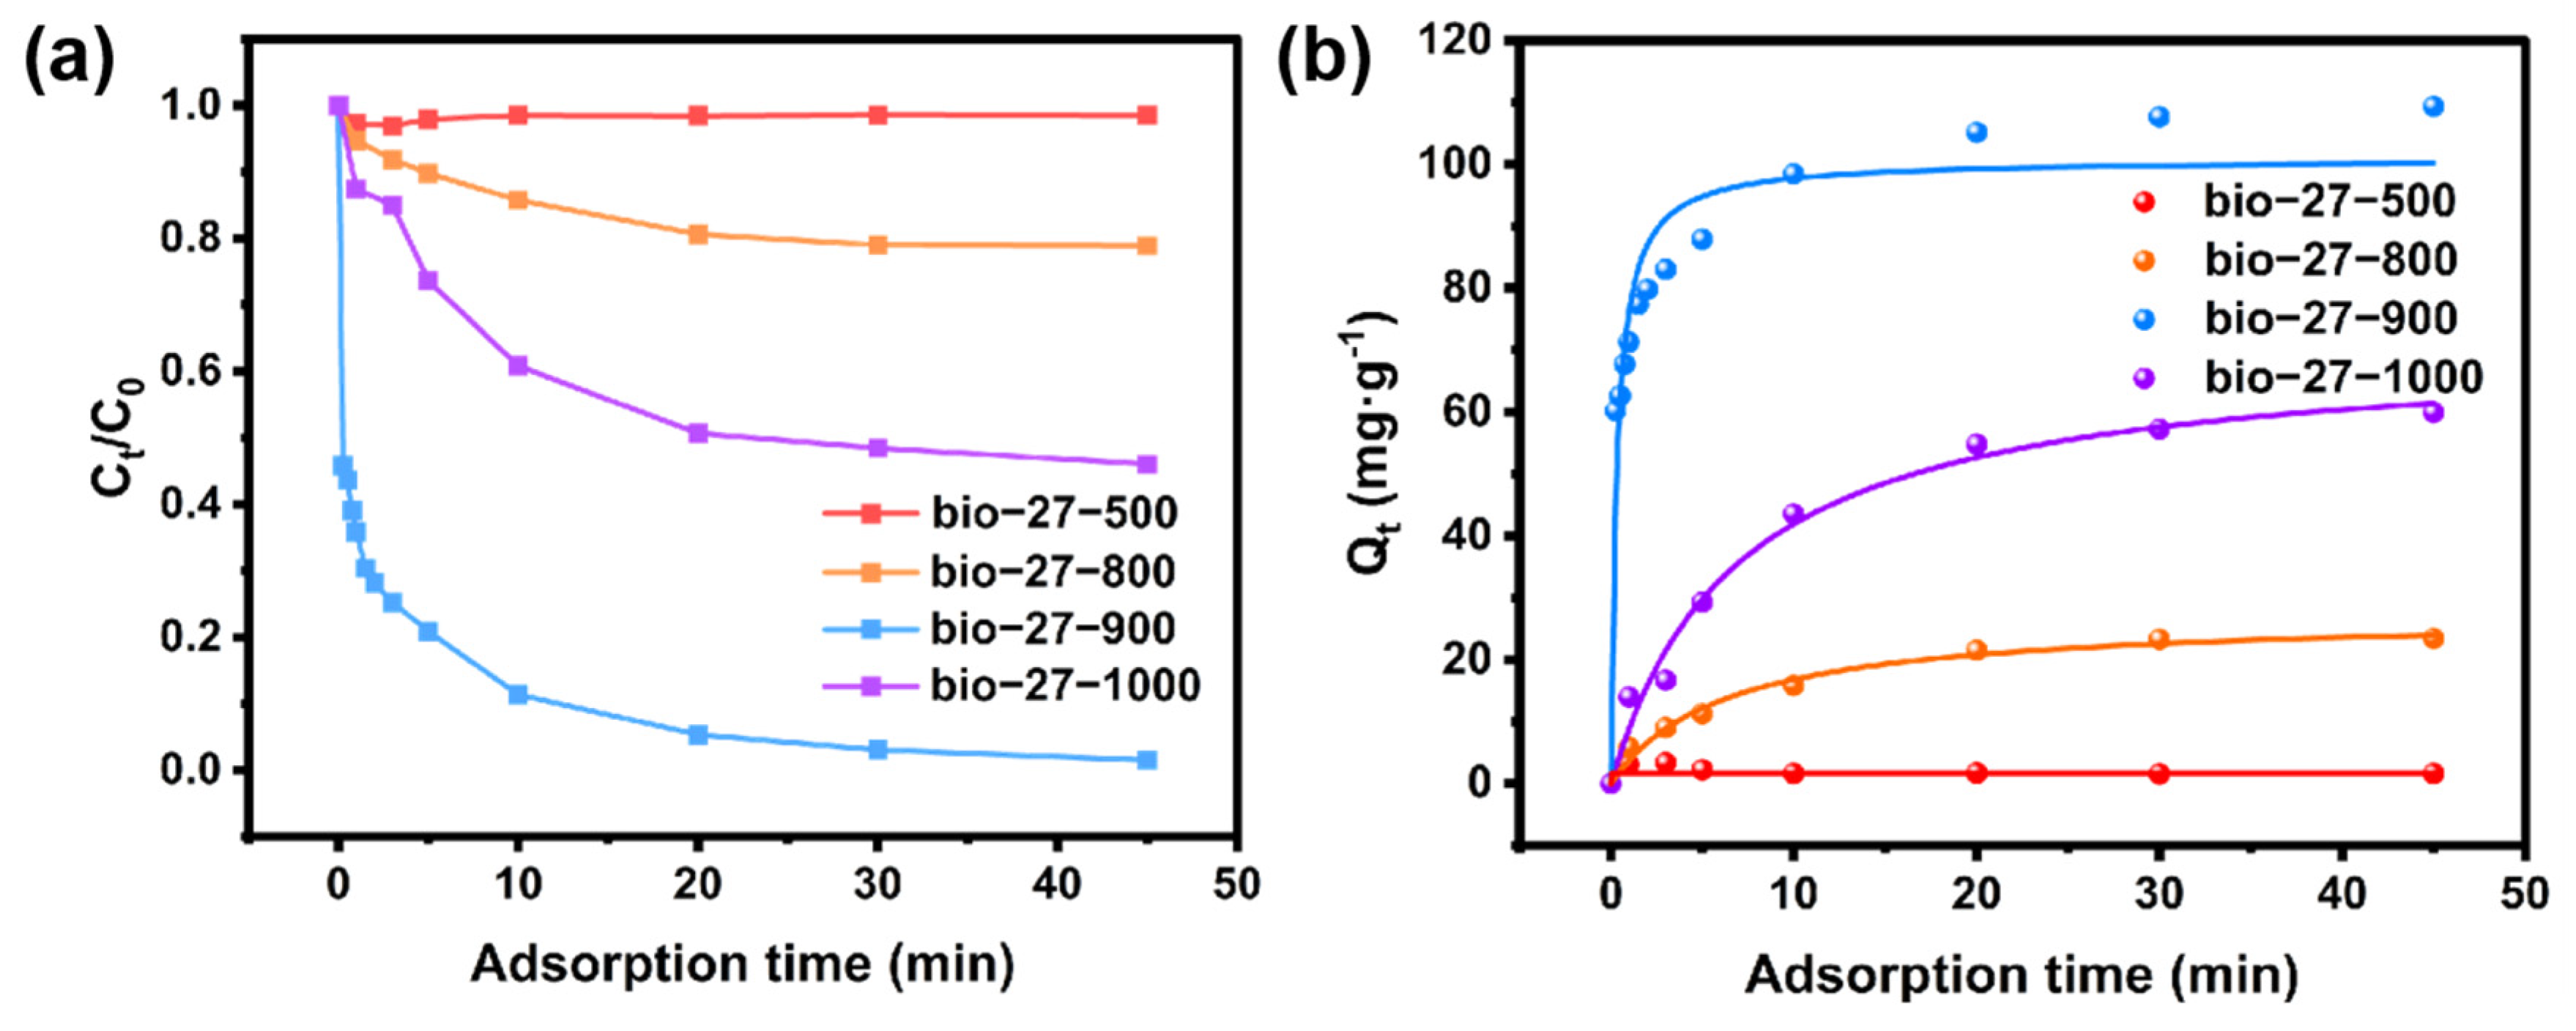
Within a contact time of 45 min, the impact of bio-C-T materials at various pyrolysis temperatures on SMX adsorption was examined. The results are displayed in Figure 5a. To fit the experimental data, a pseudo-second-order kinetic model was applied, and the relevant fit plots were produced. The model compound’s adsorption of the adsorbent is indicated by the variables Qt and Qe in the equation at reaction time t (min)—when the reaction achieves saturation equilibrium. Qe and v0 represent the adsorption amount and the initial adsorption rate (mg/g·min), respectively. According to Table 3, bio-C-900 has the highest Qe (100.85 mg/g) and the best adsorption capacity of SMX among the series of bio-C-T materials. In addition, its v0 (315.29 mg/g·min) is the highest among all the prepared materials. The mass transfer resistance of bio-C-900 to SMX is substantially lower than that of the manufactured bio-C at other temperatures, and its adsorption sites are more readily accessible to SMX. Additionally, its v0 is more than 30 times that of bio-C-1000. We therefore hypothesize that surface area has a close relationship with the adsorption amount of SMX in this study. A higher surface area should favor a higher adsorption amount.
On the other hand, large pore sizes could enhance the adsorption kinetics [35]. Similar results can be found in the adsorption process by other porous material [36]. For example, Guo found that the introduction of mesopores above 2 nm can greatly increase the pore volume. The graphene oxide/carbon composite nanofibers with abundant mesopores prepared in this study achieved improved adsorption capacity for volatile organic compounds (VOCs), and the highest adsorption capacity values for benzene and butanone reached 83.2 cm3 g−1 and 130.5 cm3 g−1, respectively. According to Table 2, we can know that the pore volume of bio-C-T-series materials was also greatly improved after the appearance of mesopores, which is consistent with the experimental results.
3.2.2. Effect of Reaction Time
The elimination of SMX was compared over bio-C-900, AC, and ZIF-8 (Zn as the metal center). The ZIF-8-C obtained after carbonization at the same temperature was applied in an adsorption experiment for removing SMX with an initial concentration of 10 ppm for 60 min. As shown in Figure 6a, bio-C-900 showed ultra-fast adsorption behavior, with 55% removal within only 15 s. A higher removal rate of 90% could be achieved within only 10 min. After reaching adsorption saturation, the removal rate of SMX by bio-C-900 can reach 98.7%. In comparison, the removal rates for SMX over AC and ZIF-8-C were 36.5% and 9.7%, respectively. Two models, the Elovich model and the second-order kinetic model, were applied in Table 4. The Elovich kinetic fitting formula (Equation (3)) is as follows:
where A and b are both Elovich constants. The fitting degree of the two models is very high, indicating that the adsorption process of the adsorbent includes both chemisorption with electron transfer and electron transfer during the pseudo-second-order kinetic process.
3.2.3. Effect of Initial Concentration
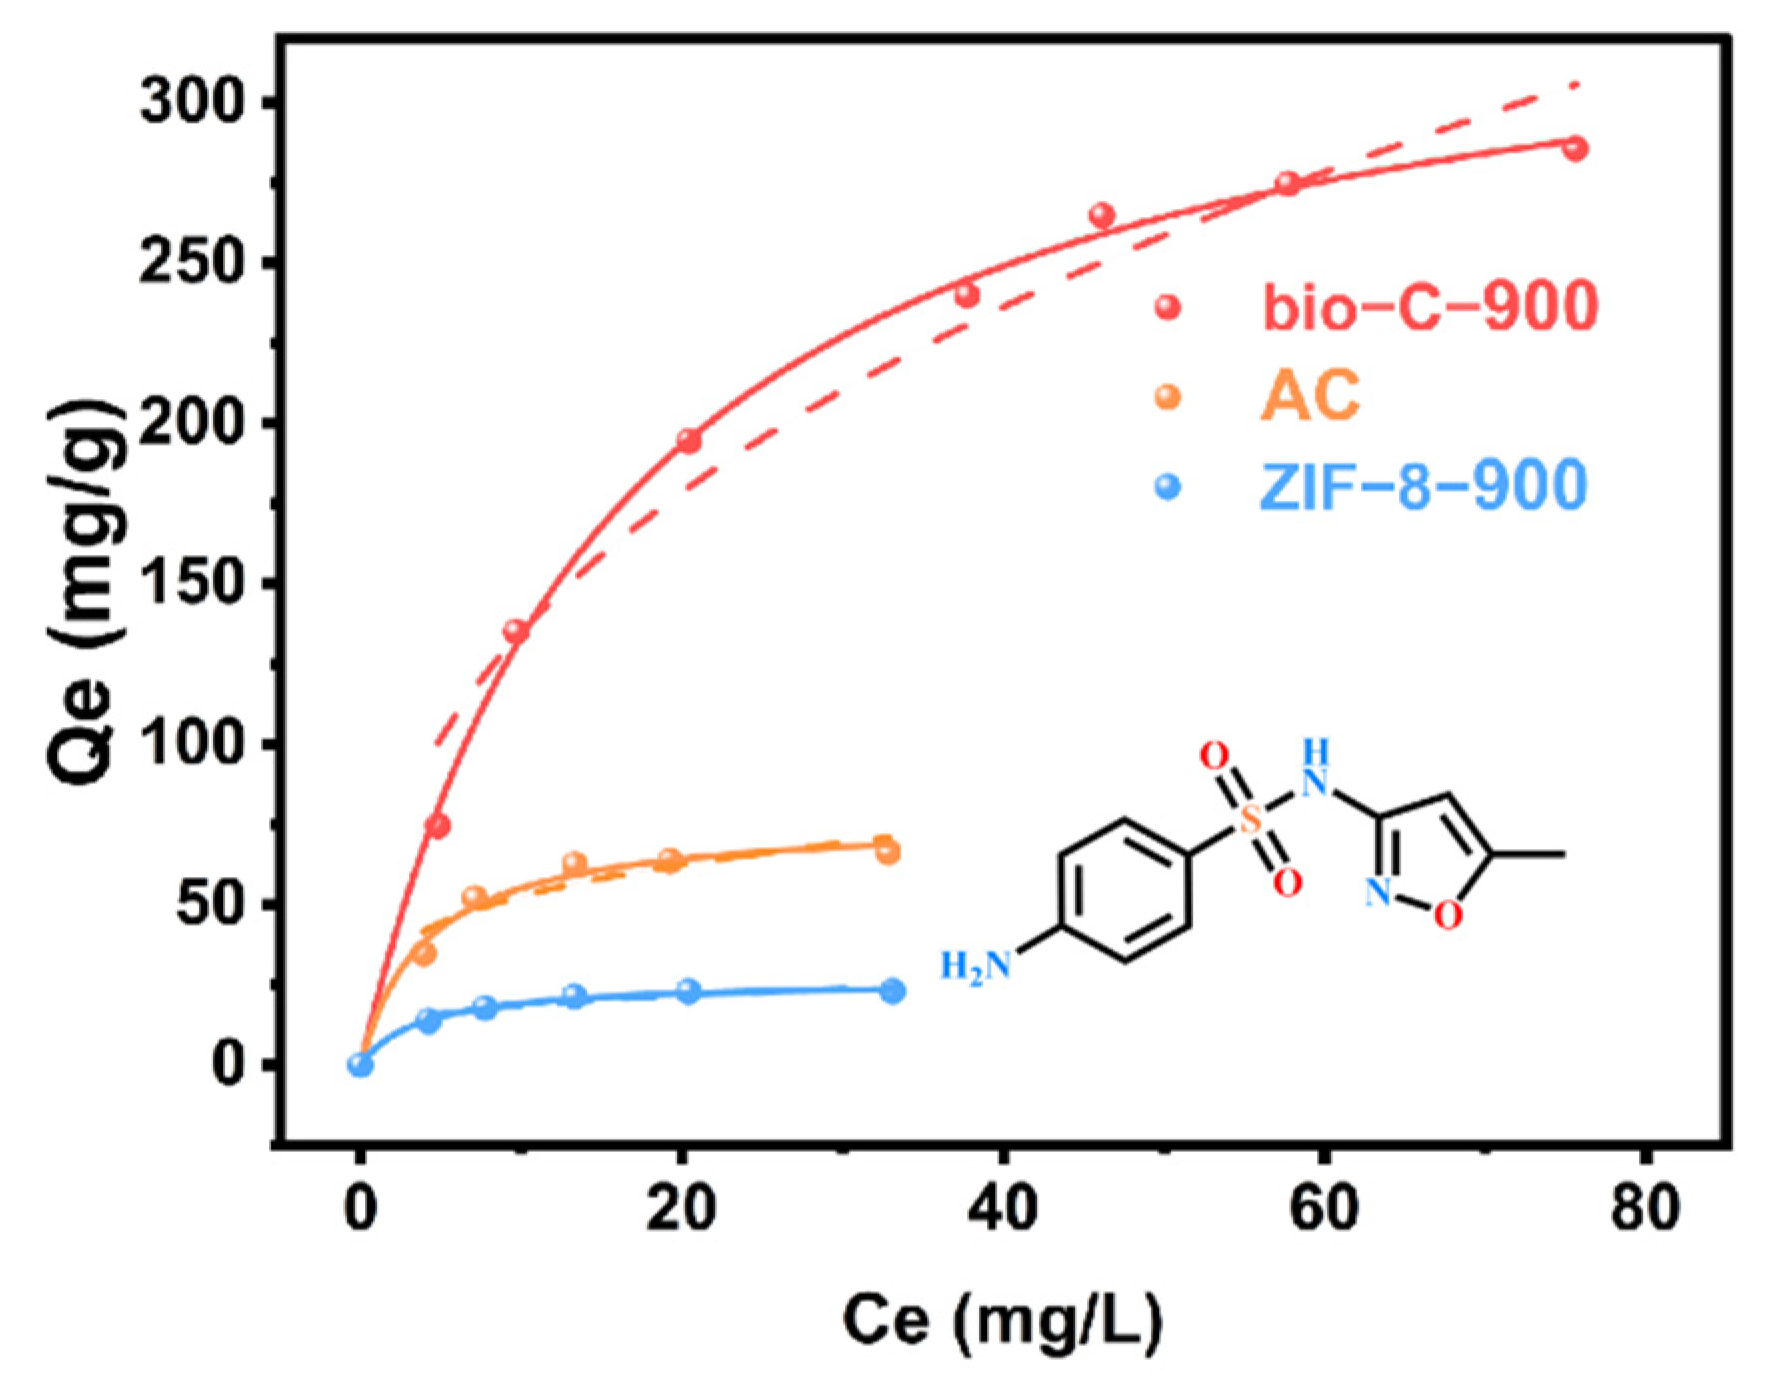
The amount of adsorption increases with increasing initial concentration and reaches saturation for bio-C-900, AC, and ZIF-8-C, as well as for adsorbents over the studied concentration (Figure 7). At initial concentration of 20 mg/L, 86.6% of SMX could be removed by the bio-C-900 sorbent. When the initial concentrations were 40, 50, 60, and 80 mg/L, SMX was partially removed with efficiencies of 58.3%, 53.1%, 44.8%, and 32.7%, respectively. Such a phenomenon can be explained by the limited adsorption sites of the same adsorbent. The adsorption capacity increases with a higher concentration of adsorbate. This demonstrates that the initial concentration should limit the adsorption amount because the adsorption sites are sufficient [37]. In addition, the data were fitted using the Langmuir and Freundlich equations.
The adsorption capacity of SMX over bio-C-900 was 4.6 and 13.3 times higher than those of AC and ZIF-8-C, respectively. The KL value indicates that SMX is more easily removed by bio-C-900, confirming that the prepared bio-C-900 could have relatively better adsorption properties than those of conventional materials. The adsorption of SMX over bio-C-900 tends to be homogeneous monolayer adsorption [38] because the Langmuir model linear fitting result (R2 = 0.99) is slightly better than that in the Freundlich model (R2 = 0.96). Therefore, the material tends towards homogeneous monolayer adsorption. In addition, the maximum adsorption capacity of SMX over bio-C-900 (350.90 mg/g) was 3.6 times higher than that over AC (76.96 mg/g), which further proved that bio-C-900 is conducive to the transport of substrates on its surface and pores. The heterogeneous multi-layer adsorption effectively improves the adsorption capacity and adsorption kinetics. The specific fitting data are shown in Table 4 below.
3.3. Exploring the Adsorption Mechanism for Micropollutants
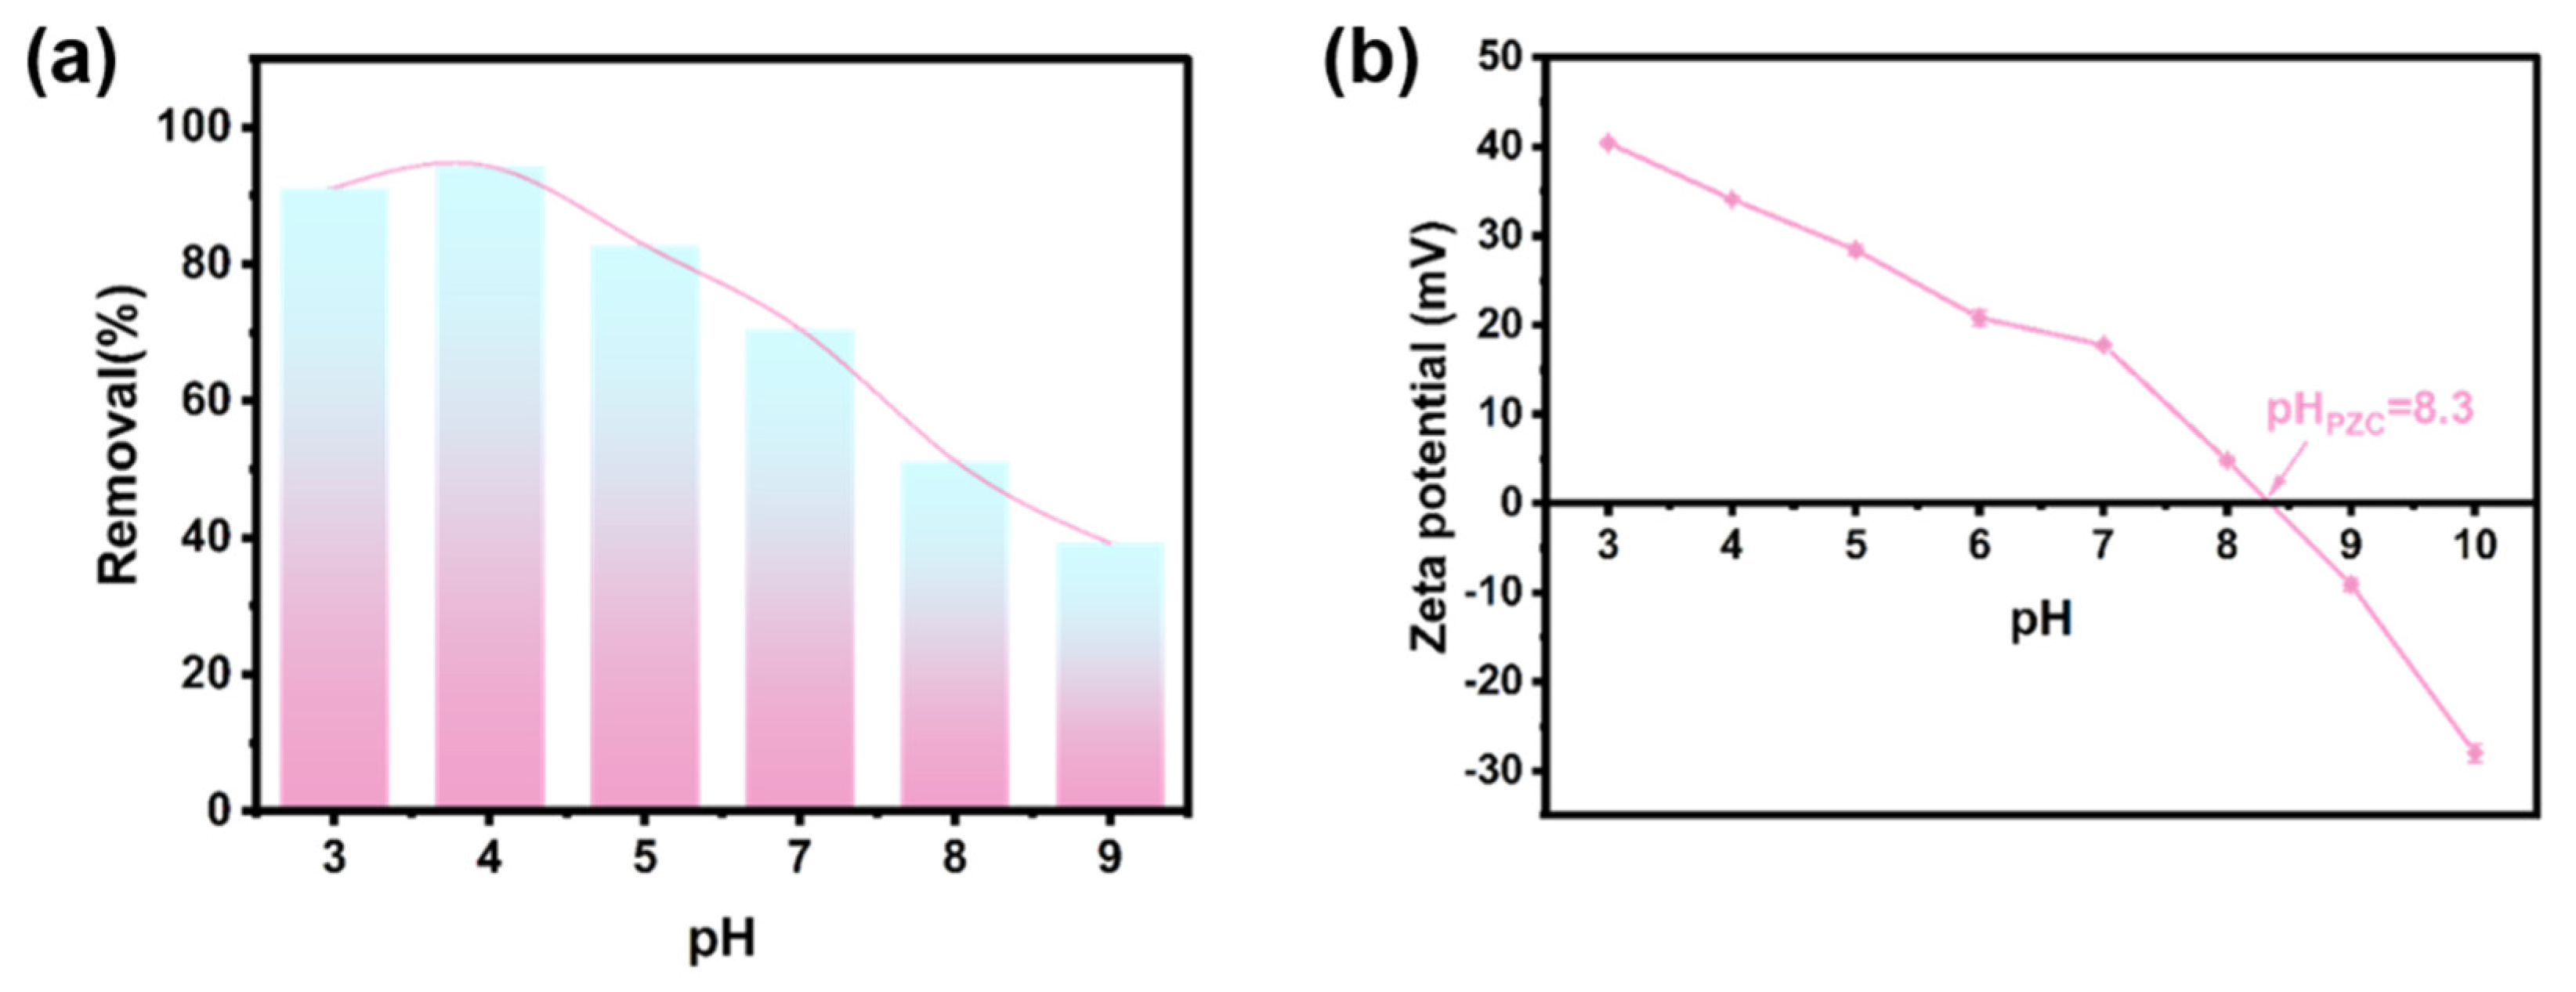
To gain more insight into the reaction mechanism, the effect of solution pH (3~9) was evaluated in Figure 8a. As seen in Figure 8, the removal percentages of SMX varied significantly with initial pH values. SMX is an amphiphilic molecule with two pKa values (pKa1 = 1.8 and pKa2 = 5.6) [39]. When the solution pH is higher, SMX is prone to exist in its deprotonated form with a negative charge. The zeta potential can be found in Figure 8b. As a result, the adsorption amount decreased obviously, probably because of electrostatic expulsion. However, in an acid environment, SMX is usually protonated, with a positive charge, which could lead to a decrease in electrostatic interaction. However, the adsorption performance for the removal of SMX is higher at pH values ranging from 3 to 5. Thus, several major mechanisms could co-exist to contribute to the high adsorption amount. For example, the solubility of SMX is lower in an acid environment, and it is very slightly soluble in water but is soluble in alkali hydroxides, as previously reported [40,41]. The properties of hydrophilic interaction should be considered.
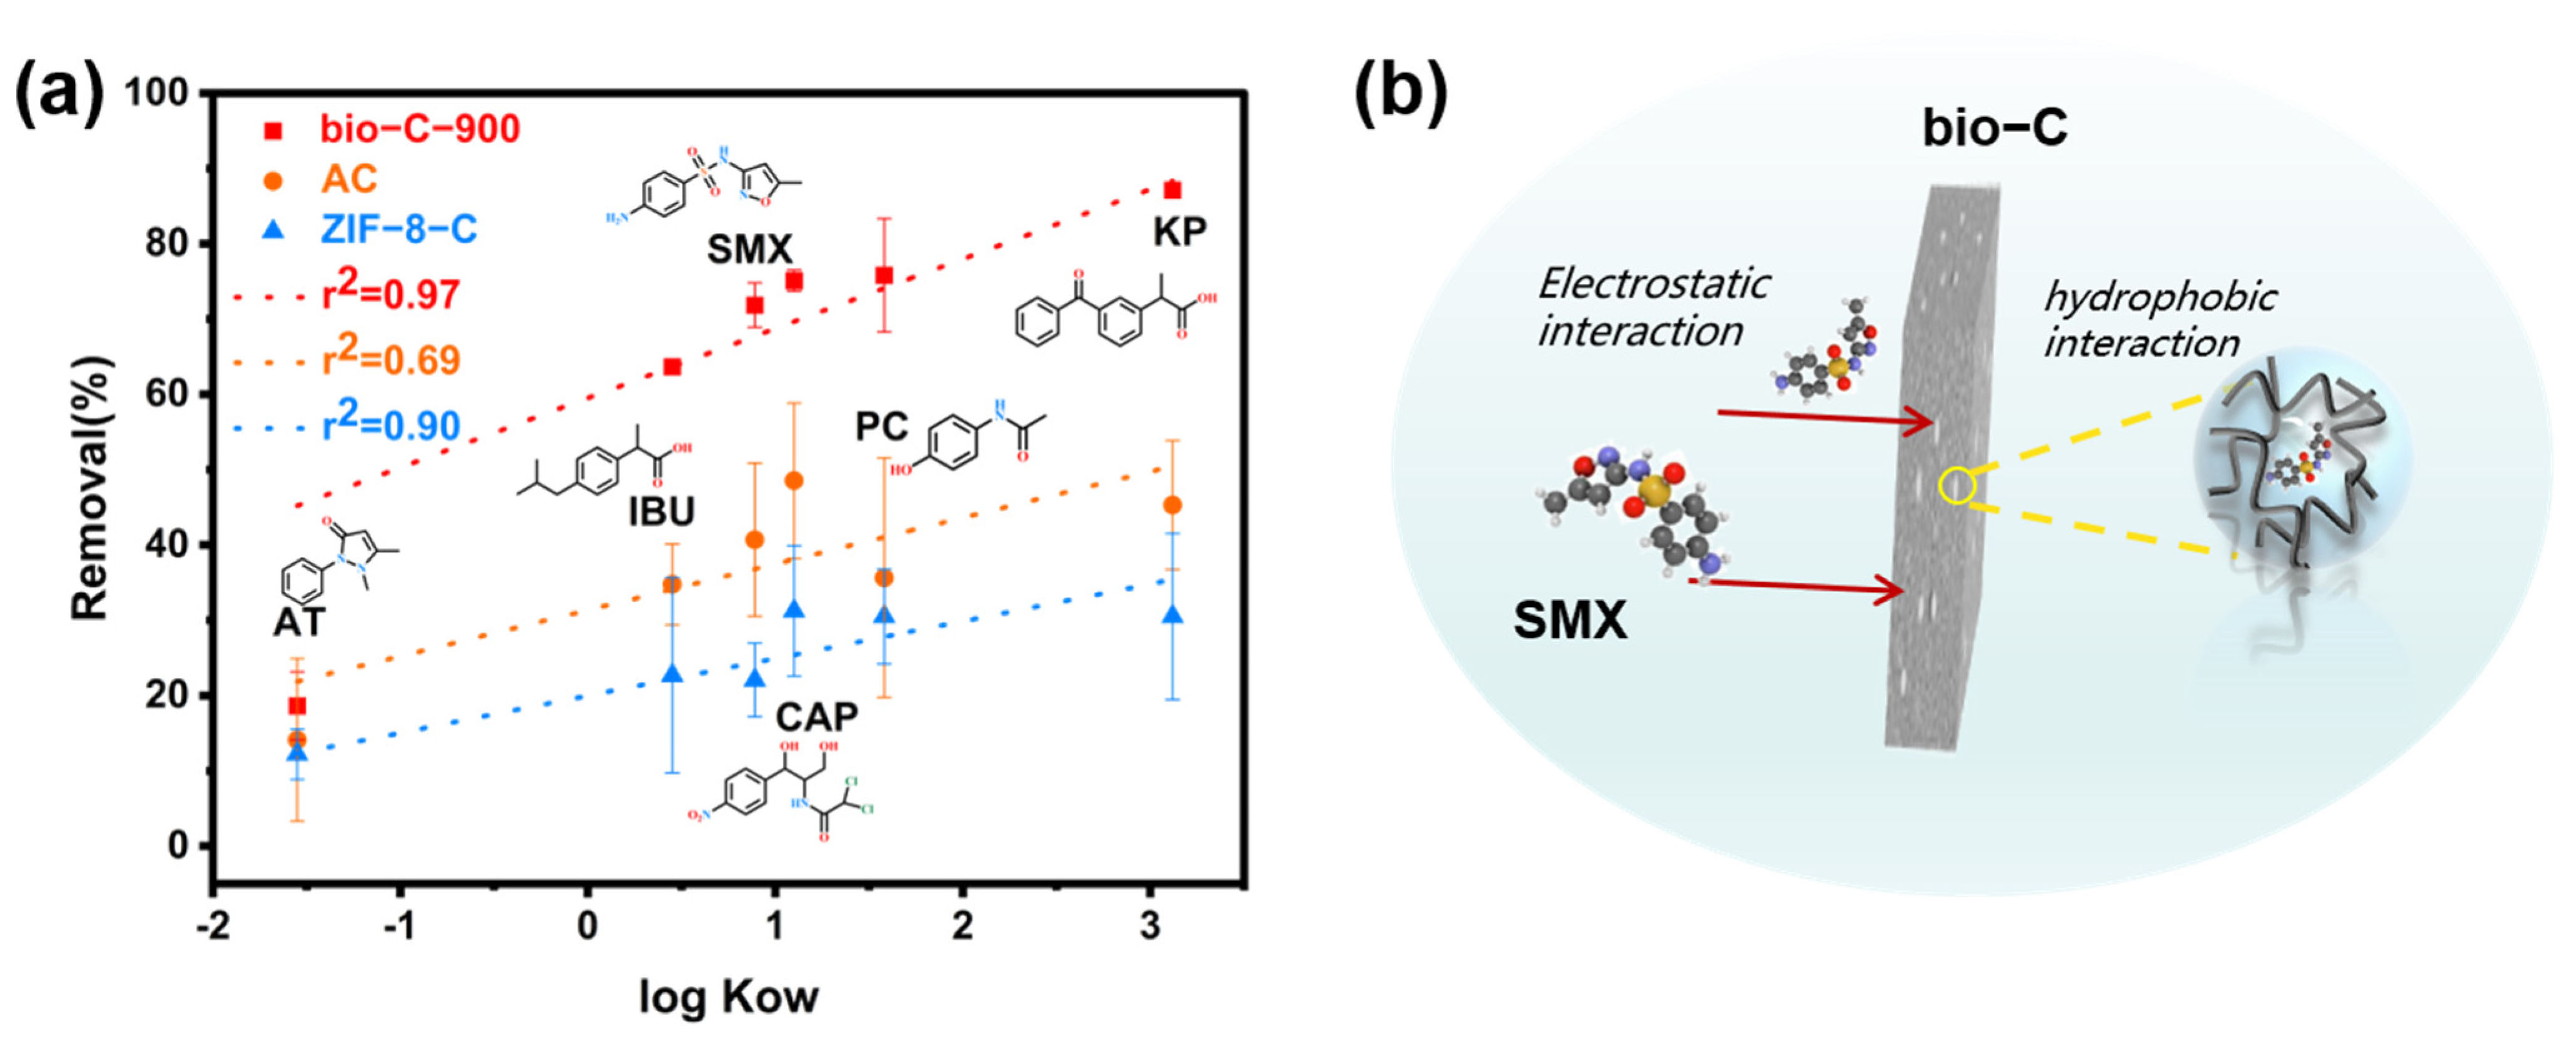
To further evaluate the adsorption performance for pharmaceuticals with diverse structures, the adsorption behavior for six pharmaceuticals—ketoprofen (KP), antipyrine (AT), ibuprofen (IBU), chloramphenicol (CAP), paracetamol (PC), and sulfamethoxazole (SMX)—were studied. Obviously, we found that the adsorption performance (removal percentages within 45 min reaction time) correlated well (R2 = 0.97) with the physical–chemical parameter log Kow of each pharmaceutical. The log Kow values of ketoprofen (KP), antipyrine (AT), ibuprofen (IBU), chloramphenicol (CAP), paracetamol (PC), and sulfamethoxazole (SMX) were 3.12, −1.55, 0.45, 1.1, 1.58, and 0.89 [42,43,44,45], respectively. Tung Xuan Bui et al. found a linear relationship between log Kow and adsorption amount at a wide range of pH values for 12 drugs, indicating that the adsorption of drugs on TMS-SBA-15 is mainly driven by hydrophobic interactions [46]. Taku Matsushita [47] et al. evaluated the adsorption capacity of nine activated carbons for geosmin and 2-methylisoborneol (MIB) and showed that hydrophobic materials enhance the adsorption. Based on the above discussion, hydrophobic interactions are dominant in this adsorption mechanism. Based on the discussion above, the proposed mechanism is shown in Figure 9b.
4. Conclusions
In summary, a novel MOF-derived carbon has been designed and synthesized for the first time. A mixed ligand approach has been applied to successfully synthesize bio-27 via the solvothermal method. By pyrolyzation at different temperatures, the optimal condition at 900 °C was selected to generate a novel heterogeneous porous carbon with the highest surface area (SBET = 980.5 m2/g) and a large pore volume (0.496 cm3/g). The maximum saturated adsorption capacity for sulfamethylthiazole (SMX) over MOF-derived carbon can reach 351.3 mg/g with a fast initial adsorption rate of 315.29 (mg/g·min). The adsorption capacity calculated by the Langmuir model (R2 = 0.99) for SMX over bio-C-900 was 4.6 and 13.3 times more than the values for AC and ZIF-8-C, respectively. Hydrophobic interaction should be one of the major mechanisms for the material’s adsorption in water. This study offers a strategy to develop novel carbon materials to remove pharmaceuticals from water.
Author Contributions
Conceptualization, X.L. and Y.M.; methodology, X.L. and Y.M.; software, Y.M.; validation, X.L. and Y.M.; formal analysis, X.L. and Y.M.; investigation, X.L. and Y.M.; resources, B.W.; data curation, X.L. and Y.M. writing—original draft preparation, Y.M.; writing—review and editing, X.L; visualization, X.L; supervision, B.W.; project administration, X.L. and B.W.; funding acquisition, X.L. and B.W.; All authors have read and agreed to the published version of the manuscript.
Funding
This work was financially supported by the National Natural Science Foundation of China (Grants 21625102, 21971017, and 21906007), China’s National Key Research and Development Program (Grant 2020YFB1506300), and the Beijing Institute of Technology Research Fund Program. We gratefully acknowledge the Analysis and Testing Center of the Beijing Institute of Technology.
Conflicts of Interest
The authors declare no conflict of interest.
References
- Yang, Y.; Ok, Y.S.; Kim, K.H.; Kwon, E.E.; Tsang, Y.F. Occurrences and removal of pharmaceuticals and personal care products (PPCPs) in drinking water and water/sewage treatment plants: A. review. Sci. Total Environ. 2017, 596, 303–320. [Google Scholar] [CrossRef]
- Priya, A.K.; Gnanasekaran, L.; Rajendran, S.; Qin, J.Q.; Vasseghian, Y. Occurrences and removal of pharmaceutical and personal care products from aquatic systems using advanced treatment—A review. Environ. Res. 2022, 204, 15. [Google Scholar] [CrossRef]
- Petrie, B.; Barden, R.; Kasprzyk-Hordern, B. A review on emerging contaminants in wastewaters and the environment: Current knowledge, understudied areas and recommendations for future monitoring. Water Res. 2015, 72, 3–27. [Google Scholar] [CrossRef] [PubMed]
- Ramirez, A.J.; Brain, R.A.; Usenko, S.; Mottaleb, M.A.; O’Donnell, J.G.; Stahl, L.L.; Wathen, J.B.; Snyder, B.D.; Pitt, J.L.; Perez-Hurtado, P.; et al. Occurrence of pharmaceuticals and personal care products in fish: Results of a national pilot study in the united states. Environ. Toxicol. Chem. 2009, 28, 2587. [Google Scholar] [CrossRef] [PubMed]
- Bonvin, F.; Omlin, J.; Rutler, R.; Schweizer, W.B.; Alaimo, P.J.; Strathmann, T.J.; McNeill, K.; Kohn, T. Direct Photolysis of Human Metabolites of the Antibiotic Sulfamethoxazole: Evidence for abiotic Back-Transformation. Environ. Sci. Technol. 2013, 47, 6746–6755. [Google Scholar] [CrossRef] [PubMed]
- Abusin, S.; Johnson, S. Sulfamethoxazole/Trimethoprim induced liver failure: A case report. Cases J. 2008, 1, 44. [Google Scholar] [CrossRef] [Green Version]
- Tong, H.; Ouyang, S.X.; Bi, Y.P.; Umezawa, N.; Oshikiri, M.; Ye, J.H. Nano-photocatalytic materials: Possibilities and challenges. Adv. Mater. 2012, 24, 229–251. [Google Scholar] [CrossRef]
- Jain, B.; Singh, A.K.; Kim, H.; Lichtfouse, E.; Sharma, V.K. Treatment of organic pollutants by homogeneous and heterogeneous Fenton reaction processes. Environ. Chem. Lett. 2018, 16, 947–967. [Google Scholar] [CrossRef] [Green Version]
- Zhang, D.Q.; Gersberg, R.M.; Ng, W.J.; Tan, S.K. Removal of pharmaceuticals and personal care products in aquatic plant-based systems: A. review. Environ. Pollut. 2014, 184, 620–639. [Google Scholar] [CrossRef]
- Nasrollahi, N.; Vatanpour, V.; Khataee, A. Removal of antibiotics from wastewaters by membrane technology: Limitations, successes, and future improvements. Sci. Total Environ. 2022, 838, 18. [Google Scholar] [CrossRef]
- Zhang, W.L.; Yin, J.; Wang, C.W.; Zhao, L.; Jian, W.B.; Lu, K.; Lin, H.B.; Qiu, X.Q.; Alshareef, H.N. Lignin Derived Porous Carbons: Synthesis Methods and Supercapacitor Applications. Small Methods 2021, 5, 24. [Google Scholar] [CrossRef] [PubMed]
- Moulahcene, L.; Skiba, M.; Senhadji, O.; Milon, N.; Benamor, M.; Lahiani-Skiba, M. Inclusion and removal of pharmaceutical residues from aqueous solution using water-insoluble cyclodextrin polymers. Chem. Eng. Res. Des. 2015, 97, 145–158. [Google Scholar] [CrossRef]
- Margeta, K.; Vojnovic, B.; Logar, N.Z. Development of Natural Zeolites for Their Use in Water-Treatment Systems. Recent Pat. Nanotechnol. 2011, 5, 89–99. [Google Scholar] [CrossRef] [PubMed]
- Liu, X.L.; Wang, C.; Wu, Q.H.; Wang, Z. Metal-organic framework-templated synthesis of magnetic nanoporous carbon as an efficient absorbent for enrichment of phenylurea herbicides. Anal. Chim. Acta 2015, 870, 67–74. [Google Scholar] [CrossRef]
- Rodrigues, D.A.D.; da Cunha, C.; Freitas, M.G.; de Barros, A.L.C.; Castro, P.; Pereira, A.R.; Silva, S.D.; Santiago, A.D.; Afonso, R. Biodegradation of sulfamethoxazole by microalgae-bacteria consortium in wastewater treatment plant effluents. Sci. Total Environ. 2020, 749, 9. [Google Scholar] [CrossRef]
- Hasan, Z.; Jhung, S.H. Removal of hazardous organics from water using metal-organic frameworks (MOFs): Plausible mechanisms for selective adsorptions. J. Hazard. Mater. 2015, 283, 329–339. [Google Scholar] [CrossRef]
- Li, S.Q.; Zhang, X.D.; Huang, Y.M. Zeolitic imidazolate framework-8 derived nanoporous carbon as an effective and recyclable adsorbent for removal of ciprofloxacin antibiotics from water. J. Hazard. Mater. 2017, 321, 711–719. [Google Scholar] [CrossRef]
- Jiao, C.N.; Wang, Y.N.; Li, M.H.; Wu, Q.H.; Wang, C.; Wang, Z. Synthesis of magnetic nanoporous carbon from metal-organic framework for the fast removal of organic dye from aqueous solution. J. Magn. Magn. Mater. 2016, 407, 24–30. [Google Scholar] [CrossRef]
- Wang, L.H.; Ke, F.; Zhu, J.F. Metal-organic gel templated synthesis of magnetic porous carbon for highly efficient removal of organic dyes. Dalton Trans. 2016, 45, 4541–4547. [Google Scholar] [CrossRef]
- Chen, D.Z.; Shen, W.S.; Wu, S.L.; Chen, C.Q.; Luo, X.B.; Guo, L. Ion exchange induced removal of Pb(II) by MOF-derived magnetic inorganic sorbents. Nanoscale 2016, 8, 7172–7179. [Google Scholar] [CrossRef]
- Salunkhe, R.R.; Young, C.; Tang, J.; Takei, T.; Ide, Y.; Kobayashi, N.; Yamauchi, Y. A high-performance supercapacitor cell based on ZIF-8-derived nanoporous carbon using an organic electrolyte. Chem. Commun. 2016, 52, 4764–4767. [Google Scholar] [CrossRef] [PubMed]
- Yan, X.L.; Li, X.J.; Yan, Z.F.; Komarneni, S. Porous carbons prepared by direct carbonization of MOFs for supercapacitors. Appl. Surf. Sci. 2014, 308, 306–310. [Google Scholar] [CrossRef]
- Fang, X.Z.; Jiao, L.; Yu, S.H.; Jiang, H.L. Metal-Organic Framework-Derived FeCo-N-Doped Hollow Porous Carbon Nanocubes for Electrocatalysis in Acidic and Alkaline Media. Chem. Sus. Chem. 2017, 10, 3019–3024. [Google Scholar] [CrossRef] [PubMed]
- Maity, R.; Singh, H.D.; Yadav, A.K.; Chakraborty, D.; Vaidhyanathan, R. Water-stable Adenine-based MOFs with Polar Pores for Selective CO2 Capture. Chem. Asian J. 2019, 14, 3736–3741. [Google Scholar] [CrossRef]
- Bhadra, B.N.; Jhung, S.H. Adsorptive removal of wide range of pharmaceuticals and personal care products from water using bio-MOF-1 derived porous carbon. Microporous Mesoporous Mater. 2018, 270, 102–108. [Google Scholar] [CrossRef]
- Yin, P.Q.; Yao, T.; Wu, Y.; Zheng, L.R.; Lin, Y.; Liu, W.; Ju, H.X.; Zhu, J.F.; Hong, X.; Deng, Z.X.; et al. Single Cobalt Atoms with Precise N-Coordination as Superior Oxygen Reduction Reaction Catalysts. Angew. Chem. Int. Edit. 2016, 55, 10800–10805. [Google Scholar] [CrossRef]
- Han, S.-y.; Qiao, J.-q.; Zhang, Y.-y.; Lian, H.-z.; Ge, X. Determination of n-octanol/water partition coefficients of weak ionizable solutes by RP-HPLC with neutral model compounds. Talanta 2012, 97, 355–361. [Google Scholar] [CrossRef]
- Kitt, J.P.; Harris, J.M. Confocal Raman Microscopy for in Situ Measurement of Octanol–Water Partitioning within the Pores of Individual C18-Functionalized Chromatographic Particles. Anal. Chem. 2015, 87, 5340–5347. [Google Scholar] [CrossRef]
- Li, Y.H.; Shen, S.G.; Wang, C.Y.; Peng, X.; Yuan, S.J. The effect of difference in chemical composition between cellulose and lignin on carbon based solid acids applied for cellulose hydrolysis. Cellulose 2018, 25, 1851–1863. [Google Scholar] [CrossRef]
- Shi, Y.W.; Liu, G.Z.; Wang, L.; Zhang, X.W. Efficient adsorptive removal of dibenzothiophene from model fuel over heteroatom-doped porous carbons by carbonization of an organic salt. Chem. Eng. J. 2015, 259, 771–778. [Google Scholar] [CrossRef]
- Tsou, C.H.; An, Q.F.; Lo, S.C.; de Guzman, M.; Hung, W.S.; Hu, C.C.; Lee, K.R.; Lai, J.Y. Effect of microstructure of graphene oxide fabricated through different self-assembly techniques on 1-butanol dehydration. J. Membr. Sci. 2015, 477, 93–100. [Google Scholar] [CrossRef]
- Yang, X.M.; Salado-Leza, D.; Porcel, E.; Gonzalez-Vargas, C.R.; Savina, F.; Dragoe, D.; Remita, H.; Lacombe, S. A Facile One-Pot Synthesis of Versatile PEGylated Platinum Nanoflowers and Their Application in Radiation Therapy. Int. J. Mol. Sci. 2020, 21, 20. [Google Scholar] [CrossRef] [PubMed] [Green Version]
- Ain, Q.T.; Haq, S.H.; Alshammari, A.; Al-Mutlaq, M.A.; Anjum, M.N. The systemic effect of PEG-nGO-induced oxidative stress in vivo in a rodent model. Beilstein J. Nanotechnol. 2019, 10, 901–911. [Google Scholar] [CrossRef] [Green Version]
- Wang, Z.; Ding, Y.K.; Wang, J.C. Novel Polyvinyl Alcohol (PVA)/Cellulose Nanocrystal (CNC) Supramolecular Composite Hydrogels: Preparation and Application as Soil Conditioners. Nanomaterials 2019, 9, 17. [Google Scholar] [CrossRef] [Green Version]
- Idris, S.A.; Alotaibi, K.M.; Peshkur, T.A.; Anderson, P.; Morris, M.; Gibson, L.T. Adsorption kinetic study: Effect of adsorbent pore size distribution on the rate of Cr (VI) uptake. Microporous Mesoporous Mater. 2013, 165, 99–105. [Google Scholar] [CrossRef]
- Guo, Z.Y.; Huang, J.T.; Xue, Z.H.; Wang, X.M. Electrospun graphene oxide/carbon composite nanofibers with well-developed mesoporous structure and their adsorption performance for benzene and butanone. Chem. Eng. J. 2016, 306, 99–106. [Google Scholar] [CrossRef]
- Nielsen, L.; Biggs, M.J.; Skinner, W.; Bandosz, T.J. The effects of activated carbon surface features on the reactive adsorption of carbamazepine and sulfamethoxazole. Carbon 2014, 80, 419–432. [Google Scholar] [CrossRef] [Green Version]
- Song, X.L.; Zhang, Y.; Yan, C.Y.; Jiang, W.J.; Chang, C.M. The Langmuir monolayer adsorption model of organic matter into effective pores in activated carbon. J. Colloid Interface Sci. 2013, 389, 213–219. [Google Scholar] [CrossRef]
- Song, Y.Q.; Zeng, Y.; Liao, J.X.; Chen, J.Q.; Du, Q. Efficient removal of sulfamethoxazole by resin-supported zero-valent iron composites with tunable structure: Performance, mechanisms, and degradation pathways. Chemosphere 2021, 269, 11. [Google Scholar] [CrossRef]
- Aronson, J.K. Sulfonamides. In Meyler’s Side Effects of Drugs, 16th ed.; Elsevier: Oxford, UK, 2016; pp. 555–569. [Google Scholar] [CrossRef]
- Hişmioğullari, Ş.E.; Yarsan, E. Spectrophotometric determination and stability studies of sulfamethoxazole and trimethoprim in oral suspension by classical least square calibration method. Hacet. Univ. J. Fac. Pharm. 2009, 2, 95–104. [Google Scholar]
- Yang, L.P.; Ke, H.; Yao, H.; Jiang, W. Effective and Rapid Removal of Polar Organic Micropollutants from Water by Amide Naphthotube-Crosslinked Polymers. Angew. Chem. Int. Ed. 2021, 60, 21404–21411. [Google Scholar] [CrossRef] [PubMed]
- Ozaki, H.; Ikejima, N.; Shimizu, Y.; Fukami, K.; Taniguchi, S.; Takanami, R.; Giri, R.R.; Matsui, S. Rejection of pharmaceuticals and personal care products (PPCPs) and endocrine disrupting chemicals (EDCs) by low pressure reverse osmosis membranes. Water Sci. Technol. 2008, 58, 73–81. [Google Scholar] [CrossRef] [PubMed]
- Ngawhirunpat, T.; Panomsuk, S.; Opanasopit, P.; Rojanarata, T.; Hatanaka, T. Comparison of the percutaneous absorption of hydrophilic and lipophilic compounds in shed snake skin and human skin. Pharmazie 2006, 61, 331–335. [Google Scholar] [PubMed]
- Lin, H.; Huang, L.; Gao, Z.; Lin, W.; Ren, Y. Comparative analysis of the removal and transformation of 10 typical pharmaceutical and personal care products in secondary treatment of sewage: A case study of two biological treatment processes. J. Environ. Chem. Eng. 2022, 10, 107638. [Google Scholar] [CrossRef]
- Bui, T.X.; Pham, V.H.; Le, S.T.; Choi, H. Adsorption of pharmaceuticals onto trimethylsilylated mesoporous SBA-15. J. Hazard. Mater. 2013, 254–255, 345–353. [Google Scholar] [CrossRef] [PubMed]
- Matsui, Y.; Nakao, S.; Sakamoto, A.; Taniguchi, T.; Pan, L.; Matsushita, T.; Shirasaki, N. Adsorption capacities of activated carbons for geosmin and 2-methylisoborneol vary with activated carbon particle size: Effects of adsorbent and adsorbate characteristics. Water Res. 2015, 85, 95–102. [Google Scholar] [CrossRef]
Figure 1.
Schematic diagram of the synthesis of bio−27 and its derivatives, bio−C materials.

Figure 2.
(a) PXRD patterns of IISERP−MOF−27 and its (b) derived carbon materials, which are pyrolyzed at temperatures ranging from 500 °C to 1000 °C. (c) The nitrogen adsorption and desorption isotherms of bio−27 and bio−C−T. (d) The pore size distribution of the as-prepared samples of bio−27 and bio−C−T (T = 500~1000 °C).

Figure 3.
(a–f) SEM images of bio−27 and bio−C−T. (g,h) HRTEM of bio−C−900.

Figure 4.
Fourier transform infrared (FTIR) spectrum of IISERP−MOF−27−derived carbon which is pyrolyzed at temperatures ranging from 500 °C to 1000 °C.
Figure 4.
Fourier transform infrared (FTIR) spectrum of IISERP−MOF−27−derived carbon which is pyrolyzed at temperatures ranging from 500 °C to 1000 °C.

Figure 5.
(a) Adsorption kinetics curves of bio−C−T. (b) The corresponding fitted pseudo-second-order adsorption kinetics. Reaction conditions: SMX = 10 mg/L, reaction volume = 50 mL, catalyst dosage = 180 mg/L, initial solution pH = 7, temperature = 25 °C, reaction time = 45 min).
Figure 5.
(a) Adsorption kinetics curves of bio−C−T. (b) The corresponding fitted pseudo-second-order adsorption kinetics. Reaction conditions: SMX = 10 mg/L, reaction volume = 50 mL, catalyst dosage = 180 mg/L, initial solution pH = 7, temperature = 25 °C, reaction time = 45 min).

Figure 6.
(a) Adsorption kinetics curves of all materials for SMX in this study; (b) The corresponding pseudo-second-order adsorption kinetic model and Elovich kinetic model were fitted. Reaction conditions: initial concentration of SMX = 10 mg/L, reaction volume = 50 mL, catalyst dosage = 4.5 mg, initial solution pH = 7, temperature = 25 °C, reaction time = 45 min.

Figure 7.
Adsorption isotherm for the removal of SMX over the three materials: active carbon (AC), ZIF−8−C, and bio−C−900. Reaction conditions: initial concentration of SMX = 5~80 mg/L, initial solution pH = 7, temperature = 25 °C, reaction time = 600 min.
Figure 7.
Adsorption isotherm for the removal of SMX over the three materials: active carbon (AC), ZIF−8−C, and bio−C−900. Reaction conditions: initial concentration of SMX = 5~80 mg/L, initial solution pH = 7, temperature = 25 °C, reaction time = 600 min.

Figure 8.
(a) Effect of pH on SMX removal. (b) Zeta-potential of bio−C−900.

Figure 9.
(a) Effect of Kow on diverse micropollutants. (b) Proposed reaction mechanism.


Table 1.
Pharmaceuticals used in this study.
| Full Name | Abbra. | Molecular Weight | Log Kow | Chemical Structures |
|---|---|---|---|---|
| ketoprofen | KP | 257.3 | 3.12 |  |
| antipyrine | AT | 189.1 | −1.55 |  |
| ibuprofen | IBU | 205.1 | 0.45 |  |
| chloramphenicol | CAP | 321.0 | 1.1 |  |
| paracetamol | PC | 180.1 | 1.58 |  |
| sulfamethoxazole | SMX | 254.1 | 0.89 |  |
Table 2.
Calculated surface area (SBET) and porous structures.
| Materials | SBET (m2/g) | Vtotal (cm3/g) | Pore Width (nm) |
|---|---|---|---|
| Bio-27 | 76.5 | 0.054 | 2.890 |
| Bio-27-500 | 90.2 | 0.160 | 3.698 |
| Bio-27-800 | 204.2 | 0.108 | 0.783 |
| Bio-27-900 | 980.4 | 0.496 | 0.852 |
| Bio-27-1000 | 605.3 | 0.294 | 0.783 |
Table 3.
Pseudo-second-order adsorption kinetics fitting values.
| Materials | k (g/mg·min) | Qe (mg/g) | v0 (mg/g·min) | R2 |
|---|---|---|---|---|
| Bio-27-500 | —— | 1.65 | —— | 0.99 |
| Bio-27-800 | 0.0059 | 27.27 | 4.38 | 0.98 |
| Bio-27-900 | 0.031 | 100.85 | 315.29 | 0.93 |
| Bio-27-1000 | 0.0021 | 70.79 | 10.52 | 0.98 |
Table 4.
Langmuir and Freundlich adsorption isotherm model.
| Langmuir Model | Freundlich Model | |||||
|---|---|---|---|---|---|---|
| Sample | Qmax (mg/g) | KL (L/mg) | R2 | KF (mg g−1(L mg−1)1/n) | n | R2 |
| Bio-C-900 | 350.90 | 0.061 | 0.99 | 53.23 | 2.47 | 0.96 |
| AC | 76.96 | 0.025 | 0.98 | 29.79 | 4.03 | 0.82 |
| ZIF-8-C | 26.44 | 0.027 | 0.99 | 10.88 | 4.32 | 0.88 |
Publisher’s Note: MDPI stays neutral with regard to jurisdictional claims in published maps and institutional affiliations. |
© 2022 by the authors. Licensee MDPI, Basel, Switzerland. This article is an open access article distributed under the terms and conditions of the Creative Commons Attribution (CC BY) license (https://creativecommons.org/licenses/by/4.0/).
Share and Cite
MDPI and ACS Style
Meng, Y.; Li, X.; Wang, B. Efficient Removal of Micropollutants by Novel Carbon Materials Using Nitrogen-Rich Bio-Based Metal-Organic Framework (MOFs) as Precursors. Water 2022, 14, 3413. https://doi.org/10.3390/w14213413
AMA Style
Meng Y, Li X, Wang B. Efficient Removal of Micropollutants by Novel Carbon Materials Using Nitrogen-Rich Bio-Based Metal-Organic Framework (MOFs) as Precursors. Water. 2022; 14(21):3413. https://doi.org/10.3390/w14213413
Chicago/Turabian StyleMeng, Yazi, Xiang Li, and Bo Wang. 2022. "Efficient Removal of Micropollutants by Novel Carbon Materials Using Nitrogen-Rich Bio-Based Metal-Organic Framework (MOFs) as Precursors" Water 14, no. 21: 3413. https://doi.org/10.3390/w14213413
Note that from the first issue of 2016, this journal uses article numbers instead of page numbers. See further details here.