Article

Optimization of Ammonia Nitrogen and Phosphorus Removal Performance and Analysis of Microbial Community Structure in Microbial Fuel Cells

1
School of Civil Engineering, Anhui Polytechnic University, Wuhu 241000, China
2
School of Environmental Engineering, Xuzhou Institute of Technology, Xuzhou 221008, China
*
Author to whom correspondence should be addressed.
Water 2022, 14(21), 3412; https://doi.org/10.3390/w14213412
Submission received: 13 August 2022 / Revised: 29 September 2022 / Accepted: 24 October 2022 / Published: 27 October 2022
(This article belongs to the Special Issue Innovation in Biological Wastewater Treatment)

Abstract

:
In order to study the effects of operating conditions on the performance of a microbial fuel cell (MFC) for treating ammonia nitrogen (NH4+-N) and phosphate and the changes in the microbial community under optimized conditions, in this study, the response surface method (RSM) and central composite design (CCD) were used to carry out experiments and construct a model of the system to analyze the influence of the hydraulic retention time (HRT) and initial influent ammonia concentration on NH4+-N and the total phosphorus (TP) removal performance of the MFC, and the changes in the microbial community structure were analyzed. The results showed that: (1) the initial influent ammonia concentration had a greater impact than the HRT; (2) after optimizing the reaction conditions, the actual removal rates of NH4+-N and TP of the system were 94.88% and 59.39% (the predicted values were 90.18% and 56.25%), respectively; and (3) the total number of species in the optimization group decreased, and the richness of the microbial community decreased. The system conducted the orthoselection of the microbial community and optimized the structure of the microbial community. After the optimization, the dominant strains for ammonia and phosphorus removal on the cathode reactor of each system were strengthened at the phylum and genus levels. Under the coaction of the dominant strains, the efficiencies of nitrogen removal and phosphorus removal in the reactor were significantly improved. The performance optimization of and microbial community change in NH4+-N and TP removal in the MFC system were studied using RSM, which was helpful to improve the effect of nitrogen and phosphorus removal.

1. Introduction

From point source and non-point source pollution, too much nitrogen and phosphorus in water bodies caused by excessive emissions lead eutrophication, algae and other plankton to grow rapidly. Dissolved oxygen (DO) in water is rapidly declining, resulting in the deterioration of water quality, the death of fish and other organisms, the ecosystem degradation of the water environment and threats to human health [1,2,3]. Water pollution and the energy crisis have become the focus of global attention. Therefore, the development of wastewater treatment technology should be continuously promoted [4,5]. Exploring new efficient and low-consumption phosphorus and nitrogen removal technologies and devices has become a research hotspot [2,3].
A microbial fuel cell (MFC) is a bioreactor that uses microbial biochemical reactions to convert chemical energy from various organic substrates within a system into electrical energy. An MFC can remove organic pollutants from wastewater and realize the resource utilization of pollutants. They have been widely studied and practiced in animal wastewater, domestic wastewater, dyeing wastewater, etc., showing excellent characteristics [5,6,7,8,9,10,11,12]. However, the performance of an MFC is affected by many factors, such as the structure of the MFC, electrode material, pH, substrate concentration, temperature, reaction time, external resistance, reactor volume and microbial community. The stability and electrical performance of an MFC lead to its inability to be applied in large-scale engineering [1,5,7,8,11,12]. Among them, cost reduction and optimal design are important research directions to expand the scale and commercialization of MFCs.
The optimization design of MFCs has become a research hotspot. The performance of an MFC was improved by optimizing the pH, anode biofilm, substrate concentration and DO in the cathode [5,13,14,15]. By adjusting the DO of the cathode, Tao et al. found that with the decrease in the DO of the cathode, the electron acceptor in the cathode chamber gradually diminished, and the electric performance of the system decreased sharply. The nitrogen removal effect was good, but the effect on the removal of TP and COD did not change to a large extent [16]. Zhao et al. found that temperature, pH and p-nitrophenol had significant effects on the removal of p-nitrophenol using an MFC system and found that the removal performance of the system was optimal when the temperature was 34.63 °C, pH was 7.4 and the initial p-nitrophenol was 126.96 mg/L [17].
Among the many optimization methods, the response surface methodology (RSM) is a statistics-based approach that optimizes the experimental process with a limited number of implementations to save money and time by influencing the experimental design as well as the interaction between independent and non-independent variables [8,13,15]. It is widely used in experimental design, the development of new water treatment technology, system parameters optimization and other processes. Feng et al. constructed an electrobiological integrated reactor (EBIR) to treat ibuprofen wastewater. The RSM was used to optimize the operation parameters, such as current density (CD), hydraulic retention time (HRT) and influent ibuprofen concentration, and the microbial community structure of the system was studied and analyzed under optimal conditions [18]. Sugumar et al. used the response surface method to study the influence of pH, substrate concentration and anode electrode material on the performance of a 300 mL tubular microbiofuel cell. Under optimized conditions, the pH was 7 and the substrate concentration was 75%, and a graphite rod was used as an electrode material to achieve the maximum power density of the system [19]. Salar-Garcia et al. used the RSM to optimize the electrical performance of an MFC based on human urine treatment using the anode area, external resistance and film thickness, and found that the model was an effective tool, which provided important information for the efficient optimization of the MFC [15].
However, the influence relationship of multiple operating parameters on the system is still lacking [1]. The influent ammonia concentration and HRT were the main factors affecting the performance of nitrogen and phosphorus removal [1,20]. The process of nitrogen and phosphorus removal was a complex one and depended on different operating conditions [1,21]. The increase in the initial ammonia concentration could inhibit the system’s pollutant treatment and power generation performance [1]. It also had a certain inhibitory effect on ammonia-oxidizing bacteria (AOB) and nitrite-oxidizing bacteria (NOB) [22]. The HRT was an important parameter in sewage design, which played an important role in the design and operation of the MFC system, thus directly affecting its performance [23,24]. The HRT was one of the most important factors in determining the contact time between pollutants and microorganisms [4,24]. The electrons provided by electrogenic bacteria were essential to improving the removal efficiency of organic pollutants from the MFC [1,16]. Therefore, the HRT of an MFC should be designed correctly [24,25]. Most previous studies have focused on the effects of the initial ammonia concentration and HRT alone or with other operating factors on MFCs, but there are few studies on the performance of the MFC system under the two operating factors of the initial ammonia concentration and HRT, and the effects of both operating parameters on microbial communities. In order to further study the influence of operating conditions on the operation of an MFC, the RSM was used to model and optimize the parameters of the MFC. By applying these methods, the relationship between the factors affecting MFC operation and its performance can be effectively identified [7,8].
In this study, a two-compartment MFC was constructed to study the effects of the influent ammonia concentration and HRT on the NH4+-N and TP removal performance of the system. The RSM was used to design and optimize the experiment, and a central composite design (CCD) was used to design the experiment. Design-Expert 11.0 software was used to model the system. The feasibility and rationality of the mathematical model were tested through analysis of variance (ANOVA), and the operating parameters of the system were optimized in order to optimize the NH4+-N and TP removal performance of the MFC. At the same time, the effects of operation parameters on the community structure of the system were tested under optimal operating conditions. This study helps us to better understand the effects of different operating conditions on NH4+-N and TP removal in MFC and provides a certain theoretical reference for the performance optimization and engineering applications of MFCs.

2. Materials and Methods

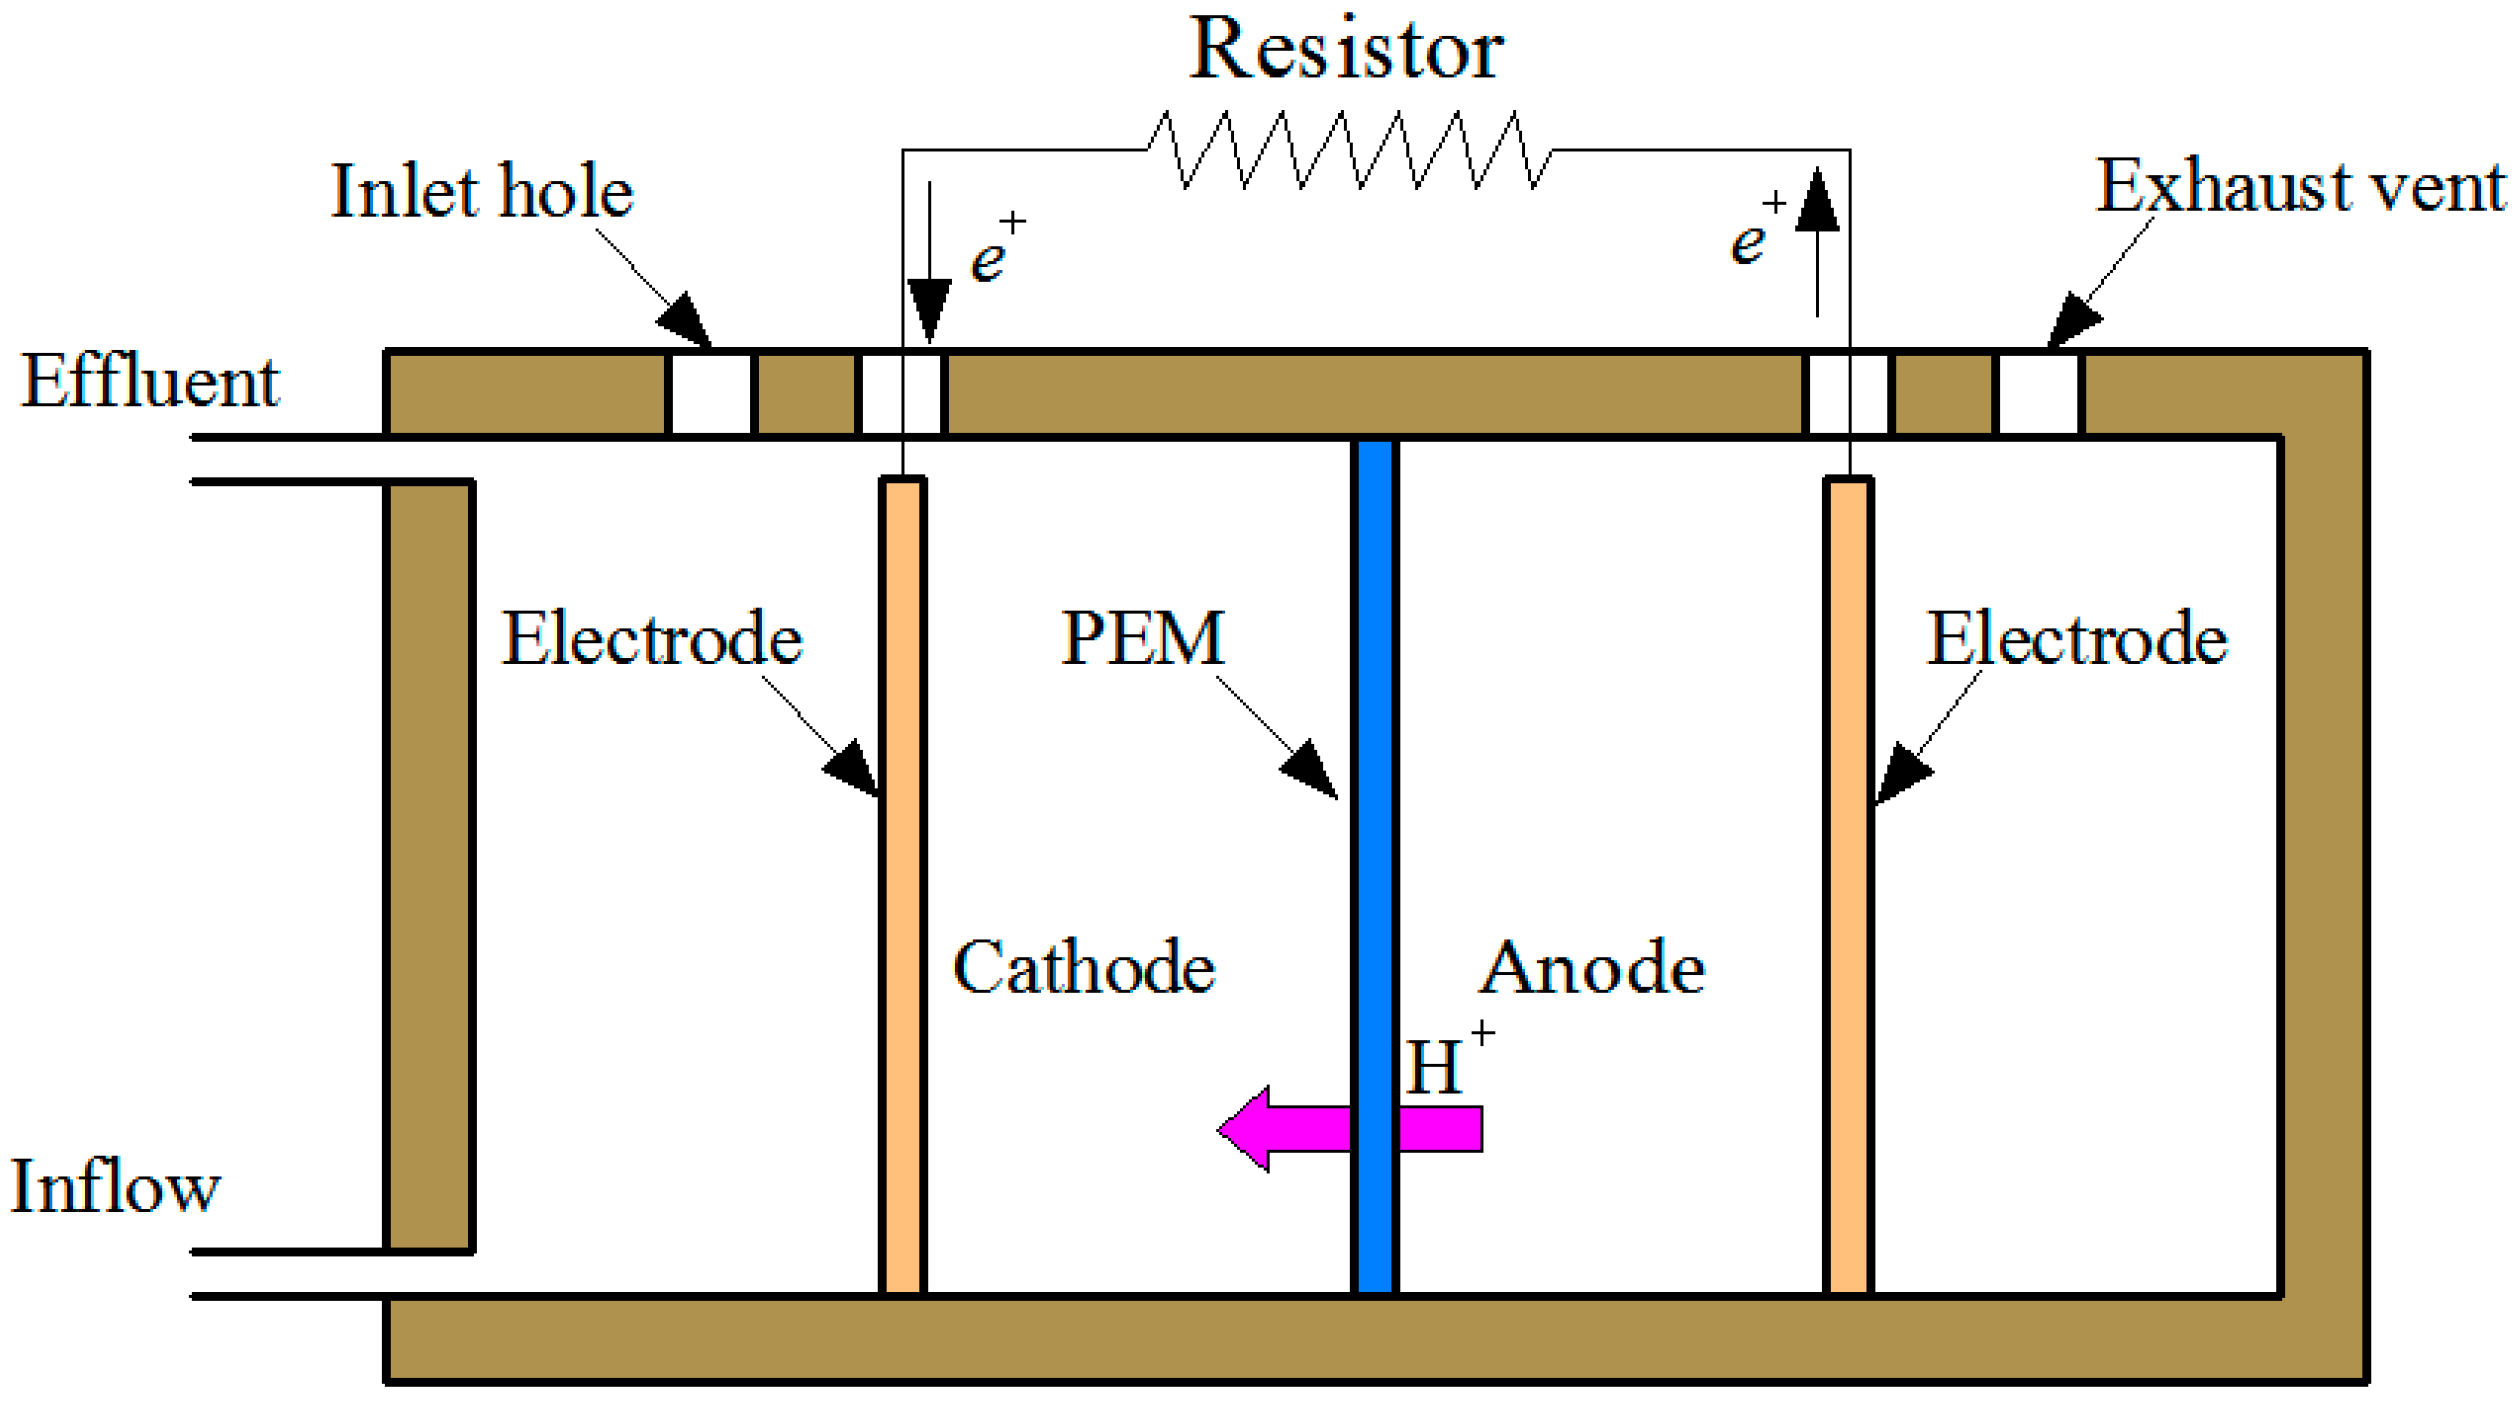
2.1. Experimental Facility

The construction of the two-compartment MFC is shown in Figure 1. The cathode and anode chambers of the MFC were composed of Plexiglas, and the working volume of each studio (6 cm × 6 cm × 5 cm) was 180 mL. The cathode and anode electrodes were composed of 3.5 cm × 3.5 cm carbon cloth (WOS1009, Clean Energy Technology Co., Ltd., Taichung, China). The cathode chamber was aerated and oxygenated with an air pump. Each working chamber had two holes at the top for exhaust and electrode placement. The cathode and anode compartments were pretreated before use with a proton exchange membrane (PEM) (N-117, Dupont Inc., Wilmington, NC, USA) with an effective area of 9 cm2 at the junction. The copper wire between the two electrodes and a 200 Ω fixed resistor were connected to form a closed circuit, and the whole device ran at room temperature. When the system voltage dropped below 50 mV, the new anode was replaced with medium [14].

2.2. Wastewater

Throughout the whole experiment, synthetic wastewater was used. The synthetic wastewater was prepared by adding 469 mg/L C6H12O6, 750 mg/L NaHCO3, 94.4~286.9 mg/L (NH4)2SO4, 8.8 mg/L K2HPO4, 2.5 mg/L KH2PO4, 120 mg/L CaCl2·H2O and 2.5 mg/L MgSO4·7H2O. Trace metals such as Fe, Ni, Mn, Zn, Co, Cu and Mo were added as per the composition suggested by Pinto et al. (2011) [26]. All reagents were analytically pure. The synthetic wastewater concentrations of COD, NH4+-N and TP were 500 mg/L, 20~80 mg/L and 20 mg/L, respectively [9,27,28].
The anode and cathode of each reactor were inoculated with 1/3 volume of sludge. Aerobic and anaerobic sludge was obtained from a sewage treatment plant in Wuhu City, China. The system was initially acclimated, and the acclimation was considered successful until the system produced stable electricity (above 200 mV), which lasted for about one month. Then, batch testing began.

2.3. PEM and Electrode Pretreatment

All the electrodes were first washed with a small amount of water; then, they were washed and soaked with 1 mol/L HCl and 1 mol/L NaOH, respectively, through a preconfigured hydrochloric acid solution for 2 h; and finally, they were washed with deionized water again and soaked for at least 6 h before taking out for later use. PEMs were immersed in the middle of 3~5% H2O2 at 80 °C for 1 h, rinsed with distilled water 3 times, boiled with 5% dilute sulfuric acid (mass ratio) at 80 °C for 2 h and finally cleaned with deionized water until pH was neutral, cool and dry for use.

2.4. Modeling and Optimization

In this study, the central composite design (CCD) method in the RSM was used to design the test scheme. The center points of the RSM were tested, and three levels were set for each factor. The center points were repeated five times to test the repeatability of the test and the rationality of the model so as to reduce the test error. The quadratic response surface model was constructed by using Design-Expert 11.0 (Stat-Ease. Inc., Minneapolis, MN, USA), and the results were analyzed. According to the optimal scheme, the relationship between the experimental variables and the response value can be described using the following polynomial [7,14,29,30].
y = β 0 + i = 1 k β i x i + i = 1 k β i i x i 2 + j = 2 k i = 1 j 1 β i j x i x j + ε
where y represents the response value. xi and xj are the variables. β0 is a constant coefficient. βi, βij and βii are the coefficients of the first term, the second term and the second term, respectively. k is the number of independent parameters. ε is the random error. The terms in front of the equation indicate exactly synergistic action, and the negative sign indicates antagonistic action [13,14,31].
Two factors, HRT and initial influent ammonia concentration, were selected, and the system performance of removing NH4+-N and TP was taken as the response values. According to the CCD principle, the independent variables (low, medium and high) and their level settings (−, 0, +) in the RSM in this study are shown in Table 1. The range and level of variables were comprehensively determined based on preliminary test results and the relevant literature [3,9,28,32]. The experimental design and operation results of CCD are shown in Table 2.
Based on the control variables and response values, all experimental results in Table 2 were run, and the model prediction system of the initial influent ammonia concentration and HRT was constructed to predict the removal performance of NH4+-N and TP.

2.5. Methods for Wastewater Quality Testing and Microbial Sequencing

According to standard methods, the concentration of NH4+-N and TP in the samples were measure by using a visible spectrophotometer (V-1100D, Shanghai Meipuo Instrument Co., Ltd., Shanghai, China) at wavelengths of 420, and 700 nm, respectively [18,33]. All the above parameters were measured three times through repeated sampling, and all test results were averaged. The relative error of test results was less than 5%.
The microbial community was extracted from the cathode of each system after 85 d of operation. The diversity and community structure of microorganisms were tested using 16S rDNA (V3–V4). Amounts of 30 ng of qualified genomic DNA sample and corresponding fusion primers were used to configure the PCR reaction system, and the corresponding PCR reaction parameters were set for PCR amplification. Agencourt AMPure XP magnetic beads were used to purify the PCR amplification products, dissolved in Elution Buffer, and labeled to complete the library construction. The Agilent 2100 Bioanalyzer (Agilent Technologies Inc., Palo Alto, CA, USA) was used to detect the fragment range and concentration of the library. The qualified libraries were detected and sequenced. Reads were spliced into Tags through the Overlap relationship between reads, and OTU was clustered in Tags to carry out OTU species annotation on OTU.

3. Results and Discussion

In this section, based on the experimental results, the Design-Expert 11.0 software was used to build the model, and ANOVA was used to validate the accuracy and rationality of the model. A three-dimensional (3D) response surface diagram and two-dimensional (2D) contour analysis diagram were used to analyze the interaction between factors combined with the relevant literature, the optimization results were verified, and finally the microbial diversity and community structure of the system were analyzed.

3.1. Construction and Optimization of NH4+-N Removal Rate Model

Analysis of variance (ANOVA) was used to statistically test the model, and the results of ANOVA are shown in Table 3 and Table 4.

3.1.1. Analysis of Variance and Validation of the NH4+-N Removal Model

All experimental results in Table 2 were run, and the model prediction system of the initial influent NH4+-N and HRT was constructed to predict the removal performance of NH4+-N. The experimental results were fitted through linear polynomial regression using the Design-Expert 11.0 software, and the linear equation of the ammonia removal model was obtained through software analysis:
Y1 = +67.741 + 11.183 × X1 − 11.253 × X2
In the formula, Y1 is the removal rate of NH4+-N, X1 is the HRT and X2 is the initial influent ammonia concentration.
From the NH4+-N removal model shown in Equation (2), it was found that the coefficient of X2 was larger than that of X1, indicating that the initial influent ammonia concentration had a greater impact on the removal rate of NH4+-N in the system than the HRT. In the model equation, X2 had a negative sign, indicating that the increase in the influent ammonia concentration had an antagonistic effect on the system treatment of NH4+-N. To further check the rationality and validity of the model, ANOVA was conducted on the model, and the results are shown in Table 3.
As shown in Table 3, the fitting model of the F-value was 16.33, which showed that the model for NH4+-N in terms of the wastewater degradation prediction had a good effect, and the p-value was less than 0.0001, showing that the model was reliable [13]. The significant levels of the two factors (p < 0.05) indicated that the HRT and initial influent ammonia concentration were the key factors affecting the performance of NH4+-N removal in the system. The coefficient of variation (C.V. %) was 11.59, and the signal-to-noise ratio was 11.90 (>4), which proved that the test had a high accuracy. The R2 of the fitted model was 0.77, the adjusted R2 was 0.72 and the predicted R2 was 0.53. The difference between the two was less than 0.2, indicating the rationality of the model construction.
The influence of the two factors on the removal of NH4+-N from wastewater in the system was slightly different, and the order of significance was as follows: initial influent ammonia concentration >HRT.

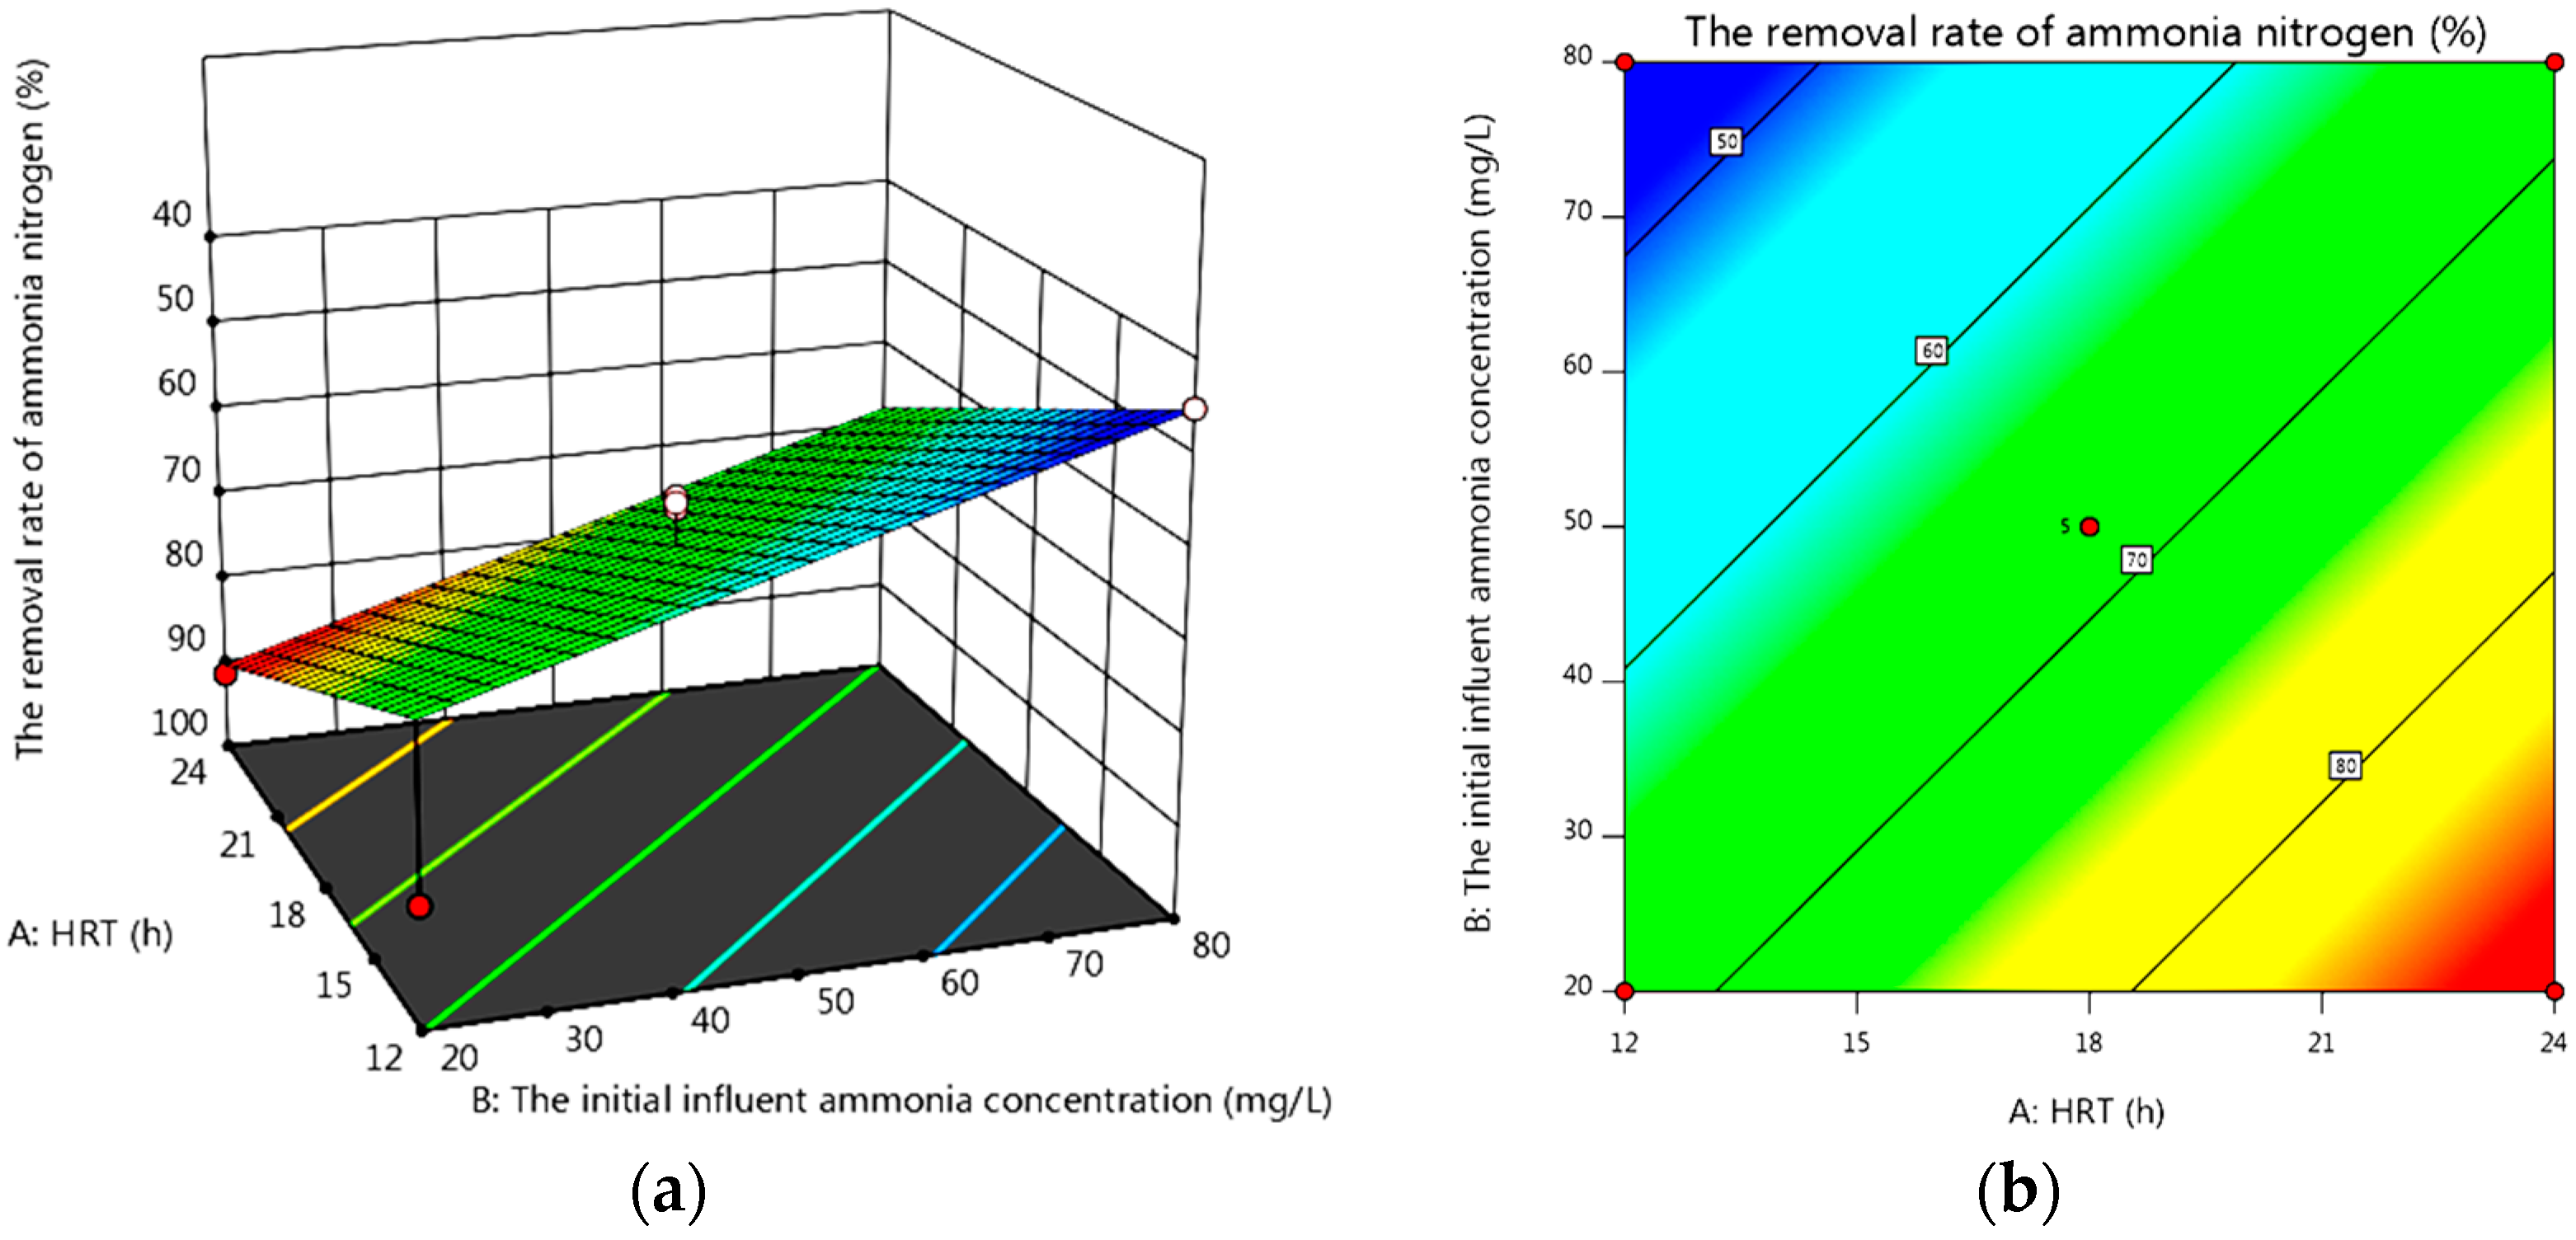
3.1.2. Effect of the Interaction of Factors and Optimization of the System

After the model was verified, the interaction of factors was studied to analyze and optimize the performance of the system in treating NH4+-N. The 3D response surface helped to visualize the interaction between variables [29]. The 3D response surface and 2D contour diagram of the influent ammonia concentration and HRT on the system treatment of NH4+-N are shown in Figure 2.
It can be seen from Figure 2a that both the HRT and initial influent ammonia concentration had significant effects on the system’s NH4+-N treatment performance. With the increase in the initial influent ammonia concentration, the removal rate decreased, and with the increase in the HRT, the system treatment efficiency increased. It can be seen from Figure 2b that the two operating factors had significant effects on the performance of the system in treating NH4+-N. The COD/N ratio in wastewater treatment was an important parameter that directly affected the nitrification process of the system. Nitrifying bacteria are autotrophic, and a higher amount of organic matter can promote the growth of heterotrophic bacteria and inhibit the growth of nitrifying bacteria [34]. When the COD/N ratio was greater than 7, nitrification/denitrification was feasible. However, at a very low COD/N ratio, a greater nitrogen removal effect could be achieved. When COD was 500 mg/L and ammonia concentration was 40 mg/L, the maximum COD removal rate was 87.2%, and the higher ammonia removal efficiency was approximately 95%. Moreover, increasing the initial influent ammonia concentration had a significant negative effect on the system’s removal effect, which may limit the simultaneous nitritation/denitritation (SND) [1,32]. With the increase in the initial NH4+-N concentration (free ammonia nitrogen (FAN) > 40 mg/L), the performance of the system ammonia removal decreased significantly [1,21]. When the HRT increased from 12 h to 24 h, the contact time between the substrate and microorganisms increased, which was conducive to the removal of pollutants [4]. When the HRT was 24 h, the initial influent ammonia concentration was 20 mg/L, and the system’s NH4+-N removal rate was 90.18%.

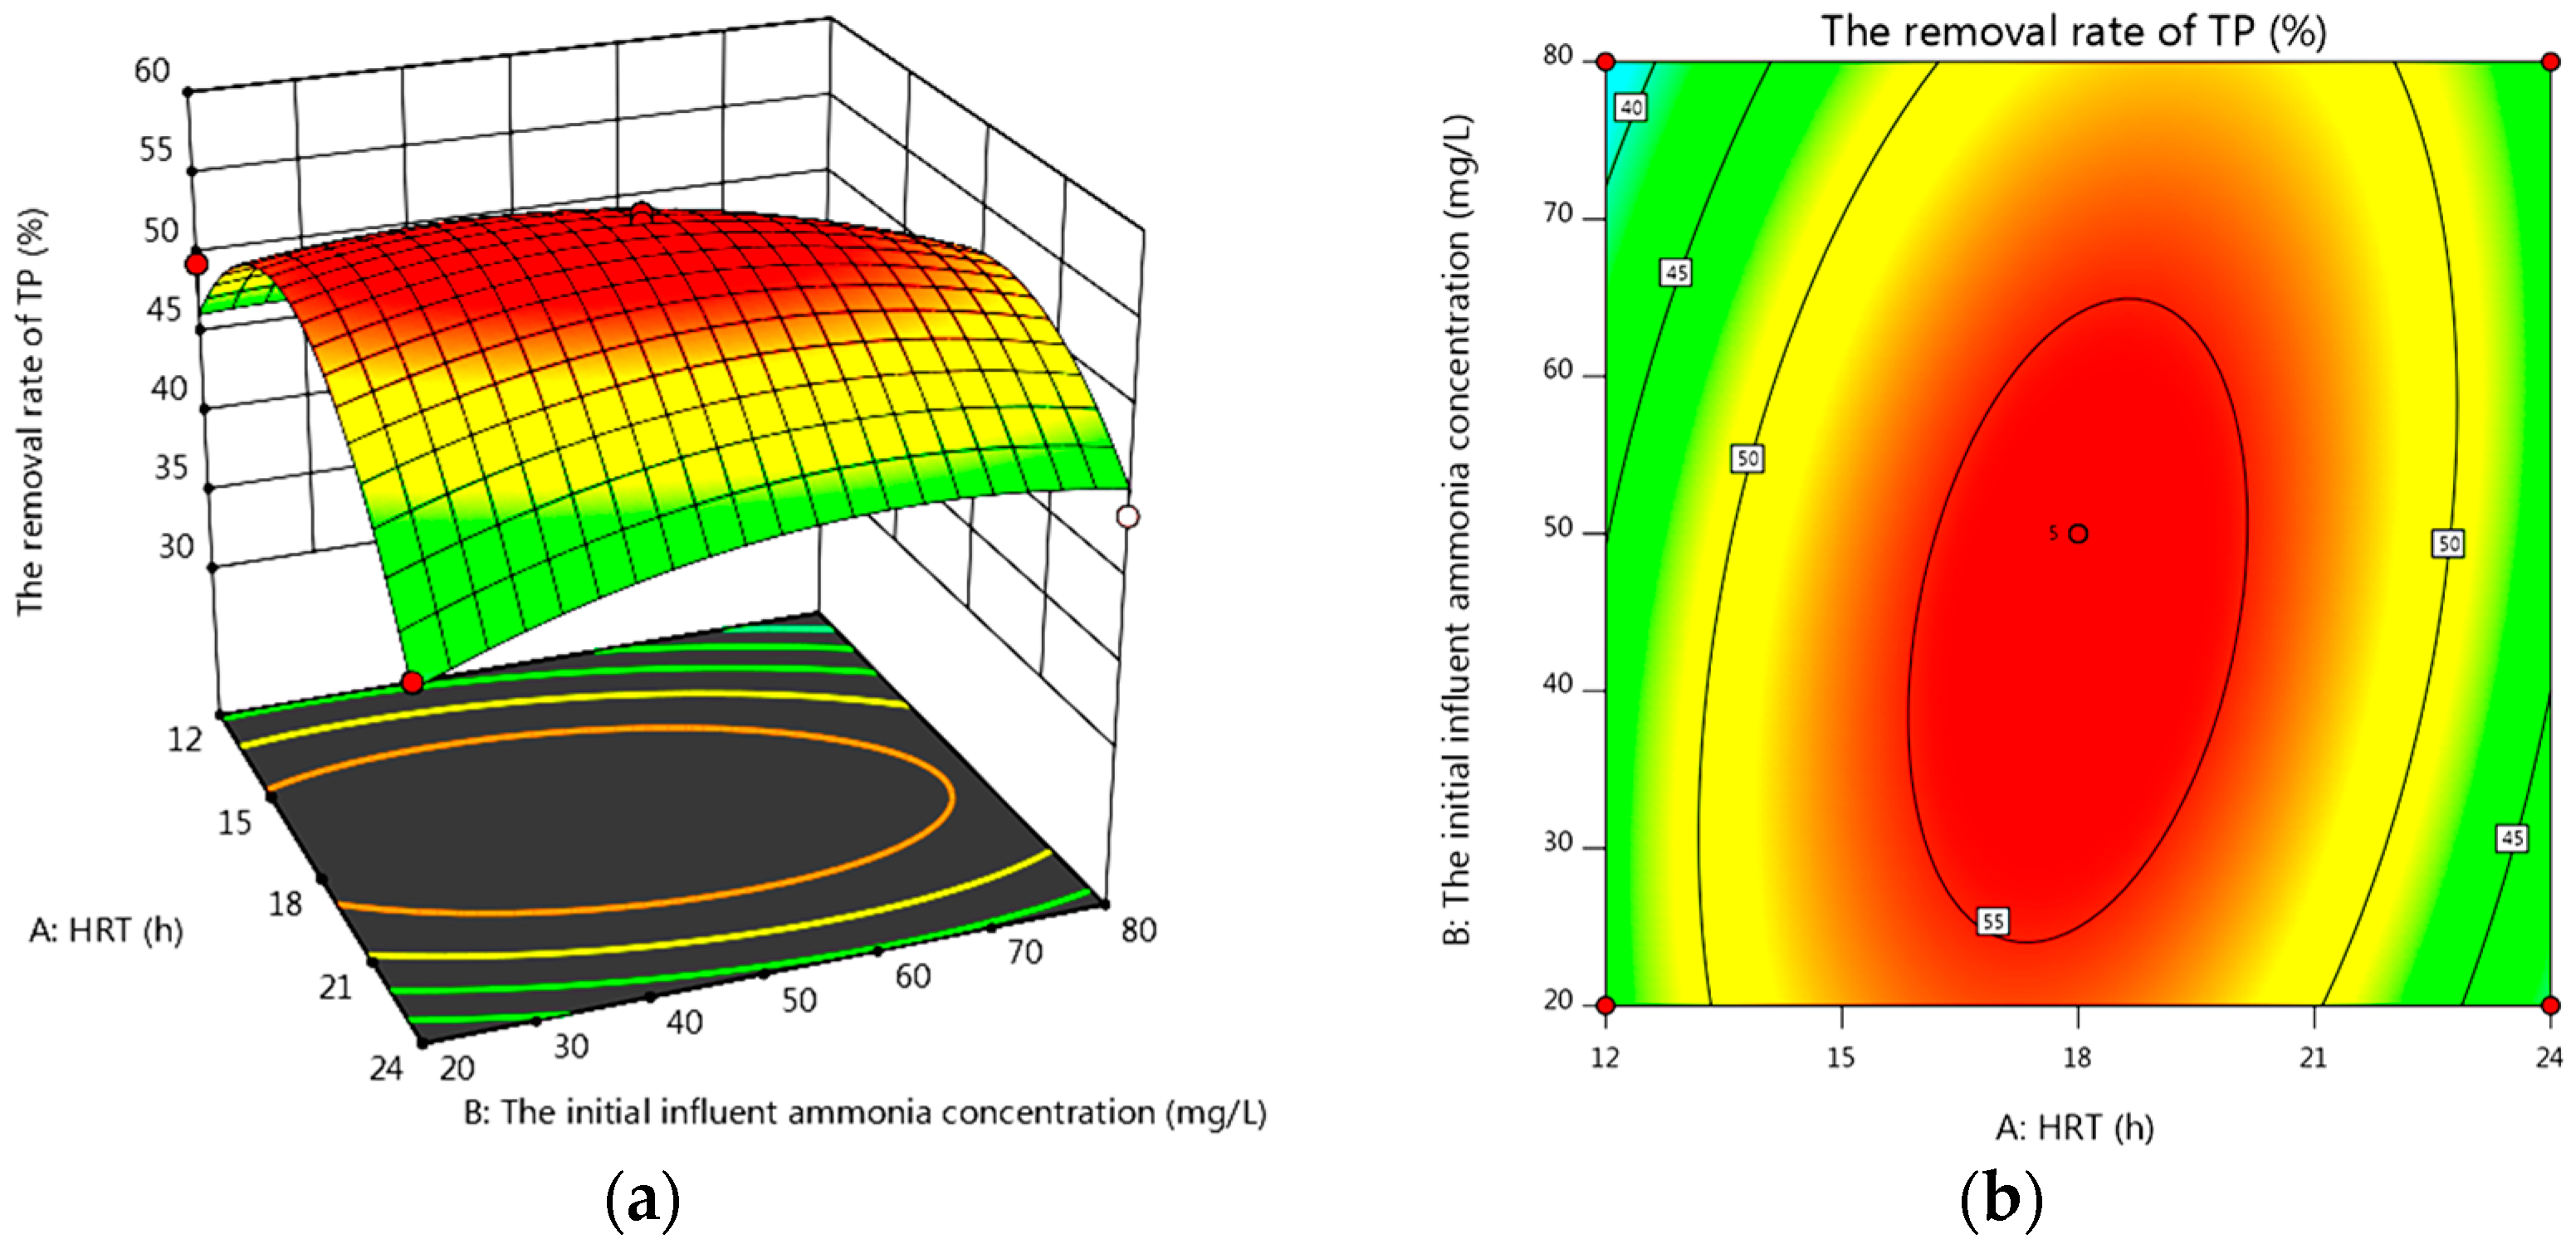
3.2. Construction and Optimization of TP Removal Rate Model

Similar to the modeling of the NH4+-N removal rate, the polynomial regression fitting analysis was carried out through the Design-Expert 11.0 software to obtain the equation of the test.

3.2.1. Analysis of Variance and Validation of the TP Removal Rate Model

Y2 = +56.152 + 0.605 × X1 − 1.085 × X2 + 3.380X1 × X2 − 10.671X12 − 2.956X22
In the formula, Y2 is the removal rate of TP, X1 is the HRT and X2 is the initial influent ammonia concentration. It can be seen from the above equation that the performance of the initial influent ammonia concentration in the system’s removal of TP was greater than the HRT. The analysis of variance of this model is shown in Table 4.
As shown in Table 4, the F-value of the fitted model was 41.97, indicating that the model had a good effect on the prediction of TP degradation in sewage, and the p-value was less than 0.0001, indicating that the model was reliable [13]. The coefficient of variation (C.V. %) was 4.26%, and the signal-to-noise ratio was 16.07 (>4), which proved that the test had a high accuracy. The R2 of the fitted model was 0.97, the adjusted R2 was 0.94, and the predicted R2 was 0.78; the difference between them was less than 0.2. The R2 value, which was close to 1, indicated that the constructed model had a high fitting degree to the actual data [13,18], indicating the rationality of the constructed model without a significant lack of fitting, and the model had a satisfactory R2 value for the removal of TP. Among the two factors, the difference in TP removal in the system water was slightly different, and the order of significance of the two factors was as follows: initial influent ammonia concentration >HRT.

3.2.2. Analysis of Variance and Validation of the TP Removal Rate Model

The 3D response surface and 2D contour diagram of influent ammonia concentration and HRT on the TP removal rate in the system are shown in Figure 3.
According to Figure 3a, with the increase in the HRT and initial influent ammonia concentration, the system’s removal rate of TP was first increased and then decreased. When the HRT was 18 h and the initial influent ammonia concentration was approximately 50 mg/L, the system’s removal rate of TP reached the maximum. This may be due to the effect of operation factors on the removal performance, microbial activity and community of the system. After a certain time of acclimation, the colony structure of the system was acclimated and changed, and the synergistic effect of the dominant strains enhanced the TP removal performance of the system. The appropriate extension of the HRT was beneficial for microorganisms to make full use of the organic matrix and promote microbial growth, thus enhancing the treatment performance of the system. However, when the HRT was too long, the treatment performance of the system was inhibited [4,24]. It can be seen from Figure 3b that the initial influent ammonia concentration had a larger effect on the system’s performance of treating TP than the HRT, which was consistent with the equation of the model construction, and a good interaction between the two factors was found [8]. When the HRT was 17.99 h and the initial influent ammonia concentration was 44.48 mg/L, the theoretical value of the TP removal rate of the system reached 56.25%.

3.3. Optimization of the System and Verification of the Model

The significance of the modeling process and its results was that it was possible not only to demonstrate the influence of operating parameters but also to predict the performance of the system under various operating conditions [8,13]. The objective of the verification and optimization experiment was to optimize the performance of NH4+-N and TP removal of the system by optimizing the operating conditions, and reduce the HRT at the same time, so as to reduce the time and power consumption in the actual treatment. By 2.2, the model was built, the system was optimized to obtain the best operating conditions and verification tests were carried out under the optimal conditions.
The theoretical maximum removal rates of NH4+-N and TP were 90.18% and 56.25%, respectively; when the HRT was 24 h, the initial influent ammonia concentration was 20 mg/L and when the HRT was 17.99 h, the initial influent ammonia concentration was 44.48 mg/L. Under the conditions in which the HRT was 24.00 h, the initial influent ammonia concentration was 20 mg/L, and when the HRT was 18.00 h, the initial influent ammonia concentration was 45 mg/L, and the system was optimized. After the stable operation of the system, the system was continuously tested for 3 days, and the average value was taken. The experimental results are shown in Table 5.
It can be seen from Table 5 that the actual removal rates of NH4+-N and TP in the optimized system were 94.88% and 59.39% (the predicted values were 90.18% and 56.25%), and the data errors were all within 5%, indicating that the expected experimental results were achieved and the accuracy of optimization of the constructed model was verified.

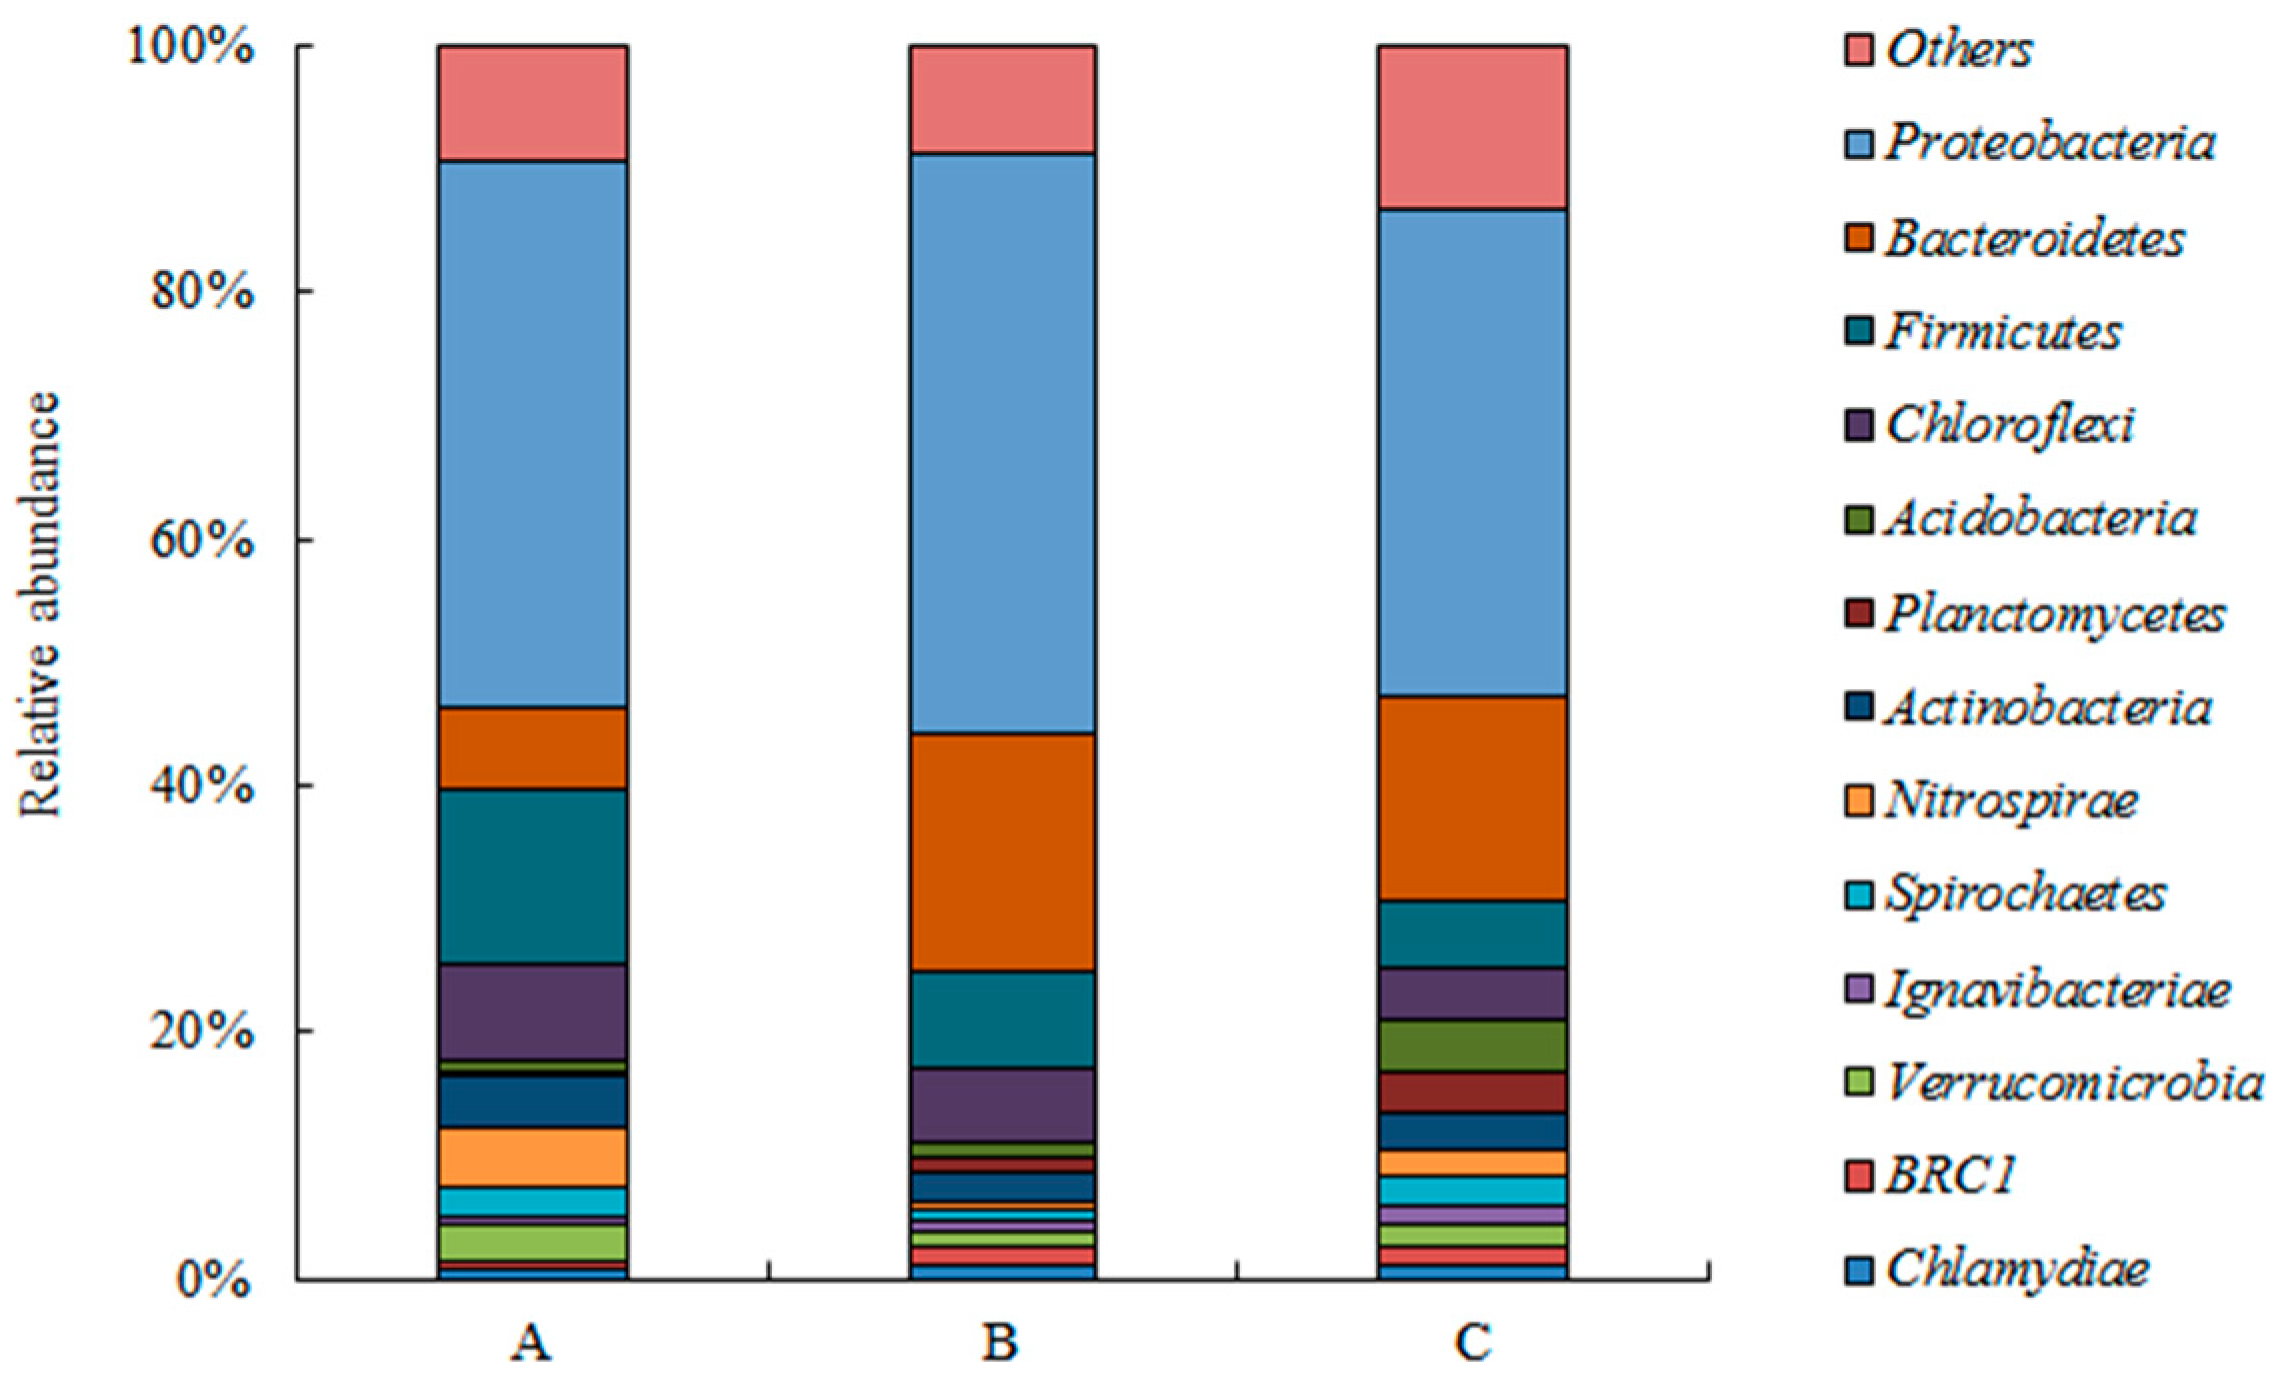
3.4. Analysis of Microbial Diversity and Community Structure

Pyrosequencing technology was used to further compare the microbial diversity and community structure of each system under the operating conditions. Groups A and B were optimal for the NH4+-N and TP removal rates, respectively. The operating conditions of the two systems are shown in Table 5. Group C was the control group, the operating condition for the HRT was 12 h, the initial influent ammonia concentration was 80 mg/L, and the operation time of each system was approximately 85 d. During stable operation, samples were taken, and the biological colonies of each system were detected. The experimental results and analysis are as follows.

3.4.1. Microbial Diversity Analysis of Each System

The Chao index was the estimated OTU number, which was used to characterize the richness of the microbial community. ACE indicated the number of species. The Shannon and Simpson indices were the alpha diversity indices of microbial communities. The higher the value of the Shannon index, the higher the community diversity, while the higher the value of the Simpson index, the lower the community diversity.
According to the data in Table 6, under the condition of more than 99% sample library coverage, the Chao, ACE and Shannon values of experimental groups A and B decreased after optimization, while the Simpson value increased. The changes in data indicated that after the optimization of the system operation parameters, the total number of species in systems A and B decreased, and the richness of the microbial community decreased. The system made an orthoselection of the microbial community and optimized the structure of the microbial community.
Experiments were performed on three groups of experimental samples and analyzed at the phylum and genus levels (as shown in Figure 4 and Figure 5).

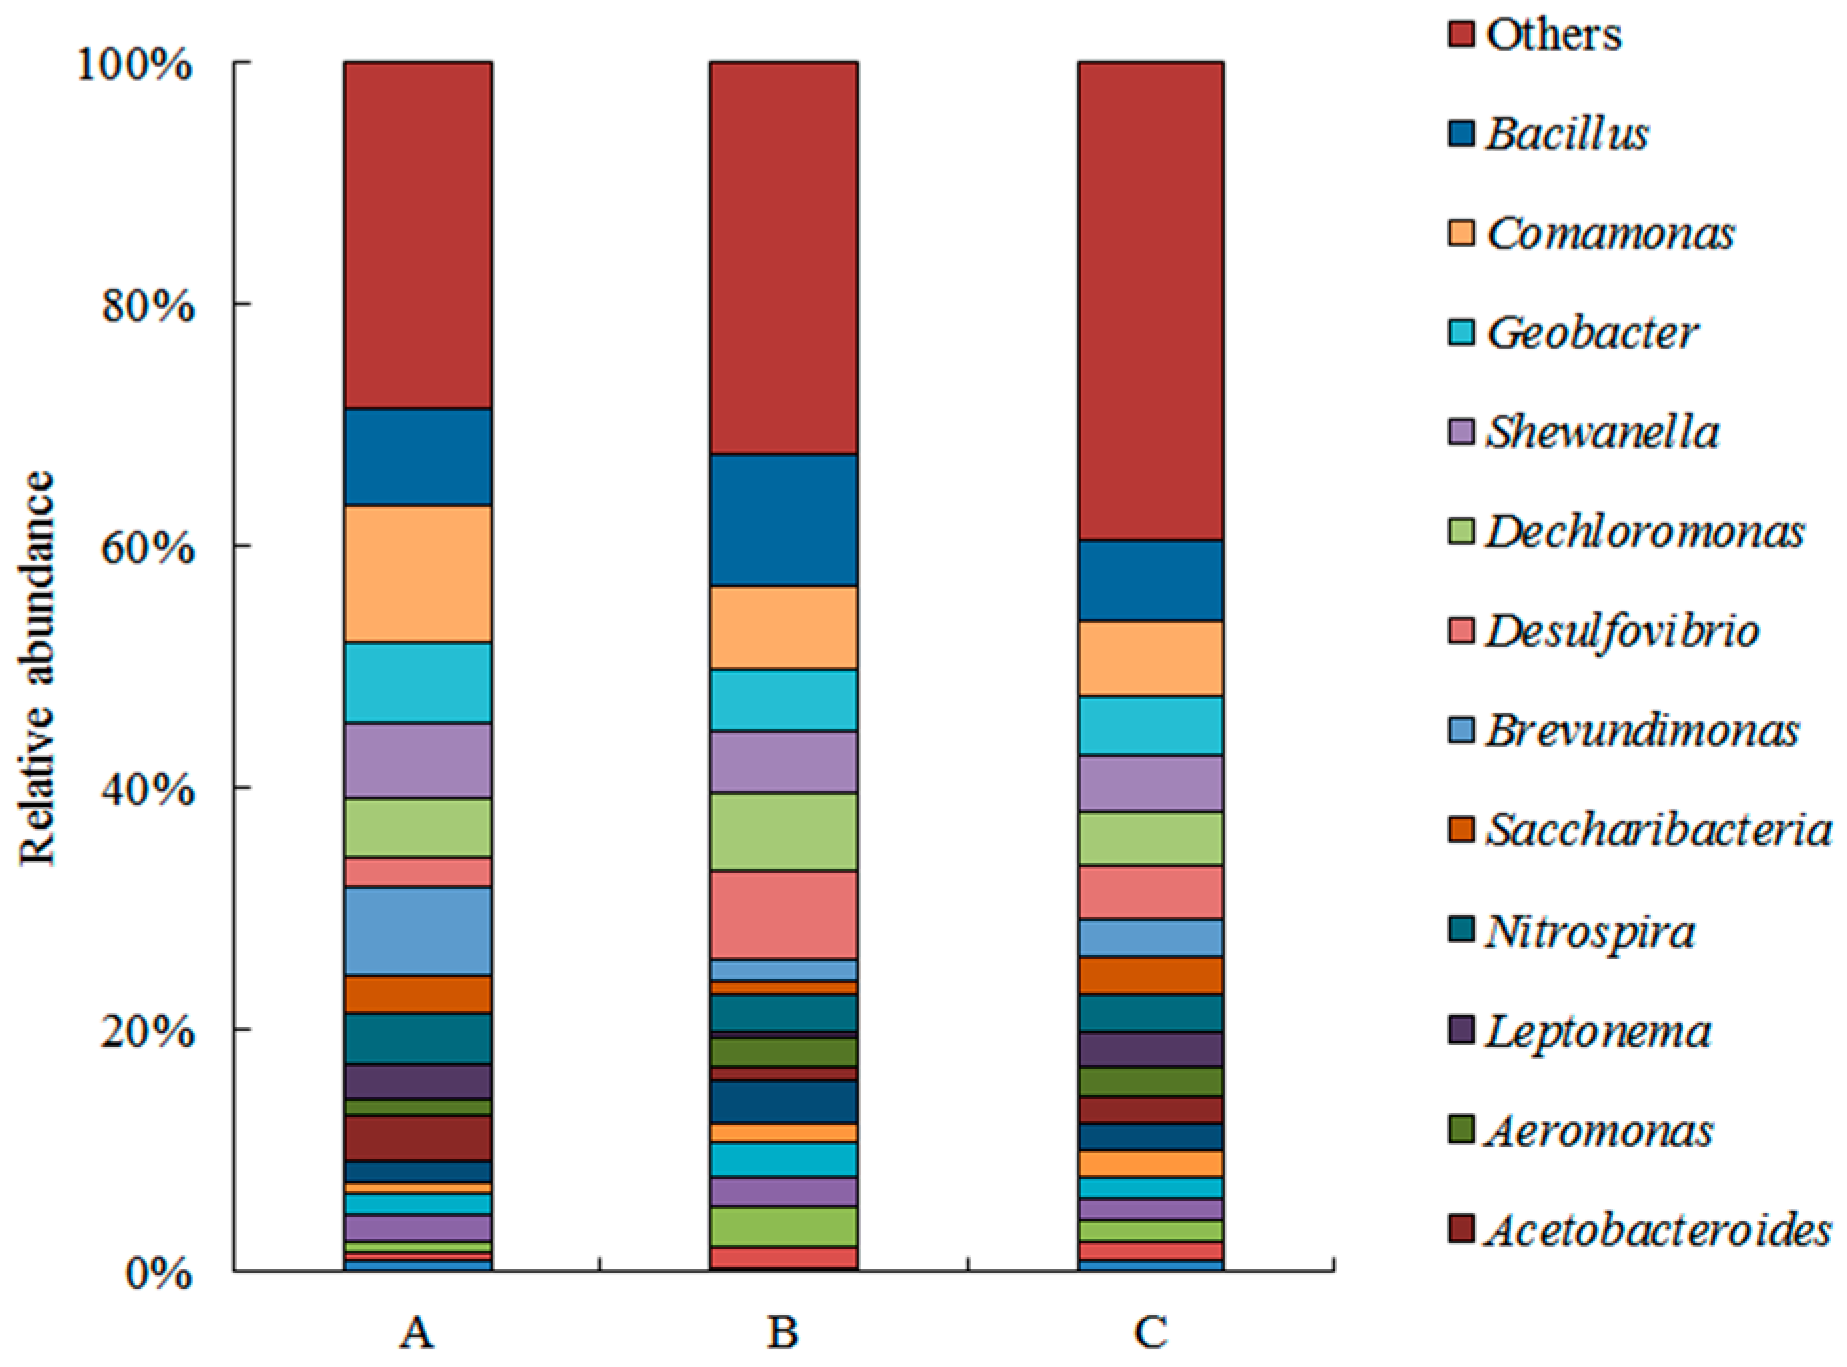
3.4.2. Analysis of Microbial Community Structure

Figure 4 shows the changes in the microbial community structure in the cathode chamber of each system under the best working conditions at the phylum level. The main dominant bacterial groups in experimental group A included Proteobacteria, Firmicutes, Chloroflexi, Bacteroidetes and Nitrospirae. Compared with group C (the control group), Proteobacteria increased from 39.68% to 44.41%, Firmicutes increased from 5.62% to 14.16%, Chloroflexi changed from 4.27% to 7.87%, Bacteroidetes changed from 16.36% to 6.50% and Nitrospirae increased from 2.34% to 4.97%. The dominant bacterial groups in experimental group B included Proteobacteria, Bacteroidetes, Firmicutes and Chloroflexi. Compared with group C, Proteobacteria increased from 39.68% to 47.02%, Bacteroidetes from 16.36% to 19.20%, Firmicutes increased from 5.62% to 8.01% and Chloroflexi increased from 4.27% to 5.91%.
Compared with control group C, the Chao value and ACE value of groups A and B decreased significantly. The results of the phylum comparison showed that the abundance of the community in systems A and B decreased significantly after optimization. As the initial influent ammonia concentration increased, the adaptability of the microorganisms changed, AOB and NOB bacteria were inhibited [22] and properly prolongating the HRT was conducive to microorganisms making full use of organic matter for growth and reproduction [4,24]. Therefore, by optimizing the initial concentration of NH4+-N and HRT, the adaptability of microorganisms changed. The proportion of dominant flora increased after systematic directional selection, which was conducive to improving the system’s function of removing NH4+-N and TP. Within the dominant bacterial strains, Proteobacteria was the largest group of bacteria. Most of the microorganisms involved in cathodic denitrification belong to this group [35], including most of the bacteria that degrade organic matter, remove phosphorus and remove heavy metals [36] and also have a strong ability to provide electrons to external electrons. Nitrospirae is one of the phyla required for nitrification [37]. Chloroflexi, as a facultative anaerobe, can degrade complex organic compounds and also participate in denitrification in the absence of oxygen [38]. In Proteobacteria, Bacteroidetes are the main organic phosphate-mineralizing bacteria in agricultural production [39,40]. Firmicutes are a major group in MFC systems that have been reported in many studies [41] and other electrochemical biological systems [18,42]. After the optimization of the initial pH, glucose concentration and external resistance, Geetanjali et al. found that Proteobacteria, Firmicutes, and Actinobacteria were the dominant phyla in SMFC, accounting for 78% [5]. The complex co-trophic interactions among microbial communities were important for the effective removal of organic compounds [17].
Based on the level of microbial community, the microorganisms in each system were identified at the genus level to further analyze the mechanism of nitrogen and phosphorus removal in each system. The result is shown in Figure 5.
Figure 5 shows the changes in microbial communities at the genus level for each group. The dominant bacteria in group A were: Comamonas, Bacillus, Brevundimonas, Geobacter, Shewanella, Dechloromonas, Nitrospira and Acetobacteroides. Compared with the control group C, Comamonas, Bacillus, Brevundimonas, Geobacter, Shewanella, Dechloromonas, Nitrospira and Acetobacteroides accounted for 6.20%, 6.56%, 3.22%, 4.92%, 4.85%, 4.44%, 3.04% and 2.37%, which increased to 11.39%, 7.97%, 7.17%, 6.60%, 6.23%, 5.03%, 4.23% and 3.94%, respectively. However, Aeromonas increased to 2.44% from 1.31%. The dominant bacteria in group B were Bacillus, Desulfovibrio, Comamonas, Dechloromonas and Simplicispira. Compared with the control group C, it was found that Bacillus rose from 6.56% to 10.90%, Desulfovibrio 4.23% to 7.42%, Comamonas 6.20% to 6.82%, Dechloromonas 4.44% to 6.43% and Simplicispira 1.87% to 3.03%.
By comparing the data, after the optimization, the proportion of active ammonia-removing bacteria (Comamonas, Bacillus, Brevundimonas, Geobacter, Shewanella, etc.) on the cathode reactor of group A increased, while the proportion of bacteria without an ammonia removal function decreased. Among them, Comamonas and Bacillus showed the most obvious changes. Comamonas belongs to the Proteobacteria phylum, which has the effect of removing organic matter, ammonia and phosphorus in sewage [43]. Bacillus belongs to Firmicutes. It is a typical bacterium for removing NH4+-N [44,45]. In addition, Brevundimonas has a positive effect on nitrogen mineralization [46], and Geobacter and Shewanella are typical bacteria with high denitrification performances [47,48]. After the optimization, the phosphorus-removing strain (Comamonas, Bacillus, Desulfovibrio, etc.) activity on the cathode reactor of group B was enhanced. Bacillus is a P-soluble bacterium involved in regulating phosphorus conversion in wastewater [49]. Comamonas and Desulfovibrio have played a role in dephosphorization [43,50].
In sum, after the operation conditions were optimized for the microbial communities on the cathode reactor, the activity of the NH4+-N-removing strains (Comamonas, Bacillus, Brevundimonas, Geobacter and Shewanella) and phosphorus-removing strains (Comamonas, Bacillus and Desulfovibrio) were strengthened. Under the synergistic effect of the dominant strains, the efficiency of nitrogen and phosphorus removal in the reactor was significantly improved [17]. The analytical results were consistent with the experimental results.

4. Conclusions

In this paper, the two factors of the HRT and initial influent ammonia concentration were selected, and the performance of removing NH4+-N and TP of the MFC was taken as the response value. According to the principle of CCD, the response surface test arrangement and model construction were carried out by using the Design-Expert 11.0 software.
(1).
The F-value of the fitted model for removing NH4+-N was 16.33, which showed that the model had a good effect, and the p-value was less than 0.0001, which showed that the model was reliable. The value of coefficient variation (C.V.) was 11.59%, and the signal-to-noise ratio was 11.90 (>4), which proved that the test had a high accuracy. The R2 of the fitted model was 0.77, the adjusted R2 was 0.72 and the predicted R2 was 0.53, indicating the rationality of the model construction. Two factors had a significant influence on the removal of NH4+-N; the effect of the initial influent ammonia concentration was greater than that of the HRT.
(2).
The F-value of the fitted model for removing TP was 41.97, indicating that the model had a good effect, and the p-value was less than 0.0001, indicating that the model was reliable. The value of coefficient variation (C.V.) was 4.26%, and the signal-to-noise ratio was 16.07 (>4), which proved that the test had a high accuracy. The R2 of the fitted model was 0.97, the adjusted R2 was 0.95 and the predicted R2 was 0.78, indicating the rationality of the model construction. Two factors had a significant influence on the removal of TP; the effect of the initial influent ammonia concentration was greater than that of the HRT.
(3).
The results of the optimization and verification experiments showed that the actual removal rates of NH4+-N and TP in the optimized system were 94.88% and 59.39%, respectively (the predicted values were 90.18% and 56.25%), indicating that the expected experimental results were achieved and the accuracy of optimization of the constructed model was verified.
(4).
Changes in the structure of microorganisms and the community: after the optimization of the system operation parameters, the total number of species in the optimization group decreased, and the richness of the microbial community decreased. The system performed an orthoselection of the microbial community and optimized the structure of the microbial community. After the optimization, the dominant strains for NH4+-N and TP removal on the cathode reactor of each system were strengthened at the phylum and genus levels. Under the coaction of the dominant strains, the efficiency of nitrogen removal and phosphorus removal in the reactor was significantly improved.

Author Contributions

Conceptualization and writing—original draft preparation, J.L. and J.Z. (Jie Zhou); methodology, M.Z. and W.C.; validation, T.S., Y.W. and J.Z. (Jingru Zhao); data curation, W.Z. and X.W.; writing—review and editing, W.C. All authors have read and agreed to the published version of the manuscript.

Funding

The authors would like to thank the National Natural Science Foundation of China (grant no. 51808001), the Anhui Provincial Natural Science Foundation of China (grant no.1808085QE146, 2208085QE176, and 2008085ME159), the Natural Science research project of Universities in Anhui Province of China (grant no. KJ2021A0505) and the Scientific research project of Anhui Polytechnic University (grant no. Xjky2020168, 2021DZ36) for their support.

Acknowledgments

The authors would like to thank the anonymous reviewers for their valuable comments, which helped improve the original version of this paper.

Conflicts of Interest

The authors declare no conflict of interest.

References

  1. Yang, N.; Zhou, Q.; Zhan, G.; Liu, Y.; Luo, H.; Li, D. Comparative evaluation of simultaneous nitritation/denitritation and energy recovery in air-cathode microbial fuel cells (ACMFCs) treating low C/N ratio wastewater. Sci. Total Environ. 2021, 788, 147652. [Google Scholar] [CrossRef] [PubMed]
  2. Sotres, A.; Cerrillo, M.; Viñas, M.; Bonmatí, A. Nitrogen removal in a two-chambered microbial fuel cell: Establishment of a nitrifying-denitrifying microbial community on an intermittent aerated cathode. Chem. Eng. J. 2016, 284, 905–916. [Google Scholar] [CrossRef] [Green Version]
  3. Ye, Y.; Ngo, H.H.; Guo, W.; Chang, S.W.; Nguyen, D.D.; Zhang, X.; Zhang, S.; Luo, G.; Liu, Y. Impacts of hydraulic retention time on a continuous flow mode dual-chamber microbial fuel cell for recovering nutrients from municipal wastewater. Sci. Total Environ. 2020, 734, 139220. [Google Scholar] [CrossRef]
  4. Liu, S.; Feng, X.; Xue, H.; Qiu, D.; Huang, Z.; Wang, N. Bioenergy generation and nitrogen removal in a novel ecological-microbial fuel cell. Chemosphere 2021, 278, 130450. [Google Scholar] [CrossRef] [PubMed]
  5. Samudro, G.; Imai, T.; Hung, Y.T. Enhancement of Power Generation and Organic Removal in Double Anode Chamber Designed Dual-Chamber Microbial Fuel Cell (DAC-DCMFC). Water 2021, 13, 2941. [Google Scholar] [CrossRef]
  6. Shahi, A.; Chellam, P.V.; Verma, A.; Singh, R.S. A comparative study on the performance of microbial fuel cell for the treatment of reactive orange 16 dye using mixed and pure bacterial species and its optimization using response surface methodology. Sustain. Energy Technol. Assess. 2021, 48, 101667. [Google Scholar] [CrossRef]
  7. Almatouq, A.; Babatunde, A.O. Identifying optimized conditions for concurrent electricity production and phosphorus recovery in a mediator-less dual chamber microbial fuel cell. Appl. Energy 2018, 230, 122–134. [Google Scholar] [CrossRef]
  8. Hassan, H.; Jin, B.; Dai, S. Dual-Response Quadratic Model for Optimization of Electricity Generation and Chlorophenol Degradation by Electro-Degradative Bacillus subtilis in Microbial Fuel Cell System. Environ. Technol. 2021, 43, 2867–2880. [Google Scholar] [CrossRef]
  9. Zhang, G.; Lee, D.J.; Cheng, F. Treatment of domestic sewage with anoxic/oxic membrane-less microbial fuel cell with intermittent aeration. Bioresour. Technol. 2016, 218, 680–686. [Google Scholar] [CrossRef] [PubMed]
  10. Rodrigo, V.L.; Jorge, D.M.; Ernesto, R.L.; Gabriel, P.; Alfonso, C.H.; Alfredo, M.; Diana, D.R.; Rodrigo, M.C.; Gerardo, C.; Carlos, G.B.; et al. Scale up of Microbial Fuel Cell Stack System for Residential Wastewater Treatment in Continuous Mode Operation. Water 2019, 11, 217. [Google Scholar] [CrossRef]
  11. Goto, Y.; Yoshida, N. Scaling up Microbial Fuel Cells for Treating Swine Wastewater. Water 2019, 11, 1831. [Google Scholar] [CrossRef] [Green Version]
  12. Zhou, Y.; Zhu, N.; Guo, W.; Wang, Y.; Huang, X.; Wu, P.; Dang, Z.; Zhang, X.; Xian, J. Simultaneous electricity production and antibiotics removal by microbial fuel cells. J. Environ. Manag. 2018, 217, 565–572. [Google Scholar] [CrossRef]
  13. Sadabad, H.R.; Gholikandi, G.B. Simultaneous effective sludge stabilization and direct electricity generation by merging microbial fuel cell (MFC) and Fered-Fenton reactor: An experimental study. Biomass Bioenergy 2018, 119, 75–89. [Google Scholar] [CrossRef]
  14. Geetanjali; Rani, R.; Sharma, D.; Kumar, S. Optimization of operating conditions of miniaturize single chambered microbial fuel cell using NiWO4/graphene oxide modified anode for performance improvement and microbial communities dynamics. Bioresour. Technol. 2019, 285, 121337. [Google Scholar] [CrossRef] [PubMed]
  15. Salar-García, M.J.; Ramón-Fernández, A.; Ortiz-Martínez, V.M.; Ruiz-Fernández, D. Towards the optimisation of ceramic-based microbial fuel cells: A three factor three-level response surface analysis design. Biochem. Eng. J. 2019, 144, 119–124. [Google Scholar] [CrossRef]
  16. Tao, Q.; Luo, J.; Zhou, J.; Zhou, S.; Liu, G.; Zhang, R. Effect of dissolved oxygen on nitrogen and phosphorus removal and electricity production in microbial fuel cell. Bioresour. Technol. 2014, 164, 402–407. [Google Scholar] [CrossRef]
  17. Zhao, H.; Kong, C.H. Enhanced removal of p-nitrophenol in a microbial fuel cell after long-term operation and the catabolic versatility of its microbial community. Chem. Eng. J. 2018, 339, 424–431. [Google Scholar] [CrossRef]
  18. Feng, Y.; Long, Y.; Wang, Z.; Wang, X.; Shi, N.; Sou, N.; Shi, Y.; Yu, Y. Performance and microbial community of an electric biological integration reactor (EBIR) for treatment of wastewater containing ibuprofen. Bioresour. Technol. 2019, 274, 447–458. [Google Scholar] [CrossRef] [PubMed]
  19. Sugumar, M.; Dharmalingam, S. Statistical optimization of process parameters in microbial fuel cell for enhanced power production using Sulphonated Polyhedral Oligomeric Silsesquioxane dispersed Sulphonated Polystyrene Ethylene Butylene Polystyrene nanocomposite membranes. J. Power Sources 2020, 469, 228400. [Google Scholar] [CrossRef]
  20. Lu, N.; Zhou, S.G.; Zhuang, L.; Zhang, J.T.; Ni, J.R. Electricity generation from starch processing wastewater using microbial fuel cell technology. Biochem. Eng. J. 2009, 43, 246–251. [Google Scholar] [CrossRef]
  21. Hiegemann, H.; Lübken, M.; Schulte, P.; Schmelz, K.G.; Gredigk, S.; Wichern, M. Inhibition of microbial fuel cell operation for municipal wastewater treatment by impact loads of free ammonia in bench- and 45L-scale. Sci. Total Environ. 2018, 624, 34–39. [Google Scholar] [CrossRef] [PubMed]
  22. Nama, J.Y.; Kim, H.W.; Shin, H.S. Ammonia inhibition of electricity generation in single-chamber microbial fuel cells. J. Power Sources 2010, 195, 6428–6433. [Google Scholar] [CrossRef]
  23. Akman, D.; Cirik, K.; Ozdemir, S.; Ozkaya, B.; Cinar, O. Bioelectricity generation in continuously-fed microbial fuel cell: Effects of anode electrode material and hydraulic retention time. Bioresour. Technol. 2013, 149, 459–464. [Google Scholar] [CrossRef] [PubMed]
  24. Sobieszuk, P.; Zamojska-Jaroszewicz, A.; Makowski, Ł. Influence of the operational parameters on bioelectricity generation in continuous microbial fuel cell, experimental and computational fluid dynamics modelling. J. Power Sources 2017, 371, 178–187. [Google Scholar] [CrossRef]
  25. Yousefi, V.; Mohebbi-Kalhori, D.; Samimi, A.; Salari, M. Effect of separator electrode assembly (SEA) design and mode of operation on the performance of continuous tubular microbial fuel cells (MFCs). Int. J. Hydrogen Energy 2016, 41, 597–606. [Google Scholar] [CrossRef]
  26. Pinto, R.P.; Srinivasan, B.; Guiot, S.R.; Tartakovsky, B. The effect of real-time external resistance optimization on microbial fuel cell performance. Water Res. 2011, 45, 1571–1578. [Google Scholar] [CrossRef] [PubMed] [Green Version]
  27. Yang, N.; Liu, H.; Zhan, G.Q.; Li, D. Sustainable ammonia-contaminated wastewater treatment in heterotrophic nitrifying/denitrifying microbial fuel cell. J. Clean. Prod. 2020, 245, 118923. [Google Scholar] [CrossRef]
  28. Koffi, N.J.; Okabe, S. Effect of poised cathodic potential on anodic ammonium nitrogen removal from domestic wastewater by air-cathode microbial fuel cells. Bioresour. Technol. 2022, 348, 126807. [Google Scholar] [CrossRef] [PubMed]
  29. Naseer, M.N.; Zaidi, A.A.; Khan, H.; Kumar, S.; Owais, M.T.; Wahab, Y.A.; Dutta, K.; Jaafar, J.; Hamizi, N.A.; Islam, M.A.; et al. Statistical Modeling and Performance Optimization of a Two-Chamber Microbial Fuel Cell by Response Surface Methodology. Catalysts 2021, 11, 1202. [Google Scholar] [CrossRef]
  30. Zhou, R.J.; Zhang, M.; Li, J.Y.; Zhao, W. Optimization of preparation conditions for biochar derived from water hyacinth by using response surface methodology (RSM) and its application in Pb2+ removal. J. Environ. Chem. Eng. 2020, 8, 104198. [Google Scholar] [CrossRef]
  31. Sadabad, H.R.; Gholikandi, G.B.; Rad, H.A.; Sadabad, H.R. Optimizing hybrid microbial fuel cell (MFC) and aerobic digestion reactor to gain simultaneous electricity generation and effective sludge digestion: An experimental study, mathematical modeling and recent achievements. Desalin. Public 2021, 212, 87–102. [Google Scholar]
  32. Mahmoudi, A.; Mousavi, S.A.; Darvishi, P. Effect of ammonium and COD concentrations on the performance of fixed-bed air-cathode microbial fuel cells treating reject water. Int. J. Hydrogen Energy 2020, 45, 4887–4896. [Google Scholar] [CrossRef]
  33. EPA of China. Monitoring and Analysis Methods of Water and Wastewater; China Environmental Science Press: Beijing, China, 2002. [Google Scholar]
  34. Li, L.; Zhang, J.; Tian, Y.; Zhan, W.; Lin, Q.; Li, H.; Zuo, W. Optimization of nutrient removal of novel electrochemically active carriers by response surface methodology. Bioresour. Technol. 2019, 292, 122000. [Google Scholar] [CrossRef] [PubMed]
  35. Li, C.; Yang, J.; Wang, X.; Wang, E.; Li, B.; He, R.; Yuan, H. Removal of nitrogen by heterotrophic nitrification-aerobic denitrification of a phosphate accumulating bacterium Pseudomonas stutzeri YG-24. Bioresour. Technol. 2015, 182, 18–25. [Google Scholar] [CrossRef] [PubMed]
  36. M’rassi, A.G.; Bensalah, F.; Gury, J.; Duran, R. Isolation and characterization of different bacterial strains for bioremediation of n-alkanes and polycyclic aromatic hydrocarbons. Environ. Sci. Pollut. Res. 2015, 22, 15332–15346. [Google Scholar] [CrossRef] [PubMed]
  37. Arshad, A.; Martins, P.D.; Frank, J.; Jetten, M.S.; Camp, H.J.; Welte, C.U. Mimicking microbial interactions under nitrate-reducing conditions in an anoxic bioreactor: Enrichment of novel Nitrospirae bacteria distantly related to Thermodesulfovibrio. Environ. Microbiol. 2017, 19, 4965–4977. [Google Scholar] [CrossRef]
  38. Speris, L.B.M.; Rice, D.T.F.; Petrovski, S.; Seviour, R.J. The Phylogeny, Biodiversity, and Ecology of the Chloroflexi in Activated Sludge. Front. Microbiol. 2019, 10, 2015. [Google Scholar] [CrossRef] [PubMed] [Green Version]
  39. Johan, L.; Sara, M.L. Bacteroidetes bacteria in the soil: Glycan acquisition, enzyme secretion, and gliding motility. Adv. Appl. Microbiol. 2020, 110, 63–87. [Google Scholar] [CrossRef]
  40. Lidbury, I.D.; Borsetto, C.; Murphy, A.R.; Bottrill, A.; Jones, A.M.; Bending, G.D.; Hammond, J.P.; Chen, Y.; Wellington, E.M.; Scanlan, D.J. Niche-adaptation in plant-associated Bacteroidetes favours specialisation in organic phosphorus mineralization. ISME J. 2021, 15, 1040–1055. [Google Scholar] [CrossRef] [PubMed]
  41. Jung, S.; Regan, J.M. Comparison of anode bacterial communities and performance in microbial fuel cells with different electron donors. Appl. Microbiol. Biotechnol. 2007, 77, 393–402. [Google Scholar] [CrossRef]
  42. Wang, Y.; Pan, Y.; Zhu, T.; Wang, A.; Lu, Y.; Lv, L.; Zhang, K.; Li, Z. Enhanced performance and microbial community analysis of bioelectrochemical system integrated with bio-contact oxidation reactor for treatment of wastewater containing azo dye. Sci. Total Environ. 2018, 634, 616–627. [Google Scholar] [CrossRef] [PubMed]
  43. Su, J.F.; Yang, S.; Huang, T.L.; Li, M.; Liu, J.R.; Yao, Y.X. Enhancement of the denitrification in low C/N condition and its mechanism by a novel isolated Comamonas sp. YSF15. Environ. Pollut. 2020, 256, 113294. [Google Scholar] [CrossRef] [PubMed]
  44. Wang, Q.; Fu, W.; Lu, R.; Pan, C.; Yi, G.; Zhang, X.; Rao, Z. Characterization of Bacillus subtilis Ab03 for efficient ammonia nitrogen removal. Syst. Microbiol. Biomanuf. 2022, 2, 580–588. [Google Scholar] [CrossRef]
  45. Patil, M.P.; Jeong, I.; Woo, H.E.; Oh, S.J.; Kim, H.C.; Kim, K.; Nakashita, S.; Kim, K. Effect of Bacillus subtilis Zeolite Used for Sediment Remediation on Sulfide, Phosphate, and Nitrogen Control in a Microcosm. Int. J. Environ. Res. Public Health 2022, 19, 4163. [Google Scholar] [CrossRef]
  46. Tahir, N.; Asma, I.; Sohail, H.; Muhammad, S.; Afshan, M.; Javed, I.; Kashif, H.M.; Shaghef, E.; Abdullah, M.K. First report of diazotrophic Brevundimonas spp. as growth enhancer and root colonizer of potato. Sci. Rep. 2020, 10, 12893. [Google Scholar] [CrossRef]
  47. Liang, D.; He, W.; Li, C.; Yu, Y.; Zhang, Z.; Ren, N.; Feng, Y. Bidirectional electron transfer biofilm assisted complete bioelectrochemical denitrification process. Chem. Eng. J. 2019, 375, 121960. [Google Scholar] [CrossRef]
  48. Jiang, M.; Zheng, X.; Chen, Y. Enhancement of denitrification performance with reduction of nitrite accumulation and N2O emission by Shewanella oneidensis MR-1 in microbial denitrifying process. Water Res. 2020, 169, 115242. [Google Scholar] [CrossRef]
  49. Liu, X.; Chen, C.; Wang, J.; Zou, S.; Long, X. Phosphorus solubilizing bacteria Bacillus thuringiensis and Pantoea ananatis simultaneously promote soil inorganic phosphate dissolution and soil Pb immobilization. Rhizosphere 2021, 20, 100448. [Google Scholar] [CrossRef]
  50. Petriglieri, F.; Singleton, C.; Peces, M.; Petersen, J.F.; Nierychlo, M.; Nielsen, P.H. “Candidatus Dechloromonas phosphoritropha” and “Ca. D. phosphorivorans”, novel polyphosphate accumulating organisms abundant in wastewater treatment systems. ISME J. 2021, 15, 3605–3614. [Google Scholar] [CrossRef]
Figure 1. Schematic diagram of device.
Water 14 03412 g001
Figure 2. Three-dimensional model diagram (a) and two-dimensional contour analysis diagram (b) of NH4+-N removal rate in MFC.
Water 14 03412 g002
Figure 3. Three-dimensional model diagram (a) and two-dimensional contour analysis diagram (b) of TP removal rate in MFC.
Water 14 03412 g003
Figure 4. Comparison of microbial communities at the phylum level in each group.
Water 14 03412 g004
Figure 5. Comparison of microbial communities at the genus level in each group.
Water 14 03412 g005
Table 1. Response surface model factors and levels.
NumberFactorUnitCodeLevel
−10+1
1HRThX1121824
2initial influent ammonia concentrationmg/LX2205080
Table 2. The response surface design and results of CCD.
Factor 1Factor 2Response 1Response 2
RunX1X2The Removal Rate of NH4+-N (Y1)The Removal Rate of TP(Y2)
hmg/L%%
19.5250 (0)46.9231.26
224 (+1)80 (+1)76.5443.82
312 (−1)80 (+1)45.2138.57
418 (0)50 (0)63.2955.82
518 (0)50 (0)62.2156.27
626.4950 (0)84.9736.82
724 (+1)20 (−1)91.2441.26
812 (−1)20 (−1)86.9249.53
918 (0)92.4354.8549.37
1018 (0)50 (0)63.5156.81
1118 (0)50 (0)62.8755.43
1218 (0)50 (0)63.4856.43
1318 (0)7.57478.6249.57
X1 is the HRT, and X2 is the initial influent ammonia concentration.
Table 3. ANOVA analysis of the NH4+-N removal model.
SourceSum of SquaresdfMean SquareF-Valuep-ValueSignificance
Model2013.4921006.7416.33<0.0001significant
X11000.4111000.4116.220.0024
X21013.0811013.0816.430.0023
C.V. % is 11.59.
Table 4. ANOVA analysis of the TP removal rate model.
SourceSum of SquaresdfMean SquareF-Valuep-ValueSignificance
Model867.515173.5041.97<0.0001significant
X12.9312.930.710.4276
X29.4219.422.280.1748
X1 X245.70545.7011.050.0127
X12792.145792.14191.60<0.0001
X2260.79560.7914.700.0064
C.V. % is 4.26.
Table 5. The results of NH4+-N and TP removal rate model verification.
X1X2Response Value
hmg/LPredictive ValueReal Value
NH4+-N removal rate model24 (actual 24)20 (actual 20)90.18%94.88%
TP removal rate model17.99 (actual 18)44.48 (actual 45)56.25%59.39%
Table 6. Statistical table of α diversity of each system.
GroupChaoShannonSimpsonACECoverage
A1563.735.44770.01221568.530.9965
B1565.795.56420.01331582.030.9971
C1719.845.58890.00971730.600.9943
Publisher’s Note: MDPI stays neutral with regard to jurisdictional claims in published maps and institutional affiliations.

