
Assessment of Trace and Rare Earth Elements Pollution in Water Bodies in the Area of Rare Metal Enterprise Influence: A Case Study—Kola Subarctic

Abstract
:1. Introduction
2. Materials and Methods
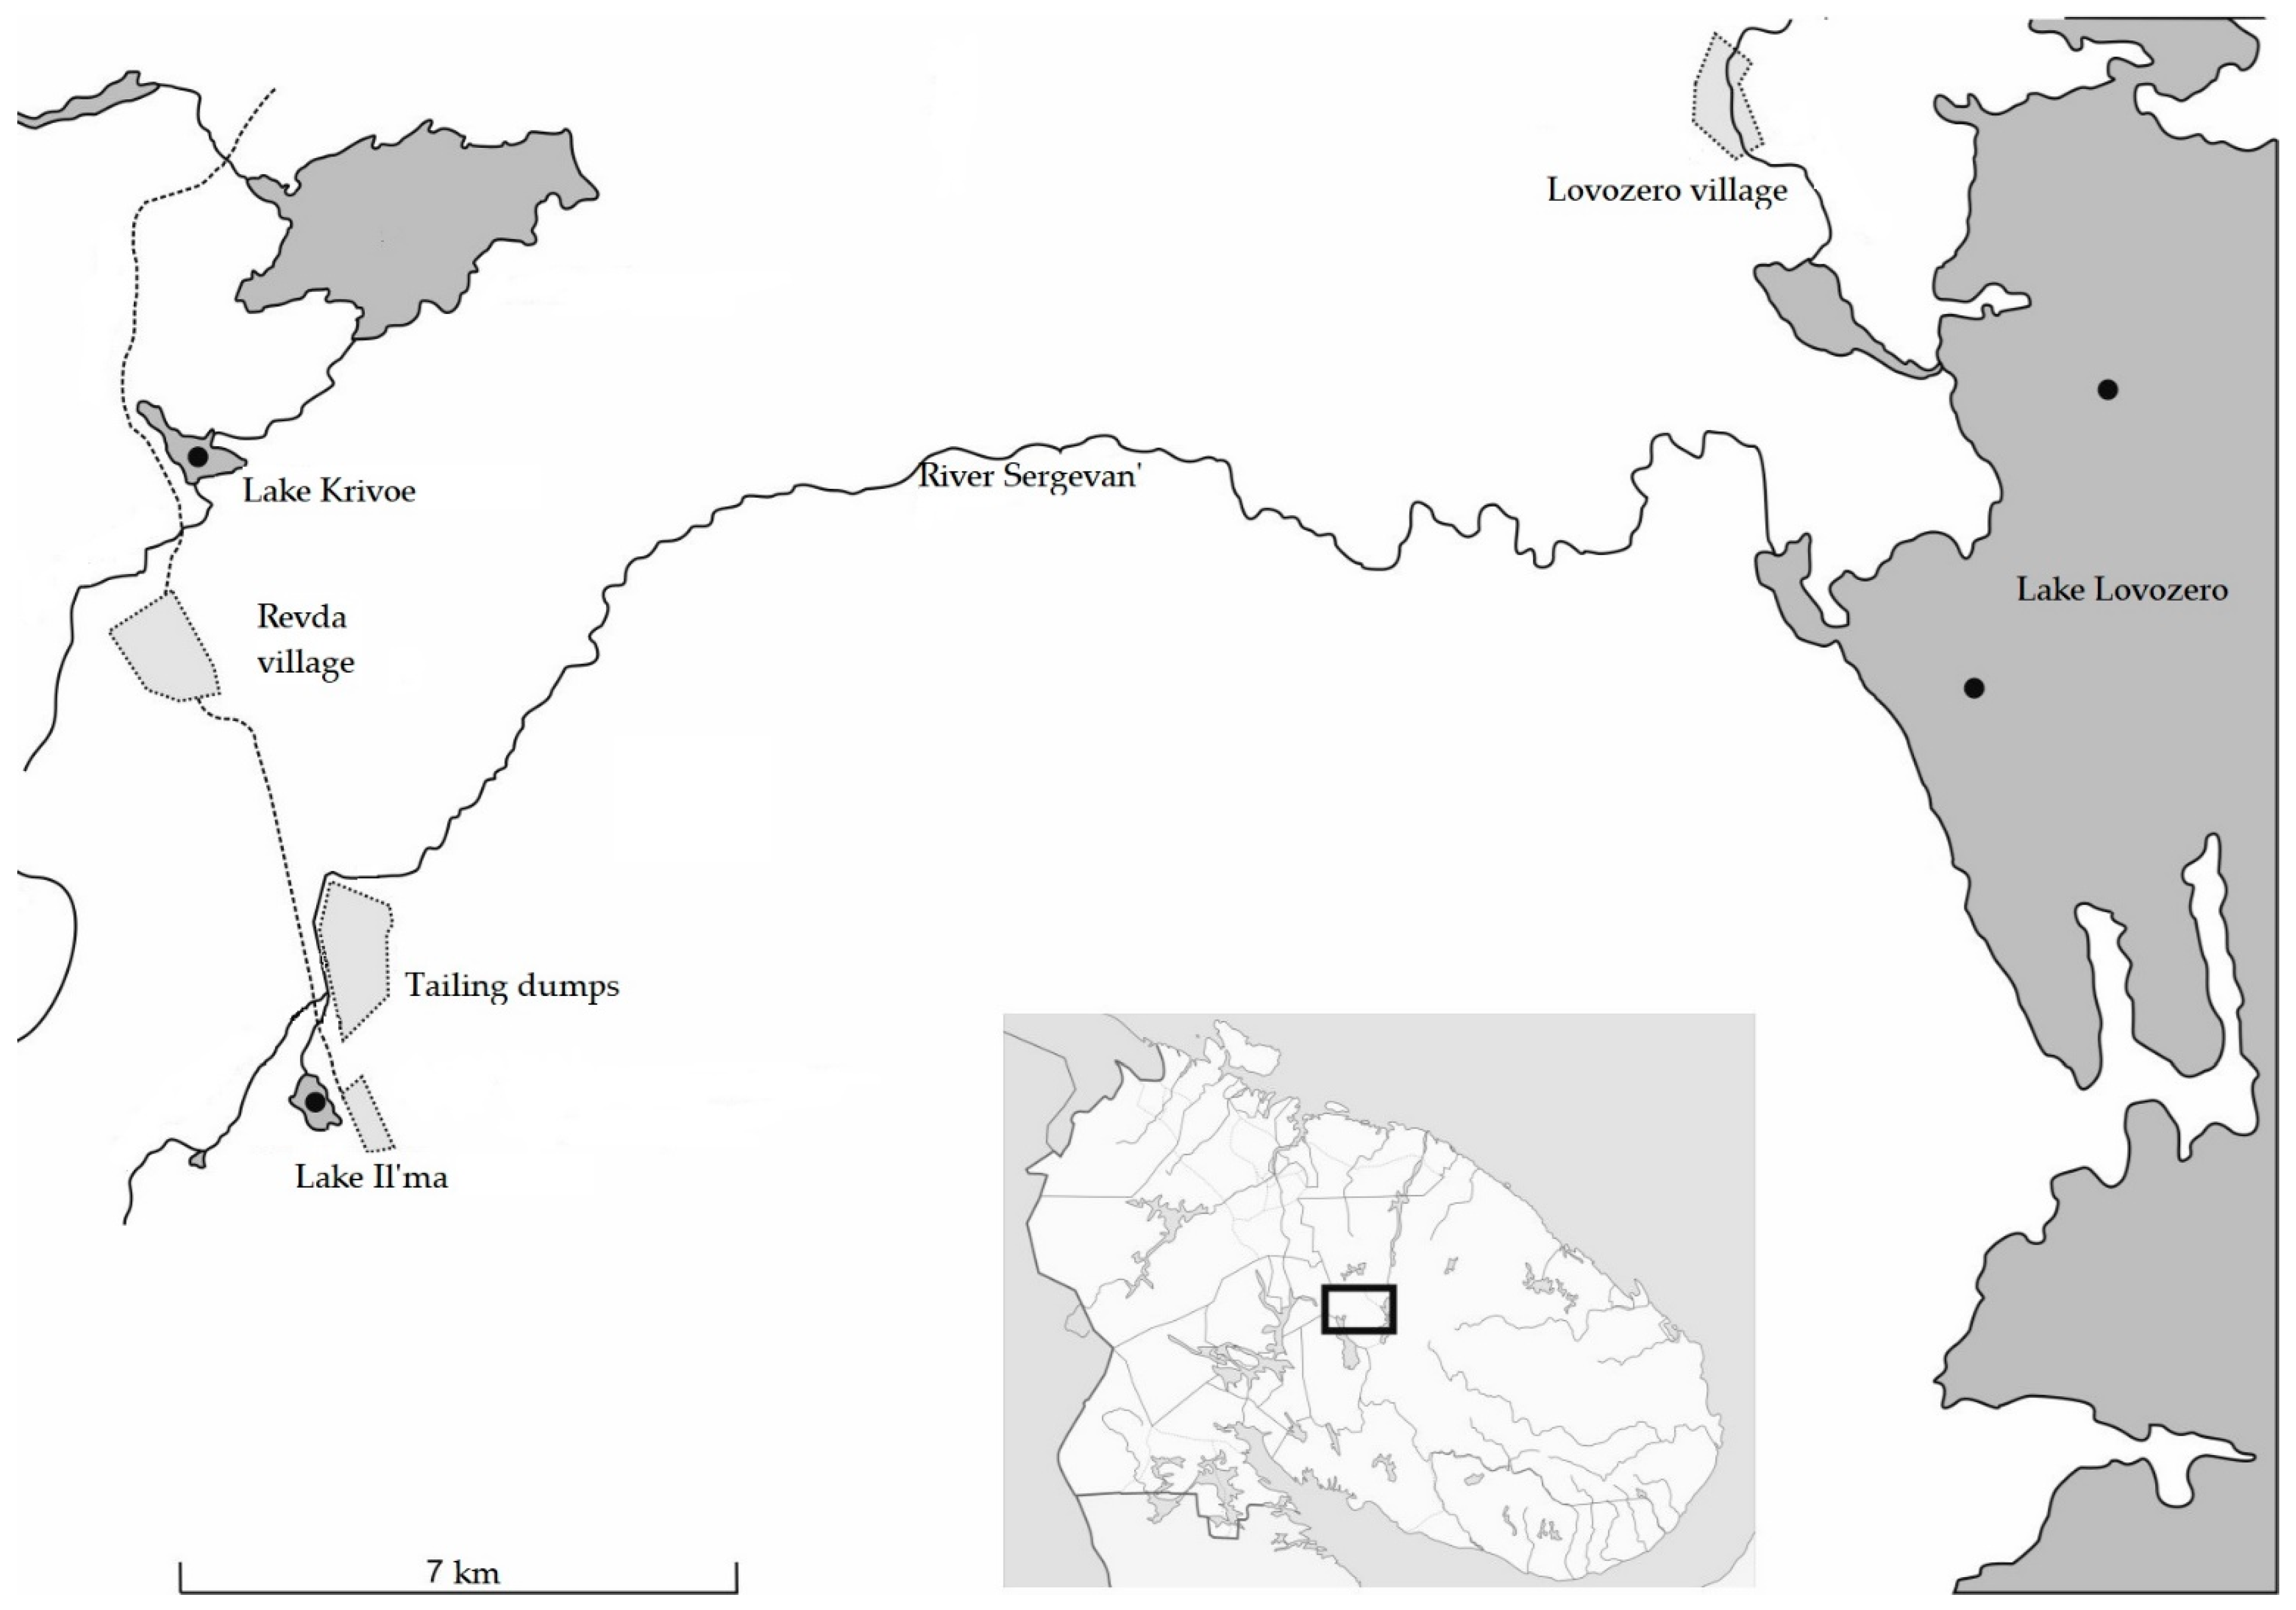
2.1. Description of the Study Area
2.2. Sampling and Analyses
2.3. TE and REE Pollution and Risk Assessment
3. Results and Discussion
3.1. Water Sample Analysis
3.2. BS Analysis
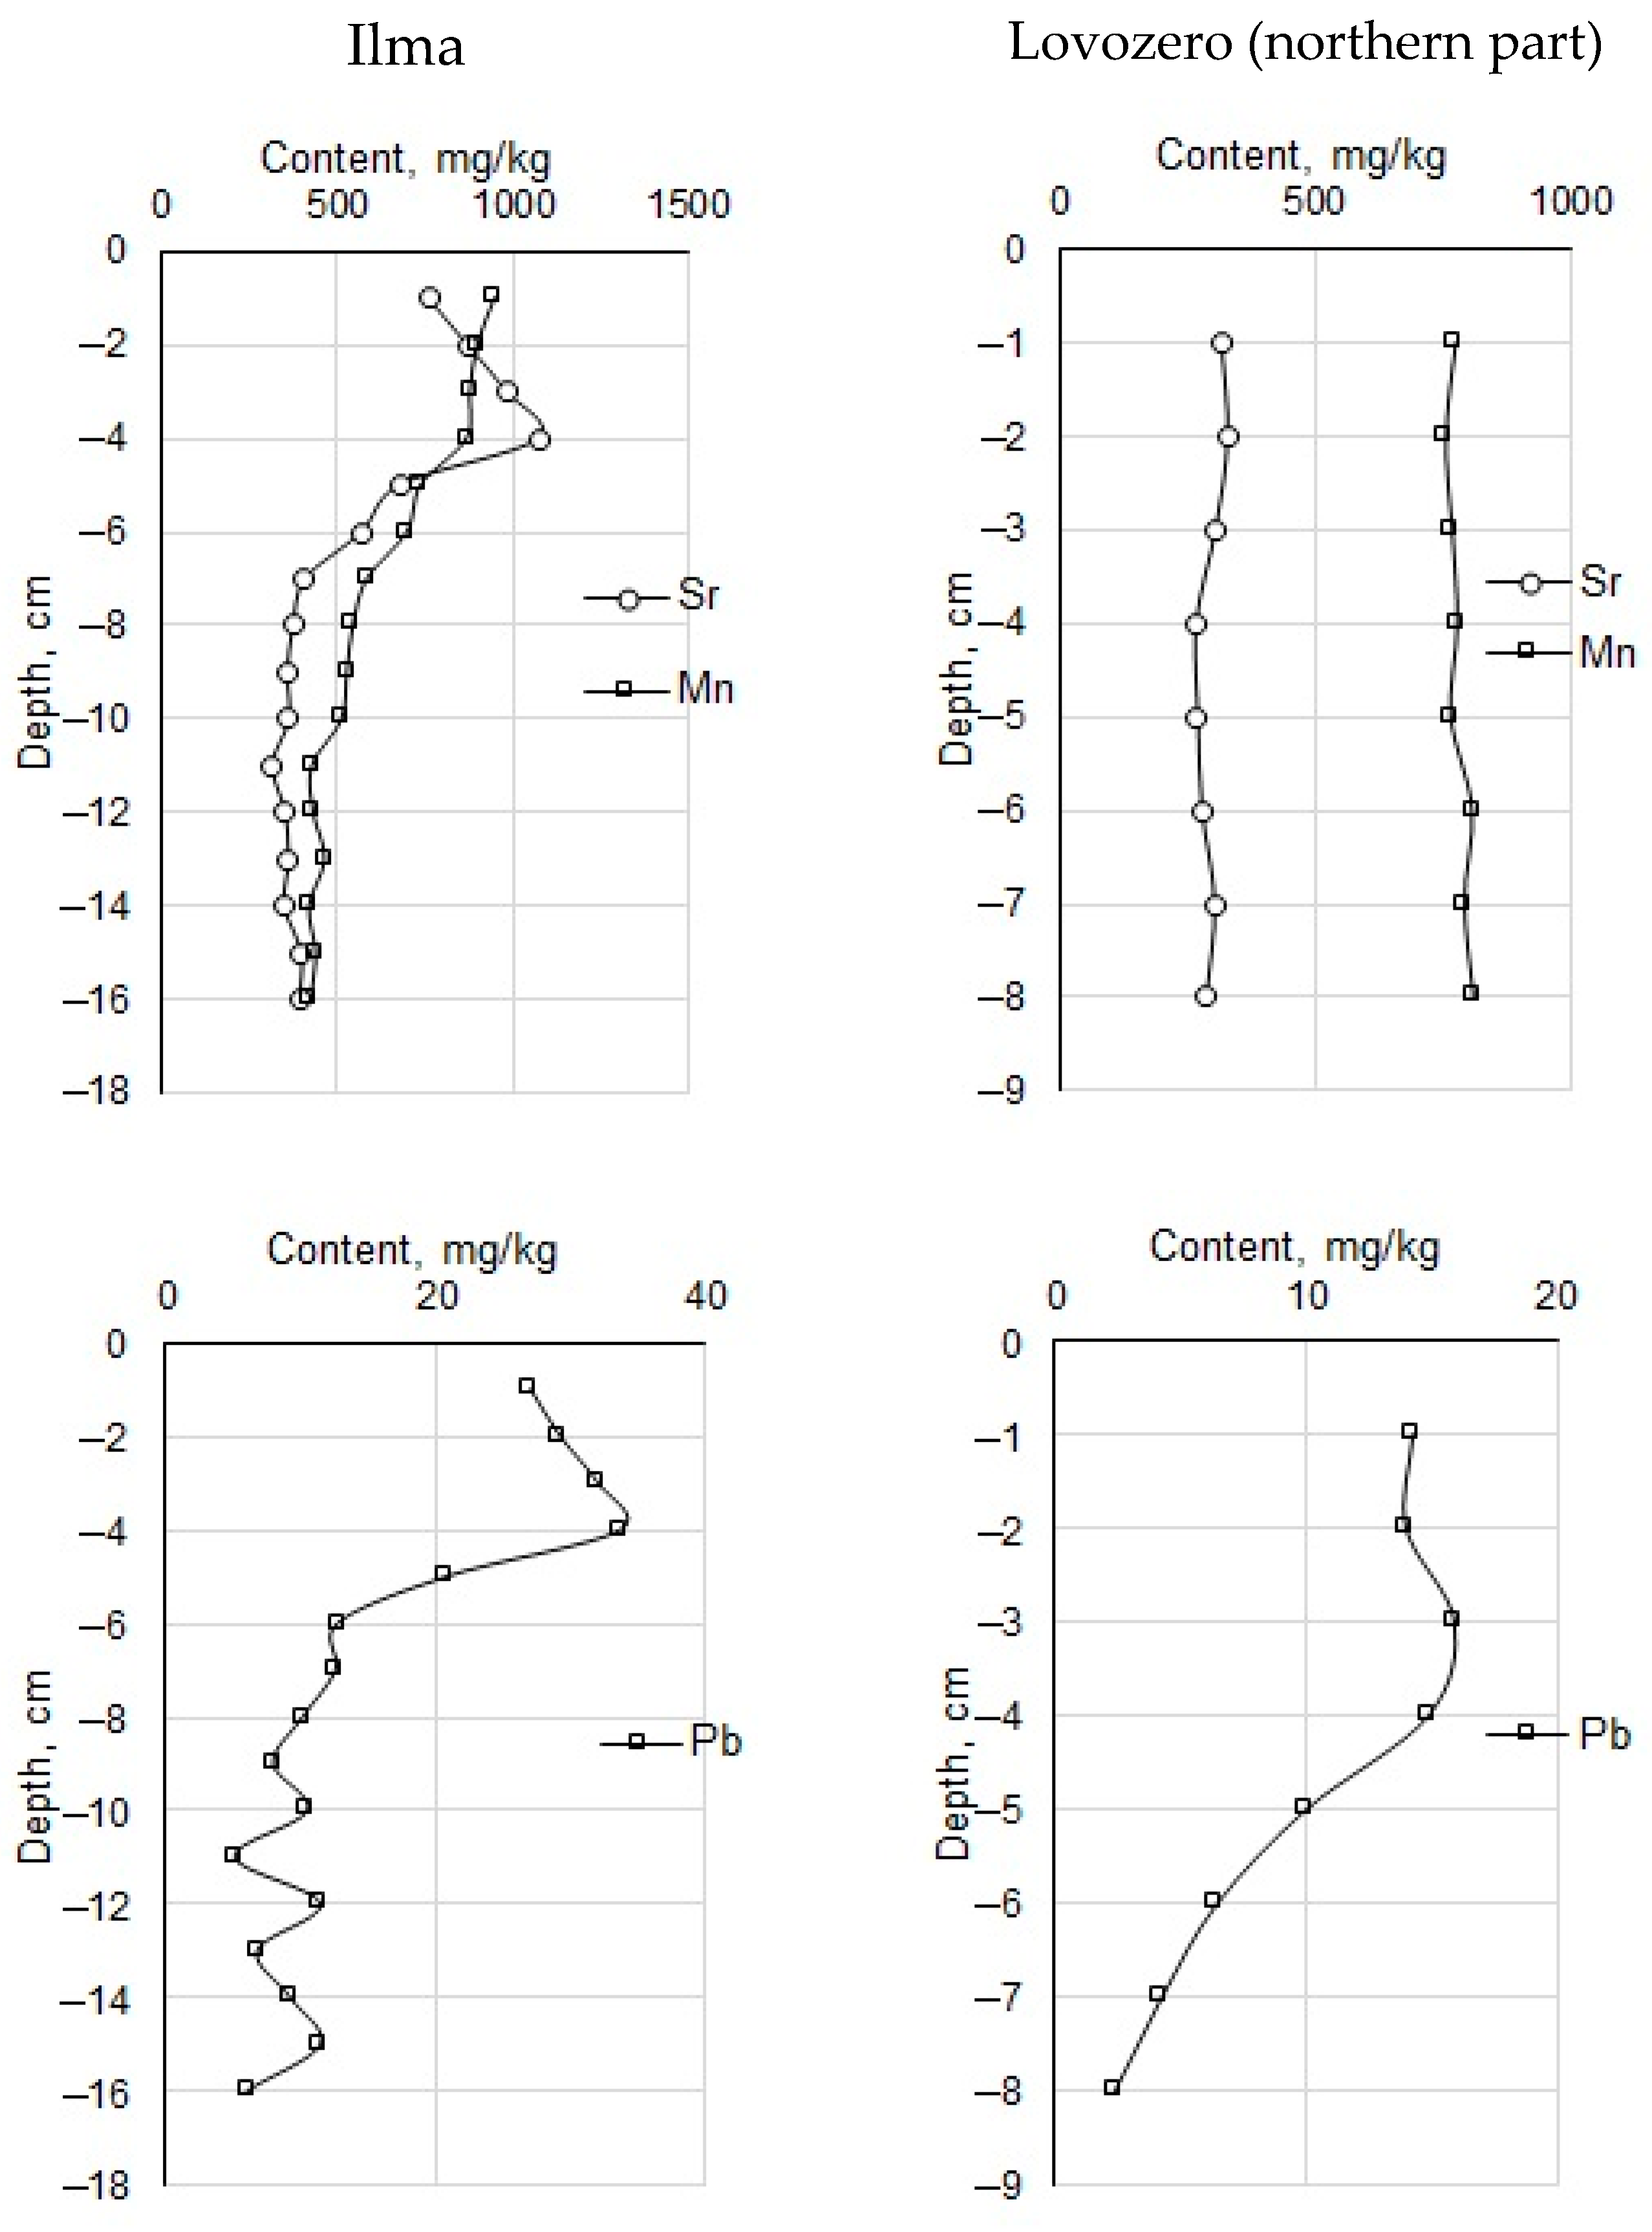
3.2.1. TE Pollution
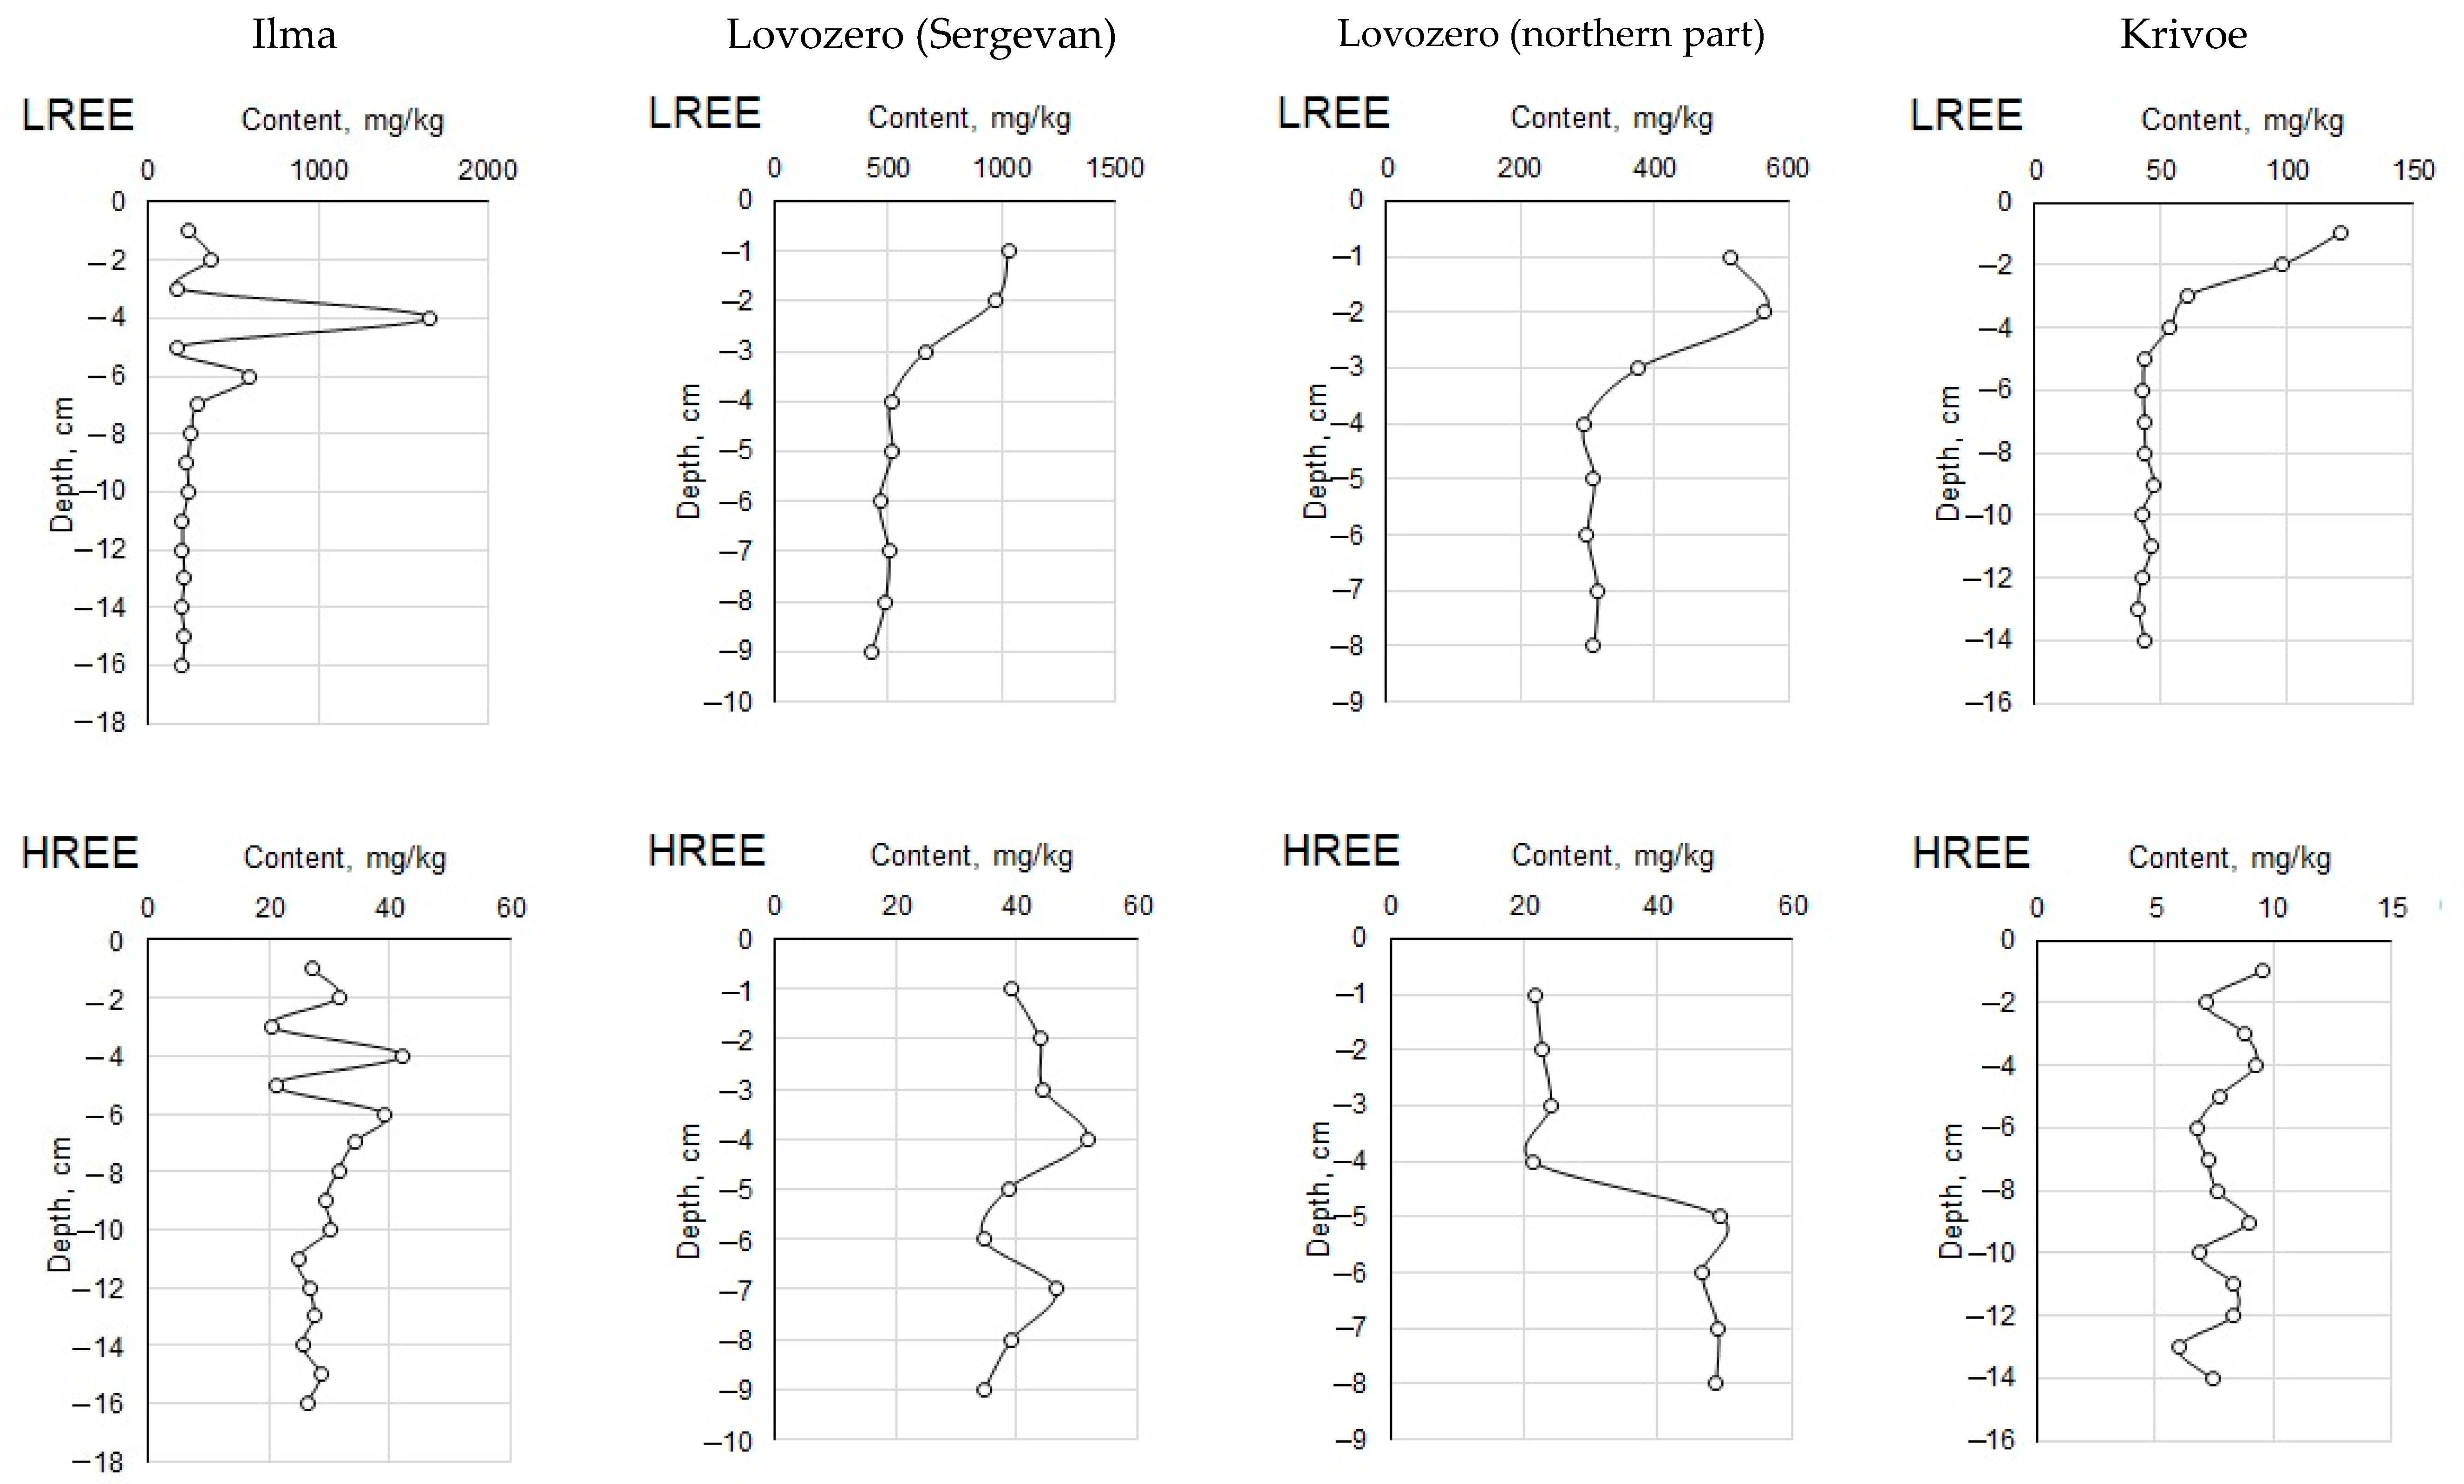
3.2.2. REE Pollution
3.3. Correlation Matrix
4. Conclusions
Author Contributions
Funding
Institutional Review Board Statement
Informed Consent Statement
Data Availability Statement
Acknowledgments
Conflicts of Interest
References
- Derome, J.; Lindroos, A.J. Effects of heavy metal contamination on macronutrient availability and acidification parameters in forest soil in the vicinity of the Harjavalta Cu-Ni smelter, SW Finland. Environ. Pollut. 1998, 99, 225–232. [Google Scholar] [CrossRef]
- Zhang, X.; Yang, L.; Li, Y.; Li, H.; Wang, W.; Ye, B. Impacts of lead/zinc mining and smelting on the environment and human health in China. Environ. Monit. Assess. 2011, 184, 2261–2273. [Google Scholar] [CrossRef] [PubMed]
- Liang, J.; Feng, C.; Zeng, G.; Gao, X.; Zhong, M.; Li, X.; Li, X.; He, X.; Fang, Y. Spatial distribution and source identification of heavy metals in surface soils in a typical coal mine city, Lianyuan, China. Environ. Pollut. 2017, 225, 681–690. [Google Scholar] [CrossRef]
- Amosov, P.; Baklanov, A.; Makarov, D.; Masloboev, V. Estimating air pollution levels by numerical simulation depending on wind flow speed and dust source area. Min. Ind. J. 2020, 5, 80–89. [Google Scholar] [CrossRef]
- Sun, Z.; Xie, X.; Wang, P.; Hu, Y.; Cheng, H. Heavy metal pollution caused by small-scale metal ore mining activities: A case study from a polymetallic mine in South China. Sci. Total Environ. 2018, 639, 217–227. [Google Scholar] [CrossRef] [PubMed]
- Huang, G.; Luo, X.; Li, D.; Li, Z.; Chen, Z.; Zhu, M. A multidisciplinary investigation on bio-oxidation gold mine tailings from Dandong, China as a potential arsenic pollution source. J. Geochem. Explor. 2018, 196, 33–41. [Google Scholar] [CrossRef]
- Wang, P.; Sun, Z.; Hu, Y.; Cheng, H. Leaching of heavy metals from abandoned mine tailings brought by precipitation and the associated environmental impact. Sci. Total Environ. 2019, 695, 133893. [Google Scholar] [CrossRef]
- Castro-Larragoitia, J.; Kramar, U.; Puchelt, H. 200 years of mining activities at La Paz/San Luis Potosí/Mexico—Consequences for environment and geochemical exploration. J. Geochem. Explor. 1997, 58, 81–91. [Google Scholar] [CrossRef]
- Rodríguez, L.; Ruiz, E.; Alonso-Azcárate, J.; Rincón, J. Heavy metal distribution and chemical speciation in tailings and soils around a Pb-Zn mine in Spain. J. Environ. Manag. 2009, 90, 1106–1116. [Google Scholar] [CrossRef] [PubMed]
- Edahbi, M.; Plante, B.; Benzaazoua, M. Environmental challenges and identification of the knowledge gaps associated with REE mine wastes management. J. Clean. Prod. 2019, 212, 1232–1241. [Google Scholar] [CrossRef]
- Buikema, N.; Zwissler, B.; Seagren, E.; Oommen, T.; Vitton, S. Stabilisation of iron mine tailings through biocalcification. Environ. Geotech. 2018, 5, 94–106. [Google Scholar] [CrossRef]
- Loredo, J.; Soto, J.; Álvarez, R.; Ordóñez, A. Atmospheric Monitoring at Abandoned Mercury Mine Sites in Asturias (NW Spain). Environ. Monit. Assess. 2006, 130, 201–214. [Google Scholar] [CrossRef]
- Corriveau, M.; Jamieson, H.; Parsons, M.; Campbell, J.; Lanzirotti, A. Direct characterization of airborne particles associated with arsenic-rich mine tailings: Particle size, mineralogy and texture. Appl. Geochem. 2011, 26, 1639–1648. [Google Scholar] [CrossRef]
- Lilic, N.; Cvjetic, A.; Knezevic, D.; Milisavljevic, V.; Pantelic, U. Dust and noise environmental impact assessment and control in Serbian mining practice. Minerals 2018, 8, 34. [Google Scholar] [CrossRef] [Green Version]
- Huang, X.; Deng, H.; Zheng, C.; Cao, G. Hydrogeochemical signatures and evolution of groundwater impacted by the Bayan Obo tailing pond in northwest China. Sci. Total Environ. 2016, 543 Pt A, 357–372. [Google Scholar] [CrossRef]
- Schreiber, A.; Marx, J.; Zapp, P.; Hake, J.; Voßenkaul, D.; Friedrich, B. Environmental Impacts of Rare Earth Mining and Separation Based on Eudialyte: A New European Way. Resources 2016, 5, 32. [Google Scholar] [CrossRef] [Green Version]
- Wang, L.; Liang, T.; Zhang, Q.; Li, K. Rare earth element components in atmospheric particulates in the Bayan Obo mine region. Environ. Res. 2014, 131, 64–70. [Google Scholar] [CrossRef]
- Csavina, J.; Field, J.; Taylor, M.P.; Gao, S.; Landázuri, A.; Betterton, E.A.; Sáez, A.E. A review on the importance of metals and metalloids in atmospheric dust and aerosol from mining operations. Sci. Total Environ. 2012, 433, 58–73. [Google Scholar] [CrossRef] [PubMed] [Green Version]
- Masloboev, V.A.; Baklanov, A.A.; Amosov, P.V. The results of assessing the intensity of dusting tailings. Bull. Murm. State Technol. Univ. 2016, 19, 13–19. (In Russian) [Google Scholar] [CrossRef]
- Cheng, Z.; Jiang, J.; Fajardo, O.A.; Wang, S.; Hao, J. Characteristics and health impacts of particulate matter pollution in China (2001–2011). Atmos. Environ. 2013, 65, 186–194. [Google Scholar] [CrossRef]
- Dauvalter, V.A. Lakes hydrochemistry in the zone of influence of iron-mining industry waste waters. Bull. Murm. State Technol. Univ. 2019, 22, 167–176. (In Russian) [Google Scholar] [CrossRef]
- Dauvalter, V.A.; Dauvalter, M.V.; Kashulin, N.A.; Sandimirov, S.S. Chemical Composition of Bottom Sedimentary Deposits in Lakes in the Zone Impacted by Atmospheric Emissions from the Severonickel Plant. Geochem. Int. 2010, 48, 1148–1153. [Google Scholar] [CrossRef]
- Dauvalter, V.A.; Dauvalter, M.V.; Saltan, N.V.; Semenov, E.N. The Chemical Composition of Surface Water in the Influence Zone of the Severonikel Smelter. Geochem. Int. 2009, 47, 592–610. [Google Scholar] [CrossRef]
- Moiseenko, T.I.; Dauvalter, V.A.; Lukin, A.A.; Kudryavtseva, L.P.; Il’yashchuk, B.P.; Sandimirov, S.S.; Kagan, L.Y.; Vandysh, O.I.; Sharov, A.N.; Sharova, Y.; et al. Anthropogenic Modifications of the Ecosystem of Lake Imandra; Nauka: Moscow, Russia, 2002; 403p. (In Russian) [Google Scholar]
- Petrova, V.A.; Pashkevich, M.A. The state of water bodies in the zone of influence of mining and processing enterprises on the example of JSC “Kovdorsky GOK”. Sci. Bull. Mosc. State Min. Univ. 2011, 9, 67–71. (In Russian) [Google Scholar]
- Denisov, D.B.; Kosova, A.L.; Vokueva, S.I. Paleoecological studies of subarctic lakes in the Murmansk region in the late Pleistocene and Holocene. In Biogeography and Evolutionary Processes; Materials of the LXVI Session of the Paleontological Society at the Russian Academy of Sciences; VSEGEI Kartfabrika: Saint Petersburg, Russia, 2020; pp. 191–193. (In Russian) [Google Scholar]
- Kashulin, N.A.; Dauvalter, V.A.; Denisov, D.B.; Valkova, S.A.; Vandysh, O.I.; Terentjev, P.M.; Kashulin, A.N. Selected aspects of the current state of freshwater resources in the Murmansk Region. J. Environ. Sci. Health Part A 2017, 52, 921–929. [Google Scholar] [CrossRef] [PubMed]
- Slukovskii, Z.I.; Guzeva, A.V.; Dauvalter, V.A. Rare earth elements in surface lake sediments of Russian arctic: Natural and potential anthropogenic impact to their accumulation. Appl. Geochem. 2022, 142, 105325. [Google Scholar] [CrossRef]
- Guzeva, A.; Slukovskii, Z.; Dauvalter, V.; Denisov, D. Trace element fractions in sediments of urbanised lakes of the arctic zone of Russia. Environ. Monit. Assess. 2021, 193, 378. [Google Scholar] [CrossRef] [PubMed]
- Balaram, V. Rare earth elements: A review of applications, occurrence, exploration, analysis, recycling, and environmental impact. Geosci. Front. 2019, 10, 1285–1303. [Google Scholar] [CrossRef]
- Liang, T.; Li, K.; Wang, L. State of rare earth elements in different environmental components in mining areas of China. Environ. Monit. Assess. 2014, 186, 1499–1513. [Google Scholar] [CrossRef]
- Dauvalter, V.; Moiseenko, T.; Rodyushkin, I. Geochemistry of Rare Earth Elements in Imandra Lake, Murmansk Area. Geochem. Int. 1999, 37, 376–383. [Google Scholar]
- Mokrushina, O.D. The first data on cryothermometry of fluid inclusions in nepheline of the loparite deposit of the Lovozero alkaline massif. Proc. Fersman’s Sci. Sess. Geol. Inst. KSC RAS 2018, 15, 251–254. (In Russian) [Google Scholar] [CrossRef]
- Bydin, F.I. (Ed.) Catalog of Lakes in the Murmansk Region; Publishing House of the USSR Academy of Sciences: Moscow, Russia; Leningrad, Russia, 1962; 146p. (In Russian) [Google Scholar]
- Veltischev, P.A.; Pavlov, N.S. Materials for the study of the depths and grounds of Lake Lovozero. In Materials for the Study of the Waters of the Kola Peninsula; Publishing House of the USSR Academy of Sciences: Moscow, Russia, 1940; pp. 298–313. (In Russian) [Google Scholar]
- Atlas of the Murmansk Region; Murmansk Press: Murmansk, Russia, 1971; 33p. (In Russian)
- Methodology PND F 16.2.2:2.3.71-2011. Methodology for Measuring Mass Fractions of Metals in Sewage Sludge, Bottom Sediments, Samples of Plant Origin by Spectral Methods. Available online: http://gostrf.com/normadata/1/4293793/4293793107.pdf (accessed on 22 September 2022). (In Russian).
- Nikanorov, A.M.; Zhulidov, A.V. Biomonitoring of Metals in Freshwater Ecosystems; Gidrometeoizdat: Leningrad, Russia, 1991; 312p. (In Russian) [Google Scholar]
- Vinogradov, A. Average contents of chemical elements in the main types of igneous rocks of the earth’s crust. Geochem. Int. 1962, 7, 555–571. (In Russian) [Google Scholar]
- Krasavtseva, E.; Maksimova, V.; Makarov, D. Conditions affecting the release of heavy and rare earth metals from the mine tailings Kola Subarctic. Toxics 2021, 9, 163. [Google Scholar] [CrossRef] [PubMed]
- Chen, C.-W.; Kao, C.-M.; Chen, C.-F.; Dong, C.-D. Distribution and accumulation of heavy metals in the sediments of Kaohsiung Harbor, Taiwan. Chemosphere 2007, 66, 1431–1440. [Google Scholar] [CrossRef] [PubMed]
- Soliman, N.F.; Nasr, S.M.; Okbah, M.A. Potential ecological risk of heavy metals in sediments from the Mediterranean coast, Egypt. J. Environ. Health Sci. Eng. 2015, 13, 70. [Google Scholar] [CrossRef] [PubMed] [Green Version]
- Muller, G. Index of geoaccumulation in sediments of the Rhine River. Geojournal 1969, 2, 108–118. [Google Scholar]
- Yang, Q.; Li, Z.; Lu, X.; Duan, Q.; Huang, L.; Bi, J. A review of soil heavy metal pollution from industrial and agricultural regions in China: Pollution and risk assessment. Sci. Total. Environ. 2018, 642, 690–700. [Google Scholar] [CrossRef]
- Loska, K.; Wiechuła, D.; Korus, I. Metal contamination of farming soils affected by industry. Environ. Int. 2004, 30, 159–165. [Google Scholar] [CrossRef]
- Zhang, Y.; Li, S.; Chen, Z.; Wang, F.; Chen, J.; Wang, L. A systemic ecological risk assessment based on spatial distribution and source apportionment in the abandoned lead acid battery plant zone, China. J. Hazard. Mater. 2018, 354, 170–179. [Google Scholar] [CrossRef] [PubMed]
- Hakanson, L. An ecological risk index for aquatic pollution control.a sedimentological approach. Water Res. 1980, 14, 975–1001. [Google Scholar] [CrossRef]
- Xu, Z.Q.; Ni, S.J.; Tuo, X.G.; Zhang, C.J. Calculation of Heavy Metals’ Toxicity Coefficient in the Evaluation of Potential Ecological Risk Index. Environ. Sci. Technol. 2008, 31, 112–115. [Google Scholar]
- Hou, D.; He, J.; Lü, C.; Ren, L.; Fan, Q.; Wang, J.; Xie, Z. Distribution characteristics and potential ecological risk assessment of heavy metals (Cu, Pb, Zn, Cd) in water and sediments from Lake Dalinouer, China. Ecotoxicol. Environ. Saf. 2013, 93, 135–144. [Google Scholar] [CrossRef] [PubMed]
- Chen, H.; Chen, Z.; Chen, Z.; Ou, X.; Chen, J.J. Calculation of Toxicity Coefficient of Potential Ecological Risk Assessment of Rare Earth Elements. Bull. Environ. Contam. Toxicol. 2020, 104, 582–587. [Google Scholar] [CrossRef] [PubMed]
- Baranov, I.V. Limnological Types of Lakes in the USSR; Gidrometeoizdat: Leningrad, Russia, 1962; 276p. (In Russian) [Google Scholar]
- Dauvalter, V.A.; Kashulin, N.A.; Denisov, D.B.; Zubova, E.M.; Slukovsky, Z.I.; Mitsukov, A.S. Changes in the geoecological state of the Arctic lake Kuetsjärvi in the post-Soviet period. In Sergeevskie Readings: Geoecological Aspects of the Implementation of the National Project “Ecology”; Dialogue of Generations; Peoples’ Friendship University of Russia: Moscow, Russia, 2020; pp. 361–366. (In Russian) [Google Scholar]
- Moiseenko, T.I.; Dinu, M.I.; Gashkina, N.A.; Kremleva, T.A. Forms of finding metals in natural waters, depending on their chemical composition. Water Resour. 2013, 40, 375–385. [Google Scholar] [CrossRef]
- Dauvalter, V.A.; Kashulin, N.A.; Denisov, D.B. Tendencies in the content change of heavy metals in lake sediments in Northern Fennoscandia over the last centuries. Trans. Karelian Res. Cent. Russ. Acad. Sci. 2015, 9, 62–75. (In Russian) [Google Scholar]
- Dauvalter, V.A. Geochemistry of Lakes in a Zone Impacted by an Arctic Iron-Producing Enterprise. Geochem. Int. 2020, 58, 933–946. [Google Scholar] [CrossRef]
- Escobar, J.; Whitmore, T.J.; Kamenov, G.D.; Riedinger-Whitmore, M.A. Isotope record of anthropogenic lead pollution in lake sediments of Florida, USA. J. Paleolimnol. 2013, 49, 237–252. [Google Scholar] [CrossRef]
- Renberg, I.; Brännvall, M.-L.; Bindler, R.; Emteryd, O. Stable lead isotopes and lake sediments—a useful combination for the study of atmospheric lead pollution history. Sci. Total Environ. 2002, 292, 45–54. [Google Scholar] [CrossRef]
- Nikanorov, A.M. Oddo-Harkins rule and the abundance of chemical elements in freshwater ecosystems. Rep. Acad. Sci. 2009, 426, 110–114. (In Russian) [Google Scholar]
- Krasavtseva, E.; Maksimova, V.; Makarov, D.; Potorochin, E. Modelling of the Chemical Halo of Dust Pollution Migration in Loparite Ore Tailings Storage Facilities. Minerals 2021, 11, 1077. [Google Scholar] [CrossRef]
- Habib, S.B.; Hossain, M.B.; Hossain, M.S.; Jolly, Y.N.; Sarker, S. Ecological risk evaluation in bottom-surface sediments and sub-surface water in the subtropical Meghna estuarine system. Heliyon 2021, 7, e08324. [Google Scholar] [CrossRef] [PubMed]
- Mohamed, I.A.I.; Laila, A.M.; Manal, G.M.; Kholoud, S.S.; Mamdouh, A.F.; Mahmoud, H.E. Potential ecological hazards assessment and prediction of sediment heavy metals pollution along the Gulf of Suez, Egypt. Egypt. J. Aquat. Res. 2019, 45, 329–335. [Google Scholar] [CrossRef]
- Peng, J.F.; Song, Y.H.; Yuan, P.; Cui, X.Y.; Qiu, G.L. The remediation of heavy metals contaminated sediment. J. Hazard. Mater. 2009, 161, 633–640. [Google Scholar] [CrossRef] [PubMed]
- Rath, P.; Panda, U.C.; Bhatta, D.; Sahu, K.C. Use of sequential leaching, mineralogy, morphology and multivariate statistical technique for quantifying metal pollution in highly polluted aquatic sediments-a case study: Brahamani and Nandirarivers, India. J. Hazard. Mater. 2009, 163, 632–644. [Google Scholar] [CrossRef] [PubMed]
- Tai, P.; Zhao, Q.; Su, D.; Li, P.; Stagnitti, F. Biological toxicity of lanthanide elements on algae. Chemosphere 2010, 80, 1031–1035. [Google Scholar] [CrossRef] [PubMed]
- Zhao, H.; Yang, Q. The suitability of rare earth elements for geographical traceability of tea leaves. J. Sci. Food Agric. 2019, 99, 6509–6514. [Google Scholar] [CrossRef]
- Li, J.; He, E.; Romero-Freire, A.; Cao, X.; Zhao, L.; Qiu, H. Coherent toxicity prediction framework for deciphering the joint effects of rare earth metals (La and Ce) under varied levels of calcium and NTA. Chemosphere 2020, 254, 126905. [Google Scholar] [CrossRef]
- Rasoulnia, P.; Barthen, R.; Lakaniemi, A.-M. A critical review of bioleaching of rare earth elements: The mechanisms and effect of process parameters. Crit. Rev. Environ. Sci. Technol. 2021, 51, 378–427. [Google Scholar] [CrossRef]
- Harbison, R.D.; Bourgeois, M.; Johnson, G.T. (Eds.) Hamilton & Hardy’s Industrial Toxicology, 6th ed.; Wiley: New York, NY, USA, 2015; 682p. [Google Scholar] [CrossRef]
- USEPA. Integrated Risk Information System. Available online: https://www.epa.gov/iris (accessed on 22 September 2022).
- Thomas, P.J.; Carpenter, D.; Boutin, C.; Allison, J.E. Rare earth elements (REEs): Effects on germination and growth of selected crop and native plant species. Chemosphere 2014, 96, 57–66. [Google Scholar] [CrossRef] [PubMed]


| Lake | Geographic Coordinates | Height above Sea Level, m | Maximum Length, km | Maximum Width, km | Lake Area, km2 | Drainage Area, km2 |
|---|---|---|---|---|---|---|
| Ilma * | 67.890713° N, 34.603778° E | 399 | 0.8 | 0.46 | 0.27 | 6.26 |
| Lovozero ** | 67.975035° N, 35.133188° E; 67.943437° N, 35.089683° E | 153.9 | 44.5 | 8.64 | 224.5 | 3770 |
| Krivoe * | 67.962042° N, 34.562104° E | 199.5 | 1.58 | 0.73 | 0.47 | 16.2 |
| Lake | pH | Ca2+ | Mg2+ | Na+ | K+ | HCO3− | SO42− | Cl− | NO2−+NO3− | ∑M * |
|---|---|---|---|---|---|---|---|---|---|---|
| Ilma | 6.68 | 0.45 | 0.10 | 6.95 | 0.76 | 13.36 | 2.26 | 1.10 | 0.307 | 24.98 |
| Krivoe | 6.77 | 5.54 | 1.92 | 10.46 | 2.46 | 36.31 | 6.92 | 4.19 | 0.068 | 67.80 |
| Lovozero | 6.3 | 3.01 | 1.48 | 3.82 | 0.54 | 16.17 | 2.63 | 2.54 | 0.191 | 30.19 |
| Element | 1 | 2 | 3 | 4 | 5 | 6 | 7 | 8 |
|---|---|---|---|---|---|---|---|---|
| Cu | 1.22 ± 0.08 | 1.50 ± 0.11 | 0.62 ± 0.04 | 1.65 ± 0.12 | 0.53 ± 0.03 | 0.98 ± 0.10 | 1 | - |
| Zn | 4.84 ± 0.17 | 64.58 ± 1.20 | 1.52 ± 0.11 | 55.69 ± 1.70 | 2.01 ± 0.11 | 39.89 ± 1.30 | 10 | - |
| Mn | 31.49 ± 0.65 | 109.35 ± 4.17 | 16.57 ± 0.62 | 256.41 ± 5.80 | 1.14 ± 0.08 | 17.13 ± 0.24 | 10 | - |
| Al | 77.18 ± 1.04 | 29.09 ± 1.21 | 124.82 ± 3.11 | 140.31 ± 2.93 | 65.93 ± 1.41 | 115.47 ± 4.71 | 40 | - |
| La | 0.33 ± 0.04 | 0.35 ± 0.03 | 1.25 ± 0.09 | 1.83 ± 0.08 | 0.91 ± 0.03 | 0.73 ± 0.02 | - | 0.06–0.2 |
| Ce | 0.50 ± 0.02 | 0.55 ± 0.07 | 2.10 ± 0.14 | 3.59 ± 0.12 | 0.51 ± 0.02 | 1.13 ± 0.05 | - | 0.08–2 |
| Pr | 0.08 ± 0.01 | 0.06 ± 0.01 | 0.22 ± 0.01 | 0.45 ± 0.02 | 0.17 ± 0.01 | 0.14 ± 0.01 | - | 0.007 |
| Nd | 0.31 ± 0.02 | 0.20 ± 0.01 | 0.69 ± 0.02 | 1.39 ± 0.10 | 0.45 ± 0.02 | 0.48 ± 0.01 | - | 0.040 |
| Sm | 0.05 ± 0.01 | 0.03 ± 0.01 | 0.10 ± 0.01 | 0.19 ± 0.02 | 0.08 ± 0.01 | 0.08 ± 0.01 | - | 0.008–1 |
| Eu | 0.01 ± 0.01 | 0.01 ± 0.01 | 0.02 ± 0.01 | 0.05 ± 0.01 | 0.02 ± 0.01 | 0.02 ± 0.01 | - | 0.001–0.03 |
| Gd | 0.05 ± 0.01 | 0.03 ± 0.01 | 0.09 ± 0.01 | 0.17 ± 0.01 | 0.07 ± 0.01 | 0.07 ± 0.01 | - | 0.0080 |
| Tb | 0.01 ± 0.01 | 0.00 | 0.01 ± 0.01 | 0.02 ± 0.01 | 0.01 ± 0.01 | 0.01 ± 0.01 | - | 0.001 |
| Dy | 0.04 ± 0.01 | 0.02 ± 0.01 | 0.04 ± 0.01 | 0.09 ± 0.01 | 0.06 ± 0.01 | 0.06 ± 0.01 | - | - |
| Ho | 0.01 ± 0.01 | 0.00 | 0.01 ± 0.01 | 0.02 ± 0.01 | 0.01 ± 0.01 | 0.01 ± 0.01 | - | 0.0010 |
| Er | 0.03 ± 0.01 | 0.01 ± 0.01 | 0.02 ± 0.01 | 0.05 ± 0.01 | 0.03 ± 0.01 | 0.03 ± 0.01 | - | 0.0040 |
| Tm | 0.00 | 0.00 | 0.00 | 0.01 ± 0.01 | 0.01 ± 0.01 | 0.01 ± 0.01 | - | 0.0010 |
| Yb | 0.03 ± 0.01 | 0.01 ± 0.01 | 0.02 ± 0.01 | 0.04 ± 0.01 | 0.03 ± 0.01 | 0.03 ± 0.01 | - | 0.004–0.085 |
| Lu | 0.01 ± 0.01 | 0.00 | 0.00 | 0.01 ± 0.01 | 0.01 ± 0.01 | 0.00 | - | 0.0010 |
| Y | 0.33 ± 0.02 | 0.13 ± 0.01 | 0.23 ± 0.02 | 0.49 ± 0.03 | 0.38 ± 0.02 | 0.36 ± 0.01 | - | 0.03–0.7 |
| Lake | Layer, cm | Cu | Ni | Zn | Cr | Cd | Pb | Sr | Mn | RI |
|---|---|---|---|---|---|---|---|---|---|---|
| Krivoe | 0–7 | - | ||||||||
| 13–14 | - | |||||||||
| EF | 1.77 | 0.97 | 0.78 | 1.10 | 1.08 | 1.30 | 1.35 | 1.13 | - | |
| Igeo | 0.07 | −0.19 | −0.29 | −0.14 | −0.14 | −0.06 | −0.05 | −0.12 | - | |
| Eir | 8.87 | 4.86 | 0.78 | 2.20 | 32.50 | 6.51 | - | - | 55.71 | |
| Ilma | 0–7 | - | ||||||||
| 15–16 | - | |||||||||
| EF | 1.41 | 0.82 | 1.07 | 1.99 | 0.95 | 3.96 | 1.94 | 1.88 | - | |
| Igeo | −0.03 | −0.26 | −0.15 | 0.12 | −0.20 | 0.42 | 0.11 | 0.10 | - | |
| Eir | 7.06 | 4.12 | 1.07 | 3.98 | 28.36 | 19.78 | - | - | 64.37 | |
| Lovozero, northern part | 0–7 | - | ||||||||
| 8–9 | - | |||||||||
| EF | 0.93 | 0.88 | 0.65 | 0.88 | 0.78 | 4.87 | 1.03 | 0.96 | - | |
| Igeo | −0.21 | −0.23 | −0.37 | −0.23 | −0.28 | 0.51 | −0.16 | −0.19 | - | |
| Eir | 4.64 | 4.41 | 0.65 | 1.75 | 23.42 | 24.35 | - | - | 59.21 | |
| Lovozero, Sergevan | 0–7 | - | ||||||||
| 8–9 | - | |||||||||
| EF | 1.34 | 1.03 | 0.69 | 1.04 | 1.26 | 1.41 | 1.23 | 1.23 | - | |
| Igeo | −0.05 | −0.16 | −0.34 | −0.16 | −0.08 | −0.03 | −0.09 | −0.09 | - | |
| Eir | 6.68 | 5.16 | 0.69 | 2.07 | 37.72 | 7.06 | - | - | 59.39 |
| Lake | Layer, cm | La | Ce | Pr | Nd | Sm | Eu | Gd | |
| Krivoe | 0–7 | ||||||||
| 13–14 | |||||||||
| EF | 1.56 | 1.52 | 1.65 | 1.43 | 1.49 | 1.13 | 1.47 | ||
| Igeo | 0.02 | 0.01 | 0.04 | −0.02 | 0.00 | −0.12 | −0.01 | ||
| Eir | 1.56 | 1.52 | 8.25 | 2.86 | 7.45 | 11.27 | 7.33 | ||
| Ilma | 0–7 | ||||||||
| 15–16 | |||||||||
| EF | 2.96 | 2.65 | 2.68 | 2.16 | 1.67 | 1.19 | 1.26 | ||
| Igeo | 0.29 | 0.25 | 0.25 | 0.16 | 0.05 | −0.10 | −0.07 | ||
| Eir | 2.96 | 2.65 | 13.42 | 4.33 | 8.34 | 11.86 | 6.31 | ||
| Lovozero, northern part | 0–7 | ||||||||
| 8–9 | |||||||||
| EF | 1.31 | 1.29 | 1.19 | 1.11 | 1.03 | 0.89 | 0.69 | ||
| Igeo | −0.06 | −0.06 | −0.10 | −0.13 | −0.16 | −0.23 | −0.34 | ||
| Eir | 1.31 | 1.29 | 5.93 | 2.21 | 5.13 | 8.93 | 3.46 | ||
| Lovozero, Sergevan | 0–7 | ||||||||
| 8–9 | |||||||||
| EF | 1.59 | 1.61 | 2.00 | 1.39 | 1.31 | 1.06 | 1.42 | ||
| Igeo | 0.02 | 0.03 | 0.12 | −0.03 | −0.06 | −0.15 | −0.02 | ||
| Eir | 1.59 | 1.61 | 10.00 | 2.79 | 6.55 | 10.58 | 7.10 | ||
| Lake | Layer, cm | Tb | Dy | Ho | Er | Tm | Yb | Lu | RI |
| Krivoe | 0–7 | - | |||||||
| 13–14 | - | ||||||||
| EF | 1.04 | 0.96 | 0.80 | 0.97 | 0.96 | 0.93 | 0.73 | - | |
| Igeo | −0.16 | −0.20 | −0.27 | −0.19 | −0.20 | −0.21 | −0.32 | - | |
| Eir | 10.39 | 4.78 | 8.00 | 4.85 | 9.56 | 4.63 | 14.52 | 96.97 | |
| Ilma | 0–7 | - | |||||||
| 15–16 | - | ||||||||
| EF | 1.17 | 1.22 | 1.02 | 1.01 | 1.15 | 1.15 | 1.12 | - | |
| Igeo | −0.11 | −0.09 | −0.17 | −0.17 | −0.12 | −0.12 | −0.13 | - | |
| Eir | 11.68 | 6.12 | 10.22 | 5.03 | 11.50 | 5.75 | 22.36 | 122.50 | |
| Lovozero, northern part | 0–7 | - | |||||||
| 8–9 | - | ||||||||
| EF | 0.69 | 0.72 | 0.74 | 0.63 | 0.70 | 0.68 | 0.67 | - | |
| Igeo | −0.34 | −0.32 | −0.31 | −0.38 | −0.33 | −0.34 | −0.35 | - | |
| Eir | 6.86 | 3.58 | 7.35 | 3.16 | 7.03 | 3.42 | 13.41 | 73.07 | |
| Lovozero, Sergevan | 0–7 | - | |||||||
| 8–9 | - | ||||||||
| EF | 1.21 | 1.16 | 1.08 | 1.13 | 1.19 | 1.19 | 1.13 | - | |
| Igeo | −0.09 | −0.11 | −0.14 | −0.12 | −0.10 | −0.10 | −0.12 | - | |
| Eir | 12.12 | 5.78 | 10.80 | 5.67 | 11.95 | 5.95 | 22.65 | 115.13 |
| Element | BS Lake Ilma | BS Lake Lovozero (Sergevan) | BS Lake Krivoe | Clarke Number of Elements in the Earth’s Crust | Limit of Contents in BS of Freshwater Ecosystems | BS Lake Imandra |
|---|---|---|---|---|---|---|
| La | 30.00 | 19.5–100 | 103.00 | |||
| Ce | 50.00 | 43–100 | 172.00 | |||
| Pr | 5.00 | 8–8.3 | 21.00 | |||
| Nd | 23.00 | 19–44 | 79.00 | |||
| Sm | 6.50 | 3.3–30 | 12.00 | |||
| Eu | 1.00 | 0.07–12.2 | 3.10 | |||
| Gd | 6.50 | 5.0–6.0 | 12.00 | |||
| Tb | 0.90 | 0.3–1.1 | 1.20 | |||
| Dy | 4.50 | 1.8–4.5 | 6.70 | |||
| Ho | 1.00 | 0.9–1.0 | 1.10 | |||
| Er | 2.50 | 2.6–3.0 | 3.00 | |||
| Tm | 0.25 | 0.40 | 0.37 | |||
| Yb | 3.00 | 1.4–4.4 | 2.30 | |||
| Lu | 0.70 | 0.2–0.5 | 0.29 |
| Variable | La | Ce | Pr | Nd | Sm | Eu | Gd | Tb | Dy | Ho | Er | Tm | Yb | Lu | Cu | Ni | Zn | Cr | Cd | Pb | Sr | Mn | Fe | OC |
|---|---|---|---|---|---|---|---|---|---|---|---|---|---|---|---|---|---|---|---|---|---|---|---|---|
| La | 1.000 | 1.000 | 0.986 | 0.999 | 0.958 | 0.281 | 0.033 | 0.075 | −0.172 | −0.283 | −0.204 | −0.412 | −0.057 | −0.091 | 0.863 | −0.045 | −0.927 | −0.620 | −0.570 | 0.973 | 0.900 | 0.874 | 0.783 | 0.962 |
| Ce | 0.999 | 1.000 | 0.986 | 0.999 | 0.958 | 0.277 | 0.037 | 0.079 | −0.169 | −0.278 | −0.194 | −0.404 | −0.052 | −0.086 | 0.861 | −0.049 | −0.925 | −0.624 | −0.567 | 0.974 | 0.900 | 0.879 | 0.782 | 0.964 |
| Pr | 0.997 | 0.998 | 1.000 | 0.985 | 0.908 | 0.206 | 0.048 | 0.137 | −0.100 | −0.196 | −0.156 | −0.396 | −0.079 | −0.096 | 0.804 | −0.116 | −0.873 | −0.604 | −0.608 | 0.966 | 0.872 | 0.844 | 0.818 | 0.958 |
| Nd | 0.998 | 0.998 | 1.000 | 1.000 | 0.962 | 0.311 | 0.045 | 0.085 | −0.159 | −0.278 | −0.208 | −0.409 | −0.048 | −0.080 | 0.870 | −0.023 | −0.929 | −0.603 | −0.579 | 0.972 | 0.906 | 0.868 | 0.787 | 0.954 |
| Sm | 0.975 | 0.974 | 0.983 | 0.984 | 1.000 | 0.432 | 0.139 | 0.073 | −0.172 | −0.308 | −0.208 | −0.329 | 0.090 | −0.004 | 0.950 | 0.173 | −0.960 | −0.564 | −0.602 | 0.900 | 0.898 | 0.836 | 0.692 | 0.910 |
| Eu | 0.508 | 0.551 | 0.525 | 0.517 | 0.506 | 1.000 | 0.494 | 0.425 | 0.370 | 0.153 | 0.135 | 0.246 | 0.529 | 0.578 | 0.422 | 0.533 | −0.350 | 0.185 | −0.204 | 0.274 | 0.484 | 0.343 | 0.290 | 0.063 |
| Gd | 0.896 | 0.892 | 0.915 | 0.913 | 0.967 | 0.417 | 1.000 | 0.875 | 0.858 | 0.804 | 0.801 | 0.842 | 0.959 | 0.884 | 0.115 | 0.327 | −0.031 | 0.108 | −0.550 | −0.061 | 0.103 | 0.095 | 0.079 | 0.014 |
| Tb | 0.856 | 0.845 | 0.870 | 0.870 | 0.928 | 0.319 | 0.982 | 1.000 | 0.960 | 0.914 | 0.821 | 0.760 | 0.763 | 0.779 | 0.018 | 0.210 | 0.104 | 0.279 | −0.393 | 0.080 | 0.234 | 0.233 | 0.370 | 0.005 |
| Dy | 0.738 | 0.741 | 0.773 | 0.770 | 0.855 | 0.418 | 0.941 | 0.931 | 1.000 | 0.972 | 0.844 | 0.834 | 0.759 | 0.808 | −0.214 | 0.174 | 0.313 | 0.399 | −0.289 | −0.171 | −0.021 | −0.031 | 0.146 | −0.236 |
| Ho | 0.557 | 0.559 | 0.594 | 0.593 | 0.722 | 0.344 | 0.854 | 0.857 | 0.947 | 1.000 | 0.889 | 0.862 | 0.708 | 0.741 | −0.349 | 0.069 | 0.440 | 0.388 | −0.224 | −0.281 | −0.165 | −0.125 | 0.046 | −0.295 |
| Er | 0.628 | 0.628 | 0.651 | 0.649 | 0.757 | 0.449 | 0.863 | 0.888 | 0.891 | 0.940 | 1.000 | 0.932 | 0.807 | 0.855 | −0.340 | −0.132 | 0.303 | 0.079 | −0.121 | −0.215 | −0.171 | 0.041 | −0.083 | −0.169 |
| Tm | 0.638 | 0.640 | 0.663 | 0.664 | 0.784 | 0.425 | 0.875 | 0.869 | 0.899 | 0.964 | 0.962 | 1.000 | 0.887 | 0.880 | −0.375 | 0.137 | 0.422 | 0.288 | −0.067 | −0.448 | −0.311 | −0.179 | −0.280 | −0.397 |
| Yb | 0.289 | 0.281 | 0.308 | 0.312 | 0.467 | 0.155 | 0.620 | 0.664 | 0.689 | 0.874 | 0.876 | 0.902 | 1.000 | 0.932 | 0.051 | 0.314 | −0.006 | 0.069 | −0.383 | −0.152 | 0.010 | 0.068 | −0.097 | −0.071 |
| Lu | 0.304 | 0.299 | 0.328 | 0.328 | 0.484 | 0.198 | 0.640 | 0.670 | 0.692 | 0.874 | 0.890 | 0.906 | 0.987 | 1.000 | −0.125 | 0.088 | 0.063 | 0.063 | −0.219 | −0.138 | −0.035 | 0.078 | −0.100 | −0.147 |
| Cu | 0.201 | 0.186 | 0.143 | 0.146 | 0.049 | 0.072 | −0.096 | −0.067 | −0.388 | −0.431 | −0.132 | −0.216 | −0.226 | −0.194 | 1.000 | 0.422 | −0.888 | −0.376 | −0.630 | 0.790 | 0.867 | 0.699 | 0.663 | 0.811 |
| Ni | 0.139 | 0.118 | 0.078 | 0.083 | −0.040 | −0.124 | −0.199 | −0.168 | −0.498 | −0.584 | −0.334 | −0.402 | −0.419 | −0.399 | 0.958 | 1.000 | −0.019 | 0.585 | −0.205 | −0.082 | 0.269 | −0.040 | 0.159 | −0.160 |
| Zn | 0.002 | 0.033 | 0.038 | 0.021 | 0.048 | 0.373 | 0.039 | −0.113 | −0.012 | 0.025 | −0.004 | 0.061 | −0.052 | 0.083 | −0.040 | −0.123 | 1.000 | 0.719 | 0.599 | −0.839 | −0.764 | −0.721 | −0.524 | −0.908 |
| Cr | 0.164 | 0.150 | 0.102 | 0.110 | −0.016 | −0.029 | −0.214 | −0.222 | −0.518 | −0.600 | −0.388 | −0.391 | −0.445 | −0.435 | 0.918 | 0.960 | −0.038 | 1.000 | 0.364 | −0.521 | −0.243 | −0.449 | −0.065 | −0.751 |
| Cd | −0.784 | −0.809 | −0.792 | −0.794 | −0.781 | −0.755 | −0.653 | −0.526 | −0.556 | −0.440 | −0.434 | −0.552 | −0.201 | −0.214 | −0.034 | 0.064 | −0.306 | −0.116 | 1.000 | −0.406 | −0.421 | −0.250 | −0.387 | −0.614 |
| Pb | 0.363 | 0.347 | 0.303 | 0.308 | 0.178 | 0.112 | −0.002 | 0.024 | −0.293 | −0.428 | −0.155 | −0.240 | −0.349 | −0.337 | 0.947 | 0.953 | −0.185 | 0.923 | −0.147 | 1.000 | 0.931 | 0.924 | 0.858 | 0.905 |
| Sr | 0.497 | 0.491 | 0.446 | 0.449 | 0.331 | 0.298 | 0.137 | 0.120 | −0.171 | −0.304 | −0.043 | −0.088 | −0.263 | −0.232 | 0.921 | 0.889 | 0.016 | 0.907 | −0.375 | 0.962 | 1.000 | 0.903 | 0.911 | 0.780 |
| Mn | 0.162 | 0.137 | 0.113 | 0.111 | 0.021 | −0.143 | −0.074 | −0.026 | −0.365 | −0.425 | −0.150 | −0.266 | −0.257 | −0.201 | 0.933 | 0.938 | −0.009 | 0.827 | 0.161 | 0.876 | 0.815 | 1.000 | 0.798 | 0.806 |
| Fe | 0.257 | 0.242 | 0.217 | 0.214 | 0.142 | 0.018 | 0.036 | 0.028 | −0.280 | −0.318 | −0.067 | −0.126 | −0.170 | −0.086 | 0.904 | 0.870 | 0.277 | 0.820 | −0.063 | 0.810 | 0.839 | 0.941 | 1.000 | 0.668 |
| OC | −0.076 | −0.111 | −0.126 | −0.125 | −0.184 | −0.396 | −0.210 | −0.109 | −0.435 | −0.424 | −0.171 | −0.309 | −0.160 | −0.126 | 0.821 | 0.839 | −0.191 | 0.675 | 0.466 | 0.723 | 0.590 | 0.934 | 0.801 | 1.000 |
Publisher’s Note: MDPI stays neutral with regard to jurisdictional claims in published maps and institutional affiliations. |
© 2022 by the authors. Licensee MDPI, Basel, Switzerland. This article is an open access article distributed under the terms and conditions of the Creative Commons Attribution (CC BY) license (https://creativecommons.org/licenses/by/4.0/).
Share and Cite
Krasavtseva, E.; Sandimirov, S.; Elizarova, I.; Makarov, D. Assessment of Trace and Rare Earth Elements Pollution in Water Bodies in the Area of Rare Metal Enterprise Influence: A Case Study—Kola Subarctic. Water 2022, 14, 3406. https://doi.org/10.3390/w14213406
Krasavtseva E, Sandimirov S, Elizarova I, Makarov D. Assessment of Trace and Rare Earth Elements Pollution in Water Bodies in the Area of Rare Metal Enterprise Influence: A Case Study—Kola Subarctic. Water. 2022; 14(21):3406. https://doi.org/10.3390/w14213406
Chicago/Turabian StyleKrasavtseva, Eugenia, Sergey Sandimirov, Irina Elizarova, and Dmitriy Makarov. 2022. "Assessment of Trace and Rare Earth Elements Pollution in Water Bodies in the Area of Rare Metal Enterprise Influence: A Case Study—Kola Subarctic" Water 14, no. 21: 3406. https://doi.org/10.3390/w14213406