
Spatiotemporal Changes in Water Quality Parameters and the Eutrophication in Lake Erhai of Southwest China
by
 , ,
, ,
Kun Chen
1,
Lizeng Duan
2,*,
Qi Liu
2,
Yang Zhang
2,
Xiaonan Zhang
2,
Fengwen Liu
2 and
Hucai Zhang
2,* 1
Institute for International Rivers and Eco-Security, Yunnan University, Kunming 650500, China
2
Institute for Ecological Research and Pollution Control of Plateau Lakes, School of Ecology and Environmental Science, Yunnan University, Kunming 650500, China
*
Authors to whom correspondence should be addressed.
Water 2022, 14(21), 3398; https://doi.org/10.3390/w14213398
Submission received: 8 September 2022
/
Revised: 23 October 2022
/
Accepted: 24 October 2022
/
Published: 26 October 2022
(This article belongs to the Special Issue Plateau Lake Water Quality and Eutrophication: Status and Challenges)
Abstract
:To understand the lake status and reasons of eutrophication at Lake Erhai in recent years, water quality, including water temperature (T), pH, dissolved oxygen (DO), total nitrogen (TN), total phosphorus (TP) and chlorophyll-a (Chl-a) from 2016 to 2020 was monitored and analyzed. The results showed no obvious thermocline in the vertical direction at Lake Erhai, while Chl-a demonstrated obvious spatiotemporal distribution characteristics in Lake Erhai. Chl-a concentrations increased to a maximum in summer in August with the low TN:TP value, leading to algal blooms, most notably in the southern lakes. Low pH and DO appeared due to the thermocline of Erhai Lake (August 2016). A large area of algae distribution due to the increase of total phosphorus appeared in the northern lake area of Lake Erhai in December 2016, with a tendency of mesotrophic to light eutrophic in summer by the nutritional evaluation of Lake Erhai, especially in the central lake area and the northern lake area. Pearson’s correlation coefficient and principal component analysis showed a significant positive correlation between Chl-a and T (r = 0.34, p ≤ 0.01) and TP (r = 0.31 p ≤ 0.01) in the mesotrophic Lake Erhai, indicating that TP content was one of the triggering factors for the algal blooming. Based on the spatiotemporal changes in water quality parameters and their relationship with eutrophication, scientific agencies should implement management strategies to protect Lake Erhai, supplemental to the costly engineering measurements.
1. Introduction
The study of lakes eutrophication is important to understand the changes in their ecological environment under the influence of natural and human activities [1]. Research on the seasonal vertical distribution characteristics of physical and chemical parameters of plateau lakes helps identify corresponding environmental indicators and assess changes in the ecosystems of plateau lakes, indicating the importance of long-term and continuous monitoring and research [2,3]. The heat distribution of the lake water affects its stratification and mixing, resulting in changes in its physical and chemical parameters [4,5]. T measurement shows that the temperature of lakes has a strong seasonal variation, while stratification shows that they have a seasonal pattern, suggesting that lakes can be classified based on T [6]. The research results indicated that typical eutrophic non-aquaculture water had mean concentrations of Chl-a of higher than 10 μg/L, and significant positive correlations were found between pH, DO and Chl-a. When the mean concentration of Chl-a was less than 10 μg/L, no correlation was found between DO and Chl-a for waters with a high exchange rate or heavily organically polluted natural waters [7].
External nutrients inputs above a critical level may drive shallow lakes to shift from clear water to a turbid state, enhanced eutrophication process, and the biomass of submerged macrophyte and dominance community changed by nutrient input [8,9]. The algal growth was often within a certain range in lakes caused by nutrient input. The study of Hou et al. showed that the lake water in Chenghai appeared temperature stratification in summer. Induces nutrient release from lake sediments and promotes eutrophication resulting from cyanobacterial reproduction in the upper thermocline [10]. The eutrophication of lakes is usually affected by total nitrogen or total phosphorus. When different types of exogenous polluted water flows into the lake, the N/P ratio will change, resulting in changes in the nitrogen and phosphorus limitation of the lake. It has been reported that the nutrient status of Jianhu has gradually shifted from N-limited (2000–2010) to P-limited in recent years (2010–2018) [11]. There have a study assessed the actual water situation in the estuarine area of Lake Taihu, China, based on eutrophication levels and status of water quality using the trophic level index (TLI) and water quality index (WQI) methods. In the wet (August 2017) and dry (March 2018) seasons, the average TLI and WQI values in the wet season were worse than that in the dry season (TLI: 57.40, WQI: 65.74), and P may be the main factor in the dry season [12].
Previous studies on Lake Erhai mostly focused on the analysis of imported phosphorus species in Lake Erhai [13], the role of sediment bioavailability phosphorus in algal growth [14], historical changes in water level and responses to human activities and climate change [15]. Comparatively, this study aimed to analyze the monitoring data of Lake Erhai from 2016 to 2020, investigate the vertical and horizontal distribution characteristics of the physical and chemical parameters in recent years, as well as the seasonal change processes, and analyze their relationship with eutrophication to provide a scientific basis for the environmental restoration and eutrophication mitigation of Lake Erhai.
2. Materials and Methods
2.1. Overview of the Study Area
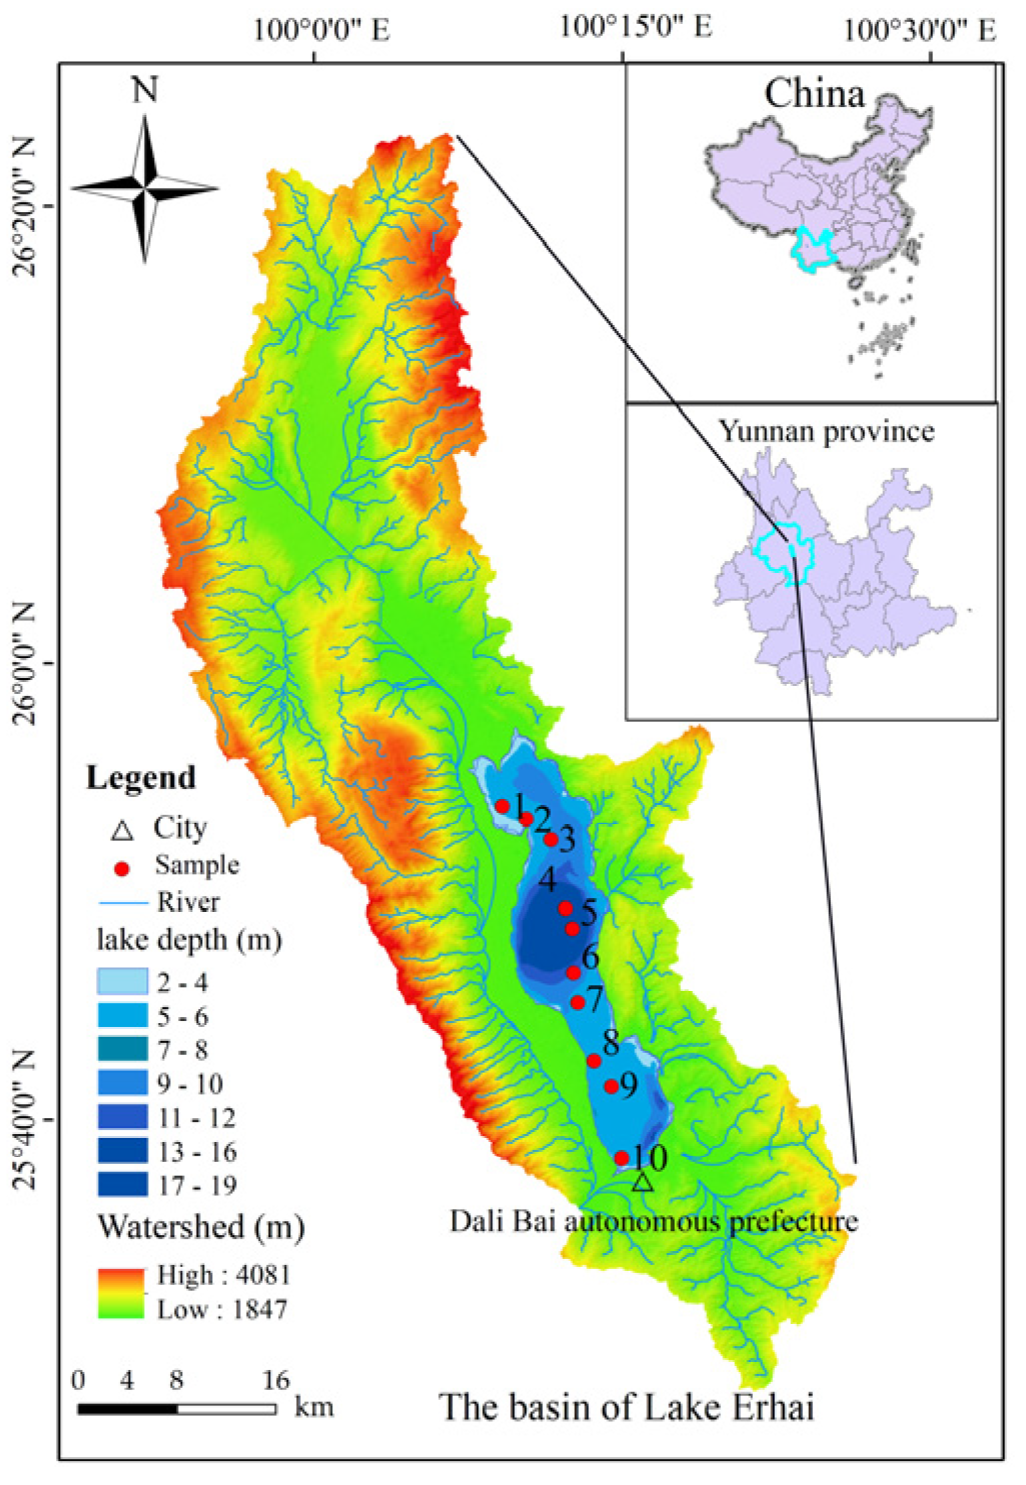
Lake Erhai is located in the central part of the Dali Bai Autonomous Prefecture in Yunnan (100°05′ E 100°17′ E, 25°36′ N 25°58′ N) and is a shallow plateau lake formed by tectonic and rifting movement (Figure 1). It belongs to the Lancang River Basin, originating from Cibi Lake in Eryuan County. Its water source is from Bagu Mountain via the Mizhi River in the north and Xier River in the west and relies on surface runoff and lake precipitation. The annual water volume of the lake is 13.78 × 10⁸ m3, with an area of 256.5 km2, water storage capacity of 270 × 108 m3, average water depth of about 10.5 m, deepest depth reaching up to 20.9 m, and a water retention time of about 2.75 years [16]. Lake Erhai has a subtropical plateau monsoon climate, with mild four seasons, low average temperature, large daily range, long daylight hours, and clear dry and rainy seasons.
Erhai Basin has a total population of 883,900, and the urban population is mainly concentrated in the western and southern regions. The western basin of Lake Erhai is the main agricultural area and the high-value areas of pollution discharge in the basin are concentrated in the northern area of Lake Erhai. From 2007 to 2017, the non-point source pollution discharge in Erhai Basin accounted for 94.10% of the total discharge in the basin [17].
2.2. Data Collection and Research Methods
To comprehensively and systematically investigate Lake Erhai’s water quality status and seasonal changes, water samples were collected from January 2016 to June 2020. A total of 10 sites were set up from north to south for fixed-point monitoring, of which sites 1–3 were located in the northern lake area of Lake Erhai, sites 4–7 in the middle lake area and sites 8–10 in the southern lake area. The water quality parameters, including temperature, pH, DO and Chl-a, were measured simultaneously, using YSI multiparameter sonde (product model: EXO2, United States, sampling frequency: 0.2 s) at the sampling site at 1 m interval.
Because water depth in most of the Lake Erhai is less than 5 m, we selected the measured date at 1 m and 5 m depth to discuss and the data at 1 m and 5 m from January, April, August and October 2017 were used to draw a heat map for seasonal comparison (representing winter, spring, summer, and autumn). The depth data at 1 m, 5 m, 10 m and 15 m from January 2016 to June 2020 (averaged data of each month) were used to analyze the change in trends and investigate long-term series change. Sites 2, 7 and 10 (representing the northern, central and southern parts of the lake) were used to assess TN and TP, and analyze the changing trends of different depths and long-term series in the three lake areas.
The water quality evaluation of surface layer mainly used the lake eutrophication level scoring standard of Aizaki Morihiro to score the three sampling site 2, 7 and 10 (Table 1), and used the Carson index method to classify the monitoring site [18].
From the six water quality parameters, we selected all corresponding data (at the same depth and time: total 287 groups) at sites 2, 7, and 10 for Pearson correlation analysis to determine the causes of the higher Chl-a content in the water environment of Lake Erhai. At the same time, the 1 m, 5 m and 10 m depth data (at the same depth and time: total 76 groups) at sites 2, 7 and 10 were selected for principal component analysis to investigate the correlation between temperature, water quality parameters and TP and Chl-a. The above analysis was conducted by origin (version: 2021b).
3. Results
3.1. Spatiotemporal Changes in Water Quality Parameters
3.1.1. Spatiotemporal Changes in T
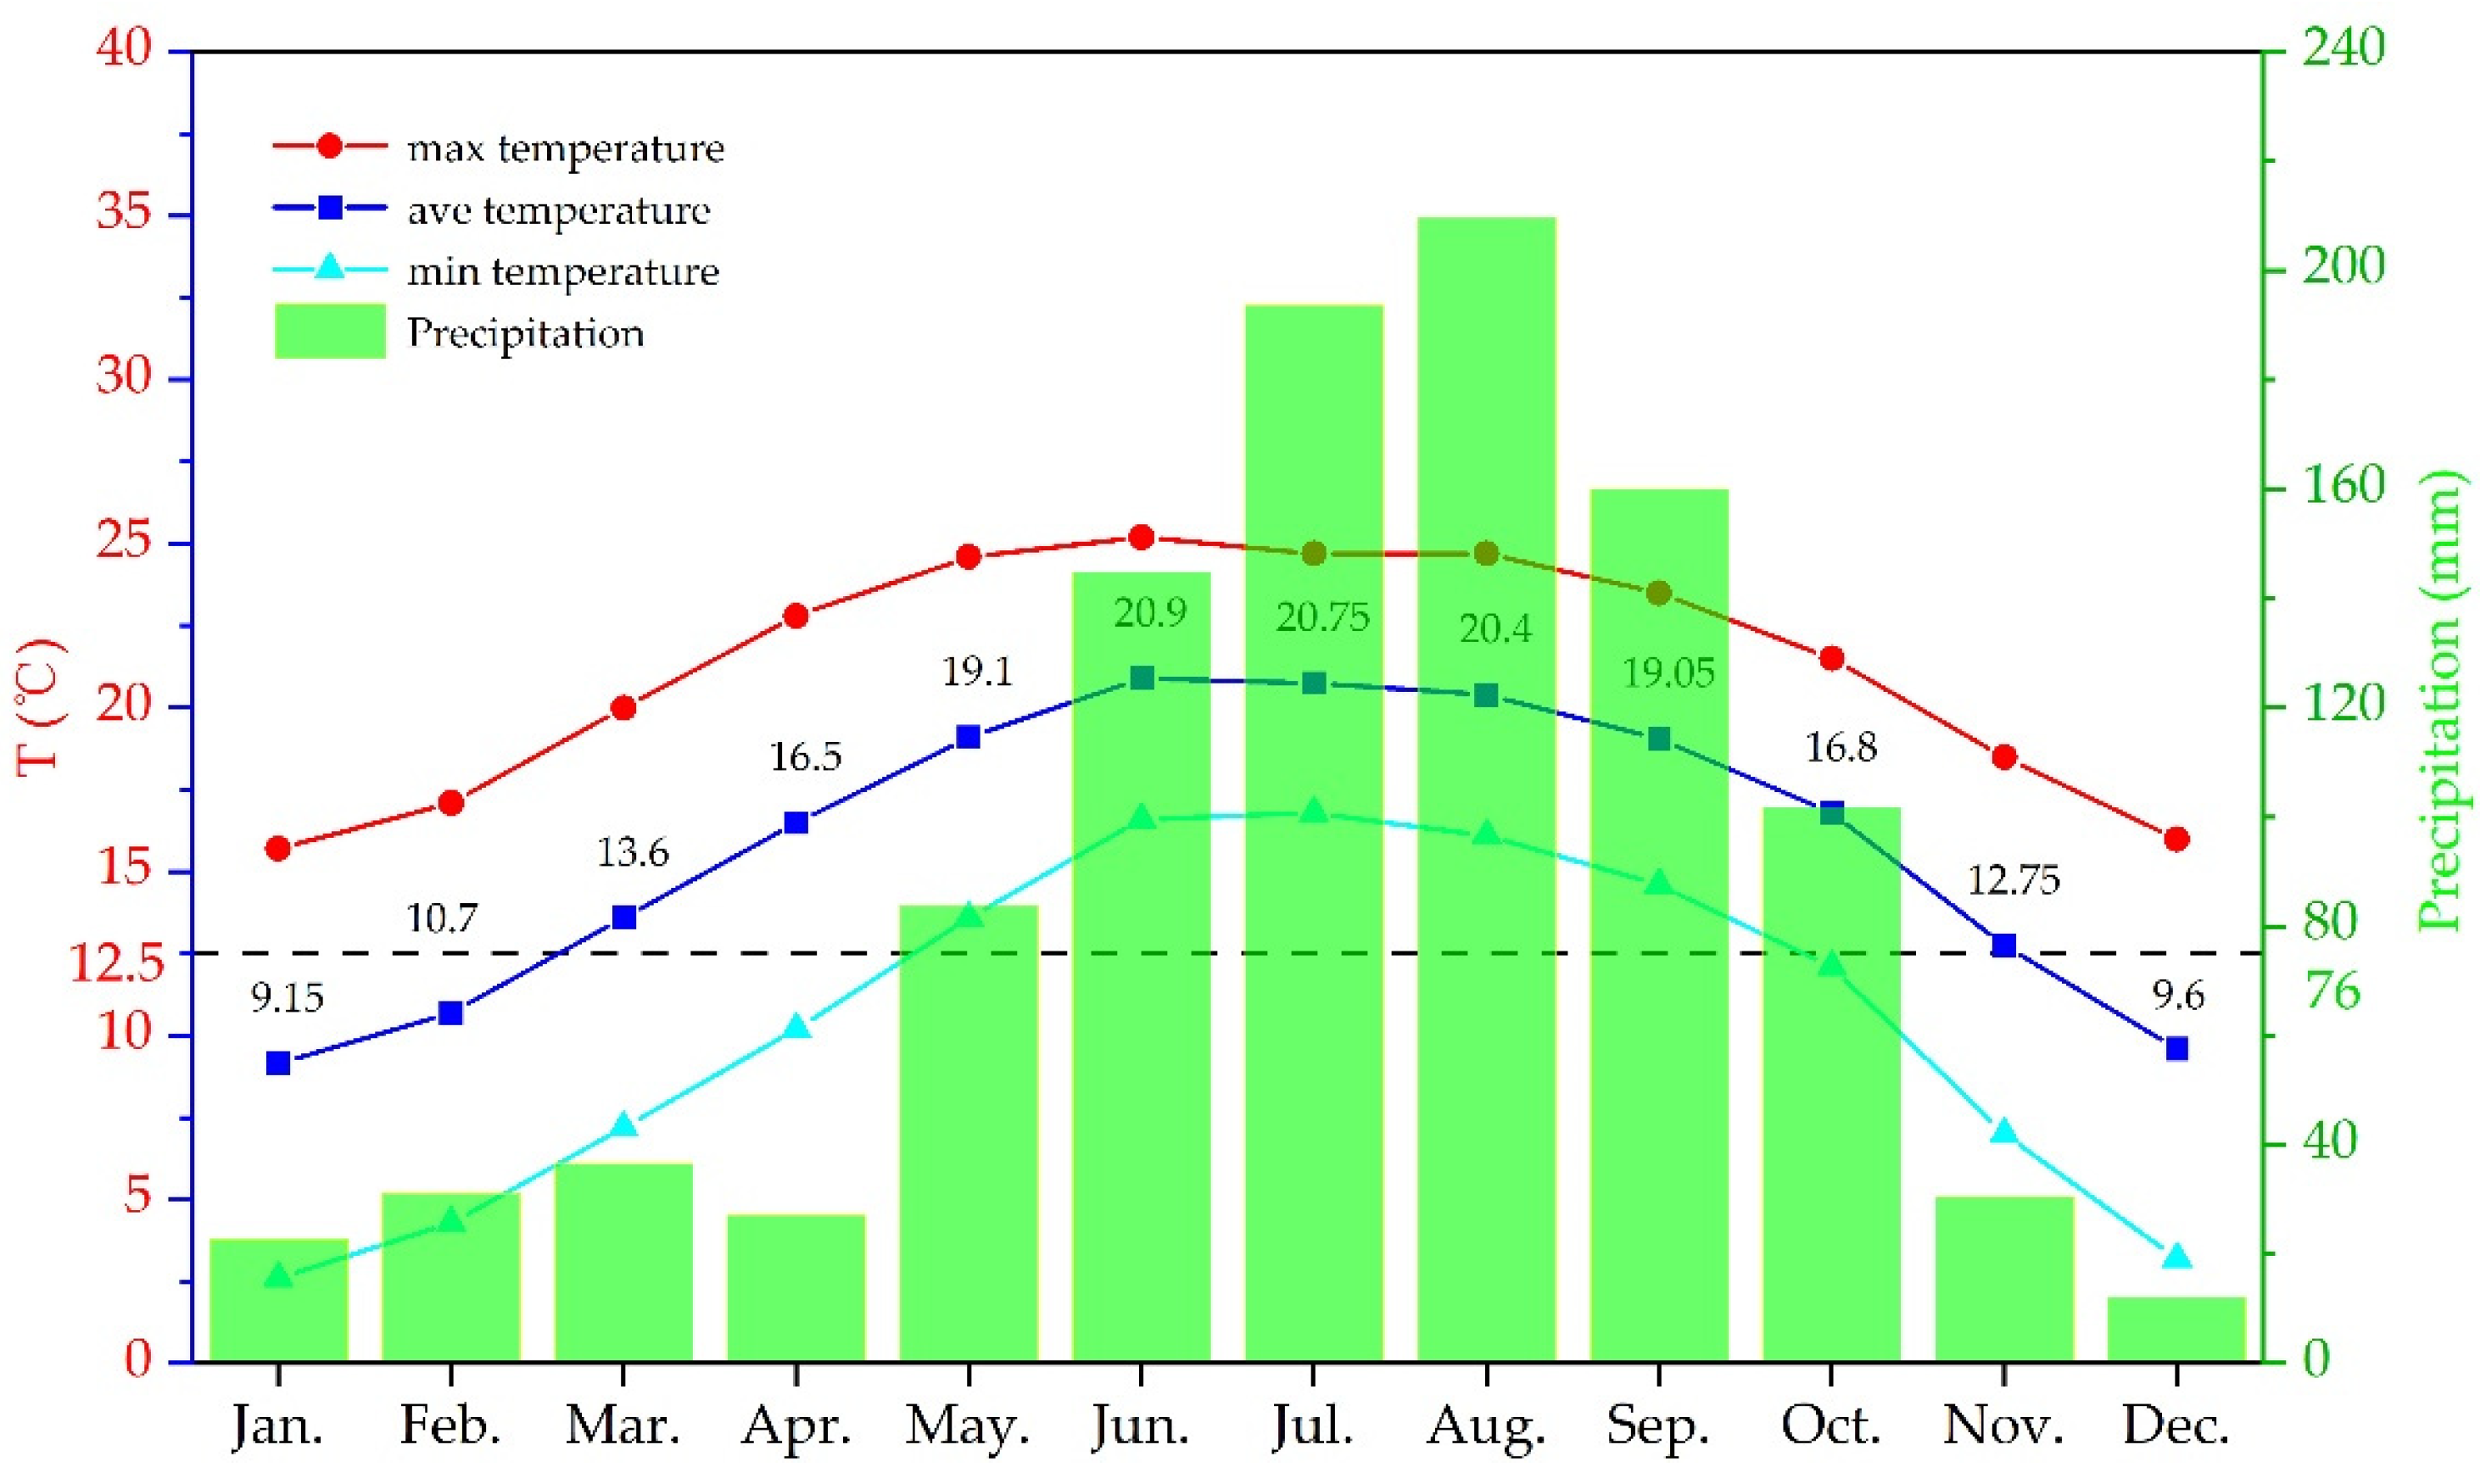
According to the meteorological data from 1981 to 2010 (data source: www.nmc.cn (accessed on 1 May 2022), the annual average precipitation at Dali Bai autonomous prefecture is about 1078.9 mm, with monthly average precipitation in the rainy season from May to October greater than 76 mm, accounting for 85–96% of the annual precipitation (Figure 2). Years of meteorological data as the basis for the division of dry and rainy seasons. Precipitation and temperature has obvious distribution characteristics in dry and rainy seasons, of which May-October is the rainy season, with an average temperature >15 °C. The dry season is from November to April and has an average temperature <15 °C. Thus, the dry season is from January to April and the rainy season is from May to October.
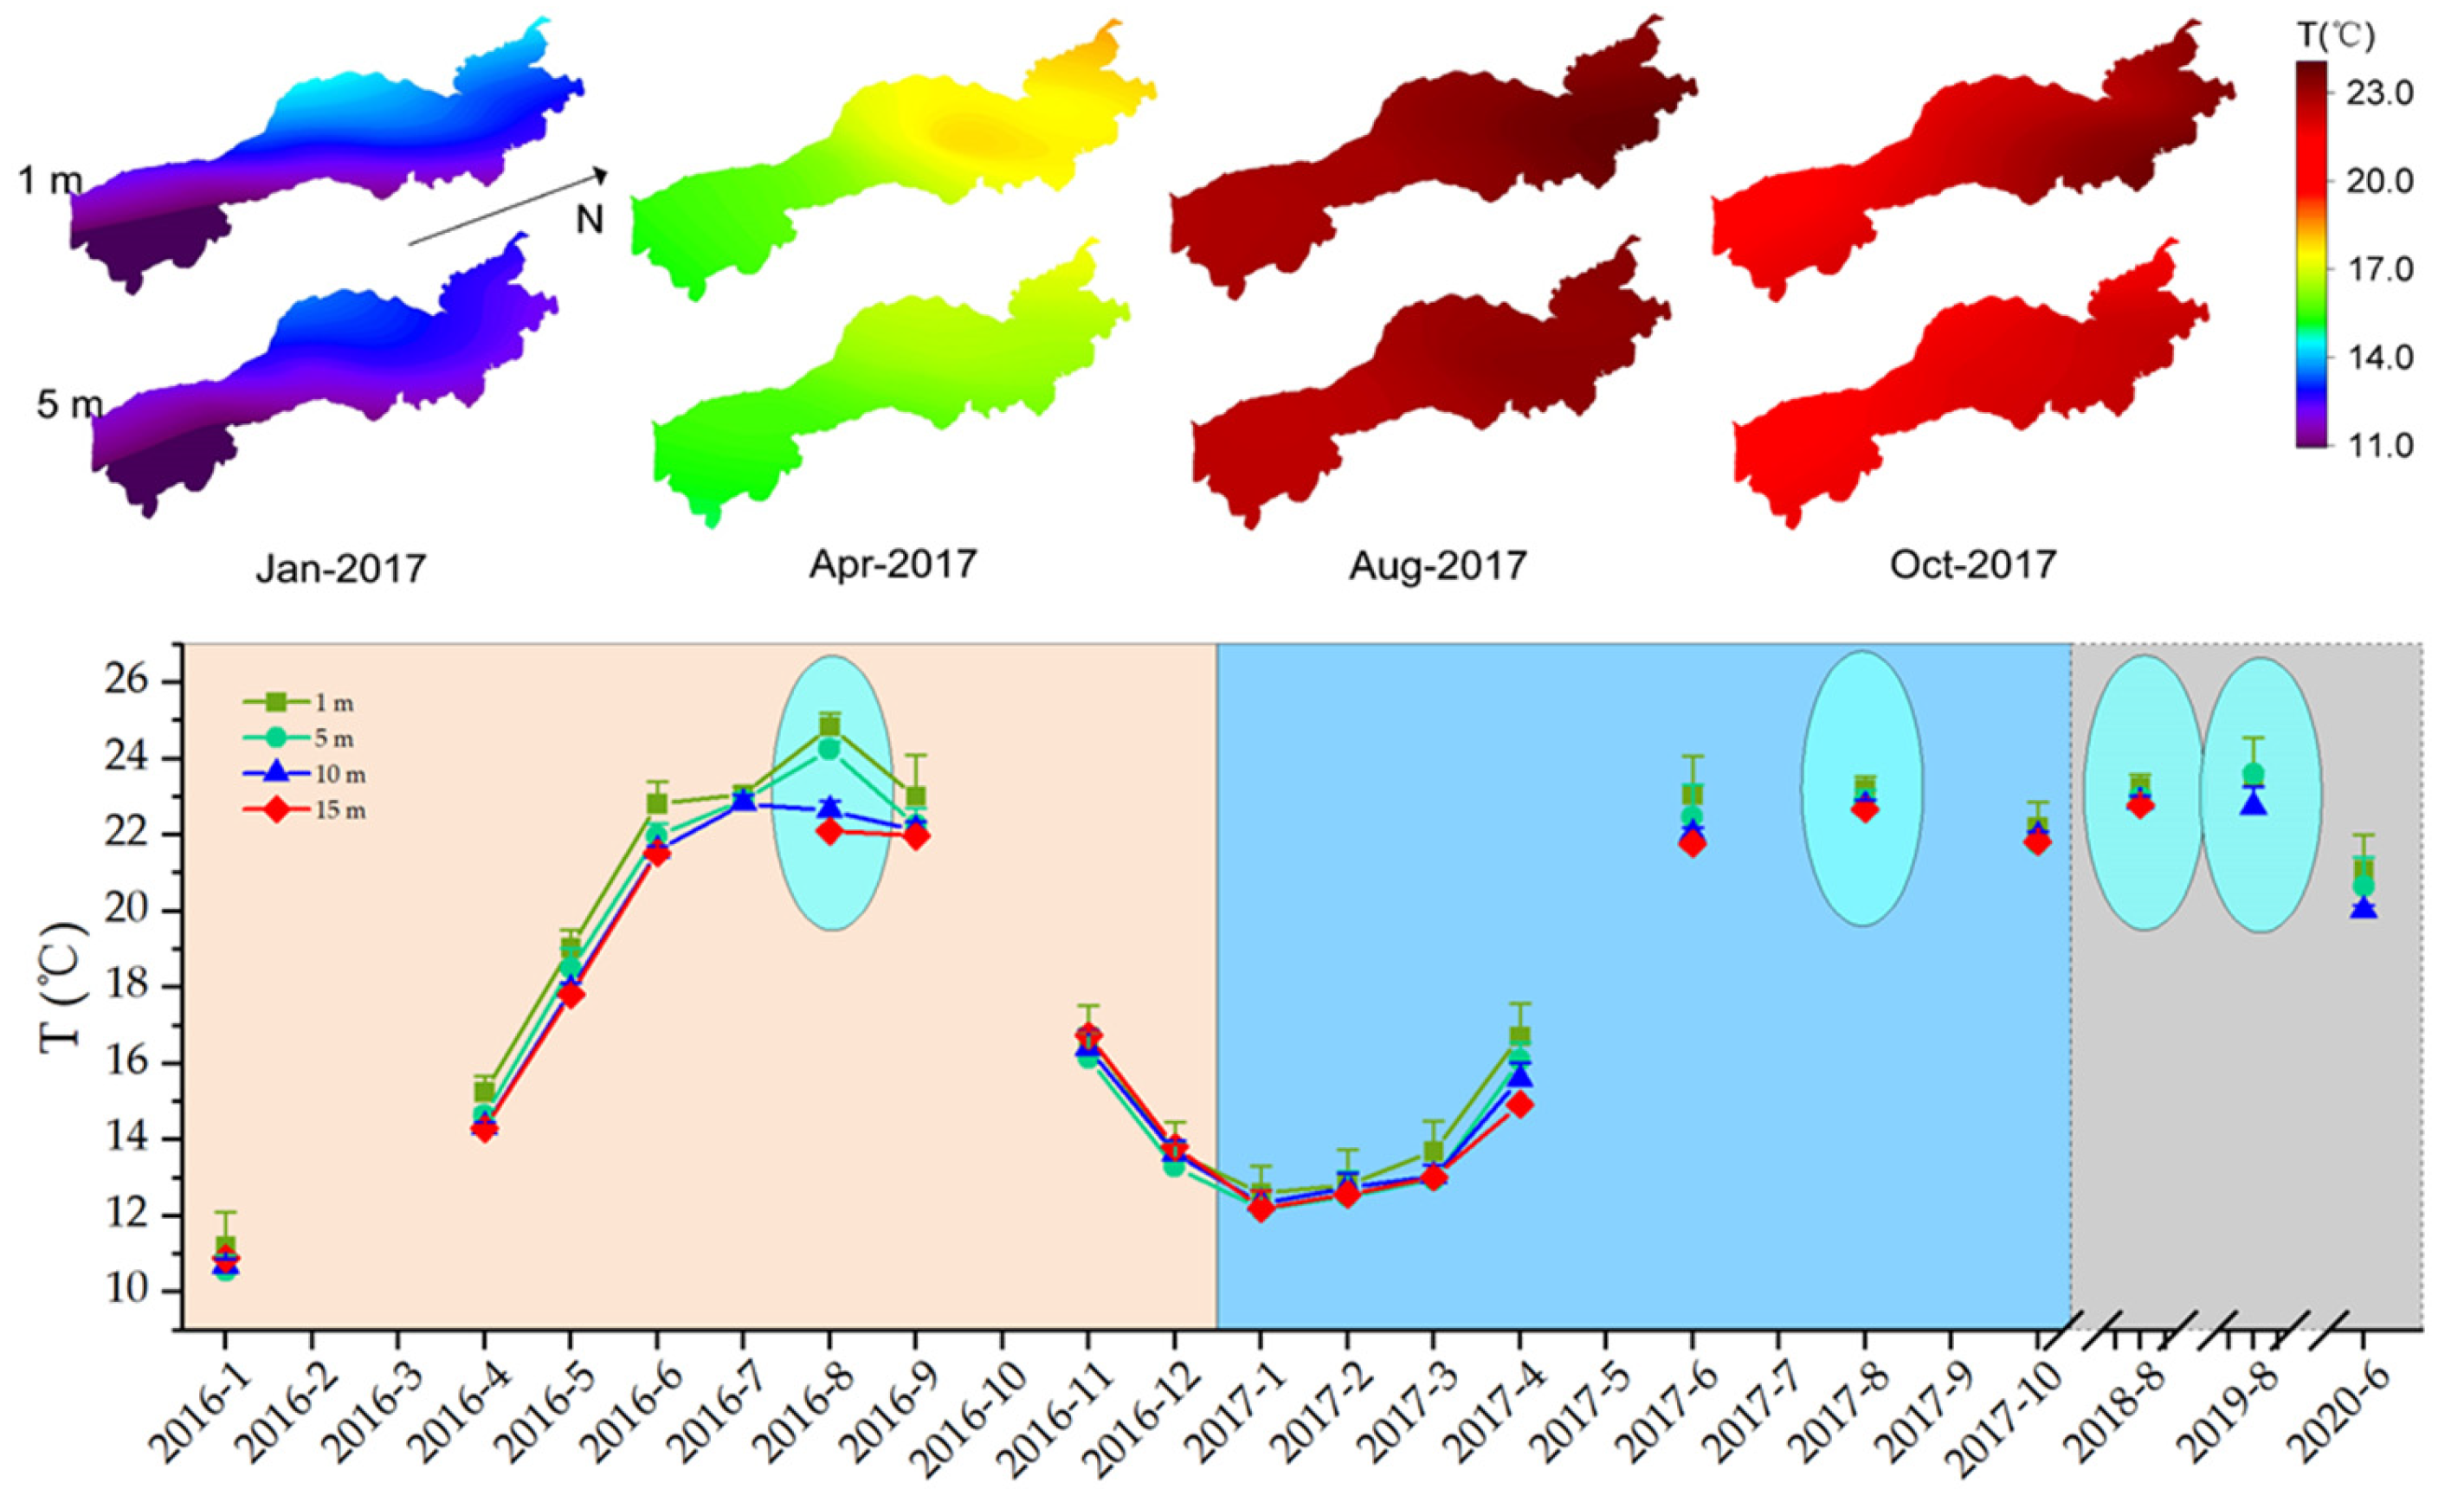
Based on the monthly changes in the T, our monitoring data from 2016 to 2020 (Figure 3) showed that the T of Lake Erhai was higher than the average temperature of Dali Bai autonomous prefecture during the same period but lower than the highest temperature in that same period. Since the monitoring time was mainly concentrated during the daytime when the temperature was higher than the average temperature.
According to the research of Taihu Lake, the key factors affecting the growth of algae are lake T, light energy [19]. From the perspective of different lake areas, the T in the northwestern lake area was slightly higher than in its southeast area, especially in January and April 2017. In different lake layers, we observed that the overall T decreased as the water depths increased. The T and local temperature had the same trend in different seasons.
From the temporal change of Lake Erhai’s temperature, the T in the rainy season was found to be significantly higher than in the dry season, with the highest temperature recorded in summer and starting to drop in autumn. The lake T did not change much in the four seasons from 2016 to 2017. From 2017 to 2020, several high-temperature rainy months were observed. A large temperature difference was observed between the upper and lower layers of the lake (5–10 m) during the rainy August seasons in 2016. Studies have shown that the process of thermal stratification will lead to oxygen deficiency (O2 < 1 mg/L), and the oxygen consumption rate of lakes indicates the more eutrophic nature of water bodies [20].
3.1.2. Spatiotemporal Changes in pH
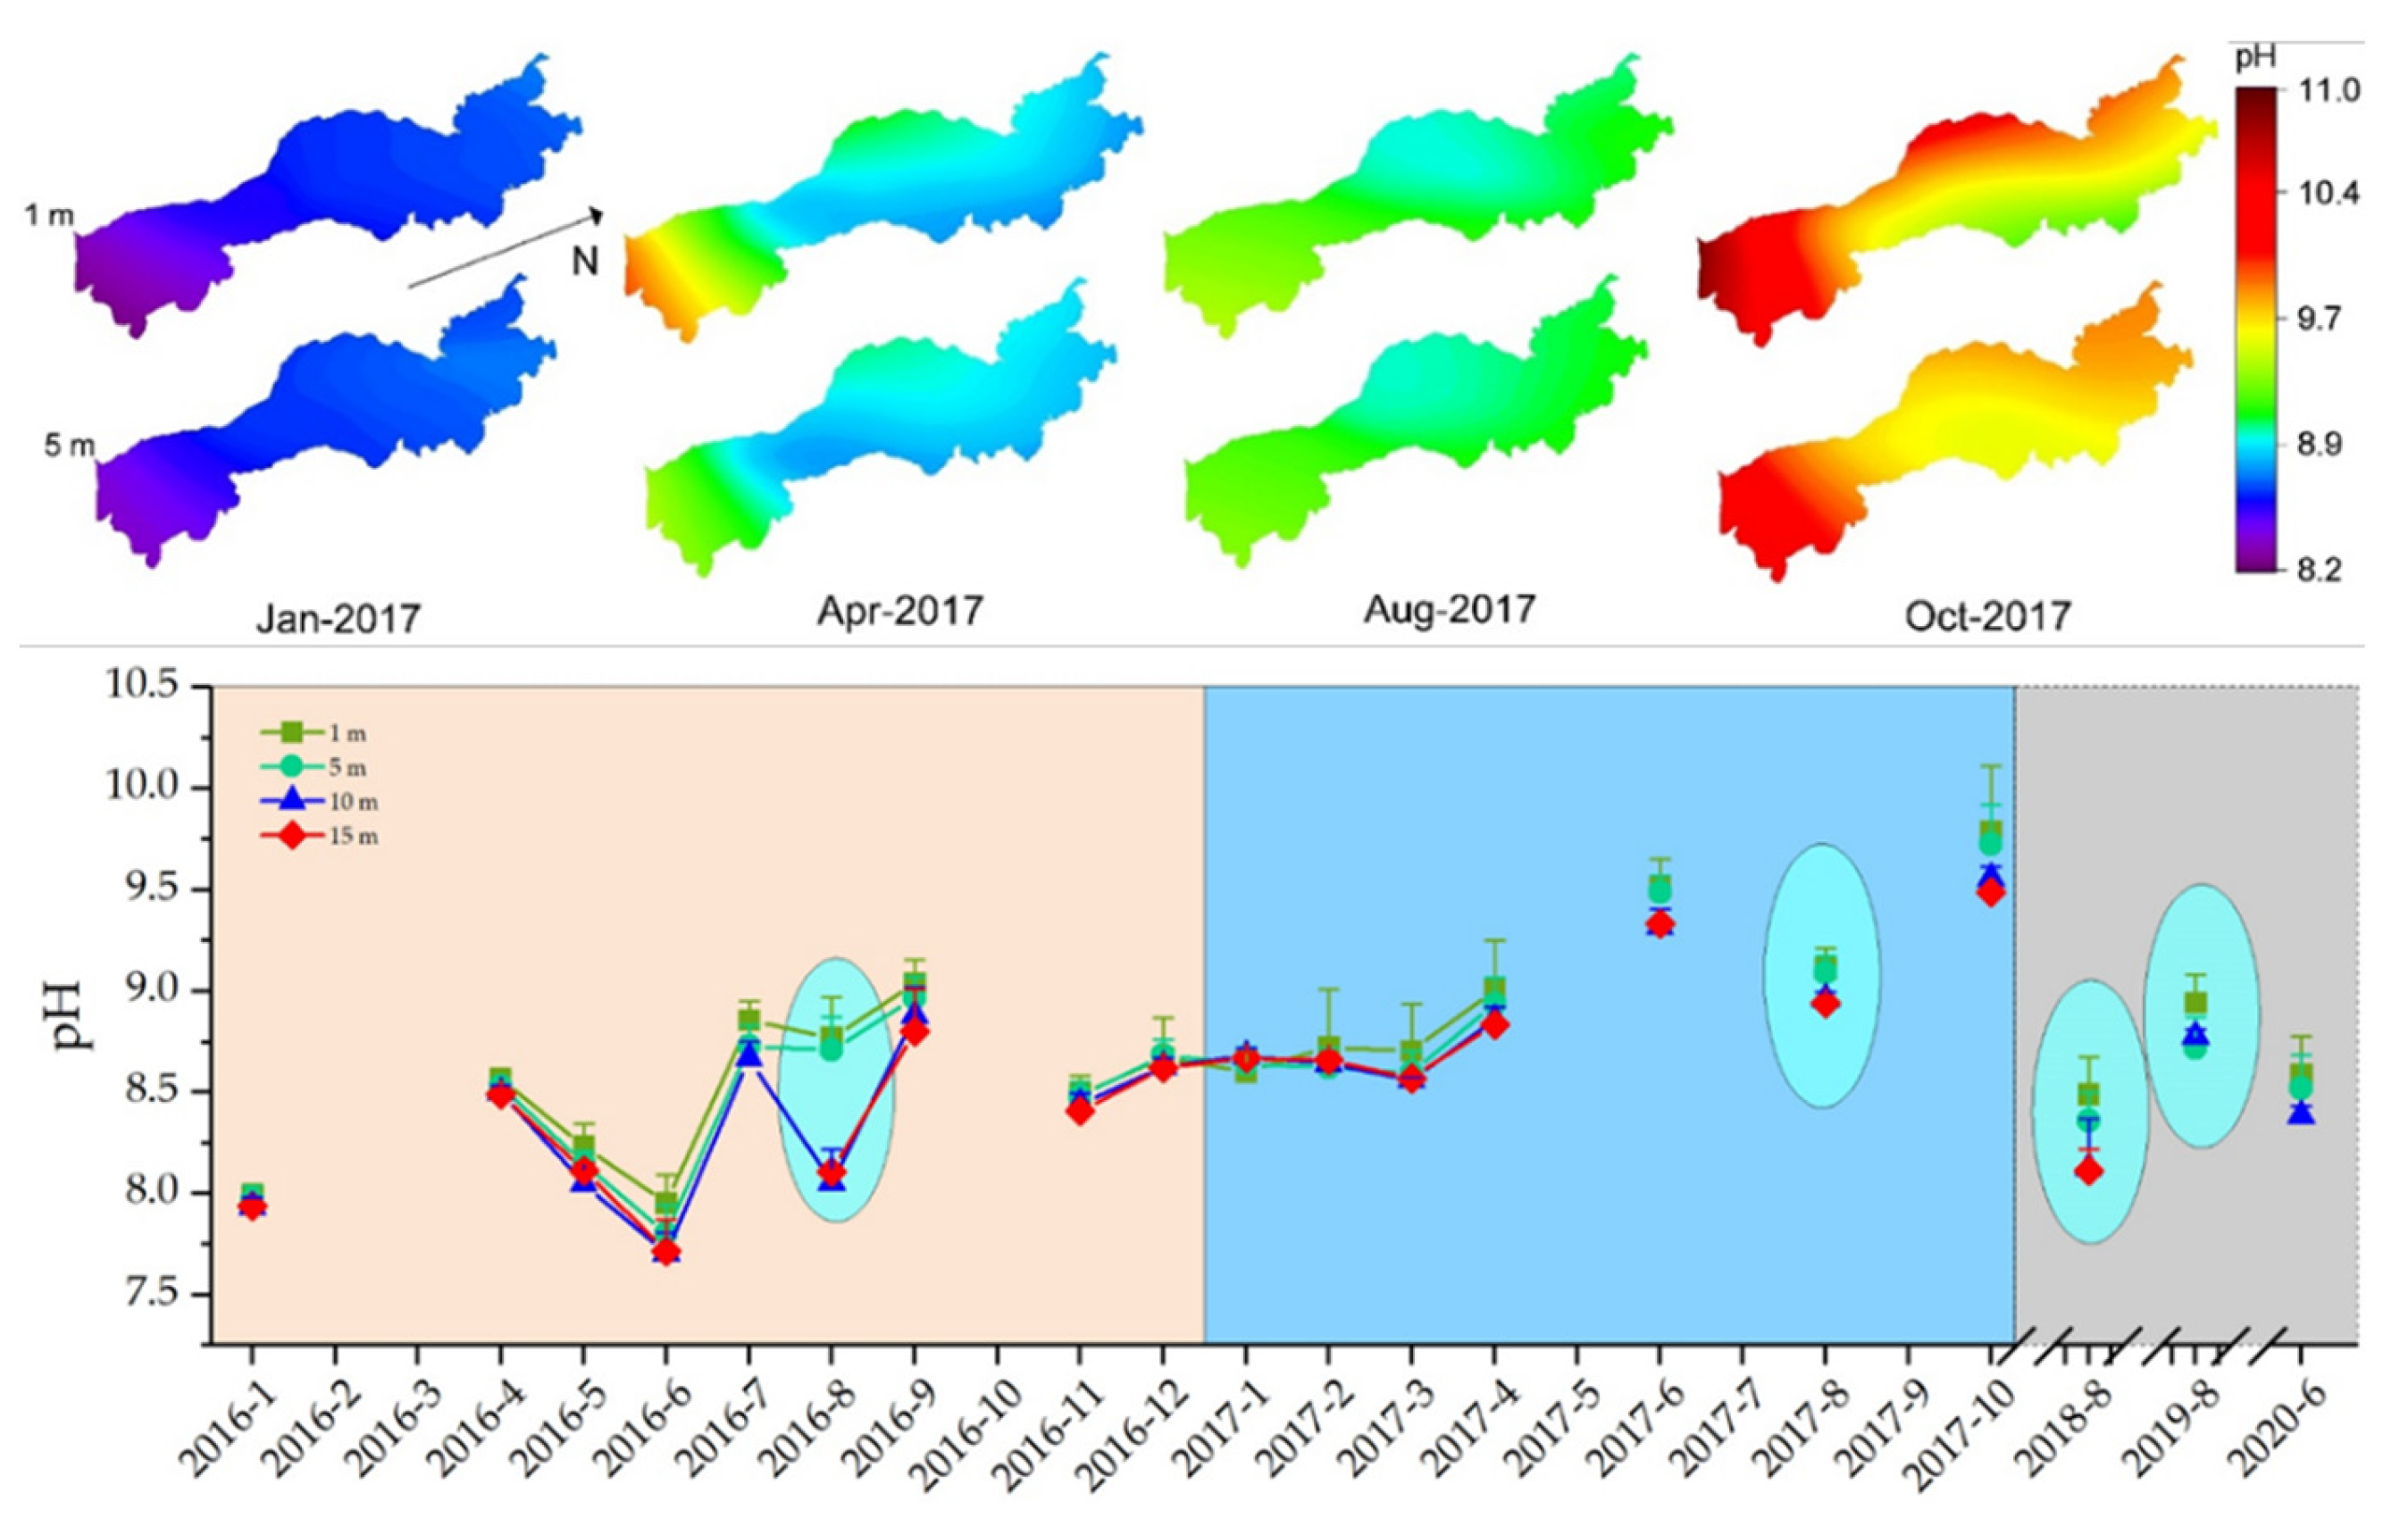
Algae growth and bacteria decomposing organic matter affect pH. The study found that high correlation values were obtained for pH and algae cellular growth [21]. From the temporal change of Lake Erhai’s pH, the pH of the entire lake was low alkaline, higher than 7.5 per all monitoring months throughout the year (Figure 4).
In regard to seasons varies of pH, it was lowest in winter and started to rise until it was maximum in autumn. The data at different lake areas showed that the pH in the southwestern lake area was slightly higher than in the northeast area. In different lake layers, the pH decreased with increased water depths. The lake’s pH has increased from 2016 to 2017. From the summer of 2017 to 2020, the pH of Lake Erhai drops in summer. Depth change in pH reached a maximum in summer, with low pH appeared in August 2016 between 5–10 m. The low pH value may be caused by the decomposition of organic matter and algae by microorganisms after the thermocline appears.
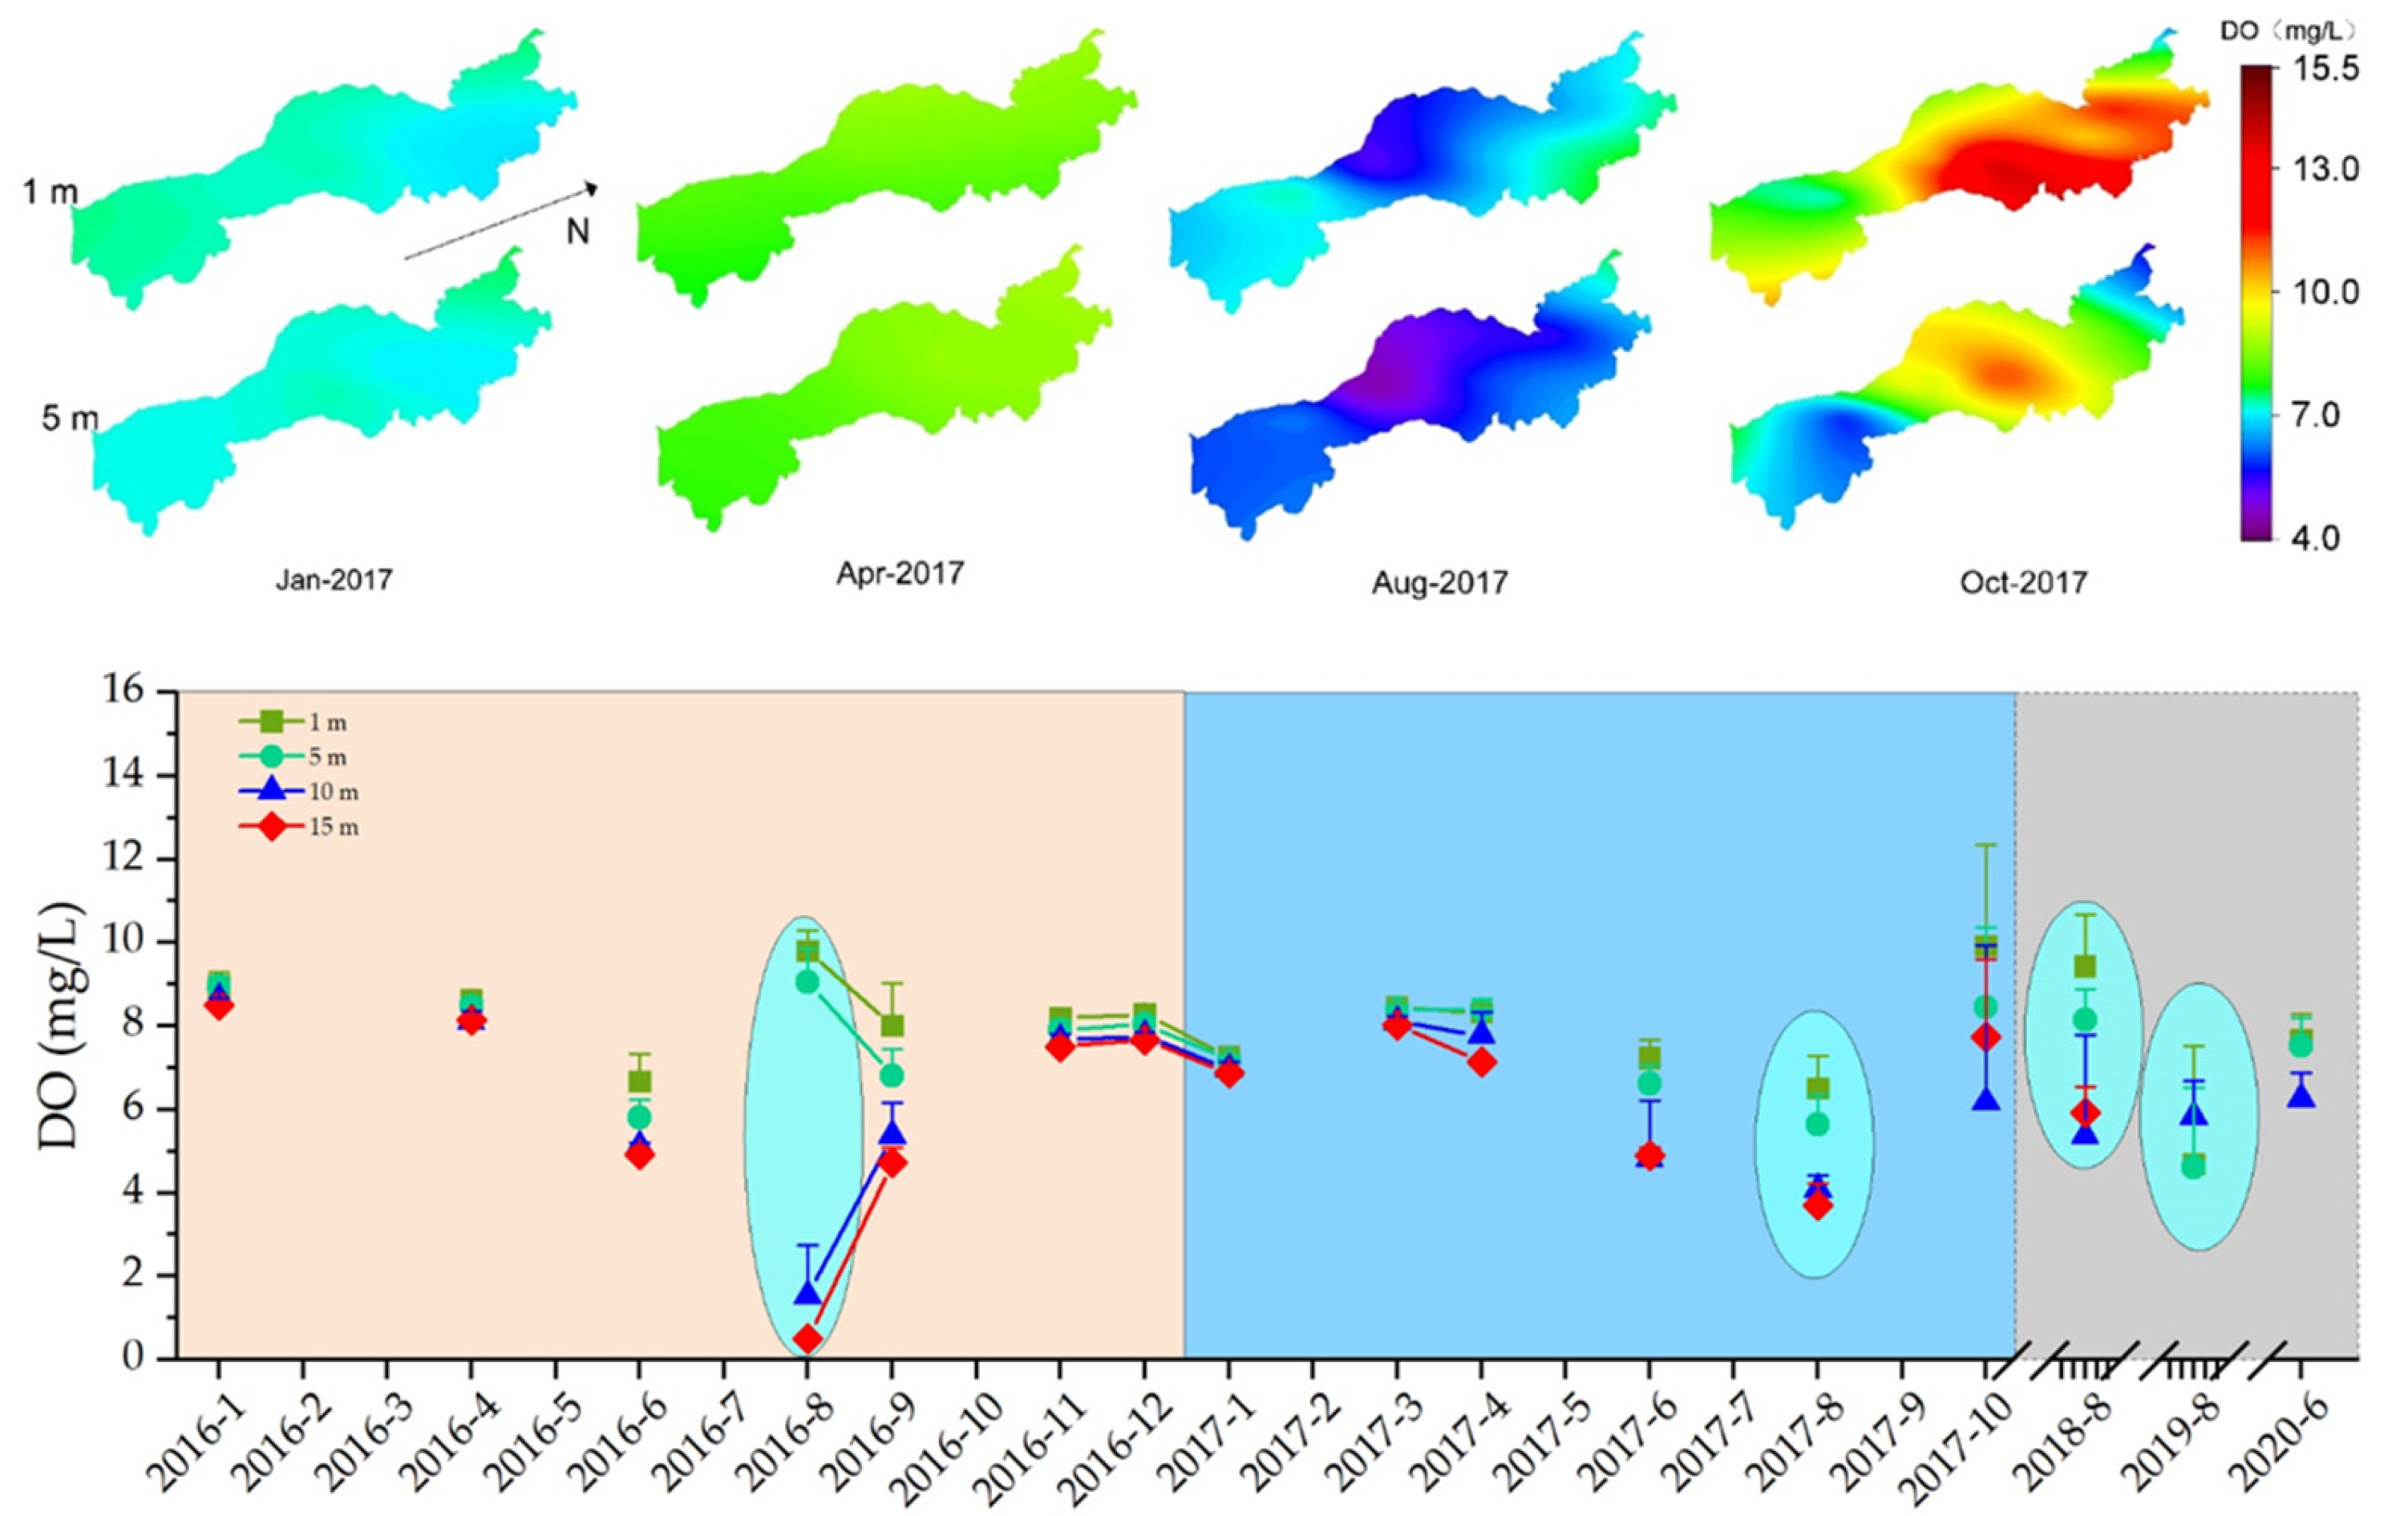
3.1.3. Spatiotemporal Changes of DO
The DO in lakes was important to maintain the dynamic balance of the ecological environment of a water body for the survival of aquatic organisms. DO also participates in the transformation of some substances [22]. Relevant studies have shown that the activities of plankton directly or indirectly determine the scope and degree of the hypoxic (less than 4 mg/L) less zone in the Qiandao Lake area. At the same time, the low oxygen area will affect the growth of aquatic organisms [23].
From the seasonal changes of DO in Lake Erhai in 2017, the DO increased slightly from winter to spring (from 7 mg/L to about 8 mg/L), and from spring to summer, the DO in water dropped sharply (from 8 mg/L to 8 mg/L). Dropped to about 4 mg/L) and the DO at a depth of 15 m was as low as 2 mg/L, forming a hypoxic area. From summer to autumn, the DO content in water increases (from 4 mg/L to about 10 mg/L). This may be related to the decrease in algae density in the water and the fact that photosynthesis produces more oxygen than respiration consumes, and photosynthesis is stronger on the lake surface, especially in the northeastern lake area (Figure 5).
From the long-term sequence of 2017–2020, the phenomenon appeared in August in summer when the DO in the lake water at a depth of 1–5 m was significantly greater than that in a depth of 10–15 m, of which 2016 was the most obvious, followed by 2018. This phenomenon may be related to the fact that a large number of algae in the upper layer of photosynthesis is stronger than respiration to increase the oxygen concentration, while the lower layer of algae is decomposed by bacteria due to the shading of the upper layer of algae and lack of light. The bacterial decomposition process consumes oxygen and produces organic acid species, resulting in a drop in DO and pH.
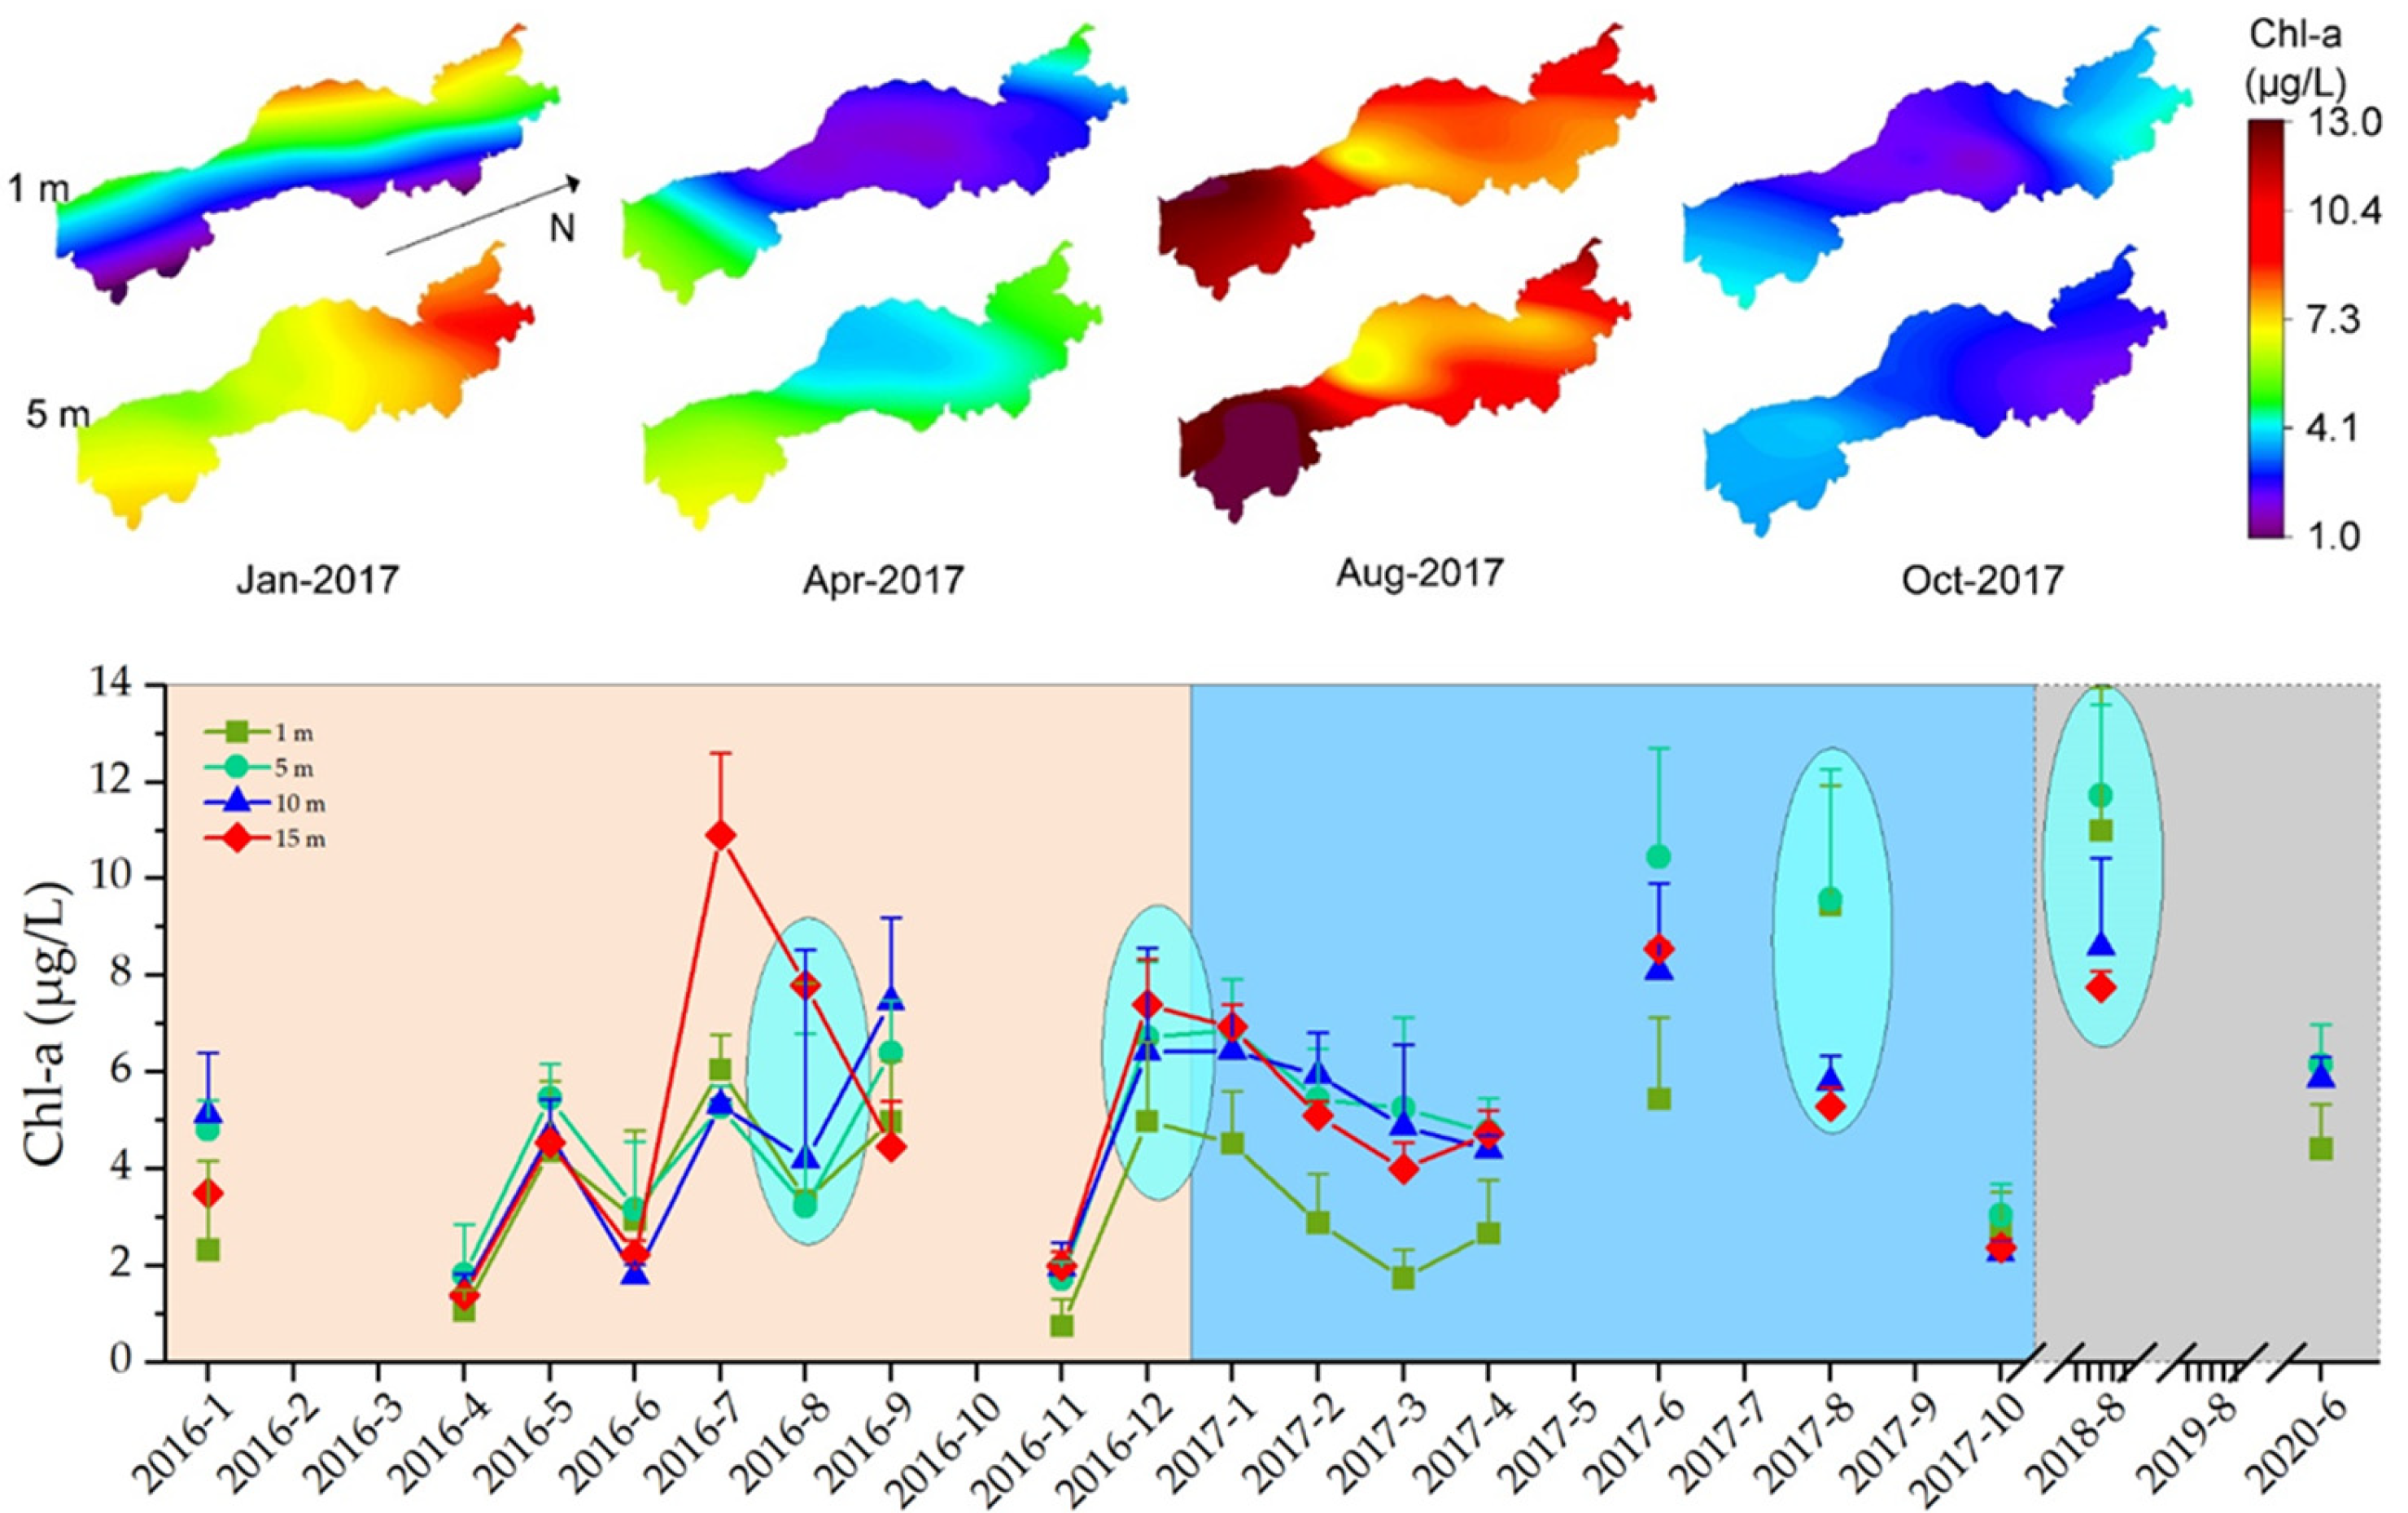
3.1.4. Spatiotemporal Changes in Chl-a
Chl-a is the main parameter characterizing the existing amount of phytoplankton and is one of the important indicators of lake water quality [24]. A change in Chl-a concentration can reflect the nutritional status of the water body. Previous research results showed significant seasonal changes in Chl-a in Lake Erhai, with the overall content beginning to rise gradually in April, increasing sharply in July, reaching a peak in October, and dropping sharply in January the following year [25].
From the temporal change of Lake Erhai Chl-a, the months with higher Chl-a content appeared from June to September. The distribution characteristics of Chl-a concentration at a depth of 1–5 m in different lake areas in four seasons in 2017 were southern area > northern area > central area (Figure 6). Combined with the long-term series, Chl-a appeared higher in four periods, namely July-September 2016, December 2016, June-August 2017, and August 2018. The content of Chl-a in the summer and winter of 2016 showed that the content in the lower layer was higher than that in the upper layer. In August 2017 and 2018, the Chl-a content of the upper layer was higher than that of the lower layer. This reflects the increasing tendency of algal growth space to the surface layer of 1–5 m in summer.
3.1.5. Temporal Changes in TN and TP
Assessment of changes in TN and TP concentrations with depth at indicated sites of Lake Erhai showed no obvious change trend in TN content with depth, while the TP content slightly decreased with increased depth (Figure 7). In terms of overall season, the TN content was lowest in August 2017, while that of TP was highest. The characteristics of TP concentration in different seasons were as follows: summer > autumn > spring > winter.
From the long-term observation of TN, we noticed a decreasing trend in TN in Lake Erhai, with its value fluctuating between 0.3–0.9 mg/L. A higher value was mainly recorded in February and August. Its content at the surface layer was generally higher than that of the lower layer. From the long-term observation of TP, we noticed significant variation in TP content in Lake Erhai during different months. Higher values were mainly recorded in July and December 2016, August 2017 and August 2018, and TP and Chl-a have the same seasonal distribution trend.
3.2. Trophic Status Evaluation
A study used the comprehensive trophic state index to evaluate Dianchi Lake, Lake Erhai, and Fuxian Lake in 2017. The results showed that the medians of the comprehensive trophic state index were 63.21, 31.69, and 18.55, respectively. Lake Erhai was evaluated as mesotrophic [26].
According to the evaluation of eutrophic level of surface water at three points in Lake Erhai from 2016 to 2018 (Table 2). The evaluation results showed that Lake Erhai is mainly in a mesotrophic state, while only the northern and central lake regions in 2018 were in a light eutrophic state. The north lake and central lakes showed a fast transition to light eutrophic, while the southern lakes showed a slower trend. Moreover, the TP score increased while the TN score decreased, which means that the value of N: P was decreasing, indicating that the contribution of TP to eutrophication was increasing.
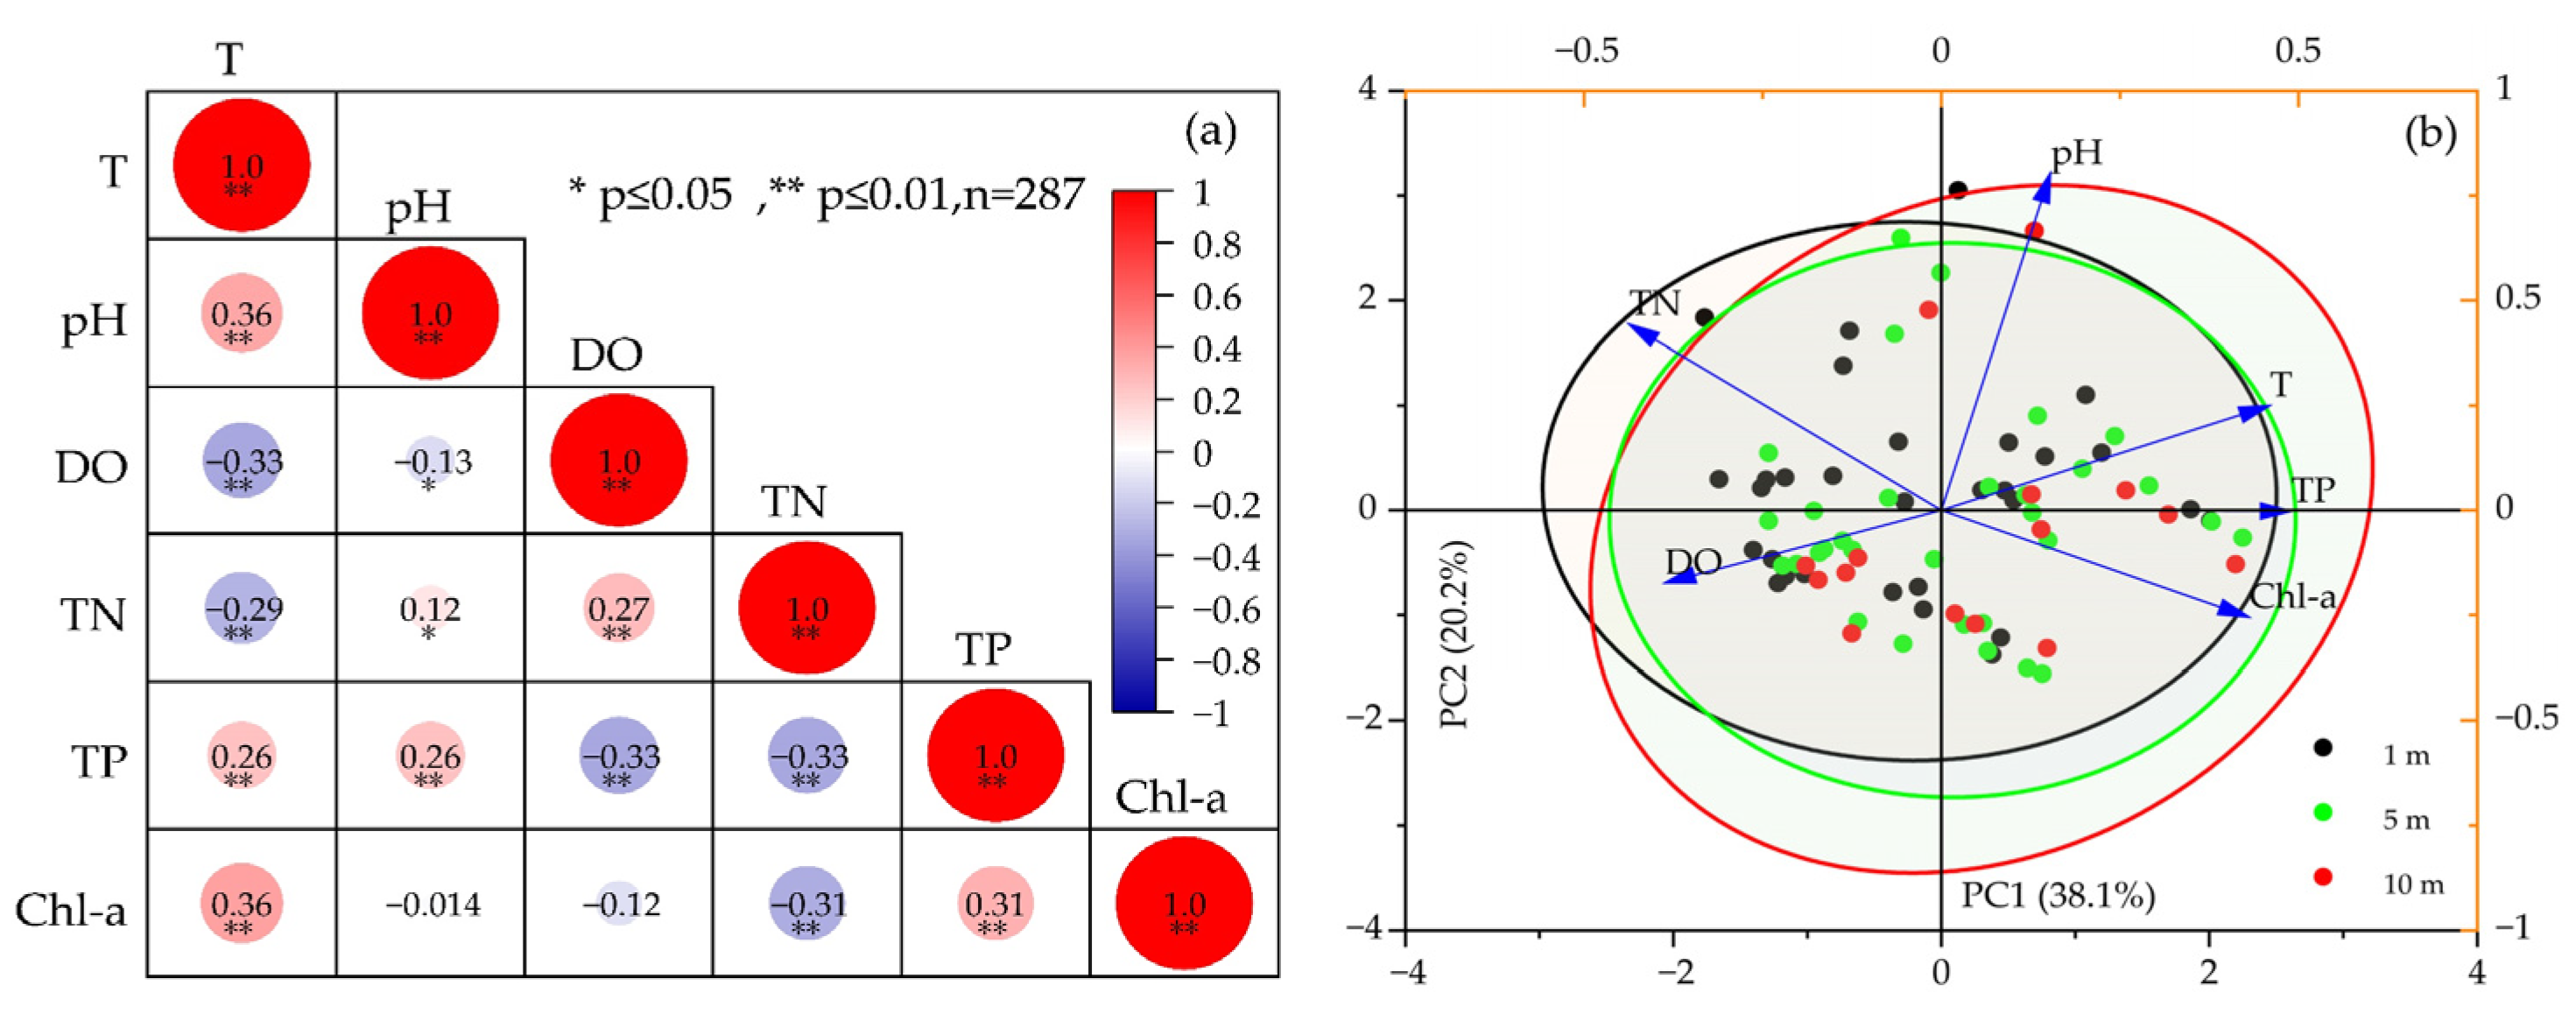
3.3. Correlation and Principal Component Analysis
The correlation analysis of Chl-a at different depths showed (Figure 8a): (1) a positive correlation with temperature (r = 0.36, p ≤ 0.01) and TP (r = 0.31, p ≤ 0.01), (2) a negative correlation with TN (r = −0.31, p ≤ 0.01).
Chl-a reflects the density of photosynthetic aquatic plants in lake water, and the vertical distribution of aquatic plants in lakes changes regional DO and pH. This explains the decomposition of large amounts of algae at a depth of 10–15 m in August 2016, leading to the formation of anoxic and acidic environments in this area.
In our study, temperature and TP in Lake Erhai were the main promoting factors for algal growth in Lake Erhai. TN had a downward trend in summer, and was negatively correlated with Chl-a, which was not the limiting factor for algal growth in Lake Erhai in summer. According to the trend of evaluation scores of TN and TP, TP has become one of the main limiting nutrients for aquatic photosynthetic plants in Lake Erhai in summer. This is consistent with Li Donglin’s research results in Qilu Lake [27]. From the principal component analysis (Figure 8b), it can be seen that the water quality parameters’s differences of Lake Erhai at depths of 1, 5 and 10 m are relatively low, indicating that the spatial mixing of the lake water is relatively high. The principal component PC1 (38.1%) may represent a nutrient factor that promotes water eutrophication. It can be seen that when it is reduced to only three depths, it also has a relatively consistent correlation with Figure 8a.
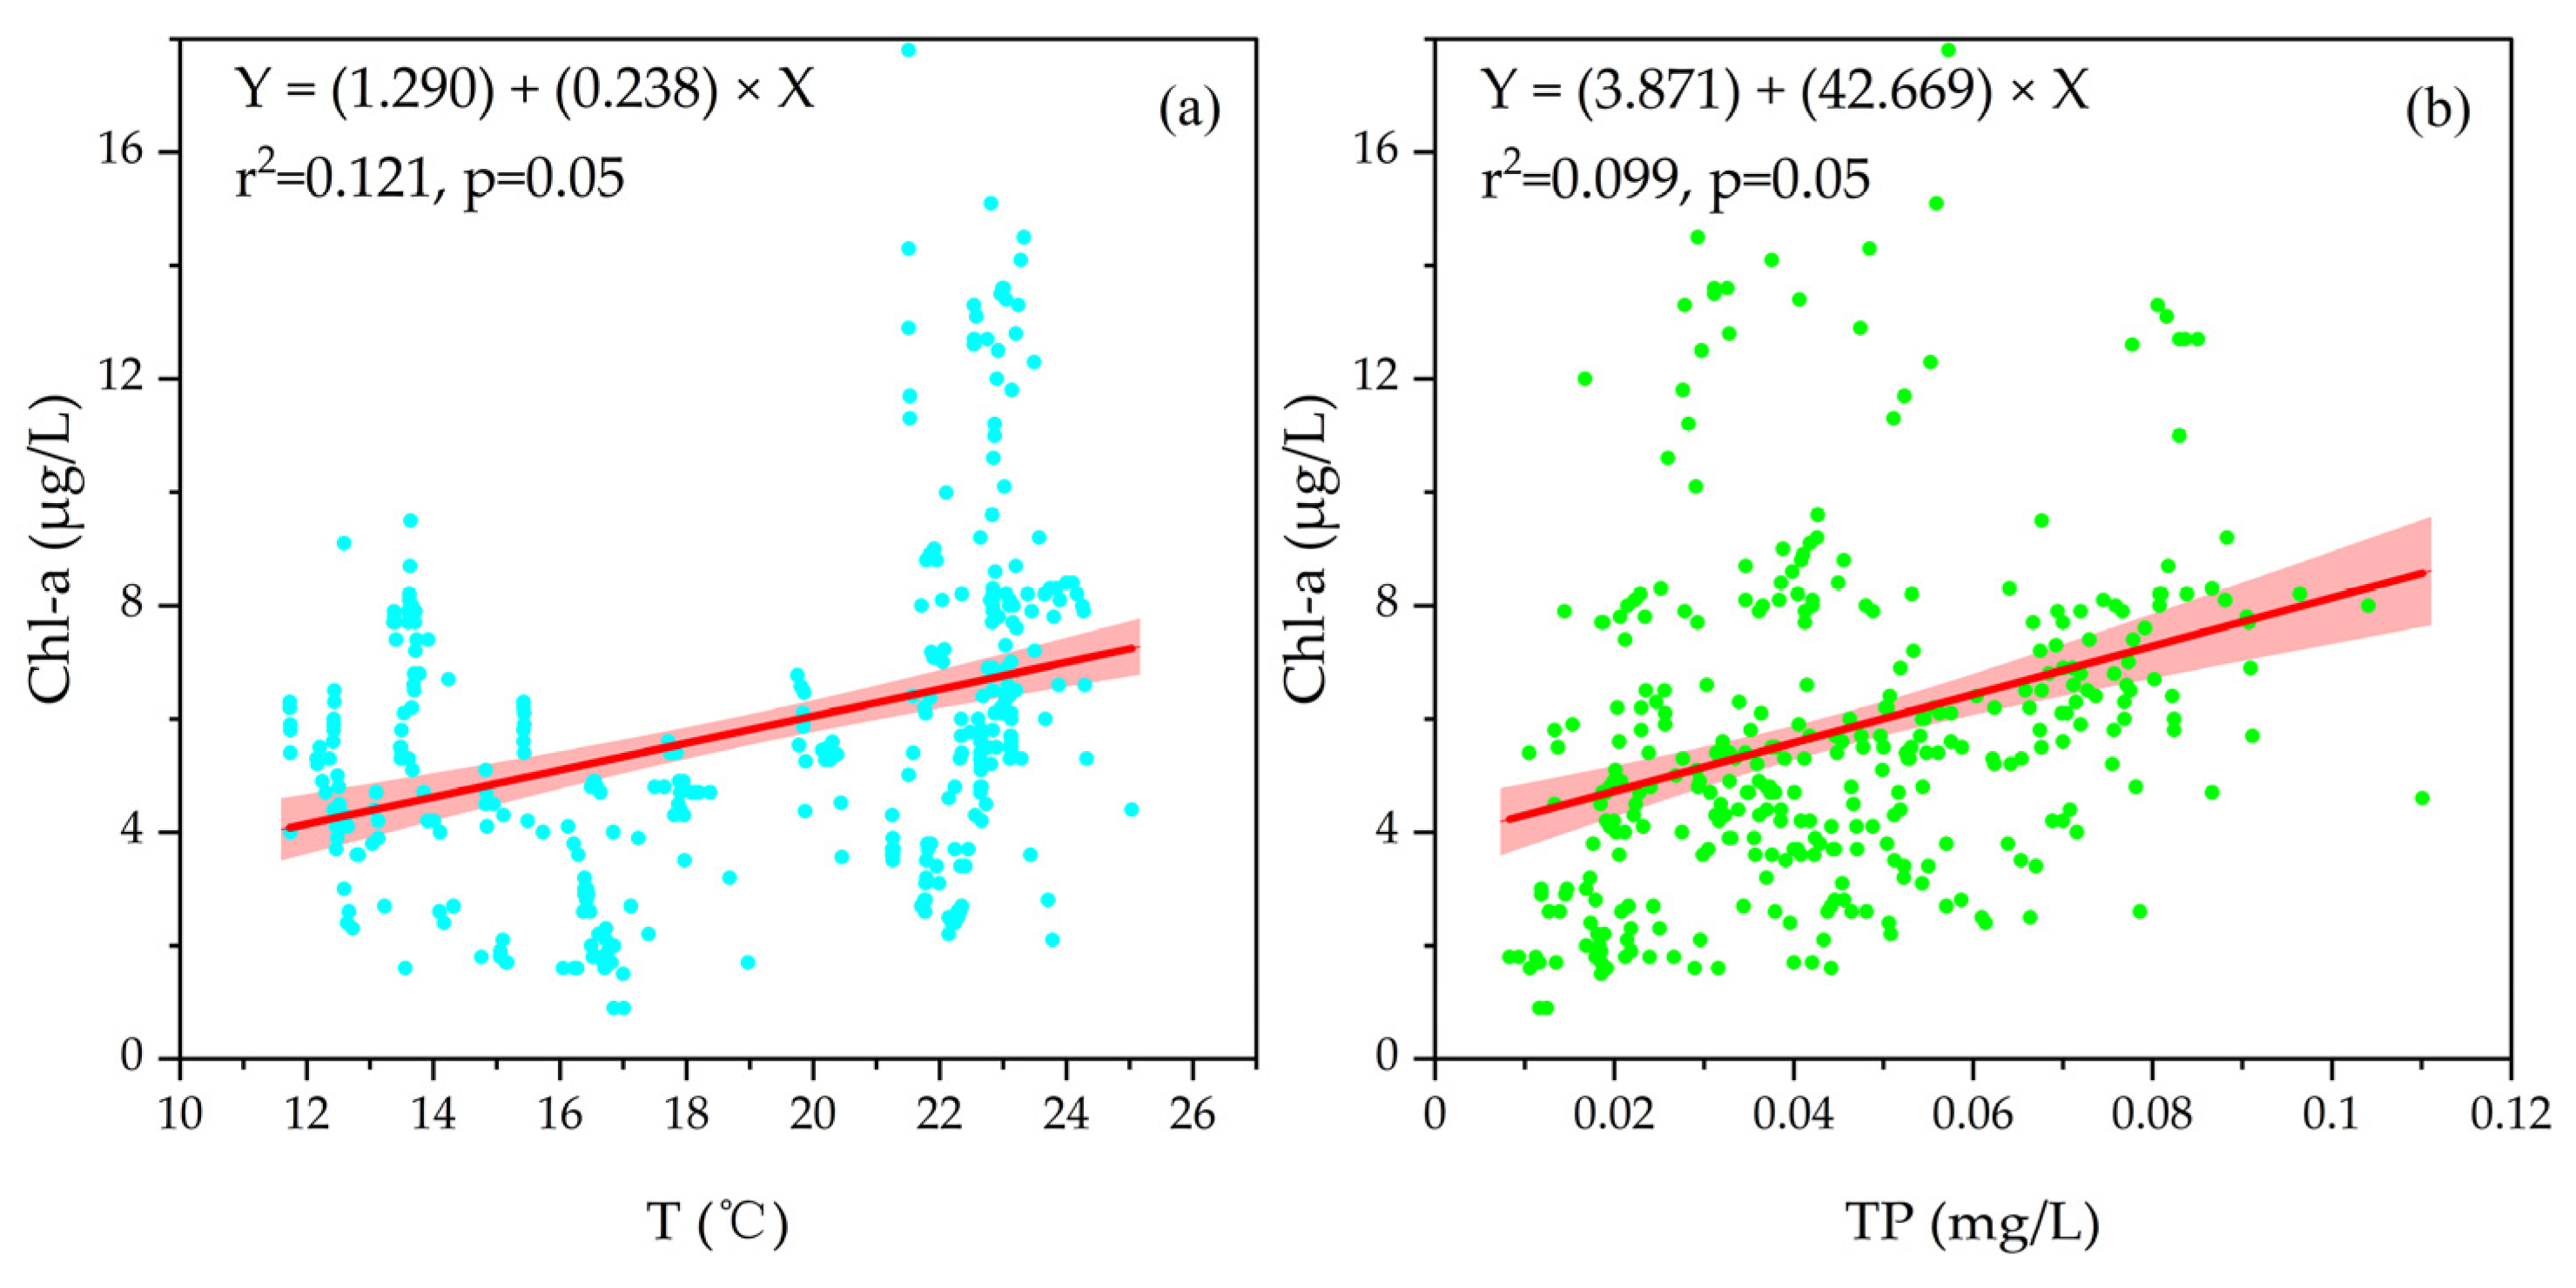
Based on the above analysis results, the temperature and TP content of Lake Erhai demonstrated a significant and positive correlation with Chl-a content. Using 95% regression linear fitting (Figure 9a,b), we found that the linear regression coefficients for temperature and TP were (R1 = 0.121, R2 = 0.099; p > 0.05). From the scatter plot, when the temperature was lower in winter, the recorded Chl-a value was higher, which may be related to the sudden increase of TP in December 2016. The increase of TP significantly reduced the distribution of Chl-a in the low value area. TP was the main limiting nutrient for elevated Chl-a concentration. This result is consistent with that of Chl-a in many studies [28,29,30,31].
4. Discussion
4.1. Water Quality Parameters
T is an important factor affecting Chl-a concentration, and it is a key factor for the growth of phytoplanktons [32,33]. Similar to the local monthly average temperature at Lake Erhai, obvious seasonal changes were observed in the lake T. The monthly average air temperature directly affected the T of the lake. However, as a large shallow lake, Lake Erhai has a large specific heat capacity. Since sampling was performed during the day, the recorded surface T of the lake was slightly higher than the local monthly average air temperature. The spatial distribution of Lake Erhai’s temperature was mainly affected by wind, the southwest wind was the main wind direction, The wind speed of Lake Erhai was significantly different at different locations of the lake, with the southern lake region > central lake region > northern lake region [34]. The southern lake area of Lake Erhai was the shallowest with strong wind disturbance. The southwest wind blew the surface water of the southern lake area to the northern lake area, so the lower water level at the northern lake area flowed to the southern lake area as a supplement. At the same time, the strong wind in the southern part of Lake Erhai cooled the shallow lake faster. Therefore, the T in the northern lake area was observed to be higher than in the central and southern lake areas. The temperature of Lake Erhai demonstrated little vertical variation. The lake water was completely mixed under the influence of wind, and there was no obvious thermocline in the T in most months. In the summer of August 2016, thermocline was observed at a depth of 5–10 m in Lake Erhai. At this time, the wind makes the lake water less mixed. the algae die and settle down and are decomposed by bacteria, resulting in the release of a large amount of Chl-a, and the DO and pH in the water body decrease, which is the most likely condition for eutrophication in this month. Studies have shown that the location of the thermocline and the euphotic depth can create a functional niche for diazotrophic cyanobacteria, resulting the upward transport of nitrate into the euphotic zone is reduced by a subjacent thermocline changed of nitrogen and phosphorus limiting factors on algal blooms [35].
From the perspective of the spatiotemporal changes in the lake’s pH value, the photosynthesis of aquatic plants and algae consuming a large amount of CO2 is the main reason for the increase in pH value. In terms of seasons, in summer and autumn, the total photosynthetic rate of aquatic organisms was greater than the respiration rate, which reduced the dissolved CO2 content and increased the pH value of the lake water. On the contrary, the light intensity was weakest in winter, and the photosynthesis intensity of aquatic plants and algae was lowest. The photosynthesis rate was lower than the respiration rate, making the dissolved CO2 content higher and the lake water pH lower. The pH value was also related to the lake’s depth, which was the main reason for the spatial differentiation in pH values. In summer and autumn, the light and intensity of aquatic plants in the shallow lake area of southern Lake Erhai were greater than the respiration intensity, which was the reason for the higher pH value of the southern shallow lake area. In winter, a lower pH value was recorded in the shallow lake area of southern Lake Erhai because the light and intensity of aquatic plants were less than the respiration intensity. In the summer of August 2016, the temperature was higher and the wind was lower, resulting in a decrease in pH value in the area below 5 m. Studies have investigated the relationships between early summer partial pressures of CO2 and dissolved organic carbon concentration in the surface waters of 27 northern Wisconsin lakes. CO2 had a strong positive relationship with dissolved organic carbon concentration [36]. Other studies show that bacteria decomposed the organic matter on the bottom of the lake, oxygen was consumed, and a large amount of acidic substances were produced [37].
DO in Lake Erhai showed significant seasonal variation. It was highest in winter and lowest in summer. This could have been related to the low temperature in winter due to strong wind and weak solar radiation, which increased the contact of the water body from the surface to the bottom with the atmosphere, increasing the frequency of oxygen exchange. In summer, the temperature was high and precipitation was heavy. The death and decomposition of algae and aquatic plants consume a lot of oxygen, and the effect of microorganisms in the water below the mixed layer to decompose organic matter in the water is strengthened. As a result, the DO content of the lower water body decreases. We found that the content of Chl-a is affected by lake depth, wind and DO, and studies have shown that when DO increases, aquatic plants increase, resulting in an increase in Chl-a content [38]. Warmer summer temperatures result in high algal biomass. The photosynthesis of the algae on the surface is greater than the respiration to produce oxygen. The algae in the lower layer are decomposed to produce Chl-a, so that the oxygen concentration and Chl-a content have opposite trends in the vertical direction. Combining the above two situations, the DO and Chl-a in Lake Erhai were negatively correlated (r = −0.12). It was reported that DO stratification remarkably influence N species and transformation pathways in different water columns by high frequency sampling during summers in Longjing Lake, China. Results showed that Oxycline (4–11 m) was the major place for N transformations [39]. It was explained that the change of DO in Erhai Lake caused nitrogen to be removed and phosphorus to become a limiting nutrient factor.
Previous studies have investigated the Chl-a concentration in Lake Erhai from 2009 to 2013, and found that the annual average Chl-a concentration in Lake Erhai was 5–10.0 μg/L. Compared with this study, the content of Chl-a in Lake Erhai from 2016 to 2018 showed an increasing trend [40]. In addition, analysis of monitoring data showed that the summer temperature and TP in 2016–2018 also led to an upward trend in Chl-a. Due to a large number of algal blooms in summer, the temperature of Lake Erhai began to drop in autumn, and the DO content began to rise. After a large number of phytoplankton were decomposed by bacteria the Chl-a concentration also began to decline. This observation is consistent with the use of models to simulate seasonal changes in water quality parameters in Lake Erhai [41]. In December 2016, the lake area in the northwest of Lake Erhai became higher in TP content, even with fast wind speed and high DO content in December. However, the T in the northwestern lake area is higher, and a large amount of phosphorus is conducive to the growth of aquatic plants and algae, resulting in higher Chl-a content in the middle and lower layers (5–15 m) of the lake area in the northwestern Lake Erhai. The phenomenon that Chl-a in the middle and lower layers is higher than that in the surface layer may be related to the fact that the surface temperature is lower than that in the middle and lower layers in December.
4.2. Trophic Status and Changes
From the eutrophication score, it can be seen that the nutrient score changes: northern lake area > central lake area > southern lake area, which may be related to the fact that the outflow river Xi’er is in the south and the main wind direction is southwesterly. The gradual increase of TP drives the increase of Chl-a content, which leads to the change of Lake Erhai from light eutrophic state in summer. The sudden increase in TP in December 2016 also increased the score. The TN score is not high in summer, and phosphorus gradually becomes the main nutritional factor of algae blooming. The buffer capacity and hydrodynamic conditions of Lake Erhai should be improved and the input of exogenous phosphorus in the northwestern lake area should be controlled to prevent the massive growth of algae [42].
4.3. Trophic Causes and Effects
The changes in water quality in Lake Erhai are complex, and the trend of increasing nutrient levels is due to various factors. Although Lake Erhai is still in the mesotrophic, principal component analysis and correlation analysis show that temperature and phosphorus elements promote the growth of algae in the lake, and the excessive growth of algae changes DO and pH. This is consistent with the nutrition level analysis of the Sabalan Dam Reservoir in northwest Iran that implied TN:TP value was lower in summer than in winter, and therefore phosphorus became the main limiting factor of eutrophication [43]. Lake Erhai shows similar nutrient characteristics in summer, in addition that the range and trend of Erhai algae controlled by wind and lake currents.
5. Conclusions
Water quality parameters of Lake Erhai measured from 2016 to 2020 provided a deepening understanding of the lake’s eutrophication features and their changes. The monitoring data analysis shows that there is no obvious thermocline occured in the lake, indicating that Lake Erhai belongs to a shallow lake with a high degree of water mixed state.
The Chl-a in Lake Erhai showed obvious spatiotemporal distribution characteristics. It is higher in the southern lake area in August and higher in the northern lake area in December. A high Chl-a values appeared around August in summer and December in 2016. T (r = 0.36) and TP (r = 0.31) are the main promoting factors for the increase of Chl-a content in Lake Erhai. The phenomenon of low T, DO, pH, and high Chl-a appeared in the middle and lower water depths (<5 m) of the central Lake Erhai in August 2016, which may be caused by the decomposition of a large number of algae by microorganisms. The thermocline and low TN:TP values may cause the risk of water quality deterioration in summer. The abnormal high Chl-a content appeared in Lake Erhai in winter in December 2016 is directly related to the particularly high TP content this month. The nutritional evaluation of the main months with high Chl-a content in Lake Erhai showed that has a trend of mesotrophic to light eutrophic.
Author Contributions
Methodology, Software, Writing—Original draft preparation, K.C.; Conceptualization, Supervision, Resources, Writing—review & editing, Foundations acquisition, H.Z.; Investigation, Data Curation, L.D., Q.L., Y.Z., X.Z. and F.L. All authors have read and agreed to the published version of the manuscript.
Funding
This research was funded by the Yunnan Provincial Government Scientist workshop and the Special Project for Social Development of Yunnan Province (Grant No. 202103AC100001).
Data Availability Statement
The data that support the findings of this study are available from the corresponding author upon reasonable request.
Acknowledgments
We thank all the graduate students whom participated the field works and laboratory analysis.
Conflicts of Interest
The authors declare no conflict of interest.
References
- Li, Y.P.; Tang, C.Y.; Yu, Z.B.; Acharya, K. Correlations between algae and water quality: Factors driving eutrophication in Lake Taihu, China. Int. J. Environ. Sci. Technol. 2014, 11, 169–182. [Google Scholar] [CrossRef] [Green Version]
- Xu, W.; Duan, L.; Wen, X.; Li, H.; Li, D.; Zhang, Y.; Zhang, H. Effects of Seasonal Variation on Water Quality Parameters and Eutrophication in Lake Yangzong. Water 2022, 14, 2732. [Google Scholar] [CrossRef]
- Chang, F.Q.; Hou, P.F.; Wen, X.Y.; Duan, L.Z.; Zhang, Y.; Zhang, H.C. Seasonal Stratification Characteristics of Vertical Pro-files and Water Quality of Lake Lugu in Southwest China. Water 2022, 14, 2554. [Google Scholar] [CrossRef]
- Liu, M.; Zhang, Y.L.; Shi, K.; Zhu, G.W.; Wu, Z.X.; Liu, M.L.; Zhang, Y.B. Thermal stratification dynamics in a large and deep subtropical reservoir revealed by high-frequency buoy data. Sci. Total Environ. 2019, 651, 614–624. [Google Scholar] [CrossRef]
- Chen, J.; Lyu, Y.; Zhao, Z.; Liu, H.; Zhao, H.; Li, Z. Using the multidimensional synthesis methods with non-parameter test, multiple time scales analysis to assess water quality trend and its characteristics over the past 25 years in the Fuxian Lake, China. Sci. Total Environ. 2018, 655, 242–254. [Google Scholar] [CrossRef] [PubMed]
- Yang, K.; Yu, Z.; Luo, Y.; Zhou, X.; Shang, C. Spatial-Temporal Variation of Lake Surface Water Temperature and Its Driving Factors in Yunnan-Guizhou Plateau. Water Resour. Res. 2019, 55, 4688–4703. [Google Scholar] [CrossRef]
- Zang, C.; Huang, S.; Wu, M.; Du, S.; Scholz, M.; Gao, F.; Lin, C.; Guo, Y.; Dong, Y. Comparison of Relationships Between pH, Dissolved Oxygen and Chlorophyll a for Aquaculture and Non-aquaculture Waters. Water Air Soil Pollut. 2011, 219, 157–174. [Google Scholar] [CrossRef]
- He, L.; Zhu, T.; Cao, T.; Li, W.; Zhang, M.; Zhang, X.; Ni, L.; Xie, P. Characteristics of early eutrophication encoded in submerged vegetation beyond water quality: A case study in Lake Erhai, China. Environ. Earth Sci. 2015, 74, 3701–3708. [Google Scholar] [CrossRef] [Green Version]
- Qi, J.; Deng, L.; Song, Y.J.; Qi, W.X.; Hu, C.Z. Nutrient Thresholds Required to Control Eutrophication: Does It Work for Natural Alkaline Lakes? Water 2022, 14, 2674. [Google Scholar] [CrossRef]
- Hou, P.; Chang, F.; Duan, L.; Zhang, Y.; Zhang, H. Seasonal Variation and Spatial Heterogeneity of Water Quality Parameters in Lake Chenghai in Southwestern China. Water 2022, 14, 1640. [Google Scholar] [CrossRef]
- Zhang, Y.; Chang, F.; Zhang, X.; Li, D.; Liu, Q.; Liu, F.; Zhang, H. Release of Endogenous Nutrients Drives the Transformation of Nitrogen and Phosphorous in the Shallow Plateau of Lake Jian in Southwestern China. Water 2022, 14, 2624. [Google Scholar] [CrossRef]
- Wang, J.; Fu, Z.; Qiao, H.; Liu, F. Assessment of eutrophication and water quality in the estuarine area of Lake Wuli, Lake Taihu, China. Sci. Total Environ. 2018, 650, 1392–1402. [Google Scholar] [CrossRef] [PubMed]
- Ji, N.; Liu, Y.; Wang, S.; Wu, Z.; Li, H. Buffering effect of suspended particulate matter on phosphorus cycling during transport from rivers to lakes. Water Res. 2022, 216, 118350. [Google Scholar] [CrossRef]
- Ni, Z.K.; Wang, S.R.; Cai, J.J.; Li, H.; Jenkins, A.; Maberly, S.C.; May, L. The potential role of sediment organic phosphorus in algal growth in a low nutrient lake. Environ. Pollut. 2019, 255, 113235. [Google Scholar] [CrossRef] [PubMed]
- Wen, Z.; Ma, Y.; Wang, H.; Cao, Y.; Yuan, C.; Ren, W.; Ni, L.; Cai, Q.; Xiao, W.; Fu, H.; et al. Water Level Regulation for Eco-social Services Under Climate Change in Erhai Lake Over the Past 68 years in China. Front. Environ. Sci. 2021, 9, 196. [Google Scholar] [CrossRef]
- Wang, S.M.; Dou, H.S. Chronicles of Chinese Lakes; Science Press: Beijing, China, 1998. (In Chinese) [Google Scholar]
- Wang, M.J.; Yu, B.; Zhuo, R.R.; Wang, Y. Correlation analysis of water environmental pollution and water environmental change in Erhai Basin. J. Huazhong Norm. Univ. 2020, 54, 700–710. (In Chinese) [Google Scholar]
- Zou, J.Y.; Yan, C.Q.; Wang, Y.W.; Liu, H.; Gu, F.; Hao, Y.Y.; Niu, W.B.; Zhang, Y.; Yu, S. Analysis of water quality and eu-trophication safety of Luoma Lake. Eng. J. Heilongjiang Univ. 2015, 6, 52–55. (In Chinese) [Google Scholar]
- Zhao, Q.H.; Sun, G.D.; Wang, J.J.; Yu, Z.G.; Jiang, B. Coupling effects of T and light energy on algal growth in Taihu Lake in spring. Lake Sci. 2018, 30, 385–393. (In Chinese) [Google Scholar]
- Yaseen, T.; Bhat, S.U. Assessing the Nutrient Dynamics in a Himalayan Warm Monomictic Lake. Water Air Soil Pollut. 2021, 232, 1–21. [Google Scholar] [CrossRef]
- Acuña-Alonso, C.; Lorenzo, O.; Álvarez, X.; Cancela, A.; Valero, E.; Sánchez, A. Influence of Microcystis sp. and freshwater algae on pH: Changes in their growth associated with sediment. Environ. Pollut. 2020, 263, 114435. [Google Scholar] [CrossRef]
- Crossman, J.; Futter, M.; Elliott, J.; Whitehead, P.; Jin, L.; Dillon, P. Optimizing land management strategies for maximum improvements in lake dissolved oxygen concentrations. Sci. Total Environ. 2018, 652, 382–397. [Google Scholar] [CrossRef] [PubMed]
- Yu, Y.; Liu, D.F.; Yang, Z.J.; Zhang, J.L.; Xu, Y.Q.; Liu, J.G.; Yan, G.H. The vertical stratification characteristics of DO and phytoplankton in Qiandao Lake and their influencing factors. Environ. Sci. 2017, 38, 1393–1402. (In Chinese) [Google Scholar]
- Li, D.; Wu, N.; Tang, S.; Su, G.; Li, X.; Zhang, Y.; Wang, G.; Zhang, J.; Liu, H.; Hecker, M.; et al. Factors associated with blooms of cyanobacteria in a large shallow lake, China. Environ. Sci. Eur. 2018, 30, 27. [Google Scholar] [CrossRef] [PubMed] [Green Version]
- Yang, W.; Deng, D.G.; Zhang, S.; Xie, P.; Yu, L.G.; Wang, S.R. Seasonal dynamics and spatial distribution of Chl-a concentra-tion. Lake Sci. 2012, 24, 858–864. (In Chinese) [Google Scholar]
- Zhou, Q.; Wang, W.; Huang, L.; Zhang, Y.; Qin, J.; Li, K.; Chen, L. Spatial and temporal variability in water transparency in Yunnan Plateau lakes, China. Aquat. Sci. 2019, 81, 36. [Google Scholar] [CrossRef]
- Li, D.L.; Chang, F.Q.; Wen, X.Y.; Duan, L.Z.; Zhang, H.C. Seasonal Variations in Water Quality and Algal Blooming in Hy-pereutrophic Lake Qilu of Southwestern China. Water 2022, 14, 2611. [Google Scholar] [CrossRef]
- Lin, S.-S.; Shen, S.-L.; Zhou, A.; Lyu, H.-M. Assessment and management of lake eutrophication: A case study in Lake Erhai, China. Sci. Total Environ. 2021, 751, 141618. [Google Scholar] [CrossRef] [PubMed]
- An, G.Y.; Guo, Z.C.; Ye, P. Climatic changes and impacts on water quality of Lake Erhai in Dali area, Yunnan province over the period from 1989 to 2019. Geoscience 2022, 36, 406. [Google Scholar]
- Yu, G.; Jiang, Y.; Song, G.; Tan, W.; Zhu, M.; Li, R. Variation of Microcystis and microcystins coupling nitrogen and phosphorus nutrients in Lake Erhai, a drinking-water source in Southwest Plateau, China. Environ. Sci. Pollut. Res. 2014, 21, 9887–9898. [Google Scholar] [CrossRef]
- Chen, X.K.; Liu, X.B.; Li, B.G.; Peng, W.Q.; Dong, F.; Hang, A.P.; Wang, W.J.; Cao, F. Water quality assessment and spatial–temporal variation analysis in Erhai Lake, southwest China. Open Geosci. 2021, 13, 1643–1655. [Google Scholar] [CrossRef]
- Adama, H.; Ye, J.; Persaud, B.; Slowinski, S.; Pour, H.K.; Cappellen, P.V. Chlorophyll-a growth rates and related environmental variables in global temperate and cold-temperate lakes. Earth Syst. Sci. Data Discuss. 2021, 329, 1–30. [Google Scholar]
- Woolway, R.I.; Kraemer, B.M.; Zscheischler, J.; Albergel, C. Compound hot temperature and high chlorophyll extreme events in global lakes. Environ. Res. Lett. 2021, 16, 124066. [Google Scholar] [CrossRef]
- Wang, X.; Deng, Y.; Tuo, Y.; Cao, R.; Zhou, Z.; Xiao, Y. Study on the temporal and spatial distribution of chlorophyll a in Erhai Lake based on multispectral data from environmental satellites. Ecol. Inform. 2020, 61, 101201. [Google Scholar] [CrossRef]
- Ehrenfels, B.; Bartosiewicz, M.; Mbonde, A.S.; Baumann, K.B.L.; Dinkel, C.; Junker, J.; Kamulali, T.; Kimirei, I.A.; Odermatt, D.; Pomati, F.; et al. Thermocline depth and euphotic zone thickness regulate the abundance of diazotrophic cyanobacteria in Lake Tanganyika. Biogeosci. Discuss. 2020, 214, 1–21. [Google Scholar]
- Diane, H.; Timothy, K.K.; Joan, L.R. Relationship between P CO 2 and Dissolved Organic Carbon in Northern Wisconsin Lakes. J. Environ. Qual. 1996, 25, 1442–1445. [Google Scholar]
- Zhang, L.; Zhang, S.; Lv, X.; Qiu, Z.; Zhang, Z.; Yan, L. Dissolved organic matter release in overlying water and bacterial community shifts in biofilm during the decomposition of Myriophyllum verticillatum. Sci. Total Environ. 2018, 633, 929–937. [Google Scholar] [CrossRef] [PubMed]
- Islam, S.; Ali, Y.; Kabir, H.; Zubaer, R.; Meghla, N.T.; Rehnuma, M.; Hoque, M.M.M. Assessment of Temporal Variation of Water Quality Parameters and the Trophic State Index in a Subtropical Water Reservoir of Bangladesh. Grassroots J. Nat. Resour. 2021, 4, 164–184. [Google Scholar] [CrossRef]
- Su, X.; He, Q.; Mao, Y.; Chen, Y.; Hu, Z. Dissolved oxygen stratification changes nitrogen speciation and transformation in a stratified lake. Environ. Sci. Pollut. Res. 2019, 26, 2898–2907. [Google Scholar] [CrossRef] [PubMed]
- Chen, X.H.; Qian, X.Y.; Li, X.P.; Wei, Z.H.; Hu, S.Q. Temporal change characteristics of eutrophication in Lake Erhai (1988–2013) and analysis of social and economic drivers. Lake Sci. 2018, 30, 70–78. (In Chinese) [Google Scholar]
- Wu, Y.; Zhang, J.P.; Hou, Z.Y.; Tian, Z.B.; Chu, Z.S.; Wang, S.R. Seasonal Dynamics of Algal Net Primary Production in Re-sponse to Phosphorus Input in a Mesotrophic Subtropical Plateau Lake, Southwestern China. Water 2022, 14, 835. [Google Scholar] [CrossRef]
- Guo, Y.; Dong, Y.; Chen, Q.; Wang, S.; Ni, Z.; Liu, X. Water inflow and endogenous factors drove the changes in the buffering capacity of biogenic elements in Erhai Lake, China. Sci. Total Environ. 2021, 806, 150343. [Google Scholar] [CrossRef]
- Noori, R.; Ansari, E.; Jeong, Y.-W.; Aradpour, S.; Maghrebi, M.; Hosseinzadeh, M.; Bateni, S.M. Hyper-Nutrient Enrichment Status in the Sabalan Lake, Iran. Water 2021, 13, 2874. [Google Scholar] [CrossRef]
Figure 1.
Map showing the location of Lake Erhai.

Figure 2.
Monthly average temperature and precipitation from 1981 to 2010 (Dali Bai autonomous prefecture).
Figure 2.
Monthly average temperature and precipitation from 1981 to 2010 (Dali Bai autonomous prefecture).

Figure 3.
Spatiotemporal changes in T.

Figure 4.
Spatiotemporal changes in pH.

Figure 5.
Spatiotemporal changes in DO.

Figure 6.
Spatiotemporal changes in Chl-a.

Figure 7.
Spatiotemporal changes in TN and TP.

Figure 8.
Correlation (a) and principal component (b) analysis of six water quality parameters.

Figure 9.
Linear regression relationship of T to Chl-a. (a) and TP to Chl-a. (b).


Table 1.
Grading and classification standard.
| Score | Eutrophication Level |
|---|---|
| 0~30.0 | Oligotropher |
| 30.1~50.0 | Mesotropher |
| 50.1~60.0 | Light eutropher |
| 60.1~70.0 | Middle eutropher |
| 70.1~100.0 | Hyper eutropher |
Table 2.
Eutrophication level evaluation in Lake Erhai.
| Sample | Year-Month | Chl-a Score1 | TN Score2 | TP Score3 | Average Score | Eutrophication Level |
|---|---|---|---|---|---|---|
| Site 2 | 2016-7 | 17.5 | 50.9 | 43.5 | 37.3 | Mesotropher |
| 2016-12 | 45.7 | 41.6 | 43.1 | 43.5 | Mesotropher | |
| 2017-8 | 47.9 | 48.5 | 42.7 | 46.3 | Mesotropher | |
| 2018-8 | 47.3 | 44.9 | 59.8 | 50.7 | Light eutropher | |
| Site 7 | 2016-7 | 27.0 | 53.9 | 47.7 | 42.9 | Mesotropher |
| 2016-12 | 39.5 | 45.1 | 44.2 | 42.9 | Mesotropher | |
| 2017-8 | 42.3 | 42.3 | 41.2 | 41.9 | Mesotropher | |
| 2018-8 | 50.0 | 48.0 | 53.3 | 50.4 | Light eutropher | |
| Site 10 | 2016-7 | 33.6 | 49.3 | 46.3 | 43.1 | Mesotropher |
| 2016-12 | 41.1 | 46.6 | 44.5 | 44.1 | Mesotropher | |
| 2017-8 | 52.6 | 42.6 | 42.2 | 45.8 | Mesotropher | |
| 2018-8 | 47.2 | 46.2 | 51.1 | 48.1 | Mesotropher |
Publisher’s Note: MDPI stays neutral with regard to jurisdictional claims in published maps and institutional affiliations. |
© 2022 by the authors. Licensee MDPI, Basel, Switzerland. This article is an open access article distributed under the terms and conditions of the Creative Commons Attribution (CC BY) license (https://creativecommons.org/licenses/by/4.0/).
Share and Cite
MDPI and ACS Style
Chen, K.; Duan, L.; Liu, Q.; Zhang, Y.; Zhang, X.; Liu, F.; Zhang, H. Spatiotemporal Changes in Water Quality Parameters and the Eutrophication in Lake Erhai of Southwest China. Water 2022, 14, 3398. https://doi.org/10.3390/w14213398
AMA Style
Chen K, Duan L, Liu Q, Zhang Y, Zhang X, Liu F, Zhang H. Spatiotemporal Changes in Water Quality Parameters and the Eutrophication in Lake Erhai of Southwest China. Water. 2022; 14(21):3398. https://doi.org/10.3390/w14213398
Chicago/Turabian StyleChen, Kun, Lizeng Duan, Qi Liu, Yang Zhang, Xiaonan Zhang, Fengwen Liu, and Hucai Zhang. 2022. "Spatiotemporal Changes in Water Quality Parameters and the Eutrophication in Lake Erhai of Southwest China" Water 14, no. 21: 3398. https://doi.org/10.3390/w14213398
Note that from the first issue of 2016, this journal uses article numbers instead of page numbers. See further details here.