
Distributions and Influencing Factors of Carbonate Species in Bohai Bay and Relevant Rivers Flowing into the Bay in Summer 2020

1
College of Marine and Environment Sciences, Tianjin University of Science and Technology, Tianjin 300457, China
2
Research Centre for Indian Ocean Ecosystem, Tianjin University of Science and Technology, Tianjin 300457, China
3
Institute for Advanced Marine Research, China University of Geosciences, Guangzhou 511462, China
4
State Key Laboratory of Biogeology and Environmental Geology, China University of Geosciences (Wuhan), Wuhan 430074, China
*
Author to whom correspondence should be addressed.
†
These authors contributed equally to this work.
Water 2022, 14(21), 3389; https://doi.org/10.3390/w14213389
Submission received: 9 August 2022
/
Revised: 21 October 2022
/
Accepted: 21 October 2022
/
Published: 26 October 2022
(This article belongs to the Special Issue Contribution of Carbon Dioxide from Water Bodies to the Atmosphere)
Abstract
:The distributions of pH, total alkalinity (Alk), dissolved inorganic carbon (DIC) and the partial pressure of carbon dioxide (pCO2) were investigated in Bohai Bay in northeastern China during summer 2020. The CO2 air–sea fluxes were also estimated for that summer. The results of the survey showed that the distributions of Alk and DIC in surface and bottom seawater were generally consistent, with the maximum values of DIC and Alk appearing at the same station, station BHB33 at the surface and station BHB35 at the bottom, which were in the middle of the bay. The minimum values of pH and the maximums value of pCO2 were both located at station HH2 at the surface and station HH3 at the bottom, which were near the mouth of the Haihe River. Bohai Bay was estimated as a source of CO2 in summer 2020. Carbonate species presented significant correlations with biochemical parameters, such as chlorophyll (Chl-), dissolved oxygen (DO) and nutrients. In addition, terrestrial inputs and human activities, together with the poor hydrodynamics of Bohai Bay are also the main factors influencing the carbonate species in Bohai Bay.
1. Introduction
The primary productivity of marginal seas accounts for 18–33% of the total global primary productivity of marginal seas and plays an important role in the global carbon cycle [1]. The ocean is also a regulator of atmospheric carbon dioxide (CO2) that has an important role in balancing atmospheric CO2 concentrations and mitigating global warming caused by increasing CO2. Seawater carbonate species have an important influence on the acid–base balance in the ocean and play an important role in controlling seawater pH, influencing multiple chemical balances and marine biological activities. The increase in CO2 affects the carbonate equilibrium system of seawater and reduces calcium carbonate (CaCO3) formation, and predictions indicate that oceanic calcium deposition (calcification) will decrease by 14% to 30% by 2100 [2]. Coastal regions are particularly vulnerable to anthropogenic acidification, which is driven mainly by oceanic uptake of anthropogenic CO2 and enhanced eutrophication associated with complex mechanisms and human activities [3]. However, the carbonate species and pCO2 variability in coastal oceans remain highly uncertain because of the complexity of physical and biogeochemical processes, including tidal mixing and riverine input to coastal oceans [3,4,5]. Changes in the seawater carbonate species will alter the seawater chemical environment, affecting the health of marine ecosystems. Due to the complex hydrodynamic conditions and the limited coverage of observation sites in the nearshore sea, study of the carbonate species in the shelf-edge sea still faces many challenges [6]. The role of marginal seas in the marine biogeochemical cycle has increased. Marginal seas also play a vital role in the global carbon cycle. Therefore, the carbonate species has become an area of interest in global carbon cycle research. Bohai Bay, one of the three major bays of the Bohai Sea in northeastern China, is located in the western part of the Bohai Sea and is surrounded by Hebei Province, Tianjin City and Shandong Province. It spans from the mouth of the Luanhe River to the mouth of the Yellow River at its eastern boundary. Bohai Bay receives a vast amount of fresh water from the Haihe River, Luanhe River and Yellow River Basins [7]. It is a semi-enclosed bay surrounded by land on three sides with a slow seawater exchange rate and clockwise circulation. As Bohai Bay is a semi-enclosed bay, the poor water exchange capacity of Bohai Bay makes it difficult to export pollutants to adjacent offshore waters [8,9]. The bay receives about 1 billion m3 of sewage from the surrounding areas every year [10]. During the recent three decades, Bohai Bay suffered a reduction in size due to rapid industrialization and urbanization [11]. Clusters of cities with large populations surround Bohai Bay. The two most representative megacities are Beijing and Tianjin, each of which has a population of over 10 million [12]. As China’s economy grows rapidly, the pollution problems are becoming more and more serious and the seawater pollution of Bohai Bay has received widespread attention. Bohai Bay is considered to be one of the most polluted water bodies in China [13,14]. In recent years, the sea area of Bohai Bay has been reduced by about 15% due to many human activities, such as land-based pollution discharge, land reclamation and river interception [15], while the input of large amounts of nutrients such as nitrogen and phosphorus has led to an imbalance in the nutrient structure, offshore eutrophication and frequent red tide disasters. The flow speed and direction of the tidal current determine the water dispersion process and the sediment deposition process, which will also affect the ecological environment and the morphological changes of the bottom bed of the sea [16].
There have been many international studies on seawater carbonate species, especially in the estuarine areas. For example, some researchers investigated a subtropical semi-arid estuary in the northwestern Gulf of Mexico (Aransas estuary) from May 2014 to April 2015. Data showed that the carbonate species, aragonite saturation and sea–air CO2 fluxes have large seasonal and spatial differences. A high wind speed, warm climate, river input and estuarine biogeochemical processes are responsible for high CO2 emissions [17]. Two observations of seawater carbonate species were conducted in the Mozambique Channel in January 2004 and April 2019 to estimate sea surface carbon dioxide fugacity (fCO2) and long-term pH trends. An enhanced acidification trend, associated with anthropogenic CO2 emissions, was found in the Mozambique Channel [18]. In 2016, the distributions of alkalinity (Alk) and dissolved inorganic carbon (DIC) in Chesapeake Bay on the US east coast showed an increasing trend from surface to bottom and from north to south, mainly driven by seasonal changes in river inputs, mixing, surface biological uptake and subsurface biogenesis. In combination with other relevant data, this proves that the estuary is heterotrophic [19].
Studies on the carbonate species in the Yellow Sea and Bohai Sea in China were also carried out. In 2006, a number of researchers found that the partial pCO2 was relatively high (>1000 µatm) in stations close to the estuary of the Yellow River in summer, and the carbonate species presented a reducing tendency from inshore to offshore areas [20]. It was found that the South Yellow Sea is a year-round source of atmospheric CO2, releasing 7.38 106 tCyr−1 to the atmosphere [21]. Studies showed that the South Yellow Sea was a weak sink of CO2 from April to October in 2011 [22]. Scientists observed the summer surface seawater pCO2 in the South Yellow Sea, and found that it has obvious spatial variation, and the variation is influenced by the Yangtze River runoff [23]. By analyzing the seasonal changes of the carbonate species in the bottom seawater of the North Yellow Sea, it was found that it changed from the unsaturated state of CO2 in spring to the supersaturated state in autumn, and it was suggested that the change was related to the aerobic remineralization of the bottom water [24]. In the Yellow Sea and Bohai Sea, only short-term observations have been reported. The results showed that the South Yellow Sea has been experiencing significant temporal and spatial variations in seawater carbonate species, especially in summer time, as a result of the change in Yangtze River discharge and the excess of nutrient loading [23]. The subsurface water of the North Yellow Sea changed greatly from CO2 under saturation in May and in equilibrium with atmospheric CO2 in June to CO2 oversaturation during July to October [24]. According to a study of coastal acidification in the summer bottom waters of the Bohai Sea, the largest decrease in pH of 0.29 units was found from June to August. They also suggested that CO2 derived by respiration and remineralization could increase the acidity in the near-shore bottom oxygen-depleted waters and contribute to a short-term acidification [25].
However, most published studies did not set stations in Bohai Bay despite it being the sea area most directly affected by river input. Therefore, it is particularly important to study the carbonate species in Bohai Bay and its corresponding rivers. Based on field investigation data from Bohai Bay and the rivers flowing into Bohai Bay, carbonate species, combined with the chlorophyll (Chl-a) content, nutrient content and other related hydrological parameters, were analyzed. The present study was thus conducted (1) to investigate the distribution and influencing factors of the carbonate species in Bohai Bay, (2) to assess the CO2 air–sea fluxes and (3) to provide support to further control carbon emissions in Bohai Bay and maintain the marine environment.
2. Materials and Methods
2.1. Study Area
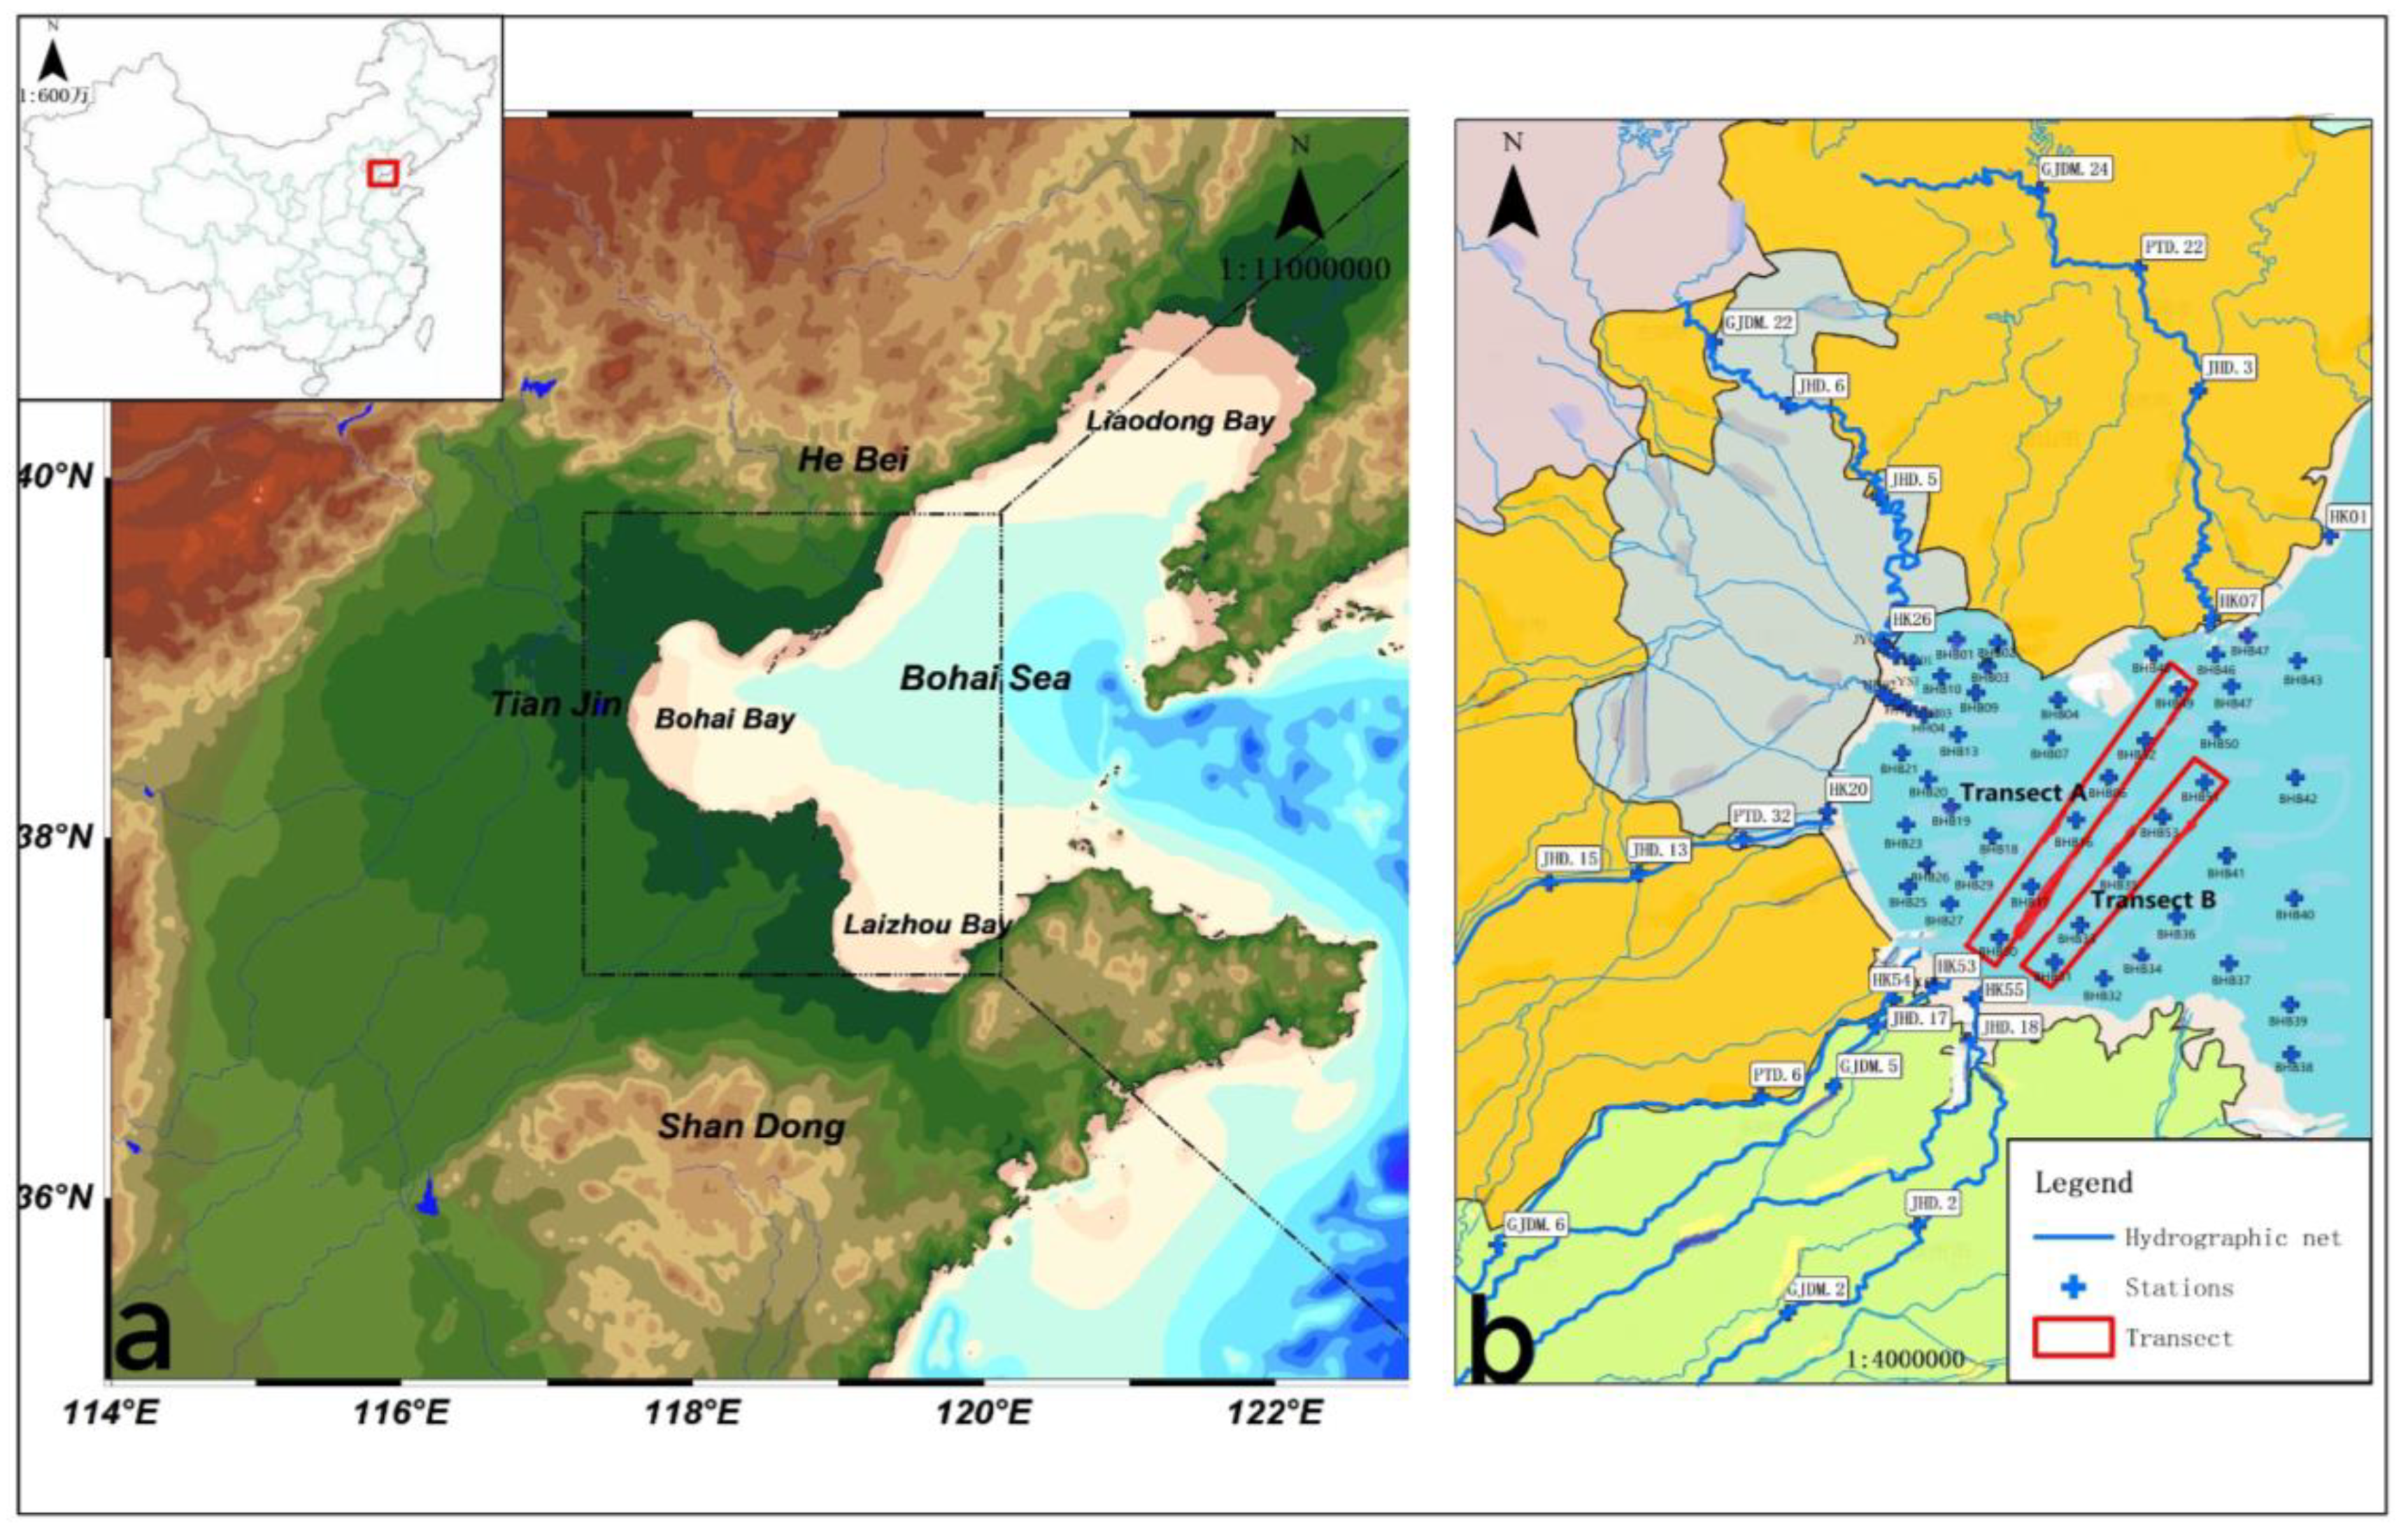
In this study, a survey was carried out onboard the vessel Jinhan Fishing Transport 0477 from July 21 to August 3, 2020 in the Bohai Bay sea area (survey range 115°–120°E, 37°–41° N), China. Observations of rivers flowing into Bohai Bay and estuaries were performed at the same time. A total of 73 stations (Figure 1) were surveyed, including 52 stations in Bohai Bay and 21 stations in the rivers and estuaries. The locations of stations are shown in Figure 1. Surface and bottom water samples from Bohai Bay were selected to study the horizontal distributions of carbonate species, and two transects, A and B (see Figure 1), were selected to analyze the vertical distributions.
The winds in the Bohai Bay have obvious seasonal changes, with northerly winds prevailing in winter and southerly winds in summer, and spring and autumn as transitional seasons. The waves in Bohai Bay are mainly wind waves, and the wave directions are similar to the wind directions. Therefore, the waves also have obvious seasonal variation, and the wave intensity varies with the direction and strength of the winds. Generally, the southeastern waves prevail in spring and summer, and the northerly waves prevail in autumn and winter. When the easterly winds in Bohai Bay (northeasterly and southeasterly winds) are prevailing, the strong wind and waves from the waters outside the Bay are transmitted into the Bohai Bay to increase the wave strength and height inside the bay. The currents in Bohai Bay have a double-loop structure (Figure. 2). The Yellow Sea Warm Current enters the Bohai Sea from the Bohai Strait and divides into two branches due to the blocking effect of the coast, one of which enters the Bohai Bay at the mouth of the Luanhe River and forms a counterclockwise current moving westward (Qinhuangdao Coastal Current a in Figure 2), while a large amount of Yellow River water flows into the southern coast of the Bohai Bay and forms a coastal current moving westward clockwise (Dongying Coastal Current b in Figure 2). The counterclockwise current from the Luan River mouth and the clockwise current from the Yellow River mouth converge near the mouth of the Haihe River to form a shear front, which turns outside the mouth of the Haihe River into the central sea area of Bohai Bay and moves eastward (Bohai Bay Offshore Current c in Figure 2). Therefore, the currents in Bohai Bay are mainly divided into two parts, north and south, with counterclockwise currents in the north and clockwise currents in the south.
2.2. Sample Collection and Determination Methods
Water samples were collected with a 4 L 6 SBE 55 eco multi-channel water sample collector. Temperature (T) and salinity (S) were measured with an RBR maestro rapid multi-parameter (RBR, Ottawa, Canada) water quality profiler onsite (Table 1). Dissolved oxygen (DO) was first sampled and measured in accordance with the Winkler method [27], then pH, DIC and Alk were sampled in sequence as with the DO sampling method. pH was measured on site, and the Alk and DIC water samples were placed in 125 mL polyethylene bottles and 40 mL borosilicate glass bottles, water samples, until full, and 1–2 drops of saturated HgCl2 solution were quickly added. Then, the samples were sealed and stored at room temperature. The measurements were completed within a month after the samples were brought back to the laboratory.
The Mettler Toledo SevenCompact series pH meter (S210-K) (Mettler Toledo Technologies, Zurich, Switzerland) and Inlab Expert Pro pH electrode (Mettler Toledo Technologies, Zurich, Switzerland) were used to measure the pH of seawater (NBS scale). The instrument accuracy was ±0.002. The laboratory data were corrected to the field pH value. Alk and DIC were determined with the T5 automatic titrator equipped with a DGi111-SC composite glass pH smart electrode (Mettler Toledo Technologies, Zurich, Switzerland) using the Gran titration method with an accuracy of greater than 1‰ [28]. The Certified Reference Material (Batch #187) produced by the laboratory of A.G. Dickson (Scripps Institution of Oceanography, San Diego, CA, USA) was regularly used for calibration. pCO2 was calculated from pH and Alk by using the software CO2SYS_V2.1. (Brookhaven National Laboratory, New York City, NY, USA) with the first and second dissociation constants K1 and K2 from Mehrbach [29] refitted by Dickson and Millero [30] and KHSO4 described by Dickson [31].
Determination of Chl-a and nutrients: 150–300 mL water samples were pumped and filtered through a GF/F (Whatman, 25 mm diameter, 0.7 µm poresize, Whatman, Maidstone, UK) filter membrane at low pressure (<0.05 MPa). The filter membrane was wrapped in aluminum foil and stored at –20 ℃ for the determination of Chl-a. The filtrate was frozen in a 100 mL plastic bottle for nutrient determination. After returning to the laboratory, the filter membrane was extracted with 90% acetone solution at a low temperature in darkness for 24 h, and its concentration was determined with a Turner Trilogy fluorometer (Turner Designs, San Jose, CA, USA) to determine the Chl-a content. After thawing, the contents of five nutrients (,,, and ) were determined with an AA3 nutrient analyzer (SEAL Analytical, Norderstedt, Germany).
2.3. Estimation of CO2 Air–Sea Fluxes in Bohai Bay in Summer
There are many models that can be used to calculate the sea–air exchange coefficient, including those proposed by Liss and Merlivat [32], Peng and Takahashi [33], Tans [34], and Wanninkhof [35]. The models proposed by Liss and Merlivat [32] and Wanninkhof [35] are widely used. In this study, the model from Wanninkhof [36] was used to calculate the gas exchange coefficients and estimate the CO2 air–sea fluxes in the investigated sea area.
The CO2 air–sea interface exchange fluxes were estimated by the following equation:
where k is the gas exchange coefficient between the atmosphere and the ocean, KH is the solubility of CO2 gas in seawater, and ΔpCO2 is the difference in pCO2 between seawater and the atmosphere. pCO2 in atmosphere is set as 411 ppm, which is the average value of the nearest atmospheric CO2 station (Tae-ahn Peninsula(TAP) and Anmyeon-do (AMY) in the Republic of Korea) to the Bohai Bay during summer 2020.
F = k × KH × ΔpCO2
3. Results
3.1. Distribution of Relevant Biochemical Parameters in Surface and Bottom Seawater in Bohai Bay
The mean values and ranges of DO, Chl-a and nutrients in the surface and bottom seawater of Bohai Bay are shown in Table 2. The mean values of DO and Chl-a in the surface layer of Bohai Bay were higher than those in the bottom layer, which were 7.31 mg/L and 9.31 µg/L, respectively. The mean value of was highest in both surface and bottom nutrients and the maximum was 18.50 µmol/L in the surface layer. The maximum values of DO and Chl-a occurred in the surface layer.
3.2. Horizontal Distributions of Carbonate Species in Surface and Bottom Seawater in Bohai Bay
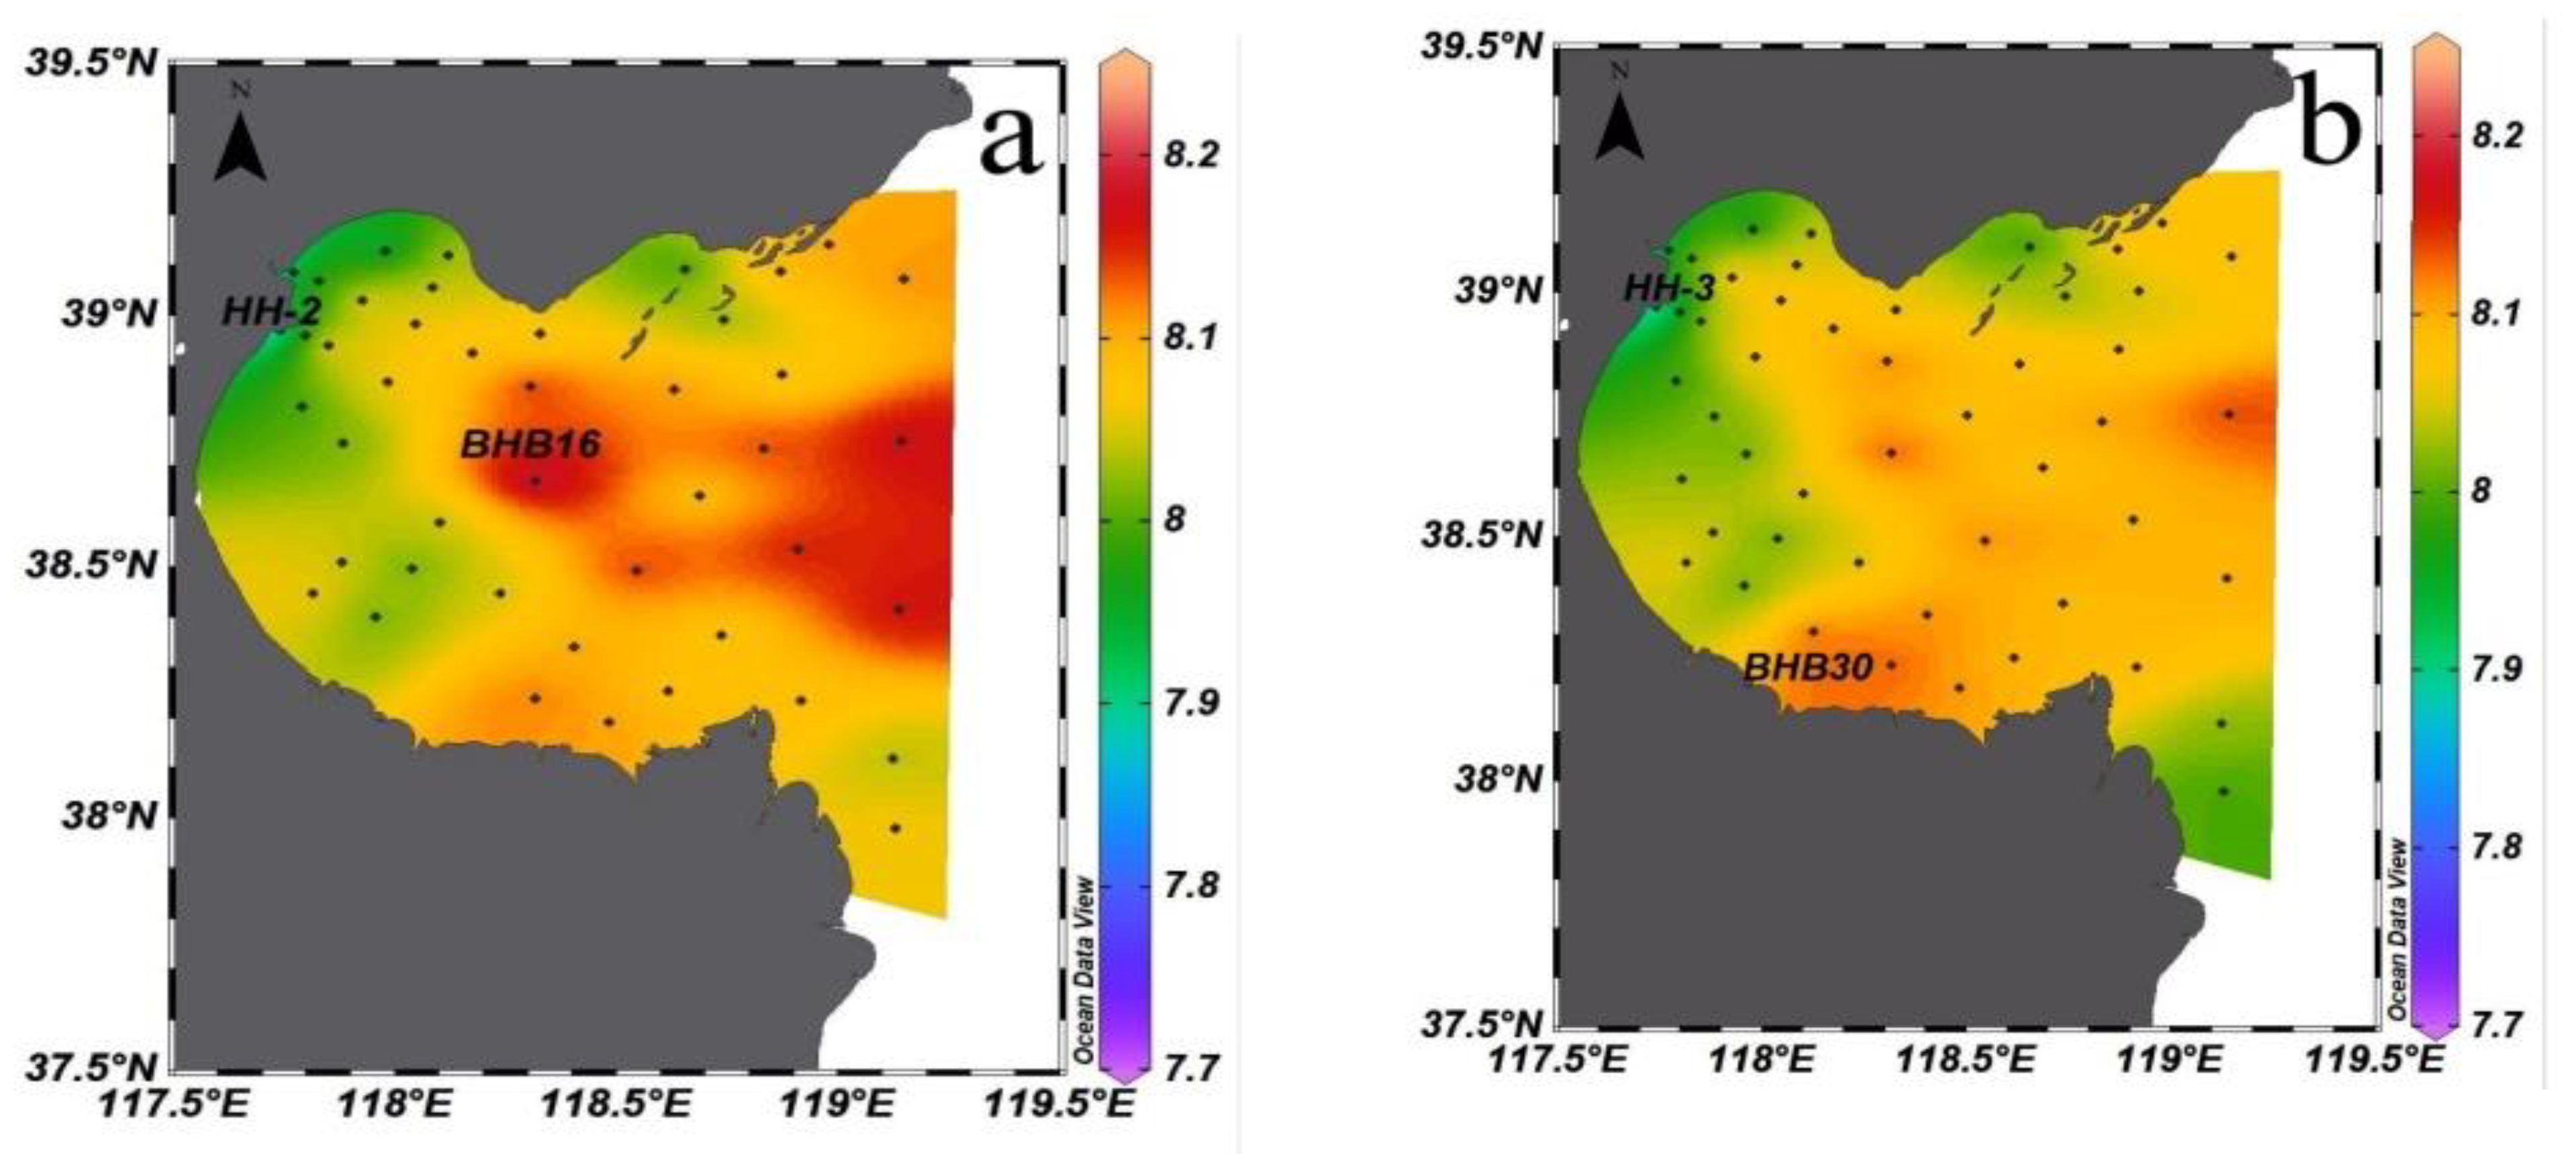
3.2.1. pH Distribution
The pH range in the surface and bottom seawater of Bohai Bay in summer 2020 was 7.73–8.22 and 7.79–8.16, respectively, with mean values of 8.05 and 8.05. The pH of the surface seawater (Figure 3a) in summer generally increased from nearshore to offshore, with the maximum value occurring at station BHB16 in the middle of the bay and the minimum value occurring at station HH-2 near the mouth of the Haihe river estuary. The pH in the bottom seawater (Figure 3b) of Bohai Bay in summer was generally lower in the western part of the bay and higher in the southern part of the bay near the shore, with the maximum value occurring at station BHB30 near the mouth of the Majia River and the minimum value arising occurring at station HH-3. This was similar to the minimum value for the surface layer.
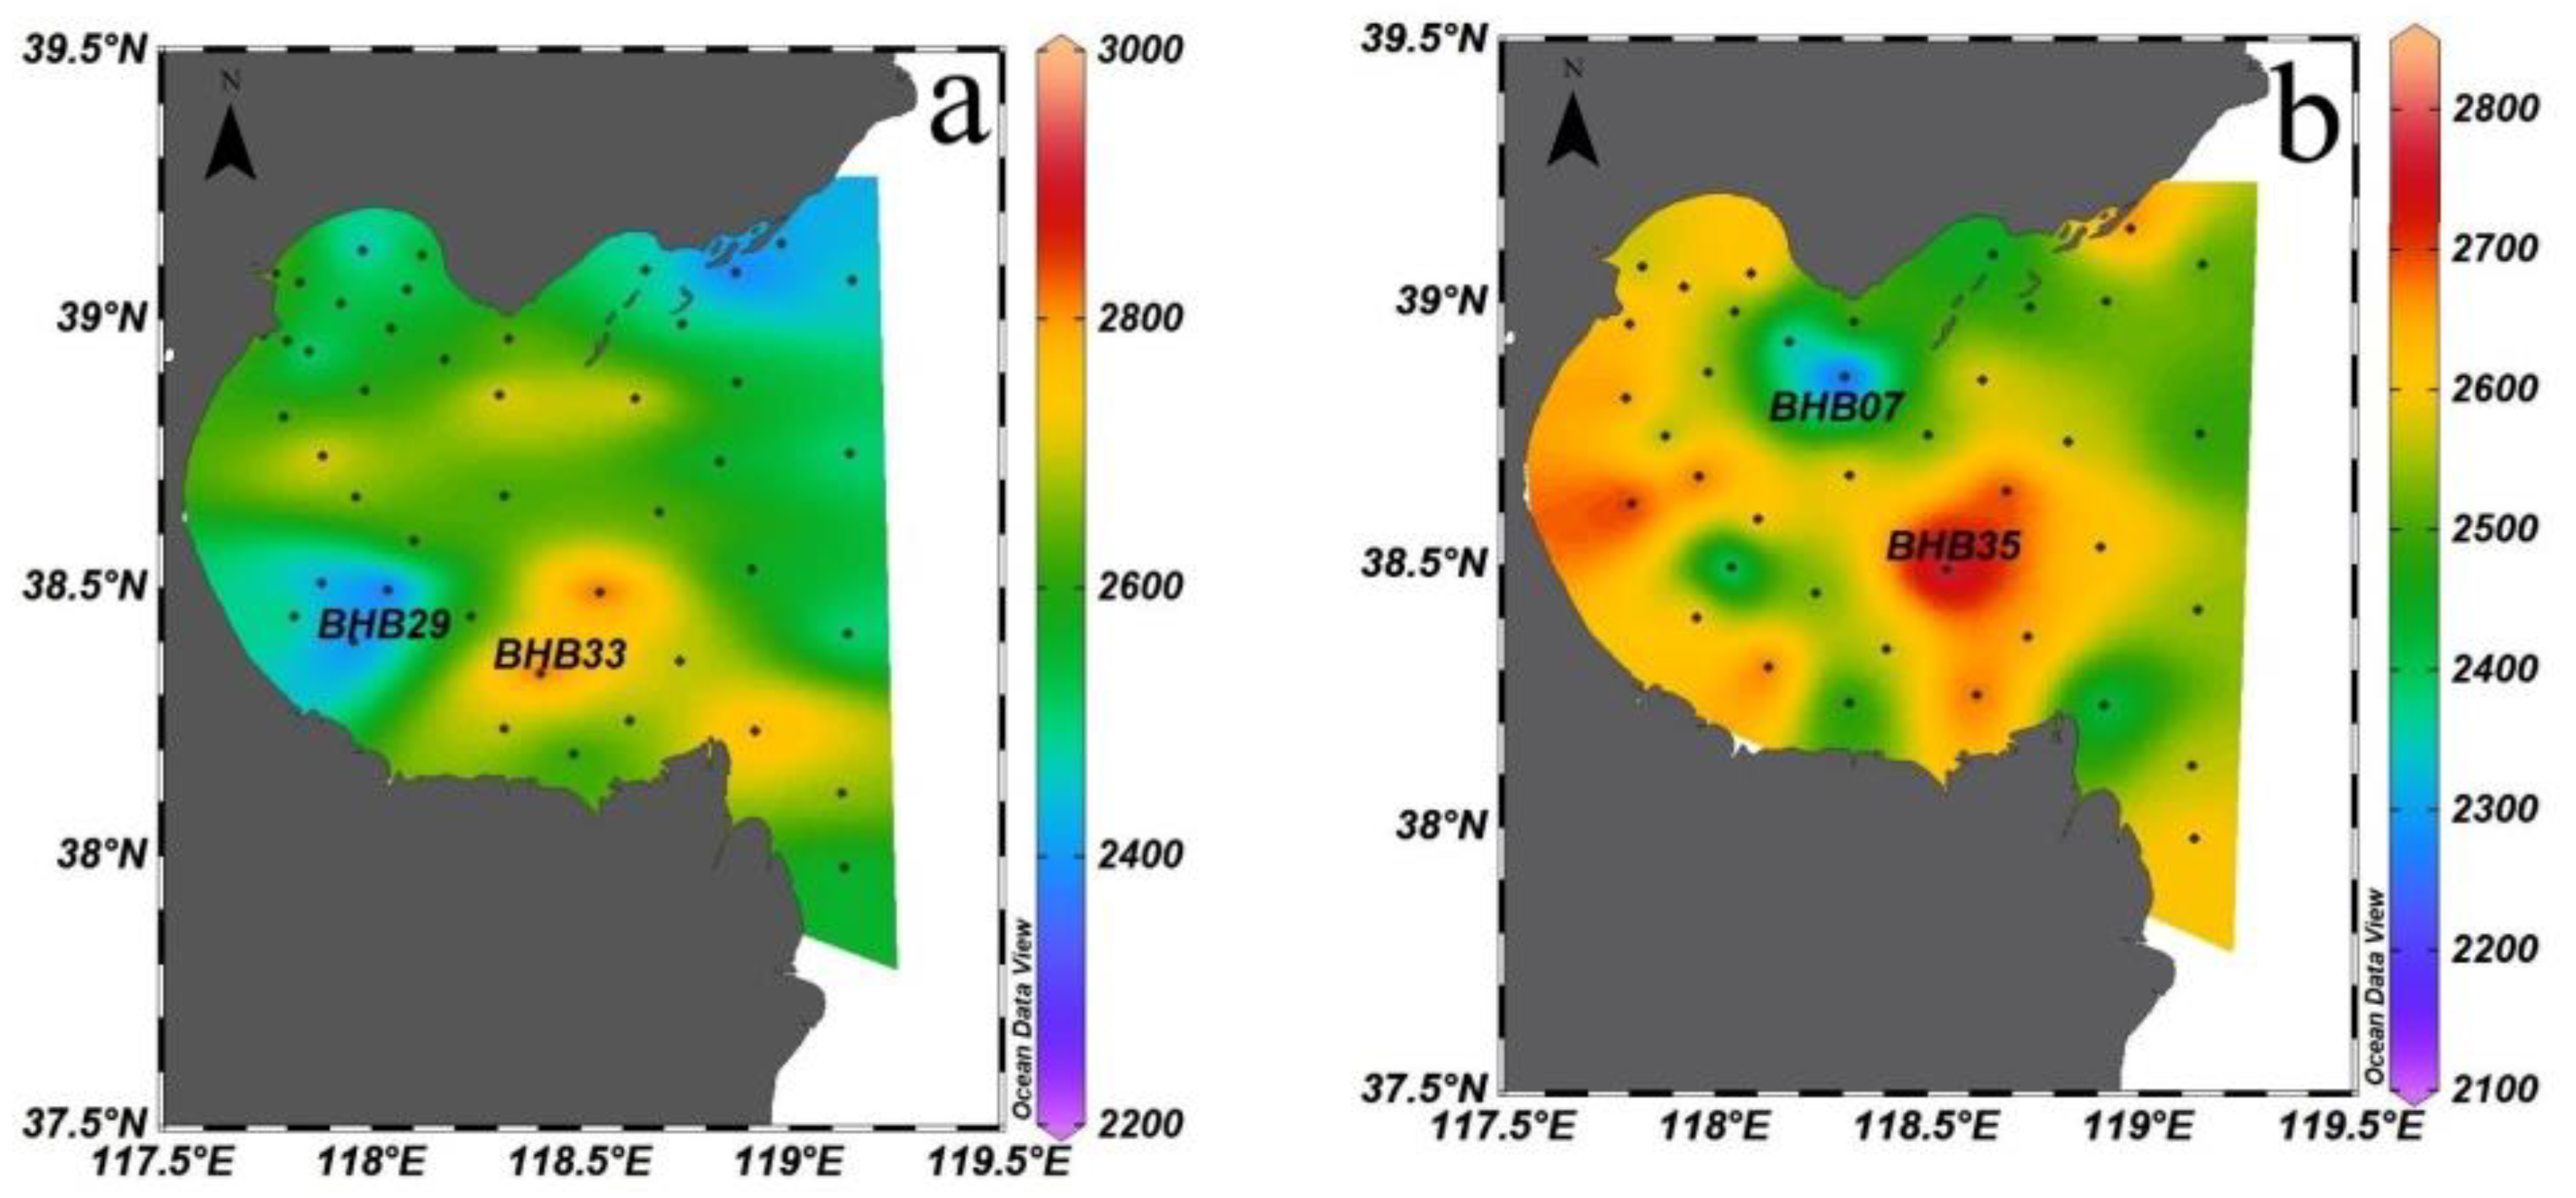
3.2.2. Alk Distribution
The Alk distributions in the surface seawater and the bottom seawater in Bohai Bay in summer 2020 were 2220–2941 µmol/kg and 2141–2810 µmol/kg, respectively, with mean values of 2338 µmol/kg and 2327 µmol/kg. In the surface layer (Figure 4a), Alk increased from the northwest to the southeast of the bay. The overall concentration was low in the north and high in the south, with a maximum value of 2941 µmol/kg at station BHB33 and a minimum value of 2220 µmol/kg at station BHB29. In the bottom layer (Figure 4b), Alk increased from the west to the east of the Bay. The overall concentration was low in the north and high in the south and high in the west and low in the east. The maximum value of 2810 µmol/kg occurred at station BHB35, close to the location at which the maximum value of surface Alk appeared. The minimum value of 2141 µmol/kg occurred at station BHB07 in the north of the bay.
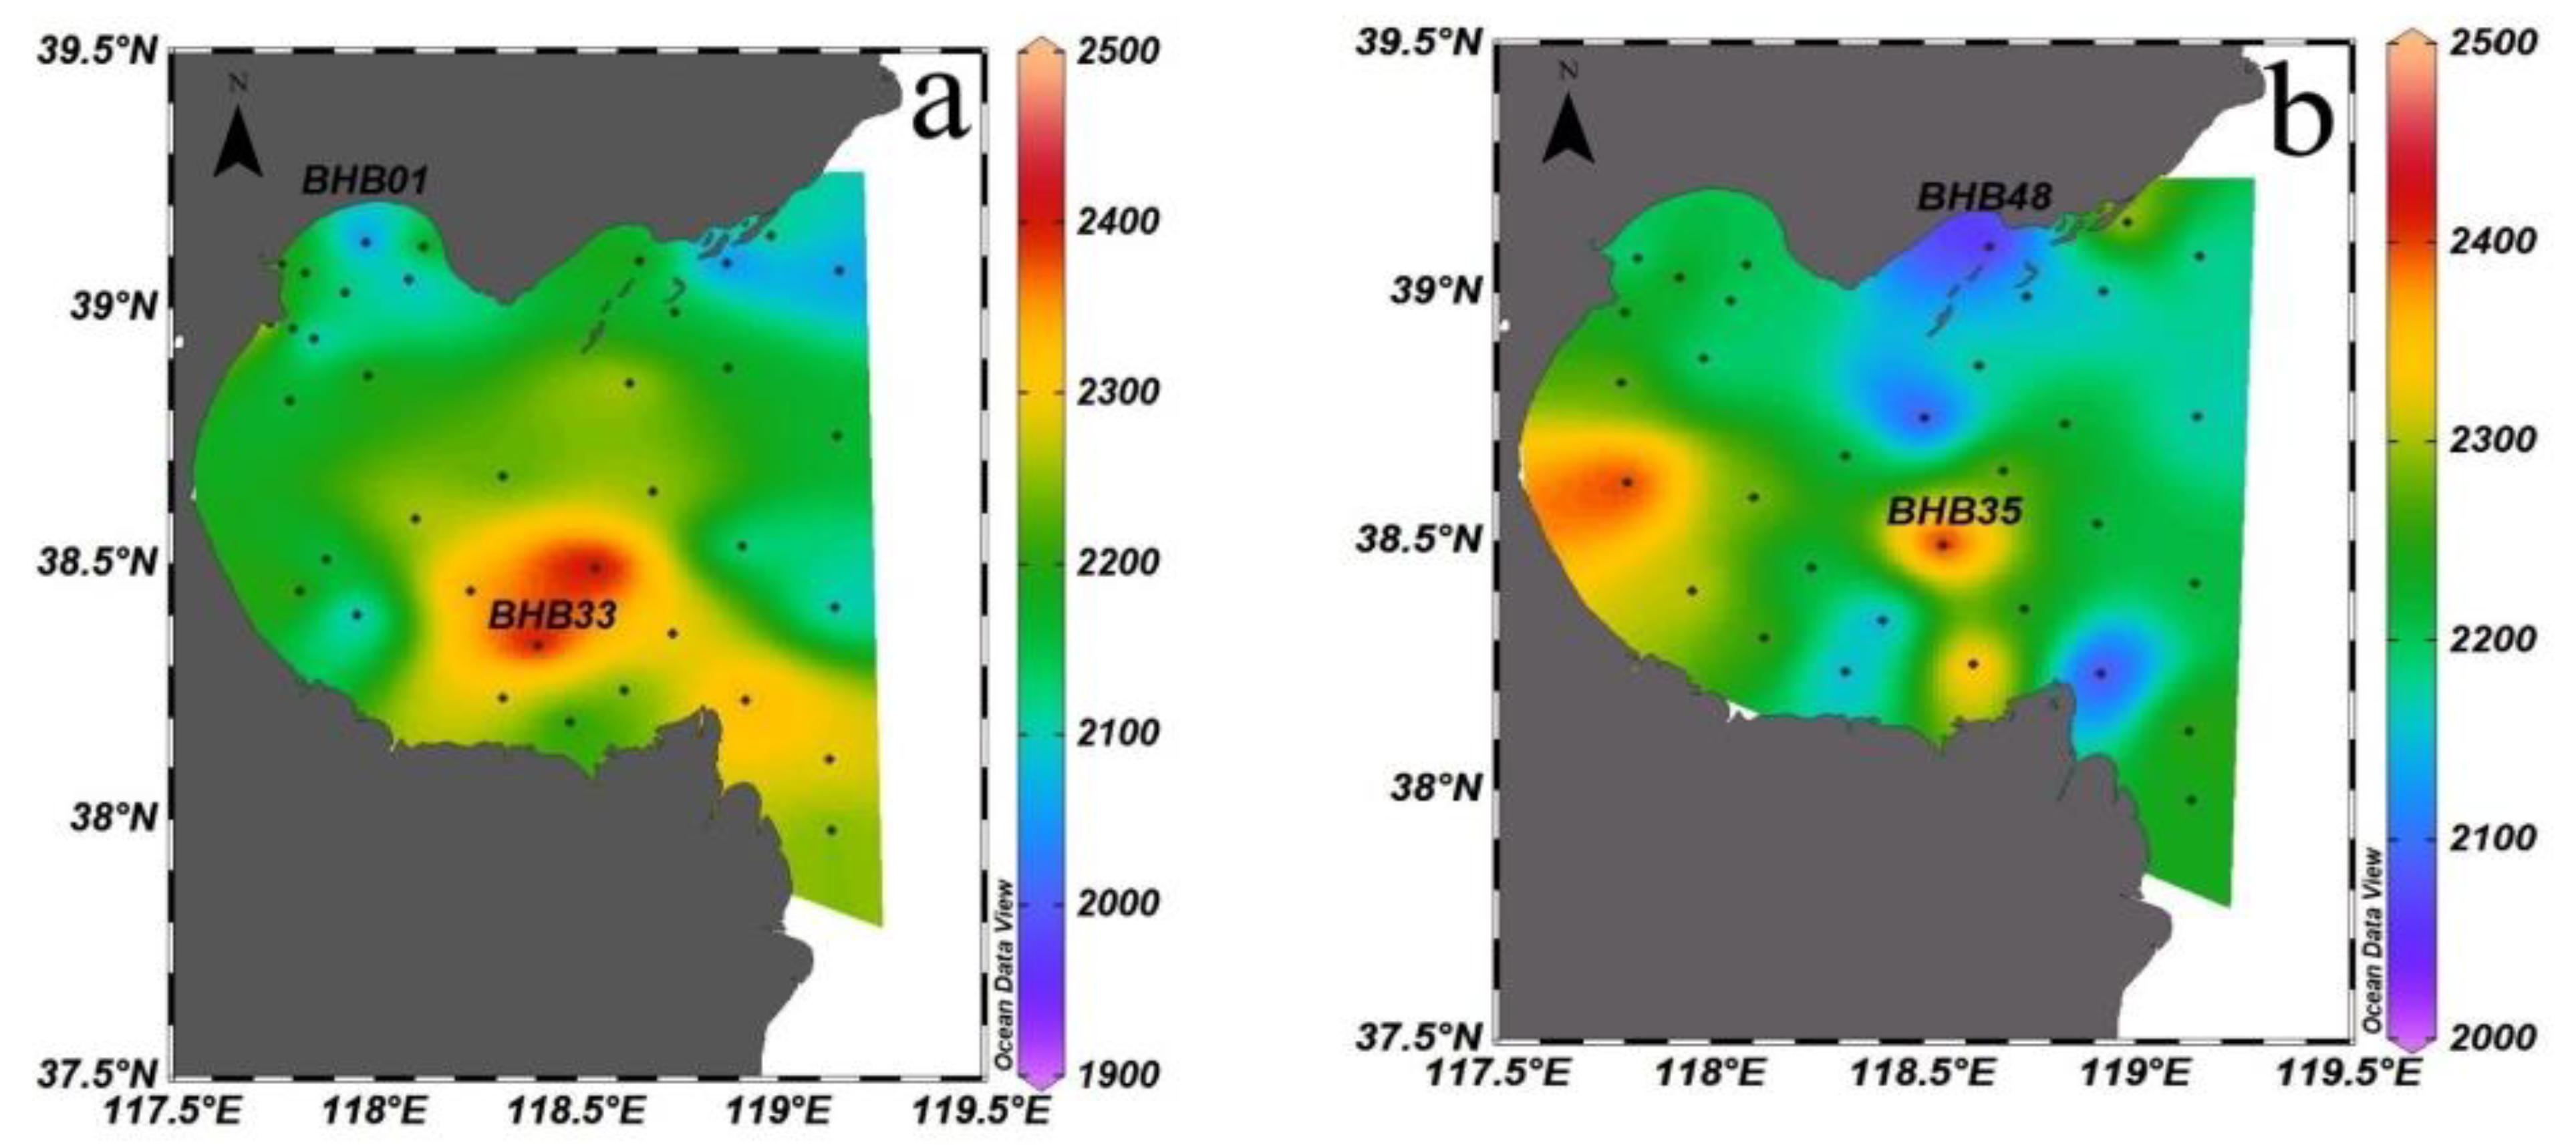
3.2.3. DIC Distributions
The DIC concentration in the surface (Figure 5a) and bottom seawater (Figure 5b) in Bohai Bay in summer 2020 were 1919 to 2485 µmol/kg and 2038 to 2460 µmol/kg, respectively, with mean values of 2201 µmol/kg and 2221 µmol/kg. The DIC distribution trend in Bohai Bay in summer was very similar to that of Alk: in the surface layer, the concentration increased from the north to the south of the bay and the overall concentration was low in the northwest and high in the southeast with a maximum value of 2485 µmol/kg at station BHB33 in the middle of the bay. This is consistent with the location of the maximum Alk value. The bottom layer showed an increasing concentration trend from the north to the south of the bay with lower concentrations in the northern nearshore stations and higher concentrations in the western nearshore stations, where the maximum DIC value of 2460 µmol/kg and the maximum Alk value both emerged at station BHB35 in the middle of the bay. The minimum value of 2038 µmol/kg occurred at station BHB48 in the northeast of the bay.
3.2.4. pCO2 Distribution
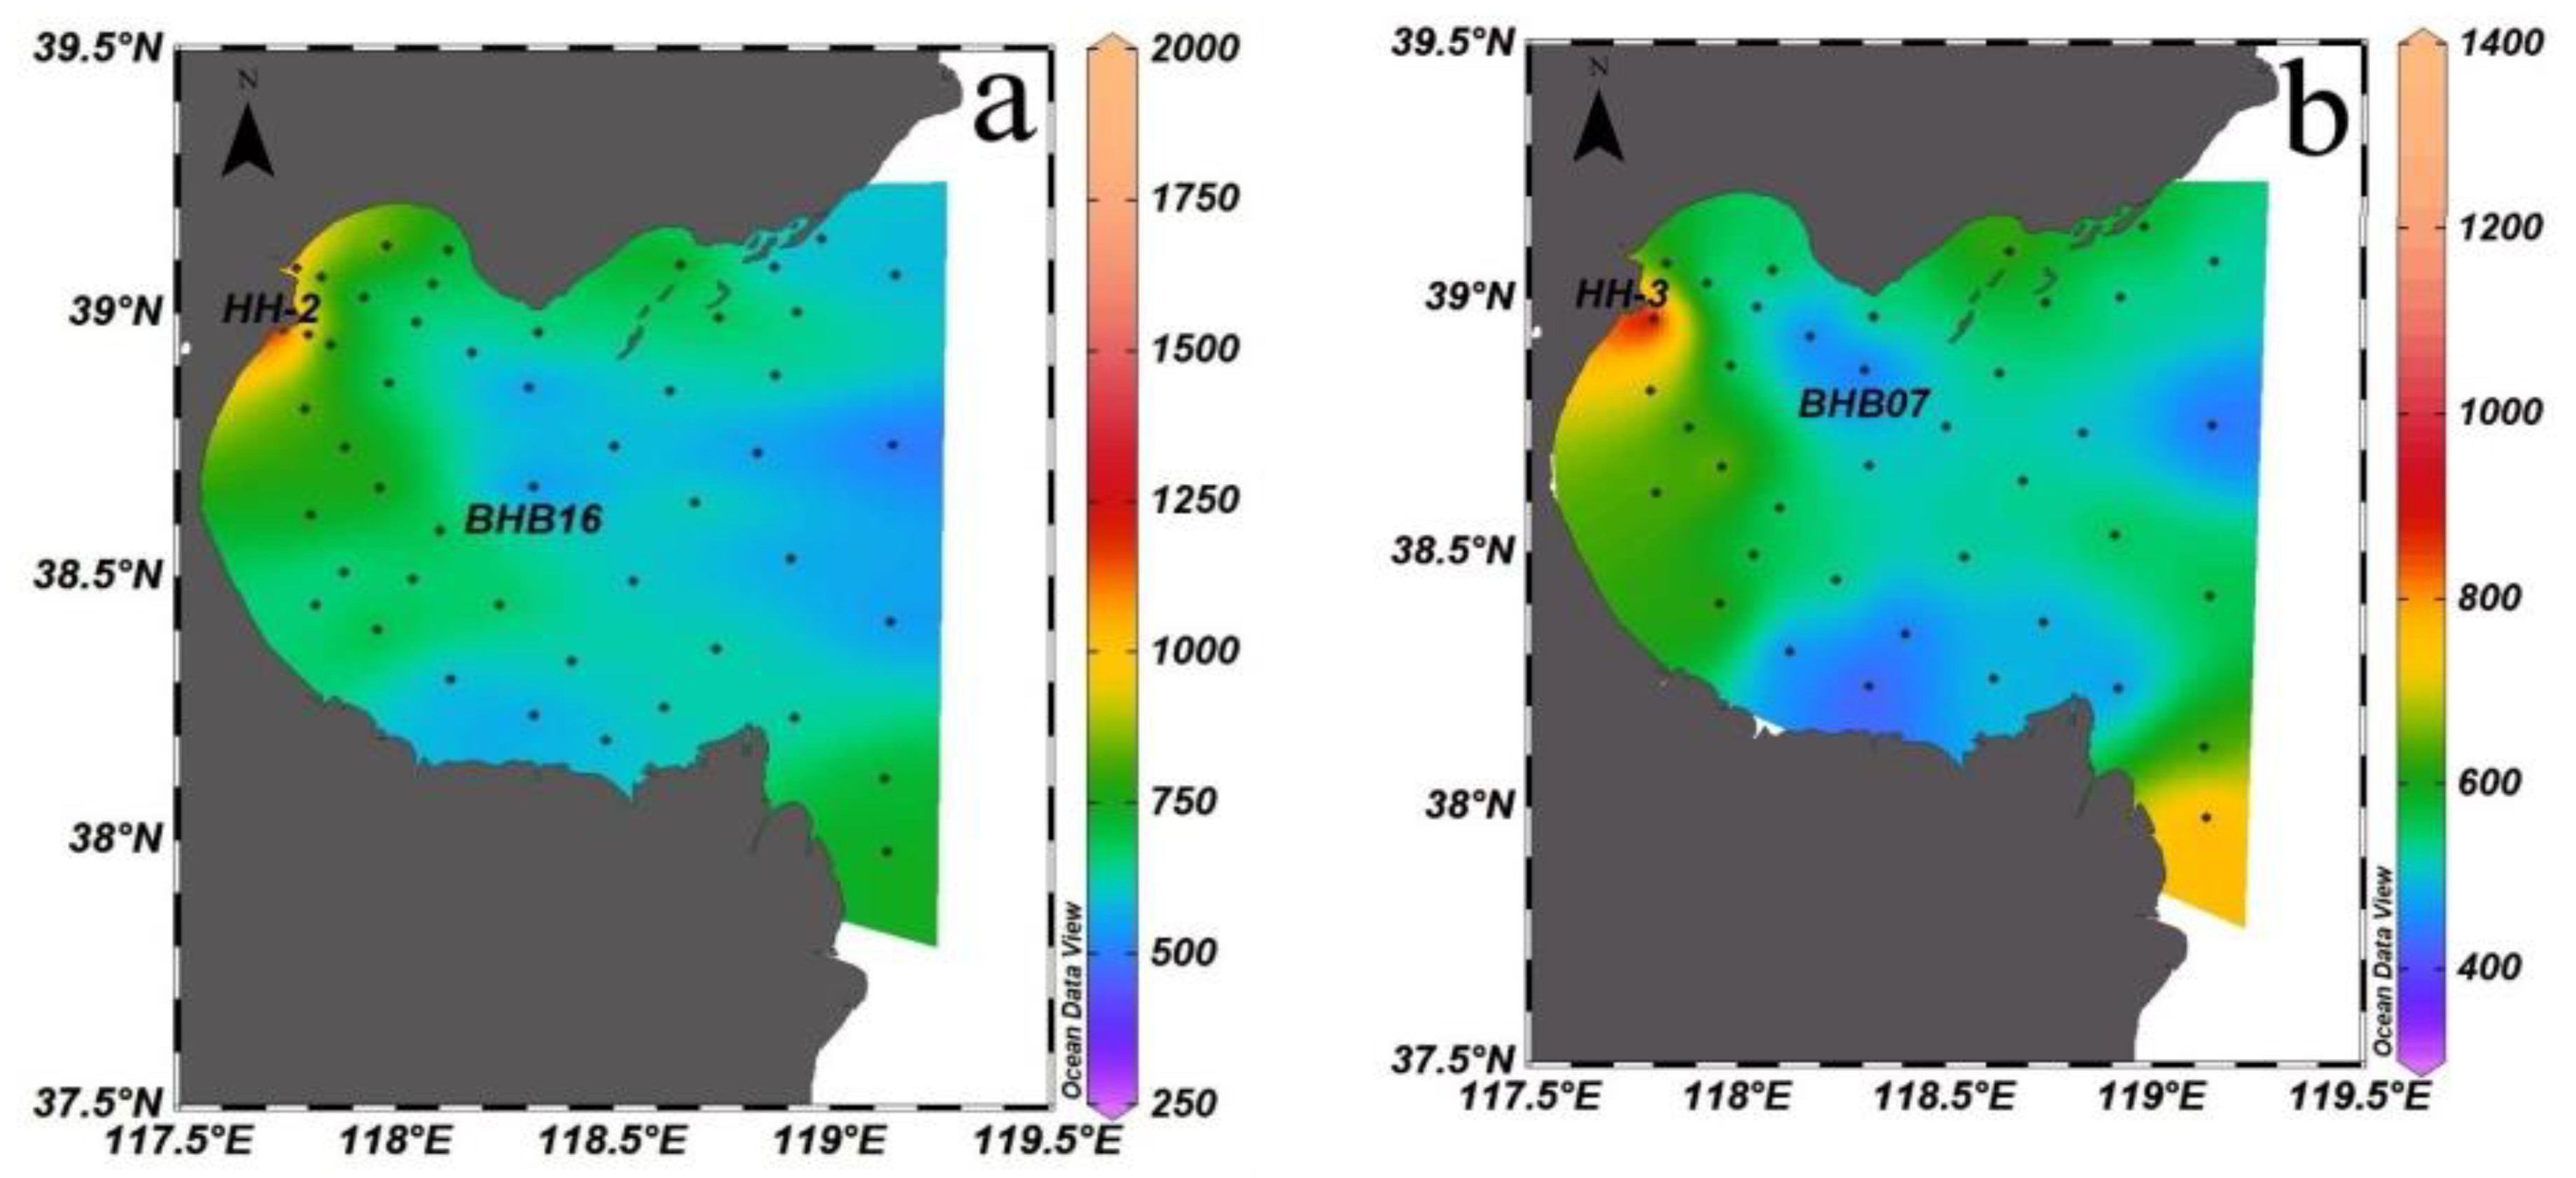
In summer 2020, the pCO2 in the surface (Figure 6a) and bottom seawater (Figure 6b) in Bohai Bay was 433–1828 µatm and 479–1362 µatm, respectively, with mean values of 697 µatm and 669 µatm. The pCO2 was comparatively high in the nearshore area of the northwestern part of the bay and low in other areas with a maximum value of 1828 µatm occurring at station HH-2 near the mouth of the Haihe River and a minimum value of 433 µatm occurring at station BHB16 in the middle of the bay. The distribution trend of seawater pCO2 was consistent with that of the surface layer with the minimum and maximum values occurring at station BHB07 in the north of the bay and station HH-3 near the mouth of the Haihe River: 479 µatm and 1362 µatm, respectively.
3.2.5. CO2 Air–Sea Flux Distribution
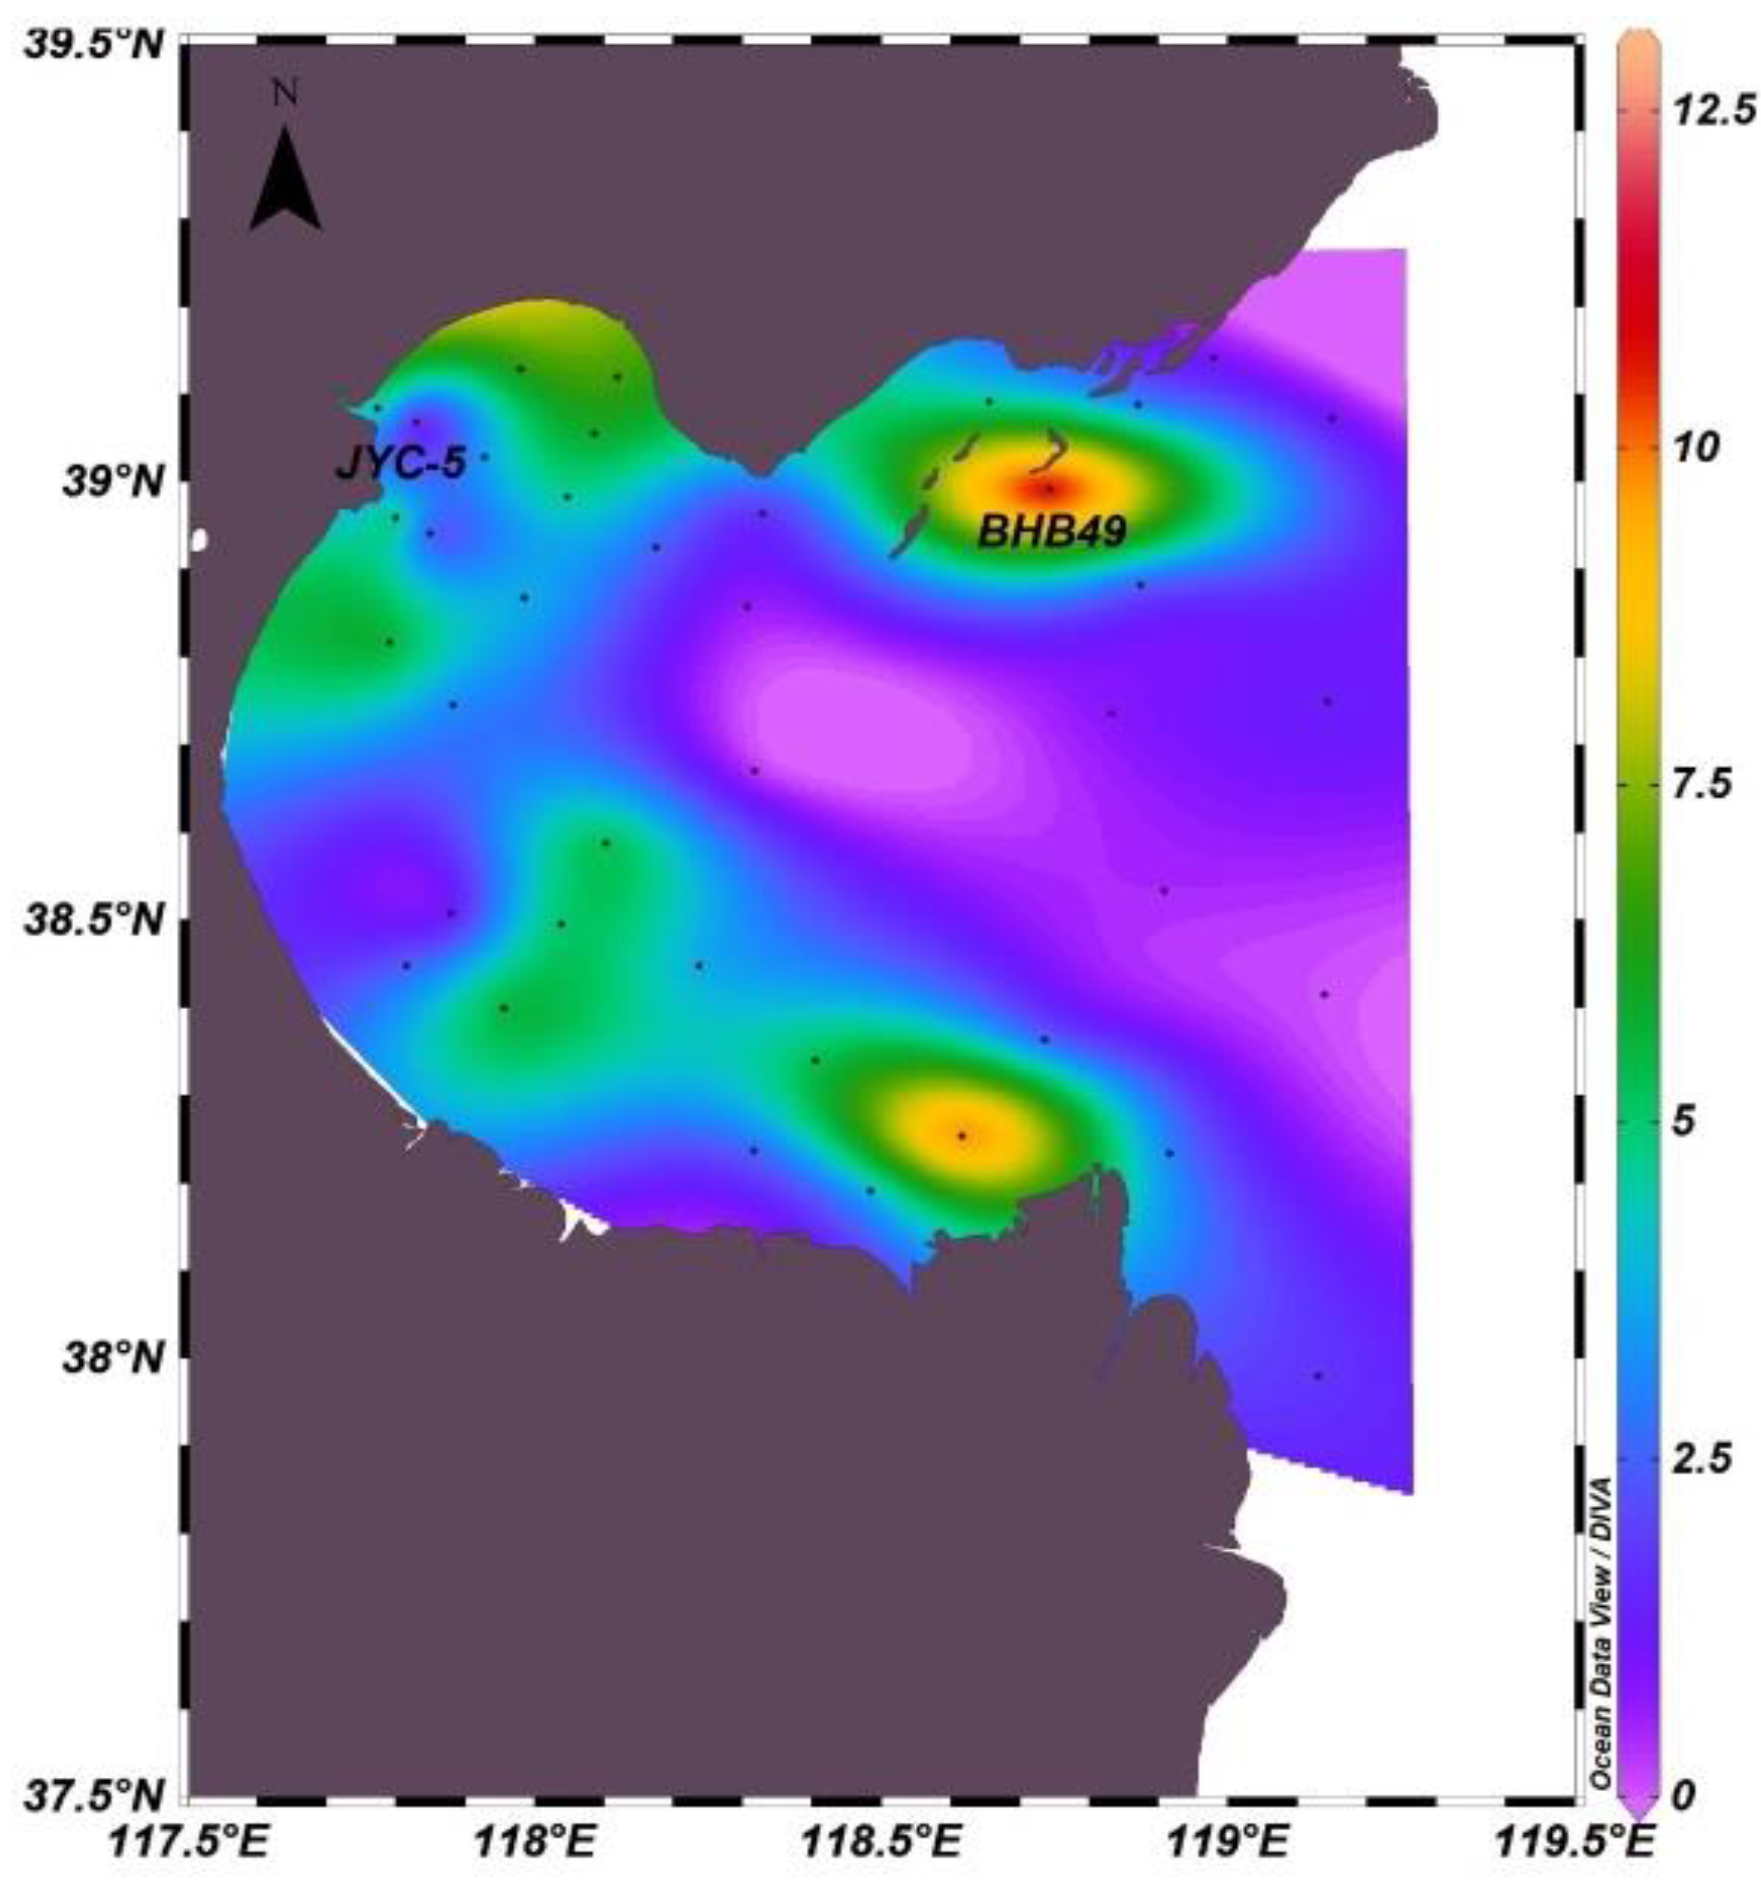
The CO2 air–sea fluxes (Figure 7) of Bohai Bay in summer were found to range from 0.05 to 12.41 mmol/(m2·a) with a mean value of 3.64 mmol/(m2·a) and the value was positive at all stations, indicating that CO2 is released to the atmosphere from Bohai Bay, making it a source area. The maximum value was identified at station BHB49 in the northeast of the bay, where CO2 concentration released was much higher than that in nearby areas due to influences from many aquaculture areas and offshore oil drilling platforms in the area. Similarly, high values were found in the southeast area of the bay with higher values occurring at the nearshore stations of Bohai Bay, mainly due to fisheries and Tuhai River and Yellow River (the former Yellow River Road) inputs with high carbonate contents. The sea area of Bohai Bay is 15,900 km2, and based on the mean CO2 air–sea fluxes of 3.64 mmol/(m2·a) in this study, it can be estimated that the CO2 emissions from Bohai Bay during the study period were about 97.68 t.
3.3. Distributions of Carbonate Species in the Relevant Rivers Flowing into Bohai Bay
The pH (Table 3) ranged from 7.19 to 8.89 in the six rivers flowing into Bohai Bay. On the whole, the upstream and midstream stations had higher values than stations of estuaries. The maximum pH was 8.89 in the upstream part of Jiyun River. The minimum pH occurred at HK26, the estuary of Jiyun River. The minimum Alk value was 1231 µmol/kg at station JHD17 in the downstream part of Majia River. The maximum value was 6519 µmol/kg at station PTD6 in the Zhangwei New River, and the overall distribution trend decreased from upstream to downstream. The lowest DIC concentration was 1103 µmol/kg at station JHD17 in the downstream part of Majia River. The maximum DIC value (5887 µmol/kg) occurred at station PTD6 in Zhangwei New River. On the whole, the DIC distributions were consistent with those of Alk. The contents in the midstream and upstream areas were higher than those in the downstream area and estuary. Both the maximum and minimum pCO2 values appeared at the Jiyun River, among which the maximum value was 6770 µatm at station HK26 in the estuary and the minimum value was 223 µatm at station JHD6 in the midstream area.
3.4. Vertical Distributions of Carbonate Species in Bohai Bay
3.4.1. Vertical Distributions of Carbonate Species in Transect A
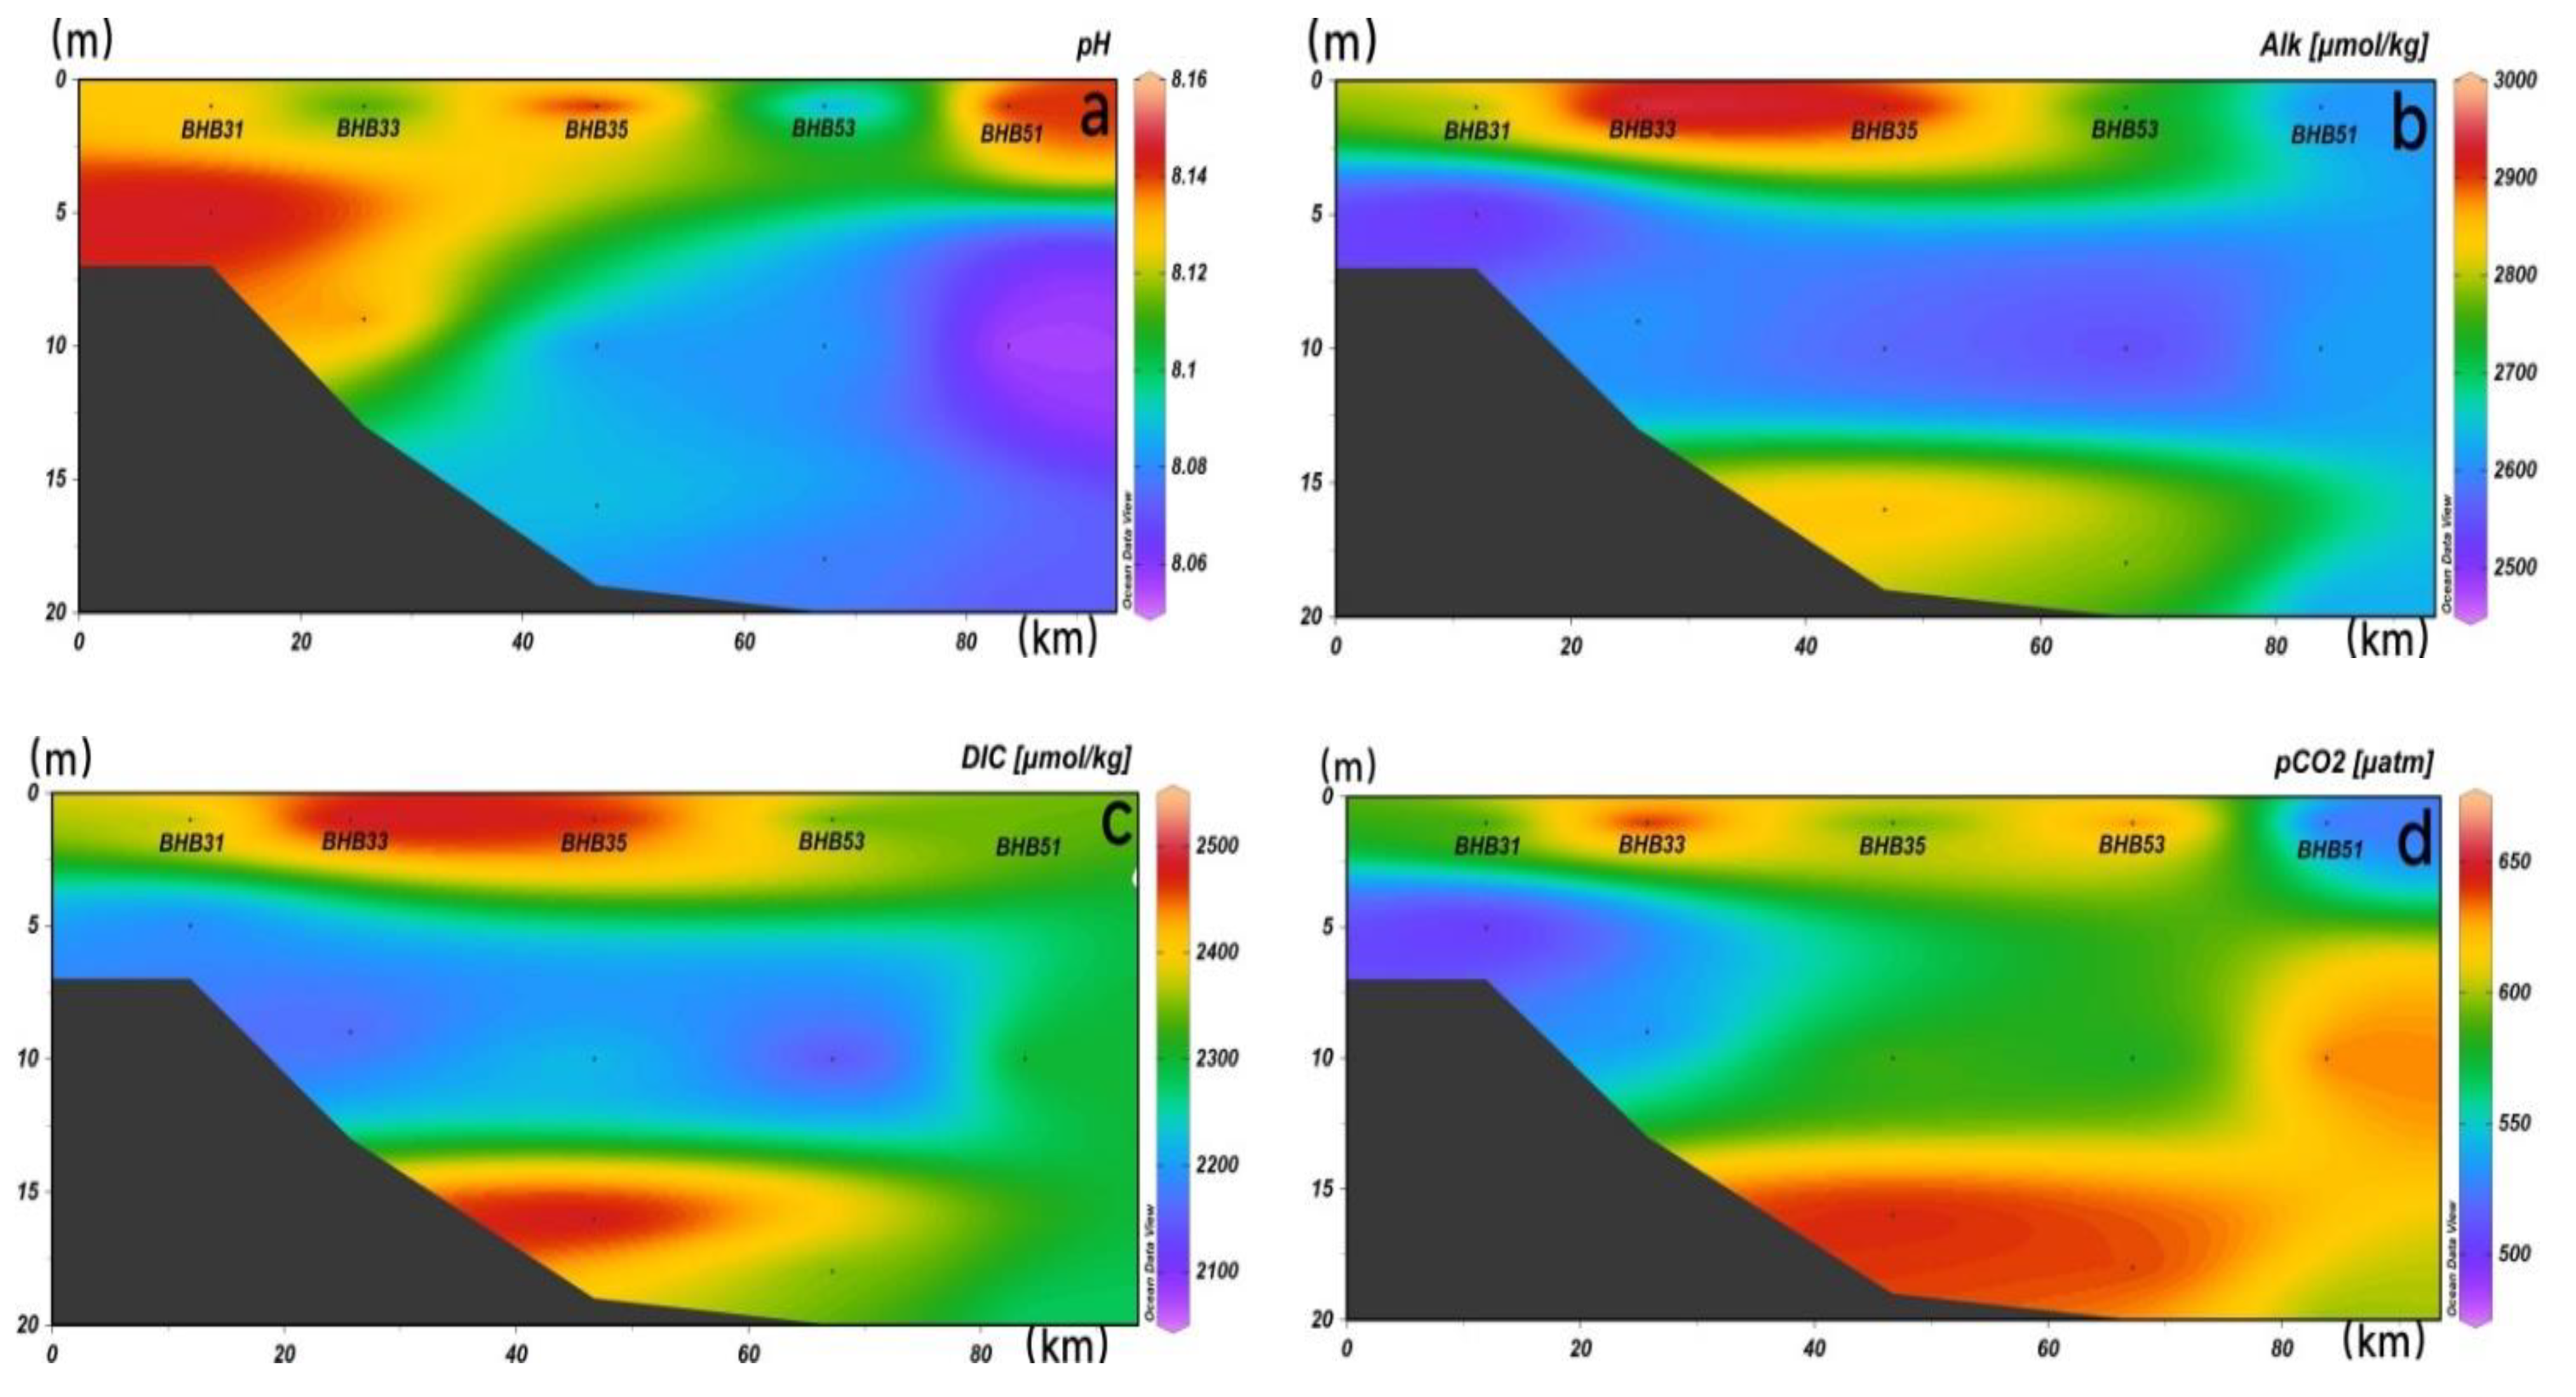
Transect A was a transect of the Tuhai River extending into Bohai Bay with five sampling points. The sampling stations were aligned southwest to northeast with the extension of the river. The pH (Figure 8a), Alk (Figure 8b), DIC (Figure 8c) and pCO2 (Figure 8d) of seawater in this transect were 8.05–8.16, 2441–2941 µmol/kg, 2052–2485 µmol/kg and 494–673 µatm, respectively. The pH was evenly distributed in the vertical direction and showed no obvious stratification phenomenon. The overall pH was high in the surface layer and low in the bottom layer and decreased from southwest to northeast in the bottom layer. Alk gradually decreased and then increased with depth in transect A with a high value of 2941 µmol/kg in the surface layer of station BHB35. The distribution trend of DIC was similar to that of Alk—decreasing and then increasing with depth. The maximum DIC and Alk values appeared at the same station: BHB35. pCO2 in this transect had a more uniform distribution in the vertical direction, and the bottom layer of the nearshore station was lower than the rest of the transect.
3.4.2. Vertical Distributions of Carbonate Species in Transect B
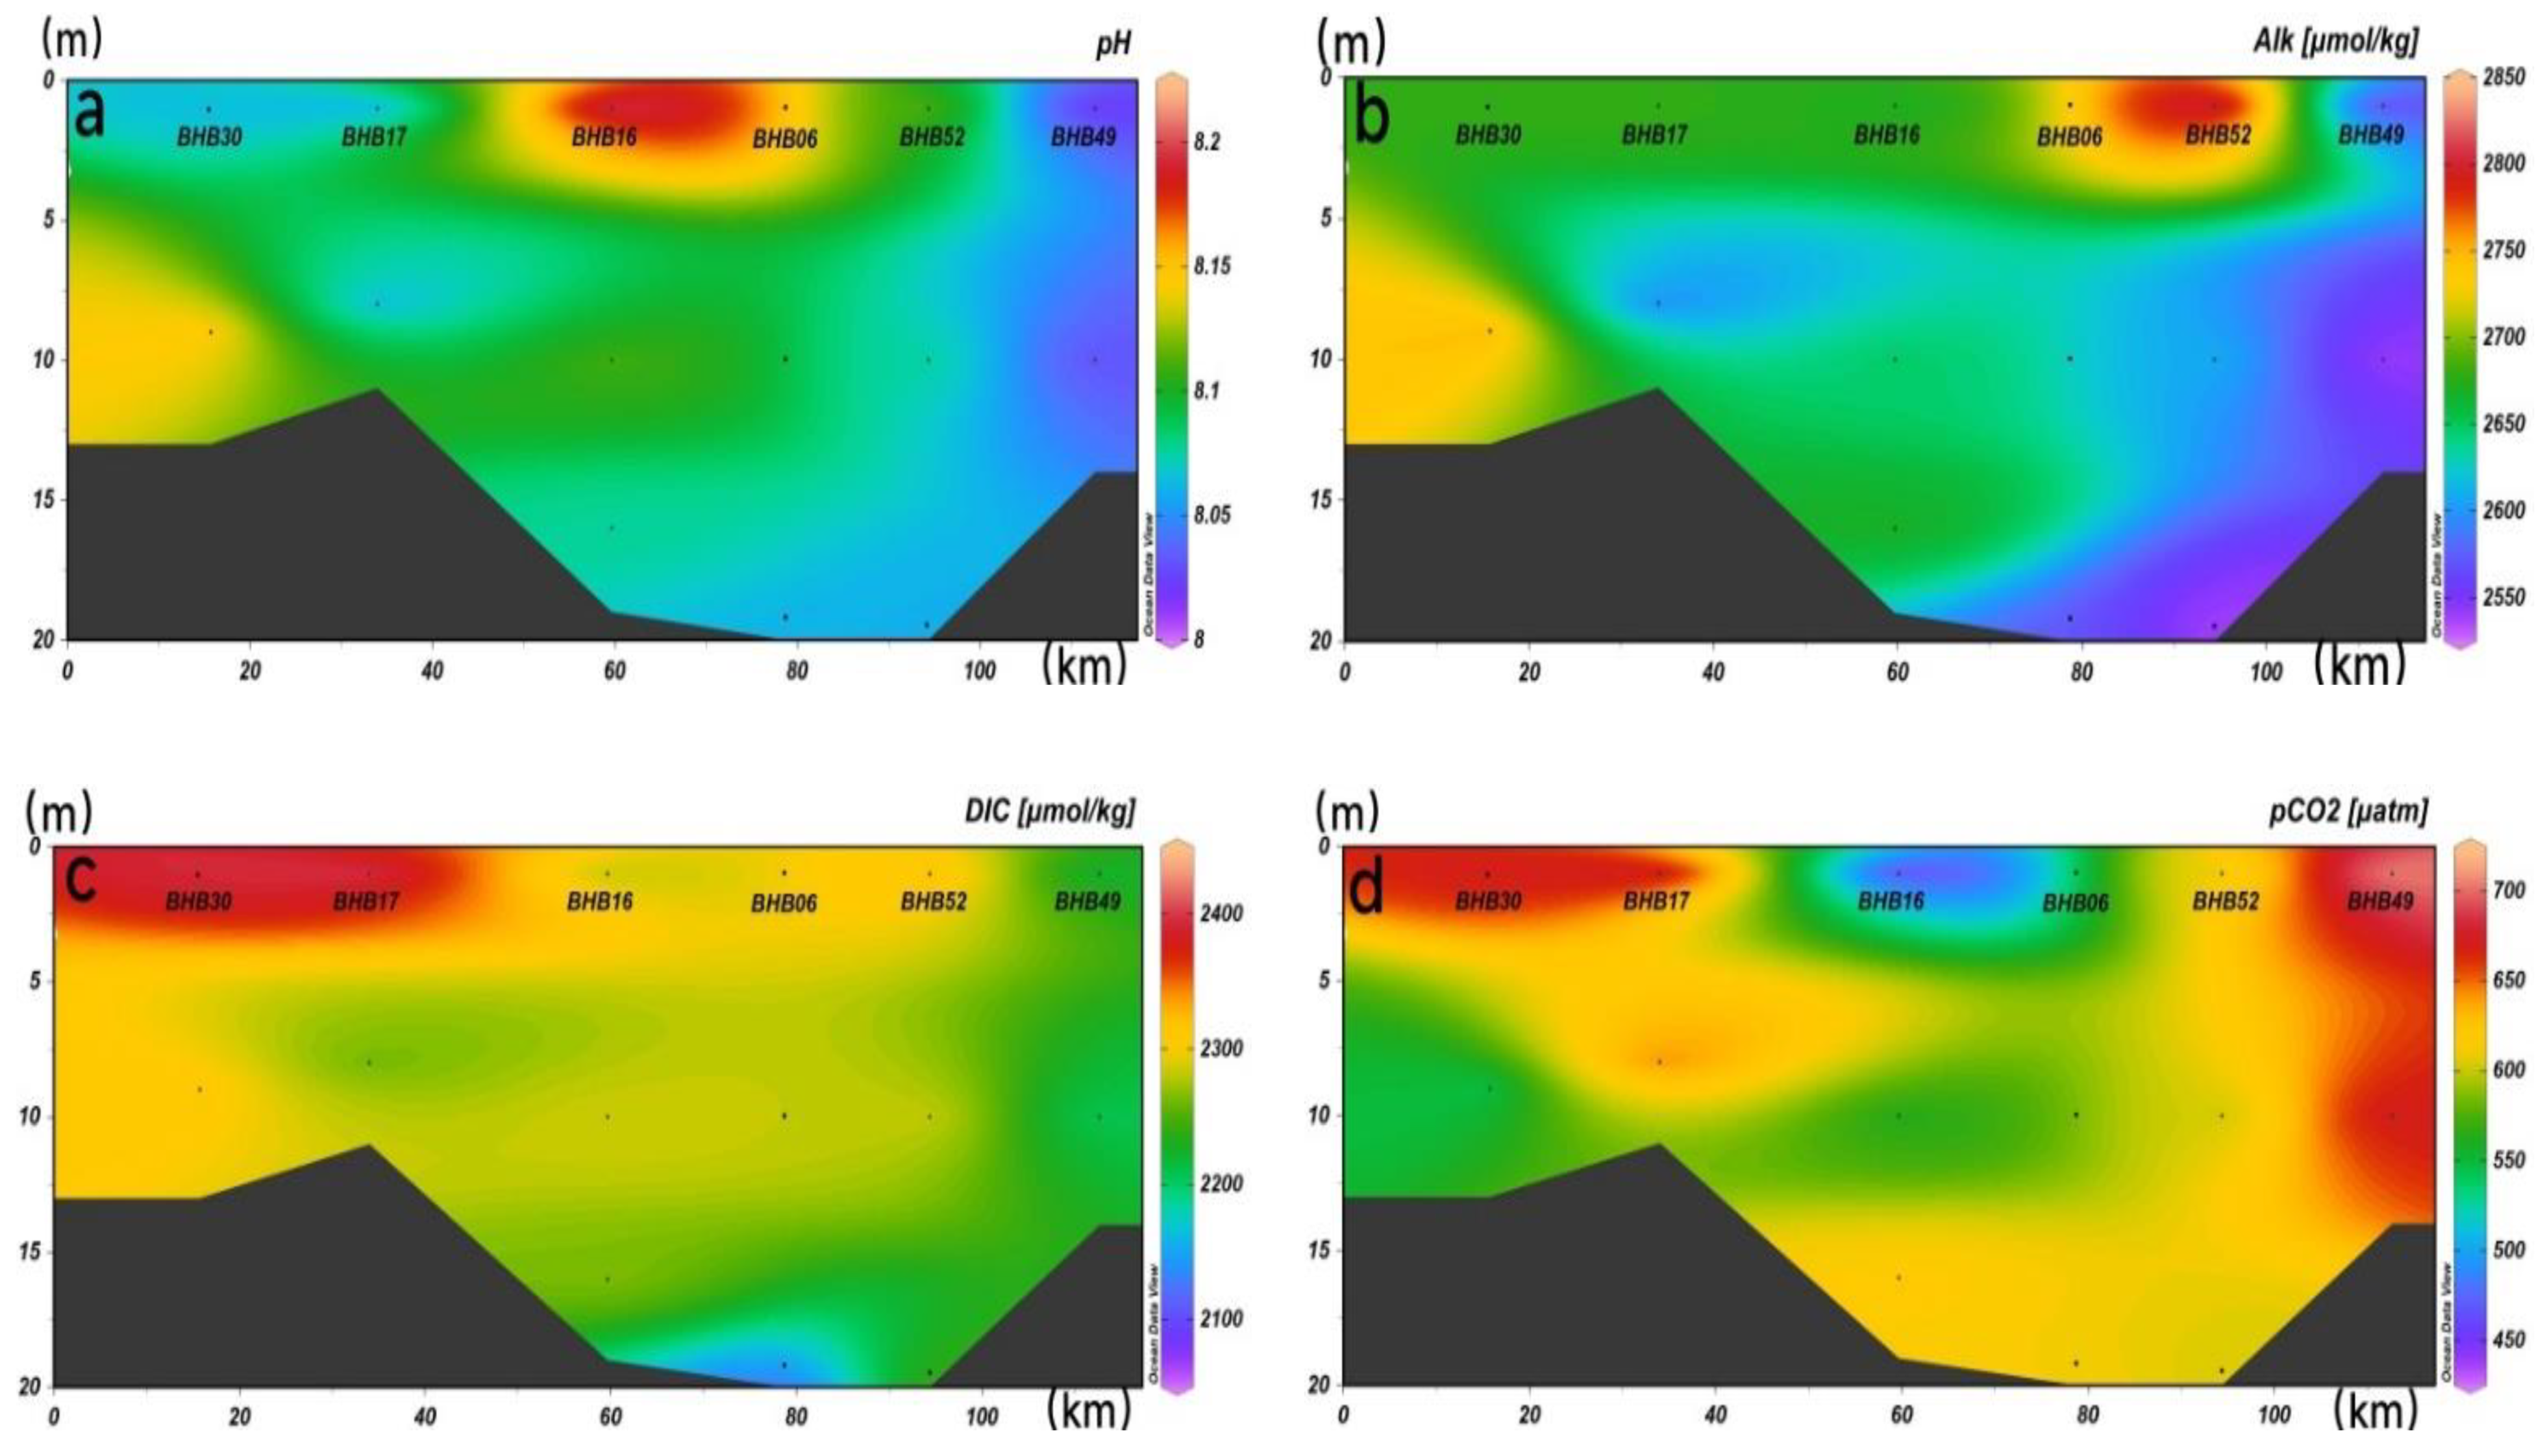
Transect B was a transect of the MaJia River extending into Bohai Bay with six sampling sites, and the sampling stations were also aligned southwest to northeast with the river extension. The pH (Figure 9a), Alk (Figure 9b), DIC (Figure 9c) and pCO2 (Figure 9d) of seawater in this transect were 8.01–8.22, 2477–2771 µmol/kg, 2045–2366 µmol/kg and 433–714 µatm, respectively. The pH decreased from the surface layer to the bottom layer in the central sea of transect B. The pH distribution presented little variation in the nearshore area. In this transect, Alk gradually decreased with depth with a high value of 2771 µmol/kg in the surface layer of station BHB52. DIC also gradually decreased with increasing depth, and the vertical distribution in the middle layer was more uniform, but the distribution of the highest value differed slightly from that of Alk. The maximum DIC value was found in the surface layer of station BHB17. pCO2 gradually increased with depth in transect B. Its distribution trend was completely opposite to that of the pH, and the minimum value of 433 µatm appeared in the surface layer of station BHB16.
4. Discussion
4.1. Comparison with Other Estuaries/Bays
Estuarine carbonate species are susceptible to high spatial and temporal variability due to physical, chemical, biological, topographic and geomorphological, and anthropogenic disturbances, and there are significant differences in the carbonate species in estuaries/bays of different regions. To explore the differences between Bohai Bay and other bays, we selected data of carbonate species in six northern hemisphere middle and high latitude estuaries/bays for a brief comparison with the data measured in Bohai Bay in this paper (Table 4).
The comparison showed that there are significant differences in the concentrations of carbonate species in the estuaries of different regions. In this paper, the average surface pH of Bohai Bay in summer 2020 was 8.06, which was slightly higher than the average surface pH in Jiaozhou Bay in summer 2007 and slightly lower than the average surface pH in the Bohai Sea in summer 2016.
The average surface Alk in Bohai Bay in summer 2020 was 2338 µmol/kg, which was higher than that in Hangzhou Bay in summer 2019 (1886 μmol/kg) and that in Jiaozhou Bay in summer 2007 (2163 µmol/kg). This was close to the average surface Alk concentration of 2370 µmol/kg in summer 2016 in the Bohai Sea. The reason for this is that the Alk concentrations of the rivers injected into Bohai Bay were higher than those of other bays in the summer. In addition, due to the high temperature in summer and the uneven precipitation of rivers in the north of China, the large amount of surface water evaporation led to a significant increase in the Alk of the river. The distribution of Alk was also affected by the change in salinity. Bohai Bay is located in the west of Bohai Sea and has low exchange with external seawater for long periods of time. The salinity is also higher than that in the other two bays, so the concentration of Alk is also high.
The average surface DIC concentration of Bohai Bay in summer was 2201 µmol/kg, which was higher than the average surface DIC concentrations of 2067 µmol/kg in Jiaozhou Bay in summer 2007, 2133 µmol/kg in the Bohai Sea in summer 2016 and 1805 µmol/kg in Hangzhou Bay in summer 2019. DIC concentrations of Bohai Bay were higher than in other marine areas, probably due to the higher level of pollution in the water bodies of the region. The coastal industrial and domestic wastewater discharges from the towns around Bohai Bay are high, and a large amount of land-based material enters the sea and eventually decomposes into inorganic carbon. In addition, the near-shore area of Bohai Bay is a concentrated area for mariculture, and is also the main receiving site for land-based and marine discharges. Due to its special geographical location, water circulation is slow, and the discharge of farming wastewater can lead to a large amount of organic matter entering the sea and eventually decomposing into inorganic carbonates and other substances, resulting in higher DIC concentration in seawater than Jiaozhou Bay and Hangzhou Bay.
The mean value of surface pCO2 in Bohai Bay in summer was 697 µatm, which is similar to the mean value of surface pCO2 (674 µatm) in Jiaozhou Bay in summer 2007 and larger than the mean value of pCO2 (499 µatm) in Bohai Sea in August 2016, while it is slightly lower than the mean value of surface seawater pCO2 (799 µatm) in Hangzhou Bay in summer 2019. This might be due to the fact that Hangzhou Bay is a typical heterotrophic bay, and Bohai Bay is not as heterotrophic as Hangzhou Bay.
4.2. Influences of Relevant Hydrological and Biochemical Parameters on the Carbonate Species of Bohai Bay
The correlations between the carbonate species (pH, Alk, DIC, pCO2) and environmental parameters (T, S, DO, Chl-a, , , , , , etc.) are shown in Table 5. The results show that the overall pH and pCO2 had the highest correlations with S, DO and nutrients, indicating the dominant roles of the freshwater input and biological activity on the carbonate species.
Biological processes, such as photosynthesis, respiration and calcification, significantly affect the seawater carbonate species by consuming and releasing CO2 [43]. In the surface layer, among the carbonate species, pH and pCO2 were found to be significantly correlated with other related parameters such as T, S, DO, Chl-a, ,, and . The results of this survey showed a significant correlation between pH and salinity and temperature, which to some extent can indicate that the interaction between different water masses in Bohai Bay during the survey period had some influence on the spatial variation of pH. Chl-a is an important indicator of the phytoplankton biomass. According to the results shown in Table 5, there was a significant correlation between two carbonate species, pH and pCO2 and Chl-a. pH had a significant negative correlation and pCO2 had a significant positive correlation with Chl-a. This is consistent with the findings of a study in Jiaozhou Bay [44], and a similar situation has been shown in the South Yellow Sea, where a positive correlation between surface pCO2 and Chl-a was found in a late spring study of the South Yellow Sea [45]. The reason for this distribution might be that the inputs of terrestrial sources bring a large concentration of nutrients, which promotes the growth and reproduction of phytoplankton in the nearshore sea. In addition, the inputs of sewage and mariculture bring large amounts of easily degradable organic matter, which intensifies the aerobic respiration of phytoplankton and bottom sediments in the bay and causes the surface seawater to have a higher pCO2 value through the vertical mixing process of seawater [46]. The nutrients were found to be significantly negatively correlated with pH, reflecting that pH and nutrients are influenced by a combination of land-based inputs and bioavailability. This is consistent with the results of a study on the characteristics of the seawater carbonate species in the Yellow Sea in summer. This is mainly due to the fact that the organic particles formed by the growth of surface algae settle to the bottom and then remineralization occurs under the action of bottom microorganisms. Organic compounds are reconverted to inorganic compounds, which consume dissolved oxygen in the water and release large amounts of CO2. Overall, the pH in the surface seawater of Bohai Bay was shown to be influenced by biological photosynthesis.
The pH in the bottom layer was found to have significant positive correlations with S and DO. Because Bohai Bay is shallow, the plants in the bottom layer also carry out photosynthesis and biological actions. These actions also influence the related parameters. In contrast with the pH, pCO2 has significant negative correlations with S and DO. The river brings fresh water into the sea and mixes with seawater. As the fresh salty water mixes, the salinity increases and pCO2 decreases. The correlation between pCO2 and DO indicates a joint influence of biological photosynthesis and respiration. pH was found to have significant negative correlations with the nutrients , and pCO2 was found to have significant positive correlations with them, which is consistent with the surface correlation results presented above.
The pH of transect A was found to be significantly and positively correlated with T, DO and Chl-a and negatively correlated with S. The reason for this may be that low-salinity seawater is influenced by the Tuhai River with its high carbonate species and high pH and thus affects the area along transect A. In addition, the pH was also found to be correlated with and .
The pH and pCO2 in transect B were only correlated with DO, showing significant positive and negative correlations, respectively. The salinity was found to have a significant negative correlation with DIC, which is consistent with the conclusion of a previous study that DIC is negatively correlated with salinity based on a study of the Yellow Sea conducted in April 2006 [47]. Nutrients were not significantly correlated with the carbonate species. The above analysis showed that phytoplankton photosynthesis inevitably affects the spatial distribution patterns of the components of pH, Alk and carbonate species to different degrees, especially for components with low concentrations such as DIC. Overall, the carbonate species of Bohai Bay were found to be most closely related to S, DO and nutrients, indicating that river inputs and biological processes have the most significant influences on the carbonate species in Bohai Bay.
4.3. The Influence of River Inputs on Carbonate Species of Bohai Bay
The influence of river inputs on carbonate species is mainly concentrated on the junction of the river and the ocean, where the variable physical and biogeochemical processes make the biogeochemical cycling of the carbonate species in the estuary a far more complex process than that in deep oceans [48]. Taking the Tuhai and Majia Rivers as examples, the influence of river inputs on the carbonate species in transects A and B of Bohai Bay is discussed below.
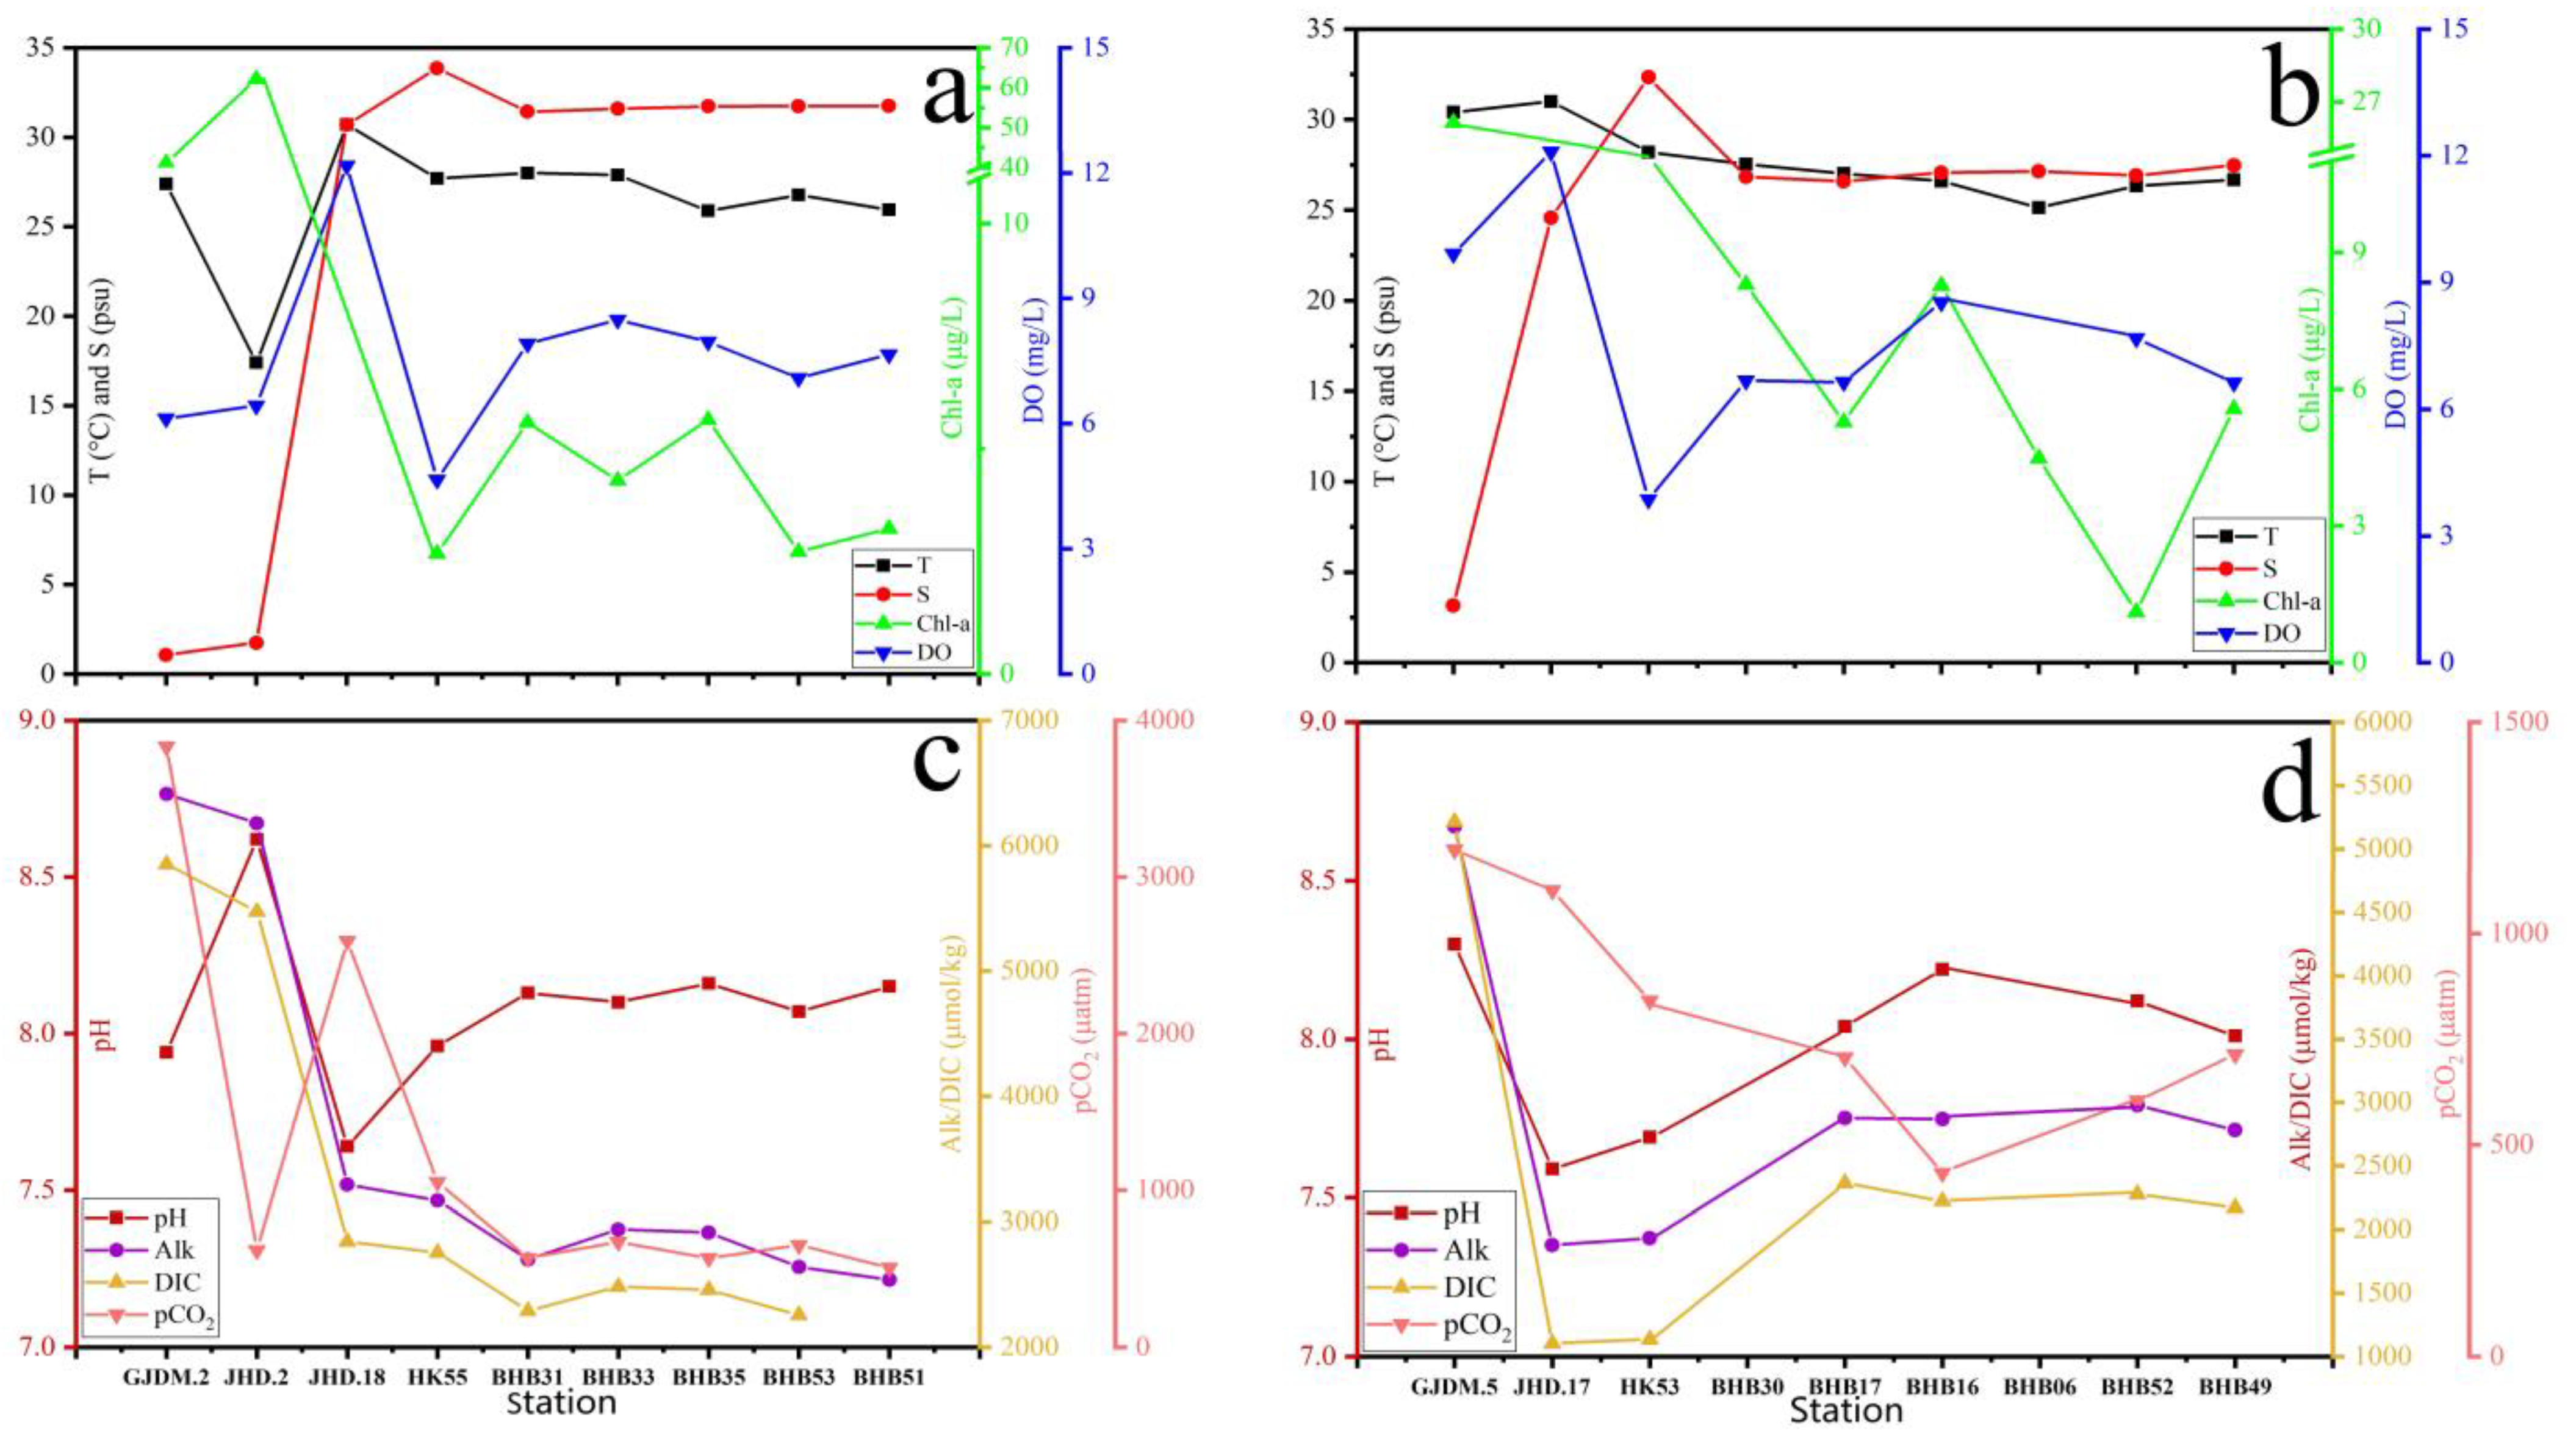
Connecting the stations in Tuhai River with the surface stations (Figure 10a,c) of transect A, the distributions of Alk and DIC always remained the same, gradually decreasing from Tuhai River to inner Bohai Bay. Because the photosynthesis of plankton converts inorganic carbon to organic carbon and absorbs CO2, which decreases the pCO2 and lowers the concentration of DIC and further changes the carbonate species equilibrium, the pH was shown to have an opposite trend to pCO2. Due to the photosynthesis of algae and absorption of CO2, the pH rises, which is in line with the law of the carbonate species equilibrium: the higher the pH value, the less acidic the water and the lower the pCO2. The pCO2 and temperature always maintained relatively consistent trends from the upstream part of the river to the bay. This is because the temperature changes the solubility of CO2. pH, DO and Chl-a maintained consistent trends from HK55 at the estuary to the inner bay due to the biological action of phytoplankton and photosynthesis, the high nutrient concentrations (the average concentration of nutrients represented by nitrate in the river was 8.56 µmol/L, 4.39 µmol/L higher than the average concentration of 4.17 µmol/L in the sea), together with large amounts of organic matter (average DOC content of 6.54 mg/L) brought by river inputs.
Connecting the stations in the Majia River with the surface stations (Figure 10b,d) in transect B, the figures show that the Alk and DIC trends remained consistent from the Majia River to inner Bohai Bay: firstly decreasing and then increasing. The Majia River flows through large agricultural land and farming areas which, coupled with the high carbonate content, results in loess accumulation. Furthermore, the upstream erosion effect caused by summer precipitation accumulates with the water flow, resulting in mechanical erosion in the upstream part of the river. Both factors lead to high Alk and DIC concentrations in the upstream area of the river. Carbonate species were found to be comparatively low in the downstream area and estuary where CO2 is consumed by biological photosynthesis. The distributions of carbonate species in the corresponding rivers and the parameters in the two transects demonstrated the terrestrial inputs from the rivers, and the higher primary productivity in the coastal area was found to significantly influence Bohai Bay.
5. Conclusions
In this paper, the distributions of four carbonate species in Bohai Bay, namely pH, Alk, DIC and pCO2, and the influence mechanism of the river inputs on them were studied. The main conclusions are as follows: (1) The distribution trends of Alk and DIC were basically the same in the surface and bottom layers, with an overall gradual increase from northwest to southeast of the bay, while pCO2 gradually decreased from northwest to southeast. The CO2 emissions from Bohai Bay during the study period were about 97.68 t. Overall, Bohai Bay was a source of CO2 in summer 2020. (2) Bio-chemical parameters, such as Chl-a, DO and nutrients had significant correlations with the carbonate species. High nutrient inputs from rivers and large amounts of DO promote the photosynthesis and the primary production, meanwhile consuming CO2. (3) The semi-enclosed hydrodynamic property in Bohai Bay, together with the influence of human activities, including the large number of oil platforms and aquaculture areas, have led to high nutrient concentrations and high turbidity in the Bohai Bay and further affected the balance of the carbonate species in Bohai Bay. Further analysis can be conducted to study the specific effects of natural factors, such as sea ice in winter on the carbonate species in Bohai Bay and to compare these conditions with the conditions in summer.
Author Contributions
Conceptualization, J.S.; X.W.; Data curation X.W.; X.Y.; Formal analysis, X.W.; X.Y.; Funding acquisition, J.S.; Investigation, X.Y.; Resources, J.S.; Supervision, J.S.; Writing—original draft, X.Y.; Writing—review and editing, J.S.; X.W. All authors have read and agreed to the published version of the manuscript.
Funding
This research was financially supported by the National Key Research and Development Project of China (2019YFC1407800), the National Nature Science Foundation of China grants (41876134), the Changjiang Scholar Program of the Chinese Ministry of Education (T2014253) to Jun Sun, and the State Key Laboratory of Biogeology and Environmental Geology, China University of Geosciences (No. GKZ21Y645 and GKZ22Y656).
Institutional Review Board Statement
Not applicable.
Informed Consent Statement
Not applicable.
Data Availability Statement
All data are available from the authors upon request.
Acknowledgments
The authors would like to thank Guicheng Zhang, Shan Jian, Dai Jia, Wenzhe Xu from Tianjin University of Science and Technology for sample collection works; Xinze Shuwang, Danyang Li, Guodong Zhang, Yujian Wen, Zhaoguang Li and Ziming Wang for sample processing and assay works.
Conflicts of Interest
The authors declare no conflict of interest.
References
- Bauer, J.E.; Cai, W.J.; Raymond, P.A.; Bianchi, T.S.; Hopkinson, C.S.; Regnier, P.A. The changing carbon cycle of the coastal ocean. Nature 2013, 504, 61–70. [Google Scholar] [CrossRef] [PubMed]
- Kleypas, J.A.; Buddemeier, R.W.; Archer, D.; Gattuso, J.P.; Langdon, C.; Opdyke, B.N. Geochemical consequences of increased atmospheric carbon dioxide on coral reefs. Science 1999, 284, 118–120. [Google Scholar] [CrossRef] [PubMed]
- Cai, W.; Hu, X.; Huang, W.; Murrell, M.C.; Lehrter, J.C.; Lohrenz, S.E.; Gong, G.C. Acidification of subsurface coastal waters enhanced by eutrophication. Nat. Geosci. 2011, 4, 766–770. [Google Scholar] [CrossRef]
- Salisbury, J.; Green, M.; Hunt, C.; Campbell, J. Coastal acidification by rivers: A threat to shellfish? Eos. Trans. Am. Geophys. Union 2008, 89, 513. [Google Scholar] [CrossRef] [Green Version]
- Chen, C.T.A.; Borges, A.V. Reconciling opposing views on carbon cycling in the coastal ocean: Continental shelves as sinks and near-shore ecosystems as sources of atmospheric CO2. Deep Sea Res. Part II Top. Stud. Oceanogr. 2009, 56, 578–590. [Google Scholar] [CrossRef] [Green Version]
- Shim, J.; Kim, D.; Kang, Y.C.; Lee, J.H.; Jang, S.T.; Kim, C.H. Seasonal variations in pCO2 and its controlling factors in surface seawater of the northern East China Sea. Cont. Shelf Res. 2007, 27, 2623–2636. [Google Scholar] [CrossRef]
- Du, R.; Liu, G.; Yang, S.; Zhou, Y.; Zhang, B. Modern sedimentation and sedimentation process in Bohai Bay. Mar. Geol. Quat. Geol. 1990, 10, 15–22. [Google Scholar]
- Jia, H.; Shen, Y.; Su, M.; Yu, C. Numerical simulation of hydrodynamic and water quality effects of shoreline changes in Bohai Bay. Front. Earth Sci. 2018, 12, 625–639. [Google Scholar] [CrossRef]
- Zhou, R.; Qin, X.; Peng, S.; Shi, H.; Deng, S. Macroinvertebrate investigation and their relation to environmental factors in Bohai Bay. Acta Ecol. Sin. 2014, 34, 50–58. [Google Scholar]
- Peng, S. The nutrient, total petroleum hydrocarbon and heavy metal contents in the seawater of Bohai Bay, China: Temporal–spatial variations, sources, pollution statuses, and ecological risks. Mar. Pollut. Bull. 2015, 95, 445–451. [Google Scholar] [CrossRef]
- Peng, S.; Qin, X.; Shi, H.; Zhou, R.; Dai, M.; Ding, D. Distribution and controlling factors of phytoplankton assemblages in a semi-enclosed bay during spring and summer. Mar. Pollut. Bull. 2012, 64, 941–948. [Google Scholar] [CrossRef]
- Liu, X.; Liu, D.; Wang, Y.; Shi, Y.; Wang, Y.; Sun, X. Temporal and spatial variations and impact factors of nutrients in Bohai Bay, China. Mar. Pollut. Bull. 2019, 140, 549–562. [Google Scholar] [CrossRef] [PubMed]
- Hu, G.; Zhang, Q. Seasonal variations in macrobenthic taxonomic diversity and the application of taxonomic distinctness indices in Bohai Bay, northern China. Ecol. Indic. 2016, 71, 181–190. [Google Scholar] [CrossRef]
- Xie, L.; Xu, H.; Xin, M.; Wang, B.; Tu, J.; Wei, Q.; Sun, X. Regime shifts in trophic status and regional nutrient criteria for the Bohai Bay, China. Mar. Pollut. Bull. 2021, 170, 112674. [Google Scholar] [CrossRef] [PubMed]
- Sun, B.; Zuo, S.; Xie, H.; Li, H.; Yang, Z. Analysis of impact effects and changes of the coastline in the Bohai Bay during the past 40 years. J. East China Norm. Univ. 2017, 4, 139–148. [Google Scholar]
- Lu, Y.; Ji, R.; Zuo, L. Morphodynamic responses to the deep water harbor development in the Caofeidian sea area, China’s Bohai Bay. Coast. Eng. 2009, 56, 831–843. [Google Scholar] [CrossRef]
- Yao, H.; Hu, X. Responses of carbonate system and CO2 flux to extended drought and intense flooding in a semiarid subtropical estuary. Limnol. Oceanogr. 2017, 62, S112–S130. [Google Scholar] [CrossRef] [Green Version]
- Monaco, C.L.; Metzl, N.; Fin, J.; Mignon, C.; Cuet, P.; Douville, É.; Tribollet, A. Distribution and long-term change of the sea surface carbonate system in the Mozambique Channel (1963–2019). Deep. Sea Res. Part II Top. Stud. Oceanogr. 2021, 186, 104936. [Google Scholar]
- Brodeur, J.R.; Chen, B.; Su, J.; Xu, Y.; Hussain, N.; Scaboo, K.M.; Cai, W.J. Chesapeake Bay inorganic carbon: Spatial distribution and seasonal variability. Front. Mar. Sci. 2019, 6, 99. [Google Scholar] [CrossRef] [Green Version]
- Zhang, L.; Zhang, Y. The Distribution of Partial Pressure of CO2 in the Bohai Sea in summer. Period. Ocean Univ. China 2008, 38, 635–639. [Google Scholar] [CrossRef]
- Zhang, L.; Xue, L.; Song, M.; Jiang, C. Distribution of the surface partial pressure of CO2 in the southern Yellow Sea and its controls. Cont. Shelf Res. 2010, 30, 293–304. [Google Scholar] [CrossRef]
- Qu, B.; Song, J.; Yuan, H.; Li, X.; Li, N. Air-sea CO2 exchange process in the southern Yellow Sea in April of 2011, and June, July, October of 2012. Cont. Shelf Res. 2014, 80, 8–19. [Google Scholar] [CrossRef]
- Qu, B.; Song, J.; Yuan, H.; Li, X.; Li, N.; Duan, L.; Lu, X. Summer carbonate chemistry dynamics in the Southern Yellow Sea and the East China Sea: Regional variations and controls. Cont. Shelf Res. 2015, 111, 250–261. [Google Scholar] [CrossRef]
- Zhai, W.; Zheng, N.; Huo, C.; Xu, Y.; Zhao, H.; Li, Y.; Xu, X. Subsurface pH and carbonate saturation state of aragonite on the Chinese side of the North Yellow Sea: Seasonal variations and controls. Biogeosciences 2014, 11, 1103–1123. [Google Scholar] [CrossRef]
- Zhai, W.; Zhao, H.; Zheng, N.; Xu, Y. Coastal acidification in summer bottom oxygen-depleted waters in north western-northern Bohai Sea from June to August in 2011. Chin. Sci. Bull. 2012, 57, 1062–1068. [Google Scholar] [CrossRef] [Green Version]
- Zhu, H. Research of the Sedimentary Characteristics in Caofeidian Inshore. Master’s Thesis, Ludong University, Yantai, China, 2016. [Google Scholar]
- Dickson, A.G. Determination of Dissolved Oxygen in Sea Water by Winkler Titration; WHP Operations and Methods WHP Office Report Woods Hole Oceanographic Institution: Falmouth, MA, USA, 1994; pp. 1–14. [Google Scholar]
- Millero, F. Chemical Oceanography, 3rd ed.; CRC Press: Abingdon, UK, 2013. [Google Scholar]
- Mehrbach, C.; Culberson, C.H.; Hawley, J.E.; Pytkowicx, R.M. Measurement of the apparent dissociation constants of carbonic acid in seawater at atmospheric pressure 1. Limnol. Oceanogr. 1973, 18, 897–907. [Google Scholar] [CrossRef]
- Dickson, P.R.; Ginter, J.L. Market segmentation, product differentiation, and marketing strategy. J. Mark. 1987, 51, 1–10. [Google Scholar] [CrossRef]
- Dickson, A.G. Thermodynamics of the dissociation of boric acid in synthetic seawater from 273.15 to 318.15 K. Deep-Sea Res. 1990, 37, 755–766. [Google Scholar] [CrossRef]
- Liss, P.S.; Merlivat, L. Air-sea gas exchange rates: Introduction and synthesis. In The Role of Air-Sea Exchange in Geochemical Cycling; Springer: Dordrecht, The Netherlands, 1986; pp. 113–127. [Google Scholar]
- Peng, T.H.; Takahashi, T. Carbon Dioxide in the Ocean; Under Contract PE-ACO5-840R31400; April, Publication No. 3311; Environmental Sciences Division, ORNL: Oak Ridge, TN, USA, 1989. [Google Scholar]
- Tans, P.P.; Fung, I.Y.; Takahashi, T. Observational constraints on the global atmospheric CO2 budget. Science 1990, 247, 1431–1438.10. [Google Scholar] [CrossRef]
- Wanninkhof, R.H. Relationship between gas exchange and wind speed over the ocean. J. Geophys. Res. 1992, 97, 7373–7381. [Google Scholar] [CrossRef]
- Wanninkhof, R.H. Relationship between wind speed and gas exchange over the ocean revisited. Limnol. Oceanogr. Methods 2014, 12, 351–362. [Google Scholar] [CrossRef]
- Ingrosso, G.; Giani, M.; Comici, C.; Kralj, M.; Piacentino, S.; De Vittor, C.; Del Negro, P. Drivers of the carbonate system seasonal variations in a Mediterranean gulf. Estuarine Coast. Shelf Sci. 2016, 168, 58–70. [Google Scholar] [CrossRef]
- Abril, G.; Etcheber, H.; Delille, B.; Borges, M.F.A.V. Carbonate dissolution in the turbid and eutrophic Loire estuary. Mar. Ecol. Prog. Ser. 2003, 259, 129–138. [Google Scholar] [CrossRef]
- Liu, Z.; Zhang, L.; Cai, W.; Wang, L.; Xue, M.; Zhang, X. Removal of dissolved inorganic carbon in the Yellow River Estuary. Limnol. Oceanogr. 2014, 59, 413–426. [Google Scholar] [CrossRef]
- Wang, J.; Wang, B.; Li, D.; Xu, Z.; Miao, Y.; Yang, Z.; Jin, H.; Chen, J. Characteristics of carbonate system in the Hangzhou Bay: Under the regulation of air-sea exchange and respiration. Haiyang Xuebao 2021, 43, 21–32. [Google Scholar] [CrossRef]
- Deng, X.; Hu, Y.; Liu, C.; Yang, G.; Lu, X.; Zhang, H. Distributions and seasonal variations of carbonate system in the Jiaozhou Bay, China. Oceanol. Limnol. Sin. 2016, 47, 234–244. [Google Scholar]
- Zheng, N. Distribution and Influence Factors of Inorganic Carbon in Main Rivers around Bohai and Bohai Sea in Summer. Master’s Thesis, Dalian Maritime University, Dalian, China, 2018. [Google Scholar]
- Fu, M.; Wang, Z.; Li, Y.; Li, R.; Sun, P.; Wei, X.; Guo, J. Phytoplankton biomass size structure and its regulation in the Southern Yellow Sea (China): Seasonal variability. Cont. Shelf Res. 2009, 29, 2178–2194. [Google Scholar] [CrossRef]
- Gong, X. Distribution and Influencing Factors of the Surface pCO2 Waters in Jiaozhou and Sanggou Bay during Spring. Master’s Thesis, Ocean University of China, Qingdao, China, 2014. [Google Scholar]
- Zhang, L.; Xue, M.; Liu, Q. Distribution and seasonal variation in the partial pressure of CO2 during autumn and winter in Jiaozhou Bay, a region of high urbanization. Mar. Poll. Bull. 2012, 64, 56–65. [Google Scholar] [CrossRef]
- Gong, X.; Han, P.; Zhang, L.; Xue, M.; Yang, X.; Wang, W. Distribution and controlling factors of sea Surface partial pressure of CO2 in Jiaozhou Bay during April. Period. Ocean Univ. China 2015, 45, 95–102. [Google Scholar]
- Zhang, Z.; Zhang, C.; Liu, L.; Gong, H.; Huang, H.; Liu, C. Multilayer-distribution of dissolved inorganic carbon (DIC) in surface sea water of the Yellow Sea in spring. Mar. Sci. 2008, 32, 36–43. [Google Scholar]
- Li, N.; Li, X.; Song, J. Key biogeochemistry processes of marine carbon cycle. Mar. Environ. Sci. 2005, 24, 75–80. [Google Scholar]
Figure 1.
Location map of sampling stations of Bohai Bay and relevant rivers flowing into the bay in summer 2020. The inserted regional map indicates the location of the Bohai Bay in northeastern China. The red rectangles represent the transects we investigated. Scale on the upper left map is 1:600,000,000.

Figure 2.
The Characterization of the ocean currents in the study area [26]. Note: The map is a repaint. The scale is 1:2,200,000. This image was created with Ocean Data View (ODV) software, version 5.3.0 (Alfred Wegener Institute, Bremerhaven, Germany).
Figure 2.
The Characterization of the ocean currents in the study area [26]. Note: The map is a repaint. The scale is 1:2,200,000. This image was created with Ocean Data View (ODV) software, version 5.3.0 (Alfred Wegener Institute, Bremerhaven, Germany).

Figure 3.
Horizontal distributions of pH in the surface seawater (a) and bottom seawater (b) in Bohai Bay in summer 2020. The scale is 1:3,700,000. This image was created by ODV software, version 5.3.0(Alfred Wegener Institute, Bremerhaven, Germany).
Figure 3.
Horizontal distributions of pH in the surface seawater (a) and bottom seawater (b) in Bohai Bay in summer 2020. The scale is 1:3,700,000. This image was created by ODV software, version 5.3.0(Alfred Wegener Institute, Bremerhaven, Germany).

Figure 4.
Horizontal distributions of Alk (µmol/kg) in the surface seawater (a) and bottom seawater (b) in Bohai Bay in summer 2020. The scale is 1:3,700,000. This image was created with ODV software, version 5.3.0 (Alfred Wegener Institute, Bremerhaven, Germany).
Figure 4.
Horizontal distributions of Alk (µmol/kg) in the surface seawater (a) and bottom seawater (b) in Bohai Bay in summer 2020. The scale is 1:3,700,000. This image was created with ODV software, version 5.3.0 (Alfred Wegener Institute, Bremerhaven, Germany).

Figure 5.
Horizontal distributions of DIC (µmol/kg) in the surface seawater (a) and bottom seawater (b) in Bohai Bay in summer 2020. The scale is 1:3,700,000. This image was created with ODV software, version 5.3.0 (Alfred Wegener Institute, Bremerhaven, Germany).
Figure 5.
Horizontal distributions of DIC (µmol/kg) in the surface seawater (a) and bottom seawater (b) in Bohai Bay in summer 2020. The scale is 1:3,700,000. This image was created with ODV software, version 5.3.0 (Alfred Wegener Institute, Bremerhaven, Germany).

Figure 6.
Horizontal distribution of pCO2 (µatm) in the surface seawater (a) and bottom seawater (b) in Bohai Bay in summer 2020. The scale is 1:3,700,000. This image was created with ODV software, version 5.3.0 (Alfred Wegener Institute, Bremerhaven, Germany).
Figure 6.
Horizontal distribution of pCO2 (µatm) in the surface seawater (a) and bottom seawater (b) in Bohai Bay in summer 2020. The scale is 1:3,700,000. This image was created with ODV software, version 5.3.0 (Alfred Wegener Institute, Bremerhaven, Germany).

Figure 7.
CO2 air–sea flux (mmol/(m2·a)) distributions of surface seawater in Bohai Bay in summer 2020. The scale is 1:3,700,000. This image was created with ODV software, version 5.3.0 (Alfred Wegener Institute, Bremerhaven, Germany).
Figure 7.
CO2 air–sea flux (mmol/(m2·a)) distributions of surface seawater in Bohai Bay in summer 2020. The scale is 1:3,700,000. This image was created with ODV software, version 5.3.0 (Alfred Wegener Institute, Bremerhaven, Germany).

Figure 8.
Vertical distributions of pH (a), Alk (b), DIC (c) and pCO2 (d) in transect A of Bohai Bay in summer 2020. This image was created with ODV software, version 5.3.0 (Alfred Wegener Institute, Bremerhaven, Germany).
Figure 8.
Vertical distributions of pH (a), Alk (b), DIC (c) and pCO2 (d) in transect A of Bohai Bay in summer 2020. This image was created with ODV software, version 5.3.0 (Alfred Wegener Institute, Bremerhaven, Germany).

Figure 9.
Vertical distributions of pH (a), Alk (b), DIC (c) and pCO2 (d) in transect B of Bohai Bay in summer 2020. This image was created with ODV software, version 5.3.0 (Alfred Wegener Institute, Bremerhaven, Germany).
Figure 9.
Vertical distributions of pH (a), Alk (b), DIC (c) and pCO2 (d) in transect B of Bohai Bay in summer 2020. This image was created with ODV software, version 5.3.0 (Alfred Wegener Institute, Bremerhaven, Germany).

Figure 10.
Related parameters in transect A (a) and the distribution of the surface carbonate species (c) in Bohai Bay under the input of the Tuhai River. Related parameters in transect B (b) and the distribution of the surface carbonate species (d) in Bohai Bay under the input of the Majia River in summer 2020.


Table 1.
Description of sampling stations and CO2 air–sea fluxes in Bohai Bay in summer.
| Station | Longitude | Latitude | Bot. Depth (m) | Temperature (°C) | Salinity (psu *) | Wind Speed (m/s) | CO2 Flux mmol/m2 a |
|---|---|---|---|---|---|---|---|
| BHB01 | 117.98 | 39.13 | 5 | 27.42 | 32.112 | 3.96 | 6.53 |
| BHB02 | 118.12 | 39.12 | 5 | 27.09 | 31.849 | 5.74 | 6.80 |
| BHB03 | 118.09 | 39.05 | 9 | 26.86 | 31.303 | 5.62 | 6.03 |
| BHB04 | 118.33 | 38.96 | 10 | 25.73 | 31.658 | 2.21 | 1.02 |
| BHB07 | 118.31 | 38.86 | 25 | 25.17 | 31.778 | 2.63 | 0.60 |
| BHB08 | 118.17 | 38.93 | 15 | 25.57 | 31.678 | 4.27 | 2.69 |
| BHB09 | 118.05 | 38.98 | 14 | 26.55 | 31.409 | 5.07 | 4.81 |
| BHB10 | 117.93 | 39.03 | 9 | 27.30 | 31.254 | 5.75 | 3.83 |
| BHB13 | 117.99 | 38.87 | 13 | 27.64 | 31.232 | 4.44 | 3.96 |
| BHB16 | 118.32 | 38.67 | 19 | 26.60 | 31.751 | 2.26 | 0.14 |
| BHB17 | 118.24 | 38.45 | 11 | 27.01 | 31.316 | 3.94 | 3.49 |
| BHB18 | 118.10 | 38.59 | 13 | 26.19 | 31.345 | 4.87 | 5.82 |
| BHB20 | 117.88 | 38.75 | 10 | 27.04 | 31.201 | 3.08 | 2.83 |
| BHB21 | 117.79 | 38.82 | 10 | 27.43 | 31.258 | 4.31 | 5.86 |
| BHB25 | 117.82 | 38.45 | 5 | 27.40 | 31.233 | 2.36 | 2.64 |
| BHB26 | 117.88 | 38.51 | 7 | 27.44 | 31.465 | 2.24 | 0.84 |
| BHB27 | 117.96 | 38.40 | 12 | 27.28 | 31.458 | 5.14 | 5.77 |
| BHB29 | 118.04 | 38.50 | 9 | 27.27 | 31.324 | 5.12 | 5.23 |
| BHB31 | 118.32 | 38.24 | 7 | 28.00 | 31.424 | 4.36 | 2.44 |
| BHB32 | 118.48 | 38.19 | 4 | 28.96 | 31.408 | 5.13 | 3.44 |
| BHB33 | 118.41 | 38.34 | 13 | 27.89 | 31.595 | 5.17 | 5.40 |
| BHB34 | 118.62 | 38.25 | 10 | 27.53 | 31.394 | 7.80 | 10.97 |
| BHB36 | 118.74 | 38.36 | 17 | 25.64 | 31.698 | 3.32 | 2.18 |
| BHB37 | 118.92 | 38.23 | 15 | 24.78 | 31.524 | 3.83 | 2.87 |
| BHB38 | 119.13 | 37.98 | 11 | 24.79 | 29.628 | 3.16 | 1.83 |
| BHB40 | 119.14 | 38.42 | 23 | 25.69 | 31.918 | 1.66 | 0.13 |
| BHB41 | 118.91 | 38.53 | 23 | 26.21 | 31.911 | 2.78 | 0.52 |
| BHB42 | 119.14 | 38.75 | 27 | 26.71 | 31.696 | 5.44 | 1.38 |
| BHB43 | 119.15 | 39.07 | 21 | 26.82 | 30.933 | 3.27 | 1.19 |
| BHB45 | 118.98 | 39.14 | 10 | 26.71 | 32.053 | 3.32 | 1.14 |
| BHB46 | 118.87 | 39.09 | 6 | 27.44 | 32.141 | 5.99 | 2.87 |
| BHB48 | 118.66 | 39.09 | 14 | 28.23 | 32.152 | 3.80 | 4.49 |
| BHB49 | 118.74 | 38.99 | 14 | 26.68 | 32.116 | 4.85 | 12.41 |
| BHB50 | 118.87 | 38.88 | 24 | 26.30 | 31.546 | 3.35 | 2.08 |
| BHB51 | 118.83 | 38.74 | 26 | 25.95 | 31.748 | 3.78 | 1.19 |
| HH-2 | 117.74 | 38.97 | 16 | 28.49 | 23.436 | 1.78 | 3.43 |
| HH-3 | 117.80 | 38.96 | 18 | 28.92 | 25.603 | 4.54 | 6.31 |
| HH-4 | 117.85 | 38.94 | 18 | 28.56 | 29.260 | 4.19 | 1.31 |
| JYC-1 | 117.74 | 39.11 | 3.5 | 28.27 | 28.520 | 3.28 | 8.13 |
| JYC-2 | 117.75 | 39.09 | 7 | 28.42 | 29.566 | 1.01 | 0.58 |
| JYC-3 | 117.77 | 39.08 | 7 | 28.72 | 29.254 | 4.60 | 7.53 |
| JYC-5 | 117.83 | 39.07 | 9 | 28.44 | 30.561 | 0.45 | 0.05 |
* psu: practical salinity unit.
Table 2.
Mean values and ranges of relevant biochemical parameters in Bohai Bay.
| Categories | DO (mg/L) | Chl-a (µg/L) | |||||
|---|---|---|---|---|---|---|---|
| Surface | 7.31 (2.87–8.96) | 9.17 (1.11–26.6) | 1.28 (0.01–7.68) | 2.81 (0.74–12) | 6.18 (0.21–18.50) | 0.29 (0.08–1.10) | 2.41 (0.17–10.04) |
| Bottom | 6.38 (1.85–8.54) | 5.35 (0.98–13.89) | 1.47 (0.08–5.53) | 2.82 (0.85–9.00) | 6.04 (0.86–15.29) | 0.24 (0.08–0.78) | 3.22 (0.11–11.88) |
Table 3.
The carbonate species in the relevant rivers flowing into the bay.
| Rivers | Station | pH | Alk (µmol/kg) | DIC (µmol/kg) | pCO2 (µatm) |
|---|---|---|---|---|---|
| Luanhe Rive | GJDM24 | 7.97 | 3670 | 3558 | 1808 |
| PTD22 | 8.39 | 3088 | 2926 | 595 | |
| JHD3 | 8.03 | 2461 | 2328 | 1230 | |
| HK07 | 7.72 | 4658 | 3548 | 2973 | |
| Jiyun river | GJDM22 | 8.30 | 3165 | 3015 | 822 |
| JHD6 | 8.89 | 4401 | 4085 | 223 | |
| JHD5 | 8.45 | 5317 | 4368 | 938 | |
| HK26 | 7.19 | 4427 | 2223 | 6770 | |
| Ziya New River | JHD16 | 8.62 | 3479 | 3194 | 360 |
| PTD31 | 8.58 | 2117 | 1911 | 258 | |
| HK20 | 8.25 | 2833 | 2755 | 806 | |
| Zhangwei New River | GJDM6 | 8.85 | 4186 | 3683 | 231 |
| PTD6 | 8.38 | 6519 | 5887 | 1291 | |
| HK54 | 7.81 | 2806 | 2457 | 1459 | |
| Majia River | GJDM5 | 8.30 | 5848 | 5216 | 1198 |
| JHD17 | 7.59 | 1231 | 1103 | 1102 | |
| HK53 | 7.69 | 1307 | 1136 | 841 | |
| Tuhai River | GJDM2 | 7.94 | 6412 | 5852 | 3831 |
| JHD2 | 8.62 | 6179 | 5474 | 620 | |
| JHD18 | 7.64 | 3294 | 2845 | 2592 | |
| HK55 | 7.96 | 3169 | 2756 | 1051 |
Table 4.
Comparison of carbonate species in six different estuaries/bays in the Northern Hemisphere.
Table 4.
Comparison of carbonate species in six different estuaries/bays in the Northern Hemisphere.
| Estuaries/Bays | pH | Alk | DIC | pCO2 (µatm) | Data Sources |
|---|---|---|---|---|---|
| Mediterranean Sea | 7.91 | 2696.2 μmol/kg | 2332.1 μmol/kg | 329 | [37] |
| Loire estuary | - | 2.1–2.65 mEq/kg | 2200–2700µmol/kg | 700–2900 | [38] |
| Yellow River Estuary (2008) | - | ~3242µmol/L | ~3178µmol/L | 400–750 | [39] |
| Hangzhou Bay (2019) | - | 1886 μmol/kg | 1805 μmol/kg | 799 | [40] |
| Jiaozhou Bay (2007) | 7.94 | 2163 µmol/kg | 2067 µmol/kg | 674 | [41] |
| Bohai Bay (2016) | 8.13 | 2370 µmol/kg | 2133 µmol/kg | 499 | [42] |
| Bohai Bay (2020) | 8.06 | 2338 µmol/kg | 2201 µmol/kg | 697 | This paper |
Note: - represents that the data do not appear in the corresponding literature.
Table 5.
Correlations of relevant hydrological and biochemical parameters with those of the carbonate species.
Table 5.
Correlations of relevant hydrological and biochemical parameters with those of the carbonate species.
| Surface | T | S | DO | Chl-a | |||||
|---|---|---|---|---|---|---|---|---|---|
| pH | −0.409 ** | 0.585 ** | 0.719** | −0.544 ** | −0.232 | −0.567 ** | −0.531 ** | −0.725** | −0.562 ** |
| Alk | −0.192 | −0.132 | −0.093 | 0.042 | −0.068 | 0.054 | 0.030 | 0.057 | 0.019 |
| DIC | −0.173 | −0.176 | −0.275 | 0.015 | −0.110 | 0.032 | 0.075 | 0.039 | 0.099 |
| pCO2 | 0.389 ** | −0.720 ** | −0.772 ** | 0.579 ** | 0.174 | 0.546 ** | 0.559 ** | 0.748 ** | 0.638 ** |
| Bottom | T | S | DO | Chl-a | |||||
| pH | −0.058 | 0.424 ** | 0.697 ** | 0.099 | −0.207 | −0.131 | −0.478 ** | −0.542 ** | −0.592 ** |
| Alk | 0.047 | −0.137 | −0.109 | −0.061 | 0.192 | −0.152 | 0.209 | 0.245 | 0.235 |
| DIC | 0.189 | −0.165 | −0.106 | −0.077 | 0.302 | −0.393 * | 0.213 | 0.088 | 0.076 |
| pCO2 | 0.171 | −0.518 ** | −0.649 ** | 0.027 | 0.234 | 0.061 | 0.550 ** | 0.565 ** | 0.649 ** |
| transect A | T | S | DO | Chl-a | |||||
| pH | 0.696 ** | −0.704 ** | 0.783 ** | 0.733 ** | 0.654 * | 0.489 | 0.658* | −0.625 | −0.476 |
| Alk | 0.274 | −0.061 | 0.267 | −0.030 | 0.101 | 0.126 | 0.254 | −0.283 | −0.231 |
| DIC | 0.195 | −0.020 | 0.116 | −0.196 | 0.132 | 0.216 | 0.253 | −0.174 | −0.345 |
| pCO2 | −0.276 | 0.448 | −0.398 | −0.583 * | −0.422 | −0.334 | −0.275 | 0.284 | 0.122 |
| transect B | T | S | DO | Chl-a | |||||
| pH | 0.238 | −0.252 | 0.750 ** | 0.483 | −0.373 | −0.388 | −0.342 | −0.232 | −0.209 |
| Alk | 0.332 | −0.518 | 0.523 | 0.070 | −0.041 | 0.033 | 0.087 | −0.009 | −0.134 |
| DIC | 0.434 | −0.693 ** | 0.046 | 0.243 | 0.541 | −0.138 | 0.340 | −0.283 | −0.066 |
| pCO2 | 0.012 | 0.032 | −0.617 * | −0.408 | 0.500 | 0.380 | 0.399 | 0.197 | 0.151 |
** At the 0.01 level (two-tailed), the correlation was significant. * At the 0.05 level (two-tailed), the correlation was significant.
Publisher’s Note: MDPI stays neutral with regard to jurisdictional claims in published maps and institutional affiliations. |
© 2022 by the authors. Licensee MDPI, Basel, Switzerland. This article is an open access article distributed under the terms and conditions of the Creative Commons Attribution (CC BY) license (https://creativecommons.org/licenses/by/4.0/).
Share and Cite
MDPI and ACS Style
Yuan, X.; Wu, X.; Sun, J. Distributions and Influencing Factors of Carbonate Species in Bohai Bay and Relevant Rivers Flowing into the Bay in Summer 2020. Water 2022, 14, 3389. https://doi.org/10.3390/w14213389
AMA Style
Yuan X, Wu X, Sun J. Distributions and Influencing Factors of Carbonate Species in Bohai Bay and Relevant Rivers Flowing into the Bay in Summer 2020. Water. 2022; 14(21):3389. https://doi.org/10.3390/w14213389
Chicago/Turabian StyleYuan, Xiaolong, Xi Wu, and Jun Sun. 2022. "Distributions and Influencing Factors of Carbonate Species in Bohai Bay and Relevant Rivers Flowing into the Bay in Summer 2020" Water 14, no. 21: 3389. https://doi.org/10.3390/w14213389
Note that from the first issue of 2016, this journal uses article numbers instead of page numbers. See further details here.