
Pollutants Source Assessment and Load Calculation in Baiyangdian Lake Using Multi-Model Statistical Analysis
by
 , and
, and
Guangwei Wang
1,2,
Cuicui Lv
3,
Congke Gu
4,
Yang Yu
2,
Zhenglun Yang
1,
Zhixiong Zhang
4 and
Changyuan Tang
1,* 1
Graduate School of Horticulture, Chiba University, 648 Matsudo, Matsudo-City 271-8510, Japan
2
Guangzhou South Surveying & Mapping Technology Co., Ltd., South Geo-Information Industrial Park, No. 39 Si Cheng Rd, Guangzhou 510640, China
3
Xiong’an Institute of Innovation, Chinese Academy of Sciences, Xiong’an 071700, China
4
Key Laboratory of Agricultural Water Resources, Hebei Laboratory of Agricultural Water-Saving, Center for Agricultural Resources Research, Institute of Genetics and Developmental Biology, Chinese Academy of Sciences, Shijiazhuang 050021, China
*
Author to whom correspondence should be addressed.
Water 2022, 14(21), 3386; https://doi.org/10.3390/w14213386
Submission received: 23 September 2022
/
Revised: 21 October 2022
/
Accepted: 21 October 2022
/
Published: 26 October 2022
(This article belongs to the Special Issue Environmental Effects of Natural Processes and Human Activities on the Water Environment in Watershed)
Abstract
:Baiyangdian lake, the largest fresh lake on the Haihe Basin in North China, has attracted wide attention on account of the distinguished ecological water bodies in Xiong’an New Area. Although remarkable achievements have been made in pollution control in Baiyangdian lake, the problem facing the overall water environment remains serious. The complex pollutant sources, drastic pollutant flux changes, and the unclear impact of the role of pollutants pose great challenges to the water quality, water environment management, and long-term restoration of the ecological environment. Here, the potential pollution sources, their contribution ratio, and the influence of the pollution load of different sources on the water quality in the priority source areas of Baiyangdian lake are discussed in detail based on collected and existing monitoring data. It is proven that the primary pollution sources of for nitrogen, phosphorus, and organic pollutants are from agricultural and rural non-point source pollution; the load contribution rates exceed 50%, of which the contribution rate to the total phosphorus load reaches 73.37%. The total load contribution of runoff to the three pollutants was small, although the contribution of soil erosion to total nitrogen was 22.95%. The contribution of point source pollution to COD was high, with a rate of 22.33%. In order to ensure the environmental quality of Baiyangdian lake, it is obligatory to strengthen the control of agricultural and rural pollution discharge and to standardize the pollution discharge of livestock and poultry breeding. This study provides a helpful support for protecting the water ecology of the national Xiong’an New Area.
1. Introduction
With the rapid development of social economy, the excessive enrichment of nutrient salts such as nitrogen, phosphorus, and organic pollutants can cause serious eutrophication problems for many large lakes [1,2]. Abundant nutrients affect the growth of algae in the water, which in turn leads to the death of fish and plankton, cyanobacterial bloom outbreaks, and biodiversity decline, causing water pollution and seriously threatening the health of aquatic ecosystems [3,4,5,6]. Therefore, it is of great significance to identify the distribution and sources of pollution in critical lake regions. However, due to the spatial extensiveness and temporal uncertainty of non-point source pollution, it is hard to obtain accurate information on pollutants in order to control and manage the aquatic environment of large lakes [7].
Baiyangdian lake, located in the middle of Haihe basin, is a typical shallow macrophytic lake in North China that was chosen as the core scope of the new-built Xiong’an New Area. Baiyangdian lake has irreplaceable ecological functions in regulating the climate of North China, replenishing surrounding groundwater, and maintaining the ecology and biodiversity of Xiong’an New Area [8]. However, the location of its slow drainage area and human activities have led to degrading environment and vulnerable ecology around Baiyangdian lake, which seriously restricts new ecological city construction and coordinated economic development [9]. It has been proven that 22 antibiotics, including eight quinolones, nine sulfonamides, and five macrolides, were present and distributed in water, sediments, and biota samples from Baiyangdian lake, which is largely due to anthropogenic activities [10]. Yang et al., (2020) found that 30 PPCPs were frequently detected in 2019, of which sulfamethoxazole, ofloxacin, anhydro-erythromycin, carbamazepine, and caffeine were appraised as the dominant PPCPs [11]. The existence of non-point source pollution led the dissolved oxygen concentration to decrease by more than 1 mg/L [12]. Yang et al., (2022) estimated the ecological thresholds for Baiyangdian lake by applying the PCLake + model, which showed that nitrogen and phosphorus loads exceeded the threshold in 2012 and that the ecological thresholds would be exceeded in 2050 with limited environmental policies on human waste [13].
Clarifying the source of pollution and the contribution ratio is the basis of water environment treatment, remediation, and management, while the pollutant sources of Baiyangdian lake are sophisticated and mutative [14]. Baiyangdian lake flows through densely populated and industrial areas, and there are more than 200 key sewage wastewater treatment plants with great impact on surface water quality, among which many sewage enterprises are distributed in Mancheng, Gaoyang and Lixian counties. For historical reasons, Baiyangdian lake has been a gathering area of upstream sewage discharge for a long time, and the water sediment has accumulated a large number of historical pollutants which have been released to the water body for a long time through the boundary of water and sediment [9]. Non-point source pollution is the main source of pollutants in the surface water of Baiyangdian lake basin [4]. The non-point source pollution in the basin is essential to calculation of the surface water pollution load input into Baiyangdian lake.
Non-point source pollution model can simulate the migration and transformation process of pollutants from the source to the water body under different scenarios and different driving forces and can predict the non-point source pollutant load and its changes [15]. According to whether the formation process of the non-point source pollution is considered in the model build, non-point source pollution models can be categorized as mechanical models and empirically-based lumped models [16,17,18]. The mechanism models, such as SWAT [16,19], AnnAGNPS [20], and SPARROW [21], use mathematical methods to simulate the migration and formation of pollutants from non-point source pollution [22]. Such models, however, require a large amount of data to verify the model adaptation in the current study area and to calibrate and validate the parameter, which restricts their promotion [23]. The lumped models are known as “black box” models. These models construct the empirical relationship between the non-point source pollution load and influencing factors through regression analysis [24]. The lumped models use multiple lumped parameters which use monitoring data on hydrology, water quality, rainfall, etc., to describe the nutrient dynamics of the basin. Although the lumped models ignore the complex process of non-point source pollution migration and transformation, their advantages lie in simple operation, low data requirements, and strong robustness [25]. Among the lumped models of non-point source pollution, the Export Coefficient Model (ECM) and Revised Universal Soil Loss Equation (RUSLE) are widely used around the world because of their clear physical meaning and concise expression. They are simple methods for quantitatively identifying non-point source pollution load at the basin scale, especially for regions with significant spatial heterogeneity [15,24]. Lumped models are thus able to illustrate the non-point source pollution load in the Baiyangdian lake basin, which is characterized by intense human activities, complex land use, and geomorphic diversity. Existing studies have mainly focused on the analysis of nitrogen and phosphorus pollution in local areas, and little research has been carried out on the estimation and source analysis of nitrogen and phosphorus loads in the entire Baiyangdian lake basin.
In order to determine the influence of human activities and the migration of pollutants caused by natural environmental changes, we use lumped model statistical analysis methods to analyze the potential pollution sources, pollution load, and the proportion of pollution contribution from Baiyangdian lake based on the collected monitoring data, aiming to quantify the impact of pollution sources and load on the water quality of Baiyangdian lake. To improves the accuracy and reliability of the overall calculation, the RUSLE and PLOAD models are used to calculate the pollution load of surface runoff and ECM is used to estimate the agricultural pollution load alone. The LOADEST model is used to calculate the pollutant flux into the lake and compare it with the non-point source load model results to verify the accuracy of the overall pollution load calculation.
2. Study Area and Methods
2.1. Study Area and Basin Division
Geohydrology: Baiyangdian Lake Basin is located in the middle of the Haihe River Basin (113°40′~116°48′ E, 38°10′~40°03′ N), and has an area of about 31200 km2. The Baiyangdian lake basin belongs to the Daqing River system and is surrounded by Yongding River on its northern part, the Taihang Mountains on its western part, the Ziya River Basin on its southern part, and Bohai Bay to the east. Baiyangdian lake is located in the catchment area of the lower reaches of the basin, with a total area of about 366 km2 (39.5 km long from east to west and 28.5 km wide from north to south, and with an average annual water resource of 41.24 million cubic meters. There are nine rivers that flow into Baiyangdian lake: Lilong River, Xiaoyi River, Tang River, Fu River, Cao River, Bao River, Qingshui River, Ping River, and Baigouyin River. The lake is known in history as the “End of the Nine Rivers”. The daily flow data of key sections of the rivers to Baiyangdian show that only Fu River and Xiaoyi River had long-term flow; Baigouyin River and Bao River are seasonal rivers which only flow into the lake during the rainy season and water supplement period, while the rest of the rivers have been cut off or diverted for more than two years.
Climate and Meteorology: Baiyangdian lake basin is situated in a continental monsoon climate zone. The average annual temperature is between 7~12 °C, the annual average rainfall is 554 mm, and the average annual evaporation is 1637 mm. The annual precipitation is unevenly distributed, with 89.7% concentrated between May and October.
Soil and vegetation: There are 14 soil types and 31 subtypes of soil in Baiyangdian Basin, mainly including brown soil, chestnut brown soil, calcareous stony soil, coarse bone soil, aquiferous soil and paddy soil, etc., as shown in Figure S1. The main land use types are paddy fields, drylands, woodlands, grasslands, orchards, and wetlands. Common woody plants in vegetation include poplars, willows, acacia, apples, pears, etc. Shrubs include purple locust, ceremony, mulberry, etc. Grasses consist mainly of poaceae, asteraceae, and legumes. Aquatic vegetation mainly includes phytoplankton and aquatic vascular plants such as algae, lotus root, reeds, and barnyard.
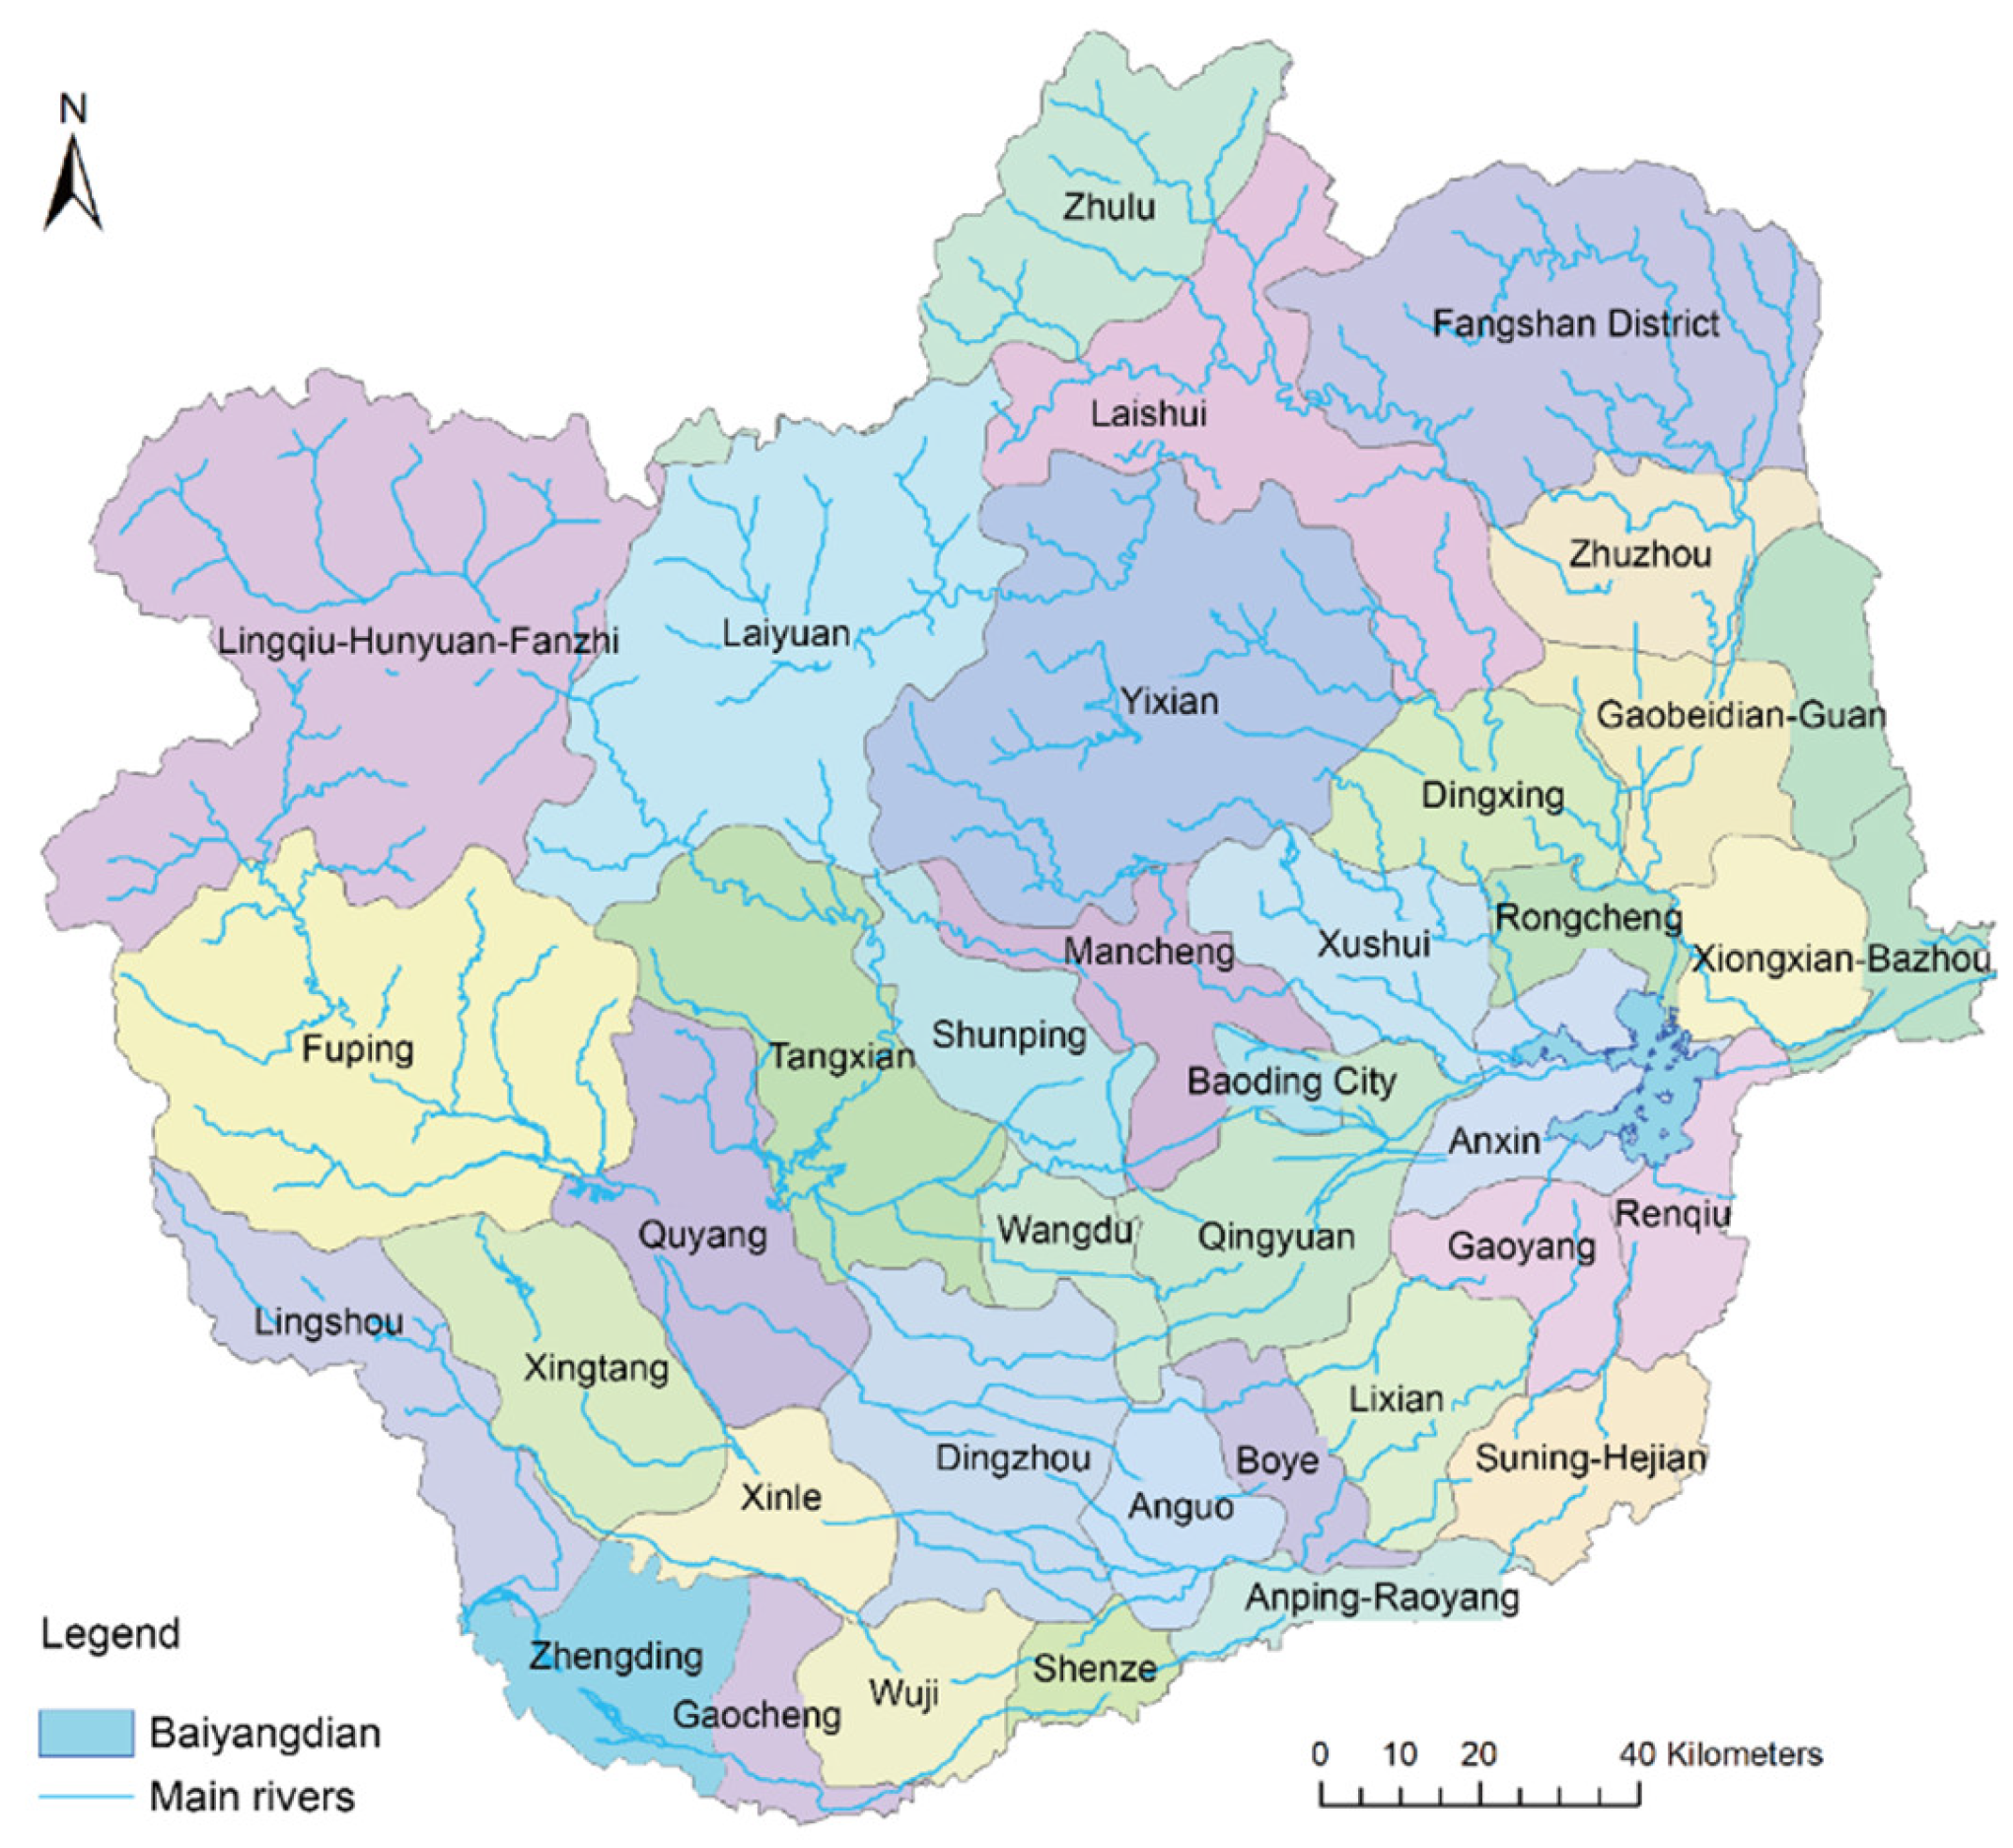
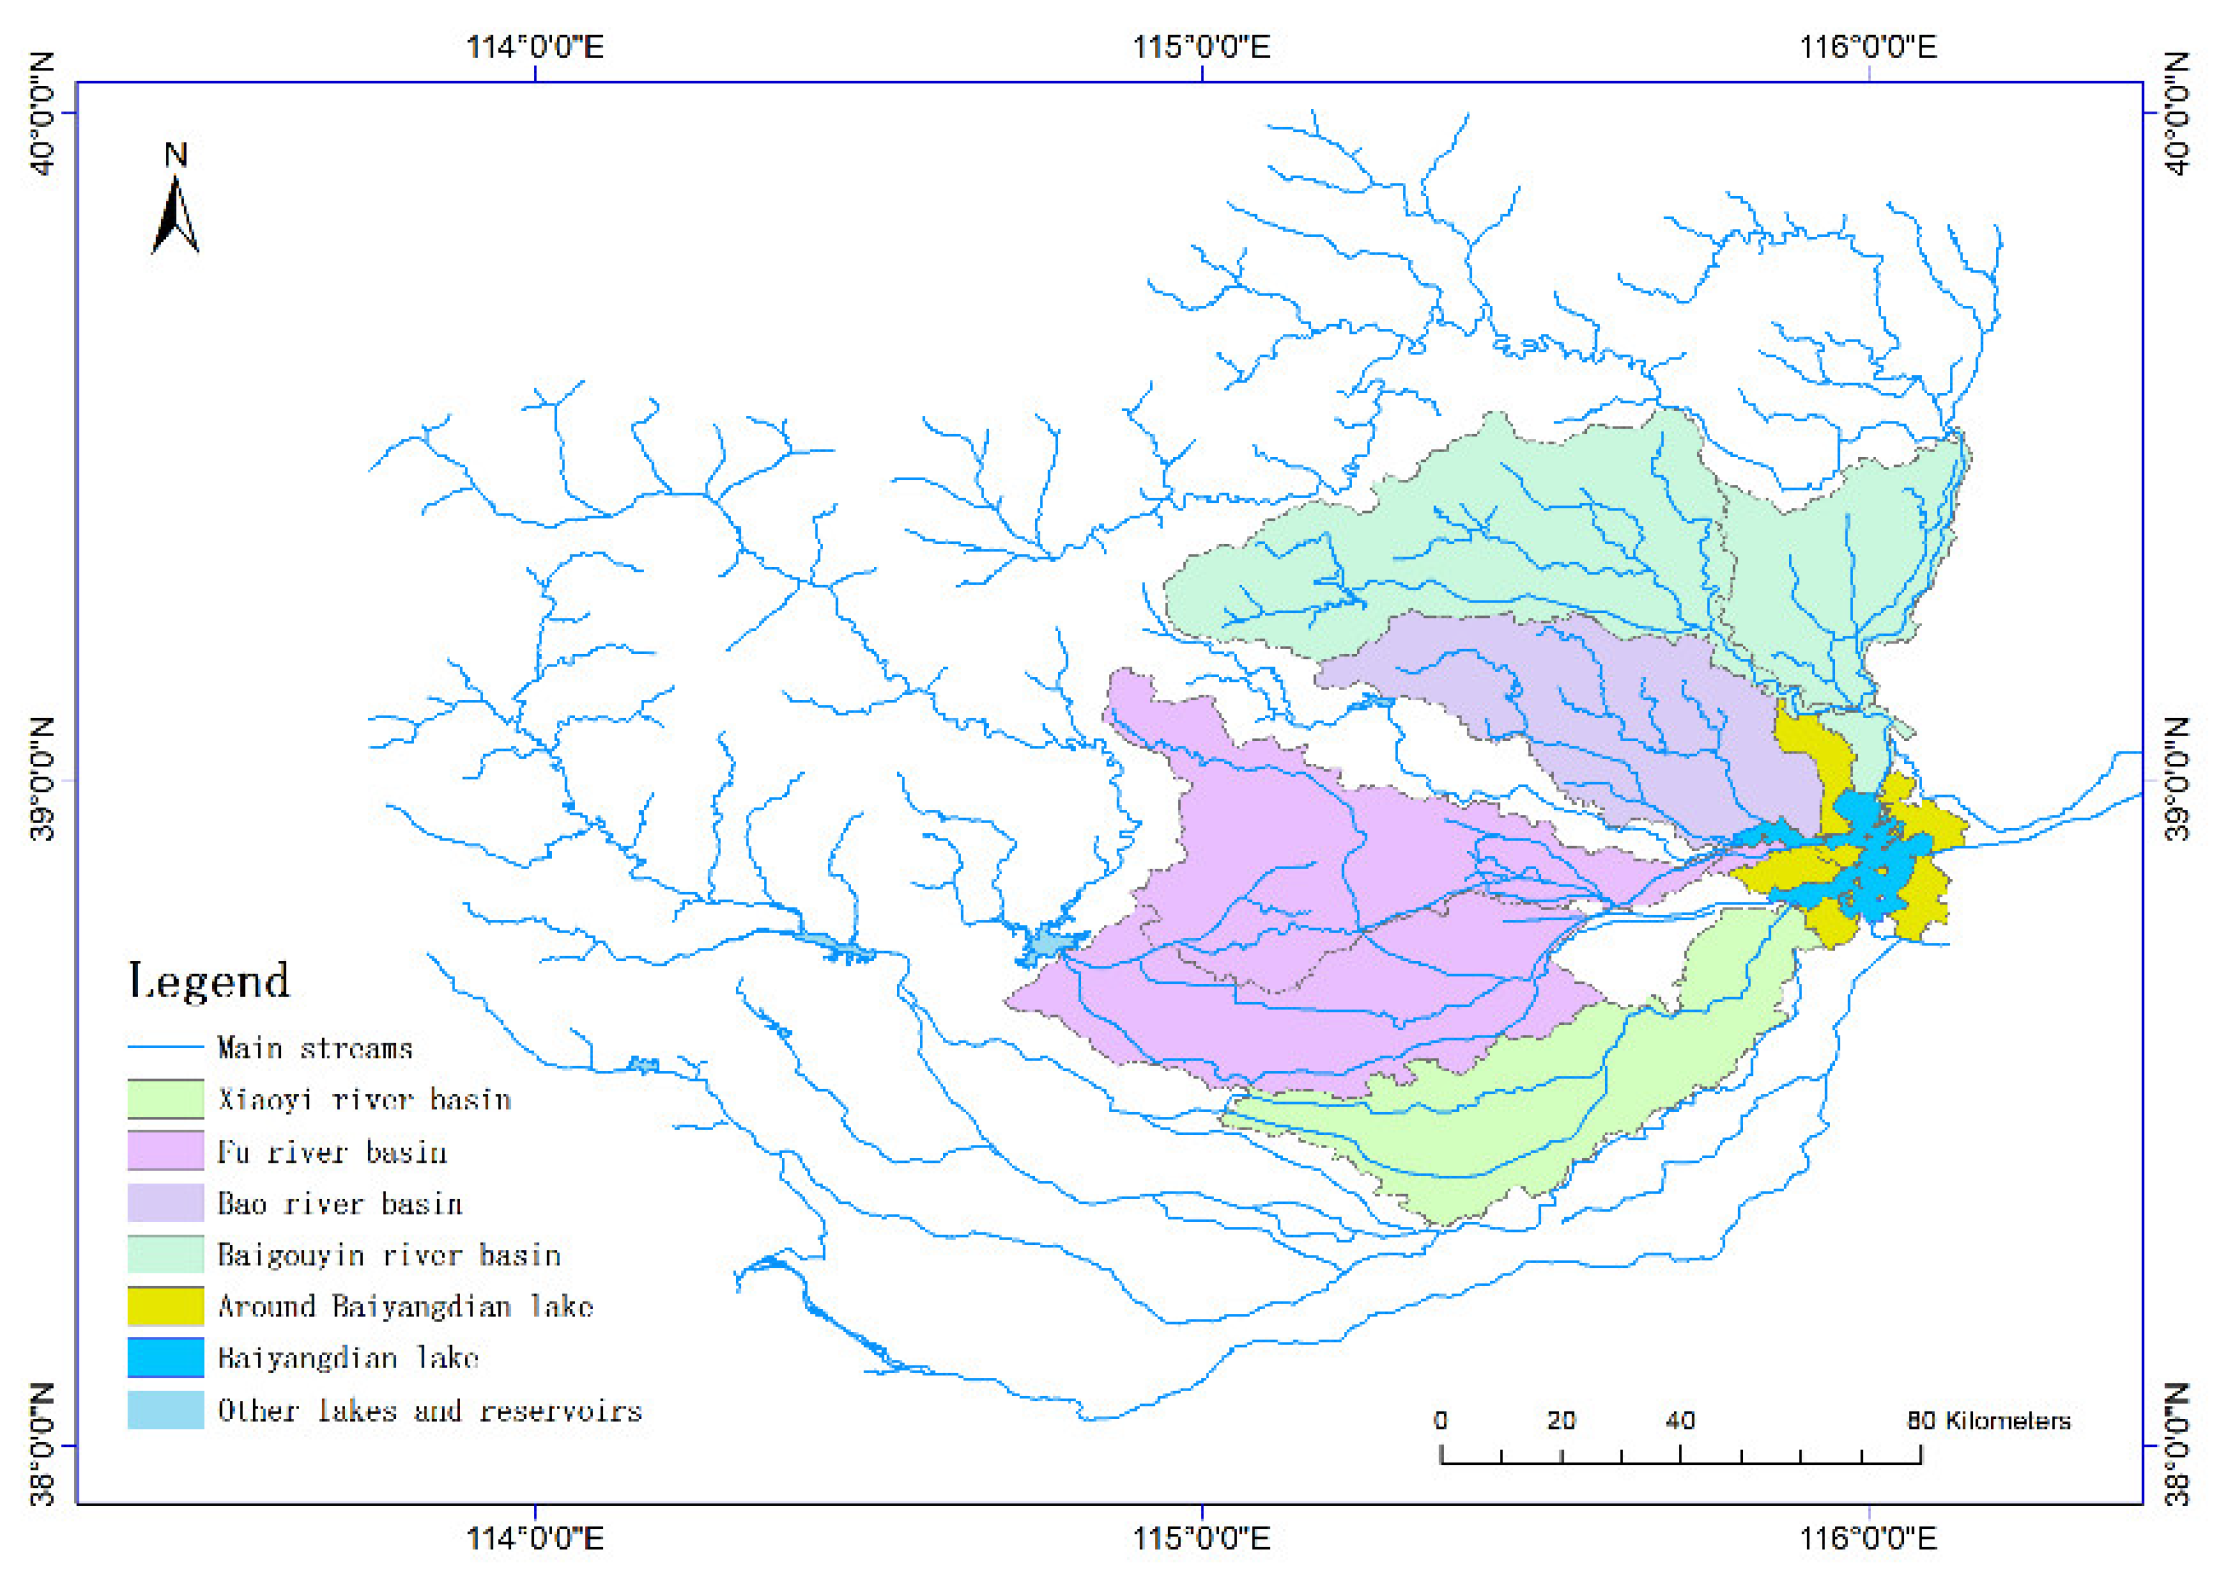
In this research, the scope of data collection covers the whole Baiyangdian lake Basin, shown in Figure 1. Because not all the rivers within the basin flow into Baiyangdian lake, we screened the four rivers (Fu River, Xiaoyi River, Baigouyin River, and Bao River) that had flow into Baiyangdian lake in 2020 as the sub-basin (shown in Figure 2) through the ArcSWAT model while analyzing the pollutants load and source in Baiyangdian lake.
2.2. Data Collection and Information
We collected more than 30 GB of data from social and economic statistical yearbooks, government affairs information, internal statistical reports, and the related literature to screen the statistical data needed to calculate source analysis. The names and sources of the data are shown in Table S1.
Because the data for 2020 were relatively complete, our study used the whole year of 2020 as the research period to explore the load of total nitrogen, total phosphorus, and chemical oxygen demand (COD) flowing into Baiyangdian lake through rivers in the Baiyangdian lake basin.
2.3. Export Coefficient Modelling (ECM)
The Export Coefficient Modelling (ECM) approach has been broadly recommended based on its convenient theory foundations, notably, that the sum pollutants of drainage basin cause non-point source pollution load [26,27]. In this model approach, livestock and poultry breeding and rural life factors such as livestock quantity and distribution status, land use type, and rural residents are considered to obtain differentiated output coefficients in order to analyze the agricultural non-point source pollution load and source analysis. Based on the ECM approach, the non-point source pollution load of rural life, livestock and poultry breeding, and agricultural planting in 2020 in Baiyangdian lake basin was calculated and the final non-point source load of agriculture and rural areas into Baiyangdian lake was corrected according to the relationship between the water quantity data of the hydrological station in the upper reaches of the Baiyangdian lake basin and the downstream water quantity data.
The ECM equation is
where is the average export coefficient of pollutants, kg/(km2 a); i is the land use type with a total of m species; is the export coefficient of pollutants j in land use type i (kg/km2), the excretion coefficient of each livestock and poultry of type i (kg/a), or the export coefficient per person (kg/a); and is the area of land use type i in the river basin (km2), the livestock quantity, or the population quantity. The acquisition of all these data were calculated and corrected according to the relevant data in Table S1 in the Supplementary Materials.
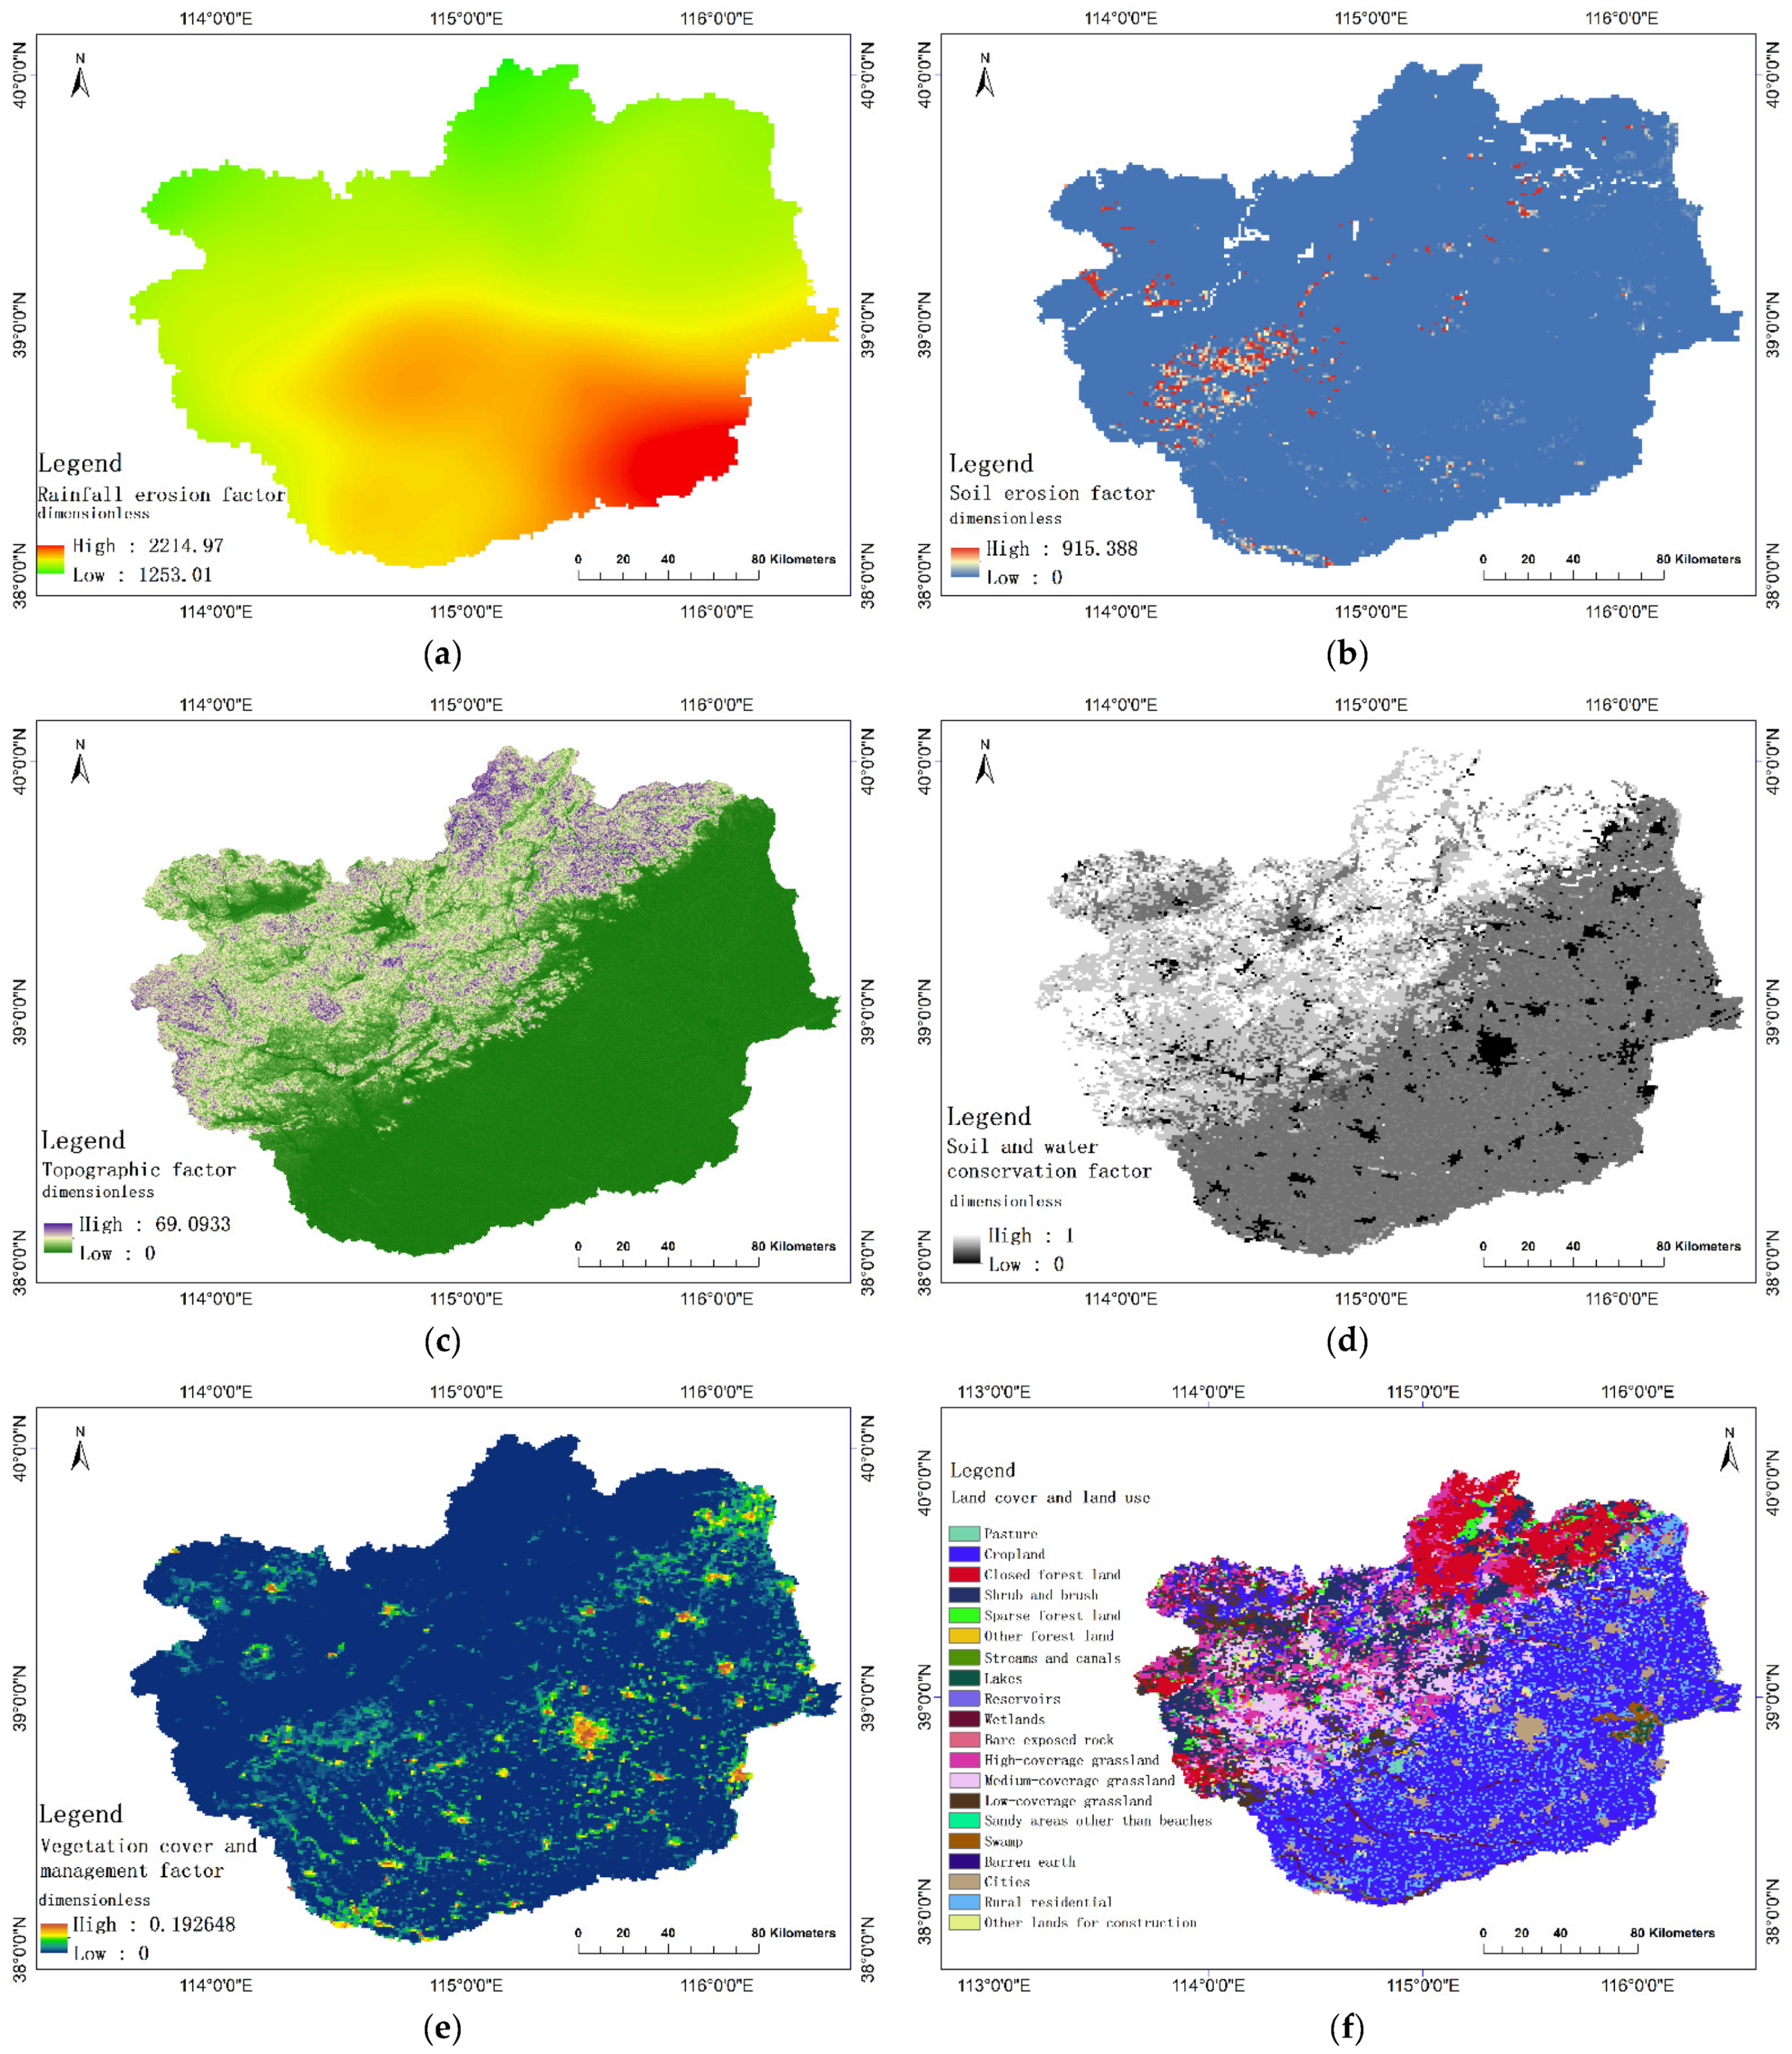
2.4. Revised Universal Soil Loss Equation (RUSLE)
The Revised Universal Soil Loss Equation (RUSLE) is used for loading of adsorbed contaminants such as nitrogen, phosphorus, and COD released into water bodies through soil erosion [28,29]. RUSLE is an empirical soil erosion model designed on the basis of the common soil erosion equation, as shown in Equation (2). In this model, watershed characteristics and hydrometeorological conditions can be used to predict soil erosion rates, allowing the spatial heterogeneity of soil erosion processes to be obtained.
where Wads is the adsorption pollution load; t/a; rads is the sediment transport ratio; u is the land use type; Xu is the annual soil erosion modulus, indicating the average soil loss caused by erosion, which is calculated by Equation (3), in t/hm2; Au is the area of land use type u, km2; Cs is the background concentration of pollutants in the soil, g/kg; t is the pollutant enrichment rate; R is the driving factor for rainfall erosion; Ku is the soil erosion factor; LS is the topographic factor; Su is the soil and water conservation factor; and Mu is the vegetation cover and management factor.
The driving factor R for rainfall erosion in Equation (3) quantifies the impact of rainfall on the soil and reflects the probability of erosion associated with precipitation events; R can be estimated by the following formula [30].
where Pu is the average annual precipitation and Pi is the average monthly precipitation.
The soil erosion factor Ku in Equation (3) is the rate of soil erosion measured on standard plots per unit rainwater erosion index, usually calculated by the soil characteristic attribute properties:
where Sd is the sand content%, Si is the silt content%, Ci is the clay content%, and C0 is the organic carbon content%.
The topographic factor LS in Equation (3) reflects the effect of terrain on soil erosion. Among them, the slope length factor L represents the effect of slope length on erosion and the slope factor S reflects the influence of slope on erosion. LS can be calculated by the following equation:
where QA is the flow accumulation, Lc is the cell size, and is the slope.
The vegetation cover and management factor Mu in equation (3) is used to reflect the influence of vegetation and human management behavior on the soil erosion rate, including crop planting and farmland management in agricultural areas and the inhibition of soil erosion by vegetation cover in forest areas. The value of this factor changes with the change of plant growth caused by seasonal factors. Mu can be estimated by
where is the average annual vegetation cover.
2.5. PLOAD Model
The PLOAD model is a simplified GIS-based model for calculating non-point source pollution loads for various sub-basins and land uses based on annual precipitation, land use, and best watershed management measures [31,32]. In this research, the PLOAD model was adopted to calculate the pollution load of dissolved pollutants generated by rainfall. The equation is as follows:
where WRJ is the load of dissolved pollutants, t/a; λRJ is the river entry coefficient; P is the rainfall, mm/a; PJ is the runoff coefficient correction; RVu is the average runoff coefficient of the land use type u; Au is the area of land use type u, hm2; and Cu is the average output concentration of pollutants in rainfall event under the land use type u, mg/L.
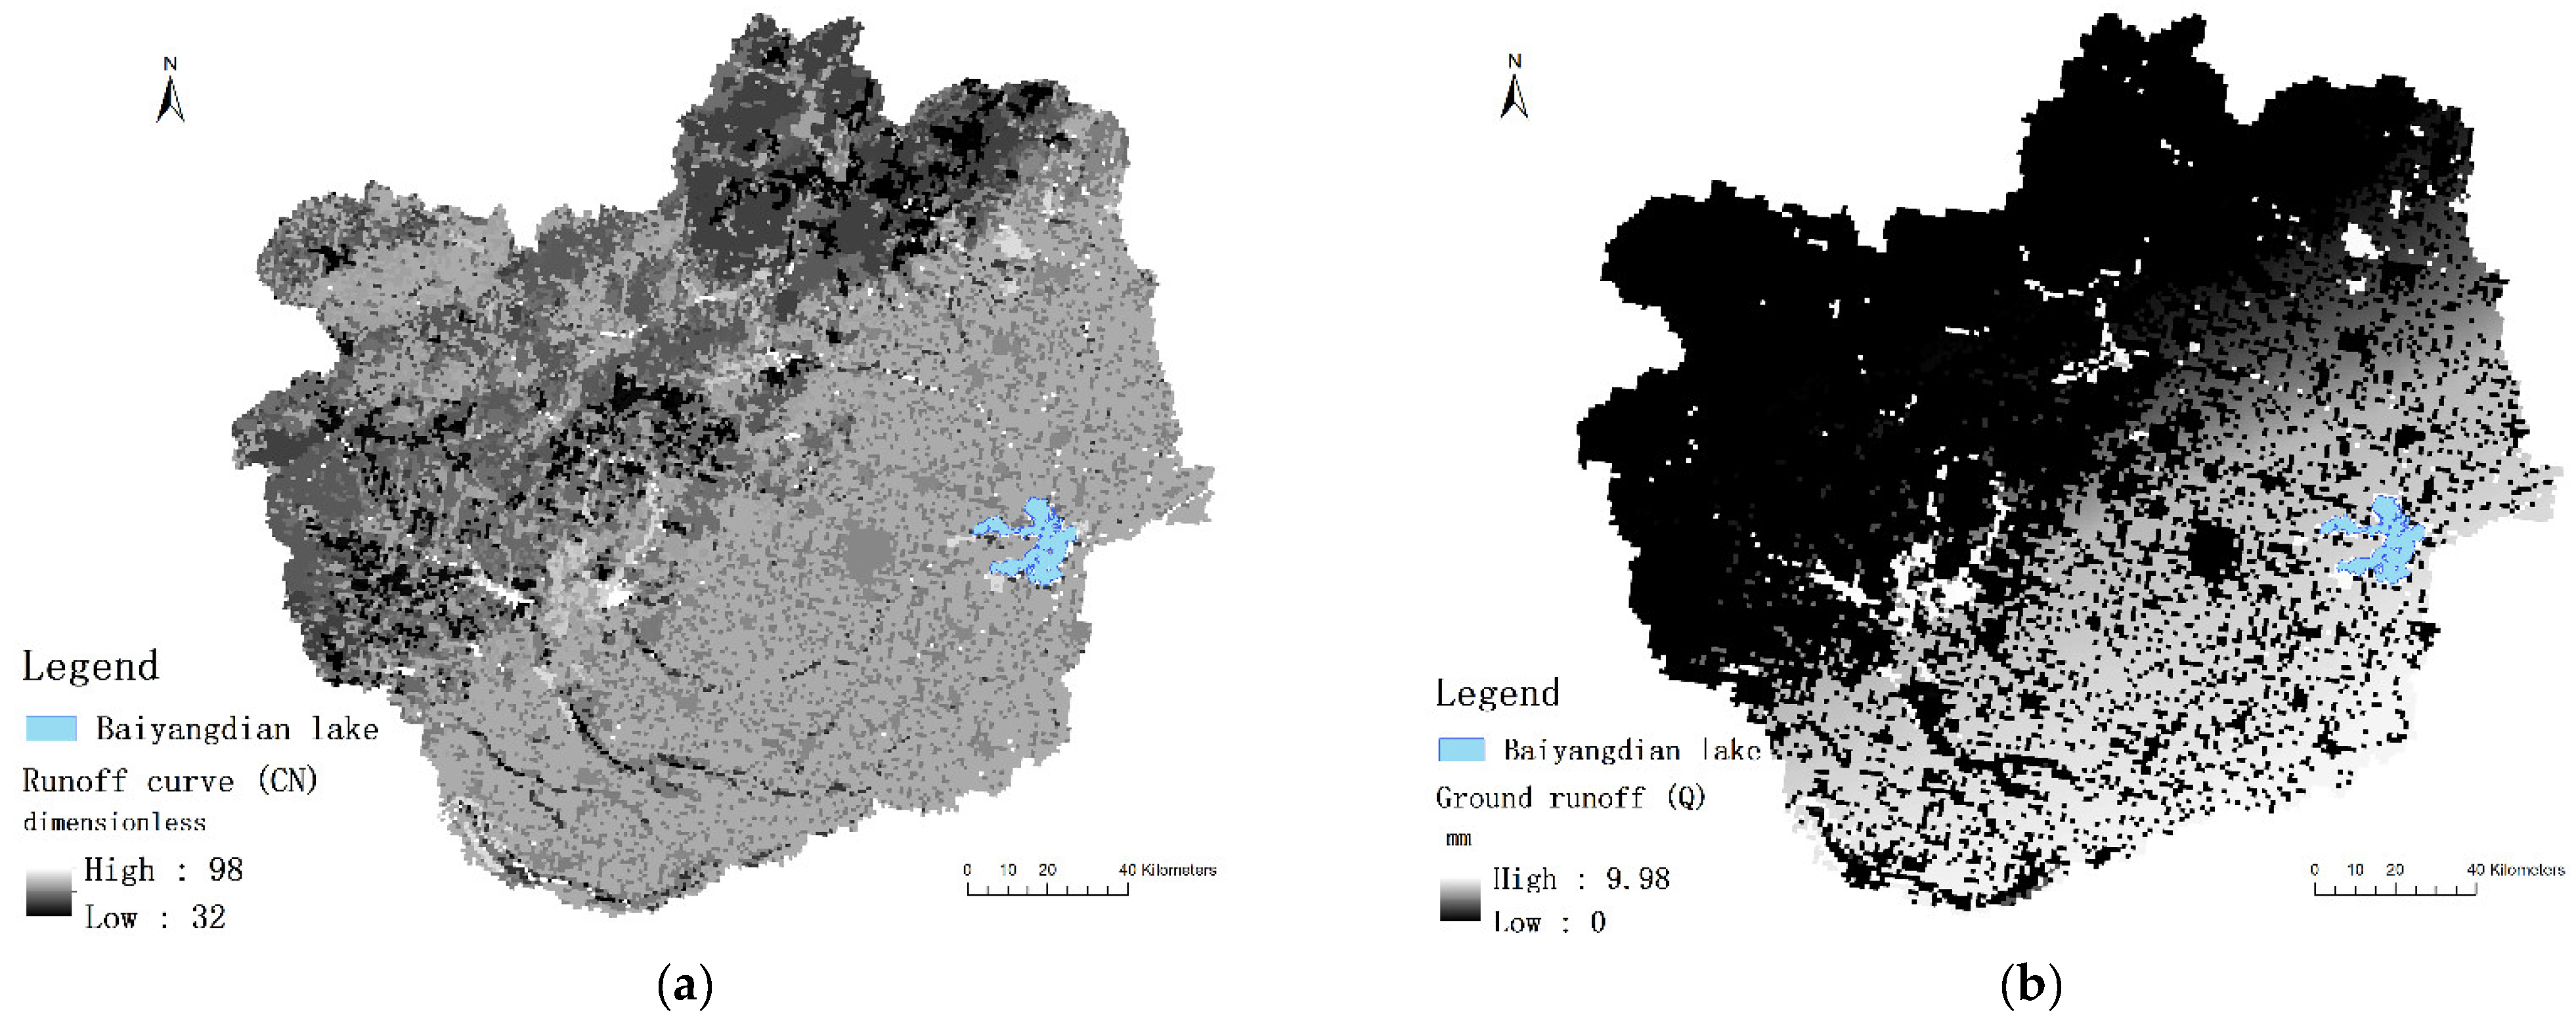
The runoff coefficient was calculated using the Runoff Curve Number (SCS-CN) model [33]. This model can reflect the effects of different soil types, different land use patterns, and previous soil moisture content on rainfall runoff. The basic equations of the model are as follows:
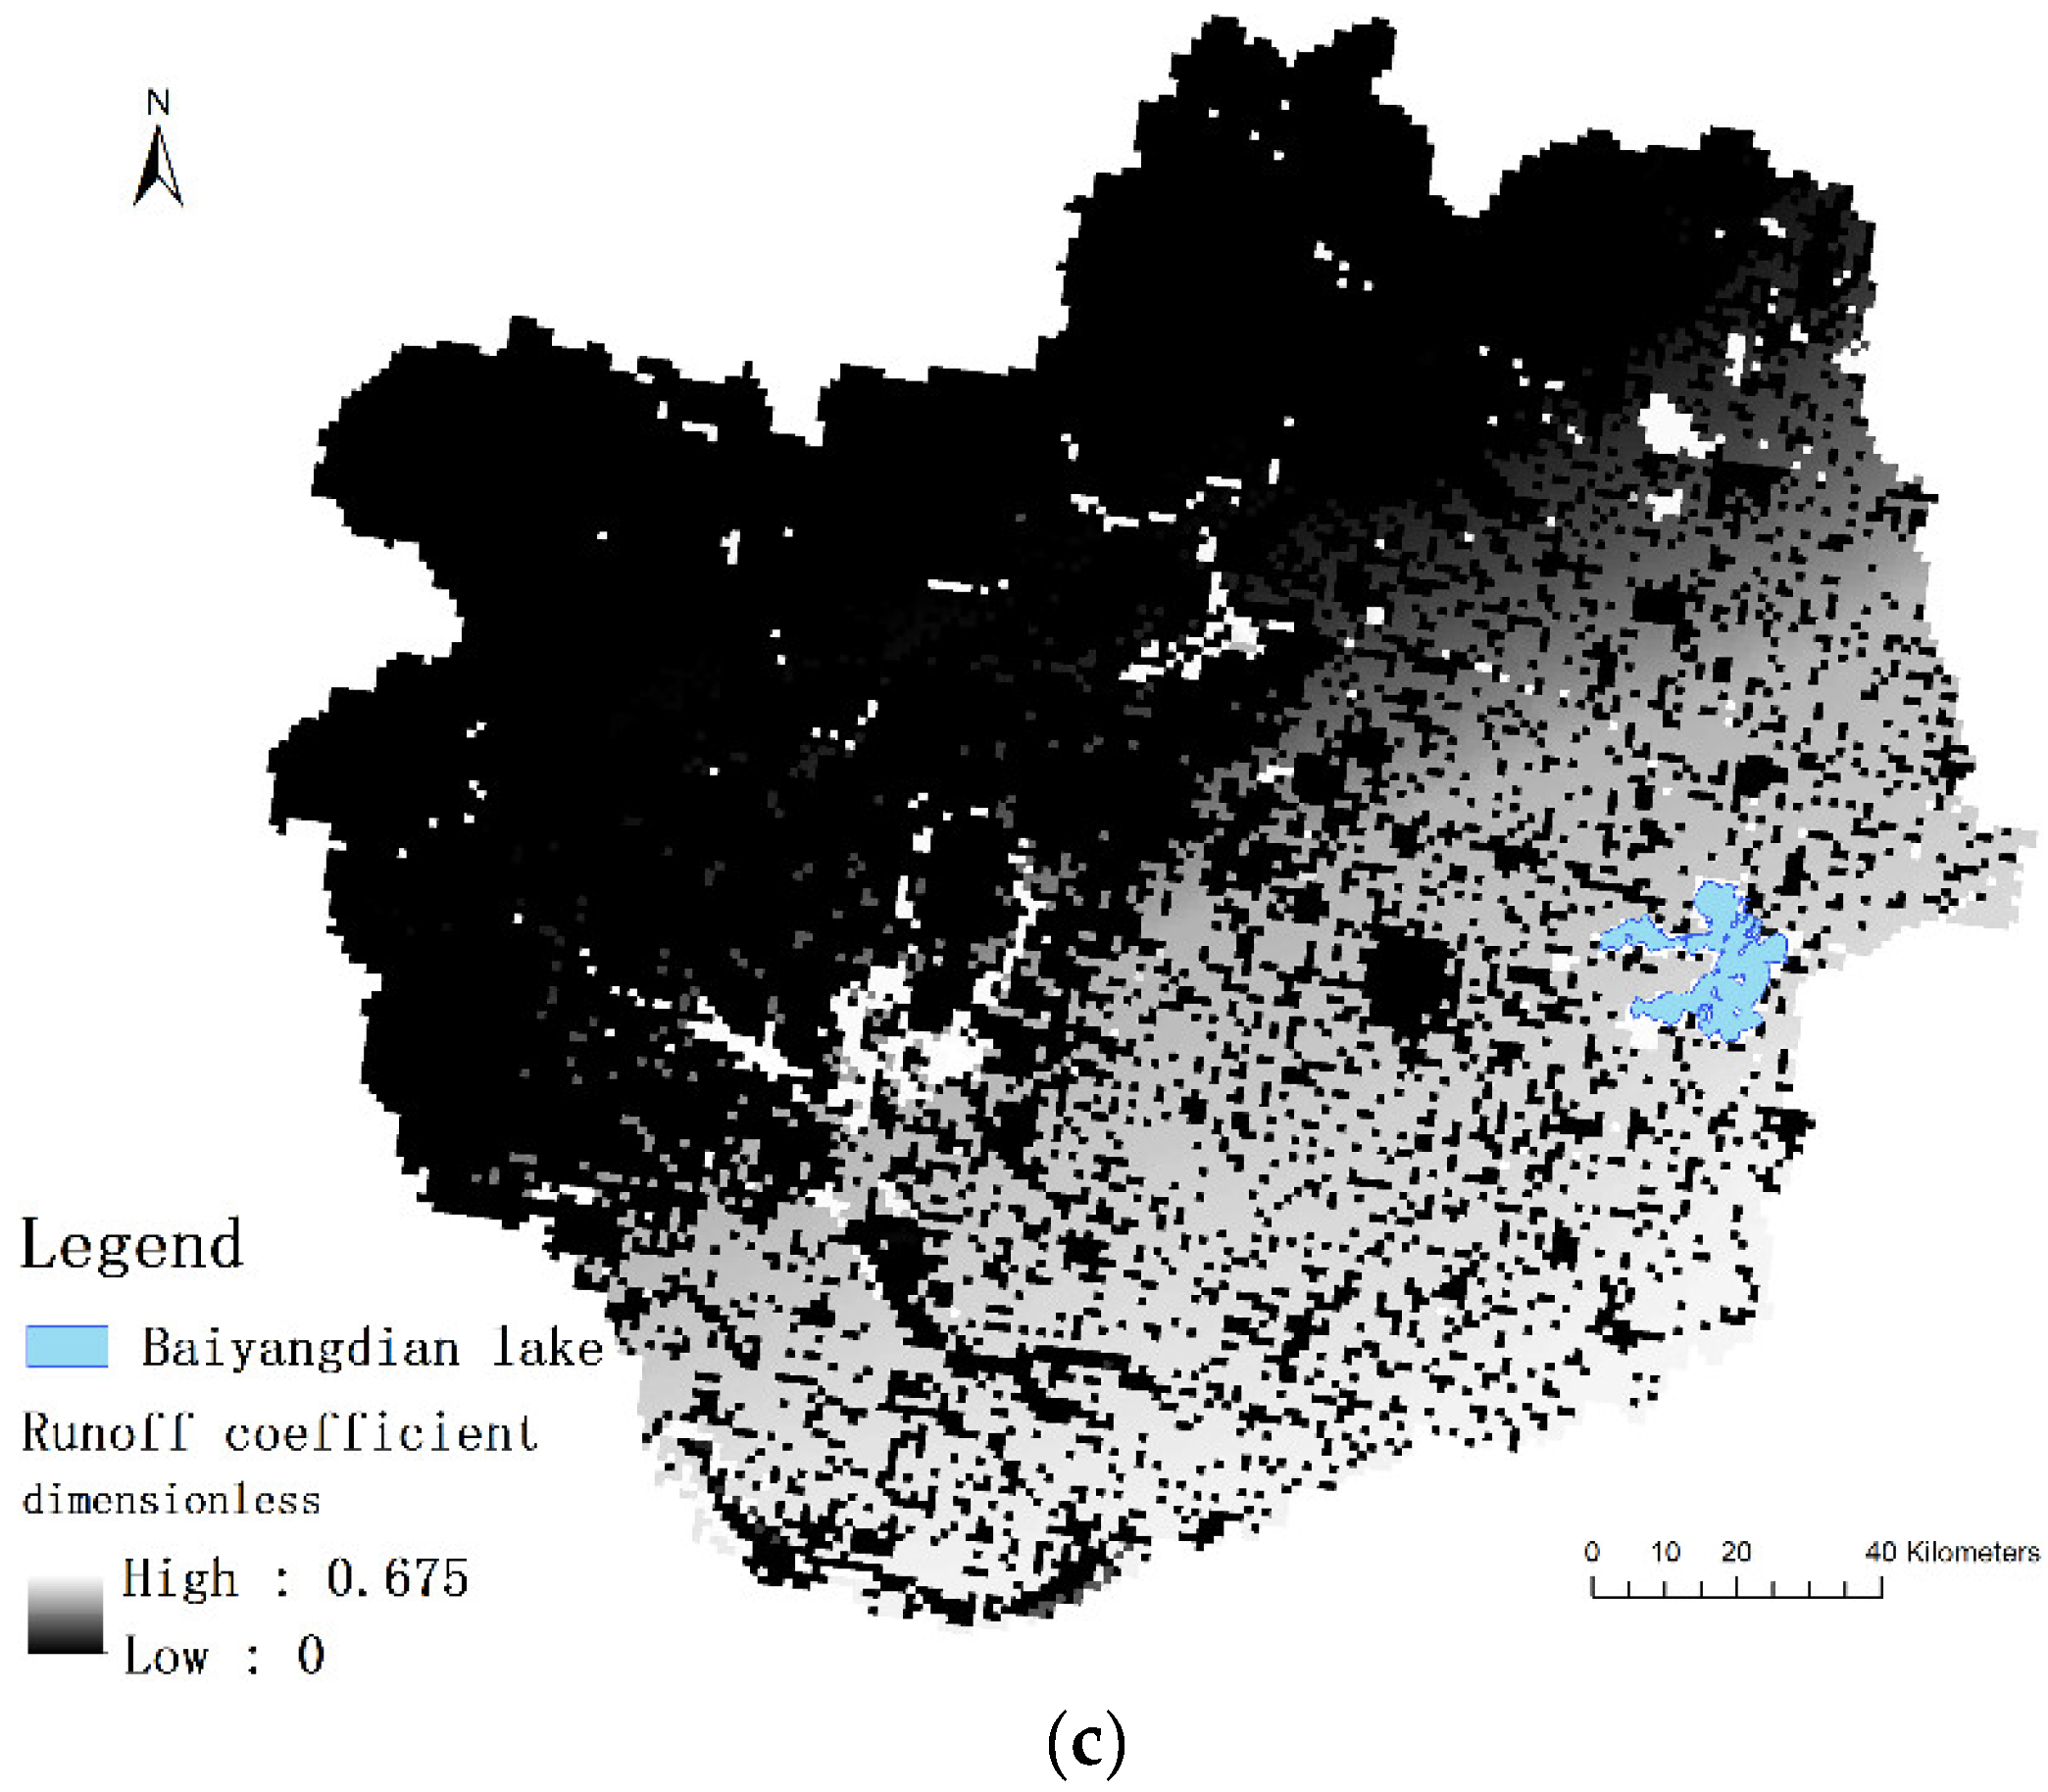
where Q is the ground runoff, mm; P is the rainfall of a rainfall event, mm; S is the potential water storage capacity of the surface, mm; CN is the comprehensive parameter of the basin characteristics, which is related to soil characteristics, pre-humidity and land use. The final runoff coefficient is the ratio of Q to P. The rainfall flow coefficient correlation parameters in the study area are shown in Figure 4. The pollution concentration, river entry coefficient, and runoff correction factors were adopted according to Li et al., (2021), Li (2007), and Cui (2011) [4,34,35].
2.6. Point Source Load
Point source pollution includes sewage from industrial enterprises and sewage treatment plants. Industrial wastewater pollution load is calculated by the following Equation (11):
where WP is the point source pollution load, t/a; λP is the point source pollution into the river coefficient; K and N are the number of industrial pollution source industry types and the number of industrial enterprises, respectively; QIW,k,n is the sewage discharge of enterprise n in industry k, m3; CIW,k,n is the corresponding average emission concentration of pollutants, mg/L; pLW is the yield factor of per capita pollution, kg/(per person·a); PLW is the catchment area population; and fLW is the sewage treatment rate. The corresponding collected data sources are shown in Table S1 in the Supplementary Materials.
2.7. LOADEST Model
LOADEST is a useful pollutant regression model based on various water quality data [36,37]. Three methods can be used to estimate parameter valuation, including (1) Minimum likelihood estimation, MLE [38]; (2) Adjusted maximum likelihood estimation, AMLE [39]; and (3) Least absolute deviation, LAD [40]. Different valuation methods are used on the basis of whether the residuals are normally distributed or whether there are censored data.
Factors such as the characteristics of pollution sources and the proportion of point sources and non-point sources carry an impact on the long-term flux calculation. When the pollutants are mainly derived from the point source, the change in runoff during the year does not change the pollutant flux of the cross-section; rather, the instantaneous concentration of the pollutants changes negatively with the flow rate. When the pollutants are mainly derived from non-point sources, such as soil erosion or endogenous release, the generation of pollutants is proportional to the runoff. When the contaminants originate from a mix of point and non-point sources, the relationship between runoff and pollutant flux is complicated, and positive correlation, negative correlation, and basically uncorrelated situations may occur.
For different cases, the general flux can be calculated using the following three equations:
where K is the time conversion coefficient calculated according to the monitoring time frequency and flux period, Ci is the instantaneous monitoring concentration of pollutants, Qi is the instantaneous flow of water, represents the mean data over the desired period, indicates the mean flow data of Ci, and n represents the amount of data.
Equation (12) weakens the time change of runoff, Equation (13) emphasizes the role of the corresponding runoff in each pollutant concentration measurement, and Equation (14) emphasizes the average time change of the total runoff and weakens the sensitivity to runoff change. Different formulas should be selected for the flux calculation for different situations.
3. Results
3.1. Non-Point Source Load from Agriculture and Rural Areas
Generally speaking, non-point sources from agriculture and rural areas include rural life, livestock and poultry farming, and agricultural planting. There are dense population and intensive life and production activities surrounding the Baiyangdian lake district, with a permanent population of about 240,000 in 2017 and an arable land area of about 12,000 hectares in 2018, which is the largest type of land use in the area [41,42]. In this study, the pollutant sources from agriculture and rural areas were first calculated.
Non-point source pollution generated by rural life is mainly derived from domestic garbage, domestic water, and human excrement [6]. The similar living habits of residents mean that similar contents of nitrogen and phosphorus elements are commonly ingested from food; thus, the rural population is the dominant factor that determine the intensity of non-point source pollution in rural life. For areas with dense rural populations, the corresponding pollution intensity is much higher. The non-point source pollution load of rural life calculated based on rural life information is shown in Figure S2.
We obtained the non-point source load of livestock and poultry farming according to the number of large livestock, pigs, sheep, and poultry in various districts and counties of Baiyangdian lake basin, in which the feeding method, fecal and urine treatment method, and proportion of breeding facility were considered in the calculation, as shown in Figure S3. Livestock and poultry are important sources of non-point source pollution in agriculture which emit a large amount of nitrogen, phosphorus, and organic pollutants into the environment through feces and urine during growth [4]. The environmental pollution problems caused by livestock and poultry manure and urine exist in most of North China.
Non-point source pollution from agricultural planting is a major component of non-point source pollution in agriculture and rural areas. The excessive use of chemical fertilizers and pesticides causes a large number of agricultural chemicals to remain on the surface of cultivated land, and the surface runoff generated by rainfall enters the natural water body, leading to non-point source pollution [43]. Planting and crop management methods were dominant determinants of the pollutant load from planting non-point sources. The non-point source pollution intensity of agricultural planting in each district and county of Baiyangdian lake basin was calculated through land use data to obtain the planting area of grain, vegetables, orchards, and other categories based on the correction to obtain the output coefficient, as shown in Figure S4.
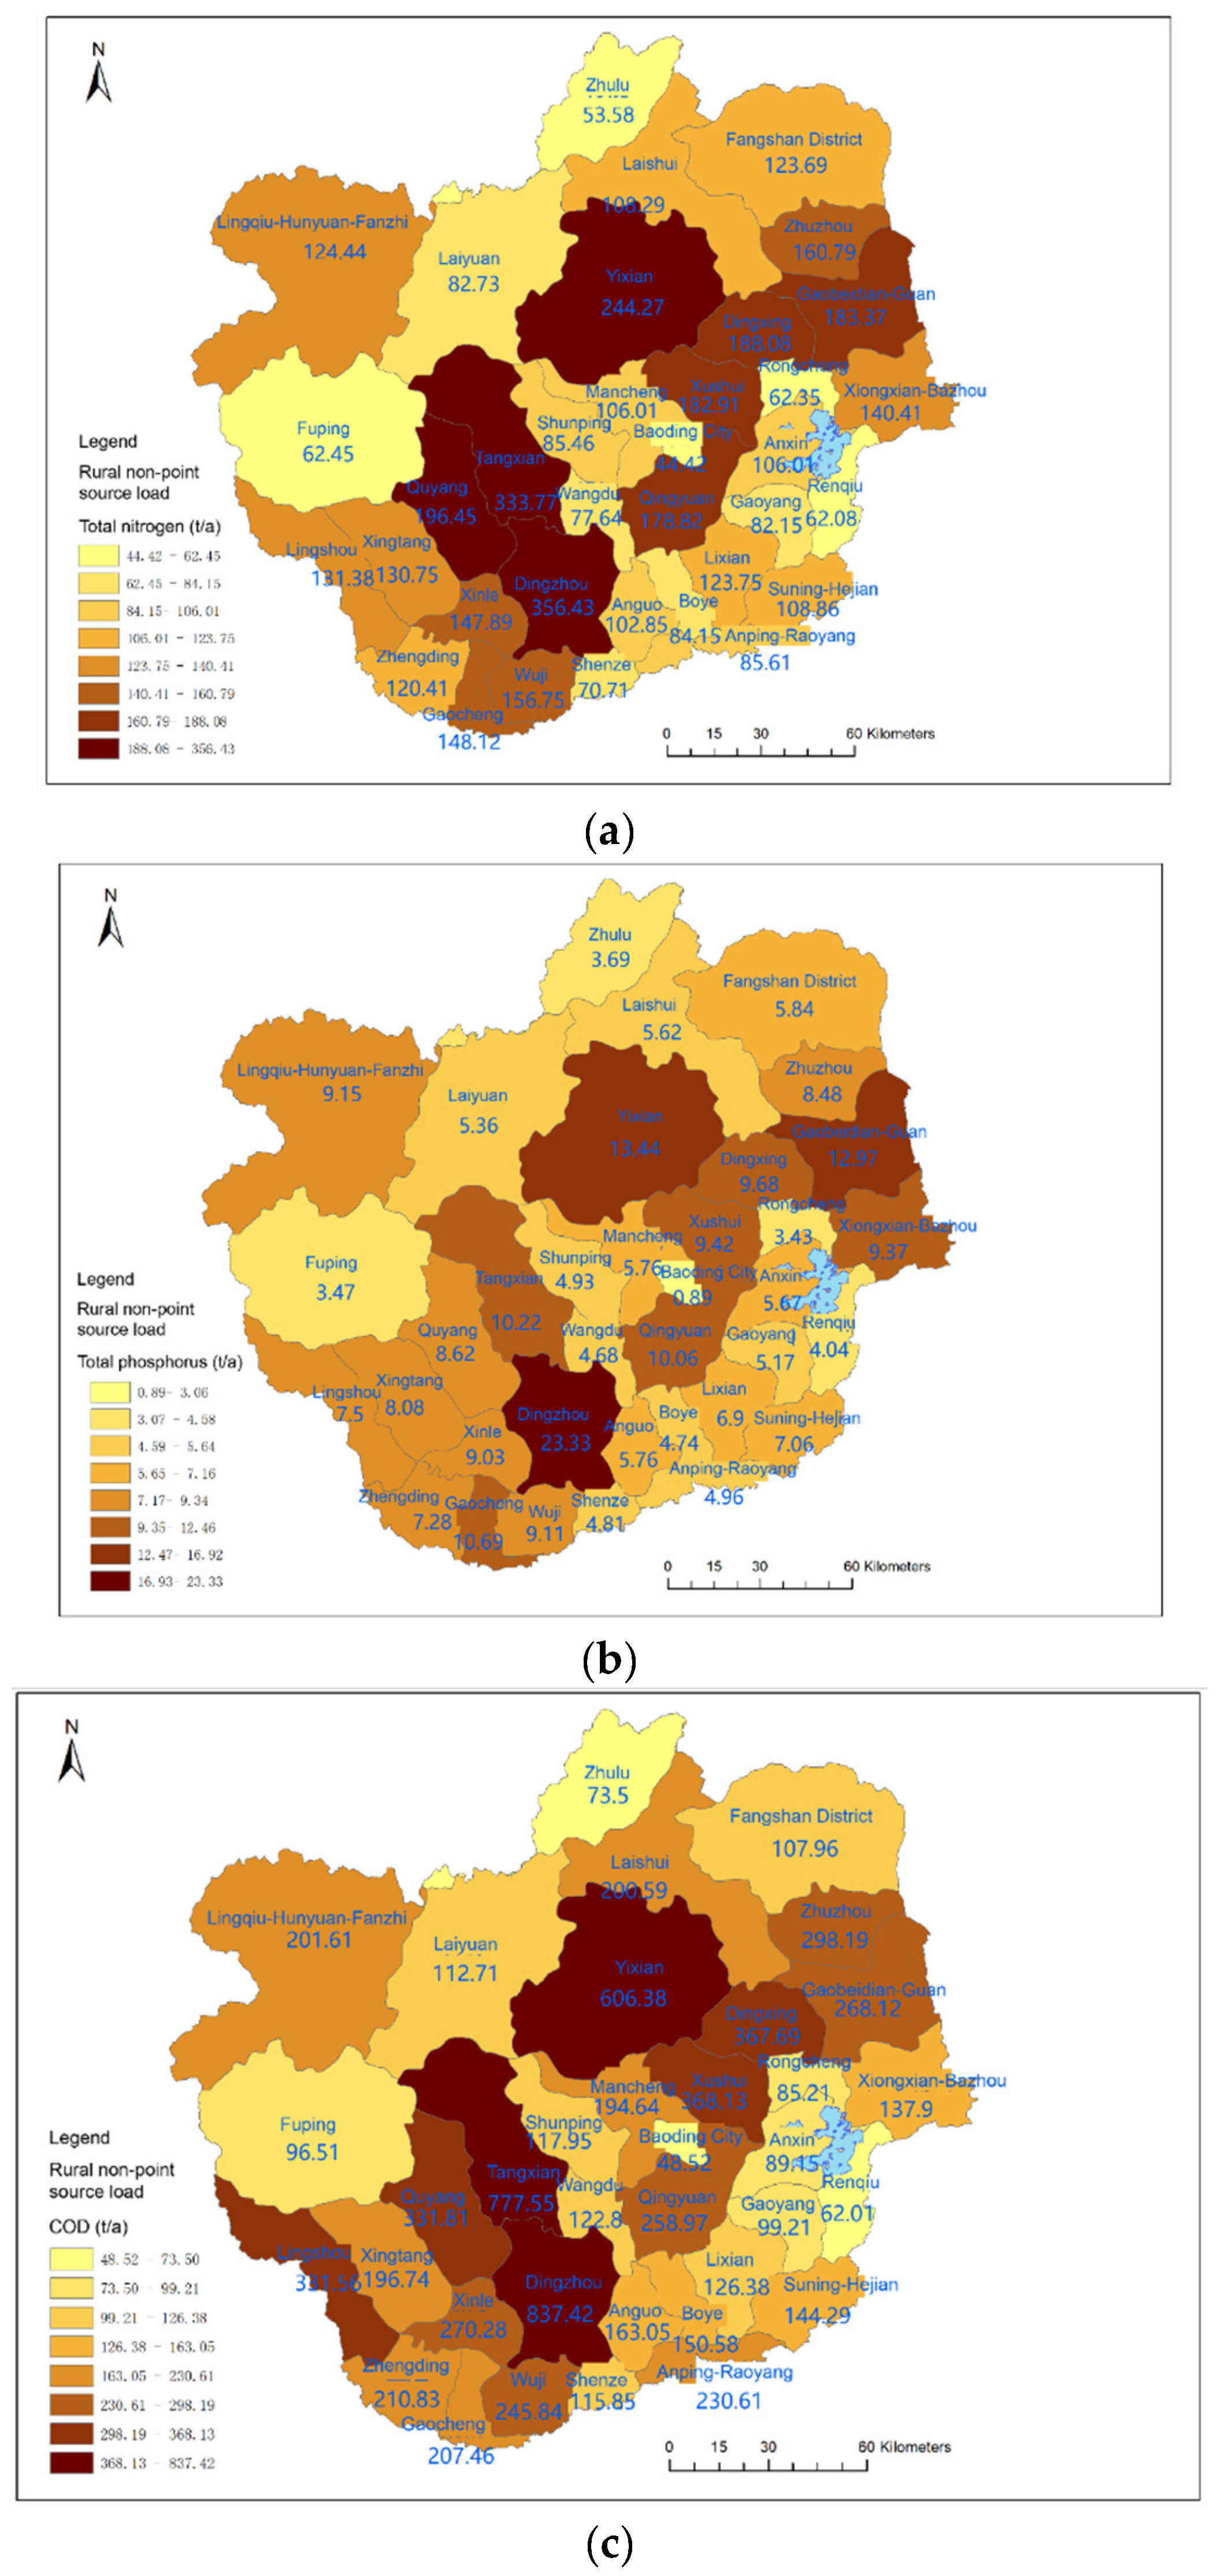
The total load of non-point source pollution in rural areas obtained by the three types of rural life, livestock and poultry farming, and agricultural planting is shown in Figure 5.
Overall, Dingzhou City, Tang County and Yi County were the three areas with the highest non-point source loads in agriculture and rural areas in Baiyangdian River Basin, which accounted 19.6% for nitrogen, 18.5% for phosphorus and 26.9% for COD of the total agricultural and rural non-point source load. According to the Baoding Economy Statistical Yearbook (2020), the total area of crop planting in Dingzhou City in 2019 was as high as 159,000 hectares, of which 117,000 hectares were planted with grain and 18,000 hectares were planted with vegetables. In 2019, 6.53 million poultry were output, including 870,000 head of pigs. In addition, the rural population of Dingzhou City ranked fourth among all the cities and counties of Baiyangdian river basin, leading to the highest pollution output. Similarly, Tang County and Yi County had large-scale farming and planting activities, resulting in high non-point pollution sources.
However, Baiyangdian lake basin included the catchment area of all rivers naturally exported into Baiyangdian lake. In fact, many of the rivers were cut off or artificially diverted and no longer transmit water to Baiyangdian lake, meaning that the pollution load generated by the whole basin cannot be equated with the sediment load. Thus, we divided Baiyangdian lake basin into sub-basins based on the four rivers (Fu River, Xiaoyi River, Baigouyin River, Bao River) that transport water into the lake [44]. The corresponding potential sedimentation of non-point source pollution in agriculture and rural areas was rectified, and the resulting total nitrogen load, total phosphorus load, and total COD load were 1073.82 tons, 102.72, tons and 3349.33 tons, respectively (see Table 1). Among them, the contribution rate of livestock and poultry breeding to COD exceeds 70%, the contribution rate of agricultural planting to total phosphorus reaches 73.12%, and the contribution rate of the three types of non-point sources to total nitrogen is basically equal, of which the contribution rate of rural life is slightly higher at 38.48%.
It can be seen that livestock and poultry breeding have a significant impact on COD pollutants in downstream water bodies; thus, efficient treatment of aquaculture pollution, especially emphasizing the management of the small-scale decentralized breeding, should be considered to control the release of organic pollutants into Baiyangdian lake. In addition, the application of excessive agrochemicals in agricultural planting causes a large amount of nutrients to remain on the farmland soil surface, which flow into natural water bodies by rainfall, resulting in eutrophication. Therefore, adopting scientific fertilization methods and intensive farmland management methods are advisable measures to reduce non-point source pollution in agricultural planting.
3.2. Pollutant Loads from Surface Runoff Erosion
Precipitation causes surface water-soluble pollutants to migrate to water bodies and causes soil particles to enter the water body by eroding the topsoil [28]. Pollutants such as nitrogen, phosphorus, and organic matter adsorbed on the surface of soil particles have become important sources of non-point source pollution in water bodies. Due to long-term cultivation, the topsoil of farmland in the Baiyangdian lake basin is usually polluted by adsorbed organic matter and inorganic nitrogen, phosphorus. Outdoor farmland soil without mulching is easily washed away by precipitation, causing topsoil erosion. Therefore, the pollution load caused by soil erosion should be considered when calculating the non-point source pollution caused by rainfall in the Baiyangdian lake basin.
3.2.1. Adsorbed Pollutant Loads
In order to distinguish between the dissolved pollutants from rainfall runoff and the particulate pollutants carried by soil erosion, the total nitrogen and phosphorus content of the topsoil in the soil database was used to subtract the adsorbed nitrogen and adsorbed phosphorus content that was easily soluble in water, and the difference obtained was used as the particle pollutant content. For the soil COD pollutant background value, the soil organic matter content was used directly as the particle contaminant content.
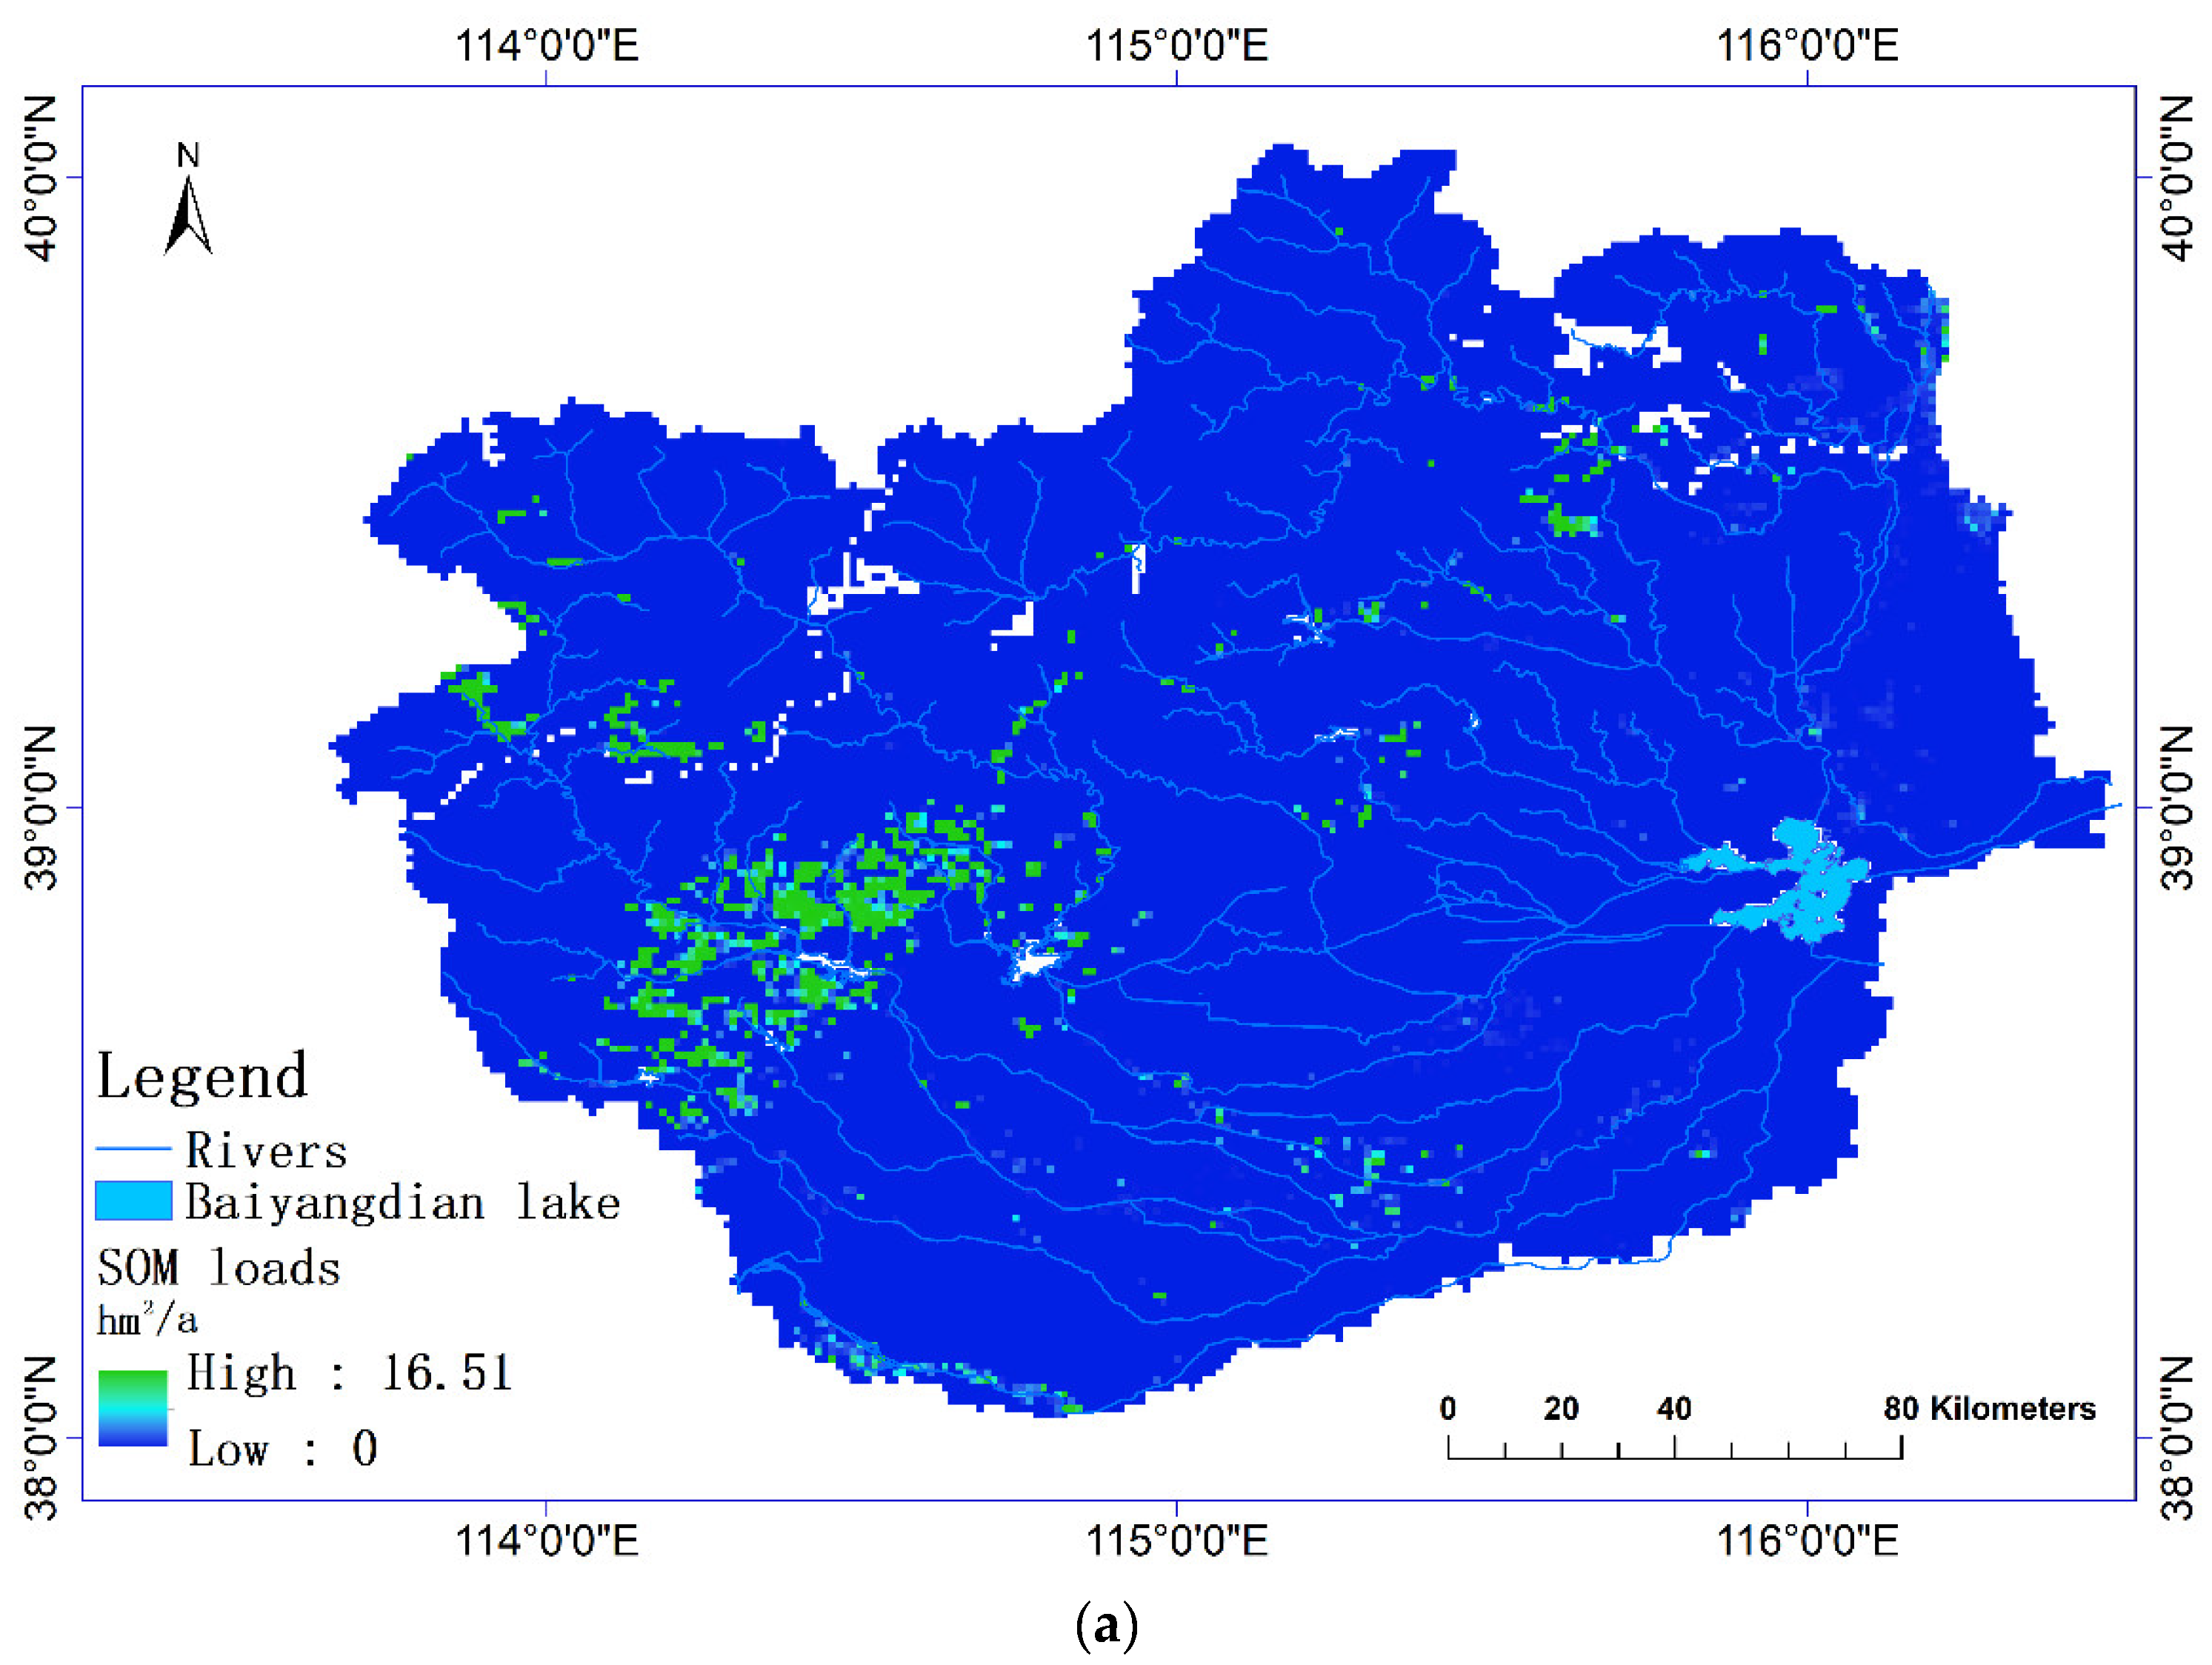
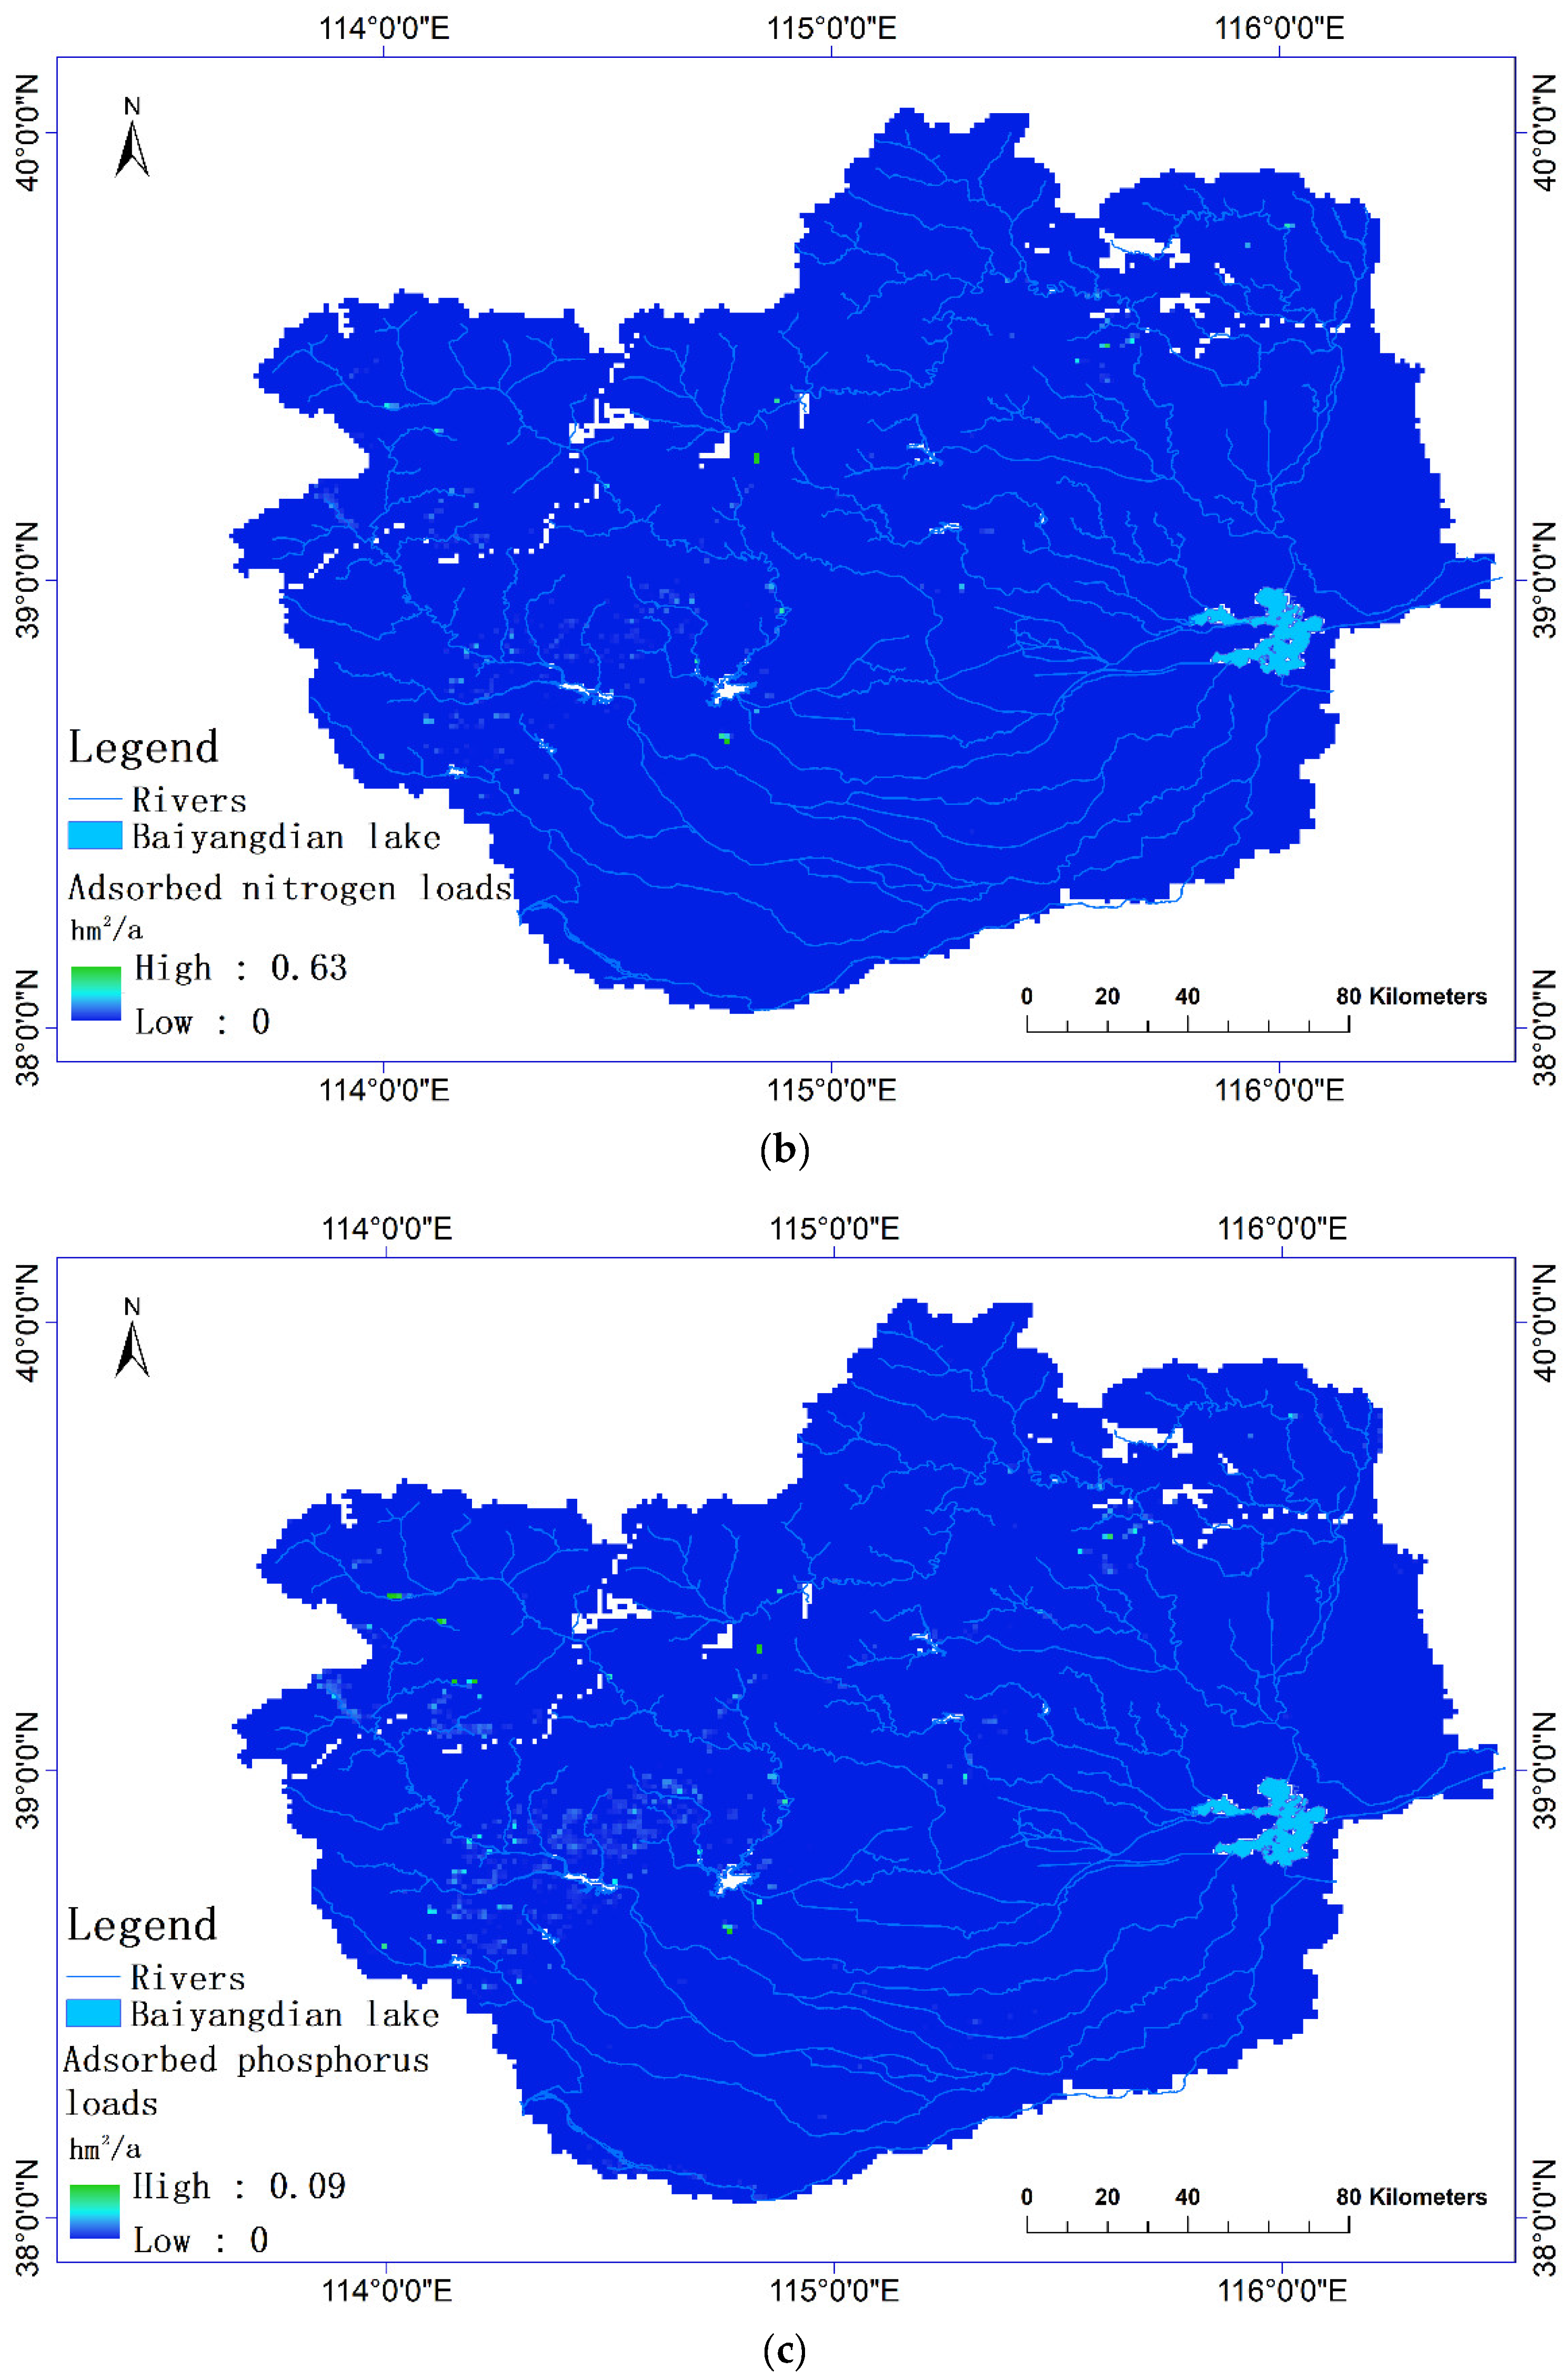
On the basis of the calculation of each parameter by Equation (2), the adsorption pollutant load generated by soil erosion in Baiyangdian lake is shown in Figure 6.
It can be seen that the non-point source pollution load caused by soil erosion in the whole basin is generally low. The high load areas are concentrated in the Taihang Mountains, especially the upper reaches of Lilong River and Tang River. The difference between the loads of the three pollutants is mainly due to their different contents in the surface soil, generally in the order of total nitrogen > total phosphorus > soil organic matter. The non-point source pollution load from soil erosion was rectified based on the sub-basins of the four main rivers (Fu River, Xiaoyi River, Baigouyin River, Bao River), showing that the total adsorption load generated by soil erosion was 94.1 tons for nitrogen, 20.8 tons for phosphorus, and 1262.9 tons for COD, as shown in Table 2.
3.2.2. Dissolved Pollution Loads
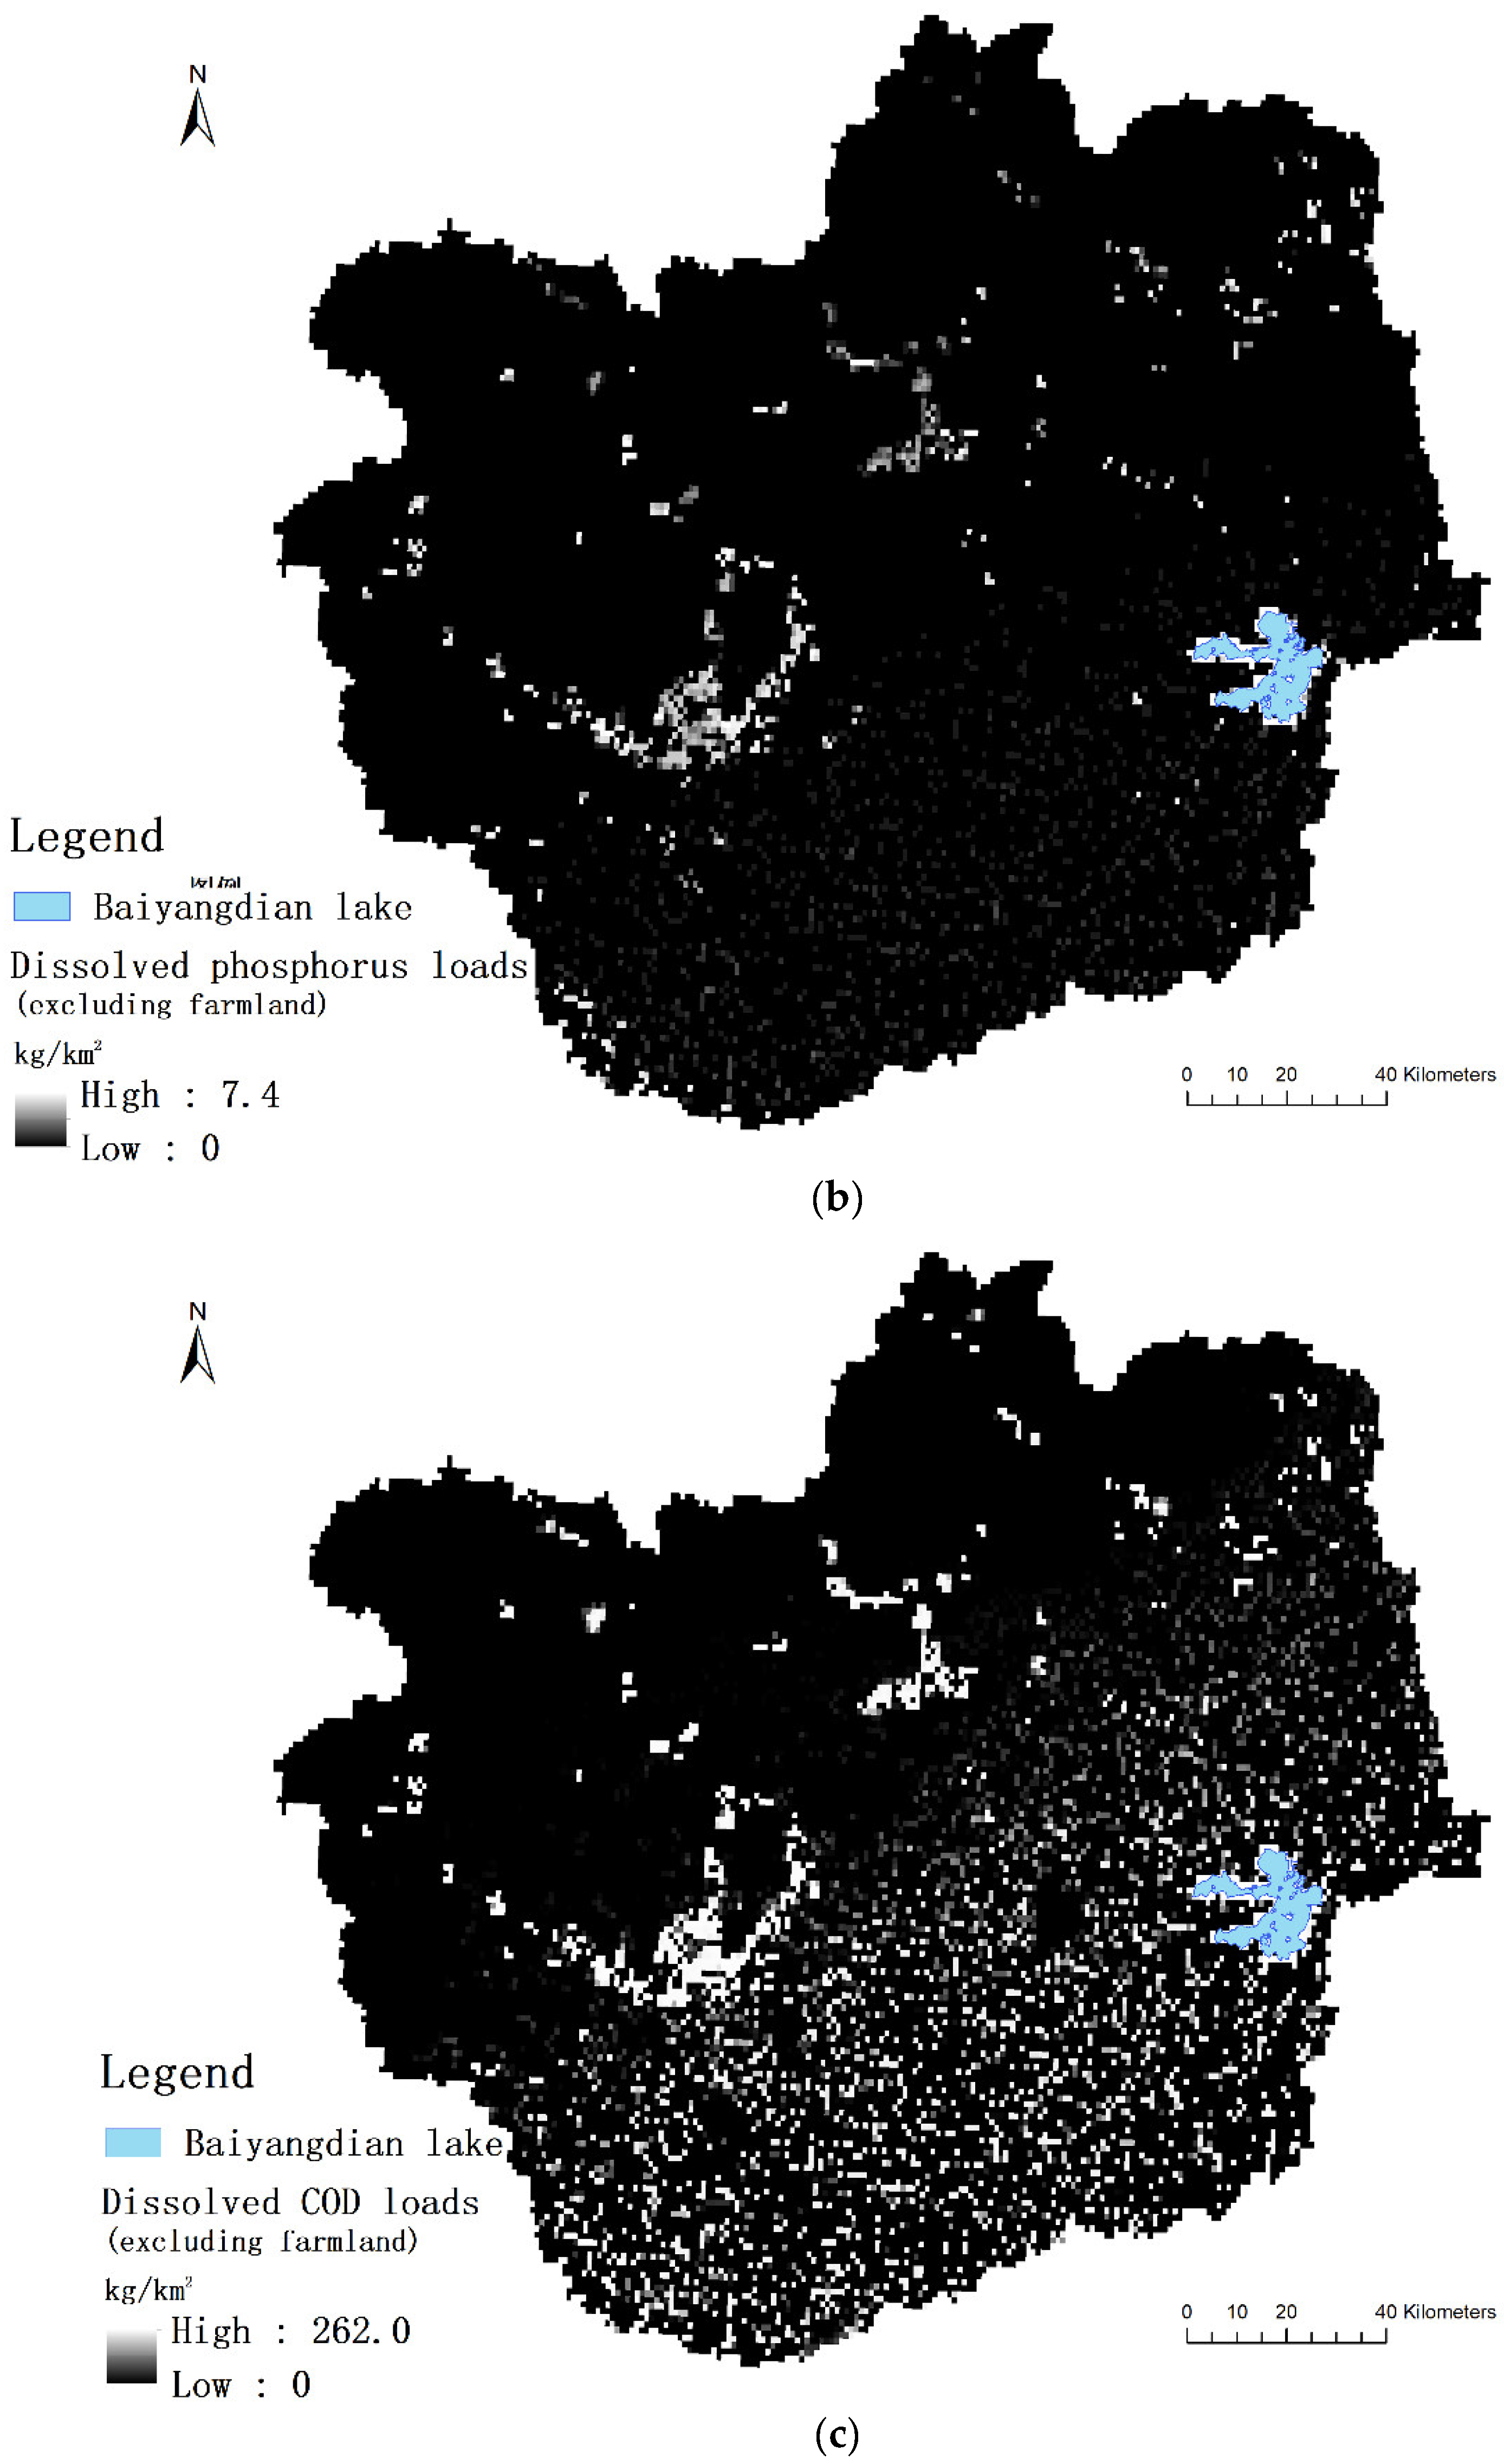
Surface runoff is the driving force of most non-point source pollution, and the differential generation and migration of non-point source loads in agriculture and rural areas are caused by rainfall. Thus, the non-point source loads in agriculture and rural areas calculated using ECM model are essentially dissolved pollutant pollution loads caused by surface runoff. Here, the calculation of the dissolved pollutant load uses the pollution load generated by other land uses with surface pollution by rainfall, with the exception of land for agriculture planting. Combined with the average yield of rainfall and the concentration of pollutants in different regional production streams, the distribution of the dissolved pollutant load caused by rain erosion in the unit area of land use excepting agricultural planting land was finally calculated; see Figure 7.
3.3. Point Source Pollutant
Point source load is completely based on the survey statistics of industrial enterprises and sewage treatment plants in Baiyangdian lake shown in Table S1. Through the comprehensive collation of the environmental disclosure information of the key sewage discharge units in 2021 by the Baoding Municipal Bureau of Ecology and Environment, there were a total of 37 key enterprises in Dingxing County, 20 key enterprises in Anguo City, 17 key enterprises in Qingyuan District, 36 key enterprises in Boye County, 12 key enterprises in Laiyuan County, 69 key enterprises in Lixian County, 37 key enterprises in Lianchi District, 133 key enterprises in Mancheng, 30 key enterprises in Yixian County, 19 key enterprises in Gaobeidian, 20 key enterprises in the high-tech zone, 38 key enterprises in Jingxiu District, 29 key enterprises in Tang County, 61 key enterprises in Xushui District, 69 key enterprises in Zhuozhou City, 27 key enterprises in Laishui County, 14 key enterprises in Wangdu County, 66 key enterprises in Gaoyang County, and 26 key enterprises in Quyang County. After excluding unclear data, incorrect reporting, and production stoppages, the remaining 682 items of enterprise information were sorted out, of which about one third of the enterprises had no obvious sewage discharge. Thus, 254 pieces of point source discharge information were finally obtained. The calculated total amount of pollutant discharge from point sources in 2020 was calculated as 271.01 tons of total nitrogen, 21.49 tons of total phosphorus, and 1302.56 tons of COD. As the point source pollution loads were mainly based on collected data, we should note that the reliability and accuracy of released data must have a great impact on the calculation results.
3.4. Flux of Pollutants
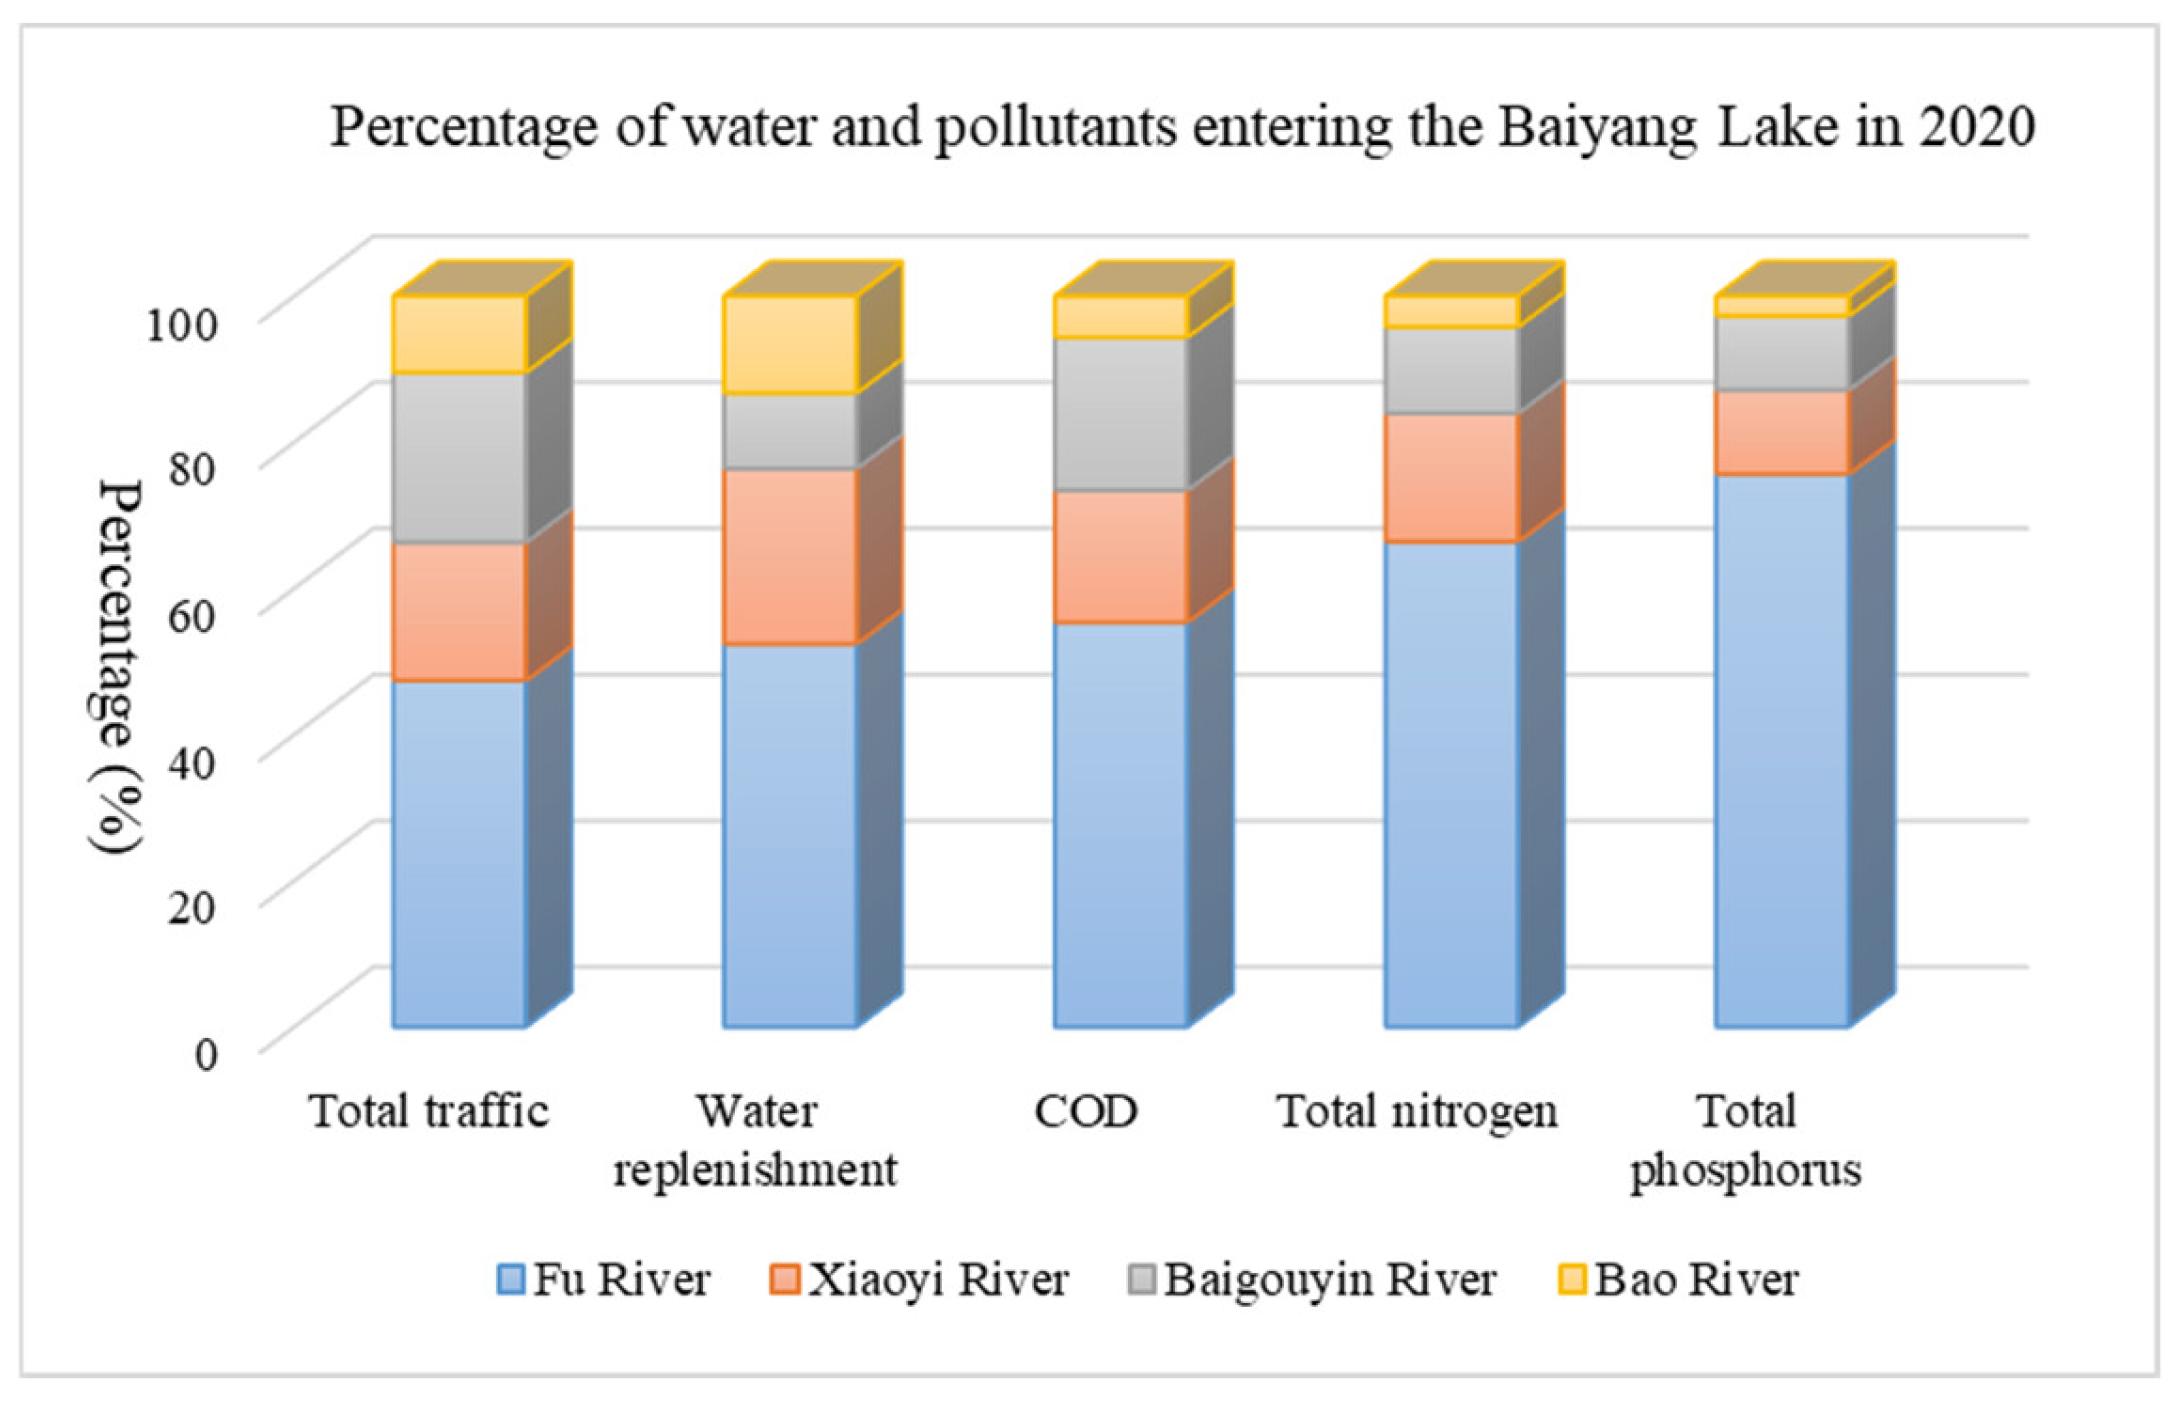
Based on the collected useful data, the total flux of nitrogen, phosphorus, and organic pollutants of the four rivers (Fu River, Xiaoyi River, Baigouyin River and Bao River) flowing into Baiyangdian lake in 2020 was calculated and summarized as shown in Table 4. It can be seen that Fu River delivered the largest amount of water into Baiyangdian lake, close to the sum of the other three rivers, as Fu River was filled with almost 87% upstream replenishment. Baigouyin River delivered 0.8 billion cubic meters of water to Baiyangdian lake in 2020, of which 35% came from upstream replenishment. Correspondingly, Fu River carried the most pollutants into Baiyangdian lake, with a total amount of 2813.3 tons of COD, 844.8 tons of total nitrogen, and 27.6 tons of total phosphorus, of which the input of COD, total nitrogen, and total phosphorus accounts for as much as 55.35%, 66.39%, and 75.64%, respectively, as shown in Table 4 and Figure 8. From the perspective of the water volume proportion, Fu River input 47.38% of the total water entering the Baiyangdian lake in 2020. It can be seen that the input proportion of each pollutant exceeded the proportion of water volume, indicating that the pollutants concentration transported by Fu River was higher than that of the other three rivers. A possible reason for this may be because there are more villages and farmland along the Fu River, especially in the section from east of Baoding City to Baiyangdian lake, resulting in more non-point source pollution dominated by nitrogen and phosphorus. The Bao River owned the best water quality, and the amount of each pollutant entering Baiyangdian lake was less than 10% of the total. Therefore, in general, the average pollutant content of Fu River was higher than that of the other three rivers, and should be given more attention for decreasing pollution.
4. Discussion
In the 1970s, the water quality of Baiyangdian Lake began to deteriorate gradually [45]; since the 1990s, it has become a typical eutrophic lake [46]. The inflow of Baiyangdian Lake dropped sharply from 2000 to 2015, and the deterioration of the water quality intensified, reaching a peak in 2012 and 2013. During this period, chemical oxygen demand, ammonia nitrogen, and total phosphorus were the main pollutants [47]. After 2015, the degree of eutrophication in Baiyangdian Lake has changed from moderate to mild. Especially following the establishment of Xiong’an New Area in 2017, the nutrient load from point sources in Biayangdian lake basin has been significantly reduced [8].
The calculated pollution load entering the lake from the basin is shown in Table 5. The loads of total nitrogen, total phosphorus, and COD were 1885.35 t, 140.01 t, and 5832.35 t, respectively. Compared with similar studies, the results of calculation in this study are basically within the range of results of similar studies (Table 6). According to the spatial distribution map of COD load in the Baiyangdian watershed calculated by Li et al. (2021) through the ECM method, it was estimated that the COD pollution potential of the four sub-basins in this study was about 7000–10,000 t [4]. Those results were higher than ours, probably because those studies focused on the pollution production potential, rather than the pollution load flowing into the lake.
The load ratio disclosed that the primary pollution sources of nitrogen, phosphorus, and organic pollutants were non-point sources, including agricultural and rural non-point sources, runoff, and soil erosion. The contribution rate of non-point sources all exceeded 70%. In Li et al. (2021), who calculated the results of pollution load in Baiyangdian lake basin in 2018, the proportion of total nitrogen load, total phosphorus load, and COD load of non-point sources were 77.11%, 86.93%, and 71.61%, respectively, which were close to the results of our study [4]. Zhao (2013) calculated the total nitrogen load of pollution sources in the Baiyangdian lake basin and found that the proportion of point source pollution loads decreased gradually [51]. With the establishment of Xiong’an New Area in 2017 and the tightening of environmental management policies, the quality of sewage from point sources has improved, and the discharge has been significantly less. As a result, the proportion of point source pollution loads has continued to decline.
Among all non-point sources, agricultural and rural non-point sources had the highest contribution rate of pollution load, all exceeding 50% for total nitrogen, total phosphorus, and COD. The pollution load of agricultural production and rural life activities imports large amounts of nitrogen and phosphorus into the environment, while extensive management methods lead to low utilization of those nutrients, making agricultural activities, especially agricultural planting activities, a huge potential source of nitrogen and phosphorus pollution [6]. The contribution rate to the total phosphorus load reaches were as high as 73.37%. The proportion of total phosphorus load was significantly higher than that of other pollutants, which may be due to the stricter restrictions on total phosphorus in industrial sewage and domestic sewage discharge standards and the large amount of phosphorus used in agricultural activities. Cui et al. (2011) found that the contribution rate of agricultural non-point sources in Baiyangdian lake basin to ammonia nitrogen, chemical oxygen demand, and other pollutants exceeded 50% [35]. Li et al. (2021) showed that the proportion of total nitrogen load, total phosphorus load, and COD load of agricultural and rural non-point sources were 50.63%, 52.03%, and 60.49%, respectively [4].
The load contribution of runoff to nitrogen, phosphorus, and organic pollutants was comparatively small, while the contribution of soil erosion to the total phosphorus was high, with a load ratio of 22.95%. The contribution rates of point source pollution to organic and phosphorus pollution were higher than that caused by runoff and soil erosion, reaching 22.33% and 15.35%, respectively. Normally, areas with low vegetation cover and farmland with only crops are prone to soil erosion occurring due to rainfall, which can cause dissolved pollutants and soil particles to contribute to agricultural non-point source pollution [29,53]. Thus, the total nitrogen and total phosphorus entering the Baiyangdian lake is mainly derived from agricultural non-point sources and corresponding soil erosion.
Non-point sources in agriculture and rural areas and point sources in enterprise sewage discharge are the main sources of COD in water bodies of Baiyangdian lake, accounting for 57.43% and 22.33% of the total COD, respectively. Among the non-point sources, livestock and poultry breeding in agricultural activities causes 70.16% of the COD pollution load, which is about 40% of the total COD load, as shown in Section 3.1 and Table 5. Thus, it is necessary to focus on the management of pollution discharge in breeding activities to reduce the total COD load entering Baiyangdian lake. In addition, industrial production activities produce sewage containing high concentrations of COD; thus, point source pollution is a main source for COD. However, the scale of pollution produced by industrial production is smaller than that from non-point agricultural sources (rural domestic sewage, aquaculture sewage, rainfall erosion, etc.), and the COD load was smaller than that of agricultural non-point sources.
Compared with the flux results of pollutants calculated by the LOADEST model with the inland four rivers in 2020, the load of total nitrogen, total phosphorus, and total COD from point source pollution and non-point source pollution (agriculture and rural areas pollution, runoff pollution, and soil erosion pollution) were significantly higher, at about 1.5 times, 3.8 times, and 1.15 times higher than the flux results, respectively. The main reason for the difference between the loads and the flux was the loss of pollutants in the process of migration and transportation, as the pollutants were gradually separated from the water body through decomposition, adsorption, sedimentation, and other self-purification processes. For example, ammonia nitrogen can be converted and absorbed through nitrification by microorganisms. Compared with total nitrogen, dissolved phosphorus is more likely to be adsorbed, precipitated, and separated from the water body, leading to a higher loss rate of total phosphorus in the process of long-distance transport [54]. Therefore, only about one third of the total phosphorus eventually entered Baiyangdian lake.
The non-point source pollution load in regions with significant spatial heterogeneity can be clarified from a global perspective using lumped non-point pollution models. It should be noted that although lumped models avoid describing the overcomplicated mechanisms that affect the implementation of the model, only the main influencing factors are used in the generalization process, which inevitably leads to deviations between the model results and reality. Further experiments need to be carried out in typical areas of Baiyangdian lake basin to optimize the pollution generation coefficient and river inflow coefficient of the ECM and to verify the applicability of RUSLE and PLOAD.
5. Conclusions
This study used the ECM model, RUSLE model, and LOADEST model to describe a systematic work for the identification of pollution released into Baiyangdian lake. It was calculated that a total nitrogen load of 1614.34 tons, total phosphorus load of 118.52 tons, and total COD load of 4529.79 tons were generated from non-point sources in the whole Baiyangdian lake basin in 2020. The primary pollution source was proven to be agricultural and rural pollution, with a load contribution rate exceeding 50%, of which the contribution rate to the total phosphorus load reached 73.37%. Among the sources of agricultural and rural pollution, the contribution rate of livestock and poultry breeding to COD exceeded 70%, while the contribution rate of agricultural planting to total phosphorus reached 73.12%. Among all the sub-basins, Dingzhou City, Tang County and Yi County were recognized as the most polluted areas, with the highest non-point source load in agriculture and rural areas. It was affirmed that Fu River delivered the most pollutants into the Baiyangdian lake, which should be paid attention to.
In conclusion, non-point source pollution was the main source of nitrogen, phosphorus, and COD. Such pollution sources are diverse and difficult to supervise and control. According to our study, agricultural activities, especially livestock and poultry breeding, had a relatively strong impact on water quality in Baiyangdian lake. Developing the ecological livestock breeding industry and realizing the resource recovery of livestock breeding manure would contribute to a harmonious environment. In order to ensure the environmental quality of Baiyangdian lake, it is necessary to strengthen the control of agricultural planting pollution discharge, standardize the pollution discharge of livestock and poultry breeding, and manage soil erosion and runoff with the aim of reducing the impact of pollution sources on eutrophication in Baiyangdian lake.
Supplementary Materials
The following supporting information can be downloaded at: https://www.mdpi.com/article/10.3390/w14213386/s1, Table S1. Data collection information; Table S2 Parameters sources used in RUSLE model; Figure S1. The soil type of Baiyangdian lake Basin; Figure S2. Non-point source pollution load of rural life in all districts and counties of the Baiyang Lake (a: Total nitrogen load; b: Total phosphorus load; c: COD load); Figure S3. Non-point source pollution load of livestock and poultry in various districts and counties of Baiyang Lake (a: Total nitrogen load; b: Total phosphorus load; c: COD load); Figure S4. Non-point source pollution load of agricultural planting in various districts and counties of Baiyang Lake (a: Total nitrogen load; b: Total phosphorus load; c: COD load).
Author Contributions
G.W.: Conceptualization, Data curation and analysis, Methodology, Writing—original draft preparation, Writing—review and editing. C.L.: Methodology, Writing—original draft preparation, Writing—review and editing. C.G.: Data analysis, Writing—review and editing. Y.Y.: Data investigation. Z.Y.: Data collection. Z.Z.: Data collection. C.T.: Conceptualization, Formal Calibration, Supervision, Writing—review. All authors have read and agreed to the published version of the manuscript.
Funding
This research was supported by the National Key R&D Program of China (No. 2018YFE0106500; 2021YFD1700500) and the National Natural Science Foundation of China (No.42071053).
Conflicts of Interest
The authors declare no conflict of interest.
References
- Yang, Y.; Gao, B.; Hao, H.; Zhou, H.; Lu, J. Nitrogen and phosphorus in sediments in China: A national-scale assessment and review. Sci. Total Environ. 2017, 576, 840–849. [Google Scholar] [CrossRef] [PubMed]
- Guan, Q.; Feng, L.; Hou, X.; Schurgers, G.; Zheng, Y.; Tang, J. Eutrophication changes in fifty large lakes on the Yangtze Plain of China derived from MERIS and OLCI observations. Remote Sens. Environ. 2020, 246, 111890. [Google Scholar] [CrossRef]
- Derolez, V.; Bec, B.; Munaron, D.; Fiandrino, A.; Pete, R.; Simier, M.; Souchu, P.; Laugier, T.; Aliaume, C.; Malet, N.; et al. Recovery trajectories following the reduction of urban nutrient inputs along the eutrophication gradient in French Mediterranean lagoons. Ocean Coast. Manag. 2019, 171, 1–10. [Google Scholar] [CrossRef] [Green Version]
- Li, Y.; Chen, H.; Sun, W. Load estimation and source apportionment of nitrogen, phosphorus and COD in the basin of Lake Baiyang. China Environ. Sci. 2021, 41, 366–376. [Google Scholar]
- Zhu, Y.; Wu, F.; He, Z.; Guo, J.; Qu, X.; Xie, F.; Giesy, J.P.; Liao, H.; Guo, F. Characterization of organic phosphorus in lake sediments by sequential fractionation and enzymatic hydrolysis. Environ. Sci. Technol. 2013, 47, 7679–7687. [Google Scholar] [CrossRef]
- Zhang, X.; Zhao, J.; Ding, L.; Li, Y.; Liu, H.; Zhao, Y.; Fu, G. Eutrophication evolution trajectory influenced by human activities and climate in the shallow Lake Gehu, China. Ecol. Indic. 2022, 138, 108821. [Google Scholar] [CrossRef]
- Bao, L.; Kang, H.Y.; Hu, X.G.; Zhang, N.M.; Zhao, X.T.; Xu, H.J. The load estimation of nitrogen and phosphorus from non- point sources in the Songhuaba reservoir watershed. Environ. Sci. Surv. 2015, 34, 1–6. [Google Scholar]
- Liu, S.C.; Wang, H.H.; Tian, K. Ecological environmental changes and influencing analysis in Baiyangdian Lake. J. Agro Environ. Sci. 2020, 39, 1060–1069. [Google Scholar]
- Zhu, A.; Liu, P.; Gong, Y.; Li, M.; Su, J.; Liu, G. Residual levels and risk assessment of tetrabromobisphenol A in Baiyang Lake and Fuhe river, China. Ecotoxicol. Environ. Saf. 2020, 200, 110770. [Google Scholar] [CrossRef] [PubMed]
- Li, W.; Shi, Y.; Gao, L.; Liu, J.; Cai, Y. Occurrence of antibiotics in water, sediments, aquatic plants, and animals from Baiyangdian Lake in North China. Chemosphere 2012, 89, 1307–1315. [Google Scholar] [CrossRef] [PubMed]
- Yang, L.; Wang, T.; Zhou, Y.; Shi, B.; Bi, R.; Meng, J. Contamination, source and potential risks of pharmaceuticals and personal products (PPCPs) in Baiyangdian Basin, an intensive human intervention area, China. Sci. Total Environ. 2020, 760, 144080. [Google Scholar] [CrossRef] [PubMed]
- Li, Y.; Ma, J.; Yang, Z.; Lou, I. Influence of non-point source pollution on water quality of Wetland Baiyangdian, China. Desalination Water Treat. 2011, 32, 291–296. [Google Scholar] [CrossRef]
- Yang, J.; Strokal, M.; Kroeze, C.; Ma, L.; Bai, Z.; Teurlincx, S.; Janssen, A.B.G. What is the pollution limit? Comparing nutrient loads with thresholds to improve water quality in Lake Baiyangdian. Sci. Total Environ. 2022, 807, 150710. [Google Scholar] [CrossRef]
- Sun, T.; Chen, J.; Wang, H.; Shi, Z.T. Study on non-point source pollution loads in villages along the Fuhe River, Baiyangdian watershed. Res. Environ. Sci. 2012, 25, 568–572. [Google Scholar]
- Shen, Z.; Zhong, Y.; Huang, Q.; Chen, L. Identifying non-point source priority management areas in watersheds with multiple functional zones. Water Res. 2015, 68, 563–571. [Google Scholar] [CrossRef] [PubMed]
- Chen, L.; Xu, J.; Wang, G.; Liu, H.; Zhai, L.; Li, S.; Sun, C.; Shen, Z. Influence of rainfall data scarcity on non-point source pollution prediction: Implications for physically based models. J. Hydrol. 2018, 562, 1–16. [Google Scholar] [CrossRef]
- Zhou, Z.; Li, J. The correlation analysis on the landscape pattern index and hydrological processes in the Yanhe watershed, China. J. Hydrol. 2015, 524, 417–426. [Google Scholar] [CrossRef]
- Chen, Y.; Xu, C.Y.; Chen, X.; Xu, Y.; Yin, Y.; Gao, L.; Liu, M. Uncertainty in simulation of land-use change impacts on catchment runoff with multi-timescales based on the comparison of the HSPF and SWAT models. J. Hydrol. 2019, 573, 486–500. [Google Scholar] [CrossRef]
- Uribe, N.; Corzo, G.; Quintero, M.; van Griensven, A.; Solomatine, D. Impact of conservation tillage on nitrogen and phosphorus runoff losses in a potato crop system in Fuquene watershed, Colombia. Agric. Water Manag. 2018, 209, 62–72. [Google Scholar] [CrossRef]
- Zema, D.A.; Lucas-Borja, M.E.; Carrà, B.G.; Denisi, P.; Rodrigues, V.A.; Ranzini, M.; Soriano Arcova, F.C.; de Cicco, V.; Zimbone, S.M. Simulating the hydrological response of a small tropical forest watershed (Mata Atlantica, Brazil) by the AnnAGNPS model. Sci. Total Environ. 2018, 636, 737–750. [Google Scholar] [CrossRef] [Green Version]
- Li, P.; Lu, J.; Hou, W.; Pan, Y.; Wang, Y.; Khan, M.R.; Ren, T.; Cong, R.; Li, X. Reducing nitrogen losses through ammonia volatilization and surface runoff to improve apparent nitrogen recovery of double cropping of late rice using controlled release urea. Environ. Sci. Pollut. Res. 2017, 24, 11722–11733. [Google Scholar] [CrossRef]
- Ouyang, W.; Gao, X.; Wei, P.; Gao, B.; Lin, C.; Hao, F. A review of diffuse pollution modeling and associated implications for watershed management in China. J. Soils Sediments 2017, 17, 1527–1536. [Google Scholar] [CrossRef]
- Adu, T.J.; Kumarasamy, M.V. Assessing Non-Point Source Pollution Models: A Review. Pol. J. Environ. Stud. 2018, 27, 1913–1922. [Google Scholar] [CrossRef]
- Rong, Q.; Cai, Y.; Chen, B.; Yue, W.; Yin, X.; Tan, Q. An enhanced export coefficient based optimization model for supporting agricultural nonpoint source pollution mitigation under uncertainty. Sci. Total Environ. 2017, 580, 1351–1362. [Google Scholar] [CrossRef] [PubMed]
- Shen, Z.; Hong, Q.; Chu, Z.; Gong, Y. A framework for priority non-point source area identification and load estimation integrated with APPI and PLOAD model in Fujiang Watershed, China. Agric. Water Manag. 2011, 98, 977–989. [Google Scholar] [CrossRef]
- Johnes, P.J. Evaluation and management of the impact of land use change on the nitrogen and phosphorus load delivered to surface waters: The export coefficient modelling approach. J. Hydrol. 1996, 183, 323–349. [Google Scholar] [CrossRef]
- Ongley, E.D.; Zhang, X.; Yu, T. Current status of agricultural and rural non-point source pollution assessment in China. Environ. Pollut. 2010, 158, 1159–1168. [Google Scholar] [CrossRef] [PubMed]
- Wischmeier, W.H.; Smith, D.D. Predicting Rainfall Erosion Losses: A Guide to Conservation Planning. Agriculture Handbook; United States Department of Agriculture, United States Government Printing Office: Washington, DC, USA, 1978.
- Chen, H.; Teng, Y.; Wang, J. Load estimation and source apportionment of nonpoint source nitrogen and phosphorus based on integrated application of SLURP model, ECM, and RUSLE: A case study in the Jinjiang River, China. Environ. Monit. Assess. 2013, 185, 2009–2021. [Google Scholar] [CrossRef] [PubMed]
- Zhang, W.; Fu, J. Rainfall Erosivity Estimation Under Different Rainfall Amount. Resour. Sci. 2003, 1, 35–41. [Google Scholar]
- USEPA. Compendium of Tools for Watershed Assessment and TMDL Development; U.S. Environmental Protection Agency: Washington, DC, USA, 1997.
- USEPA. PLOAD Version 3.0: An ArcView GIS Tool to Calculate Nonpoint Sources of Pollution in Watershed and Stormwater Projects; U.S. Environmental Protection Agency: Washington, DC, USA, 2001.
- Kang, M.; Yoo, C. Application of the SCS-CN Method to the hancheon basin on the volcanic Jeju Island, Korea. Water 2020, 12, 3350. [Google Scholar] [CrossRef]
- Li, J.C. Simulation of Non-Point Source Pollution Load in Jialing River Basin; Chongqing University: Chongqing, China, 2007. [Google Scholar]
- Cui, H.M. Analysis on effect of agricultural non-point source pollution on the water environment in Baiyangdian basin. Mod. Agric. Sci. Technol. 2011, 7, 298–300. [Google Scholar]
- Park, Y.S.; Engel, B.A. Analysis for regression model behavior by sampling strategy for annual pollutant load estimation. J. Environ. Qual. 2015, 44, 1843–1851. [Google Scholar] [CrossRef] [PubMed]
- Duan, W.; Takara, K.; He, B.; Luo, P.; Nover, D.; Yamashiki, Y. Spatial and temporal trends in estimates of nutrients and suspended sediment loads in the Ishikari River, Japan, 1985 to 2010. Sci. Total Environ. 2013, 461–462, 499–508. [Google Scholar] [CrossRef] [PubMed]
- Cohn, T.A.; Delong, L.; Gilroy, E.J. Estimating constituent loads. Water Resour. Res. 1989, 25, 937–942. [Google Scholar] [CrossRef]
- Cohn, T.A.; Gilroy, E.J.; Baier, W.G. Estimating Fluvial Transport of Trace Constituents Using a Regression Model with Data Subject to Censoring; Joint Statistical Meeting: Boston, MA, USA, 1992; pp. 142–151. [Google Scholar]
- Powell, J.L. Least absolute deviations estimation for the censored regression model. J. Econom. 1984, 25, 303–325. [Google Scholar] [CrossRef]
- Chen, T.; Xia, J.; Zou, L.; Yan, Q. Spatiotemporal variations of NDVI of different vegetation types in the Baiyangdian Basin under the background of climate change. Resour. Sci. 2021, 43, 1248–1259. [Google Scholar] [CrossRef]
- Wu, X.H.; Wang, S.J.; Peng, J.Q. Hebei Economic Yearbook China; China Statistics Press: Beijing, China, 2018. [Google Scholar]
- Ouyang, W.; Wu, Y.; Hao, Z.; Zhang, Q.; Bu, Q.; Gao, X. Combined impacts of land use and soil property changes on soil erosion in a mollisol area under long-term agricultural development. Sci. Total Environ. 2018, 613–614, 798–809. [Google Scholar] [CrossRef] [PubMed]
- Meng, B.; Zhi, X.; Wang, C.; Yin, S.; Zhou, Y.; Zhao, Q. Remote sensing monitoring of dry river beds in Baiyangdian Lake Basin. Sci. Technol. Eng. 2022, 22, 3827–3833. [Google Scholar]
- Cui, X. Investigation of Eutrophication Pollution Sources in Baiyangdian Lake. Environ. Ecol. 1995, 16, 17–18. [Google Scholar]
- Liu, X.; Shi, B.; Meng, J.; Zhou, Y.Q.; Ke, X.; Wang, T.Y. Spatio-temporal variation characteristics of water eutrophication and sediment pollution in Baiyangdian Lake. Environ. Sci. 2019, 41, 2127–2136. [Google Scholar]
- Zhao, X.; Zhang, X. Study on policy tool selection in water pollution control in Xiong’an New Area—based on the policy text of Baiyangdian Basin (1984–2018). J. Party Sch. CPC Ningbo Munic. Comm. 2019, 41, 103–111. [Google Scholar]
- Zhang, H.; Xi, B.; Gao, R.; Jiang, L.; Wang, J.; Xu, Q. Water environmental capacity accounting and upstream capacity allocation of Baiyangdian Lake. J. Environ. Eng. Technol. 2012, 2, 313–318. [Google Scholar]
- Zhu, M. Study on Agricultural NPS Loads of Haihe Basin and Assessment on its Environmental Impact; Chinese Academy of Agricultural Sciences: Beijing, China, 2011. [Google Scholar]
- Shi, J. Characteristics of Agricultural Non-Point Source Pollution and Farmland Nutrient Management in the Plain Area of Baiyangdian Watershed; Beijing Normal University: Beijing, China, 2012. [Google Scholar]
- Zhao, Z. Simulation Study of TN Load in Baiyangdian Basin Based on the SWAT Model. Water Sci. Eng. Technol. 2013, 3, 33–37. [Google Scholar]
- Zhang, X.; Yi, Y.; Liu, H.; Yang, Z. Modelling nutrient loadings to the Baiyangdian Lake under the background of urbanization. Acta Ecol. Sin. 2021, 41, 7521–7529. [Google Scholar]
- Wen, G.C.; Zhao, M.J.; Xie, H.B.; Zhang, Y.; Zhang, J. Analysis of land vegetation cover evolution and driving forces in the western part of the Ili River Valley. Arid. Zone Res. 2021, 38, 843–854. [Google Scholar]
- Trolle, D. The Influence of Sediment Nutrient Dynamics on the Response of Lake Ecosystems to Restoration and Climate Change; University of Waikato: Hamilton, New Zealand, 2009. [Google Scholar]
Figure 1.
The research area of Baiyangdian lake basin.

Figure 2.
The sub-basin division of Baiyangdian lake basin.

Figure 3.
Calculation results of parameters in RUSLE model in the study area: (a) Rainfall erosion, (b) Soil erosion factor, (c) Topographic factor, (d) Soil and water conservation factor, (e) Vegetation cover factor, (f) Land use type.
Figure 3.
Calculation results of parameters in RUSLE model in the study area: (a) Rainfall erosion, (b) Soil erosion factor, (c) Topographic factor, (d) Soil and water conservation factor, (e) Vegetation cover factor, (f) Land use type.

Figure 4.
Coefficient parameters of rainfall in the study area: (a) Runoff curves (CN), (b) Ground runoff (Q), (c) Runoff coefficient.
Figure 4.
Coefficient parameters of rainfall in the study area: (a) Runoff curves (CN), (b) Ground runoff (Q), (c) Runoff coefficient.


Figure 5.
The total load of non-point source pollution in agriculture and rural areas in Baiyangdian lake: (a) Total nitrogen load, (b) Total phosphorus load, (c) COD load.
Figure 5.
The total load of non-point source pollution in agriculture and rural areas in Baiyangdian lake: (a) Total nitrogen load, (b) Total phosphorus load, (c) COD load.

Figure 6.
Adsorption pollutant loads from soil erosion in Baiyangdian lake: ((a) Soil organic matter, (b) Adsorbed nitrogen, (c) Adsorbed phosphorus.
Figure 6.
Adsorption pollutant loads from soil erosion in Baiyangdian lake: ((a) Soil organic matter, (b) Adsorbed nitrogen, (c) Adsorbed phosphorus.


Figure 7.
Dissolved pollutant load of rainfall per unit: (a) Total nitrogen load, (b) Total phosphorus load, (c) COD load.
Figure 7.
Dissolved pollutant load of rainfall per unit: (a) Total nitrogen load, (b) Total phosphorus load, (c) COD load.


Figure 8.
Percentage of water and pollutants entering Baiyangdian lake in 2020.


Table 1.
Non-point source loads in agricultural and rural areas.
| Pollutant | Amount (t) | Percentage(%) | ||
|---|---|---|---|---|
| Rural Life | Livestock and Poultry Breeding | Agricultural Cultivation | ||
| Total nitrogen | 1073.82 | 38.48 | 29.59 | 31.93 |
| Total phosphorus | 102.72 | 7.93 | 18.95 | 73.12 |
| COD | 3349.33 | 18.15 | 70.16 | 11.69 |
Table 2.
The load of adsorbed pollutants generated by soil erosion.
| River into Baiyangdian Lake | Load of Adsorbed Pollutants Generated by Soil Erosion (t/a) | ||
|---|---|---|---|
| COD | Total Nitrogen | Total Phosphorus | |
| Bao River | 19.9 | 1.0 | 0.6 |
| Fu River | 585.9 | 27.5 | 15.3 |
| Baigouyin River | 495.4 | 56.4 | 2.6 |
| Xiaoyi River | 161.7 | 9.2 | 2.2 |
| Total | 1262.9 | 94.1 | 20.8 |
Table 3.
Non-point source pollution load of rainfall.
| Pollutant | Fu River | Baigouyin River | Bao River | Xiaoyi River | Surrounding | Total |
|---|---|---|---|---|---|---|
| Total nitrogen (t/a) | 38.80 | 37.88 | 1.72 | 27.20 | 2.31 | 107.91 |
| Total phosphorus(t/a) | 1.34 | 1.10 | 0.04 | 0.93 | 0.05 | 3.47 |
| COD (t/a) | 201.74 | 199.43 | 8.54 | 144.14 | 11.09 | 564.94 |
Table 4.
The amount of water and pollutants entering Baiyangdian lake in 2020.
| River into the Baiyangdian Lake | Total Traffic (100 Million Cubic Meters) | Water Replenishment (100 Million Cubic Meters) | The Total Amount of Pollutants (t) | ||
|---|---|---|---|---|---|
| COD | Total Nitrogen | Total Phosphorus | |||
| Fu River | 1.63 | 1.42 | 2813.3 | 844.8 | 27.6 |
| Xiaoyi River | 0.65 | 0.65 | 919.1 | 223.6 | 4.2 |
| Baigouyin River | 0.80 | 0.28 | 1063.2 | 150.5 | 3.7 |
| Bao River | 0.36 | 0.36 | 286.7 | 53.6 | 0.99 |
| Total | 3.44 | 2.71 | 5082.3 | 1272.5 | 36.5 |
Table 5.
The load of total pollutants entering Baiyangdian lake.
| Load Sources | Total Nitrogen | Total Phosphorus | Total COD | |||
|---|---|---|---|---|---|---|
| Amount (t) | Percentage (%) | Amount (t) | Percentage (%) | Amount (t) | Percentage (%) | |
| Point pollutants | 271.01 | 14.37 | 21.49 | 15.35 | 1302.56 | 22.33 |
| Agriculture and rural life | 1073.82 | 56.96 | 102.72 | 73.37 | 3349.33 | 57.43 |
| Runoff | 107.91 | 5.72 | 3.47 | 2.48 | 564.94 | 9.69 |
| Soil erosion | 432.61 | 22.95 | 12.33 | 8.81 | 615.52 | 10.55 |
| Total | 1885.35 | 140.01 | 5832.35 | |||
| Flux of pollutants | 1272.5 | - | 36.5 | - | 5082.3 | - |
Table 6.
The comparison of total pollutants load entering Baiyangdian lake.
| Total Nitrogen (t) | Total Phosphorus (t) | Year | Reference |
|---|---|---|---|
| 2123 | 175 | 1992 | Cui, 1995 [45] |
| 1966 | - | 2007 | Zhang et al., 2012 [48] |
| 3463 | 405 | 2007 | Zhu, 2011 [49] |
| 1234 | 97 | 2008 | Shi, 2012 [50] |
| 1356 | - | 2005–2010 | Zhao, 2013 [51] |
| 2018 | 313 | 1995–2015 | Zhang et al., 2021 [52] |
Publisher’s Note: MDPI stays neutral with regard to jurisdictional claims in published maps and institutional affiliations. |
© 2022 by the authors. Licensee MDPI, Basel, Switzerland. This article is an open access article distributed under the terms and conditions of the Creative Commons Attribution (CC BY) license (https://creativecommons.org/licenses/by/4.0/).
Share and Cite
MDPI and ACS Style
Wang, G.; Lv, C.; Gu, C.; Yu, Y.; Yang, Z.; Zhang, Z.; Tang, C. Pollutants Source Assessment and Load Calculation in Baiyangdian Lake Using Multi-Model Statistical Analysis. Water 2022, 14, 3386. https://doi.org/10.3390/w14213386
AMA Style
Wang G, Lv C, Gu C, Yu Y, Yang Z, Zhang Z, Tang C. Pollutants Source Assessment and Load Calculation in Baiyangdian Lake Using Multi-Model Statistical Analysis. Water. 2022; 14(21):3386. https://doi.org/10.3390/w14213386
Chicago/Turabian StyleWang, Guangwei, Cuicui Lv, Congke Gu, Yang Yu, Zhenglun Yang, Zhixiong Zhang, and Changyuan Tang. 2022. "Pollutants Source Assessment and Load Calculation in Baiyangdian Lake Using Multi-Model Statistical Analysis" Water 14, no. 21: 3386. https://doi.org/10.3390/w14213386
Note that from the first issue of 2016, this journal uses article numbers instead of page numbers. See further details here.