
Seasonal Water Quality Changes and the Eutrophication of Lake Yilong in Southwest China


Institute for Ecological Research and Pollution Control of Plateau Lakes, School of Ecology and Environmental Science, Yunnan University, Kunming 650500, China
*
Author to whom correspondence should be addressed.
Water 2022, 14(21), 3385; https://doi.org/10.3390/w14213385
Submission received: 8 September 2022
/
Revised: 20 October 2022
/
Accepted: 22 October 2022
/
Published: 25 October 2022
(This article belongs to the Special Issue Plateau Lake Water Quality and Eutrophication: Status and Challenges)
Abstract
:To better understand the seasonal variation characteristics and trend of water quality in Lake Yilong, we monitored water quality parameters and measured nutrients, including the water temperature (WT), Chlorophyll-a (Chl-a), dissolved oxygen (DO) and pH from September 2016 to May 2020, total nitrogen (TN) and total phosphorus (TP) from October 2016 to August 2018. The results showed that the lake water was well mixed, resulting in no significant thermal stratification. The DO content was decreased in the northwest part of the lake during September and October, resulting in a hypoxic condition. It also varied at different locations of the lake and showed a high heterogeneity and seasonal variability. The Chl-a concentration in Lake Yilong demonstrated seasonal and spatial changes. It was maximum at the center and southwest area of the lake in January. However, in the northwest part of the lake, the maximum value appeared in September and October. The content of TN in the rainy season increased by 75% compared with that in dry season and TP content show a downward trend (from 0.11 mg/L to 0.05 mg/L). The comprehensive nutrition index evaluation shows that the water quality of Lake Yilong in 2016 was middle eutrophic (TLI = 60.56), and that in 2017 (TLI = 56.05) and 2018 (TLI = 56.38) was weak eutrophic, showing that the nutritional status has improved. TN remained at a high level (2.15 ± 0.48 mg/L), water quality needs further improvement. Based on our monitoring and analysis, it is recommended that human activities in the watershed of the lake should be constrained and managed carefully to maintain the water quality of the lake and adopt effective water quality protection and ecological restoration strategies and measures to promote continuous improvement of water quality, for a sustainable social development.
1. Introduction
Lakes are an important inland water ecosystem with irreplaceable ecological functions, social benefits and economic value [1]. However, in recent decades, increased human activities have seriously affected the ecosystem of lakes, leading to a rapid deterioration in their water quality. Some lakes have such serious water pollution that it exceeds the carrying capacity of the lake itself. These changes reduce or even degrade the ecosystem of lakes, making them lose their adjustment ability. The spatial and temporal changes in the water quality parameters can directly reflect the water conditions of a lake, especially lake trophic status [2]. For example, Ndungu et al. [3] studied two lakes with different depths close to the equator, and the results showed that, being a shallow tropical lake, the mean water temperature in Lake Naivasha did not vary much between the sites. However, another lake in that study, Crescent Lake, showed lower temporal variability [3]. In lake Arrowhead, an oligotrophic alpine lake in southern California, strong thermal stratification during summer and early fall resulted in hypoxic hypolimnetic waters with dissolved oxygen [4]. In another example, it was found, by studying the seasonal variation of chl-a concentration in the Bay of Bengal, that in summer it is shown that the input of river nutrients, the reflux of nutrient water in the Arabian Sea and the coastal upwelling are the three main driving factors controlling the chl-a concentration in the surface layer [5]. István et al. [6] evaluated the changes in trophic conditions from 1985 to 2017 in the largest shallow freshwater lake in Central Europe, Lake Balaton, it is concluded that a drastic reduction in external phosphorus loads arriving in similar shallow lakes will lead to the eutrophication of lakes, although the time interval is very long [6].
Eutrophication is one of the most important and concerning water quality problems in freshwater ecosystems. The occurrence of water eutrophication is mainly caused by the increase of nitrogen, phosphorus and other nutrients in the water. The trophic level index (TLI) method is used to evaluate and select representative algae that can reflect the reservoir comprehensive index of quantity evaluation of chlorophyll a as the dominant factor parameters, TN, TP and other four indicators are used as water eutrophication assessment basic factor of price. TLI has been widely used to assess the nutritional status of lakes, such as Lake Wuliangsuhai [7] and Lake Chenghai [8].
In Yunnan-Guizhou Plateau, one of China’s five lake distribution areas, there are many natural lakes with serious pollution. According to statistics, Lake Dian, Lake Qilu, Lake Xingyun, and Lake Yilong in Yunnan’s plateau lakes are already in a eutrophication state, and the water quality of other lakes is not optimistic either [9,10]. Due to the aggravating pollution conditions, many scholars have investigated issues associated with lake pollution and proposed several treatment strategies. Zhang et al. [11] suggested that with the continuous eutrophication of Plateau Lake and excessive social-economic developments in the watershed, the lake’s natural material sedimentation process has been interrupted, and its self-purification function has been lost, causing serious threats to water resources [11]. Through the qualitative and quantitative analysis of the organic matter in the sediments, it is found that the organic matter in the sediments of Yilong lake is mainly self-sustaining, and the macrophytes are absolutely dominant [12]. In this lake, the coverage rate of aquatic vegetation is high (about 60%), as in the northwest of the lake, submerged plants are flourishing (slightly swampy), forming a “grass lake area”. In the east, the submerged plants are less distributed, and the algae density is high, forming an “algal lake area”. The species of phytoplankton in Lake Yilong are mainly cyanobacteria that are easy to reproduce in the eutrophic water. Liu et al. [13] investigated the water quality and eutrophication of Lake Yilong and showed that the change in Chl-a concentration since 1980 was mainly driven by the long-term accumulation of nutrients in the lake, especially the effects of TP on the increase of algae biomass [14]. Further, an increase in temperature has been shown to further aggravate the effects on phytoplankton biomass [13].
Lake Yilong is an important water source for the neighboring Shiping and Jianshui counties. However, lagging environmental protection, economic development, population growth, urbanization and human activities are continuously affecting the lake and its ecosystem. A lack of awareness on environmental protection has led to eutrophication of lakes, decline in their water level, swamping, ecosystem degradation and more. However, most studies performed on Lake Yilong mainly focused on analyzing the reasons from the status quo and proposed countermeasures [15,16], lake area wetland protection [17], fish industry [18,19], wetland sustainability evaluation [20,21], investigated lake sediment proxy indicators, etc., and few analyses have done on the seasonal changes of water quality parameters to uncover the most fundamental causes of lake pollution [22]. As the lake area continues shrinking and the area of plants continues expanding, the water volume and quality of Lake Yilong will undoubtedly continue to deteriorate. Quantitative determination of the water quality of Lake Yilong is therefore an urgent task. In view of the above situation, this study comprehensively analyzed the water quality parameters of Lake Yilong, using indicators such as water temperature, chlorophyll a concentration, dissolved oxygen concentration, and pH value. We also combined the total nitrogen (TN) and total phosphorus (TP) concentrations at various sites and different months to obtain an overall understanding of the nutrition levels and water quality of water bodies at different areas of the lake, and the trophic level index (TLI) is applied to evaluate water quality quantitatively, providing a scientific basis for the evaluation of the nutritional status of Lake Yilong and water quality management.
2. Materials and Methods
2.1. Overview of the Study Area
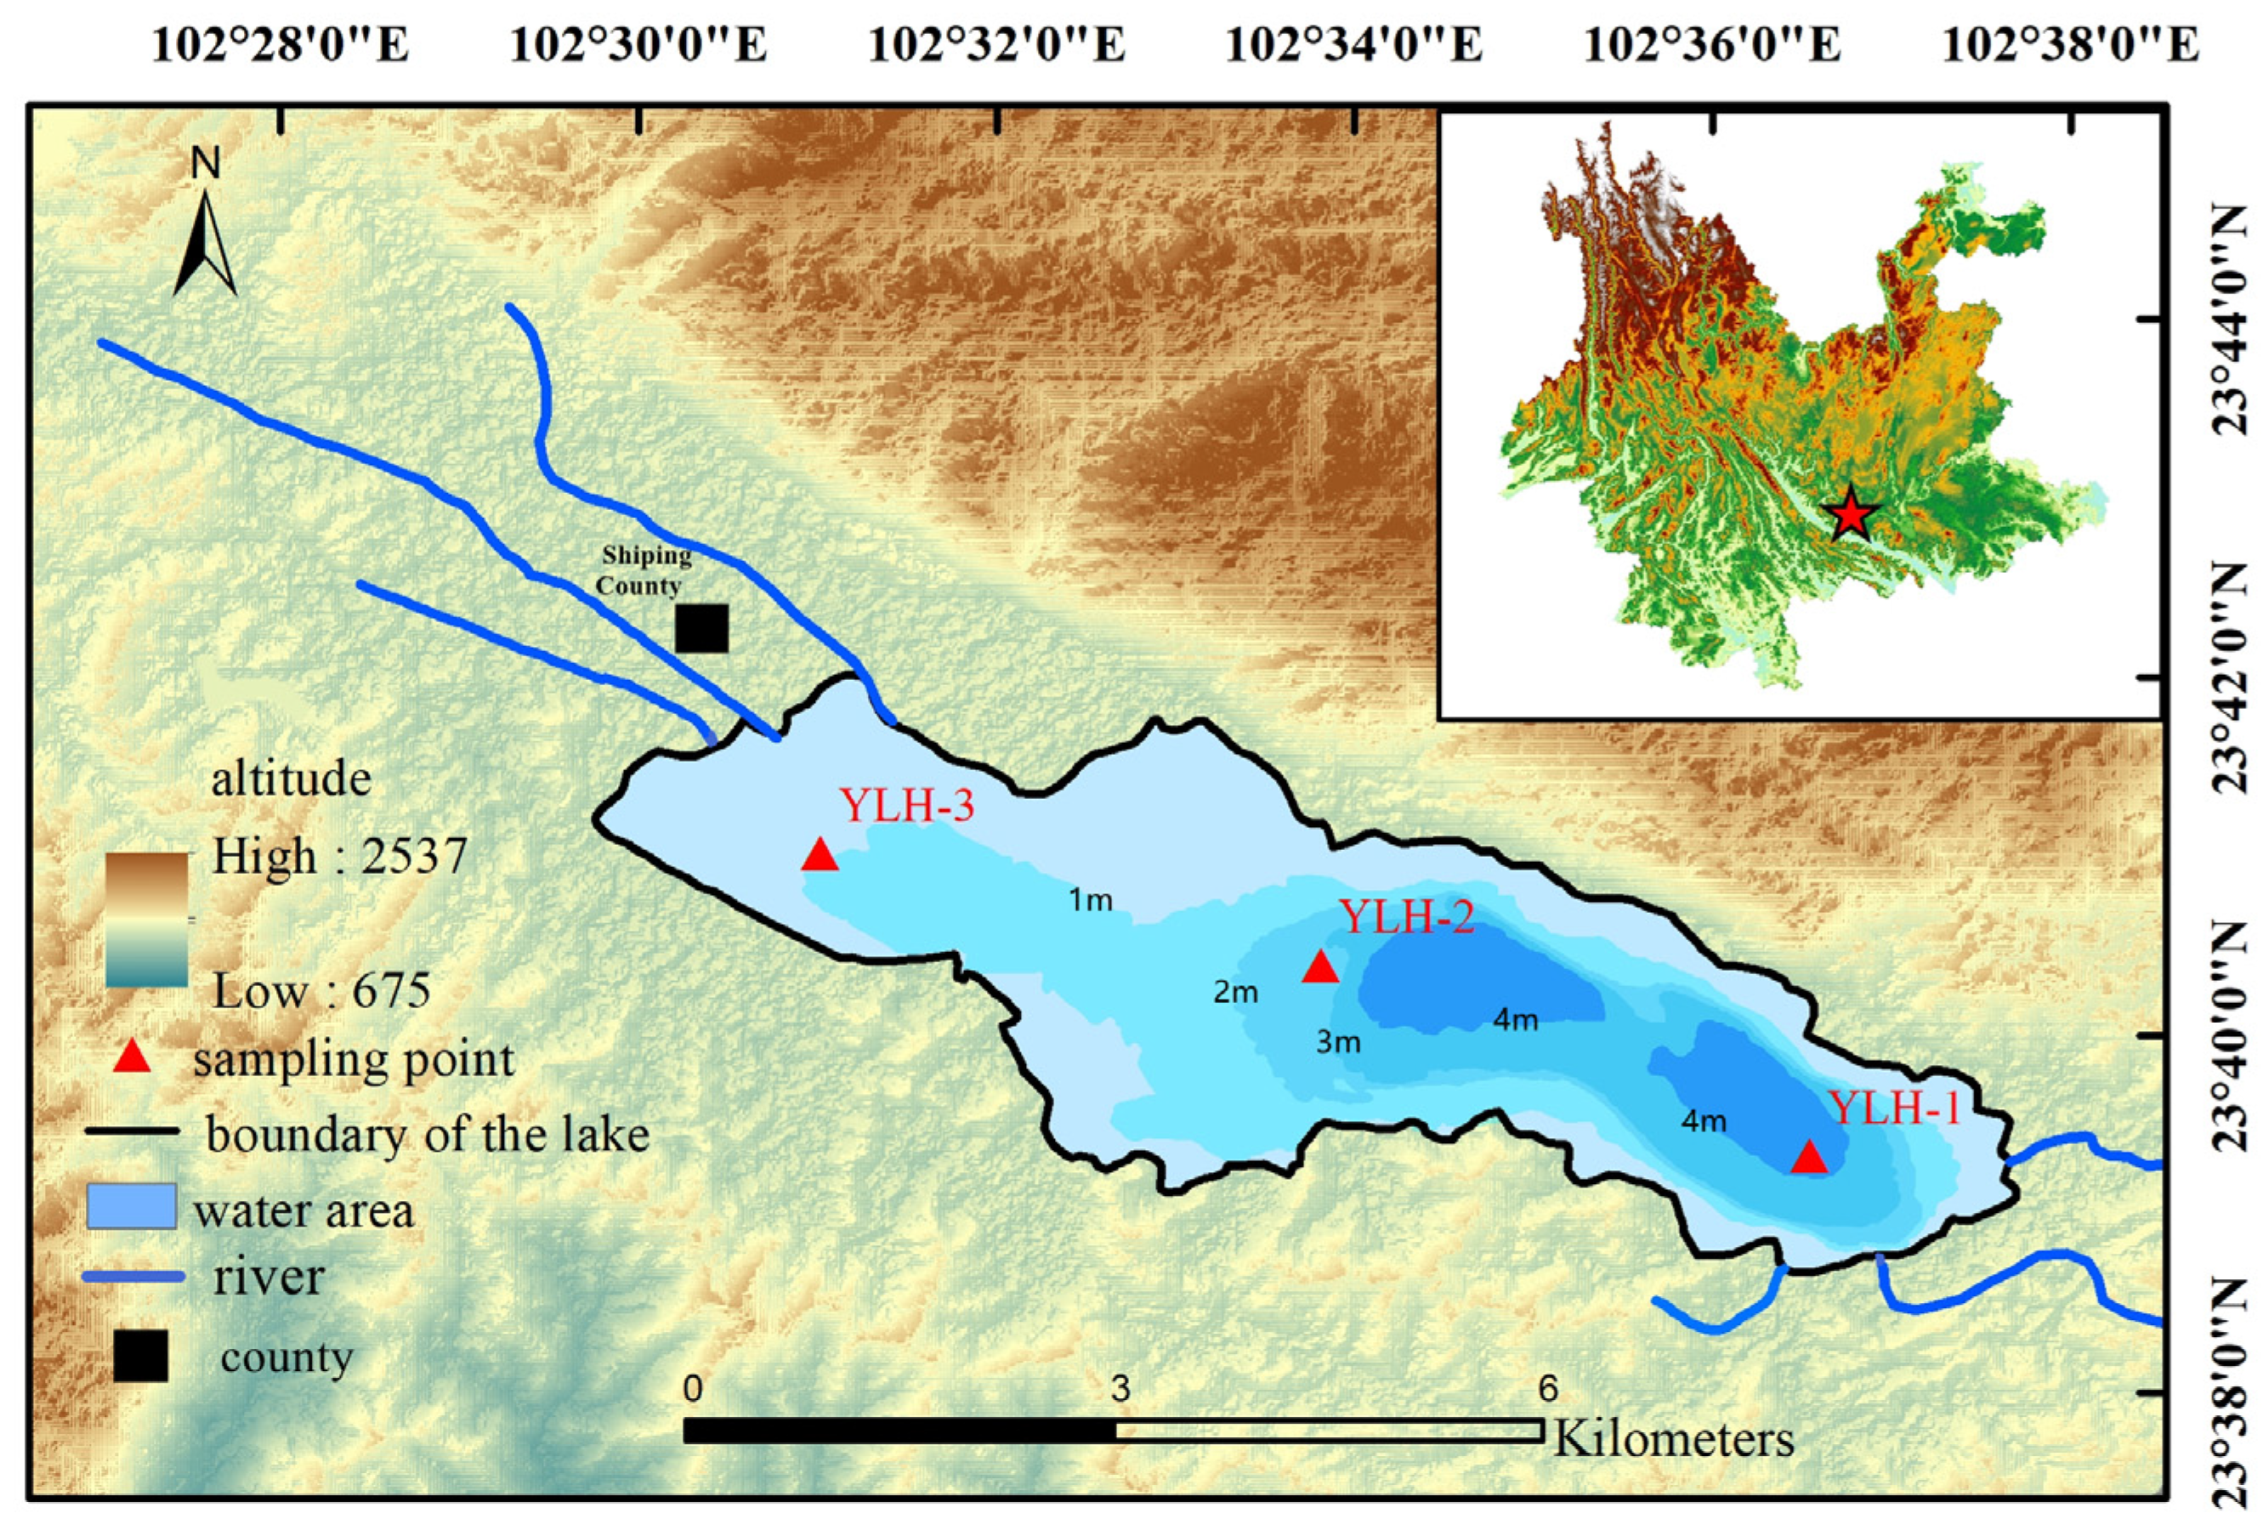
Lake Yilong is located in the Shiping County of Yunnan Province, southwestern China, with geographical coordinates of 23°39′–23°42′ N and 102°30′–102°38′ E. Lake Yilong belongs to Nanpanjiang River system of pearl River Basin. The Landsat5 TM satellite data on 3 November 2009, showed that Lake Yilong had an area of 33.87 km2 and a drainage area of 337.56 km2, but as of April 2013, the lake area decreased by more than half, to only 12.23 km2, reflecting the impact of climate conditions and human activities on the lake.
Climatically, Lake Yilong belongs to the northern subtropical dry monsoon and mid-tropical semi-humid climate zone. It is characterized by distinct dry and wet seasons, large daily temperature variations and small annual temperature differences. The rainy season lasts from May to October, while the dry season is from November to April of the following year. Lake Yilong has an average annual precipitation of 919.9 mm, maximum annual precipitation of 1160.4 mm and annual minimum precipitation of 613.2 mm. The lake water is mainly supplied by precipitation, surface runoff and groundwater. Among the surface runoff, only the surrounding moats supply perennial water, while the others are seasonal rivers. The initial watercourse was from the Xinjiehai River, which flows eastward through Jianshui and joins the Lu River. As the water level of Lake Yilong has dropped and the riverbed of Xinjiehai River has risen, Lake Yilong has become a shallow lake with no outflow [19]. In addition, there are 22 springs around the lake, most of which are located on the west bank, which are also important sources of lake water. The aquatic plants in Lake Yilong are prosperous, and the submerged plants are mainly Potamogeton lucens Linn, Potamogeton wrightii Morong, and Hydrilla verticillata, distributed throughout the lake. According to the water quality monitoring of Lake Yilong by the Honghe Prefecture Environmental Monitoring Station of the Environmental Protection Department of Yunnan Province, the water quality of the lake is poor, graded as category V. The water quality is heavily polluted and does not meet the requirements of Category III water environment criteria, with the lake being in a moderately eutrophic state. Its degree of swamping has been intensified, water depth is becoming shallower, and biodiversity is being seriously threatened [23].
2.2. Measurements and Sampling
Based on the shape and hydrological condition of the lake, 3 monitoring sites were set up in the southeast (YLH-1), center (YLH-2) and northwest (YLH-3) section of the lake, YLH-1 is the deepest and near Shiping County, YLH-3 is the shallowest (Figure 1). To investigate the water quality changes and causes in different areas of Lake Yilong, the lake was monitored and sampled from September 2016 to October 2017, after which the sampling time was randomly selected (January, March, Jun., and July, in 2018, while May, and November in 2020). The measurement was conducted once a month at the sampling point to understand the dynamic change of water quality. A complete year of data was used to identify seasonal variation characteristics, and other random sampling data were used to understand the lake’s water quality dynamics. Through 20 times of monitoring and sampling at 3 points, we obtained approximately 1200 datasets (nutrients to environmental factors). To investigate the water quality parameter seasonal variation pattern at different depths and times, we averaged the data at 3 points using intervals of one meter.
This study used a multi-parameter water quality analyzer (instrument model: YSI-6600V2, produced in the USA) for continuous on-site measurement. The instrument was calibrated before monitoring. During on-field investigations, the instrument was placed vertically in the lake to gradually measure and collect samples at a uniform speed. If necessary, the handle was connected to a cable to perform the reception of water quality parameters, including water temperature, pH, dissolved oxygen, conductivity, turbidity and chlorophyll a, at the indicated monitoring site. The instrument was cross-calibrated before each test to ensure data reliability and accuracy. The water was sampled using a low-temperature incubator and transported back to the laboratory on the same day. In addition, the monitoring of total nitrogen (TN) and total phosphorus (TP) in the water was performed following the Chinese standard method (“Water and Wastewater Monitoring and Analysis Method” Fourth Edition, China Environmental Science Press) [24]. The TN and TP were measured by a UV-spectrophotometer (UV-2600). TN was determined using an alkaline potassium persulfate digestion-UV spectrophotometric method (GB11894–89) at wavelengths of 220 nm and 275 nm, and the ammonium molybdate spectrophotometric method (GB11893–89) at wavelengths of 700 nm for TP [25,26].
2.3. Water Quality and Trophic State Assessment
The trophic level index (TLI), which reflecting lake trophic status [27] was used to evaluate the water quality of Lake Yilong. The aggregated TLI is calculated as the sum of individual TLIs, which are calculated according to lake and reservoir eutrophication evaluation methods and grading technical regulations, TN, TP, permanganate index (CODMn), DO, Chl-a, and Secchi disk transparency (SD) are the main indicators of nutrient levels in water [28,29]. Among them, the TLI is given as:
where TLI (∑) is the integrated trophic level index, TLI(j) is the trophic level index of j, and Wj represents the weighting factor for the WQ parameter, including Chl-a, TN, TP, SD, and CODMn (j = 1, 2, 3, 4, 5).
where Wj is the correlative weighted score for the trophic level index of j and rij is a relative coefficient.
In Chinese lakes and reservoirs, the correlation coefficient for Chl-a to other parameters is presented in Table 1 [30], and the TLI ranges and corresponding trophic status are shown in Table 2.
The computational formula for each eutrophication index is:
TLI(Chl-a) = 10(2.5 + 1.086 ln Chl-a)
TLI(TP) = 10(9.435 + 1.624 ln TP)
TLI(TN) = 10(5.435 + 1.694 ln TN)
TLI(CODMn) = 10(0.109 + 2.66 ln CODMn)
TLI(SD) = 10(5.118 − 1.94 ln SD)
2.4. Statistical Procedures
Microsoft Excel 2016 was used to assess the recorded data. Arcgis10.2. was used to generate the map of sampling locations. The Spearman method in origin Pro 2020 was used for correlation analysis (CA) to detect the relationship between Chl-a and various water quality parameters (pH, DO, TP, TN, etc.). In the water quality evaluation, the score value of the trophic level index of the lake is calculated using Microsoft Excel 2016.
3. Results and Discussion
3.1. Seasonal Variations in Water Temperature
The WT was not only crucial for understanding various physical and chemical processes and dynamic phenomena of lake water, but also an important factor affecting the metabolism of lake aquatic organisms. The physical characteristics, chemical reactions and biological activities of lake water are closely related to WT [31]. For example, water temperature is an important factor affecting the content of chlorophyll-a in water, and also a key factor for the growth of planktonic algae. The appropriate water temperature is conducive to the growth of planktonic algae, that is, in a certain temperature range, the rising water temperature can promote the photosynthesis of algae and the respiration of aquatic organisms [32,33,34]. Lake temperature changes with seasons. When wind and waves are not strong enough to disturb the entire water mass and energy cannot be fully exchanged, the vertical temperature difference increases [35]. The changes in WT are mainly caused by changes in seasonal solar radiation, which are synchronous and highly correlated with regional air temperature [36,37].
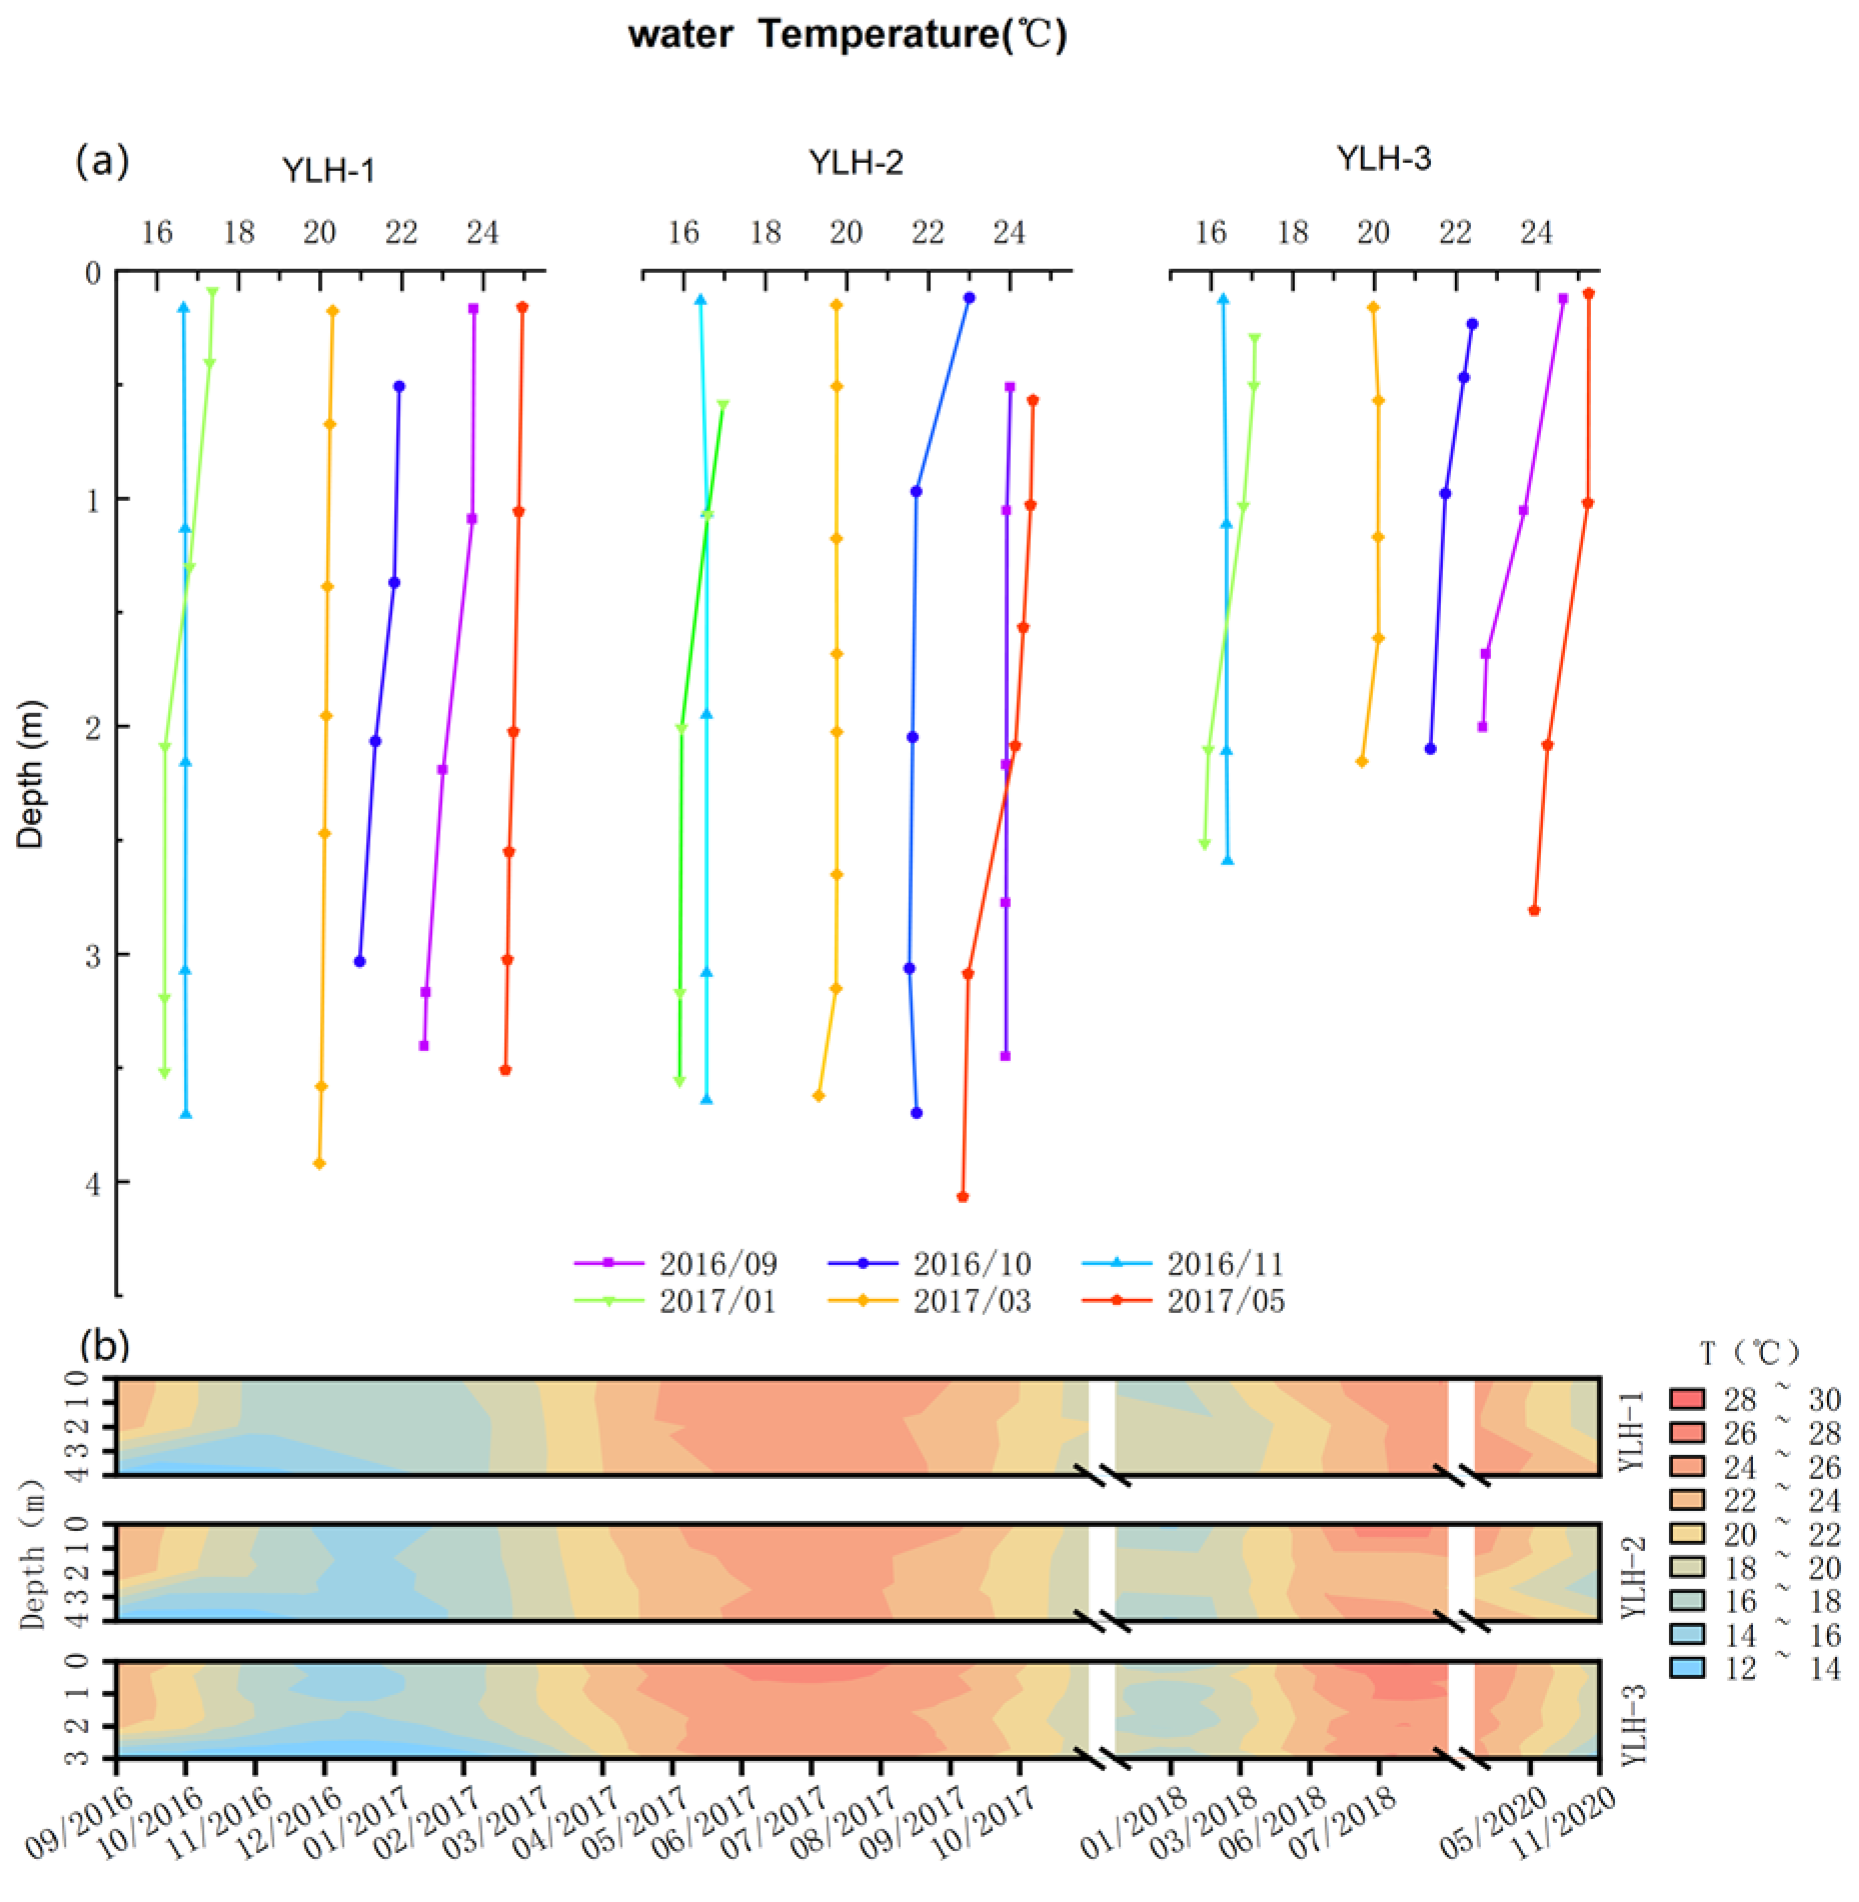
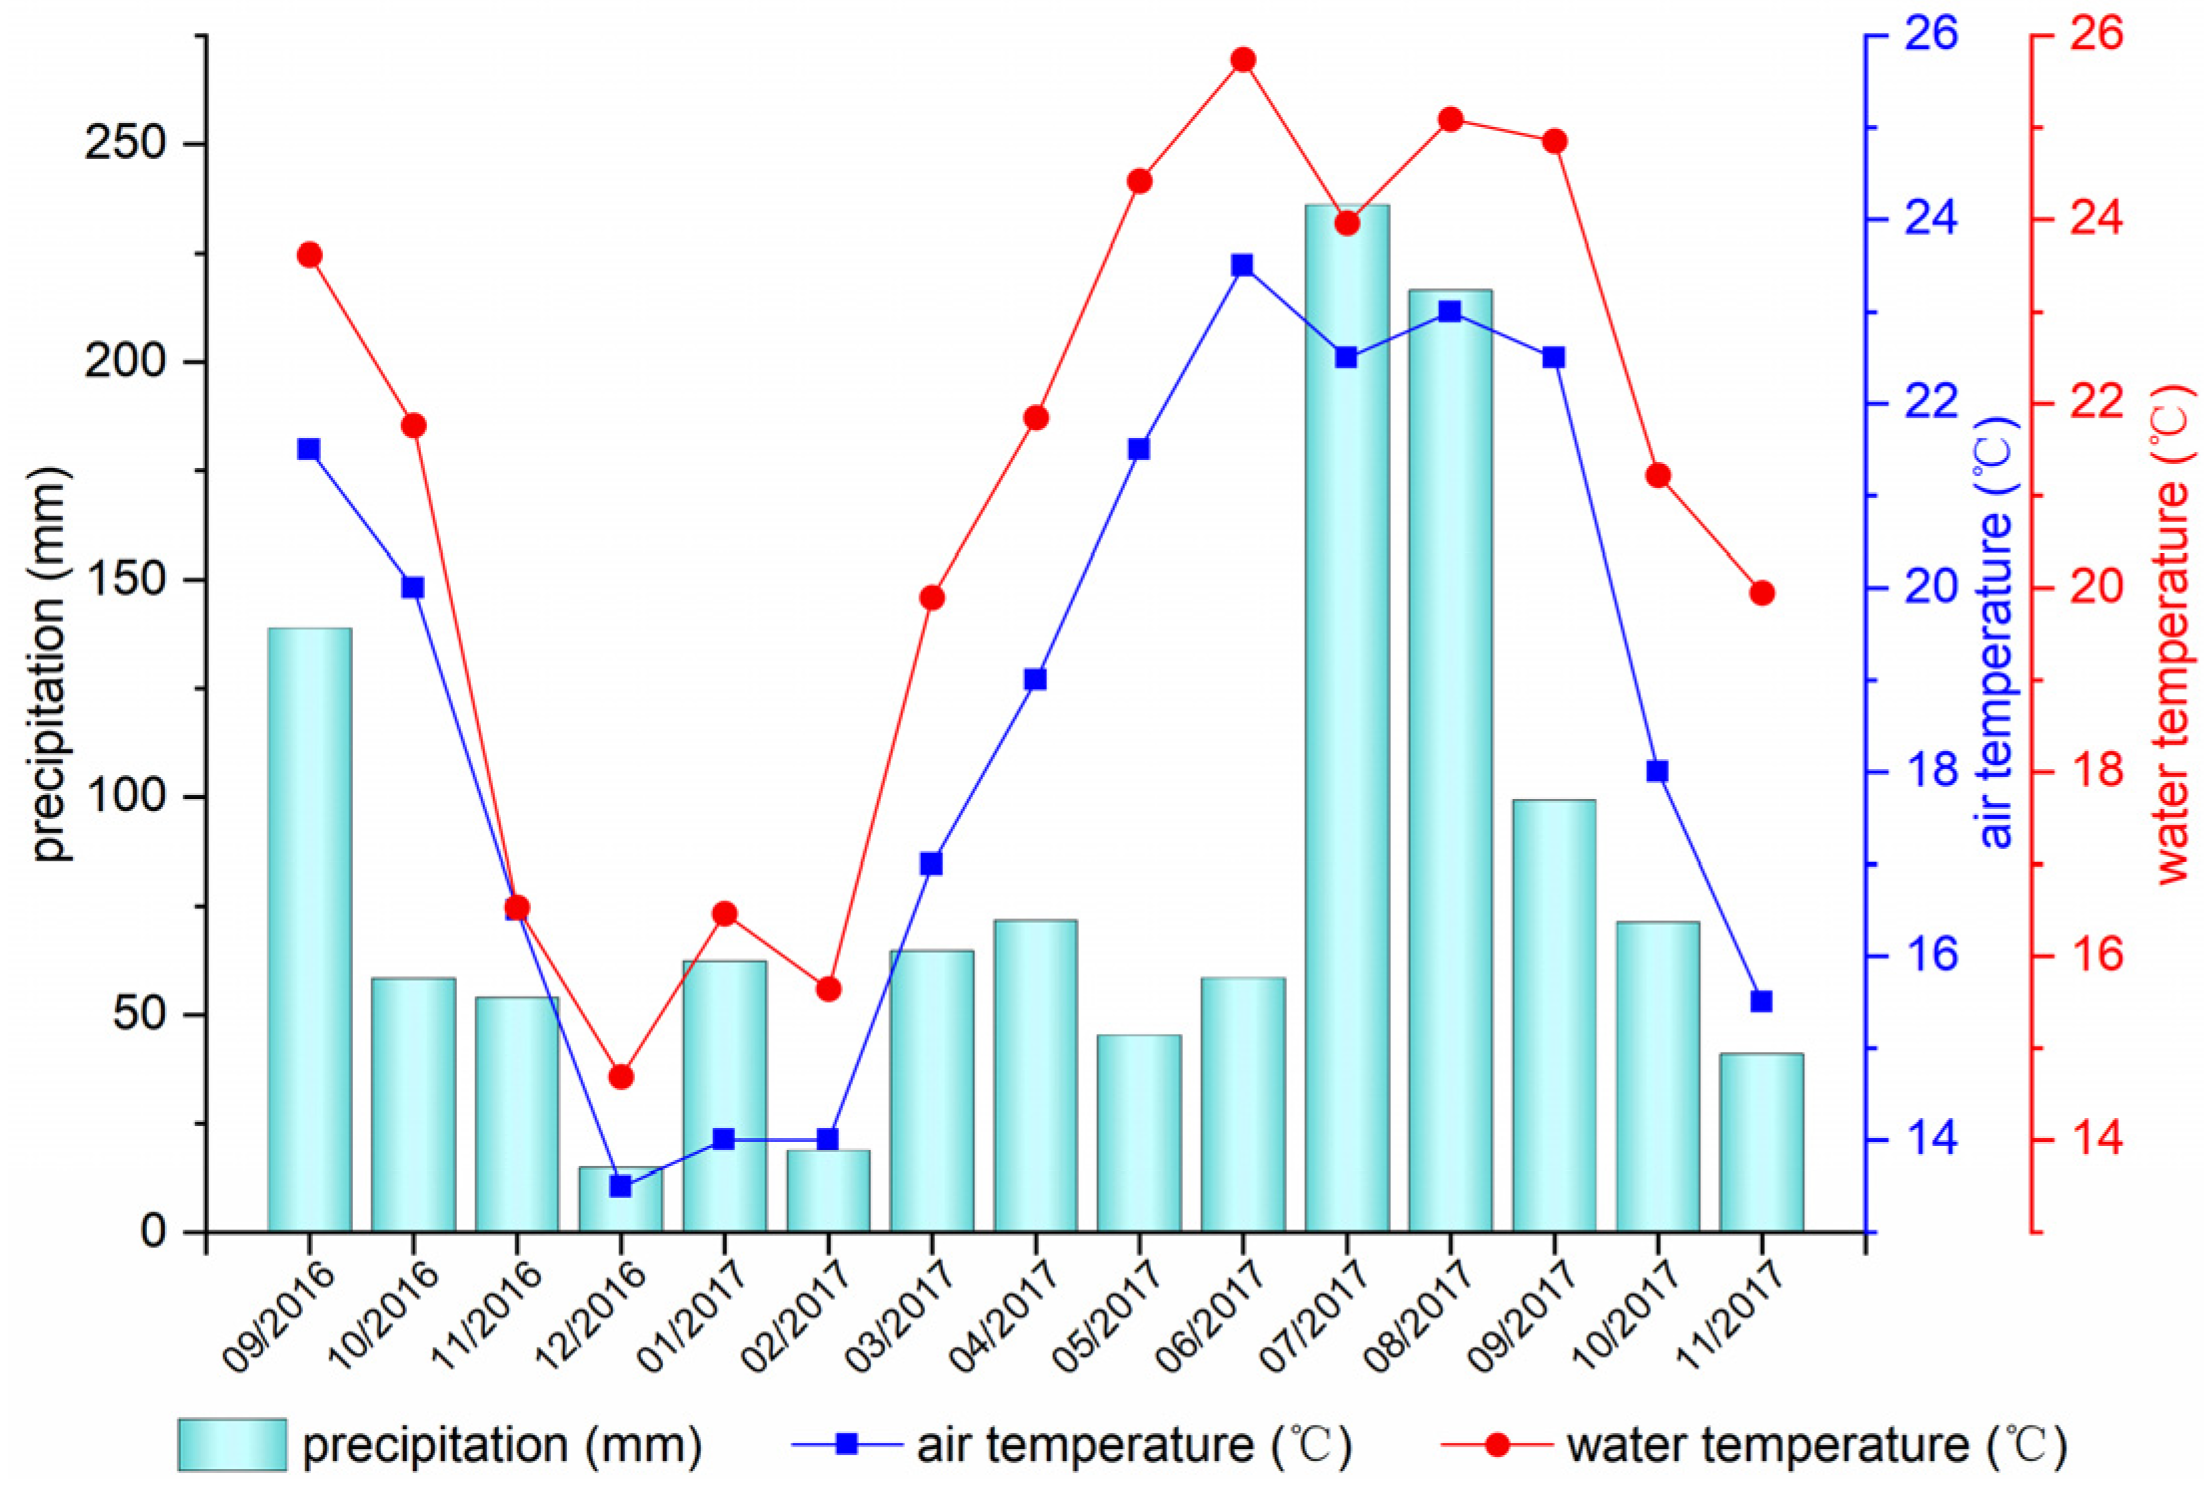
From September 2016 to November 2020, WT was inherently synchronized with seasonal change at each monitoring point (Figure 2b). The results showed that the WT of lake Yilong ranged from 13.1 °C to 29.8 °C during the whole monitoring period. Spatially, WT decreased gradually from the lake’s surface to its bottom, especially during the summer (Figure 2a). The average WT at 3 sample sites at 0 m, 1 m, 2 m, 3 m and 4 m were 21.6 °C, 21.3 °C, 20.9 °C, 20.9 °C and 20.7 °C, in line with the general law that lake WT gradually decreases as the water depth increases. WT in different areas of Lake Yilong decreased with increased depth in the vertical direction, with a decreasing range of 1–2 °C. Seasonally, the changes in WT were obvious, with the highest WT recorded in June and July and the average temperature ~26 °C. The lowest WT was ~16 °C, recorded in November and January. The average WT in the center part of the lake (20.8 °C) was higher than in the southeast (20.4 °C) and northwest (20.6 °C) in January, March and May. The average WT in the northwest of the lake was higher than in other parts of the water body in September, October and November. As a shallow plateau lake, WT showed no significant thermal stratification in Lake Yilong. The change in WT was consistent with that of air temperature (Figure 3). Figure 3 shows the synchronous change of water and air temperature during the monitoring period without obvious hysteresis. The differences in altitude between the locality of the meteorological station and lake surface were the main reasons why the WT of Lake Yilong was higher than that recorded at the meteorological station. Another possible reason is that the WT was measured during the daytime and the air temperature was the average value for the whole day.
As Lake Yilong is a typical shallow water lake on plateau, WT in the lake shows strong seasonal variability. In August 2017, due to the heat energy exchange between surface water and air, the temperature increased, resulting in a significant increase in WT. In addition, this situation leads to a decrease in surface water density, which hinders heat exchange with bottom water, especially in summer. In winter, due to the disappearance of thermocline in shallow lakes, the exchange capacity of water bodies is enhanced, and surface water and bottom water show the same properties. In addition, the monitoring shows that there is no temperature stratification phenomenon in lake Yilong, which is significantly different from other deep-water bodies in Yunnan-Guizhou Plateau, such as Lake Lugu [38] and Lake Yangzong [39].
3.2. Seasonal Variations of Chlorophyll-a
Chlorophyll-a (Chl-a) is an important indicator of the presence of phytoplankton, with its content reflecting the amount of algae in the water. Thus, Chl-a is an important indicator used for investigating eutrophication, and it plays a key role in the evaluation of the nutritional status of the lake water. It was found that Chl-a in Lake Yilong changed with seasons [40,41,42].
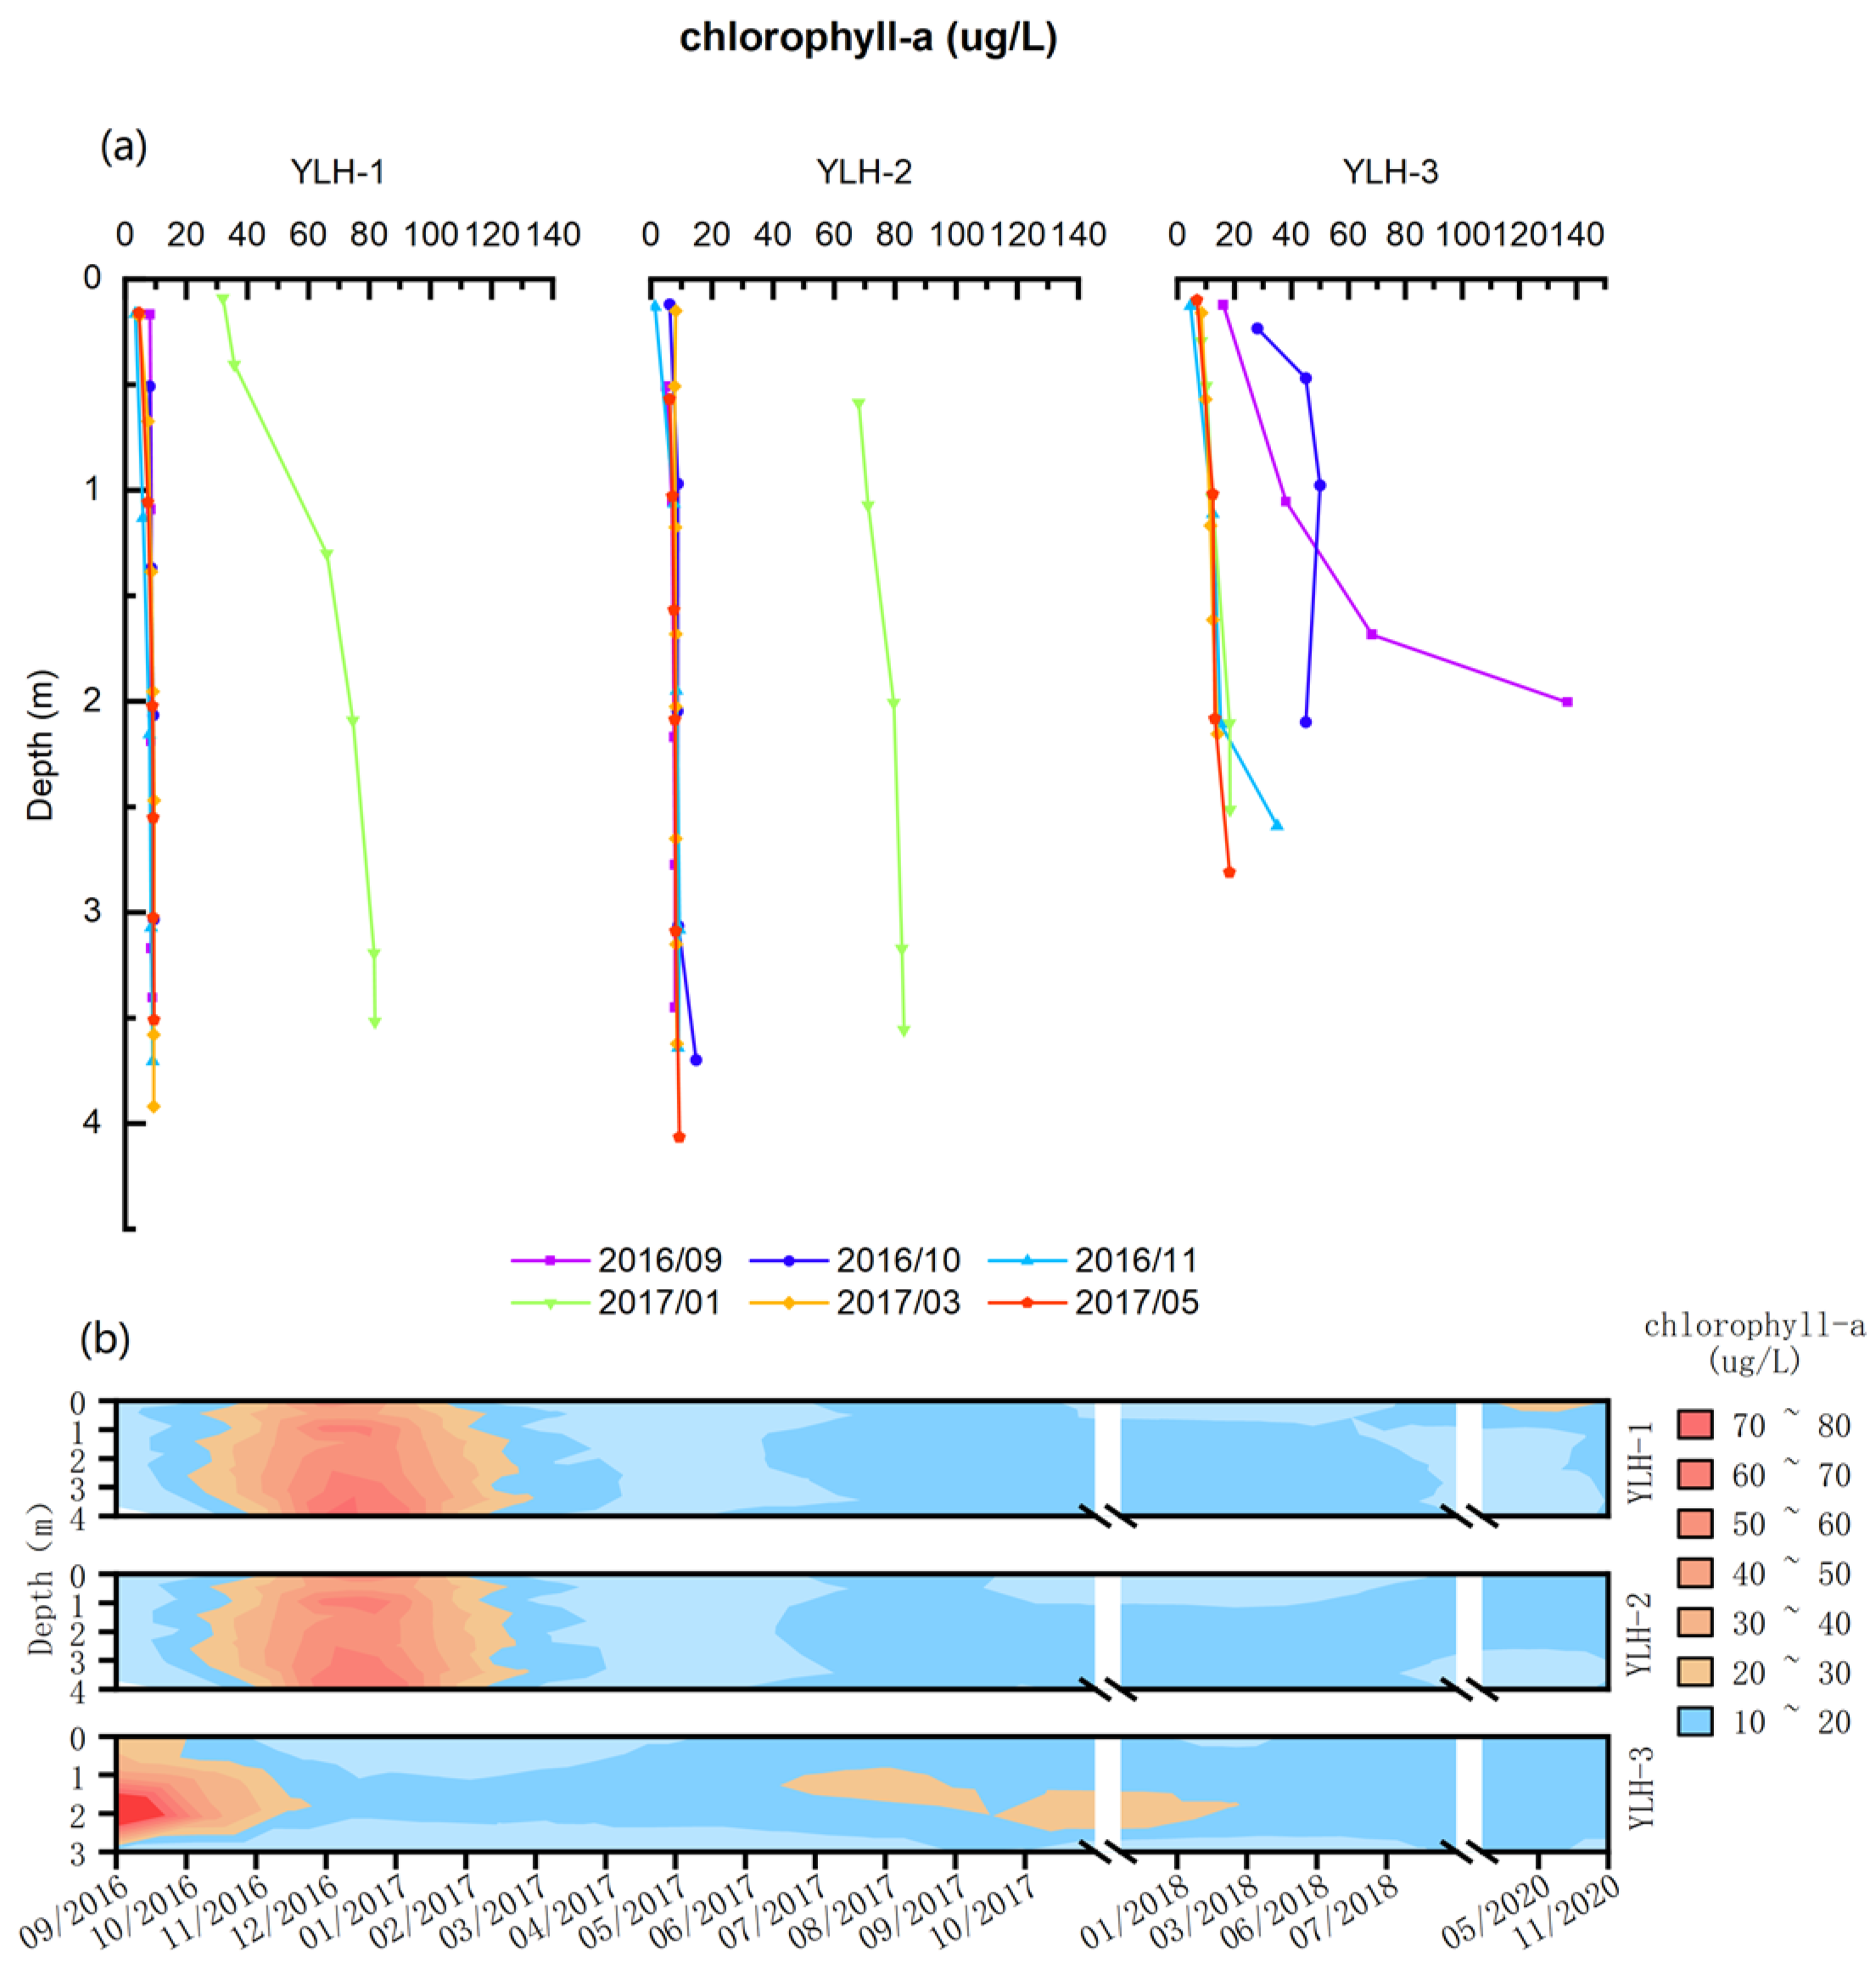
The monitoring data shows the Chl-a concentration in Lake Yilong ranged from 1.3 to 137 μg/L (Figure 4b). Chl-a concentration in the vertical profile of the entire lake area increased with the increase of water depth (Figure 4a). From different areas, the Chl-a concentration of the vertical profile in the southwest reached its maximum value in January, its concentration at the southwest increased from 29.4 µg/L on the surface to 81.3 µg/L at the bottom (average value of 66.04 μg/L). This may have been due to the effects of precipitation and runoff in the rainy season. In March and May, the Chl-a content began to return to the average value in Lake Yilong. The lowest value of Chl-a on the surface of the center of the lake was recorded in November 2016 (1.3 μg/L). In January, the concentration reached a maximum of 68 μg/L, then began to decrease. The most obvious difference in Chl-a between the surface layer and the bottom of the lake was in the vertical section in October (13.2 μg/L at the bottom of the lake).
It is worth paying attention to the monthly change in Chl-a at the northwest part of the lake. The vertical profile change was lowest in the surface layer. The Chl-a concentration increased with increase in water depth, and the concentration of Chl-a suddenly rose with every 1 m of water (Figure 4a). It is believed that the stratification of Chl-a occurred because, on the one hand, rivers were entering the northwest of the lake (Moat, ChengBei River, Cheng nan River), and the water quality was better than other rivers entering the lake. On the other hand, the introduction of large aquatic plants such as Hunan lotus improved water quality. Aquatic plants can maintain the water quality of lakes via various mechanisms, including providing zooplankton shelter, increasing the stability of sediments to reduce their resuspension, competing with phytoplankton for nutrients and releasing algae substances [12,13]. Therefore, it can be concluded that the purification effect of aquatic plants on the water is feasible, and biological engineering could be implemented in the future to protect Lake Yilong by purifying its water.
3.3. Seasonal Variations of Dissolved Oxygen
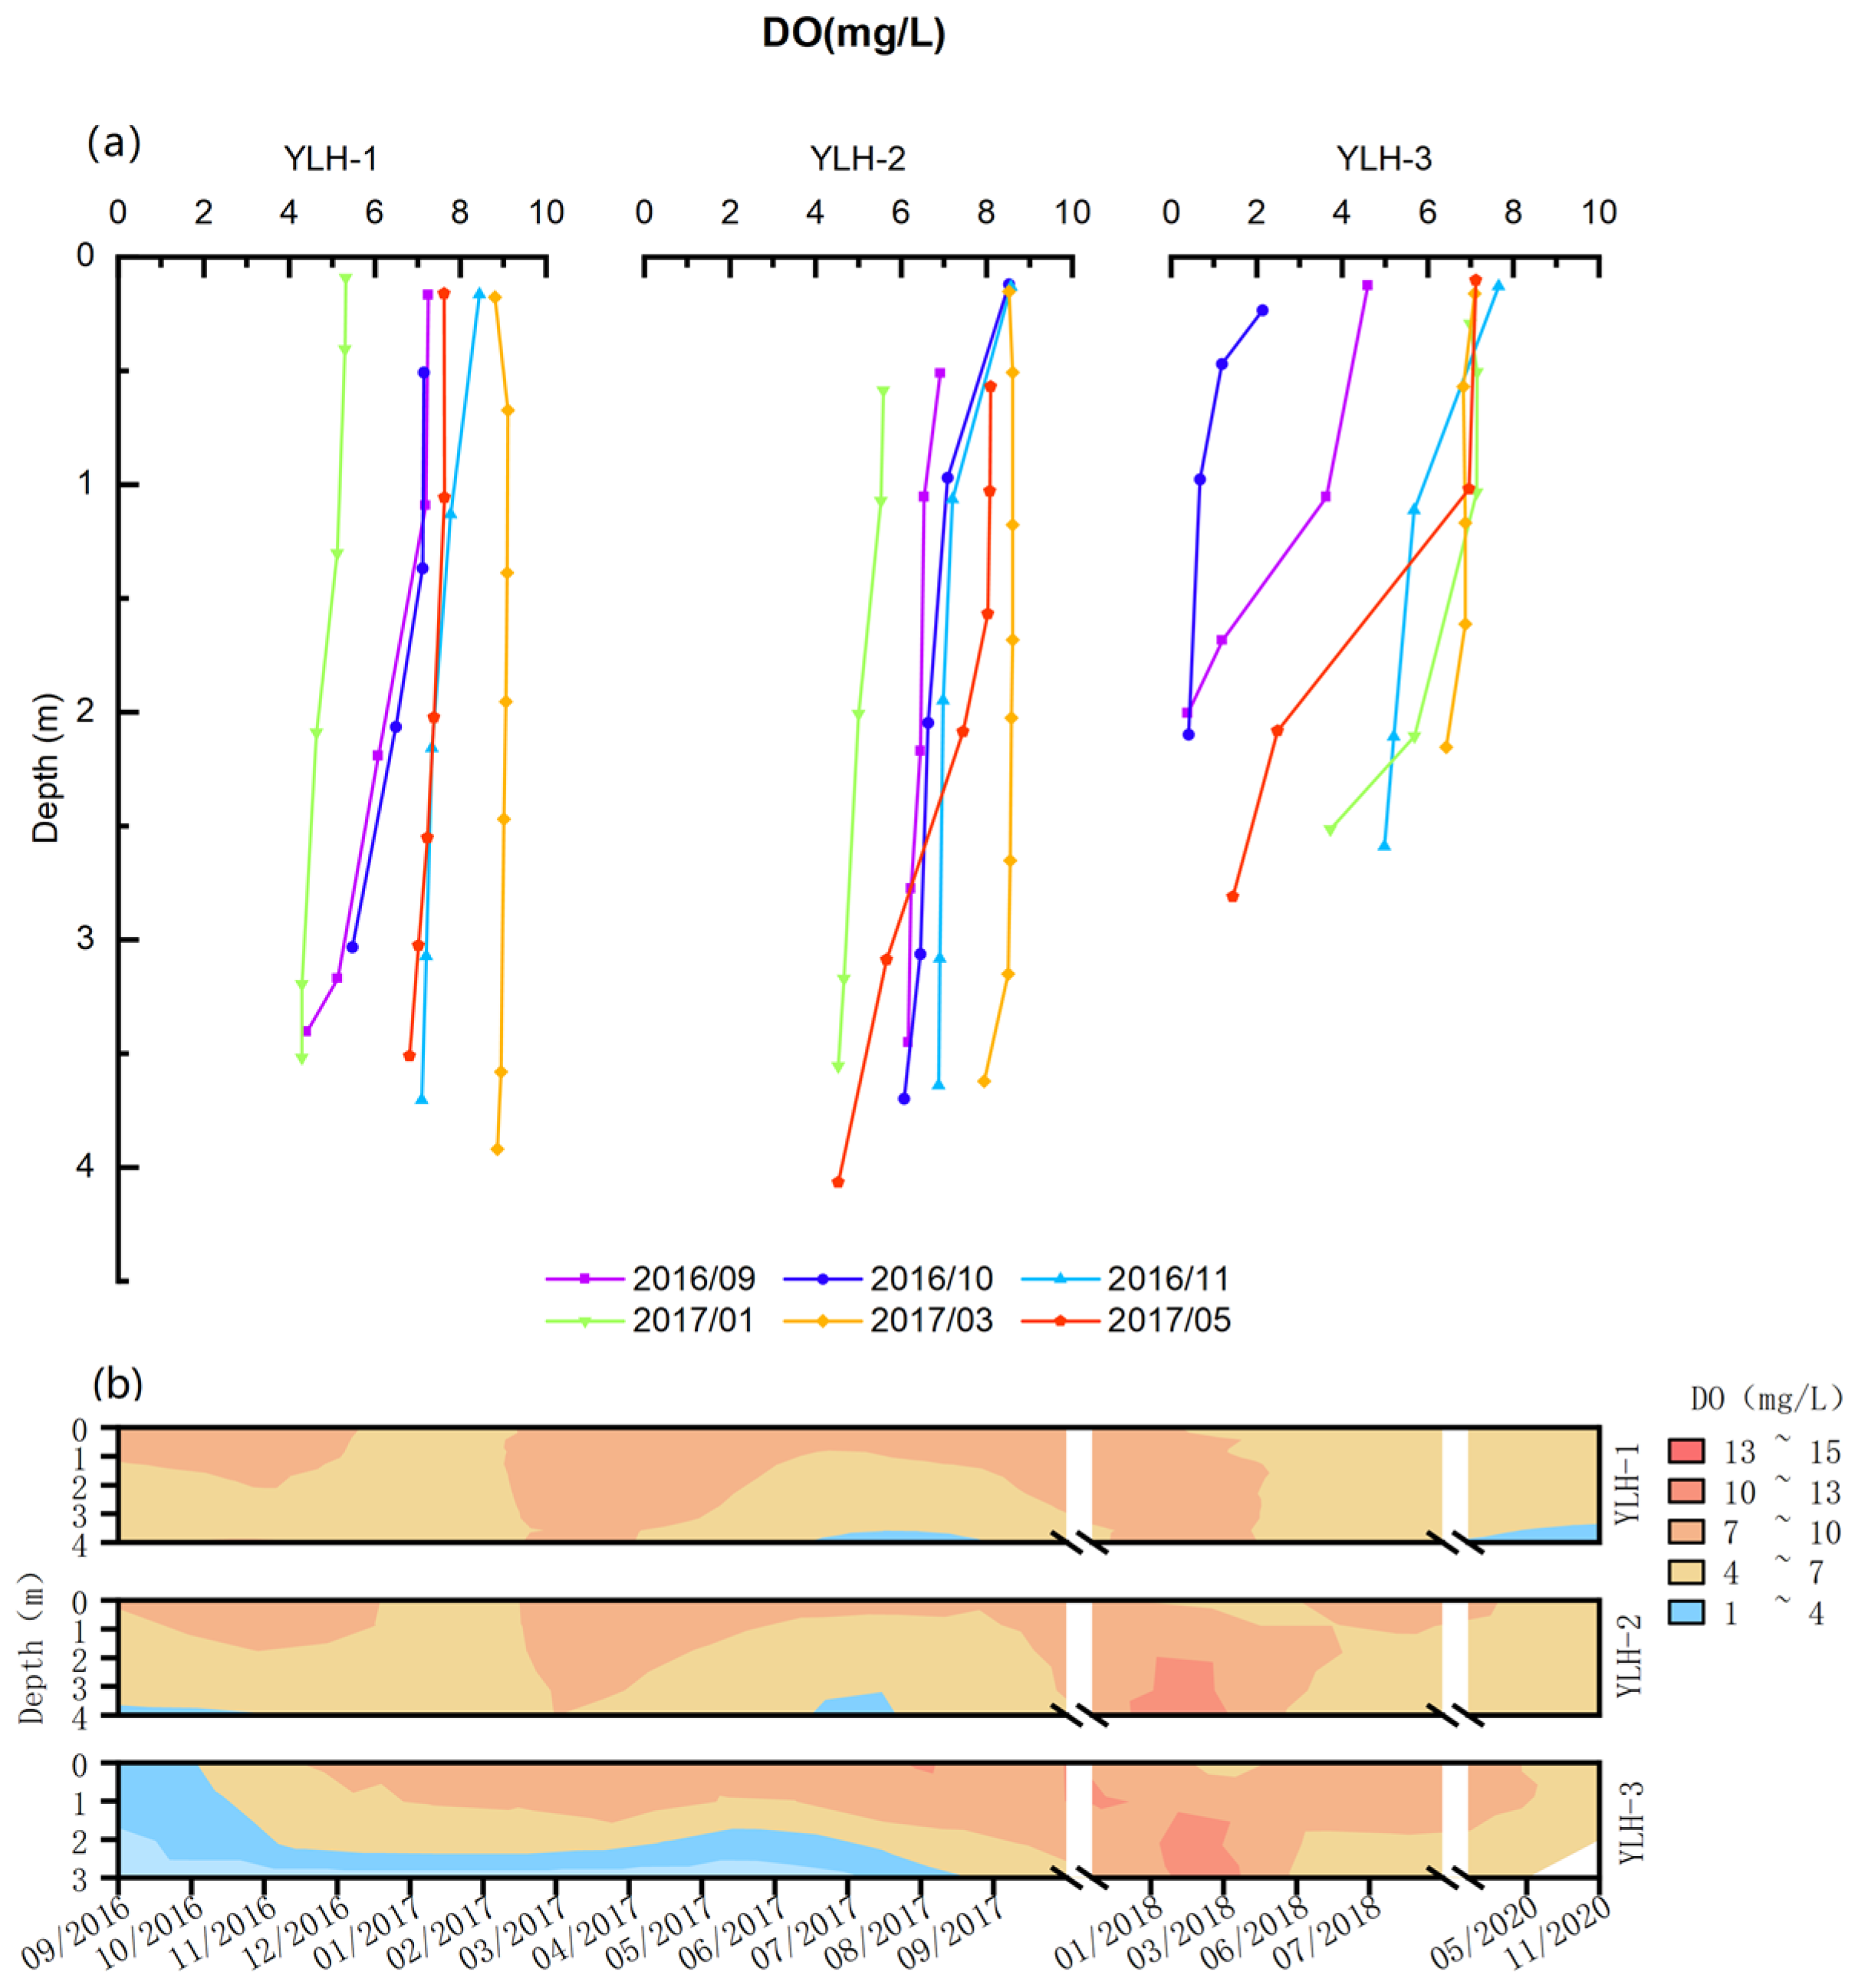
Dissolved oxygen (DO) refers to decomposed oxygen dissolved in water, mainly from aquatic plants’ photosynthesis [43]. It is an important factor in maintaining the dynamic balance of the ecological environment of the water and is necessary for the survival of aquatic life. DO also participates in the transformation of some substances [44]. Compared with other parameters, the concentration of DO can reflect the pollution degree of lake water, especially the pollution degree of organic matter, which is an important indicator of water quality [45].
The monitoring results showed that the DO concentration in Lake Yilong was 0.39–14.55 mg/L (Figure 5b). In terms of long-term trends, the DO concentration of Lake Yilong was high in the dry season, with an average concentration of 8 mg/L, while it was lower in each lake area during the rainy season, with an average of concentration of 7 mg/L. From the vertical and horizontal changes of the DO curve (Figure 5a) in different seasons, we observed a higher concentration of DO on the surface of the lake, which decreased with depth in the vertical direction. Although the concentration decreased, the magnitude of the decrease varied in different lake areas and had obvious seasonality. Compared with other shallow lakes, the change in DO in the northwest part of the Lake Yilong showed a very special phenomenon, whereby the DO concentration at the surface was 5.08 mg/L in September 2016, 3.63 mg/L at a water depth of 1 m, and suddenly decreased to 0.39 mg/L at a water depth of 2 m, forming an anoxic environment. A similar situation also occurred in October and May but at different water depths. In October, the surface DO concentration was 5.66 mg/L. As the water depth increased, the DO concentration decreased from 0.65 mg/L at 1 m to 0.37 mg/L at the bottom of the lake. In May, the surface DO concentration was 7.12 mg/L, which was at a high concentration, but when it reached the bottom of the lake, it dropped sharply to 1.44 mg/L, indicating a hypoxic or anaerobic environment.
Lake Yilong is sometimes stratified and hypoxic at a water depth of about 1 m, with the possible causes being: first, the pollution of organic fertilizers in the farmland of the basin; second, the silt deposited at the bottom of the lake; third, the lack of water resources in the basin, and the poor quality of the mixing and refreshing water. As a shallow water lake, the seasonal water level fluctuations might also influence the DO contents. These could cause Algae to bloom, thereby affecting the concentration of DO. Whether the occurrence of a hypoxic environment in the northwestern part of Yilong Lake was accidental or occurs frequently remains to be determined.
3.4. Seasonal Variations in pH
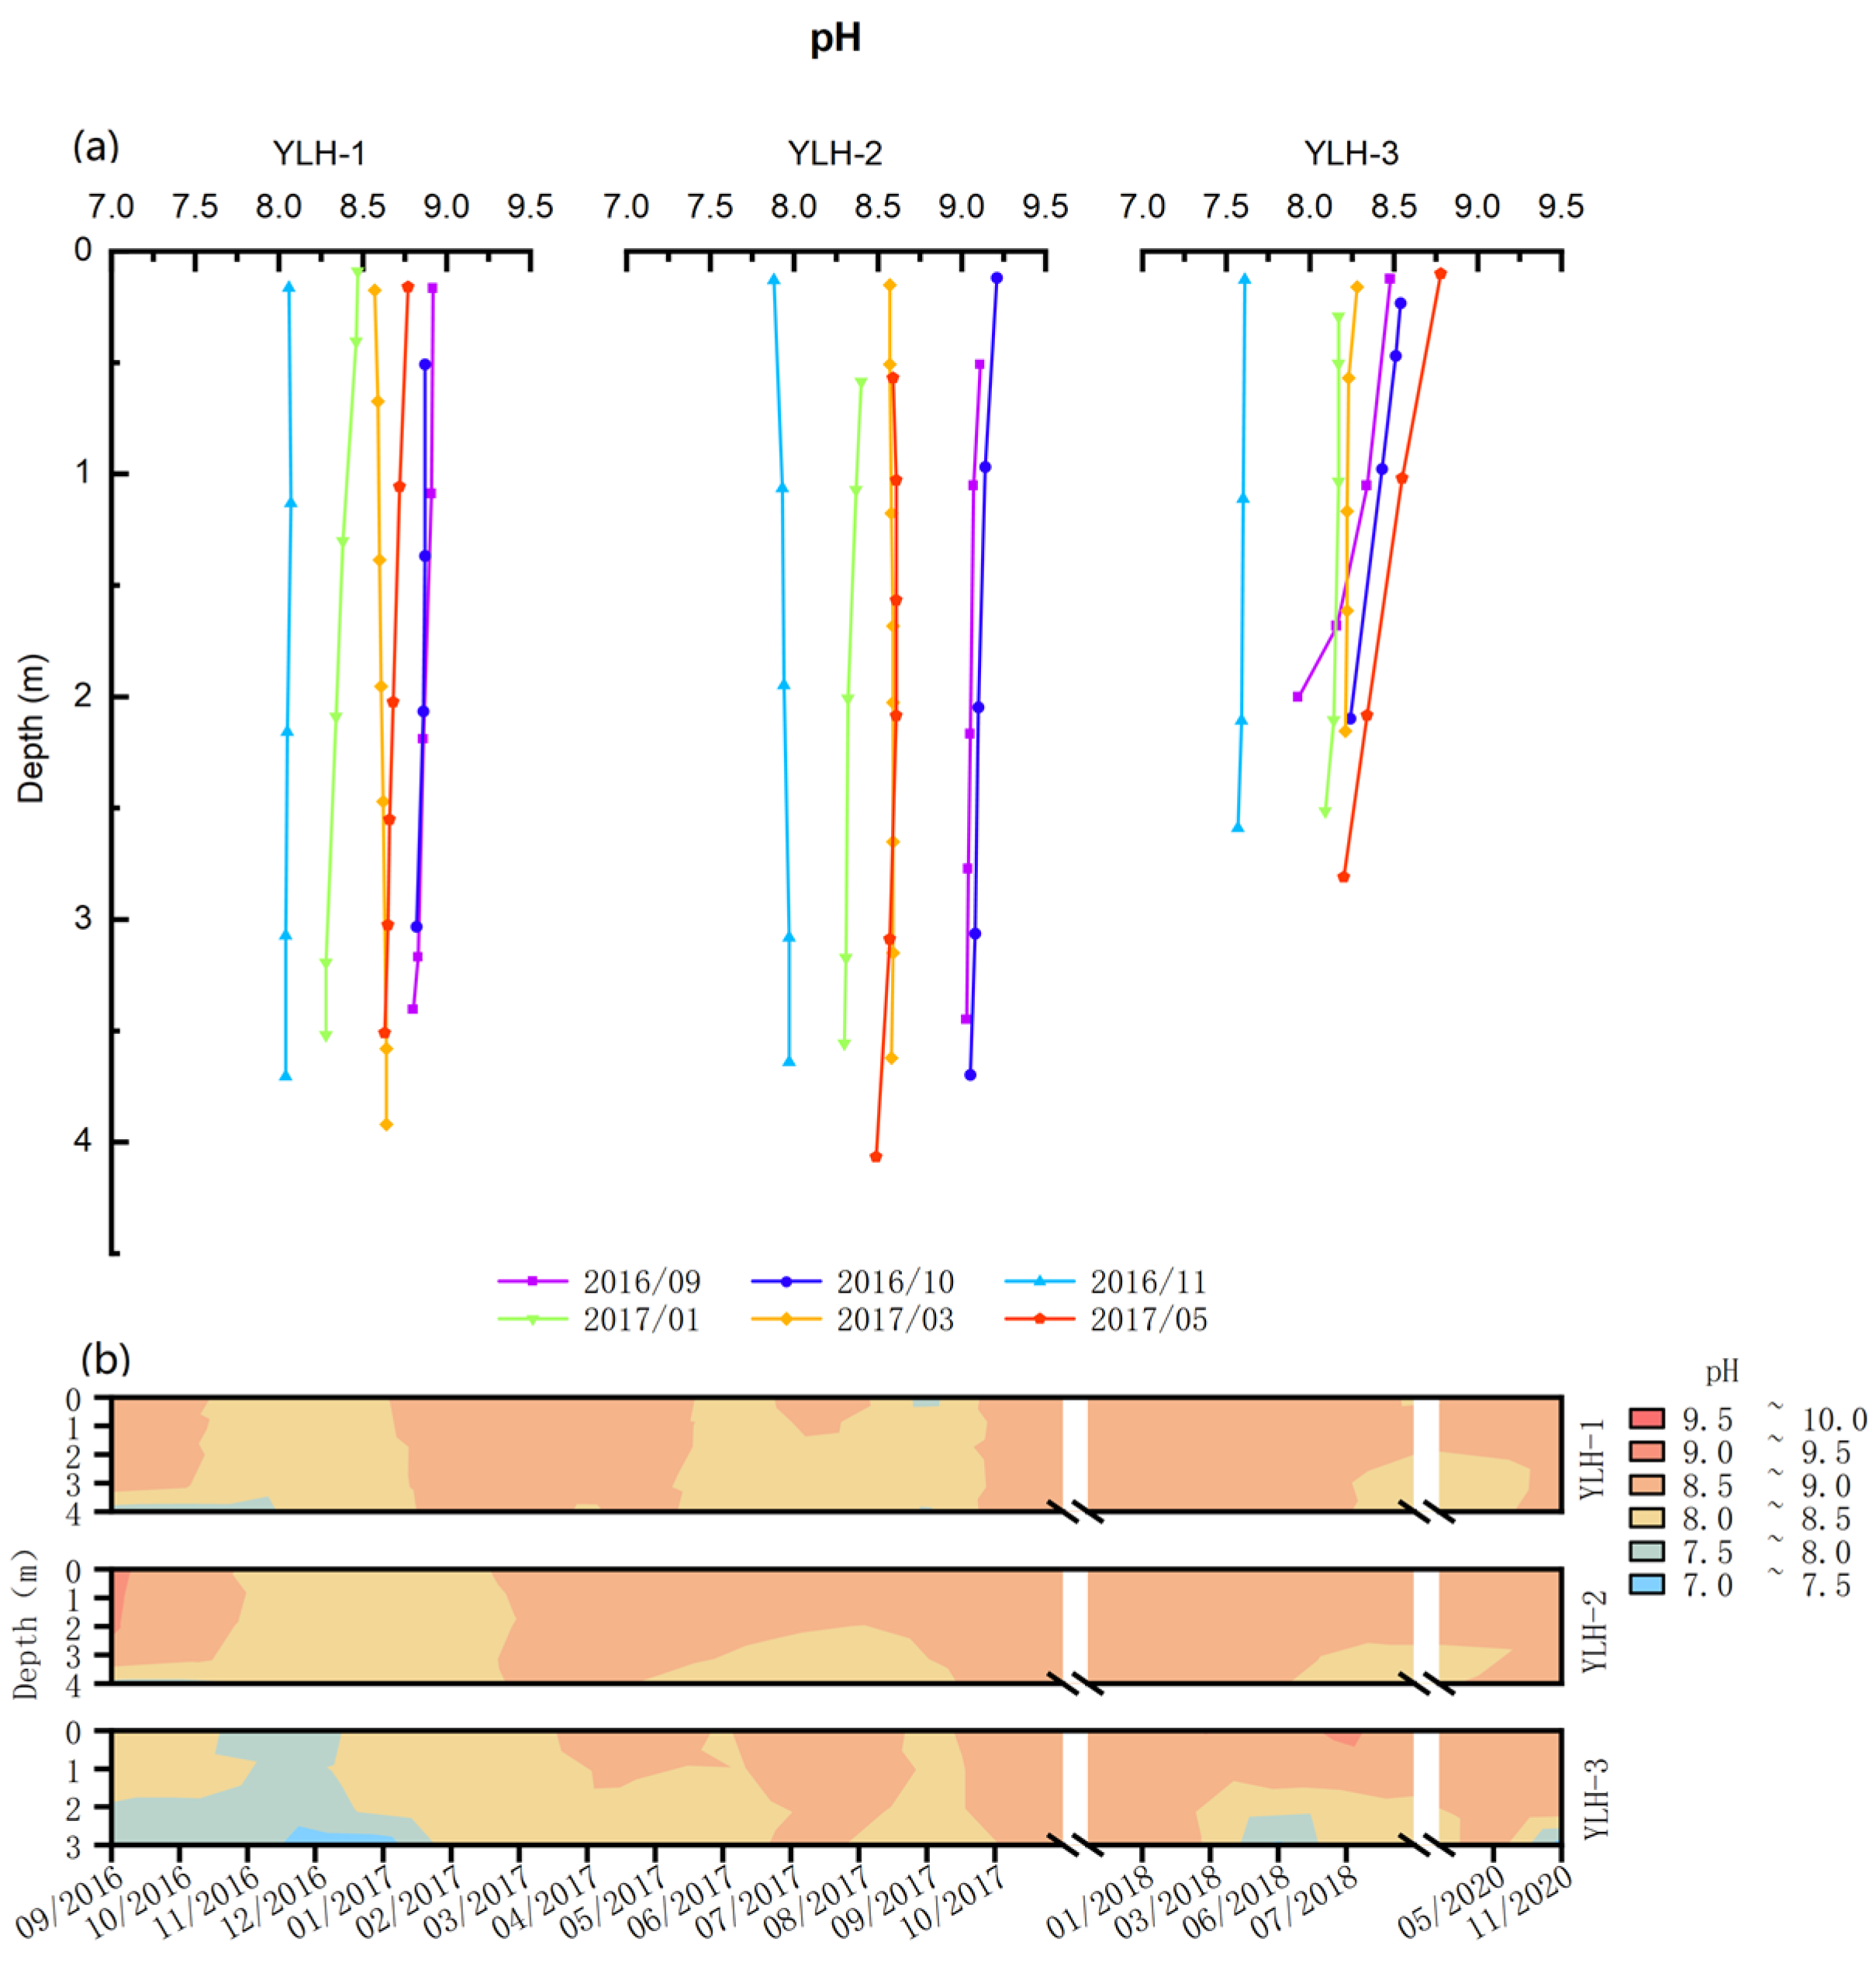
pH is an important factor determining the eutrophication and sediment phosphorus cycle of a lake. It is not only related to geological background, climatic conditions, terrestrial heat flow, etc., but also to the influx of nutrients and algae that are constantly changing during man-made eutrophication due to the interaction of factors such as reproduction and DO content. Lakes in the Yunnan Plateau are characterized by a high pH value, as the geological–geographical background of a Karst area and a subtropical climate. pH is mainly affected by the content of CO2 in water, and CO2 is affected by factors such as algae photosynthesis and aquatic organism respiration. Some studies reported that the pH value was closely related to algae growth. Algae photosynthesis affects the CO2 buffer system, thereby affecting the pH value of the water, i.e., a water pH of ~8.5 represents the optimal pH for algae growth, while a pH >9.5 is worst for algae growth [46].
The monitoring results showed that the pH value of Lake Yilong varied from 7 to 9, and the vertical variation was relatively uniform (Figure 6b), indicating that the monthly pH at the monitoring sites was in favor of algae growth. Significantly, the pH value in the center of the lake was ~9 in September and October and ~8 in January, March and May. The lowest pH was recorded in November (pH: 7.9), while Chl-a content was at its maximum value (Figure 6a). The reasons for such observation could be related to decayed algae in November, as these organic algae were converted into CO2, HNO2 and HNO3 under the action of biochemical oxidation, resulting in a decrease in pH. In addition, our monitoring data showed that the pH at the northwestern part of the lake was maintained at ~8 in September, October, March and May. The possible reason could be that the northwestern part of the lake had a higher density of planktonic algae, and suitable WT promoted the photosynthesis of algae and aquatic organisms. Respiration of CO2 consumes CO2, increasing the surface pH. At the end of November, aquatic plants and algae began to decay to produce organic substances. Under the action of biochemical oxidation, these organic substances are converted, resulting in lower pH.
3.5. Assessment of Trophic State and Water Quality
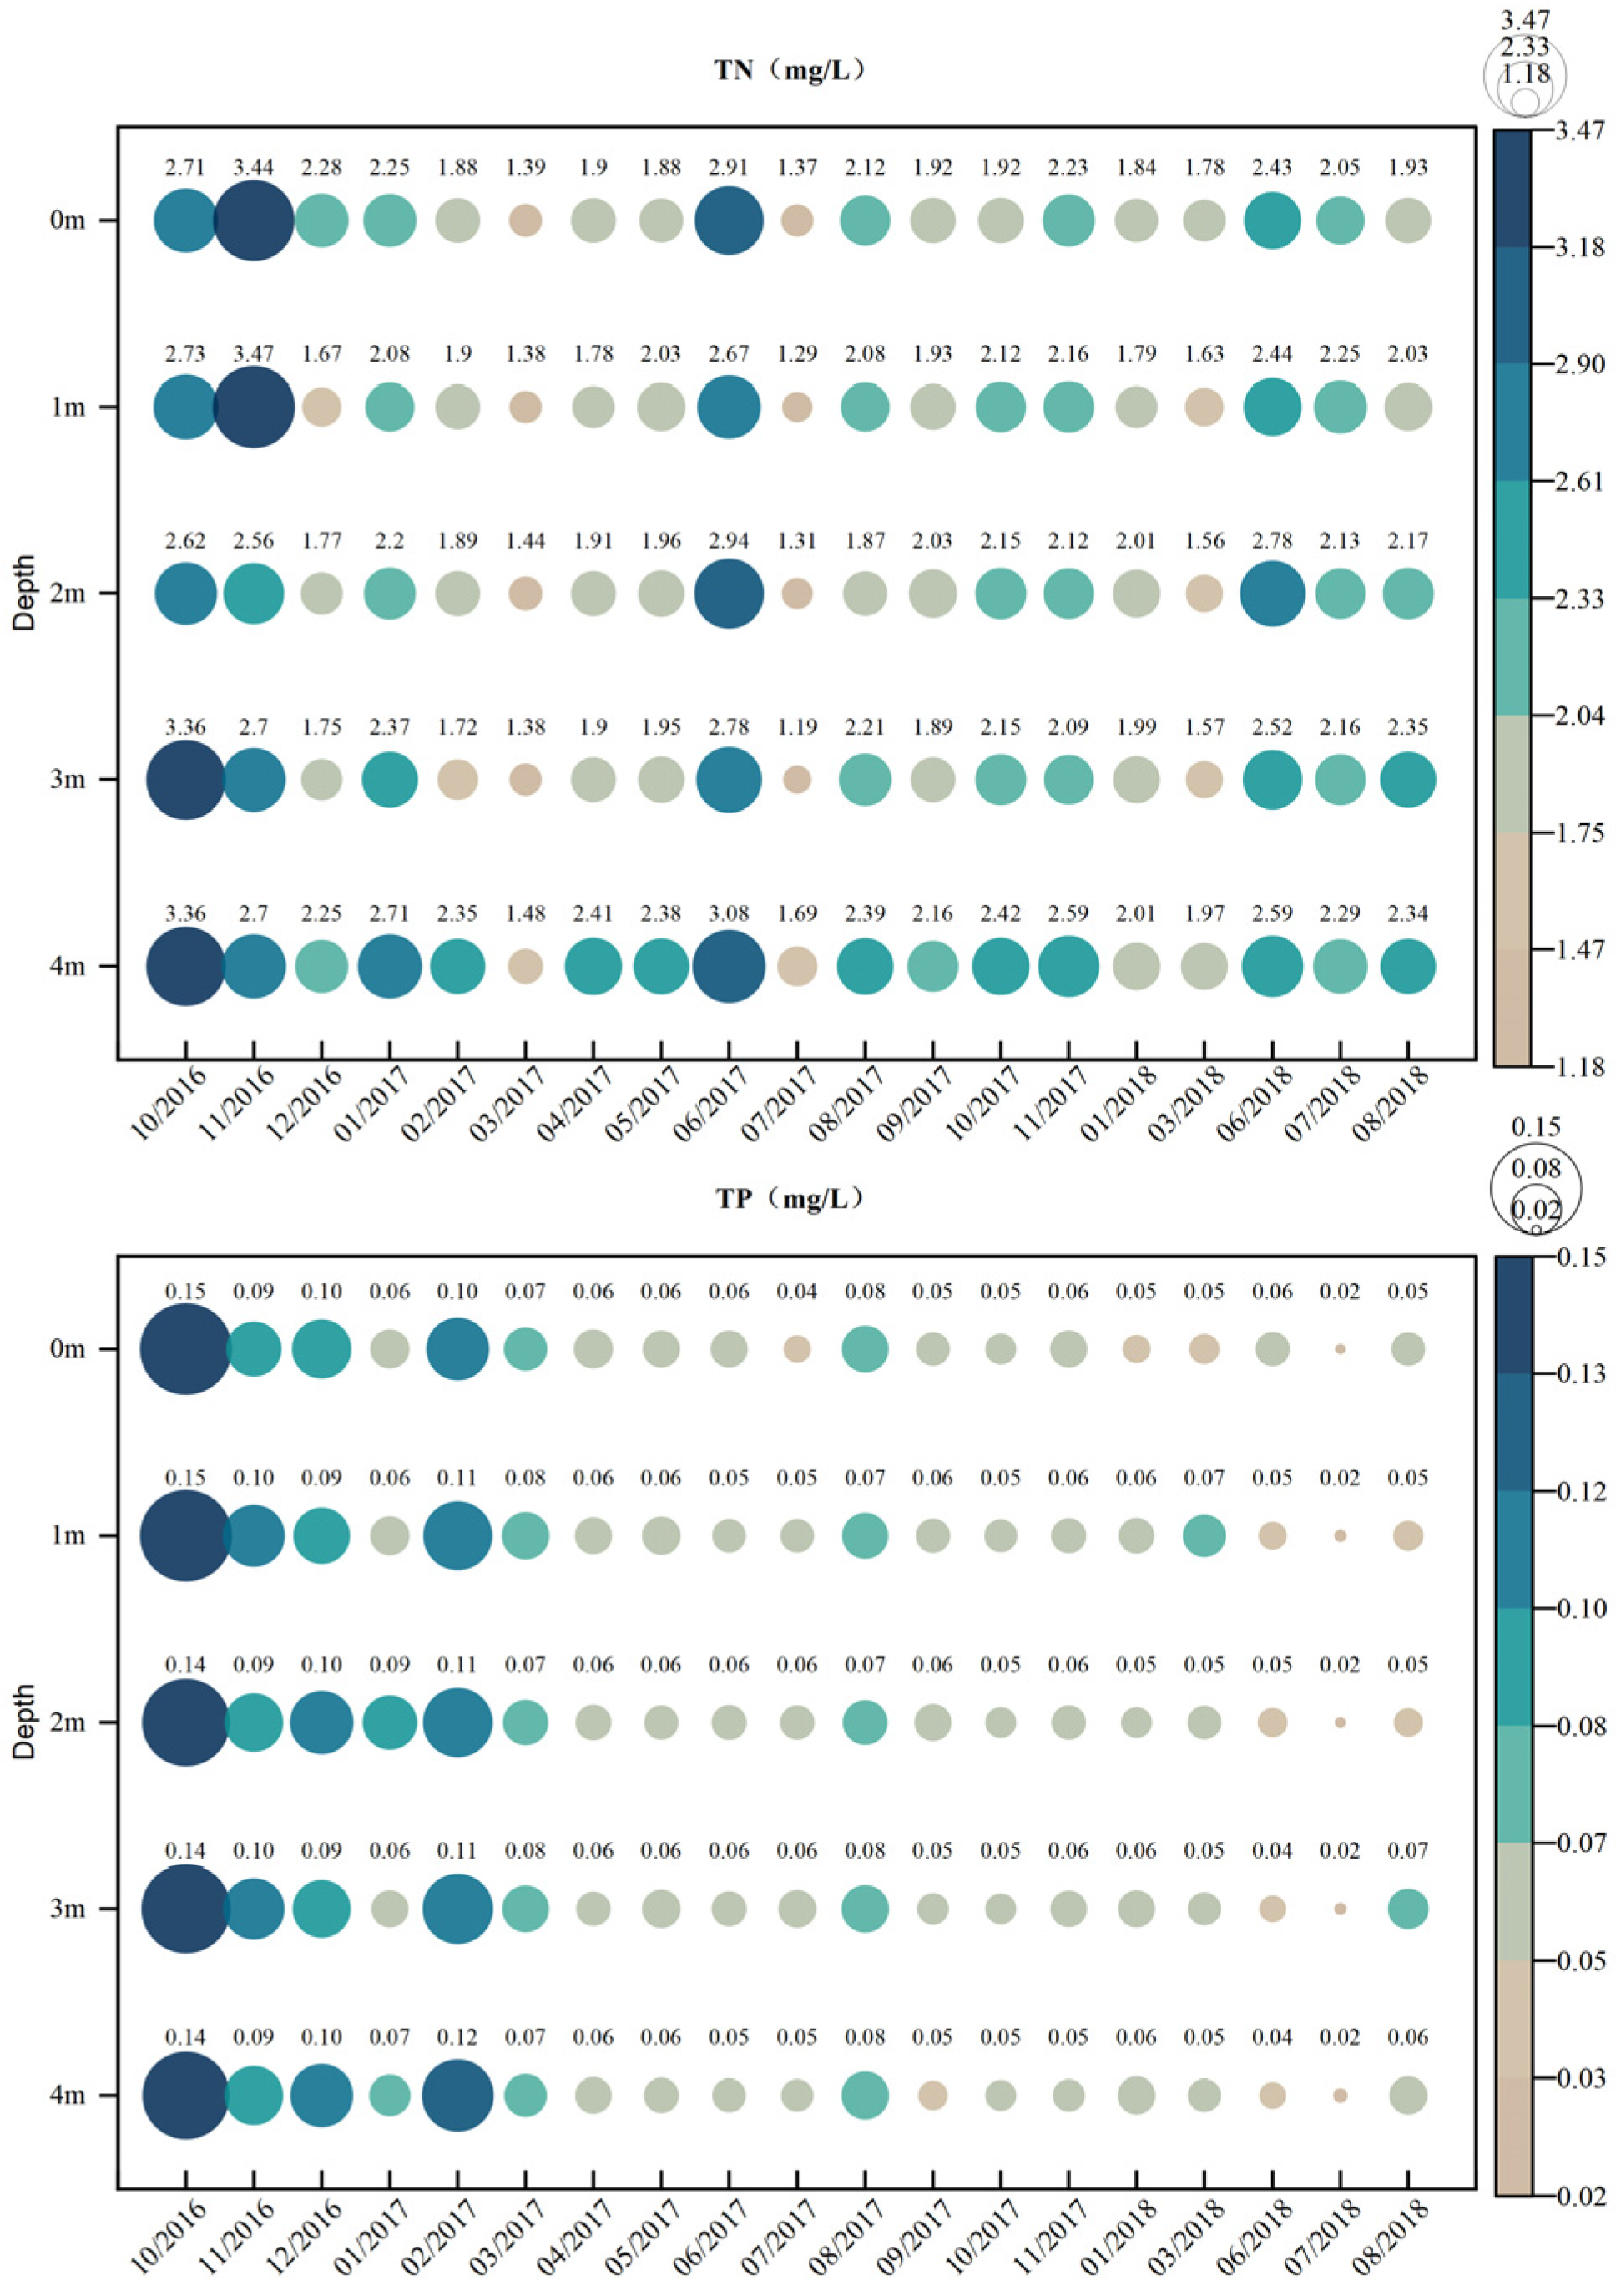
The monitoring dataset (Figure 7) showed that the TN and TP concentrations ranged from 1.19 to 3.47 (2.15 ± 0.48) mg/L and 0.02 to 0.15 (0.06 ± 0.02) mg/L, respectively. The TN content in Lake Yilong demonstrated a certain change in different seasons. The TN content was lower in the dry season (March) of 2017, 2018, and higher in the rainy season (June), which was related to less Exogenous input in dry season. Notably, The TN content in the rainy season 2017 and 2018 increased compared to dry season (about 75%). The TP content decreased from 2016 to 2018. The average TP content 2016 to 2018 is 0.11 ± 0.02, 0.07 ± 0.02, 0.05 ± 0.01 mg/L. They were inferior to Class V (GB3838-2002) for a long time [47]. In addition, the comprehensive nutrition index evaluation shows that the water quality of Lake Yilong in 2016 was middle eutrophic (TLI = 60.56), and that in 2017 (TLI = 56.05) and 2018 (TLI = 56.38) was weak eutrophic.
3.6. Comprehensive Analysis
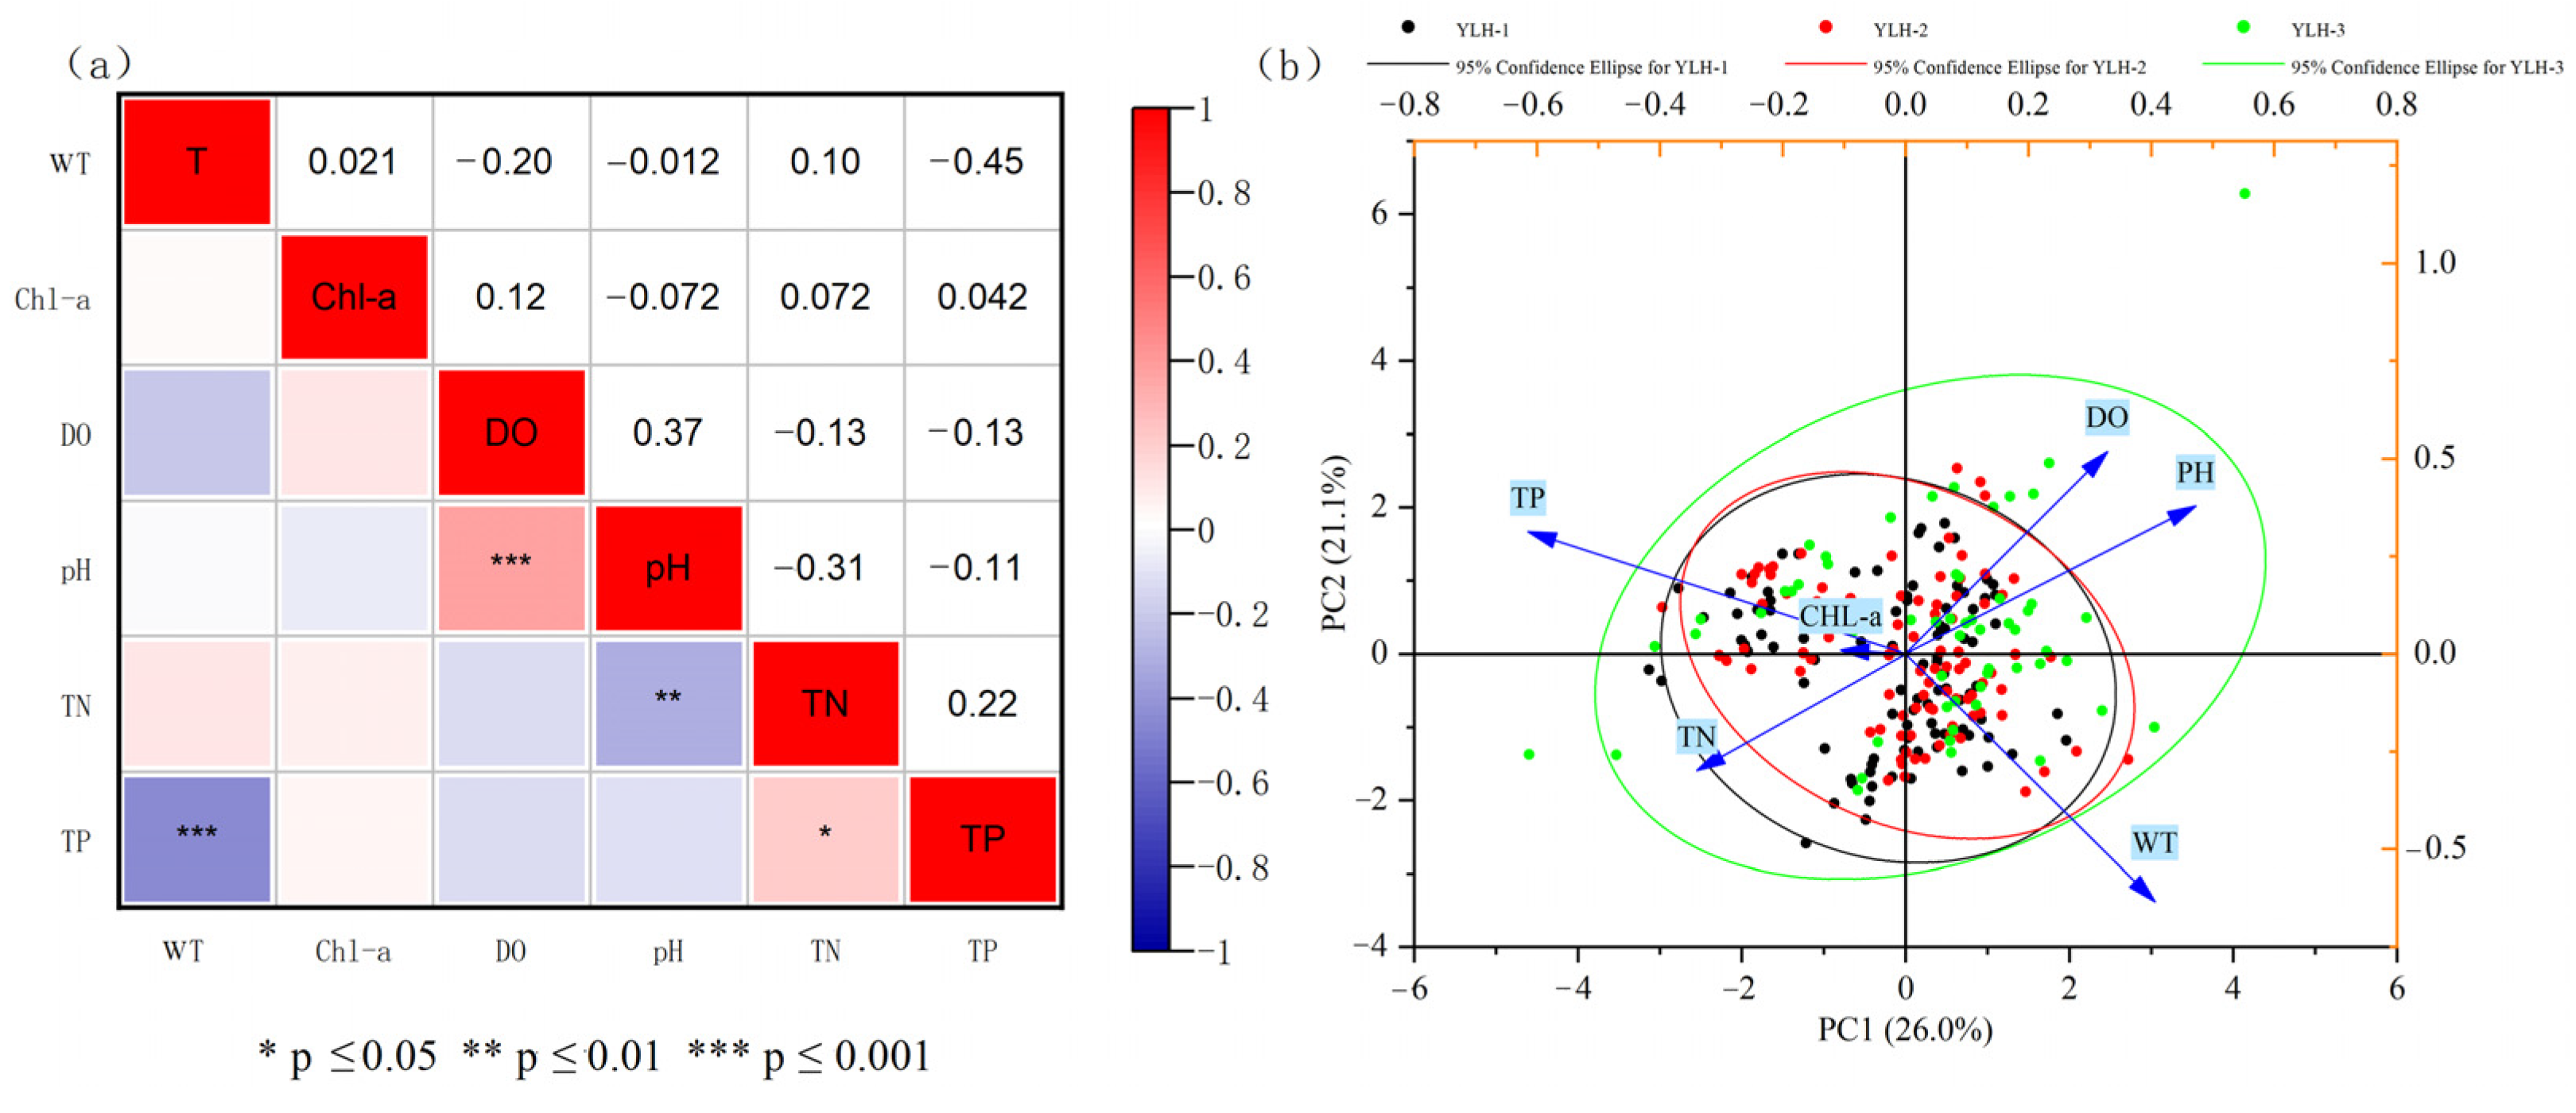
Based upon the correlation analysis of the water quality parameters (WT, Chl-a, DO, and pH), TN and TP (Figure 8a). The correlation between pH and DO is a high (r = 0.37, p ≤ 0.001), showing a positive correlation. The correlation between TN and TP was relatively high (r = 0.22, p ≤ 0.05). In general, Chl-a as a measure of algae stock and photosynthetic indicators have an effect on both pH and DO levels. Photosynthesis of algae consumes carbon dioxide in the water, causing the pH of the lake to increase and with it to increase DO. However, a different situation arose at Lake Yilong. The correlation analysis showed that there was no significant correlation between chlorophyll and pH and DO in Lake Yilong, which may be due to the high coverage of aquatic vegetation in Lake Yilong and the participation of aquatic plants in photosynthesis, which affected the pH value and DO of Lake Yilong.
The first two axes in a principal component analysis (PCA) of physicochemical variables from all sampling times and sites, explained 47.1 % of the total variation in the dataset (Figure 8b), including PC1 and PC2 accounted for 26.0% and 21.1% of all datasets, respectively (Figure 8b). The PC1 axis was related to total nutrient concentrations (TN, TP) and pH, while the PC2 axis was related to DO and WT. The results of principal component analysis show that there is a clear separation between the northwest lake area and the central and southwest lake areas, there was a general trend for northwest site to have higher DO and Chl-a concentrations than central site and southwest site. This is consistent with the previous results on DO and Chl-a.
3.7. Limitations and Implications
This study mainly analyzes the relevant water quality parameters of lake Yilong and the characteristics of TN and TP according to the detection data, discusses the hydrochemical properties of lake Yilong and evaluates the water quality. However, this paper also has the following shortcomings and defects: First, the number of monitoring points is limited, and the results may not reflect the whole situation of Lake Yilong well. In addition, due to force majeure, there is a lack of data in individual months in the whole testing year, which affects the continuity of data points. It is believed that with the improvement of monitoring systems and methods, this problem may be solved in the near future. Second, the change of water quality in Lake Yilong was not analyzed in combination with the characteristics of the basin and the impact of human activities (agricultural land use, cattle, urban area, industry, wastewater inflow). Third, in terms of water quality analysis, the impact of other factors that may affect water quality (such as large, submerged plants) has not been fully considered. Therefore, it is necessary to do further research on aquatic plants in order to get the situation in the whole lake in the future.
4. Conclusions
Monitoring of the water quality of a lake is the basis for understanding its development. Analysis of water quality parameter data based on different monitoring points and time of Lake Yilong, allowed the following conclusions to be drawn: The lake water was well mixed during the monitoring period, resulting in no significant thermal stratification.
The water of Lake Yilong began to experience a sudden drop in DO concentration in its northwest part in September and October at a water depth of about 1 m, forming an anoxic environment. The depth and magnitude of the reduction varied with different seasons. At present, it is believed to be caused by a variety of factors, of which the oxidation and decomposition of various organic pollutants in the sediments deposited at the bottom of the lake are considered the most important factors. Seasonal variation: The concentration of Chl-a in Lake Yilong demonstrated obvious changes in different seasons and lake monitoring sites. Analysis at the southwest and center of the lake showed that the concentration reached its maximum in January, while that of the northwest part occurred in September, with the maximum value recorded in October. This phenomenon may be related to the growth of aquatic plants in the lake. TN content in lake Yilong is higher in rainy season, which is related to temperature and precipitation process, and there is a risk of algal proliferation. Therefore, to protect the ecosystem of Lake Yilong, water quality monitoring should be conducted in rainy season. According to the assessment, Lake Yilong changed from middle eutrophic to weak eutrophic in 2016–2018. The eutrophication degree of the lake improved, but TN remained at a high level. Therefore, it is necessary to strengthen lake water quality monitoring and control the adverse effects of human activities on Lake Yilong to prevent water quality deterioration.
Author Contributions
H.Z.: Conceptualization, Supervision, Resources, Writing—review and editing, Foundations acquisition. Q.S.: Methodology, Software, Writing—Original draft preparation. L.D., X.Z., Y.Z. and Q.L.: Investigation, Data Curation. All authors have read and agreed to the published version of the manuscript.
Funding
This research was funded by the Yunnan Provincial Government Scientist workshop and the Special Project for Social Development of Yunnan Province (Grant No. 202103AC100001).
Data Availability Statement
The data that support the findings of this study are available from the corresponding author upon reasonable request.
Acknowledgments
We thank all the graduate students participated the field works and laboratory analyses.
Conflicts of Interest
The authors declare no conflict of interest.
References
- Wang, S.M.; Dou, H.S. Lakes of China; Science Press: Beijing, China, 1998; pp. 1–2. (In Chinese) [Google Scholar]
- Meshesha, T.W.; Wang, J.; Melaku, N.D. Modelling spatiotemporal patterns of water quality and its impacts on aquatic ecosystem in the cold climate region of Alberta, Canada. J. Hydrol. 2020, 587, 124952. [Google Scholar] [CrossRef]
- Ndungu, J.; Augustin, D.; Hulscher, S.; Fulanda, B.; Kitara, N.; Mathooko, J.M. A multivariate analysis of water quality in lake Naivasha, Kenya. Mar. Freshw. Res. 2014, 66, 177–186. [Google Scholar] [CrossRef]
- Saber, A.; James, D.E.; Hannon, I.A. Effects of lake water level fluctuation due to drought and extreme winter precipitation on mixing and water quality of an alpine lake, case study: Lake arrowhead, California. Sci. Total Environ. 2020, 714, 136762. [Google Scholar] [CrossRef] [PubMed]
- Azam Chowdhury, K.M.; Jiang, W.S.; Liu, G.; Md, K.; Shaila, A. Dominant physical-biogeochemical drivers for the seasonal variations in the surface chlorophyll-a and subsurface chlorophyll-a maximum in the Bay of Bengal. Reg. Stud. Mar. Sci. 2021, 48, 102022. [Google Scholar] [CrossRef]
- István, G.H.; Vinicius, D.B.; Péter, T.; József, K.; Székely, K. Spatiotemporal changes and drivers of trophic status over three decades in the largest shallow lake in Central Europe, Lake Balaton. Ecol. Eng. 2020, 151, 105861. [Google Scholar]
- Lv, J.; Li, C.Y.; Zhao, S.N.; Sun, B.; Shi, X.H.; Tian, W.D. Evaluation of nutritional status in Wu Liangsuhai in frozen and non-frozen seasons. J. Arid. Land Resour. Environ. 2018, 32, 6. (In Chinese) [Google Scholar]
- Hou, P.; Chang, F.; Duan, L.; Zhang, Y.; Zhang, H. Seasonal Variation and Spatial Heterogeneity of Water Quality Parameters in Lake Chenghai in Southwestern China. Water 2022, 14, 1640. [Google Scholar] [CrossRef]
- Dong, Y.X.; Zhao, L.; Cheng, Y.H.; Yu, Y.H.; Zhao, R.; Yang, G.P. Succession of Nine Plateau Lakes and Regulation of Ecological Safety in Yunnan Province. Ecol. Econ. 2015, 31, 185–191. (In Chinese) [Google Scholar]
- Bao, Y.F.; Cui, D.W. An analysis of comparative evaluation of the nutrition status of the nine plateau lakes in Yunnan province. Environ. Sci. Surv. 2012, 65, 357–364. (In Chinese) [Google Scholar]
- Zhang, H.C. The Potential Endangers of the Tectonic Lake Water Leakage from Dian chi and Water Security. Adv. Earth Sci. 2016, 31, 849–857, (In Chinese with English Abstract). [Google Scholar]
- Wu, H.; Chang, F.Q.; Zhang, H.C.; Duan, L.Z.; Zhang, X.N.; Peng, W.; Zhang, Y.; Liu, Q.; Liu, F.W. Changes of organic C and N stable isotope and their environmental implication during the past 100 years of Lake Yilong. Chin. J. Ecol. 2020, 8, 2478–2487. (In Chinese) [Google Scholar]
- Liu, W.; Ning, P.; Sun, X.; Ma, Q. The Evolution Tendency of Water Quality and Aquatic System in Lake Yilong. Environ. Sci. Technol. 2018, 41, 281–287. (In Chinese) [Google Scholar]
- Wang, Z.F.; Zhang, W.; Yang, Y.; Xu, Y.P.; Zhao, F.B.; Wang, L.Q. Characteristics of Phytoplankton Community and Its Relationship with Environmental Factors in Different Regions of Yilong Lake, Yunnan Province, China. Environ. Sci. 2019, 40, 2249–2257. (In Chinese) [Google Scholar]
- Wu, T.; Wang, S.; Su, B.; Wu, H.; Wang, G. Understanding the water quality change of the Yilong lake based on comprehensive assessment methods. Ecol. Indic. 2021, 126, 107714. [Google Scholar] [CrossRef]
- Yuan, Z.J.; Wu, D.; Niu, L.; Ma, X.; Li, Y.; Hillman, A.L.; Abbott, M.B.; Zhou, A. Contrasting ecosystem responses to climatic events and human activity revealed by a sedimentary record from Lake Yilong, southwestern China. Sci. Total Environ. 2021, 783, 146922. [Google Scholar] [CrossRef]
- Chen, J.; Qin, J.; Zhou, Q.C.; Nie, J.F.; Zhou, H.X. Application of wetland ecological restoration technology in plateau lakes. Environ. Sci. Technol. 2016, 39, 158–168. [Google Scholar]
- Li, X.J. Current Status and Countermeasures of Fishery Industry Development of Lake Yilong in Shiping County. Mod. Agric. Technol. 2014, 03, 328–333. (In Chinese) [Google Scholar]
- Wang, Z.Z. Study on Algae Plants and Fish Productivity in Lake Yilong Yunnan Province. J. Fish. China 1997, 21, 93–96. (In Chinese) [Google Scholar]
- Liu, P.; Chang, F.Q.; Wu, H.B. Health Evaluation of Wetland Ecosystem in Yi-long Lake Basin. Wetl. Sci. Manag. 2016, 12, 30–34. (In Chinese) [Google Scholar]
- She, L.H.; Liu, P.C.; Zhang, F.Q.; Cai, F. Situation and protection countermeasures on lake Yilong wetland in Yunnan. For. Constr. 2016, 04, 15–18. (In Chinese) [Google Scholar]
- Zhang, H. Application of Comprehensive Eutrophication State Index Method in Evaluation of Chaohu Lake Reservoir Eutrophication. Anhui Agric. Sci. Bull. 2018, 24, 4. (In Chinese) [Google Scholar]
- Chen, S.S. Climate Change and Human Activities Indicated by the Sediments of Yilong Lake; Kun Ming Yunnan Normal University: Kunming, China, 2015. (In Chinese) [Google Scholar]
- State Environmental Protection Administration (SEPA). Water and Wastewater Monitoring and Analysis Method, 4th ed.; China Environmental Science Press: Beijing, China, 2002; Volume 2, pp. 12–36. (In Chinese) [Google Scholar]
- Li, Y.; Wang, L.; Yan, Z.; Chao, C.; Yu, H.; Yu, D.; Liu, C. Effectiveness of dredging on internal phosphorus loading in a typical aquacultural lake. Sci. Total Environ. 2020, 744, 140883. [Google Scholar] [CrossRef] [PubMed]
- Cai, M.; Zhang, H.C.; Chang, F.Q.; Li, T.; Hu, J.J.; Duan, L.Z.; Zhang, Y. Nitrogen and Phosphorus Content Changes of the Lake Water Samples from the Typical Yunnan Plateau Lakes. Resour. Environ. Yangtze Basin 2019, 12, 3030–3037. (In Chinese) [Google Scholar]
- Wang, M.; Liu, X.; Zhang, J. Evaluation method and classification standard on lake eutrophication. Environ. Monitor. China 2002, 18, 47–49. (In Chinese) [Google Scholar]
- He, Y.F.; Li, H.C.; Zhu, Y.J.; Yang, D.G. Status and spatial-temporal variations of eutrophication in lake Changhu, Hubei province. J. Lake Sci. 2015, 27, 853–864. (In Chinese) [Google Scholar]
- Luo, L.; Zhang, H.; Luo, C.; McBride, C.; Muraoka, K.; Zhou, H.; Hou, C.; Liu, F.; Li, H. Tributary Loadings and Their Impacts on Water Quality of Lake Xingyun, a Plateau Lake in Southwest China. Water 2022, 14, 1281. [Google Scholar] [CrossRef]
- China National Environmental Monitoring Centre. Lake (Reservoir) Eutrophication Evaluation Method and Classification Technical Provisions, 2001; China National Environmental Monitoring Centre: Beijing, China, 2002. (In Chinese) [Google Scholar]
- Zhao, L.L.; Zhu, G.W.; Chen, Y.F.; Li, W.; Zhu, M.Y.; Yao, X.; Cai, L.L. Characteristics of vertical stratification of water temperature in Lake Tai and its influencing factors. Adv. Water Sci. 2011, 22, 844–850. [Google Scholar]
- Liu, Y.; Yang, F.; Gao, Y.X.; Zhu, Y.M.; Kou, M.; Zhao, Y.; Qian, W.H. Temporal and Spatial Variation Characteristics of Chlorophyll a and Analysis of Related Environmental Factors in the Estuary Area of Lake Ge. J. Ecol. Rural Environ. 2021, 37, 733–739. [Google Scholar]
- Song, Y.L.; Zhang, J.S. Spatiotemporal distribution of chlorophyll a and its influencing factors in SHIYAN reservoirs. Environ. Sci. 2017, 38, 3302–3311. [Google Scholar]
- Tian, P.; Li, Y.L.; LI, Y.J.; Li, H.; Wang, L.J.; Song, L.X.; Ji, D.B.; Zhao, X.X. Influence of Three Gorges Reservoir Operation on the Vertical Distribution of Chlorophyll a and Environmental Factors in Tributary Water. Environ. Sci. 2022, 43, 295–350. (In Chinese) [Google Scholar]
- Shi, L.P.; Sun, Q.Y. Brief Talk on Effect of Aquatic Plant Purifying Water body of Yilong Lake. Yunnan Environ. Sci. 2005, 24, 40–42. (In Chinese) [Google Scholar]
- Li, D.; Chang, F.; Wen, X.; Duan, L.; Zhang, H. Seasonal Variations in Water Quality and Algal Blooming in Hypereutrophic Lake Qilu of Southwestern China. Water 2022, 14, 2611. [Google Scholar] [CrossRef]
- Hideki, T.; Hironori, F.; Mirai, W.; Seiji, H. Effects of temperature and oxygen on 137Cs desorption from bottom sediment of a dam lake. Appl. Geochem. 2022, 140, 105303. [Google Scholar]
- Chang, F.; Hou, P.; Wen, X.; Duan, L.; Zhang, Y.; Zhang, H. Seasonal Stratification Characteristics of Vertical Profiles and Water Quality of Lake Lugu in Southwest China. Water 2022, 14, 2554. [Google Scholar] [CrossRef]
- Xu, W.; Duan, L.; Wen, X.; Li, H.; Li, D.; Zhang, Y.; Zhang, H. Effects of Seasonal Variation on Water Quality Parameters and Eutrophication in Lake Yangzong. Water 2022, 14, 2732. [Google Scholar] [CrossRef]
- Zhao, L.; Wang, M.; Liang, Z. Identification of Regime Shifts and Their Potential Drivers in the Shallow Eutrophic Lake Yilong, Southwest China. Sustainability 2020, 12, 3704. [Google Scholar] [CrossRef]
- Wei, X.; Tang, G.M. Changes of Nutrients and Aquatic Ecosystem of Yilong Lake in Recent Twenty Decades. Yunnan Environ. Sci. 2014, 33, 9–14. (In Chinese) [Google Scholar]
- Zhang, H.X. Evolution of Water Ecological Environment Quality of Typical Lakes and Reservoirs and Its Response to Climate Change; Chinese Academy of Environmental Sciences: Beijing, China, 2019. (In Chinese) [Google Scholar]
- Zhang, L.; Liu, Y.J.; Ge, F.J.; Xue, P.; Li, X.; Zhang, X.Y.; Zhang, S.X.; Zhou, Q.H.; Wu, Z.B.; Liu, B.Y. Spatial characteristics of nitrogen forms in a large degenerating lake: Its relationship with dissolved organic matter and microbial community. J. Clean. Prod. 2022, 371, 133617. [Google Scholar] [CrossRef]
- O’Reilly, C.M.; Alin, S.R.; Plisnier, P.D. Climate Change Decreases Aquatic Ecosystem Productivity of Lake Tanganyika, Africa. Nature 2003, 424, 766–768. [Google Scholar] [CrossRef]
- Niu, Z.Y.; Shen, X.X.; Chai, M.W.; Xu, L.H.; Li, R.L.; Qiu, G.Y. Characteristics of Water Quality Changes in the Futian Mangrove National Natural Reserve. Acta Sci. Rum Nat. Univ. Pekin. 2018, 54, 137–145. [Google Scholar]
- Mi, W.M.; Shi, J.Q.; Yang, Y.J.; Yang, S.Q.; He, S.H.; Wu, Z.X. Changes of algae communities in Meixi River, a tributary of the Three Gorges Reservoir Area, and its relationship with environmental factors. Environ. Sci. 2020, 41, 1636–1647. [Google Scholar]
- GB3838–2002; Environmental Quality Standard for Surface Water. State Environmental Protection Administration (SEPA): Beijing, China, 2002; pp. 1–8. (In Chinese)
Figure 1.
Water quality monitoring sites of Lake Yilong.

Figure 2.
Seasonal and interannual variations in water temperature in lake Yilong. (a) Seasonal variations in water temperature; (b) Interannual variations in water temperature.
Figure 2.
Seasonal and interannual variations in water temperature in lake Yilong. (a) Seasonal variations in water temperature; (b) Interannual variations in water temperature.

Figure 3.
Change in precipitation, air temperature and water temperature in Lake Yilong from 2016–2017.
Figure 3.
Change in precipitation, air temperature and water temperature in Lake Yilong from 2016–2017.

Figure 4.
Seasonal and interannual variations in Chl-a in lake Yilong. (a) Seasonal variations in water temperature; (b) Interannual variations in water temperature.
Figure 4.
Seasonal and interannual variations in Chl-a in lake Yilong. (a) Seasonal variations in water temperature; (b) Interannual variations in water temperature.

Figure 5.
Seasonal and interannual variations in DO in lake Yilong. (a) Seasonal variations in water temperature; (b) Interannual variations in water temperature.
Figure 5.
Seasonal and interannual variations in DO in lake Yilong. (a) Seasonal variations in water temperature; (b) Interannual variations in water temperature.

Figure 6.
Seasonal and interannual variations in pH in lake Yilong. (a) Seasonal variations in water temperature; (b) Interannual variations in water temperature.
Figure 6.
Seasonal and interannual variations in pH in lake Yilong. (a) Seasonal variations in water temperature; (b) Interannual variations in water temperature.

Figure 7.
The change in TN and TP concentration in Lake Yilong from October 2016 to August 2018.

Figure 8.
Correlations of each water parameter (a) and principal component (b) analysis of Lake Yilong.
Figure 8.
Correlations of each water parameter (a) and principal component (b) analysis of Lake Yilong.


Table 1.
Correlation coefficient for Chl-a to other parameters in Chinese lakes and reservoirs.
| Parameter | Chl-a | TN | TP | SD | CODMn |
|---|---|---|---|---|---|
| 1 | 0.82 | 0.84 | −0.83 | 0.83 | |
| 1 | 0.6724 | 0.7056 | 0.6889 | 0.6889 |
Table 2.
Trophic Level Index (TLI) value ranges and corresponding trophic status for Chinese lakes.
| TLI | TLI < 30 | 30 ≤ TLI ≤ 50 | 50 < TLI < 60 | 60 < TLI ≤ 70 | TLI >70 |
|---|---|---|---|---|---|
| Eutrophic status | Oligotrophic | Mesotrophic | Weak–eutrophic | Middle-eutrophic | Hyper-eutrophic |
Publisher’s Note: MDPI stays neutral with regard to jurisdictional claims in published maps and institutional affiliations. |
© 2022 by the authors. Licensee MDPI, Basel, Switzerland. This article is an open access article distributed under the terms and conditions of the Creative Commons Attribution (CC BY) license (https://creativecommons.org/licenses/by/4.0/).
Share and Cite
MDPI and ACS Style
Sui, Q.; Duan, L.; Zhang, Y.; Zhang, X.; Liu, Q.; Zhang, H. Seasonal Water Quality Changes and the Eutrophication of Lake Yilong in Southwest China. Water 2022, 14, 3385. https://doi.org/10.3390/w14213385
AMA Style
Sui Q, Duan L, Zhang Y, Zhang X, Liu Q, Zhang H. Seasonal Water Quality Changes and the Eutrophication of Lake Yilong in Southwest China. Water. 2022; 14(21):3385. https://doi.org/10.3390/w14213385
Chicago/Turabian StyleSui, Qingyu, Lizeng Duan, Yang Zhang, Xiaonan Zhang, Qi Liu, and Hucai Zhang. 2022. "Seasonal Water Quality Changes and the Eutrophication of Lake Yilong in Southwest China" Water 14, no. 21: 3385. https://doi.org/10.3390/w14213385
Note that from the first issue of 2016, this journal uses article numbers instead of page numbers. See further details here.