
Fate of Heavy Metals in the Surface Water-Dump Rock System of the Mine Lupikko I (Karelia): Field Observations and Geochemical Modeling
 , , ,
, , ,
Abstract
:1. Introduction
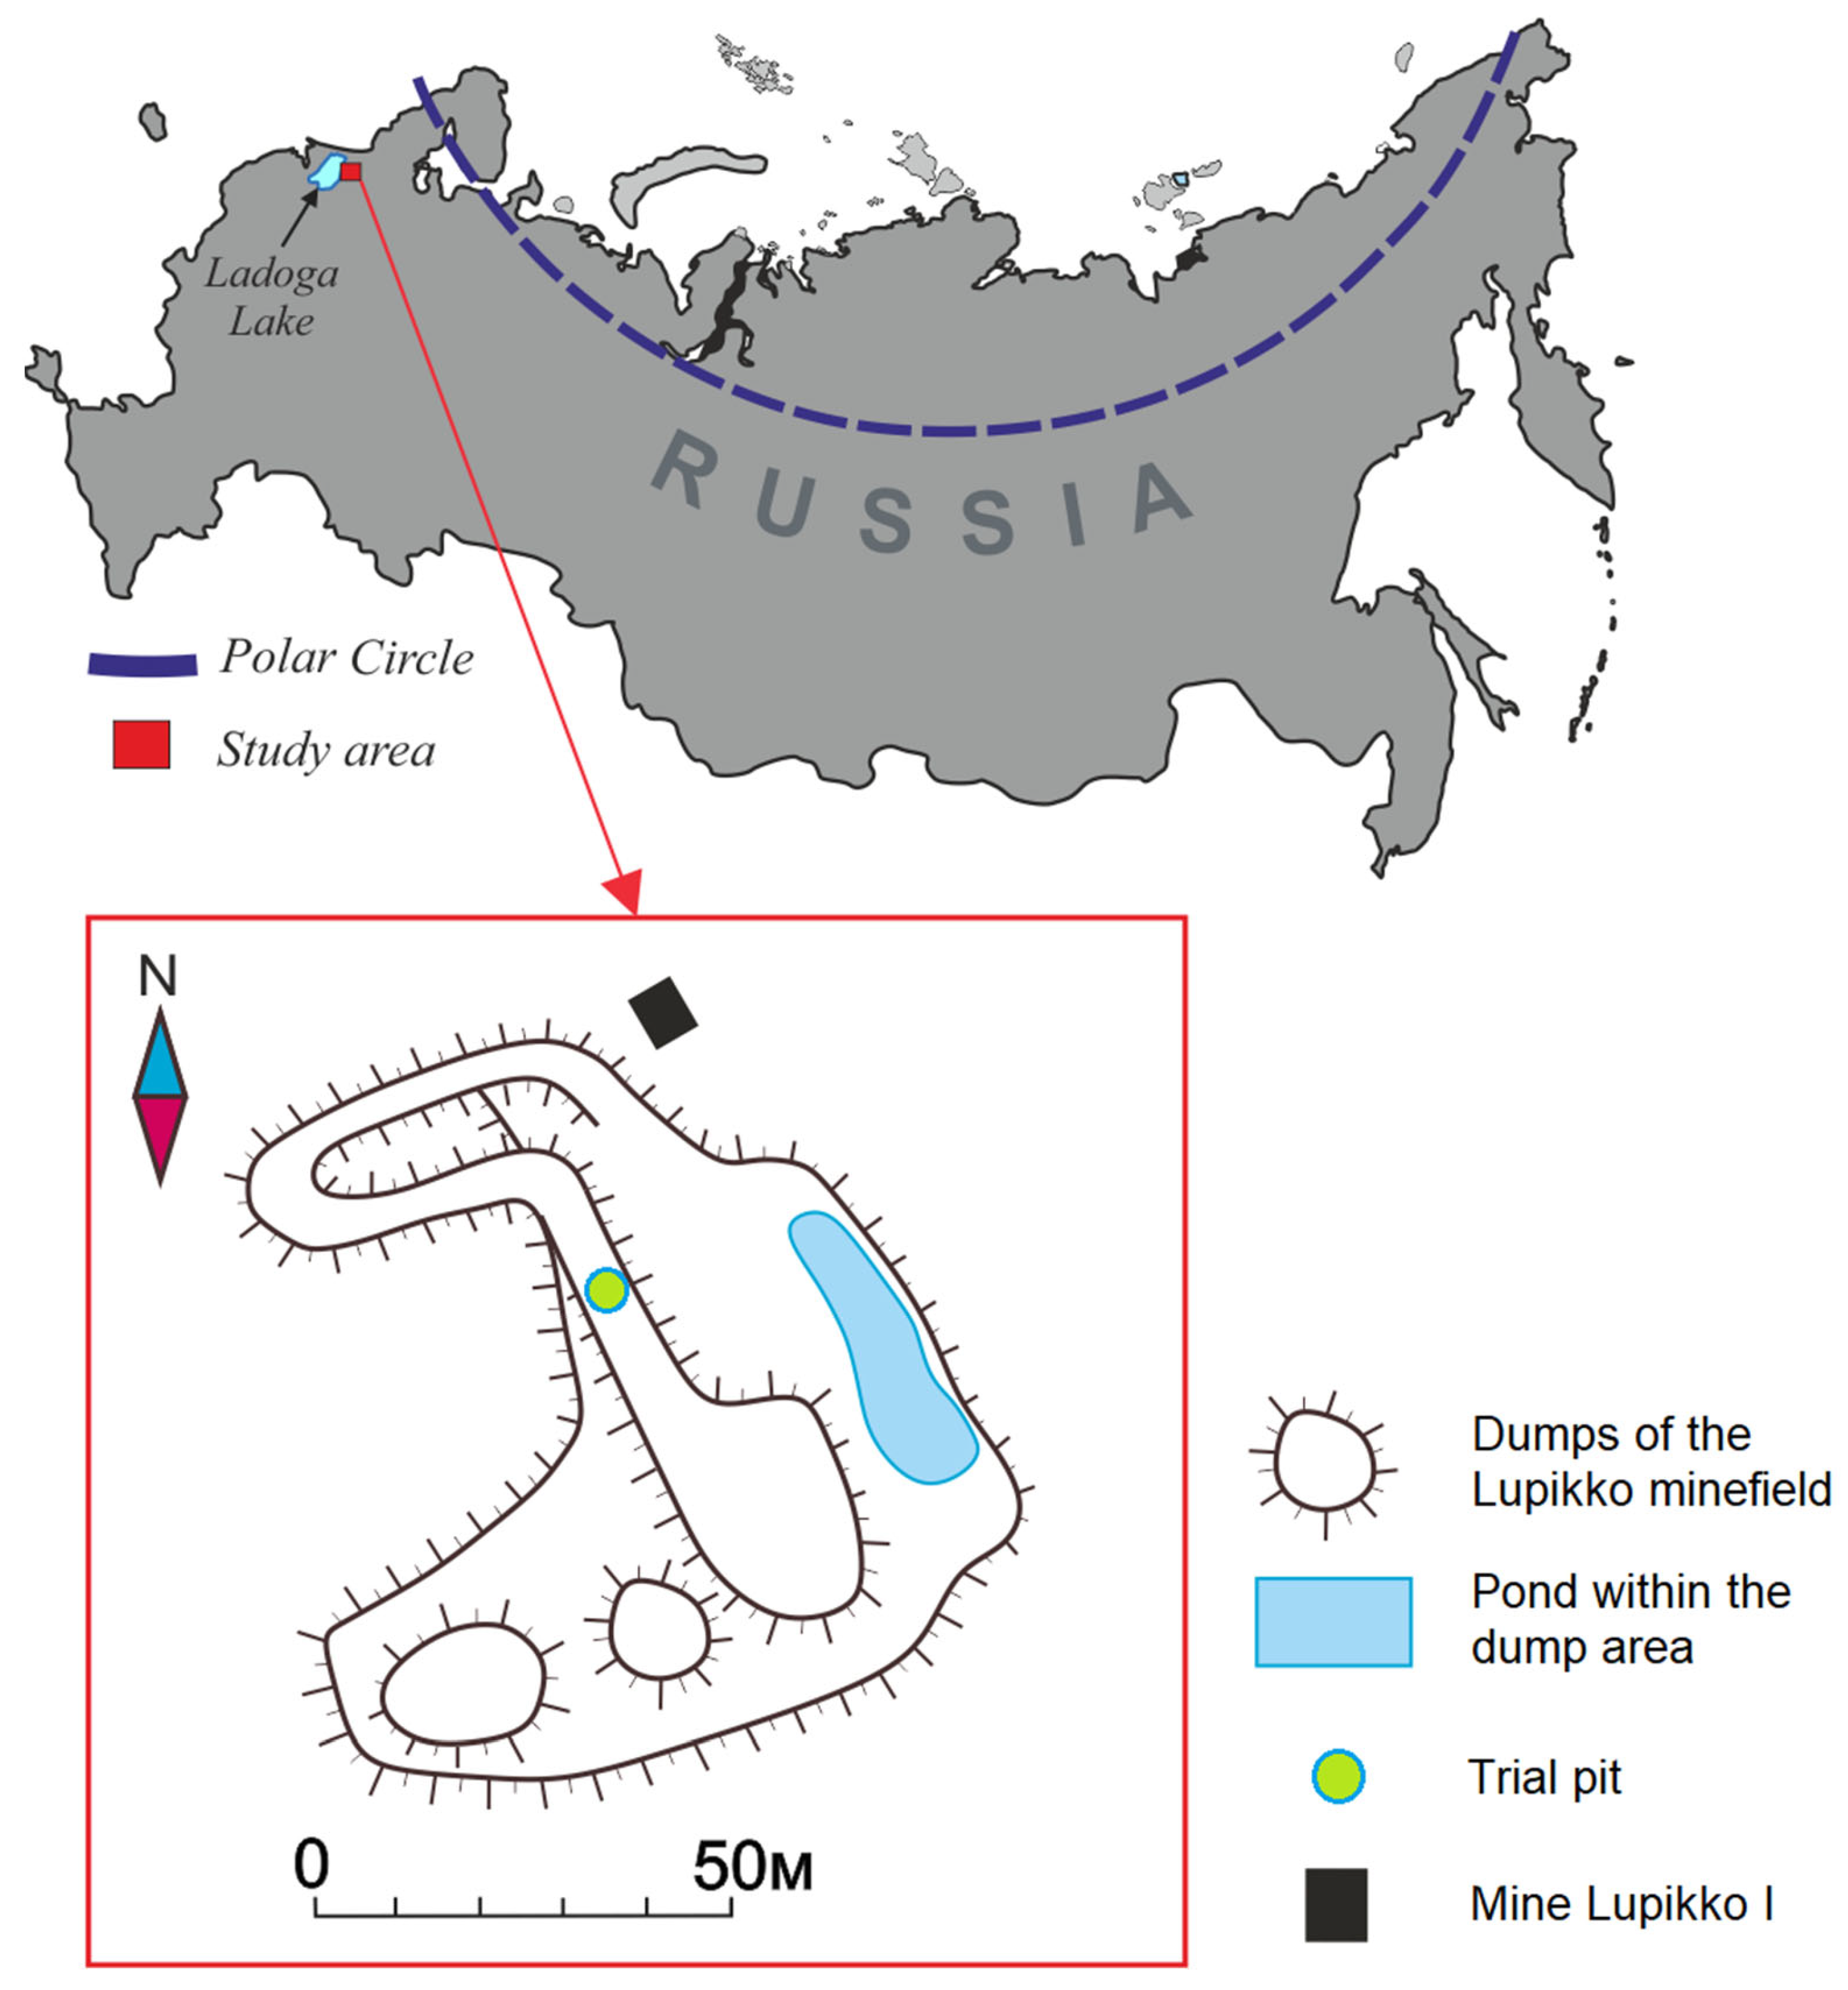
2. Study Area
2.1. Historical Background
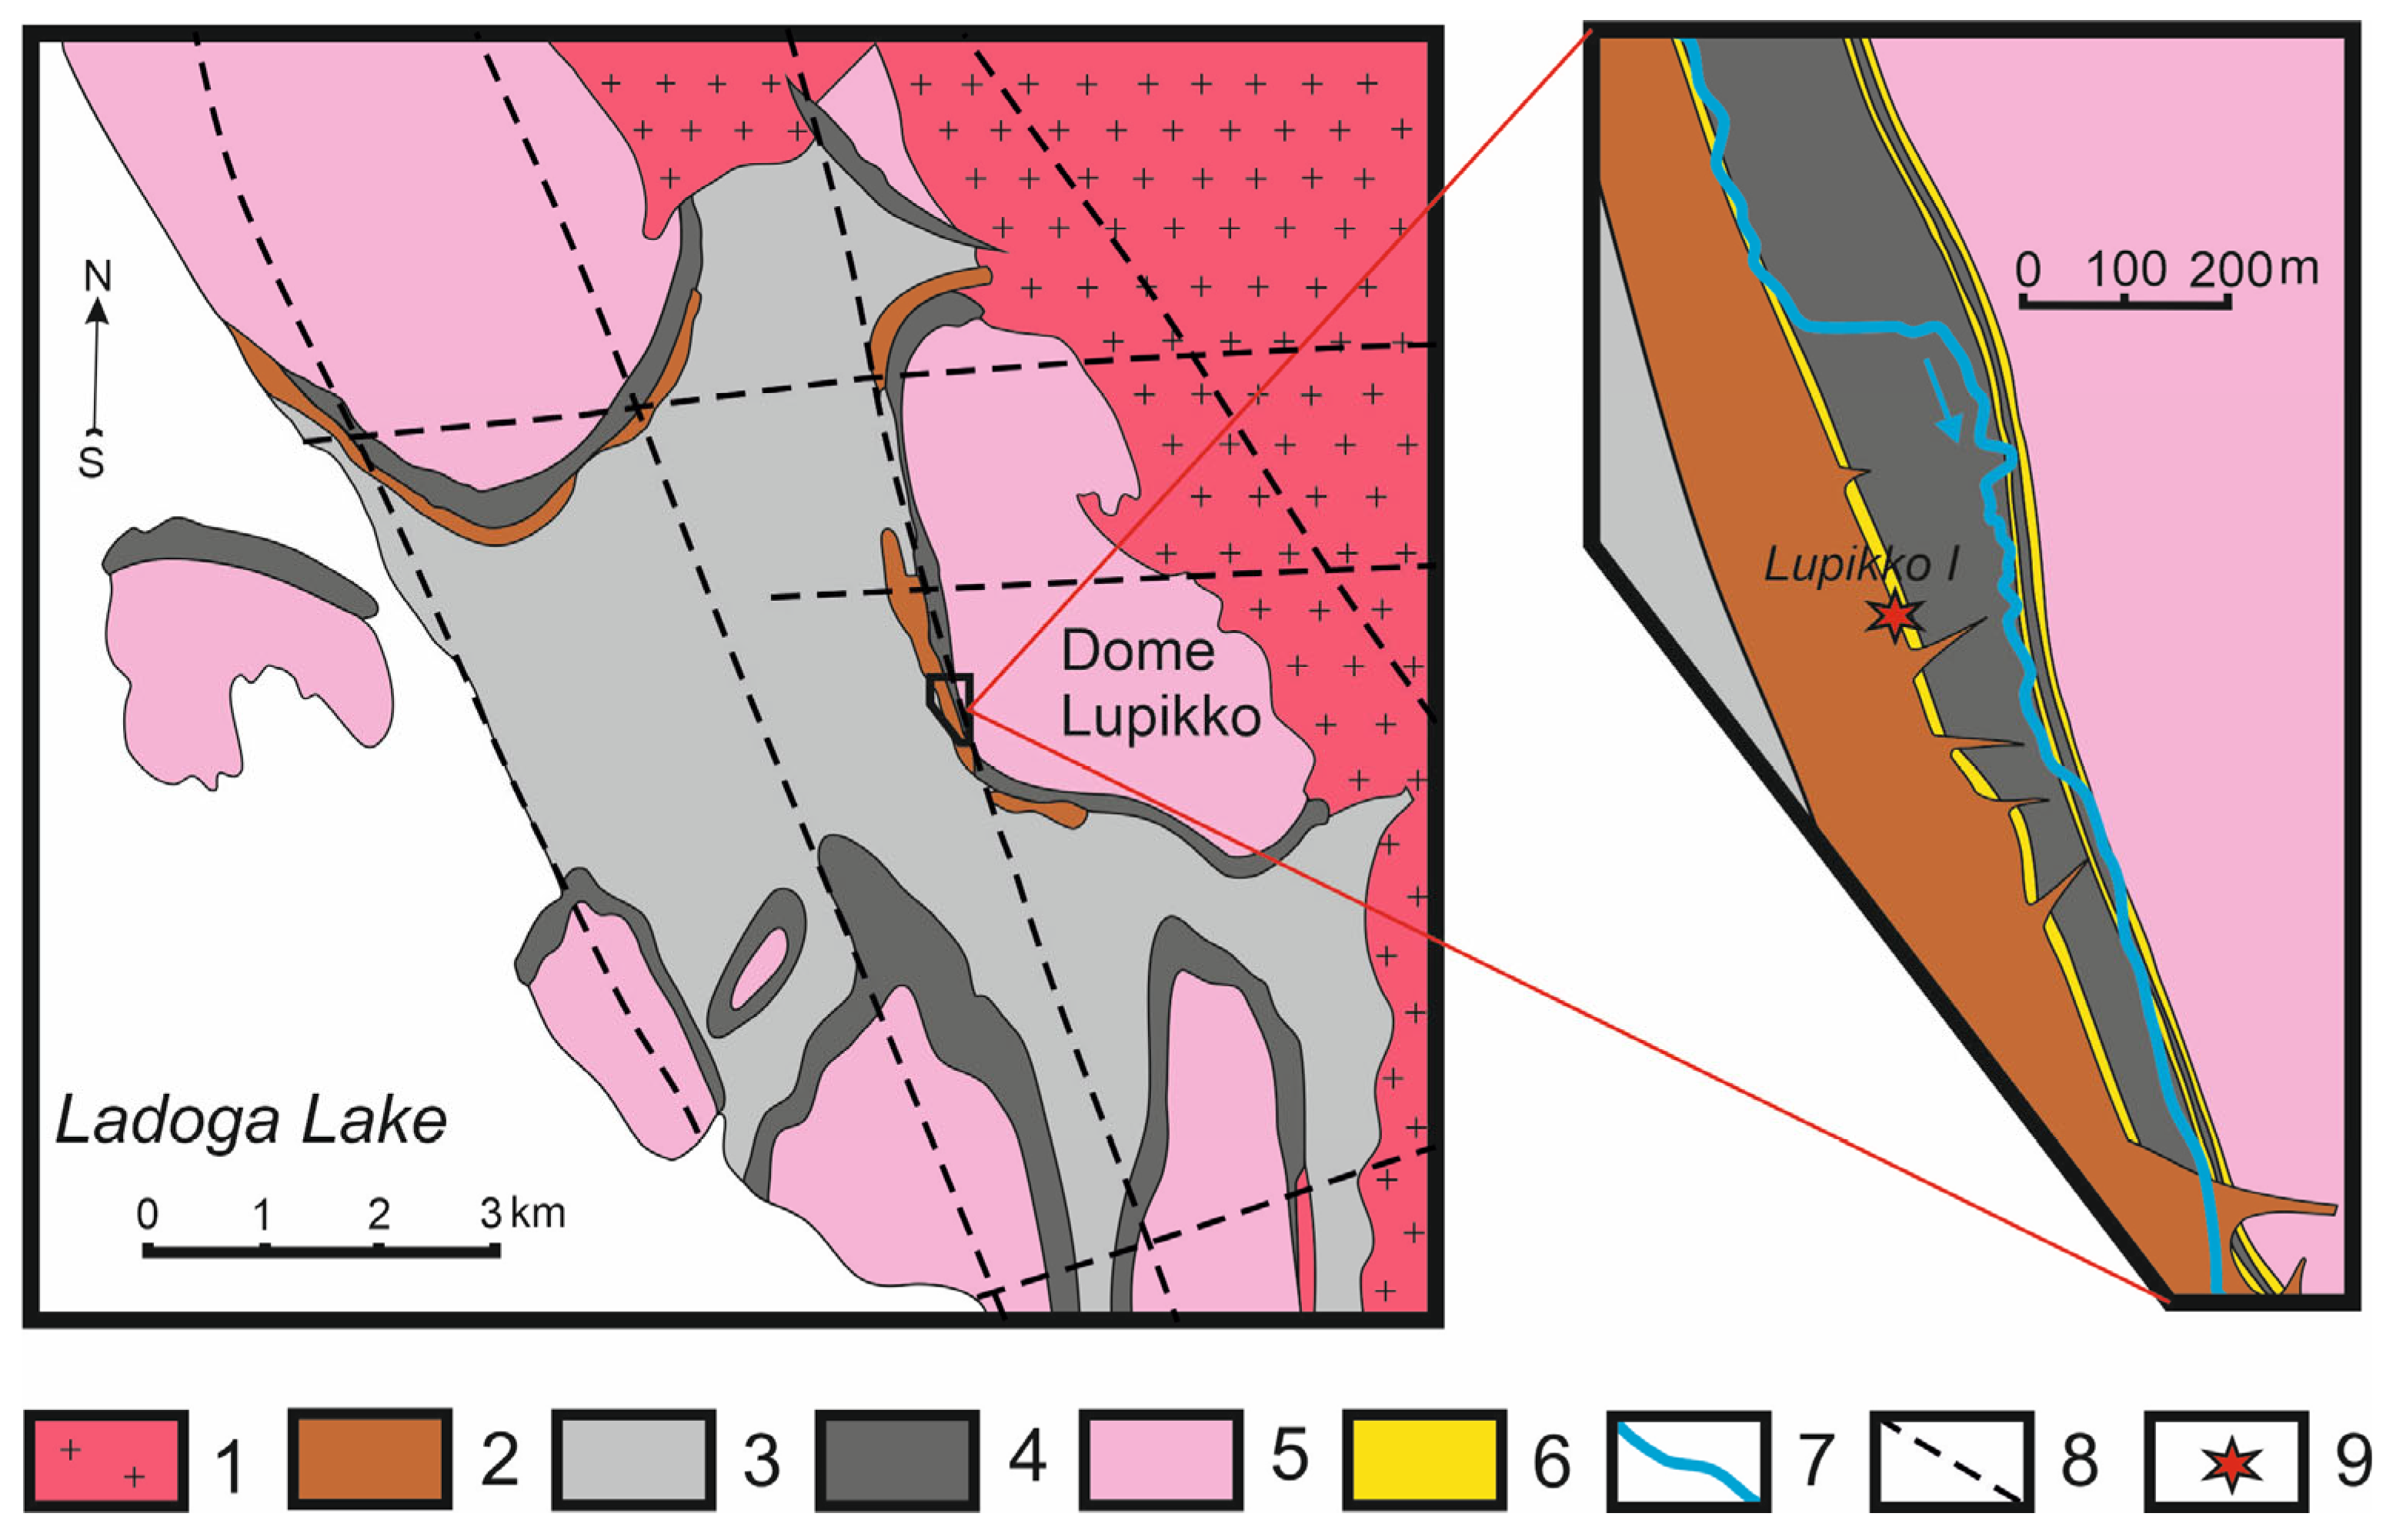
2.2. Geological Settings
3. Methodology
3.1. Sampling and Analytical Methods
3.2. Equilibrium-Kinetic Modeling
3.2.1. Modeling Scheme
3.2.2. Initial Data for Modeling
4. Results and Discussion
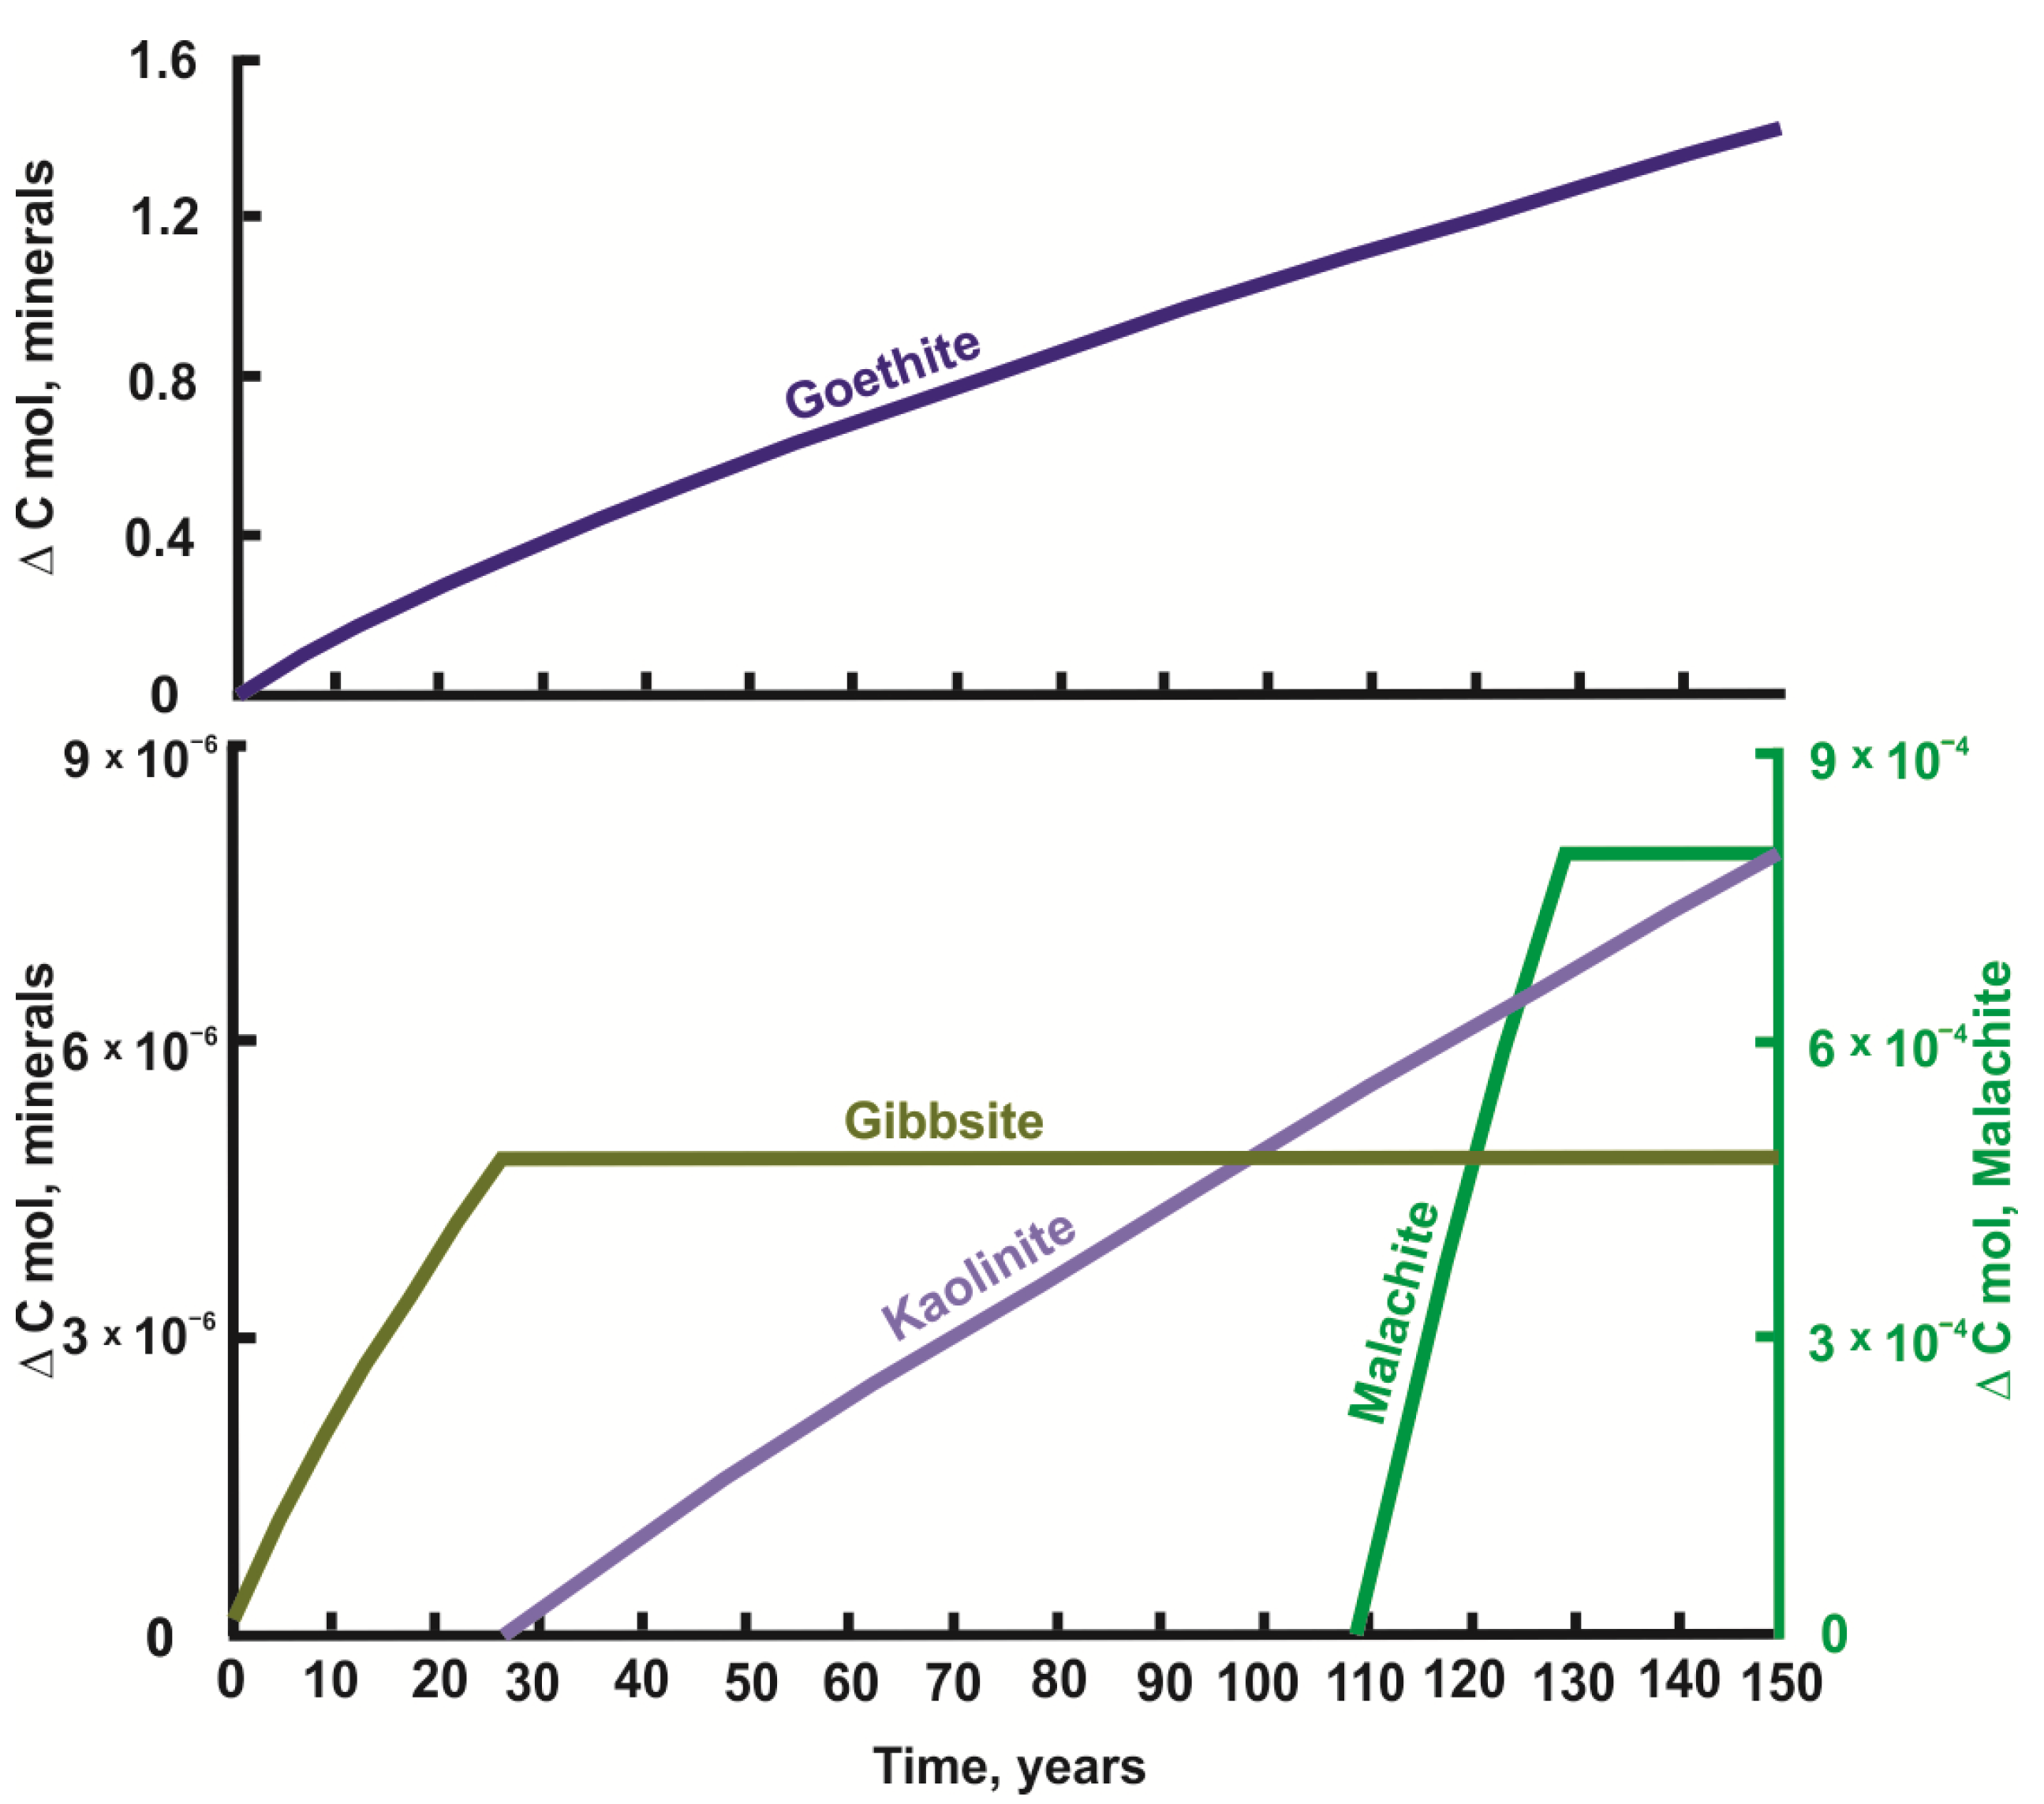
4.1. Modeling Results
4.2. Comparison of Modeling Results with Field Observations
5. Conclusions
Author Contributions
Funding
Institutional Review Board Statement
Informed Consent Statement
Data Availability Statement
Acknowledgments
Conflicts of Interest
Appendix A

| % | Skarnified Marble with a Subordinate Amount of Magnetite (1) | Magnetite with a Subordinate Amount of Skarn (2) | Aposkarn Greisen with High Sulfide Content (3) | Aposkarn Greisen with Low Sulfide Content (4) |
|---|---|---|---|---|
| Na2O | <0.10 | 0.39 | <0.10 | <0.10 |
| MgO | 2.66 | 5.68 | 5.27 | 23.11 |
| Al2O3 | 9.20 | 5.74 | 1.88 | 0.71 |
| SiO2 | 15.77 | 19.52 | 7.57 | 15.85 |
| K2O | 5.01 | 0.70 | 0.13 | 0.05 |
| CaO | 13.78 | 26.80 | 2.32 | 2.67 |
| Fe2O3 | 36.09 | 18.45 | 81.72 | 51.78 |
| S | 1.75 | 6.22 | 0.10 | 0.09 |
| F | 12.84 | 10.64 | 0.87 | 2.72 |
| LOI | 1.04 | 1.63 | 1.59 | 2.10 |
| Elements, ppm | ||||
| Ni | 25 | 10 | <10 | <10 |
| Cu | 11696 | 53193 | 126 | 20 |
| Zn | 1741 | 1255 | 2498 | 1252 |
| Pb | 19 | 64 | 22 | 17 |
| Minerals | Aqueous Species | |||||
|---|---|---|---|---|---|---|
| Albite | Hematite | H2O, aq | HCdO2− | FeF2+ | NaSO4− | HZnO2− |
| Annite | Illite | O2, aq | Cu+ | FeO, aq | Ni2+ | ZnOH+ |
| Antigorite | Kaolinite | H2, aq | Cu2+ | FeO+ | NiCl+ | ZnO, aq |
| Azurite | Kyanite | H+ | CuF+ | FeO2− | NiF+ | ZnO22− |
| Boehmite | Laumontite | OH− | CuO, aq | FeCl+ | NiO, aq | ZnCl3− |
| Bornite | Lawrencite | AlO2− | CuCl+ | Fe+3 | NiO22− | ZnCl2, aq |
| Calcite | Lawsonite | AlOH2+ | CuCl2− | FeCl2, aq | NiOH+ | ZnCl+ |
| Cerussite | Magnesite | HAlO2, aq | CuCl2, aq | HFeO2− | HNiO2− | ZnF+ |
| Chalcocite | Magnetite | AlO+ | CuCl42− | HFeO2, aq | Pb2+ | |
| Chalcopyrite | Malachite | Al3+ | CuHS, aq | FeOH+ | Pb(HS)2, aq | Gas |
| Chrysotile | Microcline | CaCO3, aq | CuO22− | FeOH2+ | Pb(HS)3− | O2 |
| Clinochlore | Montmorillonite-Ca | Ca2+ | CuOH, aq | K+ | PbCl+ | CO2 |
| Clinohumite-F | Montmorillonite-K | CaHCO3+ | CuOH+ | KCl, aq | PbCl42− | |
| Clinohumite-OH | Montmorillonite-Na | CaHSiO3+ | CuCl3− | KHSO4, aq | PbF+ | |
| Covellite | Muscovite | CaOH+ | CuCl, aq | KOH, aq | PbF2, aq | |
| Cuprite | NiCO3 | CaF+ | Cu(OH)2− | KSO4− | PbO, aq | |
| Daphnite | Pb3(CO3)2(OH)2 | CaCl2, aq | HCuO2− | Mg2+ | PbOH+ | |
| Diaspore | PbO2 | CaSO4, aq | Cu(HS)2− | MgCl+ | HPbO2− | |
| Diopside | Phlogopite | CaCl+ | Cl− | MgCO3, aq | PbCl2, aq | |
| Dolomite | Pyrite | Cd2+ | HCl, aq | MgF+ | PbCl3− | |
| Fe(OH)3 | Amorphous-sili | CdO22− | F− | MgHCO3+ | H2S, aq | |
| Fluorite | Siderite | CdCl+ | HF2− | MgHSiO3+ | HSO3− | |
| Galena | Smithsonite | CdCl2, aq | HF, aq | MgOH+ | HS− | |
| Gehlenite | Sphalerite | CdCl3− | CO32− | MgSO4, aq | HSO4− | |
| Gibbsite | Stellerite | CdCl42− | CO2, aq | Na+ | SO42− | |
| Goethite | Stilbite | CdF+ | HCO3− | NaHSiO3, aq | SO, aq | |
| Greenalite | Talc | CdF2, aq | Fe2+ | NaF, aq | SiO2, aq | |
| Gypsum | Zincite | CdO, aq | FeCl2+ | NaCl, aq | HSiO3− | |
| Halite | Zoisite | CdOH+ | FeF+ | NaOH, aq | Zn2+ | |
References
- Tubis, A.; Werbińska-Wojciechowska, S.; Wroblewski, A. Risk Assessment Methods in Mining Industry—A Systematic Review. Appl. Sci. 2020, 10, 5172. [Google Scholar] [CrossRef]
- Howett, P.J.; Salonen, V.-P.; Hyttinen, O.; Korkka-Niemi, K.; Moreau, J. A hydrostratigraphical approach to support environmentally safe siting of a mining waste facility at Rautuvaara, Finland. Bull. Geol. Soc. Finl. 2015, 87, 51–66. [Google Scholar] [CrossRef]
- Aydın, M.; Tunca, E. Ecological risk assessment of elemental accumulation under the impact of gold mine. Int. J. Environ. Sci. Technol. 2022, 19, 7093–7112. [Google Scholar] [CrossRef]
- Vaziri, V.; Sayadi, A.R.; Mousavi, A.; Parbhakar-Fox, A.; Monjezi, M. Mathematical modeling for optimized mine waste rock disposal: Establishing more effective acid rock drainage management. J. Clean. Prod. 2021, 288, 125124. [Google Scholar] [CrossRef]
- Wang, Y.; Wu, X.; He, S.; Niu, R. Eco-environmental assessment model of the mining area in Gongyi, China. Sci. Rep. 2021, 11, 17549. [Google Scholar] [CrossRef]
- Malov, A.I.; Sidkina, E.S.; Mironenko, M.V.; Tyshov, A.S.; Cherkasova, E.V. Modeling Changes in the Composition of River Water with Discharged Wastewater: A Case Study in NW Russia. Water 2022, 14, 165. [Google Scholar] [CrossRef]
- Thorslund, J.; Jarsjö, J.; Chalov, S.R.; Belozerova, E.V. Gold mining impact on riverine heavy metal transport in a sparsely monitored region: The upper Lake Baikal Basin case. J. Environ. Monit. 2012, 14, 2780–2792. [Google Scholar] [CrossRef]
- Pierwoła, J.; Szuszkiewicz, M.; Cabala, J.; Jochymczyk, K.; Żogała, B.; Magiera, T. Integrated geophysical and geochemical methods applied for recognition of acid waste drainage (AWD) from Zn-Pb post-flotation tailing pile (Olkusz, southern Poland). Environ. Sci. Pollut. Res. 2020, 27, 16731–16744. [Google Scholar] [CrossRef] [Green Version]
- Saryg-ool, B.Y.; Myagkaya, I.N.; Kirichenko, I.S.; Gustaytis, M.A.; Shuvaeva, O.V.; Zhmodik, S.M.; Lazareva, E.V. Redistribution and speciation of elements in gold-bearing sulfide mine tailings interbedded with natural organic matter: Case study of Novo-Ursk deposit, Kemerovo Region, Siberia. Geochem. Explor. Environ. Anal. 2020, 20, 323–336. [Google Scholar] [CrossRef]
- Sui, C.; Fatichi, S.; Burlando, P.; Weber, E.; Battista, G. Modeling distributed metal pollution transport in a mine impacted catchment: Short and long-term effects. Sci. Total Environ. 2022, 812, 151473. [Google Scholar] [CrossRef]
- Esteller, M.V.; Domínguez-Mariani, E.; Garrido, S.E.; Avilés, M. Groundwater pollution by arsenic and other toxic elements in an abandoned silver mine, Mexico. Environ. Earth Sci. 2015, 74, 2893–2906. [Google Scholar] [CrossRef]
- Mhlongo, S.E.; Amponsah-Dacosta, F. A review of problems and solutions of abandoned mines in South Africa. Int. J. Min. Reclam. Environ. 2016, 30, 279–294. [Google Scholar] [CrossRef]
- Navarro, M.C.; Pérez-Sirvent, C.; Martínez-Sánchez, M.J.; Vidal, J.; Tovar, P.J.; Bech, J. Abandoned mine sites as a source of contamination by heavy metals: A case study in a semi-arid zone. J. Geochem. Explor. 2008, 2–3, 183–193. [Google Scholar] [CrossRef]
- Ryzhenko, B.N.; Cherkasova, E.V. Simulation of geochemical processes responsible for the formation of the Zhezqazghan deposit. Geol. Ore Depos. 2014, 56, 200–207. [Google Scholar] [CrossRef]
- Cidu, R.; Dore, E.; Biddau, R.; Nordstrom, D.K. Fate of Antimony and Arsenic in Contaminated Waters at the Abandoned Su Suergiu Mine (Sardinia, Italy). Mine Water Environ. 2018, 37, 151–165. [Google Scholar] [CrossRef]
- Xing, Y.; Etschmann, B.; Liu, W.; Mei, Y.; Shvarov, Y.; Testemale, D.; Tomkins, A.; Brugger, J. The role of fluorine in hydrothermal mobilization and transportation of Fe, U and REE and the formation of IOCG deposits. Chem. Geol. 2019, 504, 158–176. [Google Scholar] [CrossRef]
- Bortnikova, S.; Gaskova, O.; Yurkevich, N.; Saeva, O.; Abrosimova, N. Chemical treatment of highly toxic acid mine drainage at a gold mining site in Southwestern Siberia, Russia. Minerals 2020, 10, 867. [Google Scholar] [CrossRef]
- Limantseva, O.A.; Ryzhenko, B.N. Geochemical Assessment of the Ecological State of the Territory of a Cu–Ore Deposit by Thermodynamic Modeling of the Water–Rock–Gas System. Geochem. Int. 2020, 58, 1430–1436. [Google Scholar] [CrossRef]
- Ryzhenko, B.N. Physicochemical Computer Simulation of Hydrogeochemical, Ecological, and Hydrothermal Processes in the Earth’s Crust. Geochem. Int. 2020, 58, 1391–1404. [Google Scholar] [CrossRef]
- Zolotov, M.Y.; Mironenko, M.V. Timing of acid weathering on Mars: A kinetic-thermodynamic assessment. J. Geophys. Res. Planets 2007, 112, 7006. [Google Scholar] [CrossRef]
- Fuoco, I.; De Rosa, R.; Barca, D.; Figoli, A.; Gabriele, B.; Apollaro, C. Arsenic polluted waters: Application of geochemical modelling as a tool to understand the release and fate of the pollutant in crystalline aquifers. J. Environ. Manag. 2022, 301, 113796. [Google Scholar] [CrossRef] [PubMed]
- Fuoco, I.; Marini, L.; De Rosa, R.; Figoli, A.; Gabriele, B.; Apollaro, C. Use of reaction path modelling to investigate the evolution of water chemistry in shallow to deep crystalline aquifers with a special focus on fluoride. Sci. Total Environ. 2022, 830, 154566. [Google Scholar] [CrossRef] [PubMed]
- Sidkina, E.S.; Mironenko, M.V.; Cherkasova, E.V. Application of Equilibrium-Kinetic Modeling for Predicting the Chemical Composition of Subdump Waters of the Udokan Deposit (Russia). Geochem. Int. 2020, 58, 1419–1429. [Google Scholar] [CrossRef]
- Cherkasova, E.V.; Mironenko, M.V.; Sidkina, E.S. Equilibrium–Kinetic Modeling an Acid Mine Drainage of Integrated Technological Sample from the Pavlovskoe Ore Deposit (Novaya Zemlya Archipelago, Southern Island). A Preliminary Estimation. Geochem. Int. 2021, 59, 191–198. [Google Scholar] [CrossRef]
- Trüstedt, O. Die Erzlagerstätten von Pitkäranta am Ladoga-See. Bull. La Comm. Géologique Finl. 1907, 19, 258–276. (In German) [Google Scholar]
- Valkama, M.; Sundblad, K.; Cook, N.J.; Ivashchenko, V.I. Geochemistry and petrology of the indium-bearing polymetallic skarn ores at Pitkäranta, Ladoga Karelia, Russia. Miner. Depos. 2016, 51, 823–839. [Google Scholar] [CrossRef]
- Ivashchenko, V.I. Rare-Metal (In, Bi, Te, Se, Be) Mineralization of Skarn Ores in the Pitkäranta Mining District, Ladoga Karelia, Russia. Minerals 2021, 11, 124. [Google Scholar] [CrossRef]
- Cherkasova, E.V.; Konyshev, A.A.; Soldatova, E.A.; Sidkina, E.S.; Mironenko, M.V. Metal Speciation in Water of the Flooded Mine “Arsenic” (Karelia, Russia): Equilibrium-Kinetic Modeling with a Focus on the Influence of Humic Substances. Aquat. Geochem. 2021, 27, 141–158. [Google Scholar] [CrossRef]
- Konyshev, A.A.; Sidkina, E.S.; Cherkasova, E.V.; Mironenko, M.V.; Gridasov, A.G.; Zhilkina, A.V.; Bugaev, I.A. Migration forms of heavy metals and chemical composition of surface waters in the “Arsenic” shaft area (Pitkäranta Ore District, South Karelia). Geochem. Int. 2020, 58, 1068–1074. [Google Scholar] [CrossRef]
- Konyshev, A.; Sidkina, E.; Soldatova, E.; Cherkasova, E.; Bugaev, I.; Toropov, A.; Dogadkin, D.; Gromyak, I.; Nikolaeva, I. Chemical composition and metal speciation in water near the mine “Lupikko-I” (Pitkyaranta mining district, Karelia). Geoecologiya. Inzhenernaya Geol. Gidrogeol. Geocriologiya 2021, 6, 55–67. [Google Scholar]
- Larin, A.M. Rapakivi Granites and Associated Rocks; Nauka: St. Petersburg, Russia, 2011. (In Russian) [Google Scholar]
- Duhovsky, A.A.; Artamonova, N.A.; Ivanova, E.I.; Nikiforov, I.O. Three-dimensional model of the Salma rapakivi granite massif and patterns of mineralization distribution. Otechestvennaya Geol. 1994, 4, 24–32. (In Russian) [Google Scholar]
- Larin, A.M. Ore mineralisation. In Salmi Batholith and Pitkaranta ore Field in Soviet Karelia; Haapala, I., Ramo, O.T., Salonsaari, P.T., Eds.; University of Helsinki: Espoo, Finland, 1991; pp. 19–34. [Google Scholar]
- Barton, P.L.; Benthke, P.M.; Toumin, P. Equilibrium in ore deposits. Min. Soc. Am. Spes. 1963, 1, 171–185. [Google Scholar]
- Helgeson, H.C. Evaluation of irreversible reactions in geochemical processes involving minerals and aqueous solutions. I. Thermodynamic relations. Geochim. Cosmochim. Acta 1968, 32, 569–592. [Google Scholar] [CrossRef]
- Helgeson, H.C.; Brown, T.H.; Nigrini, A.; Jones, T.A. Cal culation of mass transfer in geochemical processes in volving aqueous solutions. Geochim. Cosmochim. Acta 1970, 34, 569–592. [Google Scholar] [CrossRef]
- Mironenko, M.V.; Melihova, T.Y.; Zolotov, M.Y.; Akinfiev, N. GEOCHEQ_M: Program complex for thermodynamic and kinetic modeling of geochemical processes in rock–water–gas systems. Version 2008. Vestn. Otd. Nauk o Zemle RAN 2008, 1, 78–79. [Google Scholar]
- Johnson, J.W.; Oelkers, E.H.; Helgeson, H.C.; Johnson, J.W.; Oelkers, E.H.; Helgeson, H.C. SUPCRT92: A software package for calculating the standard molal thermodynamic properties of minerals, gases, aqueous species, and reactions from 1 to 5000 bar and 0 to 1000 °C. Comput. Geosci. 1992, 18, 899–947. [Google Scholar] [CrossRef]
- Mironenko, M.V.; Zolotov, M. Equilibrium-kinetic model of water-rock interaction. Geochem. Int. 2012, 50, 1–7. [Google Scholar] [CrossRef]
- Brantley, S.L.; Chen, Y. Chemical weathering rates of pyroxenes and amphiboles. In Chemical Weathering Rates of Silicate Minerals; White, A.F., Brantley, S.L., Eds.; Mineralogical Society of America: Washington, DC, USA, 1995; pp. 119–172. [Google Scholar]
- White, A.F.; Peterson, M.L.; Hochella, M.F.J. Electrochemistry and dissolution kinetics of magnetite and ilmenite. Geochim. Cosmochim. Acta 1994, 58, 1859–1875. [Google Scholar] [CrossRef]
- Bosbach, D.; Jordan, G.; Rammensee, W. Crystal growth and dissolution kinetics of gypsum and fluorite; an in situ scanning force microscope study. Euro. J. Min. 1995, 7, 267–276. [Google Scholar] [CrossRef]
- Hamza, S.M.; Hamdona, S.K. Kinetics of dissolution of calcium fluoride crystals in sodium chloride solutions: Influence of additives. J. Phys. Chem. 1991, 95, 3149–3152. [Google Scholar] [CrossRef]
- Nagy, K.L. Dissolution and precipitation kinetics of sheet silicates. In Chemical Weathering Rates of Silicate Minerals; White, A.F., Brantley, S.L., Eds.; Mineralogical Society of America: Washington, DC, USA, 1995; pp. 173–233. [Google Scholar]
- Pokrovsky, O.S.; Golubev, S.V.; Schott, J.; Pokrovsky, O.S.; Golubev, S.V.; Schott, J. Dissolution kinetics of calcite, dolomite and magnesite at 25 °C and 0 to 50 atm pCO2. Chem. Geol. 2005, 217, 239–255. [Google Scholar] [CrossRef]
- Hayashi, H.; Yamada, M. Kinetics of dissolution of noncrystalline oxides and crystalline clay minerals in a basic tiron solution. Clays Clay Miner. 1990, 38, 308–314. [Google Scholar] [CrossRef]
- Williamson, M.A.; Rimstidt, J.D. The kinetics and electrochemical rate-determining step of aqueous pyrite oxidation. Geochim. Cosmochim. Acta 1994, 58, 5443–5454. [Google Scholar] [CrossRef]
- Kazakov, K. Weather and Climate—Weather Forecasts, Weather News, Climate Data. 2021. Available online: http://www.pogodaiklimat.ru/ (accessed on 10 December 2021). (In Russian).
- Rosgydromet. Review of the State and Pollution of the Environment in the Russian Federation 2016; Chernogaeva, T.M., Ed.; Rosgydromet: Moscow, Russia, 2017. [Google Scholar]
- Astafiev, B.Y.; Bogdanov, Y.B.; Viskunova, K.G.; Voinova, O.A.; Glaznev, V.N.; Kozlov, S.A.; Kostin, D.A.; Lopatin, B.G.; Markina, N.V.; Penedyuk, E.V.; et al. State Geological Map of the Russian Federation. Scale 1: 1,000,000 (Third Generation). Series North Kara-Barents Sea. Sheet R-(35), 36—Murmansk. Explanatory Note; Cartographic factory VSEGEI: St. Petersburg, Russia, 2007. [Google Scholar]
- Li, X.; Wu, B.; Zhang, Q.; Liu, Y.; Wang, J.; Li, F.; Ma, F.; Gu, Q. Complexation of humic acid with Fe ions upon persulfate/ferrous oxidation: Further insight from spectral analysis. J. Hazard. Mater. 2020, 399, 123071. [Google Scholar] [CrossRef]
- Dinu, M.I. Element specification in small lakes of the Kola Peninsula: Geochemical and technogenic factors. Environ. Res. Lett. 2021, 16, 065005. [Google Scholar] [CrossRef]
- Levshina, S.I.; Matyushkina, L.A. The Distribution of Dissolved Forms of Metals and Metal–Humus Complexes in Zeya Reservoir Water. Water Resour. 2021, 48, 967–976. [Google Scholar] [CrossRef]
- Scott, M.J.; Jones, M.N.; Woof, C.; Simon, B.; Tipping, E. The molecular properties of humic substances isolated from a UK upland peat system: A temporal investigation. Environ. Int. 2001, 27, 449–462. [Google Scholar] [CrossRef]
- Krumins, J.; Klavins, M. Characterisation of humic acids in boreal mires depending on a peat type. Boreal Environ. Res. 2022, 27, 33–60. [Google Scholar]
- De Melo, B.A.G.; Motta, F.L.; Santana, M.H.A. Humic acids: Structural properties and multiple functionalities for novel technological developments. Mater. Sci. Eng. C 2016, 62, 967–974. [Google Scholar] [CrossRef]
- Banach-Szott, M.; Debska, B.; Tobiasova, E. Properties of humic acids depending on the land use in different parts of Slovakia. Environ. Sci. Pollut. Res. 2021, 28, 58068–58080. [Google Scholar] [CrossRef]
- Sposito, G. On the surface complexation model of the oxide-aqueous solution interface. J. Colloid Interface Sci. 1983, 91, 329–340. [Google Scholar] [CrossRef]
- Stumm, W.; Wehrli, B.; Wieland, E. Surface Complexation and Its Impact on Geochemical Kinetics. Croat. Chem. Acta 1987, 60, 429–456. [Google Scholar]
- Tournassat, C.; Gailhanou, H.; Crouzet, C.; Braibant, G.; Gautier, A.; Lassin, A.; Blanc, P.; Gaucher, E.C. Two cation exchange models for direct and inverse modelling of solution major cation composition in equilibrium with illite surfaces. Geochim. Cosmochim. Acta 2007, 71, 1098–1114. [Google Scholar] [CrossRef] [Green Version]
- Whittaker, M.L.; Lammers, L.N.; Carrero, S.; Gilbert, B.; Banfield, J.F. Ion exchange selectivity in clay is controlled by nanoscale chemical-mechanical coupling. Proc. Natl. Acad. Sci. USA 2019, 116, 22052–22057. [Google Scholar] [CrossRef] [PubMed]


| Mineral | % |
|---|---|
| Magnetite | 40 |
| Sphalerite (Cd 0.2%) | 0.18 |
| Chalcopyrite | 0.12 |
| Galena | 0.001 |
| Pyrite (0.002% Ni) | 0.194 |
| Fluorite | 2 |
| Calcite | 5 |
| Dolomite | 2 |
| Chrysotile | 25.1 |
| Chlinochlore | 7.555 |
| Daphnite | 15.85 |
| Diopside | 2 |
| Content | Unit | Sampling Points | ||||
|---|---|---|---|---|---|---|
| Trial Pit | Pond | Mine (from the Surface) | Mine (from the Depth of 2 m) | Geochemical Background [50] | ||
| pH | - | 6.04 | 7.04 | 7.95 | 7.59 | n.d. |
| Eh | mV | 190.6 | 194.2 | 122.8 | 80.2 | n.d. |
| CO2 | mg/L | 10.56 | 14.08 | 7.04 | 11.62 | n.d. |
| HCO3− | 102 | 83 | 220 | 215 | n.d. | |
| SO42− | 17.4 | 33.4 | 1.6 | 1.2 | 2.23 | |
| Cl− | 3.0 | 2.5 | 9.7 | 10.6 | 0.857 | |
| Ca | 28.2 | 28.9 | 32.4 | 32.6 | 2.32 | |
| Mg | 7.08 | 6.89 | 15.3 | 15.2 | 0.77 | |
| Na | 3.78 | 1.82 | 24.1 | 24.2 | 1.04 | |
| K | 1.02 | 1.27 | 2.32 | 2.81 | 0.344 | |
| TDS | 163 | 158 | 305 | 301 | n.d. | |
| Fe | 1.61 | 0.63 | 0.23 | 0.85 | 0.072 | |
| Zn | µg/L | 2977 | 553 | 15.8 | 8.6 | 0.001 |
| Cu | 46.6 | 9.88 | <0.5 | 0.1 | 0.525 | |
| Ni | 3.78 | 2.21 | 0.74 | 0.5 | 0.278 | |
| Cd | 5.65 | 0.35 | 0.42 | <0.01 | 0.011 | |
| Pb | 2.66 | 2.65 | <0.12 | <0.12 | 0.079 | |
Publisher’s Note: MDPI stays neutral with regard to jurisdictional claims in published maps and institutional affiliations. |
© 2022 by the authors. Licensee MDPI, Basel, Switzerland. This article is an open access article distributed under the terms and conditions of the Creative Commons Attribution (CC BY) license (https://creativecommons.org/licenses/by/4.0/).
Share and Cite
Sidkina, E.S.; Soldatova, E.A.; Cherkasova, E.V.; Konyshev, A.A.; Vorobey, S.S.; Mironenko, M.V. Fate of Heavy Metals in the Surface Water-Dump Rock System of the Mine Lupikko I (Karelia): Field Observations and Geochemical Modeling. Water 2022, 14, 3382. https://doi.org/10.3390/w14213382
Sidkina ES, Soldatova EA, Cherkasova EV, Konyshev AA, Vorobey SS, Mironenko MV. Fate of Heavy Metals in the Surface Water-Dump Rock System of the Mine Lupikko I (Karelia): Field Observations and Geochemical Modeling. Water. 2022; 14(21):3382. https://doi.org/10.3390/w14213382
Chicago/Turabian StyleSidkina, Evgeniya S., Evgeniya A. Soldatova, Elena V. Cherkasova, Artem A. Konyshev, Sofia S. Vorobey, and Mikhail V. Mironenko. 2022. "Fate of Heavy Metals in the Surface Water-Dump Rock System of the Mine Lupikko I (Karelia): Field Observations and Geochemical Modeling" Water 14, no. 21: 3382. https://doi.org/10.3390/w14213382