Article

Optimization Method to Determine the Kinetic Rate Constants for the Removal of Benzo[a]pyrene and Anthracene in Water through the Fenton Process

by
Ainhoa Rubio-Clemente
1,2,*,
Edwin Chica
2 and
Gustavo A. Peñuela
1
1
Grupo de Investigación Diagnóstico y Control de la Contaminación (GDCON), Facultad de Ingeniería, Universidad de Antioquia UdeA, Calle 70, No. 52-21, Medellín 050010, Colombia
2
Grupo de Investigación Energía Alternativa (GEA), Facultad de Ingeniería, Universidad de Antioquia UdeA, Calle 70, No. 52-21, Medellín 050010, Colombia
*
Author to whom correspondence should be addressed.
Water 2022, 14(21), 3381; https://doi.org/10.3390/w14213381
Submission received: 1 September 2022 / Revised: 11 October 2022 / Accepted: 15 October 2022 / Published: 25 October 2022
(This article belongs to the Section Wastewater Treatment and Reuse)

Abstract

:
The reaction rate constants concerning the removal of benzo[a]pyrene (BaP) and anthracene (AN) in water by the Fenton process can be commonly found from the experimental data and by using regression models. However, this calculation is a time-consuming and a difficult task. Therefore, an algorithm for the determination of the rate constants depletion of the pollutants of interest should be developed. In this study, several algorithms were developed, using MATLAB® software for representing AN and BaP elimination by the Fenton process under an experimental domain. These algorithms were derived from the first-, second- and third-order kinetic models, as well as from the double exponential and the Behnajady-Modirshahla-Ghanbery (BMG) kinetic models. Regarding the AN and BaP removal kinetics, the double exponential and the BMG models were found to exhibit the highest correlation coefficients (>0.98 and >0.95, respectively) in comparison with those ones obtained from the first-, second- and third-order kinetic models (>0.80, >0.85 and >0.88, respectively). It was found that the algorithms can be used to optimize and fit the rate constants by creating an objective function that fits and represents the experimental data obtained concerning the removal of the compounds of interest through the Fenton advanced oxidation process.

1. Introduction

Advanced oxidation processes (AOP) are a rapid and effective alternative for the treatment of water polluted with contaminants of emerging concern, such as benzo[a]pyrene (BaP) and anthracene (AN) [1,2]. AOP refer to the treatment processes based on the production of hydroxyl radicals (HO•). These radicals are characterized by their highly powerful potential, being able to effectively degrade persistent organic pollutants contained in water until the complete conversion of the target pollutants into carbon dioxide (CO2), water (H2O), and mineral salts is achieved; i.e., the total mineralization of the parent pollutant is found. Among all the AOP, the Fenton process, employing ferrous ion (Fe2+) and hydrogen peroxide (H2O2) as the catalyst and the oxidant, respectively, has been considered as one of the most attractive and powerful advanced oxidation technologies [3]. The Fenton process is able to degrade recalcitrant pollutants that cannot be efficiently removed by conventional treatment processes to a high degree [4,5,6]. Additionally, inherent toxic and dangerous substances are not generated by the Fenton oxidation process when applied to water. The Fenton process is also easy and safe to operate, and the reagents used are widely available [3,6].
Despite the fact there are a number of studies reported in the literature regarding the application of the Fenton process for the removal and degradation of several pollutants in water, the mathematical modeling of this oxidation process is still under development, contrarily to the area of knowledge concerning the kinetics associated with other AOP. In this regard, research focused on the kinetic study are required to properly discern the role of the factors influencing the efficiency of the process, acquire knowledge of the reaction mechanism and fundamentals, study the effect of the water matrix on the reaction process, and provide valuable references for its implementation [7,8,9]. To the authors’ knowledge, scarce simplified elementary reaction mechanisms or empirical approaches have been proposed, and the complex set of chemical reactions involved in this AOP might be the main reason. Some authors used the first- or second-order kinetic models for describing the pollutant abatement using the Fenton process [10]. In the case of the first-order kinetic model, a plot of the natural logarithm of the target organic compound concentration versus (vs.) the time of treatment generates a straight line with a negative slope, which refers to the apparent rate constant value representing the removal of the pollutant of interest [10].
During the last decade, several modern trends have been implemented for the calculation of the rate constants. Among these procedures, new simulation tools have been used, instead of experimental data, for the subsequent optimization of the process, to reduce the error between the data obtained at laboratory scale and the computed data [11].
The aim of this research was to discern the extent of elimination of a mixture of AN and BaP in water by the Fenton process from a kinetic point of view and by comparing the oxidation system efficiency over the time of treatment. An algorithm was developed for accurately determining a function representing the experimental data set. The routine focused on the constant optimization of a fitting equation by means of the minimization of the sum of the squares of the deviation of the data from the values predicted by the equation. The experimental results were modeled by five fitting functions derivate from the first-, second- and third-order kinetic models, and from the Behnajady-Modirshahla-Ghanbery (BMG) and double exponential kinetic models.

2. Materials and Methods

2.1. Chemicals and Reagents

For the degradation experiments, AN (99.5%) and BaP (96%) reactant grades obtained from Alfa Aesar (Haverhill, MA, USA) were used. In turn, for analytical determinations, AN (98.5 ± 1%) and BaP (99.6 ± 0.5%) reference standards, purchased from Dr. Ehrenstorfer (Augsburg, Germany), were utilized. The Fenton’s reagent was composed of iron(II) sulfate heptahydrate (FeSO4 7H2O) and H2O2 30% w/w, which were obtained from Sigma-Aldrich (St. Louis, MA, USA) and JT Baker (Mexico City, Mexico), respectively. Additionally, sulfuric acid (H2SO4, 95–97%), obtained from Merck (Darmstadt, Germany), was used for reducing the solution pH up to 2.8.
For analytical purposes, deionized water (DW) was utilized. DW was obtained from a Millipore Milli-Q water purification system (USA). Additionally, experimentation was conducted by using natural water (NW). Samples were collected from “El Peñol” dam (Guatapé, Antioquia), which is located at N 6º 17′41.1583″ O 75° 9′31.0821″. This water had a low ion content, a reduced level of organic matter (2.03 mg C/L, in terms of total organic carbon), and a pH of 7.35.

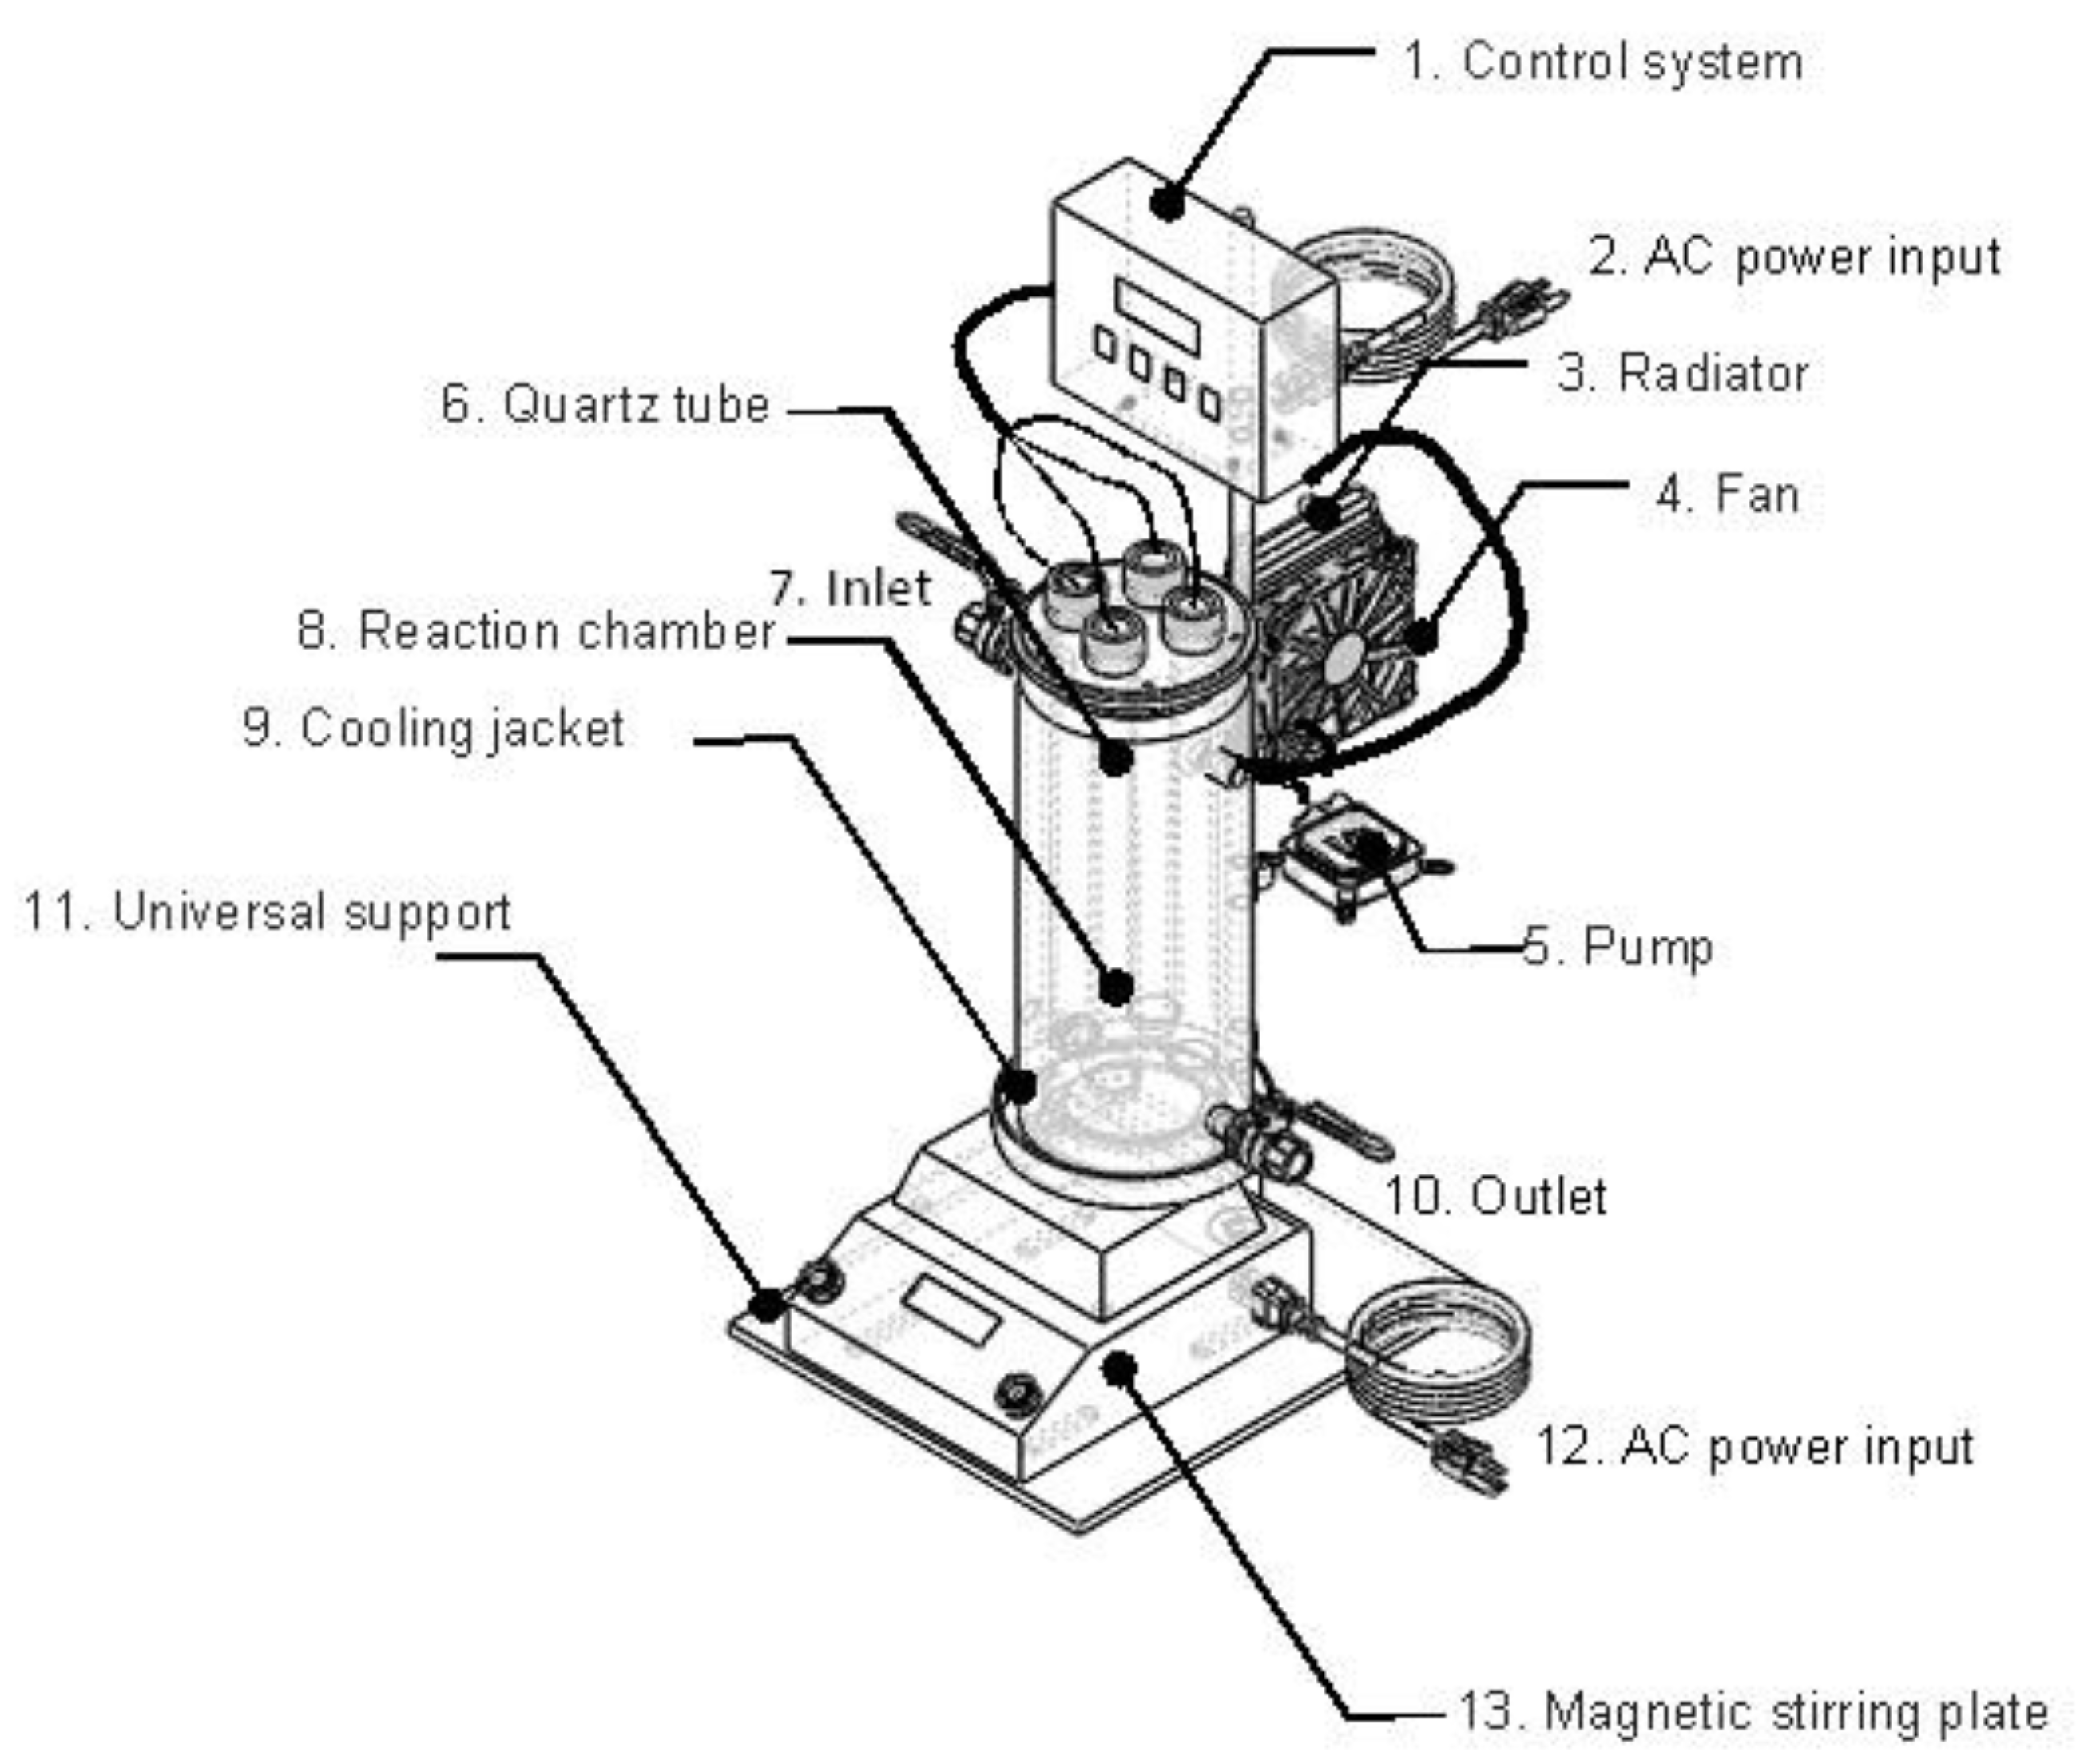
2.2. Experimental Setup

The Fenton experiments were carried out in an isothermal, well-stirred batch cylindrical jacketed photochemical reactor. The reactor had a reaction chamber of 2.5 L with an effective operating volume of 2 L. The reaction chamber walls were made of borosilicate glass 3.3, and its dimensions were 11 cm internal diameter, 35 cm length and 0.3 cm wall thickness. The chamber was sealed at one of its ends, and it featured an inlet and an outlet for water. Moreover, the reactor lid was made of stainless steel 304 type.
The system was also equipped with a cooling jacket made of borosilicate glass 3.3. As the reaction chamber, the cooling jacket was also provided with an inlet and an outlet to allow the recirculation of the cooling fluid to an external circuit composed of a pump, a radiator, and a fan, enabling a forced cooling of the system at a desired temperature. The cooling circuit automatically operates through an automatic control system, the input signal of which is the temperature inside the reaction chamber, measured by a type-K thermocouple. When the temperature is above a user-defined value, the recirculation system of the cooling fluid is activated, maintaining the temperature of the reaction medium at a constant value. For the Fenton process, the temperature of the solutions was kept at 25 °C.
To ensure the homogenization of the sample, a magnetic stirrer bar was used and the reactor was placed on the top of a stirring plate. As a support structure, a universal one was used.
Figure 1 shows a schematic representation of the experimental setup. The following parts can be differentiated: 1. Control system; 2. AC power input; 3. Radiator; 4. Fan; 5. Pump; 6. Quartz tube; 7. Inlet; 8. Reaction chamber; 9. Cooling jacket; 10. Outlet; 11. Universal support; 12. AC power input; and 13. Magnetic stirring plate.
The experimental procedure started when the previously prepared solution containing a mixture of the selected polycyclic aromatic hydrocarbons (PAH) was incorporated to the reactor. The optimal concentrations of the catalyst and the oxidant were previously determined by a design of experiments, consisting of 2 central points plus 9 runs. The response surface methodology was used to optimize the operating conditions (levels of the oxidizing and the catalyzing agents) of the system, allowing for the maximal removal of AN and BaP in 30 min of treatment. Fe(II) ion and H2O2 concentrations of 0.44 mg L−1 and 10.50 mg L−1, respectively, were achieved. Detailed information on the procedure followed is established in [12].

2.3. Analytical Methods

The detection and quantification of AN and BaP concentrations was conducted through high-performance liquid chromatography (HPLC). The equipment had a florescence detector and was operated in reversed phase (Agilent Technologies, Santa Clara, CA, USA). The limits of quantification (LoQ) and detection (LoD) of the analytical method were 30 ng L−1 and 4.26 ng L−1, respectively. The detailed information on the analytical procedure used, including the validation studies, are reported elsewhere [13,14].

2.4. Kinetic Model Representing AN and BaP Removal

Before developing a kinetic model, the analysis of the experimental data is required. Simple reaction kinetics cannot be used for representing the degradation of AN and BaP by the Fenton process, because of the complexity of the oxidation system. Several researches have reported that the Fenton process implementation for the degradation of organic pollutants follows pseudo-first- or pseudo-second-order kinetics [15,16,17,18,19,20]. For example, the removal and oxidation of dyes through the Fenton process have been studied by Malik and Saha. The entire degradation reaction was found to be divided into a two-stage reaction. The referred authors observed that, during the first stage, the pollutant decomposed quickly; this stage was ascribed to the reaction between Fe2+ and H2O2. In turn, the reaction where Fe3+ and H2O2 were involved was related to the second stage of the reaction [20,21]. Both stages have pseudo-first-order kinetics. In turn, the behavior of Orange G dye in water when subjected to the Fenton process was studied by Suna and coworkers. In this case, the dye degradation was found to occur in one step. In addition, it was observed that the reaction kinetics followed a pseudo-second order [22].
In general, the degradation of AN and BaP in water by the Fenton process can be described by Equation (1):
d C d t = k i C n
In which C stands for the level of the target pollutant, ki and n refer to the reaction rate constant and the reaction order, respectively. Finally, t is the time. For a first-order reaction, n is equal to 1. After integration, Equation (1) becomes in Equation (2), where Co and Ct are the initial concentration and the concentration at the reaction time t of AN or BaP, respectively.
ln [ C t ] = ln [ C o ] k 1 t
In turn, Equation (2) can be rewritten as Equation (3).
C t C o = e k 1 t
For a second-order kinetic reaction, n is equal to 2, and the integrated equation becomes in Equation (4).
1 C t = 1 C o + k 2 t
For a third-order kinetic reaction, n is equal to 3, and the integrated equation becomes in Equation (5).
1 C t 2 = 1 C o 2 + k 3 t
The plots of ln [ C t ] , 1/Ct and 1/Ct2 vs. time should be linear with a slope equal to k 1 , k 2 and k 3 , and an intercept equal to ln [ C o ] , 1/Co and 1/Ct2, respectively. Linear least-squares analysis can be used to evaluate the slopes and intercepts.
It has been argued that Equations (2), (4) and (5) are useful because they result in linear plots under the appropriate conditions. Indeed, linear relationships are more easily interpreted than more complex functional forms. Additionally, some studies frequently suggest that if they cannot produce a linear relationship, a particular data set cannot be analyzed. Moreover, the use of a high-quality software to perform non-linear curve fitting on computers constitutes an alternative approach for the analysis of data. As a matter of fact, Cüce and coworkers investigated laundry wastewater treatment, while Behnajady et al. studied the microplastic degradation and the C.I. Acid Yellow 23 discoloration by the Fenton reagent [23,24]. In these cases, the reaction kinetic was observed to occur in two stages with pseudo-second-order kinetics. The degradation of the pollutants can be described using the non-linear function expressed by Equation (6).
C t C o = 1 t A 1 + A 2 t
In which A 1 and A 2 are two constants related to the reaction kinetics and oxidation capacities of the treatment system, respectively. A1 is expressed in min, while A2 is a dimensionless parameter. Several authors determined that 1/A1 stands for the initial pollutant removal rate within the bulk (k4). Consequently, a higher 1/A1 value results in a faster pollutant initial decay rate. Moreover, 1/A2 was the theoretical maximal removal fraction of the pollutant of interest (k5). This value can be equal to the maximal oxidation capacity of the process at the end of the Fenton reaction. To solve these constants, a number of authors linearized Equation (6) to obtain Equation (7).
t 1 C t / C o = A 1 + A 2 t
Plotting t/(1 − Ct/Co) vs. t results in straight lines with an intercept ( A 1 ) and a slope ( A 2 ). This model is known in the literature as the BMG model [25,26,27].
By using the experimental data, the removal of AN and BaP throughout the time of treatment was found to provide a good fit to a double exponential model, which is expressed by Equation (8).
C t C o = A 3 e k 6 t + A 4 e k 7 t
In which k 6 is the reaction rate constant of the system, as well as k 7 . A3 and A4 are fractions of the initial concentration of the pollutant.
In general, the differences among the models used for the fit of the experimental data are the form of the function and the number of parameters defining it. As mentioned above, the estimation of the factors related to the rate constants is both a difficult and a time-consuming task. Therefore, in this work, the intention was to develop an algorithm for determining the parameters defining the functions of the five kinetic models fitted to the experimental data representing the target PAH removal by the Fenton process.

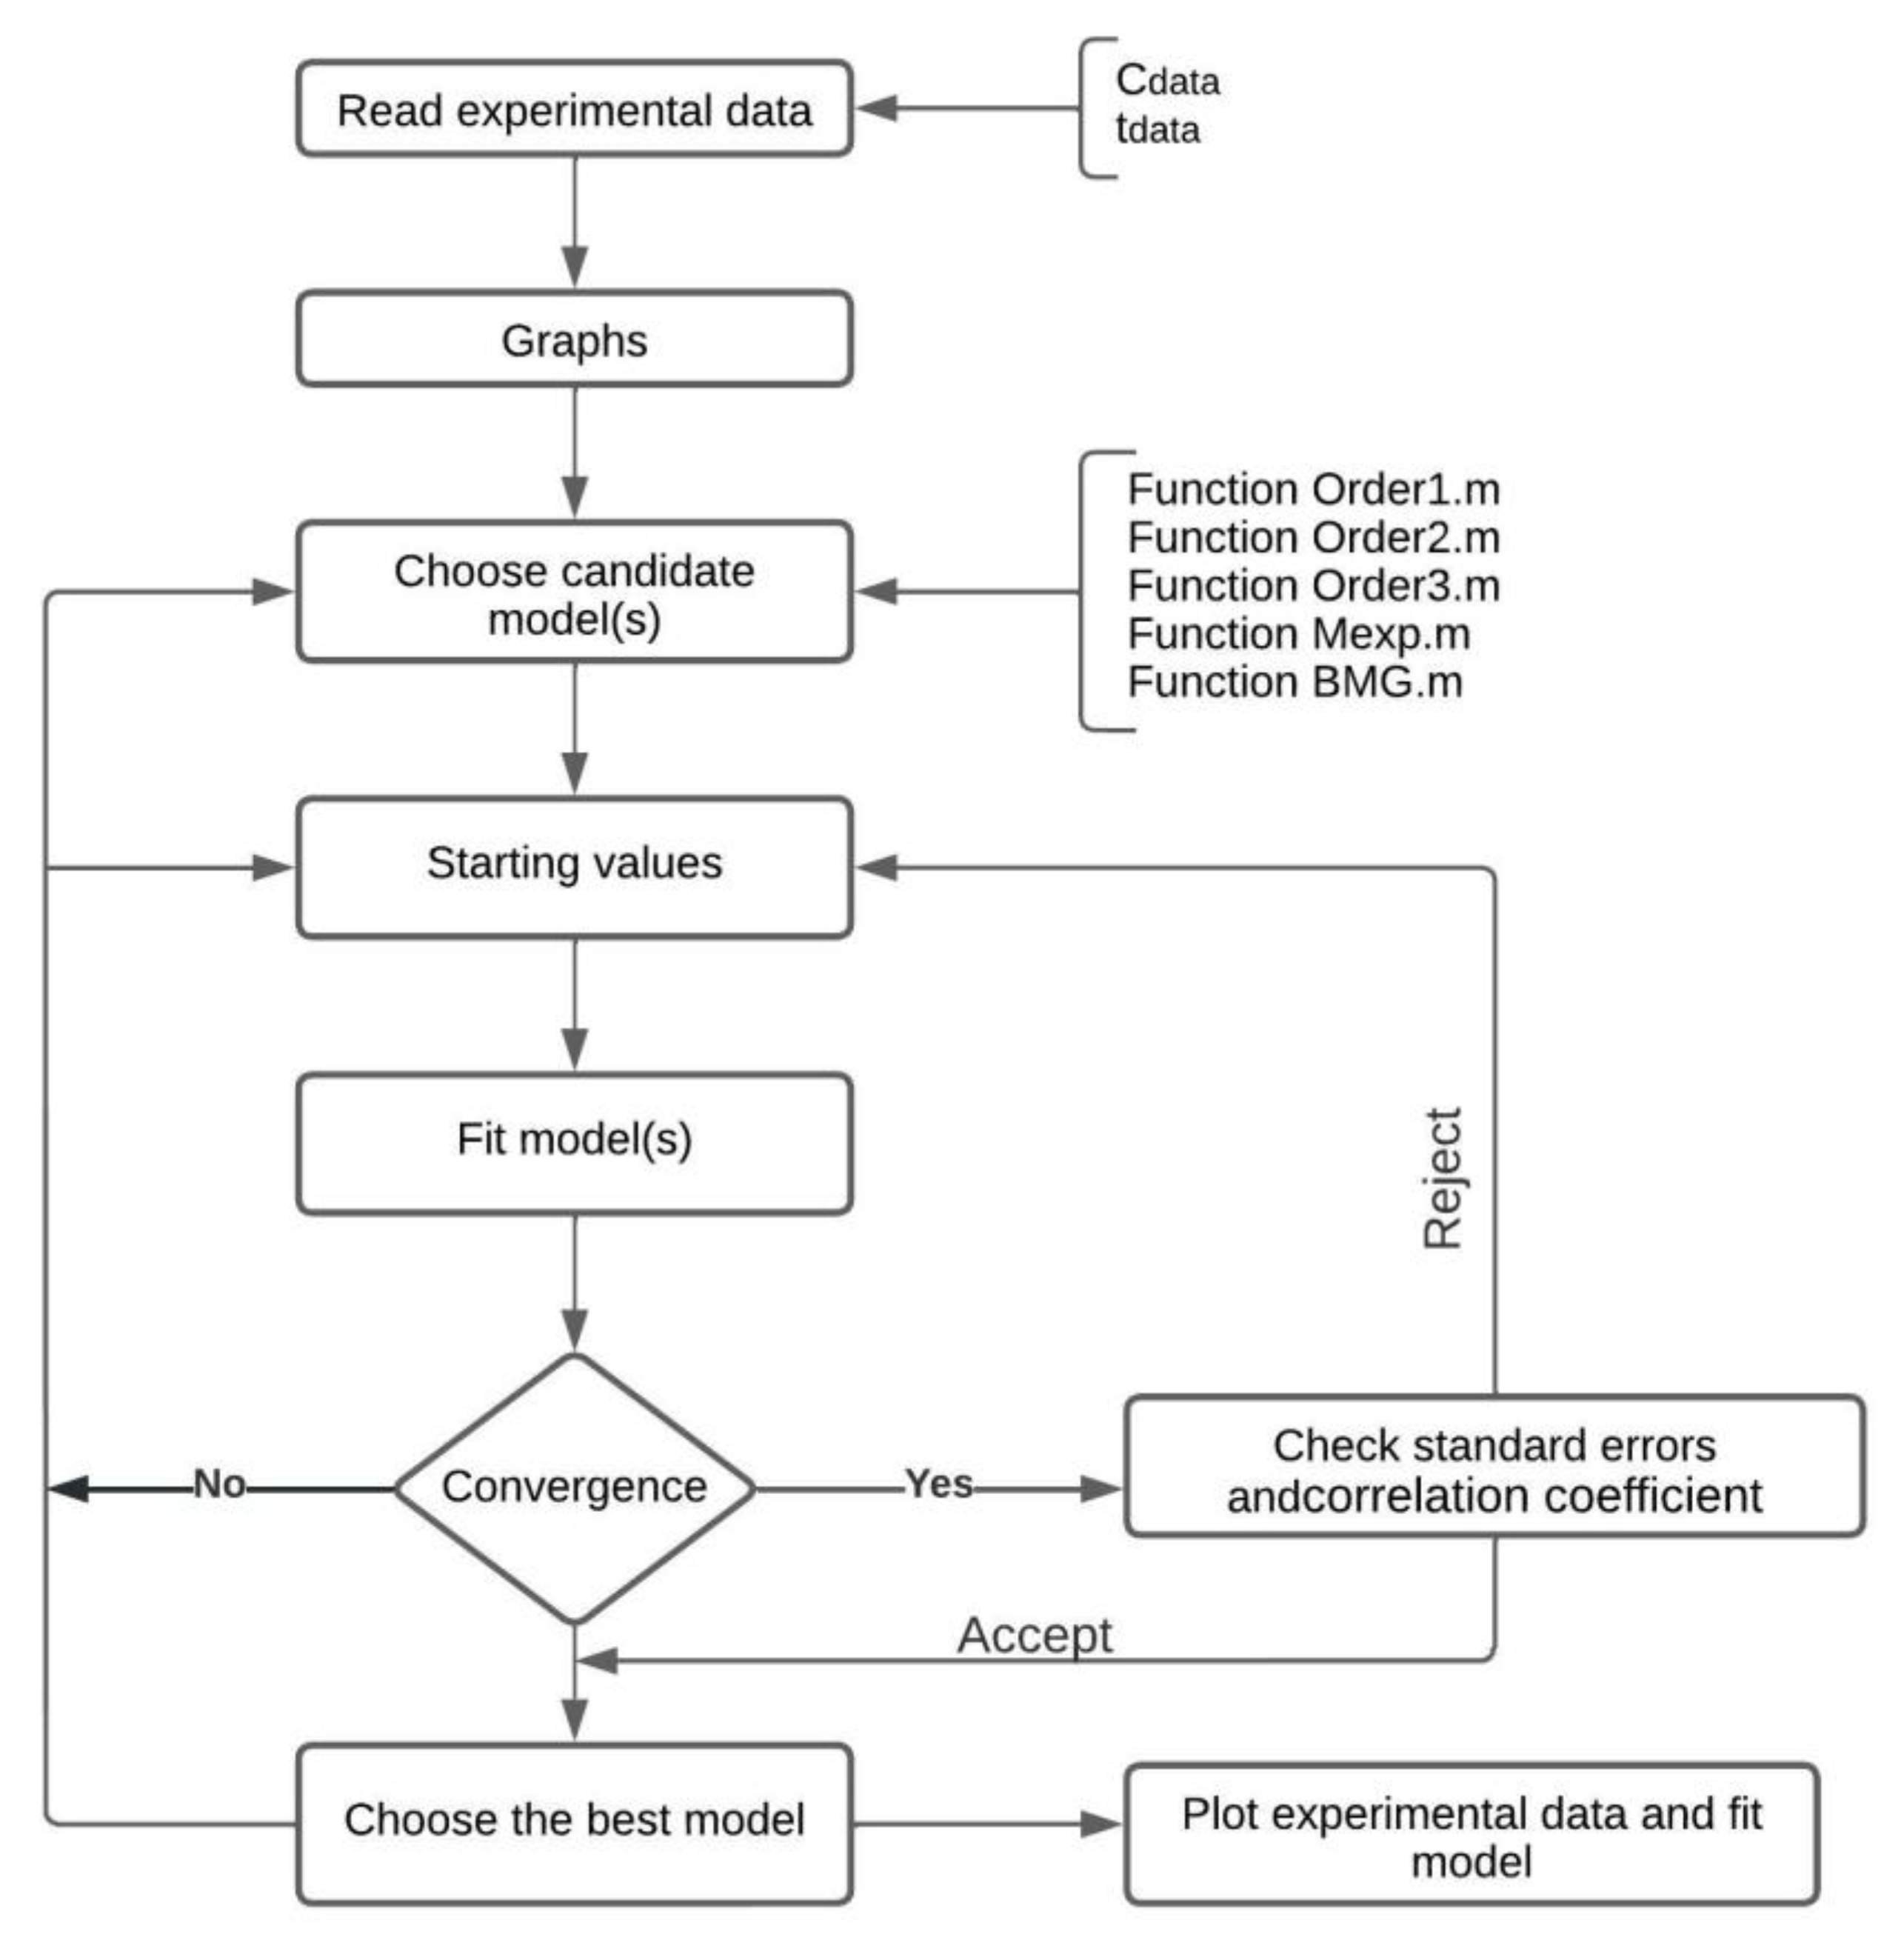
2.5. Optimization Method to Determine the Pollutant Removal Rate Constants

Obtaining the levels of the products and reactants involved in a reaction at different time intervals, once the reaction has been initiated, constitutes the first step in the kinetic analysis of the reaction. For this purpose, withdrawing samples from the bulk throughout the reaction time by means of the quenching method has been informed. In this regard, large amounts of salts or solvents are added to the samples, or they can be cooled suddenly, in order to stop the reaction. Subsequently, with the aim of obtaining the levels of different species involved in the reaction system, the samples are analyzed by using gas or liquid chromatography, mass spectrometry, spectroscopy, nuclear magnetic resonance or polarimetry, among other analytical techniques. Therefore, a kinetic model can be fitted to the concentrations of the target chemical species vs. time. Thus, the unknown reaction rate constants can be estimated.
In order to discern the rate constants of the first-, second- and the third-order, double exponential and the BMG kinetic models without proceeding with the linearization of the experimental data, applications of non-linear curve-fitting techniques were implemented. For this, a computational algorithm was developed. This routine allows optimization of the constants of a fitting equation (Equations (3)–(6) and (8)) by minimizing the sum of the squares of the deviation of the experimental data from the values predicted by the equation.
In some numerical software, such as MATLAB®, Minitab, Maple, etc., fitting models can be carried out through a number of functions, among which the function fminsearch has a highlighted position. The fitting of non-linear models relies on non-trivial hypothesis, unlike the linear regression. Therefore, users are required to carefully ensure and validate the entire modeling. By utilizing some variant of the least squares’ criterion, the estimation of parameters can be conducted through an iteration process. Optimal factors are thus ideally calculated. For example, the fminsearch is an implementation of the Nelder-Meda simplex algorithm that allows minimization of a non-linear function of several variables [28,29].
To optimize the parameters of the fitting function, an objective function must be constructed. The objective function may be a multiple-variable function or can be conformed of a single variable. Additionally, this function may be non-linear or linear, and it may be also constrained by certain conditions or unconstrained. Optimization implies either minimizing or maximizing the objective function [30]. In Figure 2, the algorithm flow chart is represented.
This algorithm proceeds as follows:
  • The algorithm reads the vector of experimental data (Cdata) and the vector that records the time when the measurements of the species concentration were performed (tdata). The fitting function (g) should be defined. This function depends on one or several parameters to be fitted. Fitting the curve via optimization means finding these parameters that minimize the sum of squared errors.
  • clear all
  • close all
  • clc
  • fig = figure(3)
  • ExpData = xlsread(‘Fenton’,’hoja1’, ’A1.B21’); % Read experimental data from an excel file
  • tdata = ExpData(:,1);
  • Cdata = ExpData(:,2);
  • Then, the experimental data related to concentration vs. time are plotted using the function plot of MATLAB®.
  • plot(tdata,Cdata,’ro’); % Plot the experimental data
  • hold on;
  • h = plot(tdata,Cdata,’b’);
  • hold off;
  • In the algorithm, it is necessary to define the objective function to be minimized that accepts the parameters to be optimized, in this particular case. When Cdatai (tdatai) represents the experimental AN or BaP concentration values measured throughout the time of treatment and g i ( t d a t a i ,   v ) are the simulated data, the function (F) can be rewritten as Equation (9).
F = i = 1 n ( C d a t a i ( t d a t a i ) g i ( t d a t a i ,   v ) ) 2
In which v is the set of variables or parameters in the model to be optimized in the fitting. In the current case, the parameters of the fitting function (g) were selected by the optimization algorithm, so that the target function kept decreasing. When the convergence criterion is satisfied or when the function F falls below an acceptable value, the search of the best parameters is finished. In general terms, at each measured point, the experimental and the algorithm results are compared. The deviations between the estimated and the experimental results are squared and summed up to form the objective function F.
For example, for the case of the first-order kinetic model, the fitting function is equal to Equation (3). Therefore, writing a function that accepts parameters k1 and the experimental data vectors tdata and Cdata, and returns the sum of squared errors for the model is required. Additionally, all the variables to be optimized (k1) must be put in a single vector variable (x).
  • function E = Order1(x,tdata,Cdata)
  • k1 = x(1);
  • E = sum((Cdata - exp(-k1*tdata)).^2);
This objective function must be saved, obtaining the file named as Order1 on MATLAB® path.
The same procedure can be done for other kinetic models. The objective functions obtained for each studied kinetic model are listed in Table 1.
Then, given the non-linear parameter (x) and the data (tdata, Cdata), the objective function allows calculation of the error in the fitting for this equation with respect to the experimental data. Additionally, the objective function allows updating of the line (h) of the algorithm. All the procedures providing the estimation of the non-linear parameters require initial values. An initial estimation of x is then carried out, and the function fminsearch is invoked. A random positive set of parameters (x0) is taken and, afterwards, fminsearch allows finding of the parameters that minimize the objective function. By adjusting x, Fminsearch minimizes the error resultant from the objective function. It returns the final value of x. Finally, an output function to plot intermediate fits is used. The initial values selection will affect the estimation algorithm convergence, leading to no convergence and to convergence after a few iterations for the worst and the best cases, respectively. For the first-order kinetic model, the following steps of the algorithm are conducted:
  • fun = @(x)Order1(x,tdata,ydata);
  • x0=rand(1,1);
  • outputFcn = @(x,optimvalues,state) fitoutputfun(x,optimvalues,state,tdata,ydata,h);
  • options = optimset(‘OutputFcn’,outputFcn,’TolX’,1e-80,’MaxFunEvals’, 10,000,000);
  • bestx=fminsearch(fun,x0,options)
The function fminsearch solver is applied to functions of one variable, x. Nevertheless, the Order1 function has three variables. tdata and Cdata are not variables to be optimized; however, they are data to be used for the optimization. Therefore, the objective function is required to be defined for fminsearch as a function of x alone. On the other hand, employing an output function is required so that the optimization function is called during each iteration. By employing this function, recording the history of the data that the algorithm generates and producing a graphical output, or halting the algorithm based on the data at the current iteration, is feasible. In MATLAB®, it is possible to use the function OutputFcn with the optimization functions fminsearch. In the function OutpuntFcn, the variable x is the point computed by the algorithm at the current iteration, the variable optimValues is a structure containing data from the current iteration, and the variable state is the current state of the algorithm.
Once the experimental data were compared to the simulated results at each measured point, and the deviations were squared and summed up, a new function was formed. This function was fed into a minimizer routine that gave the optimal rate constants of the oxidation system. Additionally, a tolerance ( ε ) was predefined so that when the absolute difference between two successive objective functions is less than ε , the iteration procedure is stopped.
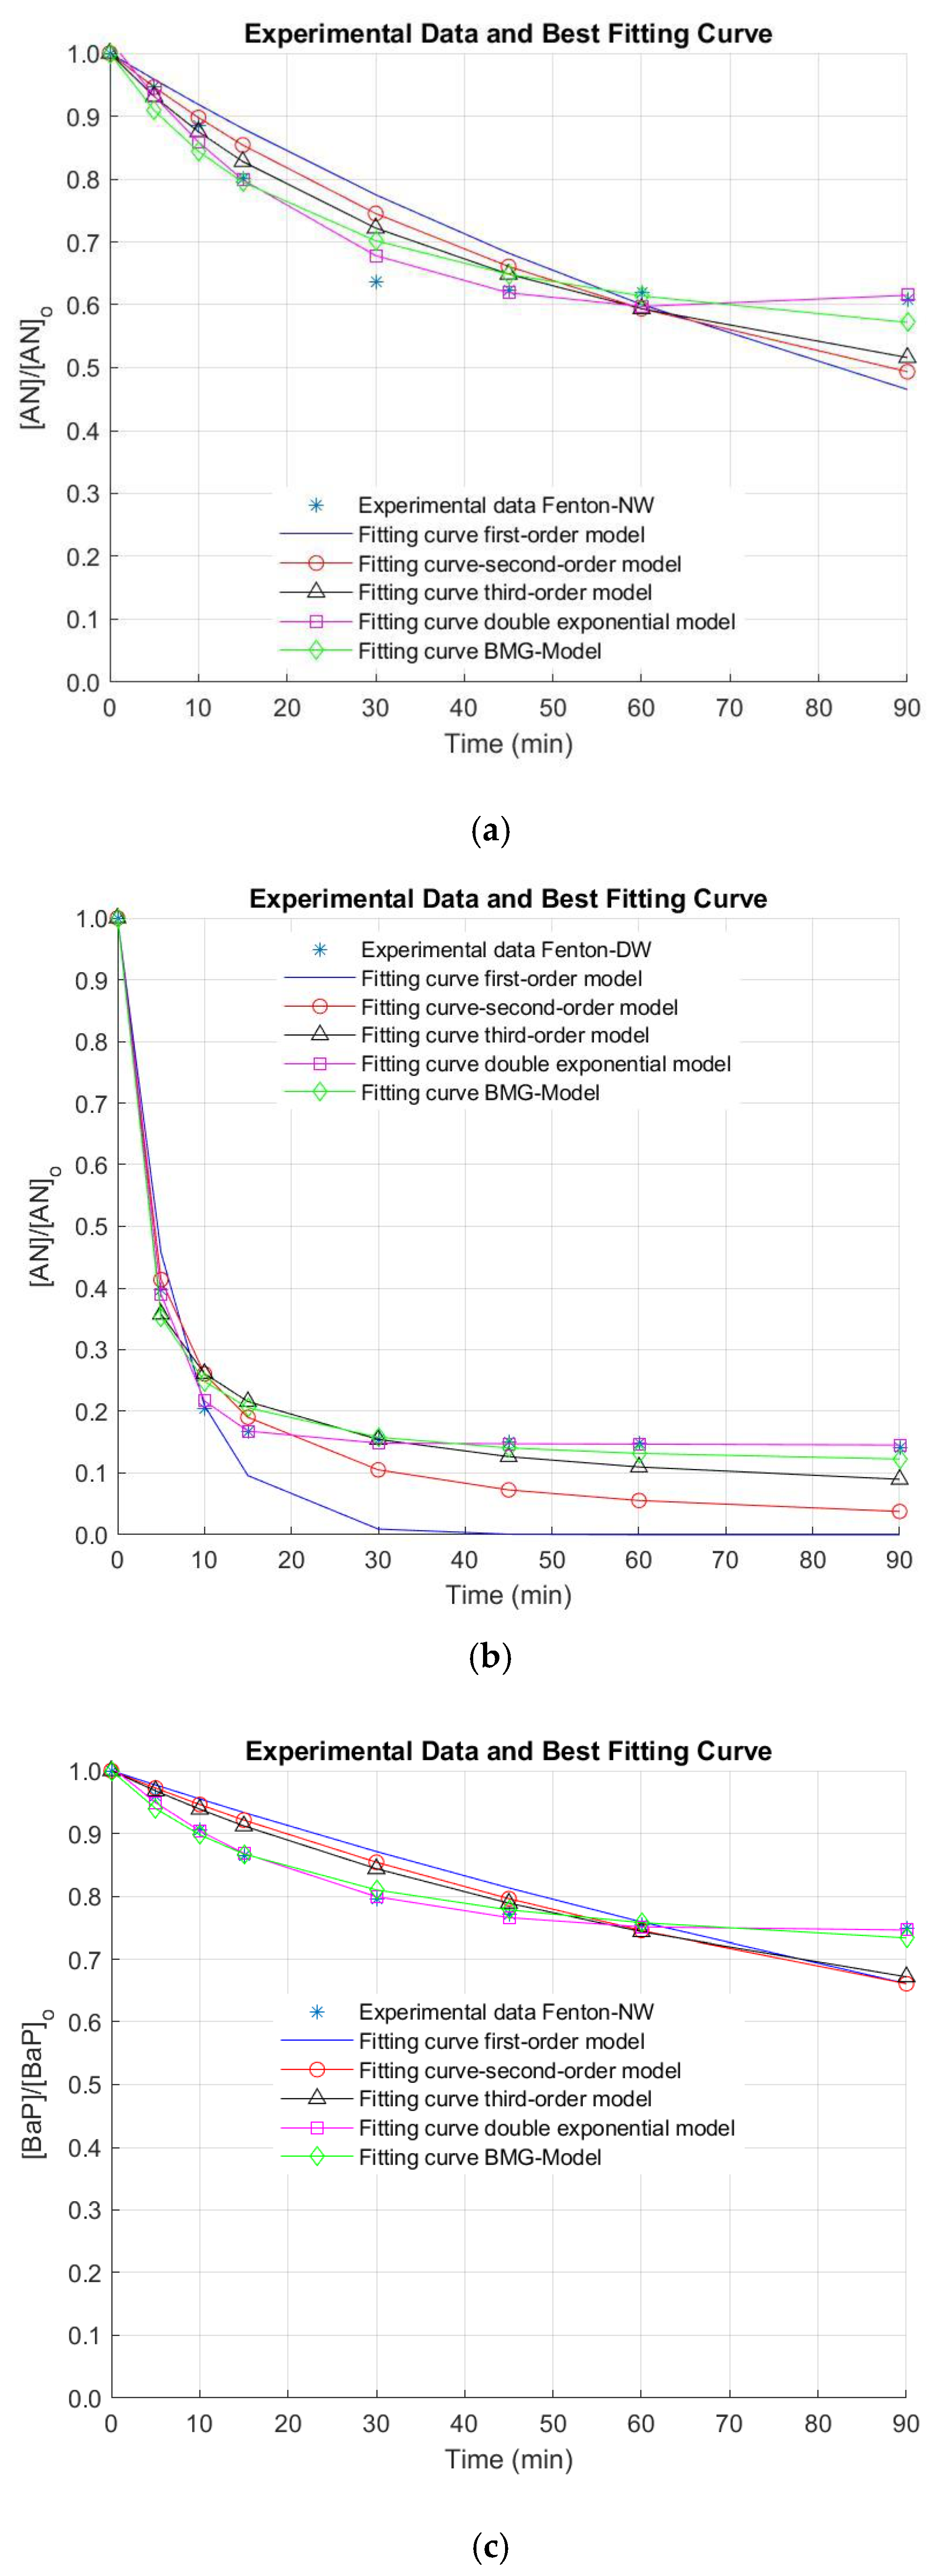
  • For checking the quality of the fit, the resulting fitted response curve and the data are plotted. The response curve is created from the returned parameters of the model. Finally, the coefficient of determination (R2) was used to choose the best model that describes the removal of the compounds of interest.
  • A = 1;
  • k1 = bestx(1);
  • yfit = A*exp(-k1 *tdata);
  • FS=10;
  • plot(tdata,ydata,’*’);
  • hold on
  • plot(tdata,yfit,’r’);
  • hold on
  • axis ([ 0 90 0 1.0 ])
  • title(‘Experimental Data and Best Fitting Curve’)
  • xlabel (‘Time (min)’)
  • ylabel (‘[AN]/[AN]_o’)
  • g=legend(‘Experimental data Fenton-NW’,’Fitting curve’,’location’,’best’);
  • set(g,’Box’,’on’,’EdgeColor’,[1 1 1])
  • set(gcf, ‘color’,’white’)
  • set(gca,’FontSize’,FS,’yticklabel’,num2str(get(gca,’ytick’)’,’%.1f’));
  • box off
  • grid on
  • a=corr(ydata,yfit)^2
The algorithm was used to find the functions that best fit the experimental data representing the degradation of a mixture of AN and BaP using the Fenton process.

3. Results and Discussion

The kinetic parameters of different models and their associated R2 values for the removal of a mixture of AN and BaP by the Fenton process under several operating conditions were calculated by applying the algorithm developed for the first-, second-, and third-order kinetic models, as well as for the double exponential and the BMG kinetic models. In order to compare the kinetic models constructed, the kinetic model providing the best fit was determined by the highest R2 associated, which was obtained among empirical and theoretical data [31].
The removal efficiencies of AN and BaP in surface (NW) and deionized water (DW) by the Fenton process under the optimal operating conditions are illustrated in Figure 3.
Only about ~36% and ~23% of AN and BaP, respectively, were removed during 30 min of oxidation in NW. These results were similar to those ones predicted by the model. Nevertheless, although the latter were slightly lower, they are within the estimated confidence intervals. Additionally, after ~30 min of reaction time, PAH conversion seems to be stabilized. This could be ascribed to the kinetics associated with the reactions involved in the iron recycling, which is characterized by a difference of about 760 times [6]. For a further pollutant conversion, 12 and 24 h of contact time were needed in the case of AN, as reported in the literature [32]. For BaP, a maximum elimination of 10 µg L−1 BaP after only 2 min of reaction under 3.75 mg L−1 Fe(II) and H2O2 in the range from 20 to 150 mg L−1 at pH 3.5 was observed [33]. This fast pollutant conversion was also observed for 2 mg L−1 NA using 8 mM Fe(II) at pH 4 [30].
It is important to note that, when NW was used, neither AN nor BaP were successfully removed under the optimal conditions. Thus, reaction time was extended for a total treatment time of 90 min, since there is evidence that the reaction time influences the Fenton process [34]. Nonetheless, elimination values higher than 40% and 30% for AN and BaP were not observed (AN and BaP removals of 39.2% and 25.2% were obtained after 90 min of treatment). In this regard, the stabilization of the oxidation system is demonstrated. This stabilization of the removal extent of the pollutants of interest was also observed when a simpler matrix (i.e., DW) was used (Figure 3). In this occasion, this phenomenon occurs after a treatment time of 15 min. Nevertheless, higher elimination efficiencies were obtained in DW at the end of the reaction time (~86% and ~77% for AN and BaP, respectively). These positive results in DW may be related to the quenching of reactive radicals by the dissolved organic matter (DOM) naturally present in NW. Furthermore, several anions can be found in NW in contrast to DW, which can also scavenge the free radicals generated during the studied AOP [31,33,35,36]. These reasons might explain the limited elimination extent of AN and BaP in comparison with other studies conducted using DW or a simpler water matrix.
In the Fenton process, the PAHs decay was stabilized in a relatively short period of time due to the rapid consumption of HO•, yielding two oxidation stages. The first conversion stage, taking place within the first 30 min of treatment, was mainly achieved by the Fenton reaction of Fe(II) with H2O2, resulting in a degradation of AN and BaP of 17.53% and 11.23%, respectively. The second stage occurring by the catalytic reaction of Fe(III) with H2O2, obtaining a final degradation extent of 20.44% and 13.29% for AN and BaP, respectively. Therefore, an increase in only 2.91% and 2.06% for AN and BaP was observed when moving from the first to the second stage. Note also that due to the dependence on the Fenton reaction on the H2O2 and Fe(II) content within the bulk, and the results obtained from the Fenton experiments, lower degradation values of AN and BaP were attained for the same treatment time. This double behavior concerning both reaction stages was also found by Mitsika and coworkers for acetamiprid [31], a persistent toxic substance.
In addition, the differences in the removal efficiency between AN and BaP both in NW and DW might be due to the physico-chemical characteristics of both compounds, which are ascribed to their differences in the molecular structures.
In the Figure, it is also observed that the fitting of the experimental kinetic data for the elimination of AN and BaP is not good by using the first-, second- and the third-order kinetic models. In contrast, the double exponential and the BMG kinetic models seem to result in a better extent of fit. Nonetheless, these observations must be numerically checked. For this purpose, the reaction rate constants representing the removal of AN and BaP through the Fenton process were obtained by the regression via optimization of five kinetic models. In turn, the reaction order was determined by means of the extent of fit, which was calculated by R2, as mentioned above.
The associated degradation rate constants for AN and BaP removal by the Fenton process under optimal conditions in NW and DW are reported in Table 2 for the five kinetic models. It was observed that the values of R2 for the five models are different.
It is important to note that the total agreement between the experimental data and those obtained from the kinetic models takes place when R2 values are approached to 1. The use of this correlation coefficient for determining the fit of a model has been also reported in the literature by [31] during the removal of 5 mg L−1 acetamiprid (0.023 mmol L−1) at different concentration of H2O2 and the catalyst in an aqueous solution at a pH value of 2.9. The referred authors found R2 values higher than 0.80, in general terms, although R2 values lower than 0.20 were also achieved, which demonstrated that, under certain operating conditions, the experimental data are not fitted by the models tested.
Here, as observed in Table 2, the kinetic rates are not highly fitted to the first-, second- and third-order kinetic models, since the R2 values associated are >0.80, >0.85 and >0.88, respectively. The double exponential and the BMG kinetic models have the highest R2 values in comparison with the first- and second-order kinetic models (R2 values ranging from 0.95 to ~1.0 were found), indicating that the AN and BaP decay kinetics were well described by the double exponential and the BMG models using the Fenton oxidation system.

4. Conclusions

The treatment of a mixture of AN and BaP contained in water by the Fenton oxidation process was considered in this study. Five kinetic models were used to analyze the removal kinetics of the target pollutants through the studied AOP under optimal operating conditions (first-, second- and third-order kinetic models, along with the double exponential and the BMG kinetic models). Among these kinetic models, the double exponential kinetic model was found to be the kinetic model with the best fitting. The BMG kinetic model also demonstrated high R2 values in comparison with the first-, second- and third-order models.
These results indicated that the AN and BaP elimination kinetics by the Fenton process under optimal operating conditions are well described by both the double exponential and the BMG kinetic models. For the latter model, the parameters best fitting the experimental curves were determined by minimizing the difference between the experimental and the simulated data, and indicated the initial removal rate of the pollutant of interest and the theoretical maximal fraction of the contaminant to be eliminated.

Author Contributions

Investigation: A.R.-C.; Conceptualization: A.R.-C. and E.C.; Writing—original draft preparation: A.R.-C.; Methodology: A.R.-C. and E.C.; Writing—review and editing: A.R.-C., E.C. and G.A.P.; Formal analysis: A.R.-C. and E.C.; Supervision: E.C. and G.A.P. All authors have read and agreed to the published version of the manuscript.

Funding

This research received no external funding.

Informed Consent Statement

Not applicable.

Data Availability Statement

Data are contained within the article.

Acknowledgments

The authors acknowledge the financial support of Universidad de Antioquia (Sustainability Strategy 2020-2021. ES84190067).

Conflicts of Interest

The authors declare no conflict of interest.

References

  1. Chu, L.; Sun, Z.; Cang, L.; Fang, G.; Wang, X.; Zhou, D.; Gao, J. A novel sulfite coupling electro-fenton reactions with ferrous sulfide cathode for anthracene degradation. Chem. Eng. J. 2020, 400, 125945. [Google Scholar] [CrossRef]
  2. Fang, J.; Zhao, R.; Rao, B.; Rakowska, M.; Athanasiou, D.; Millerick, K.; Suying, W.; Xiangyan, L.; Helen, H.L.; Reible, D.D. Removal of polycyclic aromatic hydrocarbons from water using Mn (III)-based advanced oxidation process. J. Environ. Eng. 2021, 3, 04021002. [Google Scholar] [CrossRef]
  3. Zhang, M.H.; Dong, H.; Zhao, L.; Wang, D.X.; Meng, D. A review on Fenton process for organic wastewater treatment based on optimization perspective. Sci. Total Environ. 2019, 670, 110–121. [Google Scholar] [CrossRef] [PubMed]
  4. Jain, B.; Singh, A.K.; Kim, H.; Lichtfouse, E.; Sharma, V.K. Treatment of organic pollutants by homogeneous and heterogeneous Fenton reaction processes. Environ. Chem. Lett. 2018, 16, 947–967. [Google Scholar] [CrossRef] [Green Version]
  5. Öz, Ç.; Çetin, E. Treatment of bilge water by fenton oxidation followed by granular activated carbon adsorption. Water 2021, 13, 2792. [Google Scholar] [CrossRef]
  6. Rubio-Clemente, A.; Chica, E.; Peñuela, G.A. Petrochemical wastewater treatment by photo-Fenton process. Water Air Soil Pollut. 2015, 226, 62. [Google Scholar] [CrossRef]
  7. Gholami, M.; Shomali, A.; Abbasi Souraki, B.; Pendashteh, A. Advanced numerical kinetic model for predicting COD removal and optimisation of pulp and paper wastewater treatment by Fenton process. Int. J. Environ. Anal. Chem. 2022, 102, 2729–2752. [Google Scholar] [CrossRef]
  8. Sinha, S.; Roy, D.; Roy, O.; Neogi, S.; De, S. Removal of organic contaminants from flowback water using Fenton process. J. Water Process Eng. 2022, 47, 102680. [Google Scholar] [CrossRef]
  9. Li, Y.; Cheng, H. Chemical kinetic modeling of organic pollutant degradation in Fenton and solar photo-Fenton processes. J. Taiwan Inst. Chem. Eng. 2021, 123, 175–184. [Google Scholar] [CrossRef]
  10. Enesca, A.; Isac, L. Tandem structures semiconductors based on TiO2_SnO2 and ZnO_SnO2 for photocatalytic organic pollutant removal. Nanomaterials 2021, 11, 200. [Google Scholar] [CrossRef] [PubMed]
  11. Cüce, H.; Temel, F.A.; Yolcu, O.C. Modelling and optimization of Fenton processes through neural network and genetic algorithm. Korean J. Chem. Eng. 2021, 38, 2265–2278. [Google Scholar] [CrossRef]
  12. Rubio-Clemente, A.; Chica, E.; Peñuela, G.A. Benzo[a]pyrene emerging micropollutant oxidation under the action of Fenton reactants in real surface water: Process optimization and application. Polycycl. Aromat. Compd. 2021, 41, 95–108. [Google Scholar] [CrossRef]
  13. Rubio-Clemente, A.; Chica, E.L.; Peñuela, G.A. Direct large-volume injection analysis of polycyclic aromatic hydrocarbons in water. Univ. Sci. 2018, 23, 171–189. [Google Scholar] [CrossRef]
  14. Rubio-Clemente, A.; Chica, E.; Peñuela, G. Rapid determination of anthracene and benzo(a)pyrene by high-performance liquid chromatography with fluorescence detection. Anal. Lett. 2017, 50, 1229–1247. [Google Scholar] [CrossRef]
  15. Wu, Y.; Zhou, S.; Qin, F.; Zheng, K.; Ye, X. Modeling the oxidation kinetics of Fenton’s process on the degradation of humic acid. J. Hazard. Mater. 2010, 179, 533–539. [Google Scholar] [CrossRef]
  16. Aljuboury, D.A.D.; Palaniandy, P. Kinetic study of inorganic carbon (IC) removal and COD removal from refinery wastewater by solar Photo-Fenton. Glob. Nest J. 2017, 19, 641–649. [Google Scholar]
  17. Lopez-Lopez, C.; Martín-Pascual, J.; Martínez-Toledo, M.V.; Muñío, M.M.; Hontoria, E.; Poyatos, J.M. Kinetic modelling of TOC removal by H2O2/UV, photo-Fenton and heterogeneous photocatalysis processes to treat dye-containing wastewater. Int. J. Environ. Sci. Technol. 2015, 12, 3255–3262. [Google Scholar] [CrossRef] [Green Version]
  18. Chan, K.H.; Chu, W. Model applications and intermediates quantification of atrazine degradation by UV-enhanced Fenton process. J. Agric. Food Chem. 2006, 54, 1804–1813. [Google Scholar] [CrossRef]
  19. Bautista, P.; Mohedano, A.F.; Gilarranz, M.A.; Casas, J.A.; Rodriguez, J.J. Application of Fenton oxidation to cosmetic wastewaters treatment. J. Hazard. Mater. 2007, 143, 128–134. [Google Scholar] [CrossRef]
  20. Marcinowski, P.P.; Bogacki, J.P.; Naumczyk, J. Cosmetic wastewater treatment using the Fenton, Photo-Fenton and H2O2/UV processes. J. Environ. Sci. Health Part A 2014, 49, 1531–1541. [Google Scholar] [CrossRef]
  21. Li, C.; Mei, Y.; Qi, G.; Xu, W.; Zhou, Y.; Shen, Y. Degradation characteristics of four major pollutants in chemical pharmaceutical wastewater by Fenton process. J. Environ. Chem. Eng. 2021, 9, 104564. [Google Scholar] [CrossRef]
  22. Suna, S.P.; Li, C.J.; Sunb, J.H.; Shib, S.H.; Fand, M.H.; Zhoua, Q. Decolorization of an azo dye Orange G in aqueous solution by Fenton oxidation process: Effect of system parameters and kinetic study. J. Hazard. Mater. 2009, 161, 1052–1057. [Google Scholar] [CrossRef] [PubMed]
  23. Hu, K.; Zhou, P.; Yang, Y.; Hall, T.; Nie, G.; Yao, Y.; Wang, S. Degradation of microplastics by a thermal Fenton reaction. ACS ES&T Eng. 2021, 2, 110–120. [Google Scholar]
  24. Behnajady, M.A.; Modirshahla, N.; Ghanbary, F.A. kinetic model for the decolorization of C.I. Acid Yellow 23 by Fenton process. J. Hazard. Mater. 2007, 148, 98–102. [Google Scholar] [CrossRef]
  25. Saini, R.; Kumar Mondal, M.; Kumar, P. Fenton oxidation of pesticide methyl parathion in aqueous solution: Kinetic study of the degradation. Environ. Prog. Sustain. Energy 2017, 36, 420–427. [Google Scholar] [CrossRef]
  26. Ertugay, N.; Acar, F.N. Removal of COD and color from Direct Blue 71 azo dye wastewater by Fenton’s oxidation: Kinetic study. Arab. J. Chem. 2017, 10, S1158–S1163. [Google Scholar] [CrossRef] [Green Version]
  27. Zhang, Q.; Wang, C.; Lei, Y. Fenton’s Oxidation Kinetics, Pathway, and Toxicity Evaluation of Diethyl Phthalate in Aqueous Solution. J. Adv. Oxid. Technol. 2016, 19, 125–133. [Google Scholar] [CrossRef]
  28. Gao, F.; Han, L. Implementing the Nelder-Mead simplex algorithm with adaptive parameters. Comput. Optim. Appl. 2012, 51, 259–277. [Google Scholar] [CrossRef]
  29. De la Cruz, D.R. Optimal Fit Non-linear Function for Allocating Emergency Goods during Initial Stage of Disaster Relief in Malolos City. Inst. Electron. Eng. Philipp. J. 2021, 4. Available online: http://www.iecepjournal.net/index.php/iecepjournal/article/view/8 (accessed on 31 August 2022).
  30. Nemet, A.; Bogataj, M.; Kravanja, Z. Optimization of the Sequence of Wastewater Treatment in the Cosmetic Industry. Chem. Eng. Trans. 2021, 88, 715–720. [Google Scholar]
  31. Mitsika, E.E.; Christophoridis, C.; Fytianos, K. Fenton and Fenton-like oxidation of pesticide acetamiprid in water samples: Kinetic study of the degradation and optimization using response surface methodology. Chemosphere 2013, 93, 1818–1825. [Google Scholar] [CrossRef] [PubMed]
  32. Ma, Y.; Chen, B.; Zhang, B.; Zheng, J.; Liu, B.; Zhang, H. Fenton oxidation process for remediation of produced water containing polycyclic aromatic hydrocarbons. In Proceedings of the CSE 2014 13th International Environmental Specialty Conferences, Halifax, NS, Canada, 28–31 May 2014; pp. 1–10. [Google Scholar]
  33. Homem, V.; Dias, Z.; Santos, L.; Alves, A. Preliminary feasibility study of benzo(a) pyrene oxidative degradation by Fenton treatment. J. Environ. Public Health 2009, 2009, 149034. [Google Scholar] [CrossRef] [PubMed] [Green Version]
  34. De Souza e Silva, P.T.; Da Silva, V.L.; de Barros Neto, B.; Simonnot, M.O. Phenanthrene and pyrene oxidation in contaminated soils using Fenton’s reagent. J. Hazard. Mater. 2009, 161, 967–973. [Google Scholar] [CrossRef] [PubMed]
  35. Ribeiro, J.P.; Nunes, M.I. Recent trends and developments in Fenton processes for industrial wastewater treatment–A critical review. Environ. Res. 2021, 197, 110957. [Google Scholar] [CrossRef]
  36. Rodríguez, S.; Lorenzo, D.; Santos, A.; Romero, A. Comparison of real wastewater oxidation with Fenton/Fenton-like and persulfate activated by NaOH and Fe (II). J. Environ. Manag. 2020, 255, 109926. [Google Scholar] [CrossRef]
Figure 1. Batch reactor employed in all experiments.
Water 14 03381 g001
Figure 2. Algorithm flow chart.
Water 14 03381 g002
Figure 3. Removal of anthracene (AN) in (a) natural water (NW) and (b) deionized water (DW), and benzo[a]pyrene (BaP) in (c) NW and (d) DW by the Fenton oxidation process. [AN]0 = 3 µg L−1, [BaP]0 = 3 µg L−1; [Fe(II)]0 = 0.44 mg L−1; [H2O2]0 = 10.50 mg L−1.
Water 14 03381 g003aWater 14 03381 g003b
Table 1. Objective functions obtained for several kinetic models.
Kinetic ModelFunction
First-order modelfunction E = Order1(x,tdata,Cdata)
k1 = x(1);
E = sum((Cdata - exp(-k1*tdata)).^2);
Second-order modelfunction E = Order2(x,tdata,Cdata, A)
C0 = A;
k2 = x(1);
E = sum((Cdata -1./(1+C0*k2*tdata)).^2);
Third-order modelfunction E = Order3(x,tdata,Cdata, A)
C0 = A;
k3 = x(1);
E = sum((Cdata –sqrt(1./(1+C0^2*k3*tdata))).^2);
Behnajady-Modirshahla-Ghanbery (BMG) modelfunction E = Order3(x,tdata,Cdata)
A1 = x(1);
A2 = x(2);
E = sum((Cdata -(1-tdata./(A1+A2*tdata))).^2);
Double exponential modelfunction E = Order3(x,tdata,Cdata)
A3 = x(1);
k6 = x(2);
A4 = x(3);
k7 = x(4);
E = sum((Cdata - (A3*exp(-k6*tdata)+A4*exp(-k7*tdata))).^2);
Table 2. Kinetic parameters of different models and their correlation coefficients (R2) for the removal of a mixture of AN and BaP in deionized (DW) and natural (NW) water by the Fenton process.
PollutantMatrixFirst-Order ModelSecond-Order ModelThird-Order ModelBMG ModelDouble Exponential Model
k1 (min−1)R2k2 (µg−1 min−1)R2k3
(µg−2 min−1)
R2A1 (min)k3 (min−1)A2k4R2A3k6 (min−1)A4k7 (min−1)R2
ANNW0.00850.80940.00380.87180.00340.910845.78380.02181.82780.54710.95260.61460.03440.4061−0.00410.9806
DW0.15630.96070.09450.96910.15150.98192.14730.46571.11610.89600.99030.85150.25280.14950.00030.9996
BaPNW0.00460.81480.00190.85490.00150.888567.98420.01472.99350.33410.98680.29840.04350.7074−0.00050.9970
DW0.09520.88670.05000.92420.06510.96523.19590.31291.22820.81420.98930.76330.21040.23660.00020.9987
Notes: k1, k2 and k3: kinetic reaction rate constants representing the depletion of the target pollutant according to the first-, second and third-order kinetic models. A1 and A2: constants related to the reaction kinetics and oxidation capacities of the treatment system, respectively. k4 and k5: constants concerning 1/A1 and 1/A2 that refer to the initial pollutant removal rate within the bulk and the theoretical maximal removal fraction of the pollutant of interest, respectively. A3 and A4: fractions of the target pollutant initial concentration. k6 and k7: kinetic reaction rate constants representing the abattement of the target pollutant for the first and second stages, respectively.
Publisher’s Note: MDPI stays neutral with regard to jurisdictional claims in published maps and institutional affiliations.

