
Isotopic Evidence for Anaerobic Oxidation of Methane in the Freshwater Sediments of Reservoirs: The Impact of Selected Environmental Factors

Department of Environmental and Chemistry Engineering, Faculty of Civil and Environmental Engineering and Architecture, Rzeszów University of Technology, al. Powstańców Warszawy 12, 35-959 Rzeszów, Poland
*
Author to whom correspondence should be addressed.
Water 2022, 14(21), 3375; https://doi.org/10.3390/w14213375
Submission received: 5 October 2022
/
Revised: 20 October 2022
/
Accepted: 21 October 2022
/
Published: 25 October 2022
(This article belongs to the Section Water and Climate Change)
Abstract
:This paper presents the results of research conducted in 2018–2019 on the anaerobic oxidation of methane (AOM) in reservoir sediments. Located in SE Poland, Maziarnia, Nielisz and Rzeszów Reservoirs were selected for the purposes of the research. Rates of AOM were determined via 50-day incubation of sediment from the 0–5, 5–10 and 10–15 cm layers, to which a 13CH4 isotope tracer was added. The sediments had been collected from a single station at each reservoir in places that had earlier reported high levels of emission of CH4 to the atmosphere. Results demonstrate ongoing AOM processes in the kinds of freshwater ecosystem represented by reservoirs, further implying the existence of an important sink for CH4. More specifically, however, AOM rates were found to differ among both the reservoirs, and the layers of sediment, studied. Preliminary analysis of selected environmental factors capable of affecting AOM failed to suggest the availability of electron acceptors (NO3−, SO42−, Fe3+) as key controlling factors. Important factors also proved to be sediment pH, the quality of organic matter (especially the content of organic electron acceptors), the salinity of pore water, and—primarily—the presence of the microorganisms actually responsible for AOM. The results here are important, given the low level of knowledge of AOM process in reservoirs. They therefore help supply key information on the functioning of these ecosystems and the role in global climate change they play.
1. Introduction
Methane (CH4) is one of the main greenhouse gases, and furthermore, it is one whose concentration in the atmosphere is increasing steadily, with the result that average air temperatures also go up [1]. On that basis, researchers around the world seek to identify the sources of CH4 in the atmosphere and to quantify level of emission. Among other sources, freshwater ecosystems such as lakes and reservoirs have been shown to be of significance globally, where CH4 is concerned [2,3,4,5,6,7]. Since reservoirs as anthropogenic, methane-emitting bodies of water are continuing to increase in number worldwide, their emissions of CH4 have proved to be of special interest. A specific feature of the functioning of these ecosystems is the production of organic matter during primary production in situ as well as its continuous transport from the catchment.
Under anaerobic conditions, the organic matter accumulated in sediments decomposes, with CH4 being among the end products. Spatial variation in emissions of this gas from reservoirs has been shown to be significant, with zones located near tributaries considered hot spots for CH4 [8,9,10,11,12,13,14,15]. However, it should be stressed at the outset that amounts of CH4 emitted to the atmosphere are not equivalent to what is produced in sediments, as part of that gas is oxidised there, or on the way through the water column. That leaves it all the more important for the processes contributing to a reduction in CH4 emissions from reservoirs to be well understood.
One of the least recognised sinks for CH4 involves the anaerobic oxidation of methane (AOM) in sediments—a process in which microorganisms of the Archaea group participate, with the role of electron-acceptor played by such substances other than oxygen such as the ions NO3−, SO42−, Fe3+ and Mn4+ [16,17,18,19,20]. Where sulphates are present, it is specific groups of Archaea (i.e., ANME-1, ANME-2a,b,c and ANME-3) that oxidise methane, while in the presence of nitrate (V), the role is played by ANME2-d, and in the presence of iron (III), it is played by microorganisms associated with the ANME-2d group [21,22,23,24]. In order to identify these microorganisms in sediments, characteristic lipid biomarkers (e.g., archaeol, crocetane, PMI, pristane, phytane and squalane) are most often used [25,26,27,28].
However, as the AOM process was until recently thought to be confined to environments with saline waters, the importance of the process in inland waters was anyway neglected. Therefore, there is a great need for research in this area. The few scientific reports about AOM in freshwater sediments mainly concern lakes and wetlands [29,30,31,32,33]. Relevant data on reservoirs prove to be entirely lacking.
The main aim of the presented work was to determine the rates of the anaerobic oxidation of methane (AOM) in freshwater sediments of reservoirs and to determine the biotic and abiotic factors potentially controlling this one. The obtained results of the research are very important and of a cognitive nature. Recognition of the AOM process can contribute to changing existing views about the cycle of CH4 in freshwater ecosystems and provides significant information on functioning of reservoirs and their role in global climate change.
2. Materials and Methods
2.1. Study Area
The objects of research were the sediments present in selected reservoirs of SE Poland, located in Podkarpackie Province (Rzeszów and Maziarnia Reservoirs) or Lubelskie Province (Nielisz Reservoir).
Rzeszow Reservoir was created in 1974. The main aim of the construction of the reservoir was the proper operation of the water intake for the city of Rzeszow and recreational-sports use. The surroundings of the reservoir are wasteland, cultivated fields and few scattered buildings. The catchment area of the reservoir, apart from a few industrial centres, is mainly agricultural in nature. Over the years, as a result of sediment accumulation and intensive deposition of debris carried by tributaries, the reservoir has become significantly siltation and shallow. Reclamation activities are currently underway at the reservoir.
Established in 1988, the Maziarnia Reservoir serves many functions, including: water supply, irrigation, fish farm, recreation and retention. The latter task is significantly limited due to insufficient capacity. The catchment of the reservoir is predominantly arable, with mixed crop and meadows zones accounting for about 70% of the area. A dominant role is played by individual-scale farming in highly fragmented holdings of land.
Nielisz Reservoir, commissioned in 2008, is surrounded by a belt of coniferous forests and consists of two parts: the main reservoir and the preliminary reservoir. The basic tasks of the reservoir include: flood protection, limiting water table fluctuations during the bird breeding season, energy generation (there is a 362 kW hydroelectric power plant on the dam), and use in recreation, leisure and amateur fishing.
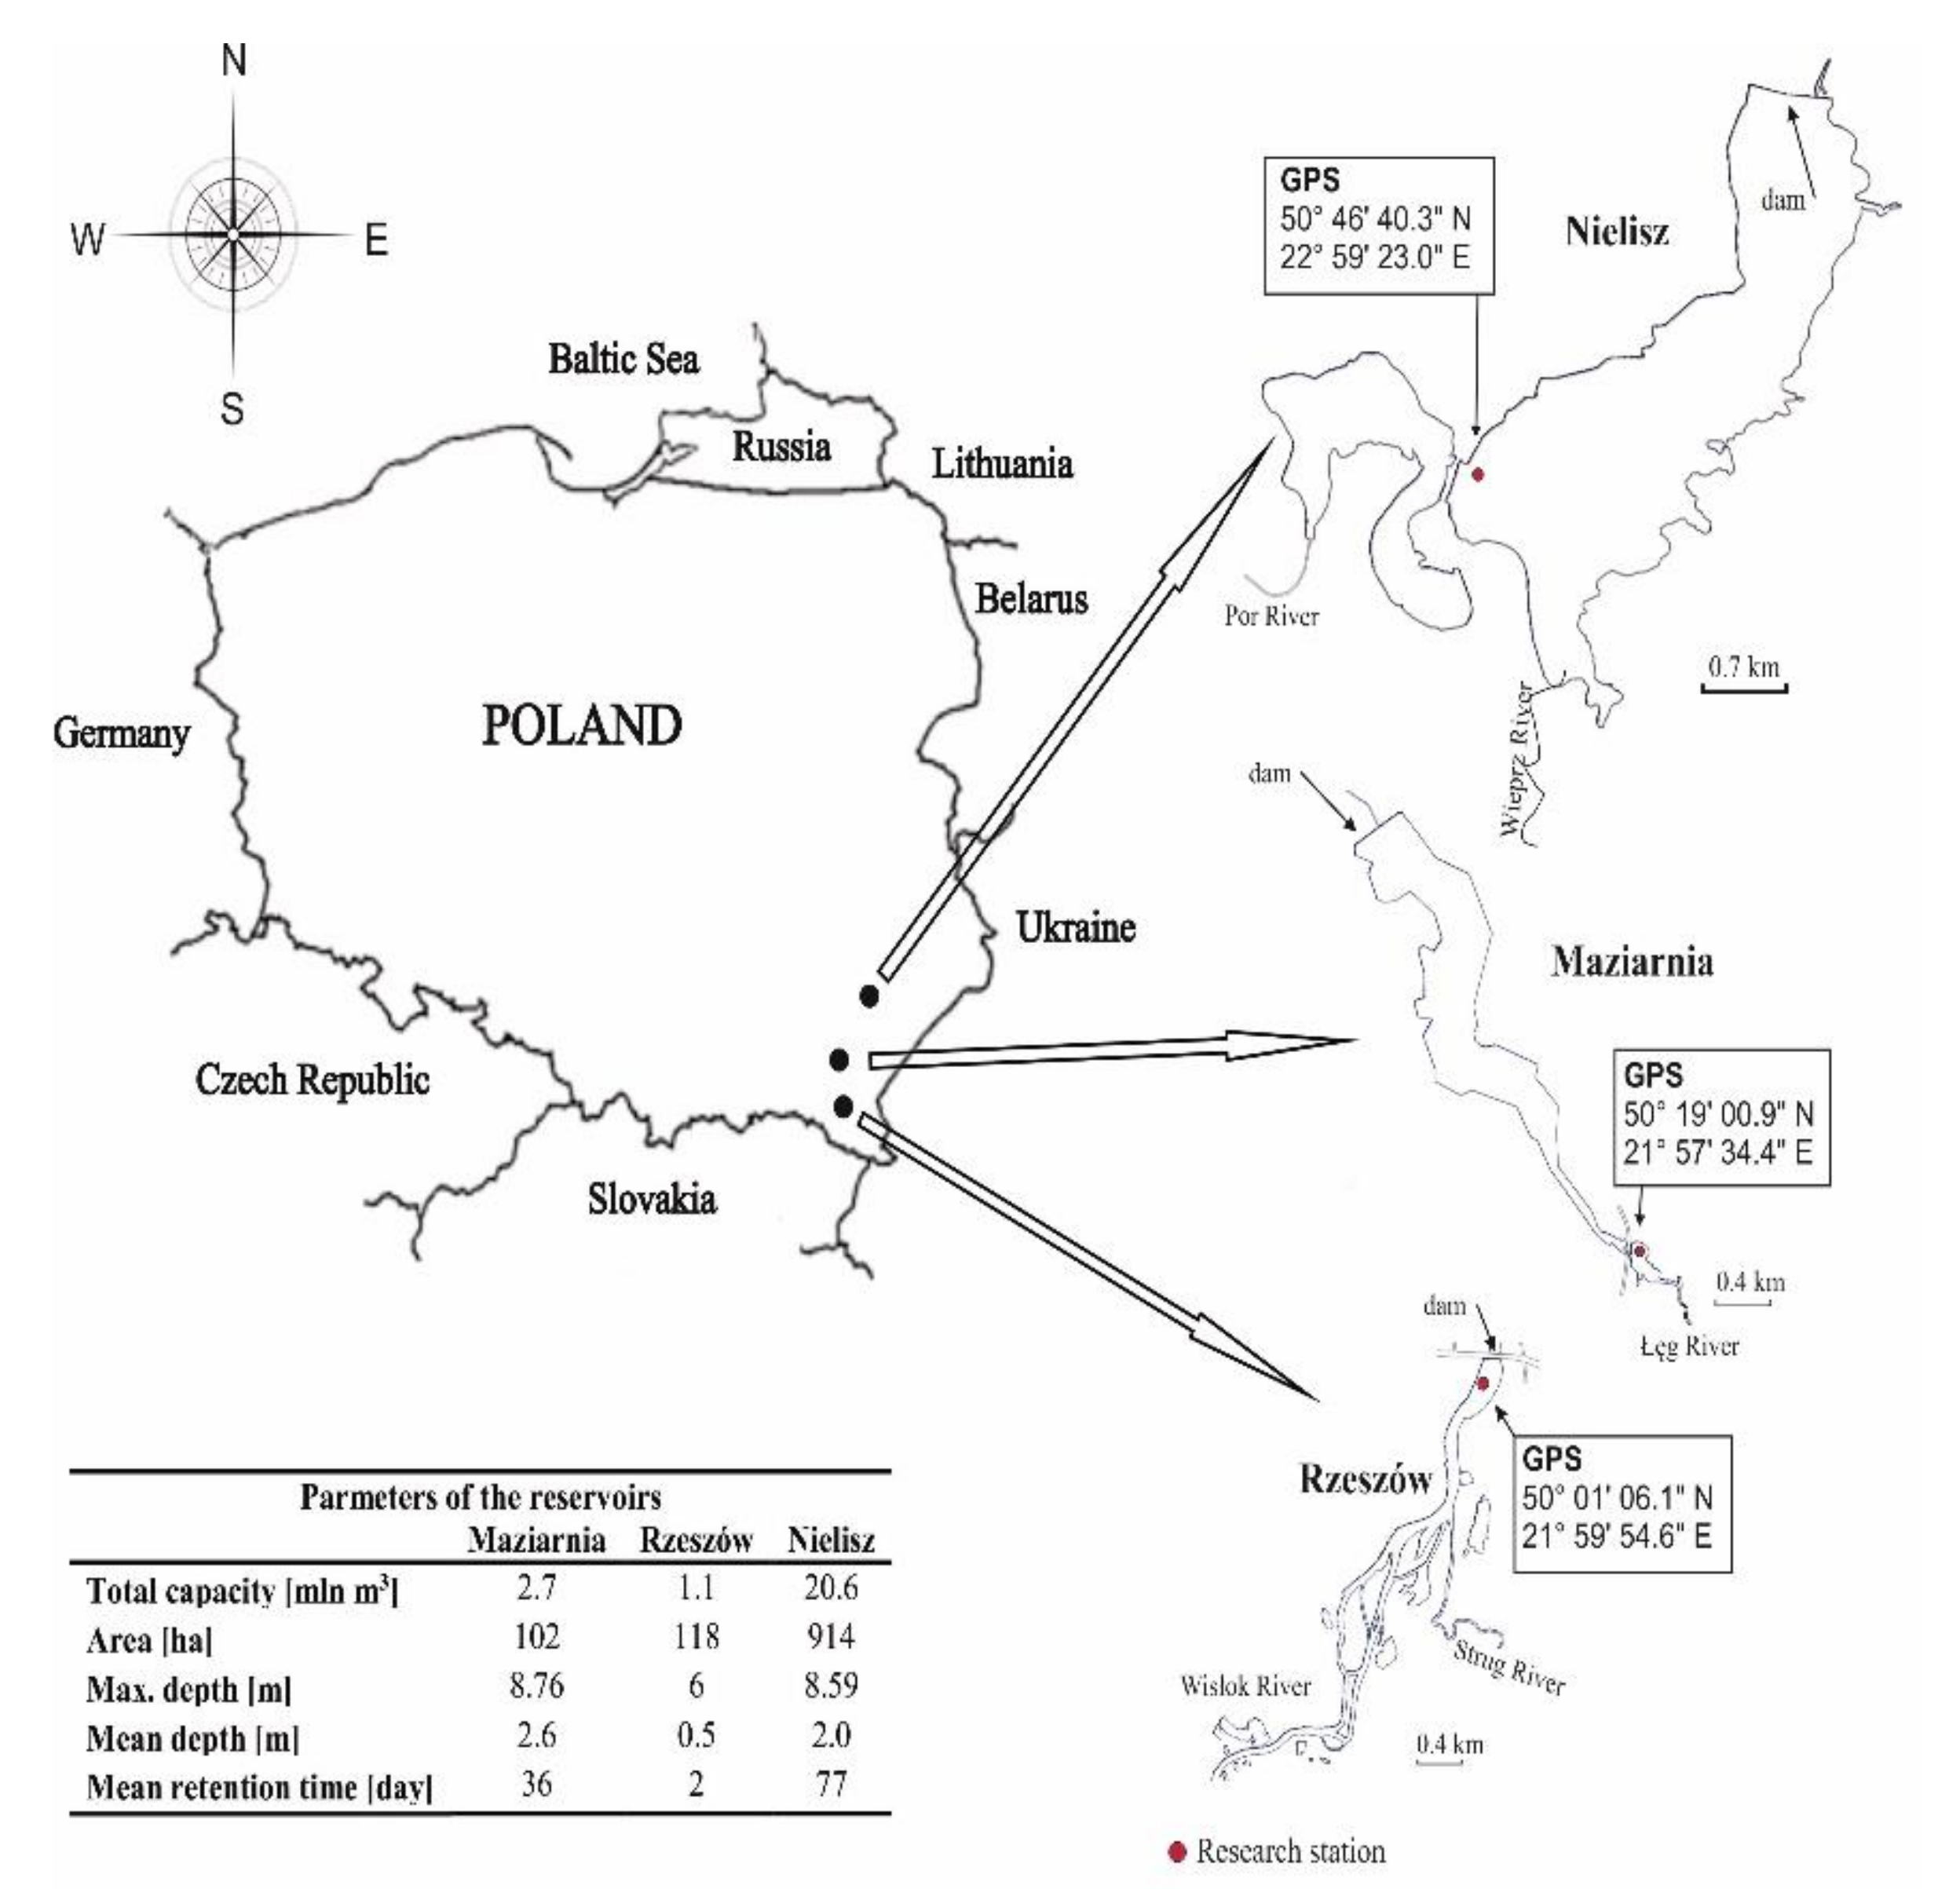
The objects selected for the research differed, e.g., in size, nature of catchment and degree of degradation. Selected parameters of the studied reservoirs and their catchments are as shown in Figure 1.
2.2. Methods
2.2.1. Sediment Sampling and Preparation
Sediments from Rzeszów Reservoir were collected in April 2018, while those from Maziarnia and Nielisz Reservoirs were collected in April 2019. In each of the reservoirs, sediments were collected from a single station located in the river zone (Maziarnia and Nielisz) or near the dam (Rzeszów) (Figure 1). The height of the water column over the sediment at the sampling stations was approx. 1 m. These research stations were selected by reference to the conclusions of previous studies showing that emissions of CH4 to the atmosphere were higher at these stations than others, amounting to 29.13 mmol/m2·d on average (Rzeszów), as well as 372.43 (Maziarnia) and 209.55 mmol/m2·d (Nielisz) [34]. The earlier study also confirmed a distinct nature to the pathways leading to the generation of CH4 in the different production pathways was found between reservoirs. While acetate fermentation prevailed at the Nielisz site, CO2 reduction prevailed at Maziarnia, while the roles played by the two pathways were similar in Rzeszów Reservoir [35,36].
The work described here thus proceeded on the assumption that the various biotic and abiotic parameters prevailing in the sediments at the stations selected for study would illustrate various courses to the AOM process representing the focus of the work.
Five intact sediment cores were collected from each reservoir, into plexiglass pipes, using a sampler constructed specially [37]. These were transported to the laboratory along with overlying water. Sediment cores were then expelled from pipes using a piston in such a way as to ensure division into three 5 cm layers, i.e., 0–5, 5–10 and 10–15 cm. Pore water was centrifuged from each layer of the first core (with an MPW-352 laboratory centrifuge) prior to determinations being made of concentrations of: organic carbon (TOCW), inorganic carbon (IC), as well as ions of nitrate (III) (NO2−), nitrate (V) (NO3−), ammonium (NH4+), sulphate (SO42−), chloride (Cl), sodium (Na+), potassium (K+), magnesium (Mg2+) and calcium (Ca2+). Pore-water from the second core, set aside for determinations of the concentrations of iron ions (Fe2+ and Fe3+) was extruded directly into gas-tight vials using a modified squeezer [38] to ensure that contact with air was avoided. Different sediment layers of the third core were dried at 60 °C, and milled, before being tested in regard to: pH, organic matter (OM), total organic carbon (TOCS) and humic substances (HS). The fourth sediment core, divided into layers, was first stored at −20 °C prior to the determination of contents of selected lipid biomarkers of microorganisms participating in AOM. The fifth core was deployed in studying the AOM process, with all analytical procedures performed in a helium atmosphere (glove bag).
2.2.2. Sediment Analysis
Sediment pH was determined potentiometrically (MultiLine P4, WTW, Reutlingen, Germany) in suspension with 1 N KCl. The content of organic carbon (TOCS) was determined using a CN elemental analyser (Flash EA 1112, ThermoQuest, USA). Quality control relied on standard samples of known composition of carbon and nitrogen (acetanilide—C8H9NO). Prior to the determination of TOC content, samples of dried and milled sediment were placed in a desiccator with concentrated HCl vapours [39] for 72 h to ensure the removal of carbonates. Prior to analysis, sediment samples were again dried to constant mass at 60 °C. The content of humic substances in sediments was assessed according to the modified Griffith–Schnitzer method [40]. Granulometric analysis of sediments was performed in line with the PN-EN ISO 165 17892-4: 2017-01 standard. Areometric analysis (sedimentation method based on the Stokes law) was used to determine the content of boundary fractions for particles with a diameter of 0.063 to 0.002 mm and less than 0.002 mm. Sieve analysis was used for fractions with a particle diameter of 2–0.063 mm. Sediments were in turn classified in accordance with the PN-EN ISO 14688-2: 2018-05 standard.
Lipids (pristane, crocetane, squalane and archaeol) were extracted from 10 g portions of wet sediments by sonication in a sequence of solvent mixtures of increasing (1:2, 2:1, 1:0) dichloromethane: methanol (DCM:MeOH) ratios. Extracts were pooled and partitioned against a pre-extracted 0.05 M KCl-solution. The organic phase was collected and the solvent evaporated, yielding a total lipid extract (TLE). An aliquot of such TLE was then saponified with 6% KOH in methanol (80 °C, 3 h). Once cooled, this mixture was diluted with 0.05 M KCl-solution with neutral lipids then released from the basic mixture through a process of extraction with n-hexane. The neutral lipids were separated by solid-phase extraction (SPE) into three compound classes of (1) hydrocarbons (n-hexane:dichloromethane, 95:5, v:v) and (2) alcohols (dichloromethane:acetone, 9:1). Prior to analysis, alcohols were silylated with 50 µL of N,O-bis(trimethylsilyl)trifluoroacetamide (BSTFA) and 100 µL pyridine for 1 h at 70 °C. In the case of alcohols and hydrocarbons, the analysis in question was performed using Thermo Electron Finnigan GC-MS (USA) equipped with a 60 m ZB-5 ms capillary column (0.32 mm i.d., 0.25 μm film thickness). Helium was supplied as the carrier gas at a flow rate of 1.2 mL/min. The GC temperature programme used was as follows: initial temperature 60 °C (1 min isothermal—alcohols; 2 min isothermal—hydrocarbons), from 60 to 150 °C (at 10 °C/min—alcohols; at 15 °C/min—hydrocarbons) and from 150 to 320 °C (at 5 °C/min—alcohols and hydrocarbons), 320 °C (25 min isothermal—alcohols and 2 min isothermal—hydrocarbons) [41,42,43,44].
2.2.3. Pore-Water Analysis
Ion concentrations for: nitrate (III) (NO2-), nitrate (V) (NO3-), ammonium (NH4+), sulphate (SO42), chloride (Cl-), sodium (Na+), potassium (K+), magnesium (Mg2+) and calcium (Ca2+) were analysed in pore-water samples using a DIONEX ICS-5000 ion chromatograph. Concentrations of total organic carbon (TOCw) and inorganic carbon (IC) were determined using a Shimadzu TOC-V CPN analyser, concentrations of Fe2+ and Fe3+ ions via the spectrophotometric method with ferrozine [45].
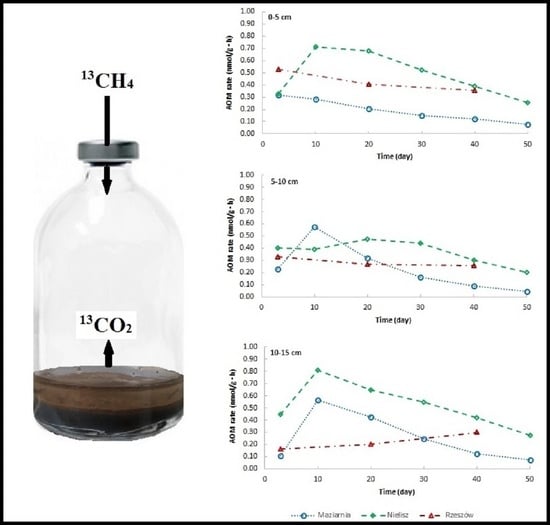
2.2.4. 13CH4 Incubation Experiment
To determine rates of AOM, 7 g portions of wet sediment from the different (0–5 cm, 5–10 cm and 10–15 cm) layers were placed into the incubation vessels with 14 mL of deionised water deoxygenated by nitrogen (99.99% Air Products, USA). All operations were carried out in a glove box (830-ABB Compact Glove Box Plas-Labs, USA), with the commencement of work preceded by 7–8 changes of the air in the glove box, which was replaced with helium (99.9999% Air Products). The prepared samples were preincubated to remove oxygen residues reflecting biochemical processes. This was completed by placing those samples in a thermostat for 10 days (at 15 °C, in the dark). Thereafter, 1 cm3 of the 13CH4 isotope tracer (99%, Sigma-Aldrich 490229–1L-EU, USA) was introduced into the headspace, prior to 40 days of incubation of the sediments (in the case of Rzeszów Reservoir), or 50 days (in the cases of Maziarnia and Nielisz Reservoirs). To provide evidence that the CO2 produced by the AOM process is derived from the isotopic tracer, sediment incubation without 13CH4 was carried out simultaneously. Incubation temperature was 15 °C, as this corresponded with the in situ temperature of the sediments collected from the first reservoir (April 2018, Rzeszów). The concentration of CO2 in the headspace was determined on day 0, and then, successively on days 3, 10, 20, 30, 40 and 50, concentrations of both CO2 and δ13C-CO2 were determined. The CO2 concentrations at time zero were subtracted from those measured in subsequent days of incubation.
To determine the CO2 concentration in the headspace, 1 cm3 of the gas was taken in a gas-tight syringe (1001SL Hamilton, USA), with the difference made up each time using 1 cm3 of helium (99.9999% Air Products). CO2 concentrations were measured using a Shimadzu GC-2010 Plus gas chromatograph equipped with a Barrier Discharge Ionization Detector (BID) and a Shin Carbon ST column (2 m, 1.00 mm ID, Mesh 100/120). Samples were injected manually into the GC apparatus with the detector working at 250 °C. Temperatures were in turn 150 °C in the case of the injection port, and 60 °C in the column (the latter maintained for 13 min). The carrier gas was helium (99.9999% Air Products), supplied at a flow rate of 50 mL/min.
The carbon isotopic composition of CO2 was determined using an isotope ratio mass spectrometer on-line with a gas chromatograph (GC-CIII-IRMS DELTAPlus Finnigan, Thermo Electron Corporation, USA) by injecting 0.1 cm3 of the headspace. Results have been presented in the form of δ13C expressed in ‰ relative to the PDB (Pee Dee Belemnite) standard.
Values obtained for CO2 concentrations (ppm) and δ13C-CO2 (‰) were used to calculate the anaerobic oxidation of methane (AOM).
2.2.5. Calculations
The AOM rate (nmol/g·h) and amount of CH4 oxidised (nmol/g) were calculated using Equations (1) and (2) [29,31]. The values δ13C-CO2 were converted to 13C AP% in line with Equation (3):
where 13C AP—13C atom percent (%), CO2—carbon dioxide concentration at time (ppm), Vg—volume of headspace in vial (0.096156 dm3), Vm—molar volume of ideal gas at 25 °C (24.45 dm3/mol), m—dry sediment weight (g), t—incubation time (h), Rstd—absolute ratio constant in the standard (0.0111803).
3. Results
3.1. Sediment Characteristics
The sediments studied were found to differ in their granulometric composition (Table 1). The silty fraction dominated in all sediment layers from Maziarnia Reservoir (44.09–50%). In the 0–5 and 5–10 cm layers, the smallest share was accounted for by the sand fraction (17.49% and 25.18%), while in the deepest layer, it was the clay fraction (22%). The analysed sediments were loam down to a depth of 10 cm, though with clay loam present in the 10–15 cm layer. The analysis of the granulometric composition of the Nielisz Reservoir sediments confirmed these as clay-loam sediments throughout the studied depths. In the 5–10 and 10–15 cm layers, it was the silty fraction that predominated, with the respective shares being 45.98 and 56.05%, and with clear increases occurring at successively greater depths. The sand fraction took the highest share in the 0–5 cm layer, (51.27%). It was also in these sediments that the smallest clay-fraction share was noted (in the range 15.44–22.64%). In the sediments from Rzeszów Reservoir, as in those from the Maziarnia site, the silty fraction dominated, though with a much larger share (73.15–77.35%). The sand fraction proved to be the smallest, accounting for between 3.50 and 5.23% of the total (Table 1). The surface layer thus consisted of silty loam sediments, while the deeper layers were classified as silty clay.
The pH values for the analysed sediments ranged from 6.39 to 8.03, with greatest acidity characterising those from Maziarnia, and highest alkalinity those from the Nielisz site (Table 2). While it was the deeper-lying sediments from Maziarnia Reservoir that had lower pHs, the trend for Rzeszów Reservoir was the reverse. No such trends could be noted for Nielisz Reservoir.
Contents of OM and TOCS showed strong correlations with each other (r = 0.9831, p < 0.001), with TOCS being 31–47% of OM. The sediments from Nielisz Reservoir displayed highest contents of OM and TOCS, in the respective ranges 12.47–13.16% and 4.94–5.22%. Lowest contents of OM and TOCS were recorded in the sediments of Maziarnia Reservoir, and were respectively in the 3.39–4.71% and 1.29–1.79% ranges (Table 2).
HS, as natural organic compounds found commonly in the aquatic environment, were found to correlate closely with OM (r = 0.9899, p < 0.001) and TOCS (r = 0.9909, p < 0.001). It was in the Nielisz sediments that HS contents were highest (in the 48.00–50.50 mg/g range), while lowest values were those in the 14.2–18.20 mg/g range reported from Maziarnia Reservoir (Table 2).
Where the analysed lipid biomarkers were concerned, sediments showed highest contents of archaeol (in the 0.47–3.48 µg/g range), as well as lowest contents of crocetane (0.07–0.14 µg/g) (Table 2). Typically, it was deeper layers of sediment that were found to contain smaller amounts of the lipid biomarkers. However, there was also a general observation that sediments from Nielisz Reservoir stood out in terms of their greatest level of enrichment in archaeol.
3.2. Pore-Water Characteristics
Table 3 presents concentrations of NO2−, NO3−, NH4+, SO42−, Cl−, Na+, K+, Mg2+, Ca2+, Fe2+, Fe3+ ions, as well as IC and TOCW, in the pore water of sediments in the reservoirs studied.
Analysis of concentrations of nitrogen compounds revealed that these were slightly higher in Maziarnia Reservoir than the other sites, where NO2- and NO3- were concerned. Respective values ranged from 0.024 mg/dm3 in the deepest layer to 0.032 mg/dm3 in the surface layer, as well as from 0.037–0.071 mg/dm3 in the 5–10 cm layer. The lowest recoded concentrations of NO2- and NO3- characterised Nielisz Reservoir, even as this was the reservoir distinguished from the others in having the highest observed concentrations of NH4+, which also decreased with sediment depth—from 16.58 to 8.07 mg/dm3.
The highest concentrations of SO42− were the 6.30–14.49 mg/dm3 recorded in Maziarnia Reservoir, while figures were slightly lower at the Nielisz site (8.40–11.34 mg/dm3), as well as much lower in Rzeszów Reservoir (0.87–2.56 mg/dm3). In the first two reservoirs, the concentration of SO42− was lower at greater depth.
Concentrations of Cl−, Na+ and K+ ions were found to be present at similar levels in the Maziarnia and Rzeszów Reservoirs, respectively, varying across the ranges 16.12–19.81 mg/dm3, 13.36–17.12 mg/dm3 and 4.19–8.64 mg/dm3. Only much lower values were reported from Nielisz Reservoir, in the ranges 3.20–6.37 mg/dm3, 4.99–6.21 and 1.35–5.24 mg/dm3, respectively.
The highest concentrations of Mg2+and Ca2+ ions characterised Rzeszów Reservoir (18.92–22.67 and 97.06–124.42 mg/dm3), with figures slightly lower in Nielisz Reservoir (at 9.00–12.37 and 64.79–119.34 mg/dm3), as well as being much lower in Maziarnia Reservoir (4.98–9.88 and 50.72–78.81 mg/dm3). Concentrations of these ions showed statistically significant positive correlations with each other (r = 0.8704, p < 0.01) as well as with concentrations of IC (r = 0.8136, r = 0.8953, p < 0.01). Moreover, the concentration of Mg2+ correlated significantly with that of SO42- (r = −0.8839, p < 0.01).
All reservoirs had pore-water concentrations of Fe3+ that decreased with depth. The highest values were found for Nielisz Reservoir (741.85–845.55 μmol/dm3), although figures for Maziarnia (401.51–896.33 μmol/dm3) were similar, while those for Rzeszów Reservoir were far lower (39.45–279.75 μmol/dm3). Trends were the opposite for Fe2+ concentrations, which were greater at greater depth. However, no significant differences between the reservoirs were observed. It was also possible to note a statistically significant correlation between the concentrations of Fe3+ and SO42- (r = 0.9349, p < 0.001).
In the case of TOCW concentrations, it proved impossible to note significant differences between the reservoirs, with no clear relationships of any kind found. In Maziarnia and Rzeszów Reservoirs, TOCW concentrations were greater further down into the sediment, differing across respective ranges of 20.06–44.34 and 19.88–36.56 mg/dm3. In Maziarnia Reservoir, a high of 52.74 mg/dm3 was noted for pore water of the surface sediment layer even as a low figure of 20.64 mg/dm3 characterised the 5–10 cm layer.
3.3. Rate of AOM
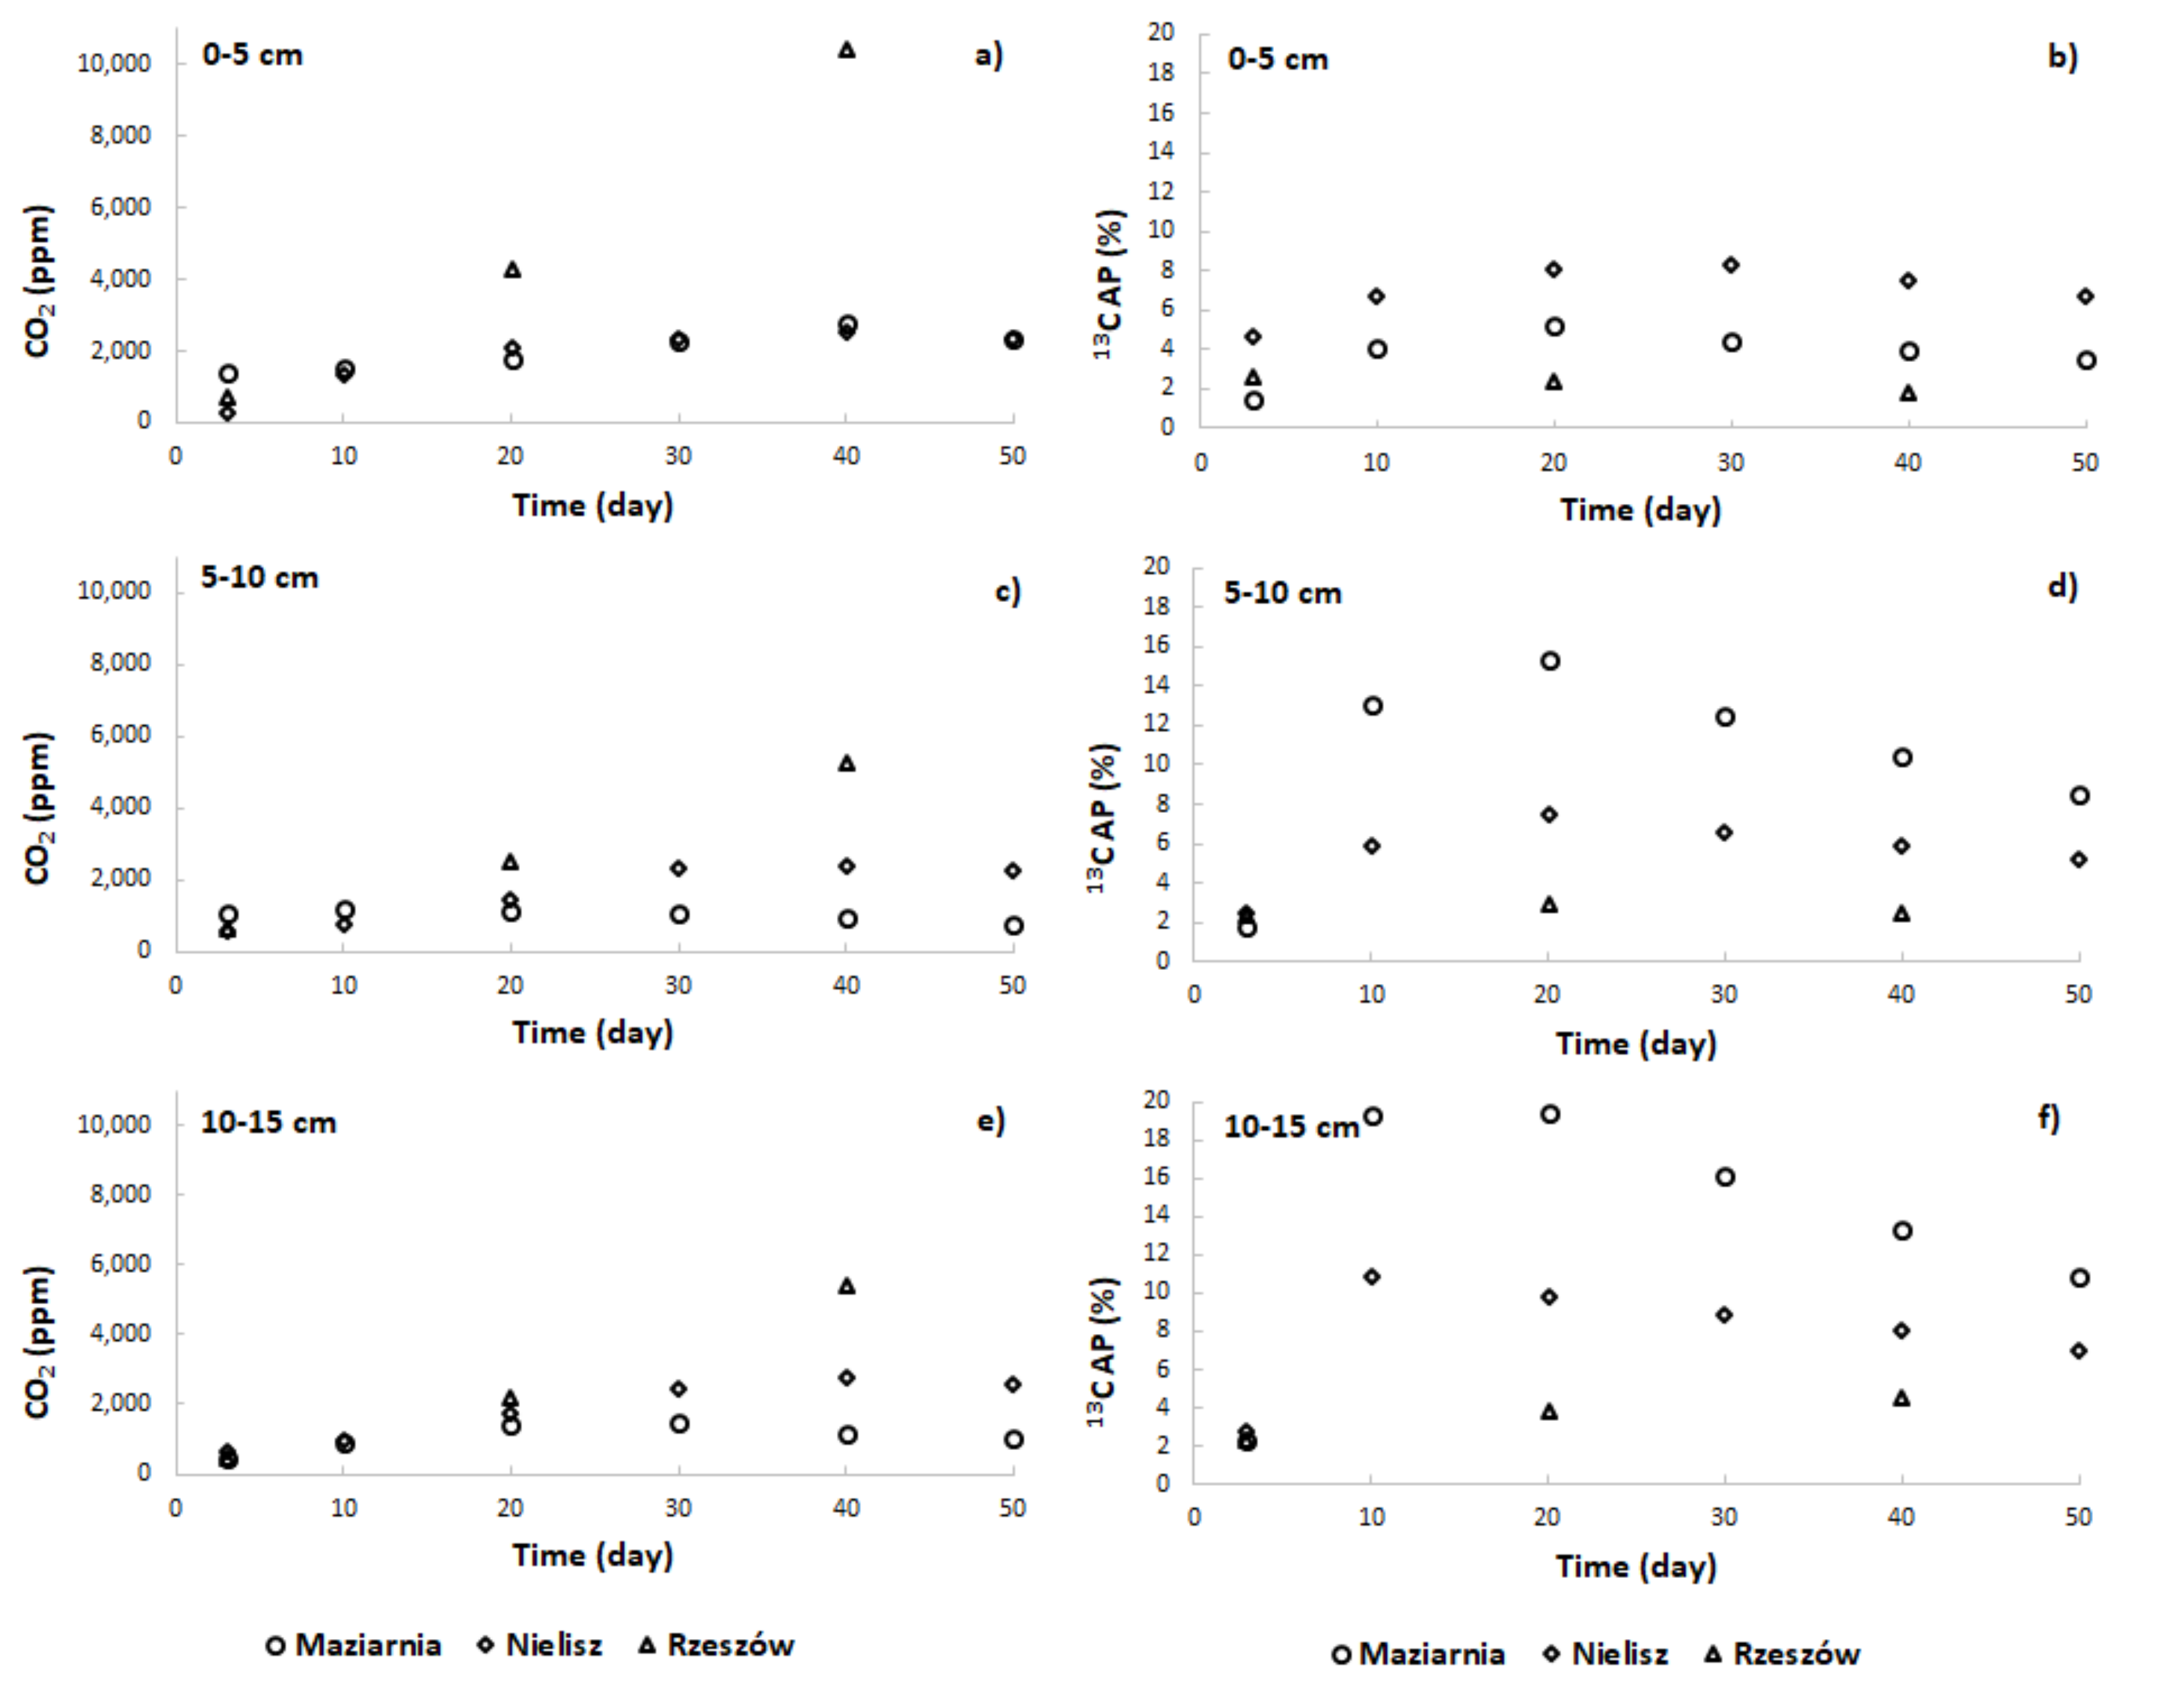
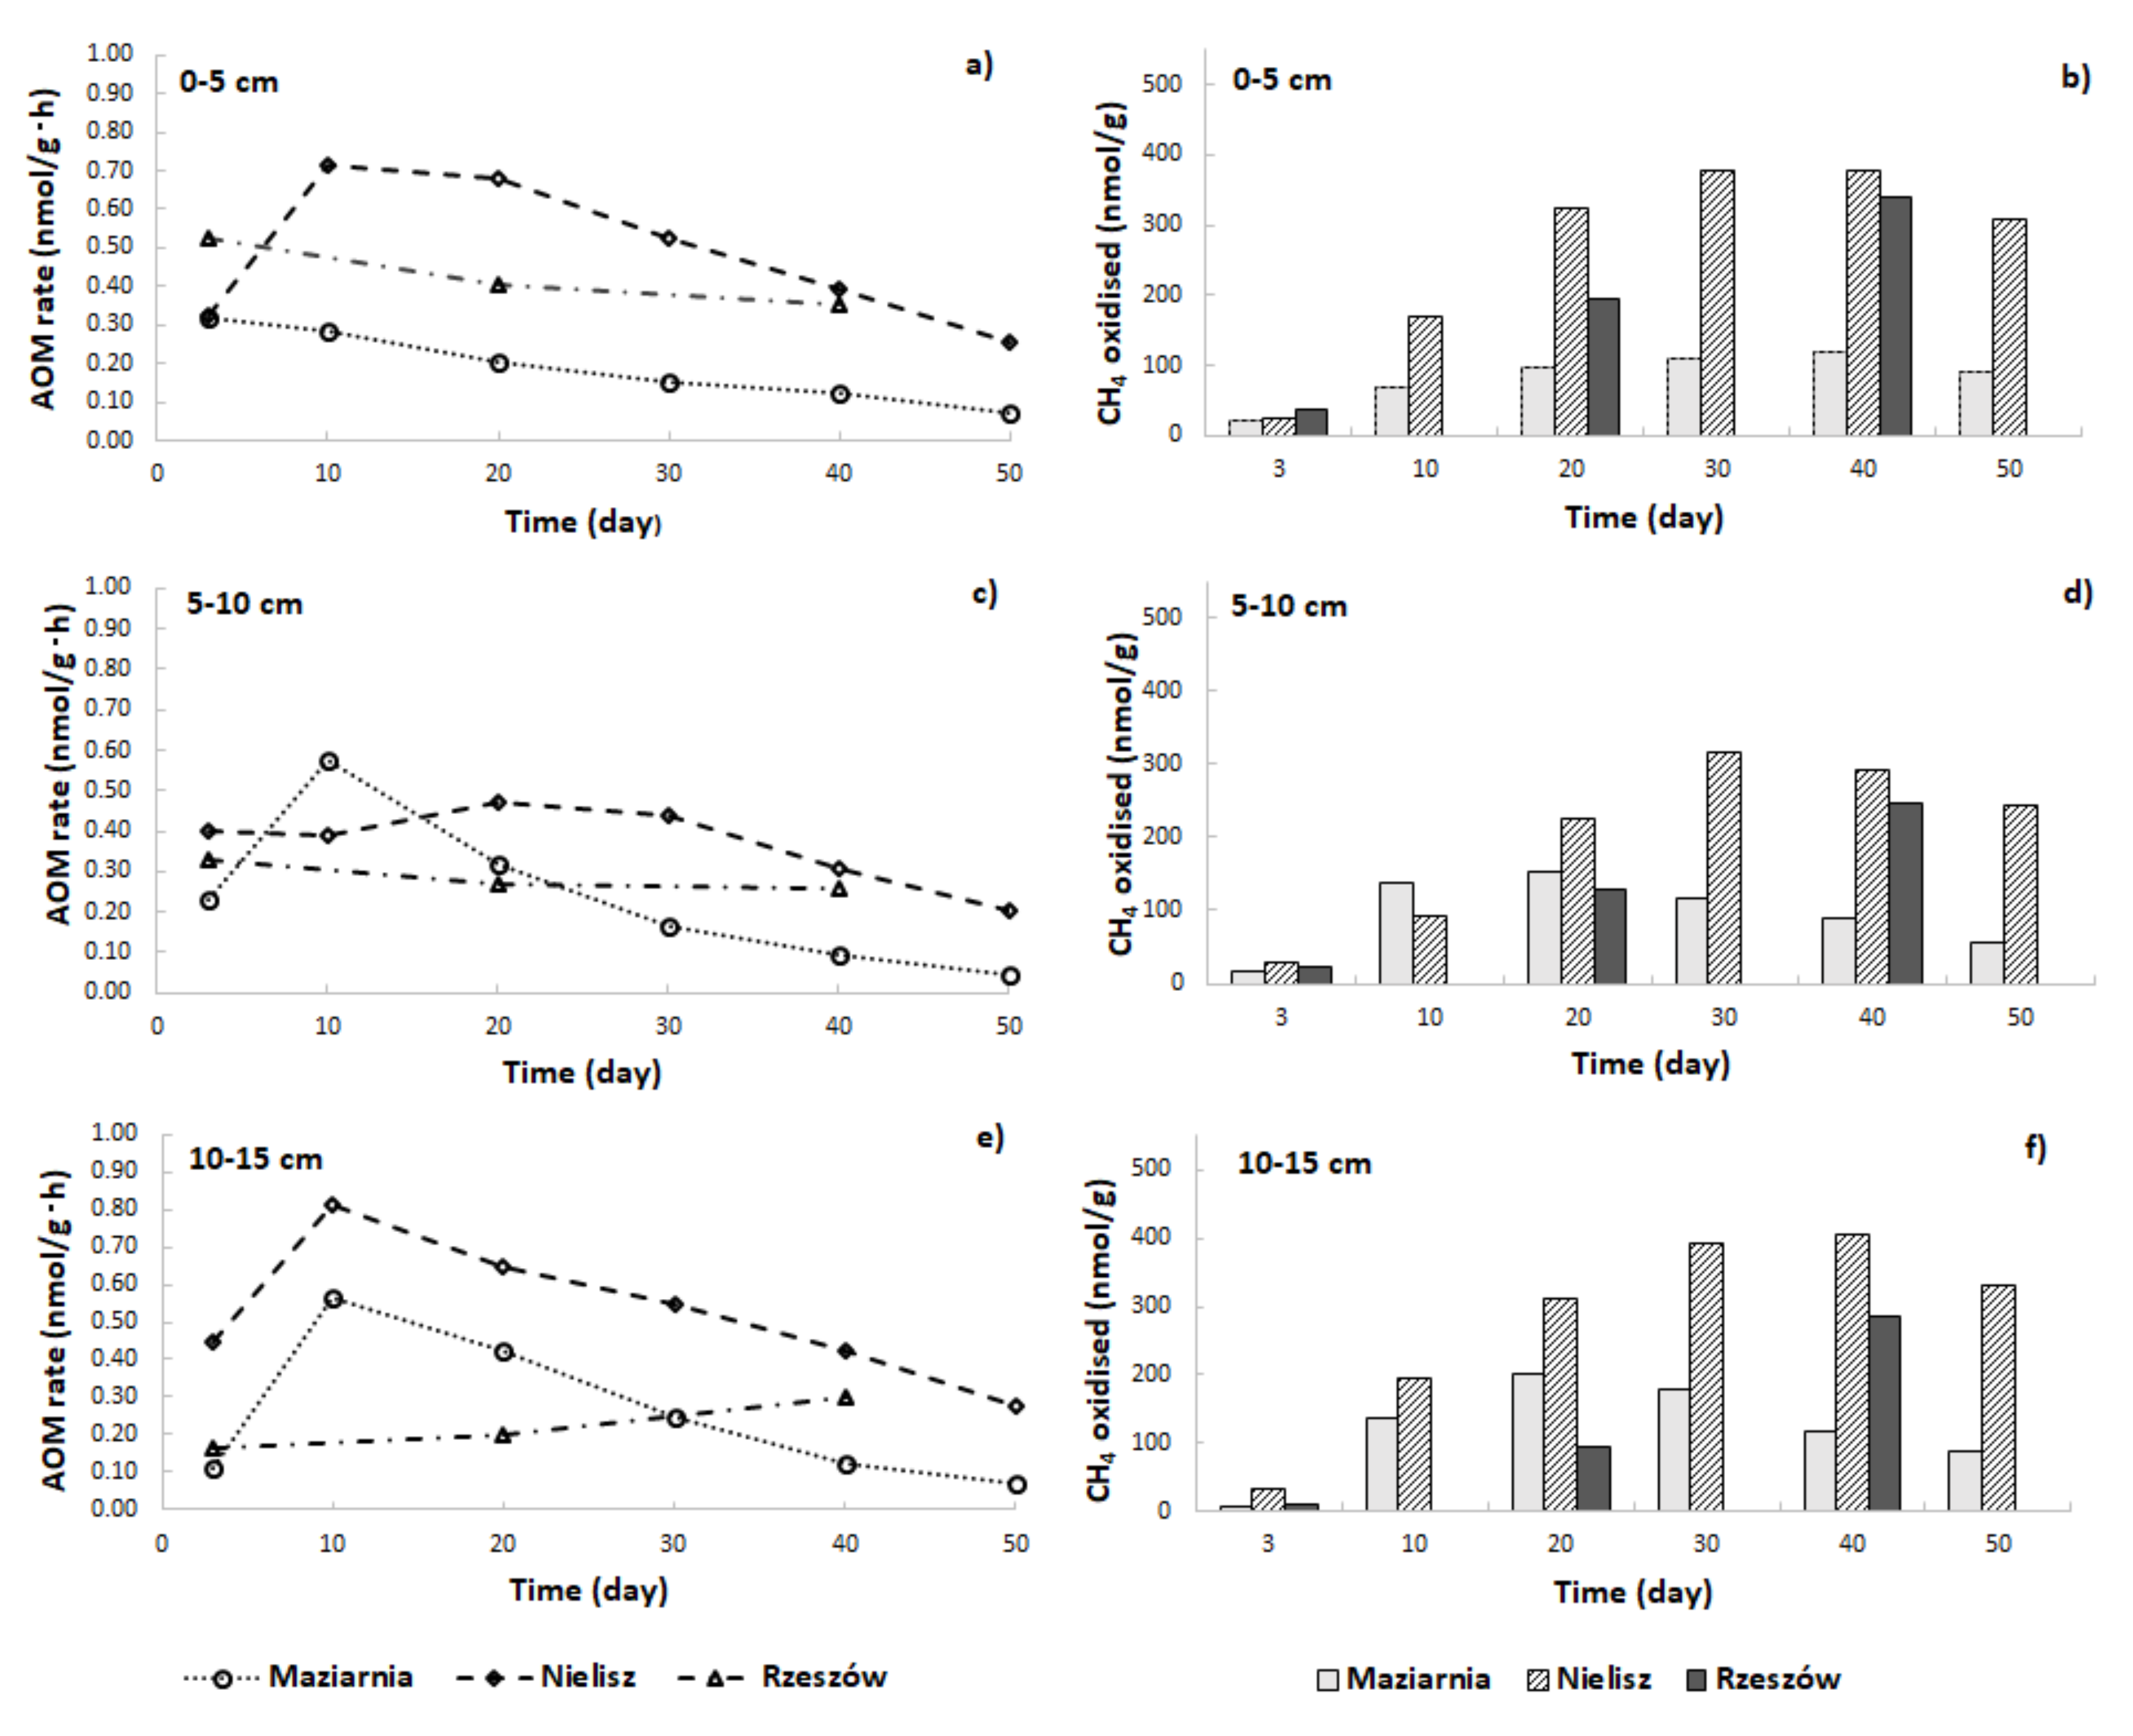
The addition of the 13CH4 isotope tracer to the incubations resulted in an increase in CO2 concentrations and in values for 13C AP in the headspace (Figure 2)—a circumstance taken to confirm the presence of the AOM process in sediments investigated. In comparison, in incubations without the isotopic tracer, 13C AP values varied slightly over time from a value of about 1.05 to a maximum of 1.46. However, the reservoirs differed in the intensity of the process (Figure 3a,c,e). In almost all cases, it was the Nielisz sediments that had the highest CH4 oxidation rates (in the 0.20–0.81 nmol/g·h range), with similar rates in the 0–5 cm and 10–15 cm layers, as well as slightly lower ones in the 5–10 cm layer. In the other two reservoirs, AOM rates were lower than at the Nielisz site. In the surface 0–5 cm layer of sediments from Rzeszów Reservoir, AOM rates were about twice as high as in Maziarnia Reservoir, with ranges of 0.35–0.53 and 0.12–0.28 nmol/g·h, respectively. In the deeper (5–10 and 10–15 cm) layers, there was no clearly higher AOM rate in one reservoir or another. In addition, it was typical for the maximum AOM rate to be noted 3 or 10 days into the incubation process.
The amounts of CH4 oxidised during the incubation are as shown in Figure 3b,d,f. In Nielisz Reservoir (where AOM was most intensive), the maximum amount of CH4 oxidised characterised day 30 in the 0–5 cm and 5–10 cm layers, or day 40 in the 10–15 cm layer. In Maziarnia Reservoir, a maximum on day 40 was only recorded for the surface sediment layer, with deeper layers reporting their maximum as early as on day 20. In Rzeszów Reservoir, the amount of CH4 oxidised continued to increase through to day 40 in all sediment layers, it not therefore being known if maxima had been reached or if further increases might have been noted.
With a view to factors controlling the studied process in reservoir sediments being determined, further analysis considered relationships between the AOM rates obtained and certain parameters characterising both pore water and sediments. Pearson correlation coefficients (r) for rates of AOM on days 3, 20 and 40 are presented in Table 4 and Table 5.
4. Discussion
The experiments run with 13CH4 tracer evidenced that a process of the anaerobic oxidation of methane that takes place in reservoir sediments and may therefore represent an important sink for CH4 (even) in the ecosystems of inland waters. Rates for AOM obtained for the sediments in reservoirs located in SE Poland are of 0.05 to 0.81 nmol/g·h (Figure 3a,c,e). While these are different values from those reported in other aquatic ecosystems, they do fall within the overall reported range. Thus, AOM rates for the sediments of certain wetlands and swamps in the USA ranged from 0.00047 to 0.00254 nmol/g·h [29], while—in the more familiar circumstances of marine environments, obtained AOM values have included 5 nmol/g·h reported for sediments in the North Sea, 15.63 nmol/g·h in Japan’s Nankai Trough, and 22.92 nmol/g·h in the Hydrate Ridge (USA) [46]. However, the much higher rate noted for Eckernforde Bay (Germany) was of 11,920 nmol/g·h [47,48].
In the course of the studies, it was possible to observe the formation of 13CO2, with the AOM process proving most intense 3 or 10 days into the process of incubation, after which a decrease in the rate of oxidation of CH4 could be observed. Decreasing AOM rates during incubation have also been reported by other researchers [31,49,50]. A decrease in 13C AP values was primarily after day 20 (Figure 2b,d,f), with the CO2 concentration usually still increasing to day 40 (Figure 2a,c,e). Maxima for amounts of CH4 oxidised characterised days 20, 30 or 40, depending on the reservoir and sediment layer involved, with a decrease then ensuing (Figure 3b,d,f). This certainly reflected a gradual depletion of electron acceptors and an increase in the endogenous activity of microorganisms responsible for methanogenesis going hand in hand with a decline in concentrations of 13CO2 [50,51].
In regard to the vertical distribution of AOM rates in sediments, it was only those in Rzeszów Reservoir that showed a markedly reduced intensity of the process at greater depths. Similar trends have been noted by other researchers [52,53,54], which was attributed to a greater availability of electron acceptors close to the sediment–water interface [53,55]. Given that Maziarnia and Nielisz Reservoirs failed to report any such clear decrease in AOM in deeper sediment layers, it needs to be assumed that the availability of electron acceptors is not the only controlling factor but also certain properties of both sediments and their pore waters.
Indeed, the process of AOM in the bottom sediments of aquatic ecosystems can be seen to depend on many factors, with their impact proving very hard to determine given the complexity of processes. Temperature, which was not addressed in this study at all, is believed to be a key factor, with the literature often invoking its positive impact [50,52,56,57,58]. Some papers confirm the sensitivity of the AOM process to temperature change and imply a peak level ~25 °C [59].
A priori consideration of influences on AOM suggested the kind of positive correlation with concentrations of electron acceptors in pore water that the experiments in fact failed to detect (Table 4). While concentrations of NO3- were low in all the sediments we investigated, and while no significant differences between reservoirs in this respect were observed, concentrations of SO42− and Fe3+ were already higher and clearly differentiated. Thus, while these ions were present in rather low concentrations in the Rzeszów sediments, in those of the Maziarnia and Nielisz Reservoirs, they were higher, with SO42− present at above 60 μmol/dm3—i.e., the threshold value at which reduction in sulphates may surpass methanogenesis [60]. Despite concentrations of SO42− and Fe3+ in the Nielisz and Maziarnia Reservoirs being similar, there were significant differences in measured rates of AOM. This perforce confirmed the hypothesis advanced above that rates of AOM are controlled not solely by the availability of electron acceptors but also by other environmental factors.
One such factor may have been sediment pH, given the positive relationship with AOM rate we were able to observe (Table 5). While the microorganisms involved in AOM do have adapted to environments across a wide range of pH, optimal conditions for them are nevertheless associated with just pH 7.7–7.9. In turn, in extremely acidic conditions (pH < 2) or those featuring extremely alkaline pHs (∼12), the oxidation of CH4 is—unsurprisingly—inhibited, inter alia because the growth of the Archaea involved is arrested [61,62]. While the sediments under study displayed far more moderate pHs, the observed range of 6.39–8.03 mostly denoted circumstances outside the aforementioned optima (Table 2). Furthermore, differences in pH may affect not only the microorganisms responsible for AOM but also other circumstances relevant to the process. For example, lower pH values favour the solubility of iron (III) hydroxide and increase the bioavailability of Fe3+, thereby accelerating AOM [62].
Another factor of undoubted influence on AOM relates to amounts and types of organic matter. We obtained statistically significant positive correlations between OM and TOCS on the one hand and rate of AOM rate on the other (Table 5). It is presumed that sediments richer in OM will stimulate AOM, e.g., by organic electron acceptors such as humic substances which are used by microorganisms in their anaerobic respiration [23]. Such a hypothesis may gain confirmation through our statistically significant positive relationships found between rate of AOM and HS content (Table 5) as well as the observation that the highest AOM rate coincided with Nielisz Reservoir sediments richest in HS (Table 2). Moreover, strong statistically significant correlations were found between contents of OM and TOCS (r = 0.9898, p < 0.001) and OM and HS (r = 0.9908, p < 0.001). Positive correlations between rates of AOM and contents of OM and HS have also been observed in other studies [49,63]. Thus, the labile part of OM present in freshwater sediments can promote methanogenesis [64], while a slowly decomposing humic part can prevent CH4 emission by acting as the final electron acceptor driving AOM [20].
The highest level of statistical significance characterised positive correlations between AOM rate and the content of the pristane and archaeol lipid biomarkers characteristic for Archaea (Table 5). Archaeol and pristane are both ether lipids, whose presence denotes Archaea of the ANME-1 group. These are common in sediments given a higher degree of adaptability in environments that can be regarded as unfavourable (in terms of temperature or pH) than is the case for ANME-2 and ANME-3 [65,66]. As Archaea from this group are responsible for an AOM process combining with sulphate reduction (AOM-SR), the correlations obtained may point to this mechanism of CH4 oxidation being the main one ongoing in the sediments under study. This hypothesis would be confirmed by positive correlations between AOM rate and the concentration of SO42− in pore water—of the kind not in fact observable in our work (Table 4). However, measured AOM rates might not solely reflect AOM-SR, given the way that other studies point to complex relationships between metals and sulphates or humic substances in sediments, and hence to the co-occurrence of CH4 oxidation via a variety of mechanisms [20,55,57,62,67,68,69].
Analysis of obtained results also showed statistically significant negative correlations between the concentrations of Cl−, Na+, K+ in the pore water and the AOM rates, suggesting that salinity may impact upon the AOM process in a negative way (Table 4). An inverse relationship between concentrations of Cl− and rates of AOM has in fact been confirmed by other studies [70,71,72]. High concentrations of Cl- have been linked with reduced biodiversity of both bacteria and Archaea [73].
5. Conclusions
The results presented show how the process of AOM can represent a sink for CH4 in freshwater sediments. Rates of AOM were found to differ both from one studied reservoir to another and with different layers of sediment. It was observed that the AOM process was seen to have achieved peak intensity after 3 or 10 days into incubation, which is followed by a slowdown, most likely as available electron acceptors become depleted. After day 20 of incubation, the coexisting process of methanogenesis could gain in significance.
Preliminary analysis of the environmental factors controlling AOM pointed not only to the availability of electron acceptors but also to parameters characterising both sediments and their pore water. Higher pH values of sediments could be associated with intensified AOM, presumably as conditions favourable to the development of microorganisms were present or because other processes responsible for the availability of electron acceptors were being supported. We further suggest that an increase in the salinity of pore waters may limit the AOM process, which is possibly due to a negative effect on the growth of microorganisms. Our results also suggest that the intensity of AOM in sediments is affected to a significant degree by the availability, not only of NO3−, SO42− and Fe3+, but also of other organic electron acceptors such as humic substances. However, the key controlling factor appears to be the availability of the microorganisms oxidising CH4 anaerobically.
Our analysis further suggests an overall AOM process in sediments entailing very complex mechanisms in need for further elucidation. Matters of particular importance in this regard will be the recognition of the role played by potential electron acceptors as well as species identification and the singling-out of those Archaea responsible for the anaerobic oxidation of methane in reservoir sediments (phylogenetic analysis of 16S rRNA).
Author Contributions
Conceptualization, D.S. and R.G.-R.; methodology, D.S. and R.G.-R.; formal analysis, D.S.; investigation, D.S. and R.G.-R.; resources, D.S.; data curation, D.S.; writing—original draft preparation, R.G.-R.; writing—review and editing, R.G.-R.; visualization, R.G.-R.; supervision, R.G.-R.; funding acquisition, R.G.-R. All authors have read and agreed to the published version of the manuscript.
Funding
This study was funded by the National Science Centre Poland, via Grant No. 2017/25/B/ST10/00981.
Data Availability Statement
https://doi.org/10.4121/21387753 (accessed on 1 September 2022).
Conflicts of Interest
The authors declare no conflict of interest.
References
- IPCC. Summary for Policymakers. In Climate Change 2021: The Physical Science Basis; Contribution of Working Group I to the Sixth Assessment Report of the Intergovernmental Panel on Climate Change; Masson-Delmotte, V., Zhai, P., Pirani, A., Connors, S.L., Péan, C., Berger, S., Caud, N., Chen, Y., Goldfarb, L., Gomis, M.I., et al., Eds.; Cambridge University Press: Cambridge, UK; New York, NY, USA, 2021; pp. 3–32. [Google Scholar]
- Downing, J.A.; Prairie, Y.T.; Cole, J.J.; Duarte, C.M.; Tranvik, L.J.; Striegl, R.G.; McDowell, W.H.; Kortelainen, P.; Caraco, N.F.; Melack, J.M.; et al. The global abundance and size distribution of lakes, ponds, and impoundments. Limnol. Oceanogr. 2006, 51, 2388–2397. [Google Scholar] [CrossRef] [Green Version]
- Bastviken, D.; Tranvik, L.J.; Downing, J.A.; Crill, P.M.; Enrich-Prast, A. Freshwater methane emissions offset the continental carbon sink. Science 2011, 331, 50. [Google Scholar] [CrossRef] [PubMed] [Green Version]
- Deemer, B.R.; Harrison, J.A.; Li, S.; Beaulieu, J.J.; DelSontro, T.; Barros, N.; Bezerra-Neto, J.F.; Powers, S.M.; Dos Santos, M.A.; Vonk, J.A. Greenhouse gas emissions from reservoir water surfaces: A new global synthesis. BioScience 2016, 66, 949–964. [Google Scholar] [CrossRef] [Green Version]
- DelSontro, T.; Beaulieu, J.J.; Downing, J.A. Greenhouse gas emissions from lakes and impoundments: Upscaling in the face of global change. Limnol. Oceanogr. Lett. 2018, 3, 64–75. [Google Scholar] [CrossRef]
- Gruca-Rokosz, R. Quantitative fluxes of the greenhouse gases CH4 and CO2 from the surfaces of selected Polish reservoirs. Atmosphere 2020, 11, 286. [Google Scholar] [CrossRef] [Green Version]
- Soued, C.; Prairie, Y.T. Changing sources and processes sustaining surface CO2 and CH4 fluxes along a tropical river to reservoir system. Biogeosciences 2021, 18, 1333–1350. [Google Scholar] [CrossRef]
- DelSontro, T.; Kunz, M.J.; Kempter, T.; Wuest, A.; Wehrli, B.; Senn, D.B. Spatial heterogeneity of methane ebullition in a large tropical reservoir. Environ. Sci. Technol. 2011, 45, 9866–9873. [Google Scholar] [CrossRef] [PubMed]
- Sobek, S.; DelSontro, T.; Wongfun, N.; Wehrli, B. Extreme organic carbon burial fuels intense methane bubbling in a temperate reservoir. Geophys. Res. Lett. 2012, 39, L01401. [Google Scholar] [CrossRef] [Green Version]
- Maeck, A.; DelSontro, T.; McGinnis, D.F.; Fischer, H.; Flury, S.; Schmidt, M.; Fietzek, P.; Lorke, A. Sediment trapping by dams creates methane emission hot spots. Environ. Sci. Technol. 2013, 47, 8130–8137. [Google Scholar] [CrossRef]
- Beaulieu, J.J.; Smolenski, R.L.; Nietch, C.T.; Townsend-Small, A.; Elovitz, M.S. High methane emissions from a midlatitude reservoir draining an agricultural watershed. Environ. Sci. Technol. 2014, 48, 11100–11108. [Google Scholar] [CrossRef]
- Beaulieu, J.J.; McManus, M.G.; Nietch, C.T. Estimates of reservoir methane emissions based on a spatially balanced probabilistic-survey. Limnol. Oceanogr. 2016, 61, S27–S40. [Google Scholar] [CrossRef] [Green Version]
- Berberich, M.E.; Beaulieu, J.J.; Hamilton, T.L.; Waldo, S.; Buffam, I. Spatial variability of sediment methane production and methanogen communities within a eutrophic reservoir: Importance of organic matter source and quantity. Limnol. Oceanogr. 2019, 9999, 1–23. [Google Scholar] [CrossRef] [PubMed] [Green Version]
- Bai, X.; Xu, Q.; Li, H.; Cheng, C.; He, Q. Lack of methane hotspot in the upstream dam: Case study in a tributary of the Three Gorges Reservoir, China. Sci. Total. Environ. 2021, 754, 142–151. [Google Scholar] [CrossRef] [PubMed]
- Gruca-Rokosz, R.; Cieśla, M. Sediment methane production within eutrophic reservoirs: The importance of sedimenting organic matter. Sci. Total. Environ. 2021, 799, 149219. [Google Scholar] [CrossRef] [PubMed]
- Raghoebarsing, A.A.; Pol, A.; van de Pas-Schoonen, K.T.; Smolders, A.J.; Ettwig, K.F.; Rijpstra, W.I.; Schouten, S.; Damsté, J.S.; Op den Camp, H.J.; Jetten, M.S.; et al. A microbial consortium couples anaerobic methane oxidation to denitrification. Nature 2006, 440, 918–921. [Google Scholar] [CrossRef] [PubMed] [Green Version]
- Ettwig, K.F.; Shima, S.; de van Pas-Schoonen, K.T.; Kahnt, J.; Medema, M.H.; Op den Camp, H.J.; Jetten, M.S.; Strous, M. Denitrifying bacteria anaerobically oxidize methane in the absence of archaea. Environ. Microbiol. 2008, 10, 3164–3173. [Google Scholar] [CrossRef] [PubMed]
- Beal, E.J.; House, C.H.; Orphan, V.J. Manganese-and iron-dependent marine methane oxidation. Science 2009, 3255937, 184–187. [Google Scholar] [CrossRef] [Green Version]
- Valenzuela, E.I.; Avendaño, K.A.; Balagurusamy, N.; Arriaga, S.; Nieto-Delgado, C.; Thalasso, F.; Cervantes, F.J. Electron shuttling mediated by humic substances fuels anaerobic methane oxidation and carbon burial in wetland sediments. Sci. Total. Environ. 2019, 650, 2674–2684. [Google Scholar] [CrossRef]
- Valenzuela, E.I.; Prieto-Davó, A.; López Lozano, N.E.; Hernández-Eligio, A.; Vega-Alvarado, L.; Juárez, K.; García-González, A.S.; López, M.G.; Cervantes, F.J. Anaerobic methane oxidation driven by microbial reduction of natural organic matter in a tropical wetland. Appl. Environ. Microbiol. 2017, 83, e00645-17. [Google Scholar] [CrossRef] [Green Version]
- Ettwig, K.F.; Butler, M.K.; Le Paslier, D.; Pelletier, E.; Mangenot, S.; Kuypers, M.M.; Schreiber, F.; Dutilh, B.E.; Zedelius, J.; de Beer, D.; et al. Nitrite-driven anaerobic methane oxidation by oxygenic bacteria. Nature 2010, 4647288, 543–548. [Google Scholar] [CrossRef]
- Timmers, P.H.; Welte, C.U.; Koehorst, J.J.; Plugge, C.M.; Jetten, M.S.; Stams, A.J. Reverse methanogenesis and respiration in methanotrophic archaea. Archaea 2017, 2017, 1654237. [Google Scholar] [CrossRef] [Green Version]
- Cai, C.; Leu, A.O.; Xie, G.; Guo, J.; Feng, Y.; Zhao, J.; Tyson, G.W.; Yuan, Z.; Hu, S. A methanotrophic archaeon couples anaerobic oxidation of methane to Fe(III) reduction. ISME J. 2018, 12, 1929–1939. [Google Scholar] [CrossRef]
- Bai, Y.; Wang, X.; Wu, J.; Lu, Y.; Fu, L.; Zhang, F.; Lau, T.; Zeng, R.J. Humic substances as electron acceptors for anaerobic oxidation of methane driven by ANME-2d. Water Res. 2019, 164, 114935. [Google Scholar] [CrossRef] [PubMed]
- Brocks, J.J.; Summons, R.E. Sedimentary Hydrocarbons, Biomarkers for Early Life. In Treatise on Geochemistry, 2nd ed.; Holland, H.D., Turekian, K.K., Eds.; Elsevier: Amsterdam, The Netherlands, 2003; Volume 8, pp. 63–115. [Google Scholar]
- Blumenberg, M.; Seifert, R.; Reitner, J.; Pape, T.; Michaelis, W. Membrane lipid patterns typify distinct anaerobic methanotrophic consortia. Proc. Natl. Acad. Sci. USA 2004, 101, 11111–11116. [Google Scholar] [CrossRef] [PubMed] [Green Version]
- Stadnitskaia, A.; Muyzer, G.; Abbas, B.; Coolen, M.J.L.; Hopmans, E.C.; Baas, M.; Van Weering, T.C.E.; Ivanov, M.K.; Poludetkina, E.; Damste, J.S.S. Biomarker and 16S rDNA evidence for anaerobic oxidation of methane and related carbonate precipitation in deep-sea mud volcanoes of the Sorokin Trough, Black Sea. Mar. Geol. 2015, 217, 67–96. [Google Scholar] [CrossRef] [Green Version]
- Ogihara, S. Acyclic hydrocarbons and ketones in cold-seep carbonates from central Hokkaido, northern Japan. Geochem. J. 2010, 42, 421–427. [Google Scholar] [CrossRef] [Green Version]
- Gupta, V. Anaerobic Oxidation of Methane in Northern Peatland. Master Thesis, Department of Geography, University of Toronto, Toronto, ON, Canada, 2011; pp. 1–103. [Google Scholar]
- Hu, B.L.; Shen, L.D.; Lian, X.; Zhu, Q.; Liu, S.; Huang, Q.; He, Z.F.; Geng, S.; Cheng, D.Q.; Lou, L.P.; et al. Evidence for nitrite-dependent anaerobic methane oxidation as a previously overlooked microbial methane sink in wetlands. Proc. Natl. Acad. Sci. USA 2014, 111, 4495–4500. [Google Scholar] [CrossRef] [Green Version]
- Shi, Y.; Wang, Z.; He, C.; Zhang, X.; Sheng, L.; Ren, X. Using 13C isotopes to explore denitrification-dependent anaerobic methane oxidation in a paddy-peatland. Sci. Rep. 2017, 7, 40848. [Google Scholar] [CrossRef] [Green Version]
- Shen, L.; Ouyang, L.; Zhu, Y.; Trimmer, M. Active pathways of anaerobic methane oxidation across contrasting riverbeds. ISME J. 2019, 13, 752–766. [Google Scholar] [CrossRef] [Green Version]
- Fan, L.; Dippold, M.A.; Ge, T.; Wu, J.; Thiel, V.; Kuzyakov, Y.; Dorodnikow, M. Anaerobic oxidation of methane in paddy soil: Role of electron acceptors and fertilization in mitigating CH4 fluxes. Soil Biol. Biochem. 2020, 141, 107685. [Google Scholar] [CrossRef]
- Gruca-Rokosz, R. Dynamika Węglowych Gazów Cieplarnianych w Zbiornikach Zaporowych—Mechanizmy Produkcji, Emisja do Atmosfery; Oficyna Wydawnicza Politechniki Rzeszowskiej: Rzeszów, Poland, 2015; pp. 1–132. [Google Scholar]
- Gruca-Rokosz, R.; Tomaszek, J. Methane and carbon dioxide in the sediment of a eutrophic reservoir: Production pathways and diffusion fluxes at the sediment-water interface. Water Air Soil Pollut. 2015, 226, 1–16. [Google Scholar] [CrossRef] [PubMed] [Green Version]
- Gruca-Rokosz, R.; Koszelnik, P. Production pathways for CH4 and CO2 in sediments of two freshwater ecosystems in south-eastern Poland. PLoS ONE 2018, 13, e0199755. [Google Scholar] [CrossRef] [PubMed] [Green Version]
- Bottom sediment sampler. Patent no.239528, 2021.
- Reeburgh, W.S. An improved interstitial water sampler. Limnol. Oceanogr. 1967, 12, 163–165. [Google Scholar] [CrossRef] [Green Version]
- Zimmermann, C.F.; Keefe, C.W.; Bashe, J. Determination of Carbon and Nitrogen in Sediments and Particulates/Coastal Waters Using Elemental Analysis; Method 440.0; NER Laboratory, USEPA: Cincinnati, OH, USA, 1997. [Google Scholar]
- Griffith, S.M.; Schnitzer, M. Analytical characteristics of humic and fulvic acids extracted from tropical volcanic soils. Soil Sei. Soc. Am. Proc. 1975, 39, 861–867. [Google Scholar] [CrossRef]
- Hinrichs, K.-U.; Pancost, R.D.; Summons, R.E.; Sprott, G.D.; Sylva, S.P.; Sinninghe Damste, J.S.; Hayes, J.M. Mass spectra ofsn-2-hydroxyarchaeol, a polar lipid biomarker for anaerobic methanotrophy. Geochem. Geophys. Geosyst. 2000, 1, 2000GC000042. [Google Scholar] [CrossRef]
- Elvert, M.; Hopmans, E.C.; Treude, T.; Boetius, A.; Suess, E. Spatial variations of methanotrophic consortia at cold methane seeps: Implications from a high-resolution molecular and isotopic approach. Geobiology 2005, 3, 195–209. [Google Scholar] [CrossRef]
- Niemann, H.; Elvert, M.; Hovland, M.; Orcutt, B.; Judd, A.; Suck, I.; Gutt, J.; Joye, S.; Damm, E.; Finster, K.; et al. Methane emission and consumption at a North Sea gas seep (Tommeliten area). Biogeosciences 2005, 2, 335–351. [Google Scholar] [CrossRef] [Green Version]
- Niemann, H.; Elvert, M. Diagnostic lipid biomarker and stable carbon isotope signatures of microbial communities mediating the anaerobic oxidation of methane with sulphate. Org. Geochem. 2008, 39, 1668–1677. [Google Scholar] [CrossRef]
- Viollier, E.; Inglett, P.W.; Hunter, K.; Roychoudhury, A.N.; Van Cappellen, P. The ferrozine method revisited: Fe(II)/Fe(III) determination in natural waters. Appl. Geochem. 2000, 15, 785–790. [Google Scholar] [CrossRef]
- Aoki, M.; Ehara, M.; Saito, Y.; Yoshioka, H.; Miyazaki, M.; Saito, Y.; Miyashita, A.; Kawakami, S.; Yamaguchi, T.; Ohashi, A.; et al. A long-term cultivation of an anaerobic methane-oxidizing microbial community from deep-sea methane-seep sediment using a continuous-flow bioreactor. PLoS ONE 2014, 9, e105356. [Google Scholar] [CrossRef]
- Meulepas, R.J.W.; Jagersma, C.G.; Gieteling, J.; Buisman, C.J.N.; Stams, A.J.M.; Lens, P.N.L. Enrichment of anaerobic methanotrophs in a sulfate-reducing membrane bioreactors. Biotechnol. Bioeng. 2009, 104, 458–470. [Google Scholar] [CrossRef] [PubMed]
- Jagersma, G.C.; Meulepas, R.J.W.; Jong, I.H.; Gieteling, J.; Klimiuk, A.; Schouten, S.; Damsté, J.S.S.; Lens, P.N.L.; Stams, A.J.M. Microbial diversity and community structure of a highly active anaerobic methane-oxidizing sulfate-reducing enrichment. Environ. Microbiol. 2009, 12, 3223–3232. [Google Scholar] [CrossRef] [PubMed]
- Gupta, V.; Smemo, K.A.; Yavitt, J.; Fowle, D.A.; Branfireun, B.A.; Basiliko, N. Stable isotopes reveal widespread anaerobic methane oxidation across latitude and peatland type. Environ. Sci. Technol. 2013, 47, 8273–8279. [Google Scholar] [CrossRef] [PubMed]
- Szal, D.; Gruca-Rokosz, R. Anaerobic oxidation of methane in freshwater sediments of Rzeszów Reservoir. Water 2020, 12, 398. [Google Scholar] [CrossRef] [Green Version]
- Li, L.; Xue, S.; Xi, J. Anaerobic oxidation of methane coupled to sulfate reduction: Consortium characteristics and application in co-removal of H2S and methane. J. Environ. Sci. 2019, 76, 238–248. [Google Scholar] [CrossRef]
- Cassarini, C. Anaerobic Oxidation of Methane Coupled to Reduction of Different Sulfur Compounds as Electron Acceptors in Bioreactors; CRC Press: Boca Raton, FL, USA, 2017. [Google Scholar]
- Schubert, C.J.; Vazquez, F.; Lösekann-Behrens, T.; Knittel, K.; Tonolla, M.; Boetius, A. Evidence for anaerobic oxidation of methane in sediments of a freshwater system (Lago di Cadagno). FEMS Microbiol. Ecol. 2011, 76, 26–38. [Google Scholar] [CrossRef] [Green Version]
- Winkel, M.; Sepulveda-Jauregui, A.; Martinez-Cruz, K.; Heslop, J.K.; Rijkers, R.; Horn, F. First evidence for cold-adapted anaerobic oxidation of methane in deep sediments of thermokarst lakes. Environ. Res. Commun. 2019, 1, 021002. [Google Scholar] [CrossRef]
- Smemo, K.; Yavitt, J.B. Evidence for anaerobic CH4 oxidation in freshwater peatlands. Geomicrobiology 2007, 24, 583–597. [Google Scholar] [CrossRef]
- Blazewicz, S.; Petersen, D.; Waldrop, M.; Firestone, M. Anaerobic oxidation of methane in tropical and boreal soils: Ecological significance in terrestrial methane cycling. J. Geophys. Res. 2012, 117, G02033. [Google Scholar] [CrossRef]
- Nordi, K.; Thamdrup, B.; Schubert, C. Anaerobic oxidation of methane in an iron-rich Danish freshwater lake sediment. Limnol. Oceanogr. 2013, 58, 546–554. [Google Scholar] [CrossRef]
- Saarela, T.; Rissanen, A.; Ojala, A.; Pumpanen, J.; Aalto, S.; Tiirola, M.; Vesala, T.; Jantti, H. CH4 oxidation in a boreal lake during the development of hypolimnetic hypoxia. Aquat. Sci. 2020, 82, 19. [Google Scholar] [CrossRef] [PubMed] [Green Version]
- Smemo, K.A. Methane Cycling in Northern Peatland Ecosystems. A Potential Role for Anaerobic Methane Oxidation. PhD. Thesis, Cornell University, Ithaca, NY, USA, 2003; pp. 1–138. [Google Scholar]
- Lovley, D.R.; Klug, M.J. Sulfate reducers can outcompete methanogens at freshwater sulfate concentrations. Appl. Environ. Microbiol. 1983, 45, 187–192. [Google Scholar] [CrossRef] [PubMed] [Green Version]
- Mueller, T.J.; Grisewood, M.J.; Nazem-Bokaee, H.; Gopalakrishnan, S.; Ferry, J.G.; Wood, T.K.; Maranas, C.D. Methane oxidation by anaerobic archaea for conversion to liquid fuels. J. Ind. Microbiol. Biotechnol. 2015, 42, 391–401. [Google Scholar] [CrossRef] [PubMed]
- He, Z.; Zhang, Q.; Feng, Y.; Luo, H.; Pan, X.; Michael, G. Microbiological and environmental significance of metal-dependent anaerobic oxidation of methane. Sci. Total. Environ. 2018, 610, 759–768. [Google Scholar] [CrossRef]
- Blodau, C.; Deppe, M. Humic acid addition lowers methane release in peats of the Mer Bleue bog, Canada. Soil Biol. Biochem. 2012, 52, 96–98. [Google Scholar] [CrossRef]
- Gruca-Rokosz, R.; Szal, D.; Bartoszek, L.; Pękala, A. Isotopic evidence for vertical diversification of methane production pathways in freshwater sediments of Nielisz reservoir (Poland). Catena 2020, 195, 104803. [Google Scholar] [CrossRef]
- Pancost, R.D.; McClymont, E.L.; Bingham, E.M.; Roberts, Z.; Charman, D.; Hornibrook, E.R.C.; Blundell, A.; Chambers, F.M.; Lim, K.L.H.; Evershed, R.P. Archaeol as a methanogen biomarker in ombrotrophic bogs. Org. Geochem. 2011, 42, 1279–1287. [Google Scholar] [CrossRef]
- Pancost, R.D.; Zhang, C.L.; Tavacoli, J.; Talbot, H.M.; Farrimond, P.; Schouten, S.; Damste, J.S.S.; Sassen, R. Lipid biomarkers perserved in hydrate-associated authigenic carbonate rocks of the Gulf of Mexico. Palaeogeogr. Palaeoclimatol. Palaeoecol. 2005, 227, 48–66. [Google Scholar] [CrossRef] [Green Version]
- Egger, M.; Rasigraf, O.; Sapart, C.J.; Jilbert, T.; Jetten, M.S.M.; Röckmann, T.; Van Der Veen, C.; Bânda, N.; Kartal, B.; Ettwig, K.F. Iron-mediated anaerobic oxidation of methane in brackish coastal sediments. Environ. Sci. Technol. 2015, 49, 277–283. [Google Scholar] [CrossRef] [Green Version]
- Sivan, O.; Adler, M.; Pearson, A.; Gelman, F.; Bar-Or, I.; John, S.C.; Eckert, W. Geochemical evidence for iron-mediated anaerobic oxidation of methane. Limnol. Oceanogr. 2011, 56, 1536–1544. [Google Scholar] [CrossRef]
- Sivan, O.; Antler, G.; Turchyn, A.V.; Marlow, J.J.; Orphan, V.J. Iron oxides stimulate sulfate-driven anaerobic methane oxidation in seeps. Proc. Natl. Acad. Sci. USA 2014, 111, E4139–E4147. [Google Scholar] [CrossRef] [PubMed] [Green Version]
- Joye, S.B.; Samarkin, V.A.; Bowles, M.W.; Carini, S.A.; Crespo-Medina, M.; Madigan, M.T. Patterns and controls on anaerobic oxidation of methane in extreme environments of varying salinity. Geochim. Cosmochim. Acta Suppl. 2009, 73, A608. [Google Scholar]
- Maignien, L.; Parkes, R.J.; Cragg, B.; Niemann, H.; Knittel, K.; Coulon, S.; Akhmetzhanov, A.; Boon, N. Anaerobic oxidation of methane in hypersaline cold seep sediments. FEMS Microbiol. Ecol. 2013, 83, 214–231. [Google Scholar] [CrossRef] [PubMed]
- Avrahamov, N.; Antler, G.; Yechieli, Y.; Gavrieli, I.; Joye, S.; Saxton, M. Anaerobic oxidation of methane by sulfate in hypersaline groundwater of the Dead Sea aquifer. Geobiology 2014, 12, 511–528. [Google Scholar] [CrossRef] [PubMed] [Green Version]
- Wang, S.; Hou, X.; Su, H. Exploration of the relationship between biogas production and microbial community under high salinity conditions. Sci. Rep. 2017, 7. [Google Scholar] [CrossRef] [PubMed]
Figure 1.
Location of studied reservoirs and sampling station.

Figure 2.
Changes in CO2 concentrations – panels (a,c,e) and values of 13C AP – panels (b,d,f) over the time of incubation of sediments.
Figure 2.
Changes in CO2 concentrations – panels (a,c,e) and values of 13C AP – panels (b,d,f) over the time of incubation of sediments.

Figure 3.
Changes in AOM rates – panels (a,c,e) and amounts of CH4 oxidised – panels (b,d,f) over the time of incubation of sediments.
Figure 3.
Changes in AOM rates – panels (a,c,e) and amounts of CH4 oxidised – panels (b,d,f) over the time of incubation of sediments.


Table 1.
Granulometric composition of the studied sediments.
| Reservoir | Depth (cm) | Fraction (%) | Type | ||
|---|---|---|---|---|---|
| Fsa 2–0.063 mm | Fsi 0.063–0.002 mm | Fcl < 0.002 mm | PN-EN ISO 14688–2: 2018–05 | ||
| Maziarnia | 0–5 | 17.49 | 50.00 | 32.51 | loam (Cl) |
| 5–10 | 25.18 | 44.09 | 30.72 | loam (Cl) | |
| 10–15 | 32.18 | 45.82 | 22.00 | clay loam (sasiCl) | |
| Nielisz | 0–5 | 51.27 | 33.28 | 15.44 | clay loam (sasiCl) |
| 5–10 | 34.03 | 45.98 | 19.98 | clay loam (sasiCl) | |
| 10–15 | 21.31 | 56.05 | 22.64 | clay loam (sasiCl) | |
| Rzeszów | 0–5 | 3.50 | 77.35 | 19.15 | silty loam (clSi) |
| 5–10 | 5.23 | 73.15 | 21.61 | silty clay (siCl) | |
| 10–15 | 4.01 | 73.76 | 22.22 | silty clay (siCl) | |
Notes: Fsa—sand fraction, Fsi—silty fraction, Fcl—clay fraction.
Table 2.
Selected parameters characterising sediments in the reservoirs studied.
| Reservoir | Depth (cm) | pH | OM (%) | TOCS (%) | HS (mg/g) | Pristane (μg/g) | Crocetane (μg/g) | Squalane (μg/g) | Archaeol (μg/g) |
|---|---|---|---|---|---|---|---|---|---|
| Maziarnia | 0–5 | 7.13 | 4.44 | 1.38 | 14.20 | 0.082 | 0.16 | 0.20 | 1.00 |
| 5–10 | 6.39 | 4.71 | 1.79 | 18.20 | 0.046 | 0.07 | 0.16 | 0.65 | |
| 10–15 | 6.44 | 3.38 | 1.29 | 13.40 | 0.042 | 0.07 | 0.49 | 0.47 | |
| Nielisz | 0–5 | 8.01 | 13.16 | 5.22 | 48.00 | 0.117 | 0.13 | 0.22 | 3.14 |
| 5–10 | 7.99 | 13.18 | 4.94 | 49.60 | 0.101 | 0.13 | 0.19 | 3.48 | |
| 10–15 | 8.03 | 12.47 | 4.97 | 50.50 | 0.075 | 0.10 | 0.17 | 3.34 | |
| Rzeszów | 0–5 | 7.51 | 9.65 | 3.79 | 34.90 | 0.106 | 0.14 | 0.24 | 1.42 |
| 5–10 | 7.58 | 8.18 | 3.84 | 34.70 | 0.072 | 0.09 | 0.27 | 2.44 | |
| 10–15 | 7.71 | 5.99 | 2.66 | 22.90 | 0.057 | 0.07 | 0.68 | 2.06 |
Table 3.
Results obtained for the chemical parameters of pore water in the reservoirs studied.
| Reservoir | Depth cm | NO2− mg/dm3 | NO3− mg/dm3 | NH4+ mg/dm3 | SO42− mg/dm3 | Cl− mg/dm3 | Na+ mg/dm3 | K+ mg/dm3 | Mg2+ mg/dm3 | Ca2+ mg/dm3 | TOCw mg/dm3 | IC mg/dm3 | Fe2+ μmol/ dm3 | Fe3+ μmol/ dm3 |
|---|---|---|---|---|---|---|---|---|---|---|---|---|---|---|
| Maziarnia | 0–5 | 0.032 | 0.040 | 5.53 | 14.49 | 17.30 | 16.29 | 5.10 | 4.98 | 50.72 | 20.06 | 64.08 | 69.70 | 896.33 |
| 5–10 | 0.028 | 0.071 | 6.64 | 10.61 | 17.88 | 15.77 | 5.70 | 6.92 | 63.39 | 36.39 | 85.71 | 172.45 | 736.61 | |
| 10–15 | 0.024 | 0.037 | 9.43 | 6.30 | 16.93 | 13.36 | 4.19 | 9.88 | 78.81 | 44.34 | 101.66 | 321.61 | 401.51 | |
| Nielisz | 0–5 | 0.010 | 0.024 | 16.58 | 11.34 | 6.37 | 6.21 | 5.24 | 12.37 | 119.34 | 52.74 | 147.12 | 110.80 | 845.55 |
| 5–10 | 0.015 | 0.029 | 12.70 | 9.70 | 4.81 | 5.59 | 2.63 | 9.73 | 80.62 | 28.54 | 114.30 | 162.17 | 778.95 | |
| 10–15 | 0.018 | 0.036 | 8.07 | 8.40 | 3.20 | 4.99 | 1.35 | 9.00 | 64.79 | 20.64 | 101.50 | 259.78 | 741.85 | |
| Rzeszów | 0–5 | 0.015 | 0.037 | 4.75 | 0.87 | 19.81 | 17.12 | 6.85 | 18.92 | 97.06 | 19.88 | 149.14 | 68.41 | 279.75 |
| 5–10 | 0.018 | 0.052 | 9.61 | 2.56 | 16.70 | 15.77 | 7.46 | 21.79 | 118.59 | 31.44 | 141.44 | 75.93 | 177.15 | |
| 10–15 | 0.015 | 0.020 | 8.04 | 2.37 | 16.12 | 16.43 | 8.64 | 22.67 | 124.42 | 36.56 | 131.80 | 100.52 | 39.45 |
Table 4.
Pearson correlations (r) between AOM rate and pore-water parameters.
| NO2− | NO3− | NH4+ | SO42− | Cl− | Na+ | K+ | Mg2+ | Ca2+ | TOCw | IC | Fe2+ | Fe3+ | |
|---|---|---|---|---|---|---|---|---|---|---|---|---|---|
| AOM rate (3 day) | −0.3293 | −0.0577 | −0.0922 | −0.0694 | −0.3295 | −0.3015 | −0.2884 | 0.0333 | −0.0914 | −0.6362 | 0.2740 | −0.3431 | 0.2296 |
| AOM rate (20 day) | −0.5329 | −0.2925 | 0.5989 | 0.2206 | −0.7804 * | −0.8589 ** | −0.6647 | −0.2689 | 0.0055 | 0.2515 | 0.2625 | 0.4285 | 0.4657 |
| AOM rate (40 day) | −0.8646 ** | −0.5910 | 0.3810 | −0.2938 | −0.6325 | −0.5763 | −0.1690 | 0.3968 | 0.4691 | −0.0911 | 0.6676 * | −0.1430 | −0.0673 |
Notes: * p < 0.05, ** p < 0.01.
Table 5.
Pearson correlations (r) between AOM rate and sediment parameters.
| pH | OM | TOCS | HS | Pristane | Crocetane | Squalane | Archaeol | |
|---|---|---|---|---|---|---|---|---|
| AOM rate (3 day) | 0.5889 | 0.7057 * | 0.6676 * | 0.6840 * | 0.7495 * | 0.6514 | −0.6621 | 0.4943 |
| AOM rate (20 day) | 0.4402 | 0.7513 * | 0.7077 * | 0.7452 * | 0.4804 | 0.1649 | −0.4038 | 0.5778 |
| AOM rate (40 day) | 0.9026 *** | 0.8691 ** | 0.8998 *** | 0.8712 ** | 0.6574 | 0.2801 | −0.0890 | 0.8244 ** |
Notes: * p < 0.05, ** p < 0.01, *** p < 0.001.
Publisher’s Note: MDPI stays neutral with regard to jurisdictional claims in published maps and institutional affiliations. |
© 2022 by the authors. Licensee MDPI, Basel, Switzerland. This article is an open access article distributed under the terms and conditions of the Creative Commons Attribution (CC BY) license (https://creativecommons.org/licenses/by/4.0/).
Share and Cite
MDPI and ACS Style
Gruca-Rokosz, R.; Szal, D. Isotopic Evidence for Anaerobic Oxidation of Methane in the Freshwater Sediments of Reservoirs: The Impact of Selected Environmental Factors. Water 2022, 14, 3375. https://doi.org/10.3390/w14213375
AMA Style
Gruca-Rokosz R, Szal D. Isotopic Evidence for Anaerobic Oxidation of Methane in the Freshwater Sediments of Reservoirs: The Impact of Selected Environmental Factors. Water. 2022; 14(21):3375. https://doi.org/10.3390/w14213375
Chicago/Turabian StyleGruca-Rokosz, Renata, and Dorota Szal. 2022. "Isotopic Evidence for Anaerobic Oxidation of Methane in the Freshwater Sediments of Reservoirs: The Impact of Selected Environmental Factors" Water 14, no. 21: 3375. https://doi.org/10.3390/w14213375
Note that from the first issue of 2016, this journal uses article numbers instead of page numbers. See further details here.