
A Novel Low-Cost Photocatalyst: Preparation, Characterization, and Photocatalytic Properties of CeO2-Diatomite Composites

Department of Chemistry, Faculty of Arts and Sciences, Kirsehir Ahi Evran University, Kirsehir 40100, Turkey
Water 2022, 14(21), 3373; https://doi.org/10.3390/w14213373
Submission received: 26 September 2022
/
Revised: 18 October 2022
/
Accepted: 19 October 2022
/
Published: 24 October 2022
(This article belongs to the Special Issue New Perspectives in Environmental Catalysis and Oxidation Processes for Removal of Pollutants from Water)
Abstract
:Developing CeO2-diatomite composites with highly efficient photocatalytic performance is a practical and low-cost strategy for the removal of abundant contaminants in water and wastewaters. Diatomite (D) was modified by acid treatment to obtain a more porous structure. CeO2-diatomite composites were prepared in two different mass ratios of D to CeO2 of 1:1 and 1:2 via a facile precipitation method. The changes in structural, morphological, optical, and thermal properties of CeO2-diatomite composites were characterized by FTIR, XRD, ESEM-EDAX, BET surface area, TGA, PL, Raman spectroscopy, and zeta potential techniques. ESEM images presented the morphological differences of CeO2-diatomite composites, reflecting the effect of modification as a more folded sheet form morphology and higher BET surface area. XRD analysis revealed the fluorite-type structure of CeO2 particles in composites. Photocatalytic activities were investigated by following the degradation of methylene blue (MB) as a thiazine dye model under UVA light irradiation. CeO2-diatomite composites exhibited irradiation time- and dose-dependent remarkable photocatalytic efficiencies, whereas composite type inconsistent variations were also noticed. The attained performance of the CeO2-diatomite composites could strongly imply a favorable application prospect in the photocatalysis field.
1. Introduction
The lack of efficient wastewater treatment and the spreading of hazardous chemicals including dyes from industries into water resources is a major global issue [1]. The textile industry consumes the most dye, followed by the various dye-related industries, such as printing, and the production of paper, paint, and leather for various manufacturing purposes. Among the different textile dyes, MB is widely used as a cationic and primary thiazine dye for coloring silk, wool, cotton, and paper [2,3]. The accumulation of MB in receiving waters can have a harmful impact on the ecological system. Therefore, the removal of MB from wastewater effluent is highly crucial prior to the direct discharging into the water bodies [1,3,4]. To date, numerous approaches have been reported for the elimination of MB from wastewaters, including coagulation, flocculation, biodegradation, and adsorption treatments [3,5,6,7]. However, these wastewater treatments are generally not able to achieve complete dye degradation, even with a sequential combination of two or three methods. Therefore, it is necessary to focus on an alternative and efficient water treatment technique having a low cost [8,9,10,11]. Advanced oxidation processes, specifically heterogeneous photocatalysis, may degrade complex organic pollutants via reactive oxygen species (ROS) operating mainly through hydroxyl radical attack [12,13].
Recently, new catalysts using either semiconductors such as CdS [14], CuO [15], MgO [16], SnO2 [17], and Al-doped CoFe2O4 [18], or composites such as PANI-ZnO [19] and Ag@TiO2/W3 [20], were developed for the photocatalytic degradation of MB. A rare earth oxide, CeO2, received attention as a promising catalyst since it is non-toxic, non-photocorrosive, and low-cost, and has a strong oxygen ability with high chemical stability properties [21,22,23].
The primary events of a photocatalytic degradation process using a photocatalyst, e.g., CeO2, can be expressed by the reactions given below (Reactions (1–6)):
Charge separation: Upon irradiation of CeO2, a hole in the valence band (VB, h+VB) and an electron in the conduction band (CB, e−CB) are generated (Reaction (1)).
CeO2 + hν (E > Ebg) → CeO2 (e−CB + h + VB)
These charge carriers react with either the H2O molecule (Reaction (2)) or with the hydroxyl ion OH− (Reaction (3)) to form hydroxyl radical (•OH).
•OH formation via h + VB:
h + VB + H2O → H+ + •OH
h + VB + OH− → •OH
Reduction via e−CB:
e−CB + O2 → •O2−
Reaction (4) defines a reduction process indicating formation of a superoxide anion (•O2−) followed by formation of H2O2 (Reactions (5) and (6)).
•O2− + H2O2 → •OH + O2 + HO−
•OH + •OH → H2O2
Degradation of organic pollutants can be achieved through action of ROS (i.e., •OH, •O2−, H2O2, etc.) proceeding through various consecutive steps and eventually resulting in formation of innocuous products as CO2, H2O, and inorganic ions (Reaction (7)) [23,24].
ROS + organic pollutants → → → CO2 + H2O
Recently, some researchers reported the photodegradation of MB using CeO2 as a catalyst to solve the problem of water pollution [25,26,27,28,29,30]. Considerable efforts were made to enhance CeO2 adsorption with the addition of SiO2 nanoparticles [23,31,32,33,34,35]. Modification of the morphology with SiO2 was an advantageous step for successful separation of the photogenerated charge carriers. It is well-known that the use of SiO2 emerged as a promising strategy to obtain a more uniform distribution and porosity of the final product [31,35].
In the past, D was used to prepare new natural silica mineral carrier materials for wastewater treatment [36,37,38]. Raw D is a unique ordered porous silica material with a large specific surface area, low density, high adsorption capacity, and chemical resistance. This low-cost porous material is derived from the skeleton fossils of unicellular aquatic algae known as diatoms having various shapes and sizes and consisting of amorphous silica [36,39]. Raw D consists of mineral impurities that reduce the original structural characteristics. Therefore, the removal of the existing undesired impurities is sometimes crucial to enhance the pore-size distribution and adsorption properties of D. Accordingly, acid treatment is applied as a simple and cheap approach, resulting in a modified diatomite (MD) [39,40,41]. Several studies have focused on the photocatalytic performance of MB using various catalysts including TiO2-diatomite composites [42,43], Zn-diatomite composite [44], SnO2-diatomite composite [39], CdS-diatomite composite [45], and TiO2-ZnO-diatomite composite [46]. However, there were very few studies on the development of CeO2-diatomite composites. Zhou and colleagues prepared a Pt single-atom catalyst on CeO2-modified diatomite support for the hydrogenation of phenylacetylene to styrene [47]. Su and co-workers proved that the synthesized modified nano-CeO2-filled oily diatomite/polyvinylidene fluoride composites exhibited tribological behavior [48]. Therefore, this study addressed the photocatalytic performance of CeO2-diatomite composite, which represents a significant contribution.
CeO2-diatomite composites were synthesized via a facile precipitation method considering the photocatalytic activity of CeO2 with the adsorption ability of diatomite as the representative material of porous silica. The present work dealt with the preparation of CeO2-diatomite composites using raw D and MD in two different mass ratios to understand the relationship between the pretreatment method and resulting composites. Furthermore, the possible morphological, structural, optical, and thermal differences depending on the use of the diatomite type in the composite were systematically investigated. The photocatalytic properties of the prepared CeO2-diatomite composites via two different routes were evaluated by testing MB dye for the first time.
2. Materials and Methods
2.1. Materials
Diatomite (average particle size = 5.2 μm) was used as supplied from Beg Tug Mineral, Türkiye. Chemically, D was mainly composed of SiO2 (75.45%), inorganic constituents such as Al2O3 (7.15%), CaO (3.05%), Fe2O3 (2.35%), MgO (1.45%), and TiO2 (0.40%), and some organic impurities. Ce(NH4)2(NO3)6, NaOH, and HCl (37%) were purchased from Sigma-Aldrich and used without further purification. All aqueous solutions were prepared using distilled water (conductivity 2 × 10⁻⁶ S/m at 25 °C).
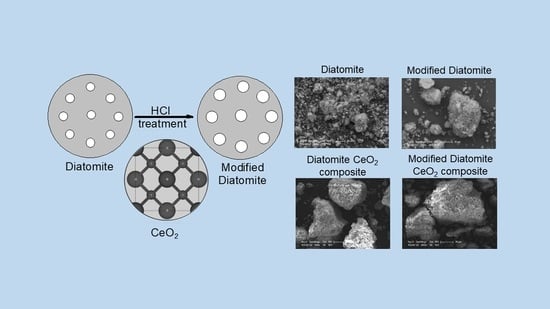
2.2. Preparation of Modified Diatomite
Acid-modified diatomite was prepared according to the procedure reported by Jiang and colleagues [39]. A quantity of 10 g diatomite was added to 100 mL of 1 M HCl to prepare a suspension and placed in a water bath shaker for 2 h. Then, MD was filtered through a Gooch funnel equipped with a sintered glass disc, followed by extensive washings with distilled water, dried at 105 °C for 24 h, and finally calcined in a muffle furnace at 450 °C in air for 1h.
2.3. Preparation of CeO2-Diatomite Composites
CeO2-diatomite composites were prepared via a modified co-precipitation method [49]. The theoretical diatomite/CeO2 mass ratios were 1:1 and 1:2 of raw D or MD to CeO2, and these four composites were denoted as DC-11, DC-12 MDC-11, and MDC-12, respectively. The representative synthesis of DC-11 was given as follows: 1.72 g raw D was added to 100 mL of 0.1 M Ce(NH4)2(NO3)6 solution in a flat-bottomed flask and stirred vigorously for 5 min. Subsequently, the pH was adjusted to 12 by dropwise (approximately one drop/second) addition of 0.5 M NaOH with vigorous stirring by a magnetic stirrer, and stirring was continued for 2 h at room temperature. The precipitate was filtered, washed with distilled water, and then dried in an air oven at 80 °C for 24 h. Finally, the dried CeO2-diatomite composites were calcined in a muffle furnace at 500 °C in air for 2 h. The same synthesis procedure was repeated by taking half the amount of D for the preparation of DC-12. MDC-11 and MDC-12 composites were synthesized using MD, accordingly.
2.4. Characterization Techniques
Fourier transform infrared (FTIR) spectroscopy was performed with the attenuated total reflectance (ATR) technique using a Perkin Elmer Spectrum Two model FTIR and Universal ATR accessory with diamond/ZnSe crystal in a spectral region of 3600–500 cm−1 with a scan resolution of 2 cm−1. Dispersive Raman spectroscopy measurements were performed by a Thermo Scientific DXR Raman Microscope using Ar+ laser power (10 mW) at λ = 532 nm. X-ray diffraction (XRD) patterns were obtained by a Rigaku-D/MAX-Ultima diffractometer with Cu Kα radiation (λ = 1.54 Å) as an X-ray source. The accelerating and applied currents were 40 kV and 40 mA, respectively. Scanning electron microscopy in combination with energy dispersive X-ray analysis (ESEM-EDAX) was achieved on a FEI-Philips XL30 Scanning Electron Microscope-EDAX instrument. Brunauer–Emmett–Teller (BET) surface area and Barrett–Joyner–Halenda (BJH) pore-size distribution measurements were obtained by N2 adsorption at 77 K using a Quantachrome Quadrosorb SI instrument. Thermogravimetric (TG) analysis was undertaken by a Perkin Elmer model STA 600 in the temperature range of 30 to 800 °C under pure nitrogen using 10 mg of specimen. The applied heating rate and nitrogen flow rate were 10 °C/min and 20 mL/min, respectively. The photoluminescence (PL) spectra were recorded on an Edinburgh Instruments FS5 spectrofluorometer with an excitation wavelength at λ = 325 nm. Zeta potential measurements were performed in a Malvern Zetasizer Nano ZSP in the pH range of 2–12 by adding HC1 or NaOH solutions.
2.5. Assessment of Initial Adsorptive Surface Interactions
Photocatalytic time-dependent (0–480 min) adsorption experiments were carried out in a continuously shaking water bath at 25 ± 1 °C. The volume of MB (5 mg/L) solution in Erlenmeyer flasks was 25 mL and the adsorbent dose was 0.25 g/L. Following predetermined time intervals, the suspensions were filtered through 0.45 μm cellulose acetate membrane filter (Millipore HA) to obtain clear solutions for spectroscopic analysis.
2.6. Photocatalytic Activity Assessment
Photocatalytic activity experiments were carried out in a cylindrical Pyrex reaction vessel containing 50 mL MB solution illuminated from the top with a 125 W black light fluorescent lamp (λemis = 300–400 nm, λmax = 365 nm). The intensity of the BLF lamp was determined as Io = 1.65 × 10¹⁶ quanta/s using potassium ferrioxalate actinometer [50]. Two different dosages of CeO2-diatomite composites (0.25 g/L and 0.50 g/L) were used while keeping the MB concentration constant (5 mg/L). Prior to testing of photocatalytic activity, the solution was magnetically stirred thoroughly for 30 min in the dark to achieve effective surface coverage. Following each photocatalytic treatment period (0–360 nm), the solutions were immediately filtrated through 0.45 μm membrane filters. The absorption changes of MB were assessed at specific maximum absorbance wavelengths of λ = 664 nm, λ = 292 nm, and λ = 246 nm. The UV-vis measurements acquired by a Thermo Scientific Genesys 10S double-beam UV-vis spectrophotometer using 1 cm quartz cells were denoted as A664, A292, and A246 parameters.
3. Results and Discussion
3.1. Characterization of the Diatomites and CeO2-Diatomite Composites
3.1.1. FTIR Analysis
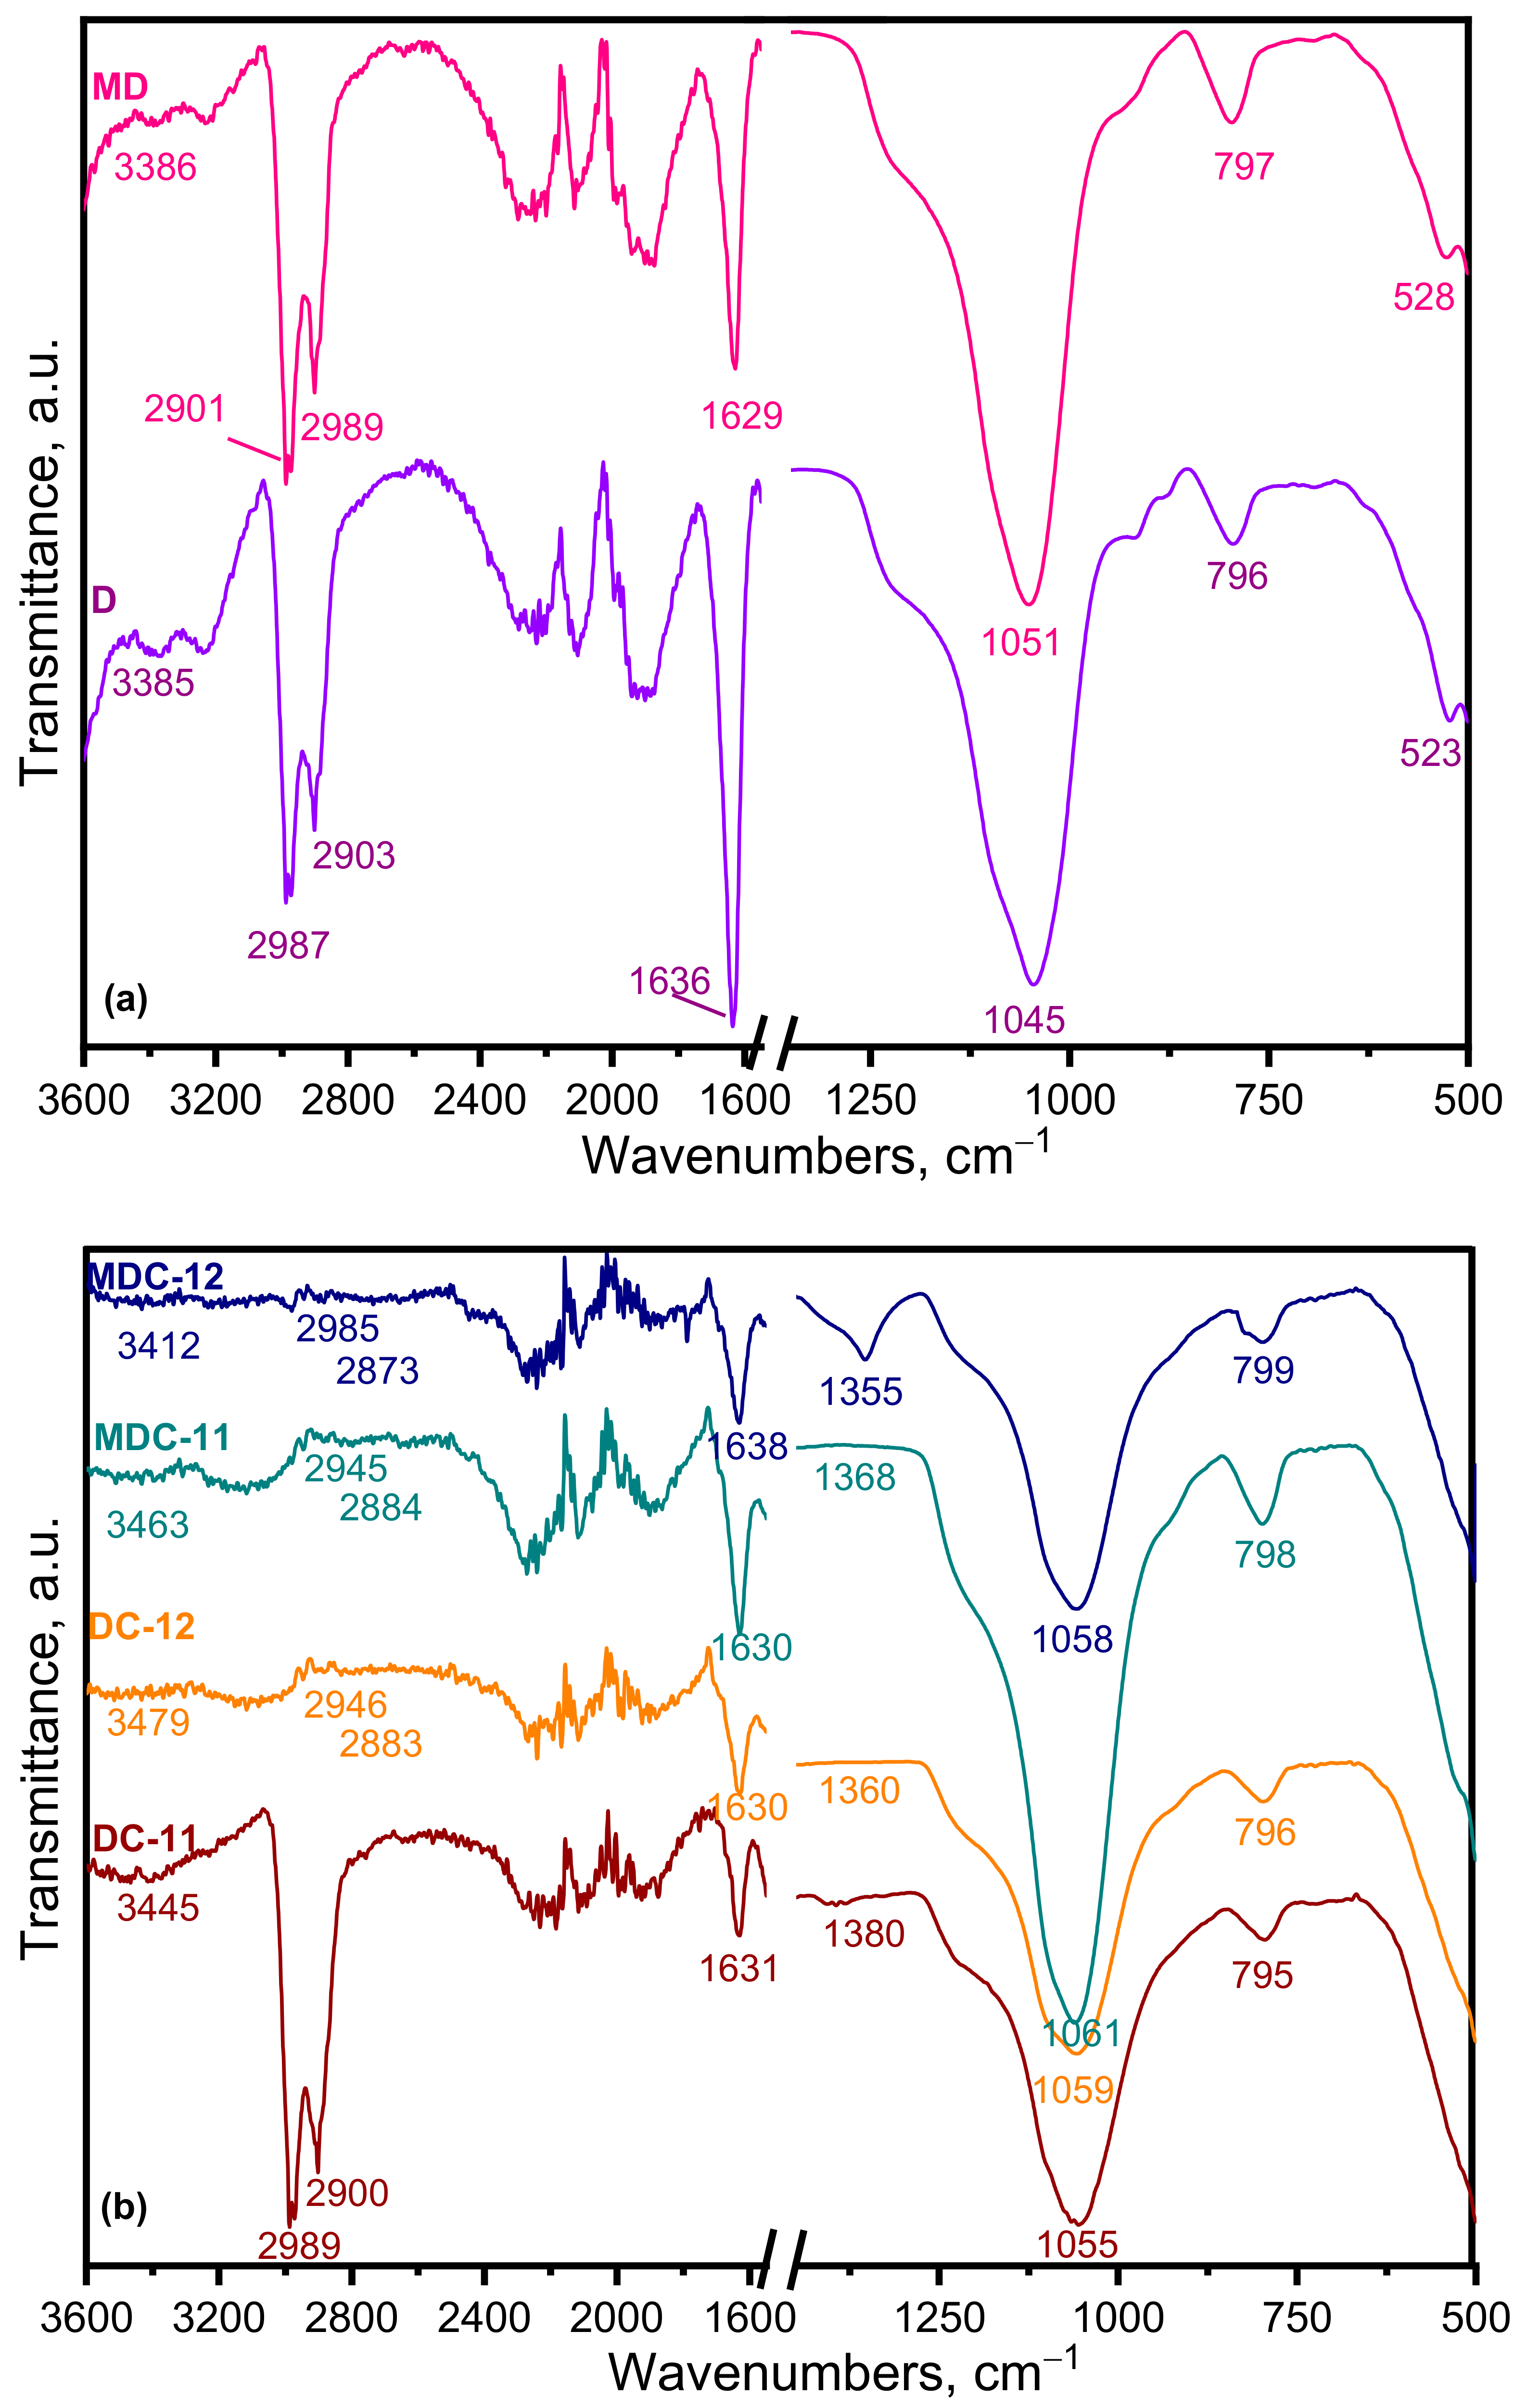
FTIR spectral features revealed the influence of acid modification on characteristic functional groups of D, MD, and CeO2-diatomite composites (Figure 1a,b). The spectrum of D indicated a broad band near 3385 cm−1 that was assigned to the free silanol group (νSiO–H) on the surface [51]. The bands at 2987 and 2903 cm−1 corresponded to the asymmetric and symmetric C–H bands on CH2 and CH3, respectively, reflecting the presence of organic matter in diatomite [52,53]. The intense band observed at 1636 cm−1 was related to the bending vibration of water (δHOH). Moreover, the characteristic silica bands at 1045 and 796 cm−1 were attributed to the asymmetric stretching of Si–O–Si (νasSi–O–Si), and the symmetric stretching vibration of Si–O (νsSi–O) in amorphous silica, respectively [53]. The band at 523 cm−1 was related to the stretching vibration of Si–O due to the deformation on the structural unit of SiO2 [54]. The FTIR spectrum of MD showed a red shift related to the bands belonging to νasSi–O–Si and νsSi–O groups of silica. This could indicate that the acid treatment had an impact on the chemical properties of the D. The reason for this could be the change in the chemical composition of MD, resulting in an enhancement of the silica amount due to the removal of the impurity content of D.
The FTIR spectral profiles of composites are shown in Figure 1b. The weak band located in the range of 1355–1380 cm−1 belonged to Ce–O–Ce vibration bond in composites, indicating the existence of CeO2 [55,56]. In general, the positions of the prominent D bands were slightly shifted in the spectrum of CeO2-diatomite composites. The observed band shifts could be related to the incorporation of CeO2 into the framework of the SiO2 matrix [31,57]. In the presence of CeO2, a new band related to the stretching vibration of Ce–O–Ce (νCe–O–Ce) at 1380 cm−1 was observed in the spectrum of DC-11 composite. The main bands at 3445, 2989, 2900, 1631, 1380, 1055, and 795 cm−1 corresponded to the free silanol group (νSiO–H), asymmetric C–H bands on CH2 (νasC–H), symmetric C–H bands on CH3 (νsC–H), bending vibration of water (δHOH), asymmetric stretching of Si–O–Si (νasSi–O–Si), and symmetric stretching vibration of Si–O (νsSi–O), respectively. The characteristic Si-O-Si asymmetric and symmetric strong stretching signals of D and MD red shifted in all composites with the increasing amount of CeO2. Although the band at 530 cm−1 was also expected to shift to higher frequencies, it seems to be shielded by the shoulder of strong O-Ce-O vibrational signal centered at around 415 cm−1 (not shown in the figure) as reported in the literature [51,52,53,54,55,56]. Moreover, the most interesting spectral change was observed in the stretching vibration band of Ce–O–Ce. This band was notably blue shifted in MDC-11 and MDC-12 composites compared to that of composites prepared by raw D, designated as DC-11 and DC-12, respectively.
3.1.2. Raman Spectroscopy
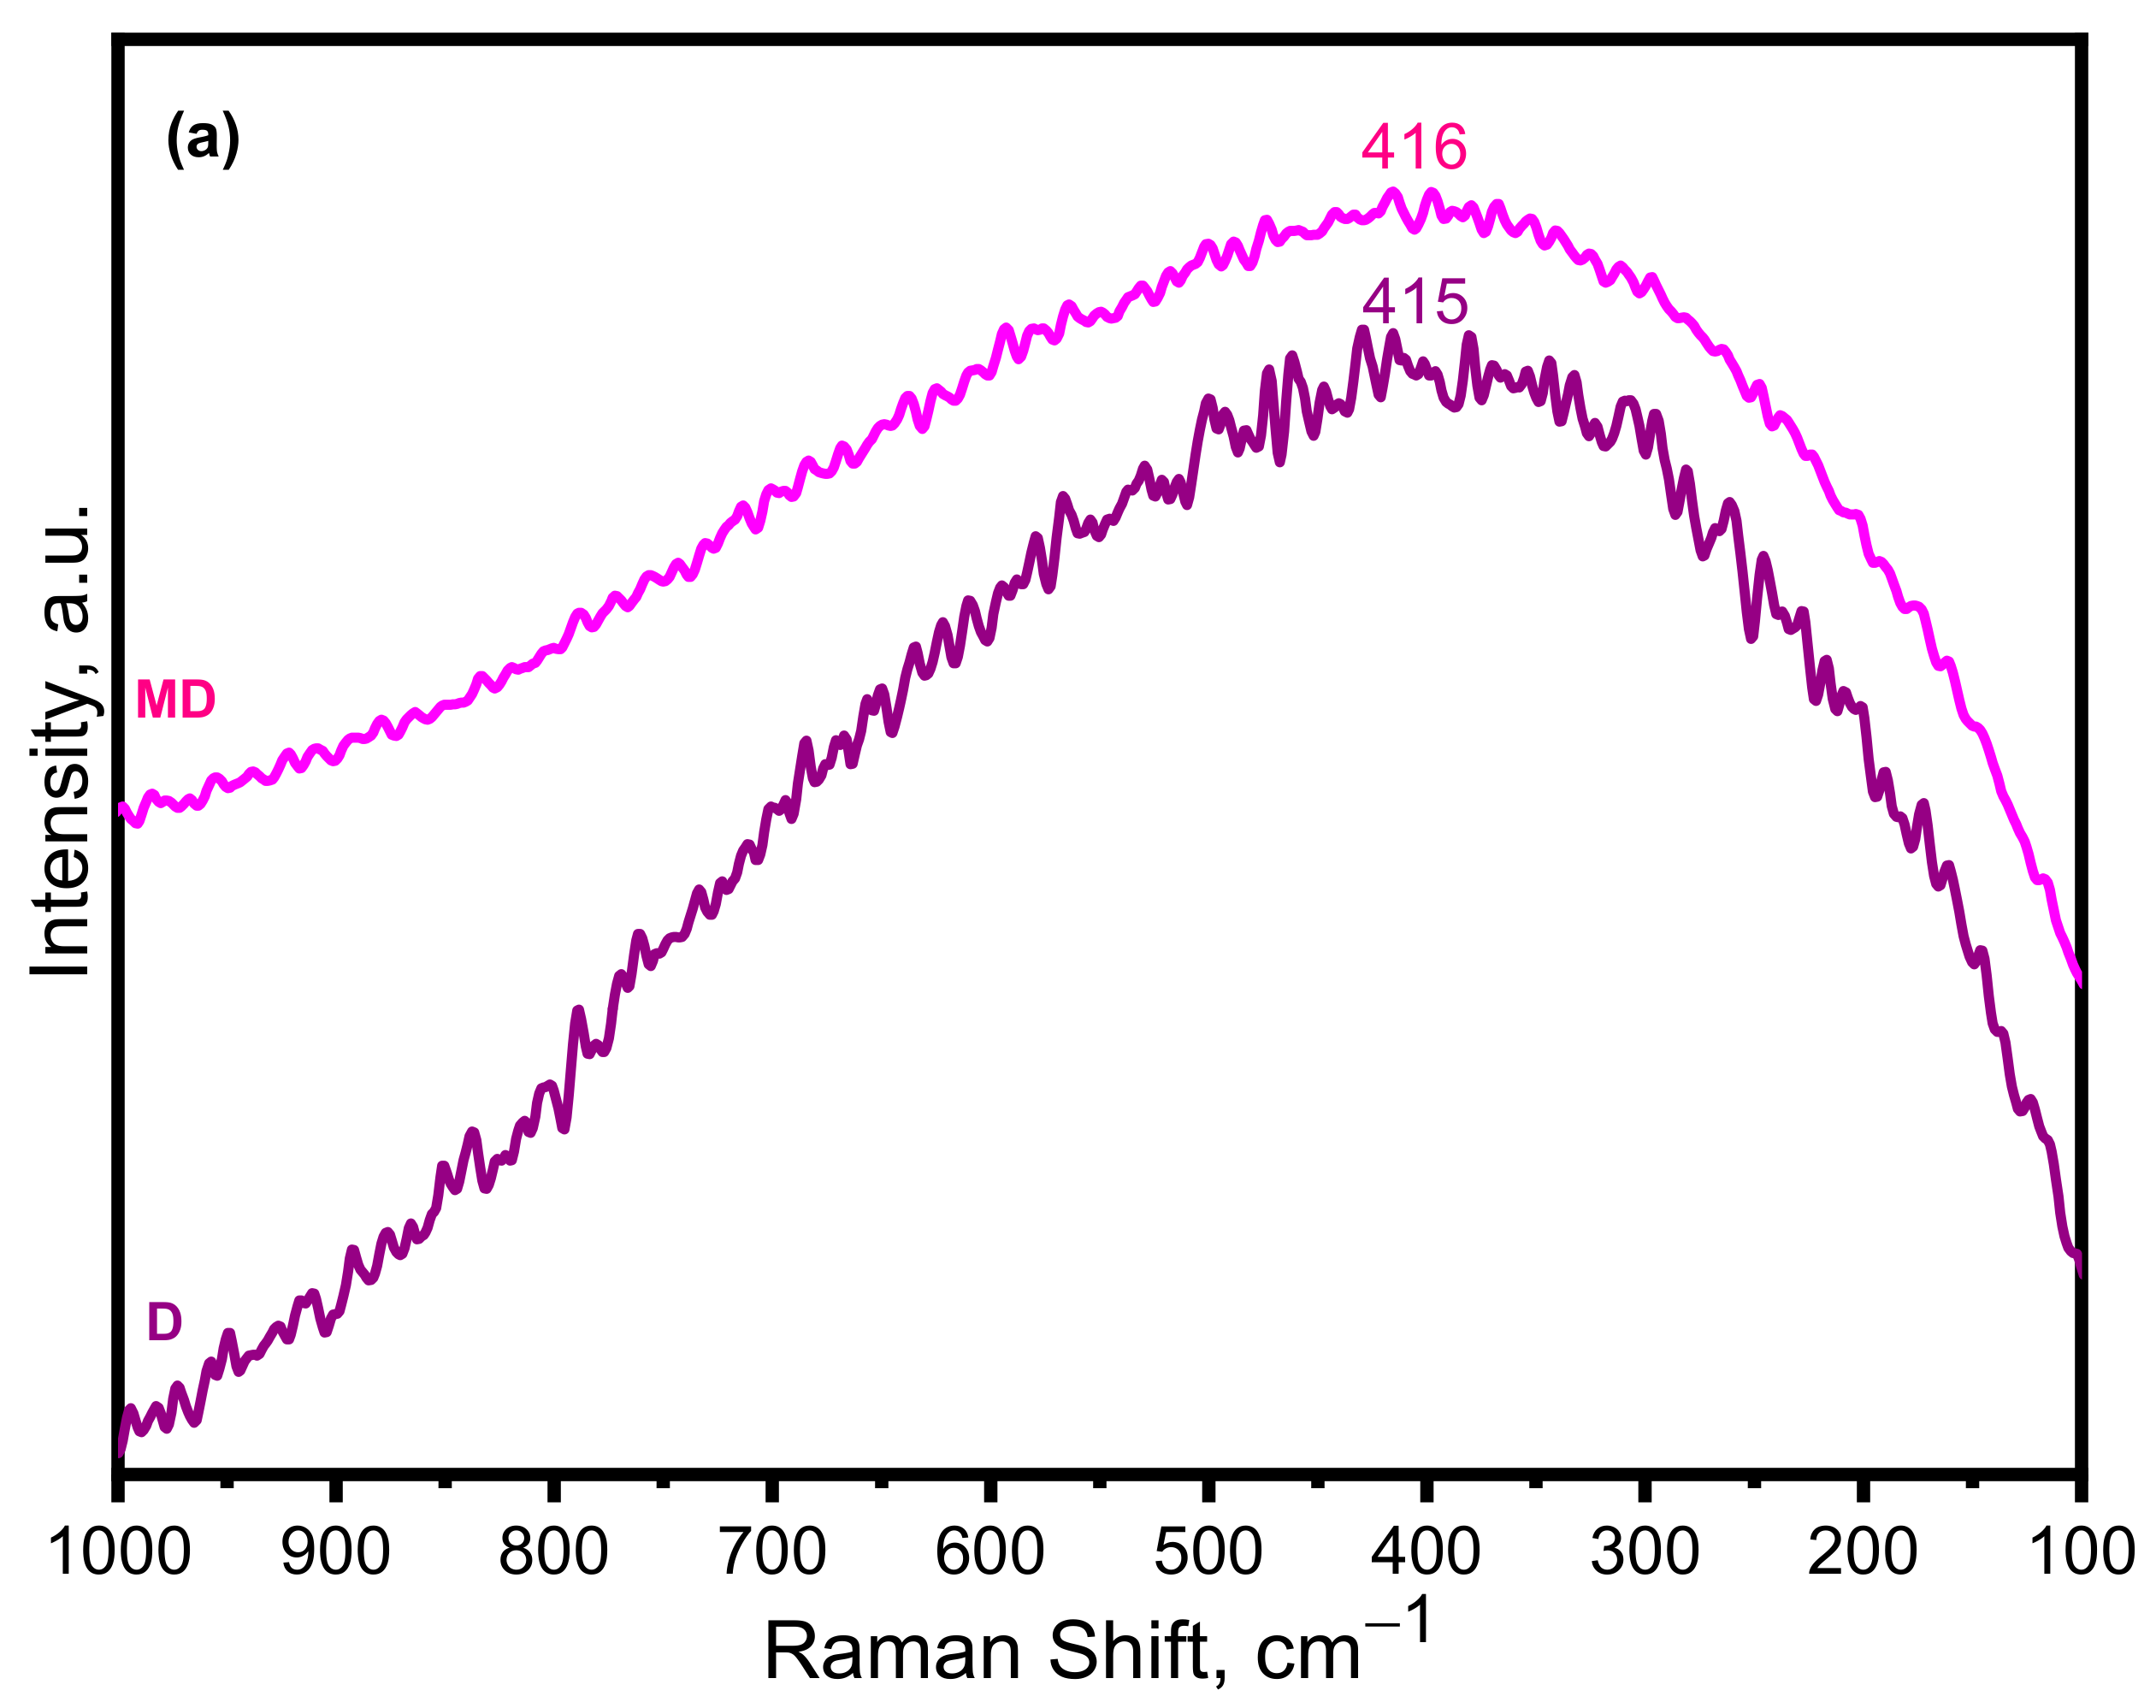
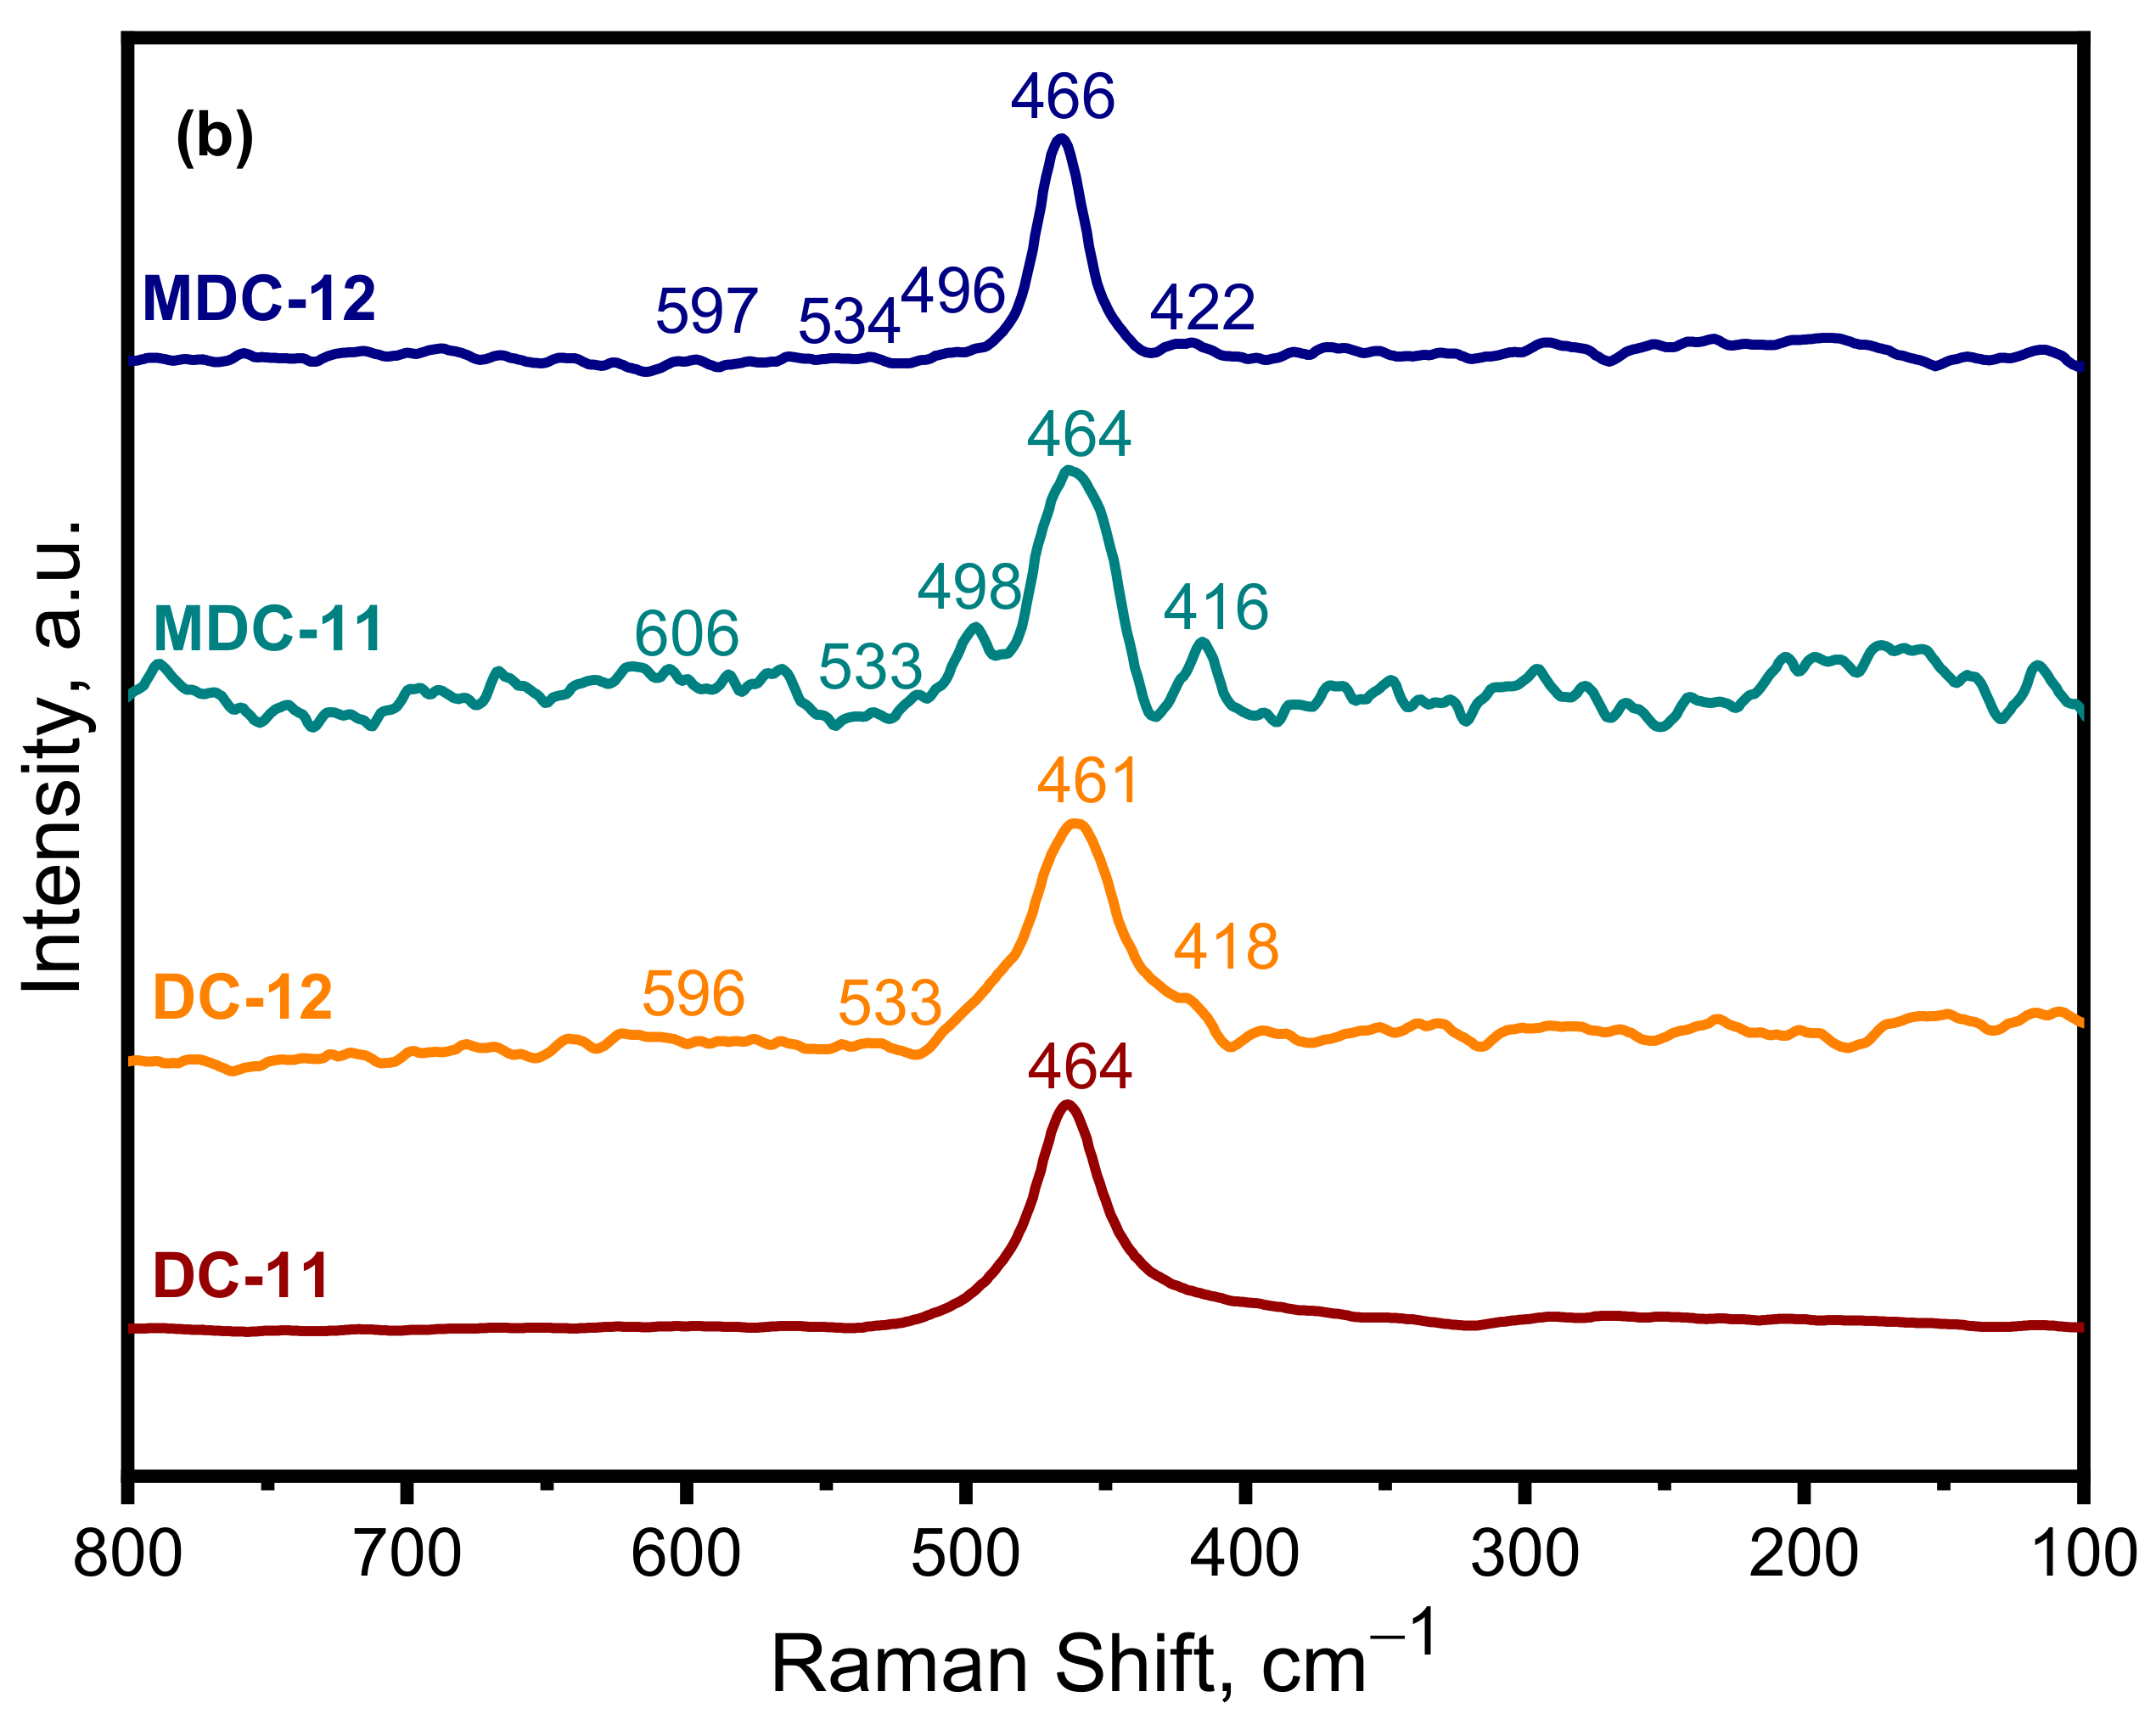
Raman spectra of diatomite specimens and CeO2-diatomite composites are presented in Figure 2.
Diatomite specimens exhibited a broad band at ~415 cm−1 that was assigned to the O-Si-O bending mode [58]. Raman spectra of DC-11 composite revealed a prominent band at 464 cm−1 that was attributed to the triply degenerate F2g vibration mode, which was assigned to a symmetric breathing mode of the oxygen atoms around Ce ions [59]. This band was in the range of 461–464 cm−1 in composites, suggesting the fluorite structure of CeO2 [60]. The observed band at ~600 cm−1 corresponded to the non-degenerate longitudinal-optical mode of CeO2 indicating the oxygen vacancies in the CeO2 lattice [59,61]. The D1 bands in the region between 500 and 600 cm−1 could be related to the bulk oxygen vacancies in CeO2. The band at ~420 cm−1 could belong to the silica structure due to the contribution of D. The bands below 200 cm−1 could be assigned to the scattering [62,63].
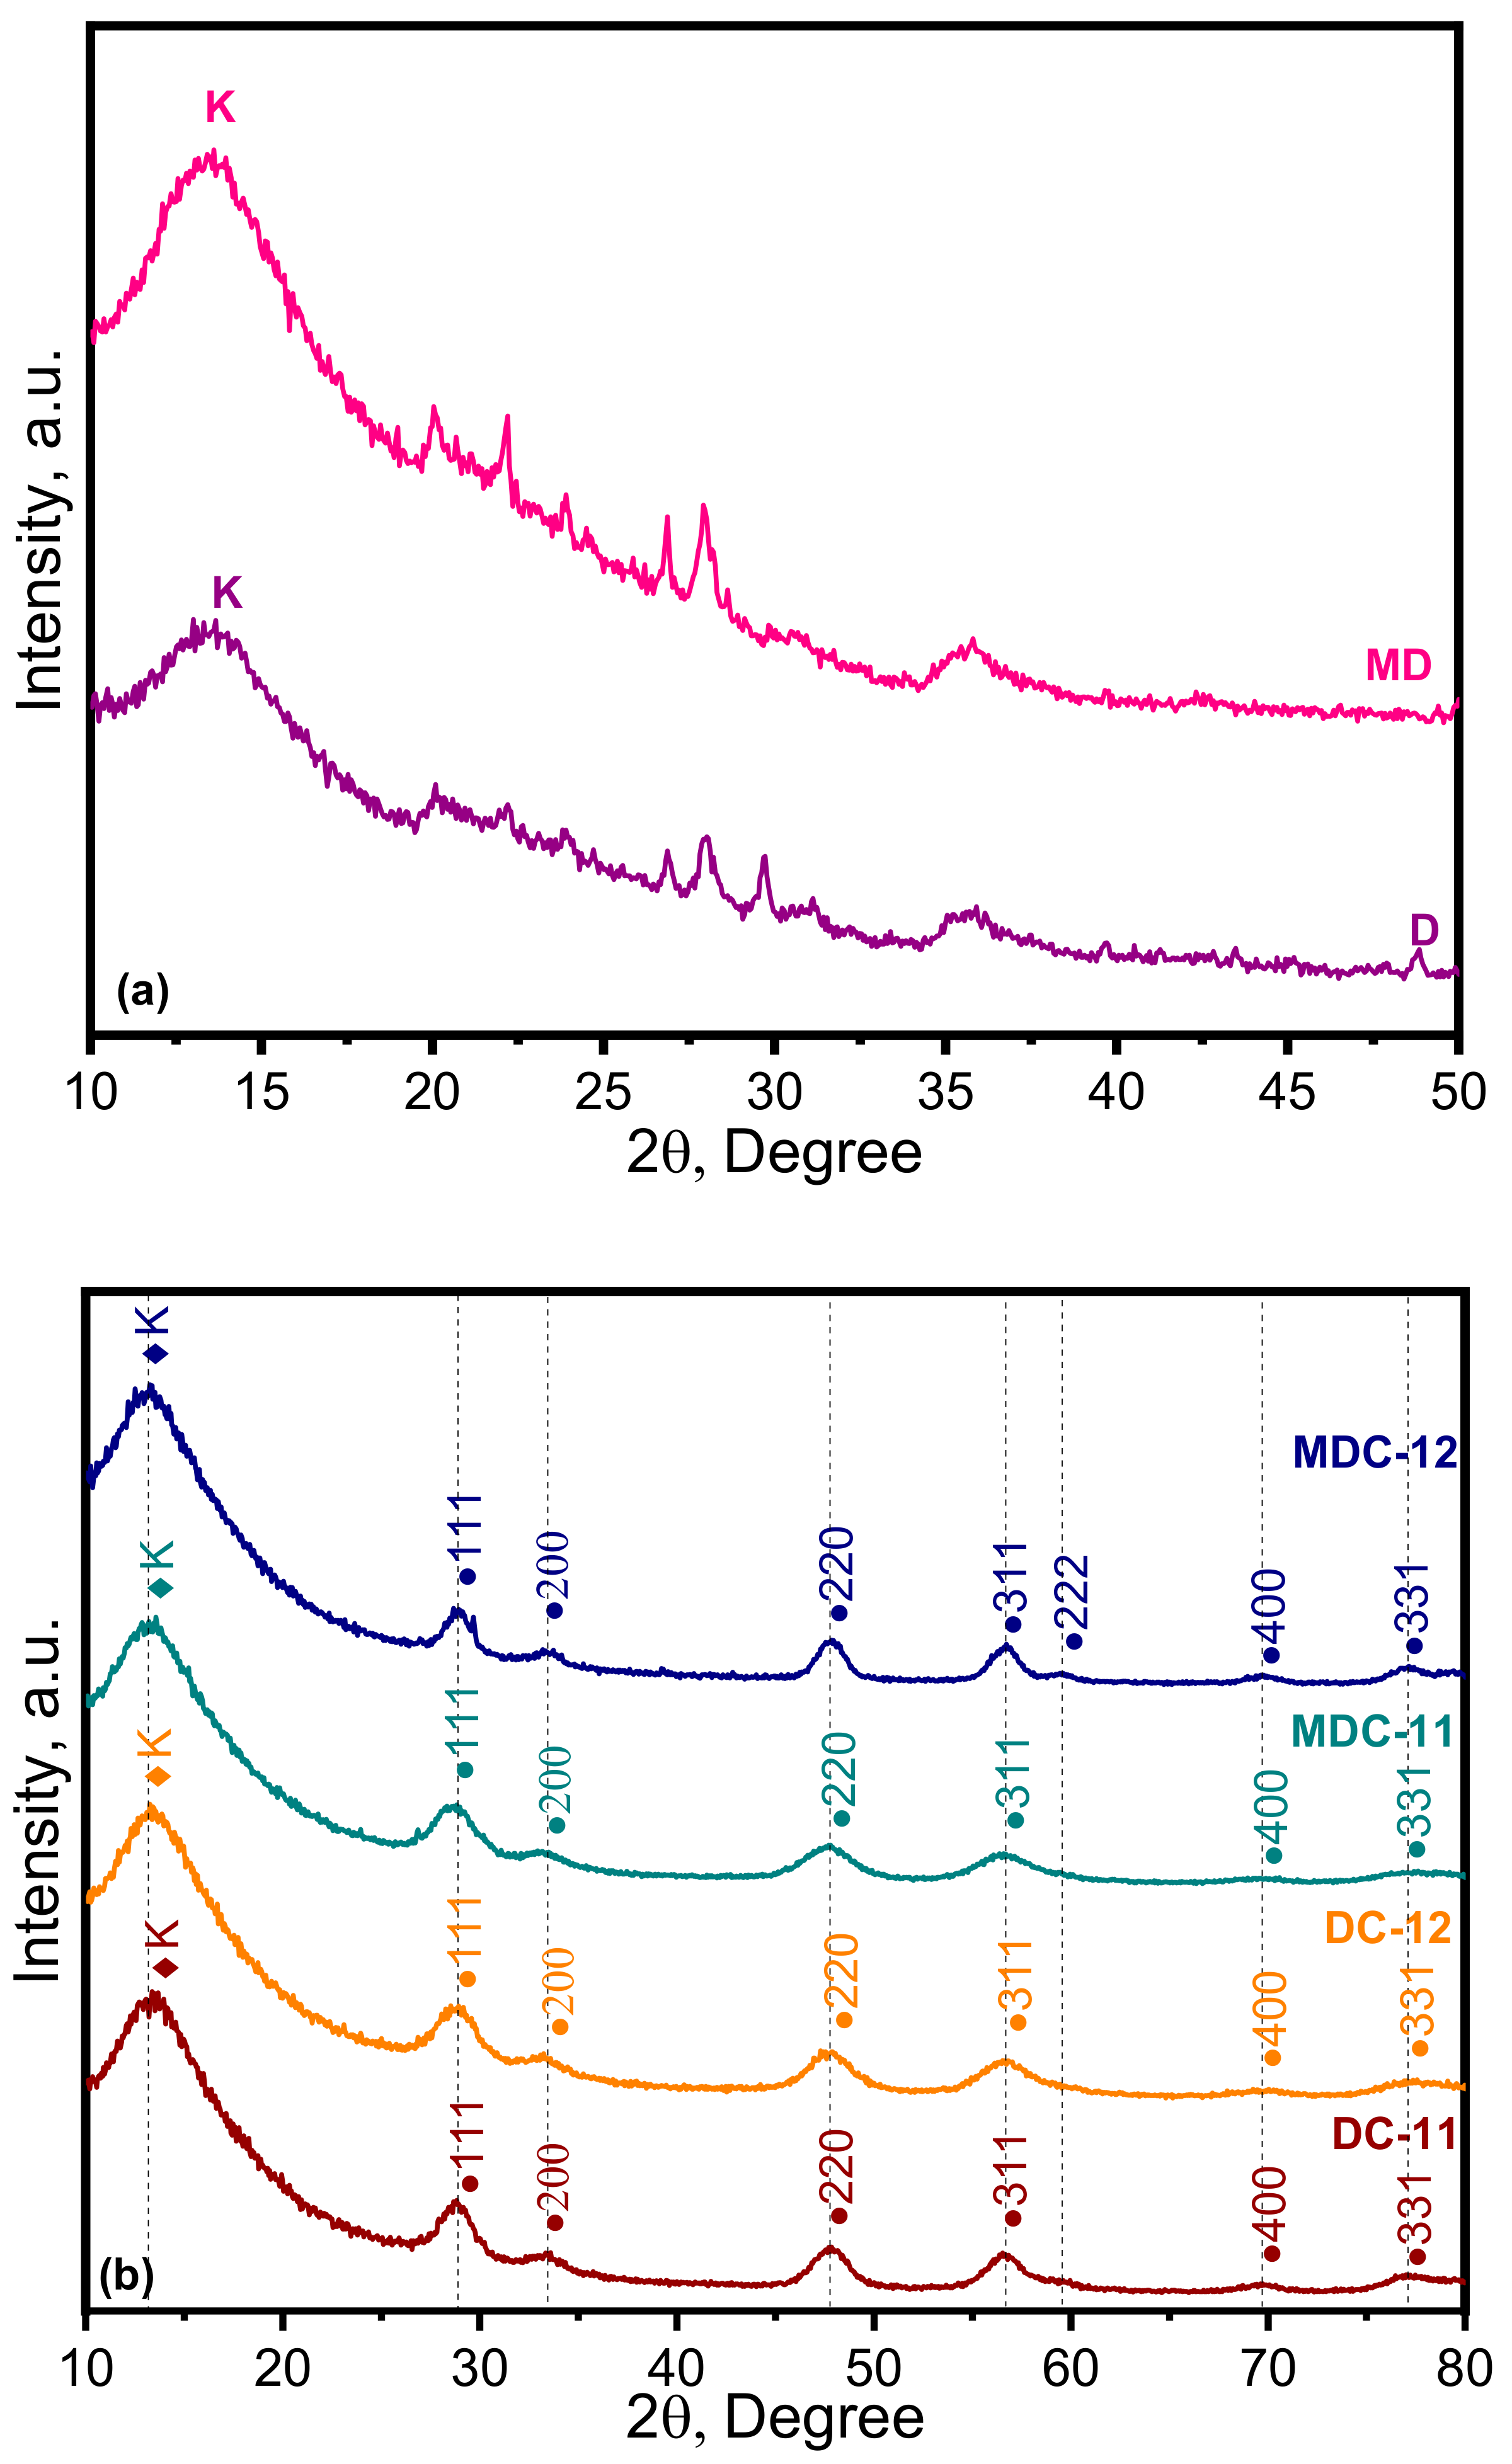
3.1.3. XRD Analysis
XRD analysis was performed to determine the main chemical composition of raw D and MD (Figure 3a). XRD patterns of D exhibited a broad diffraction in the region of 2θ = 20–30°, suggesting the presence of amorphous silica. There was no remarkable alteration in the peak positions of the MD. However, a slight enhancement was observed in the peak intensities, indicating that the acid treatment affected the crystallinity of diatomite.
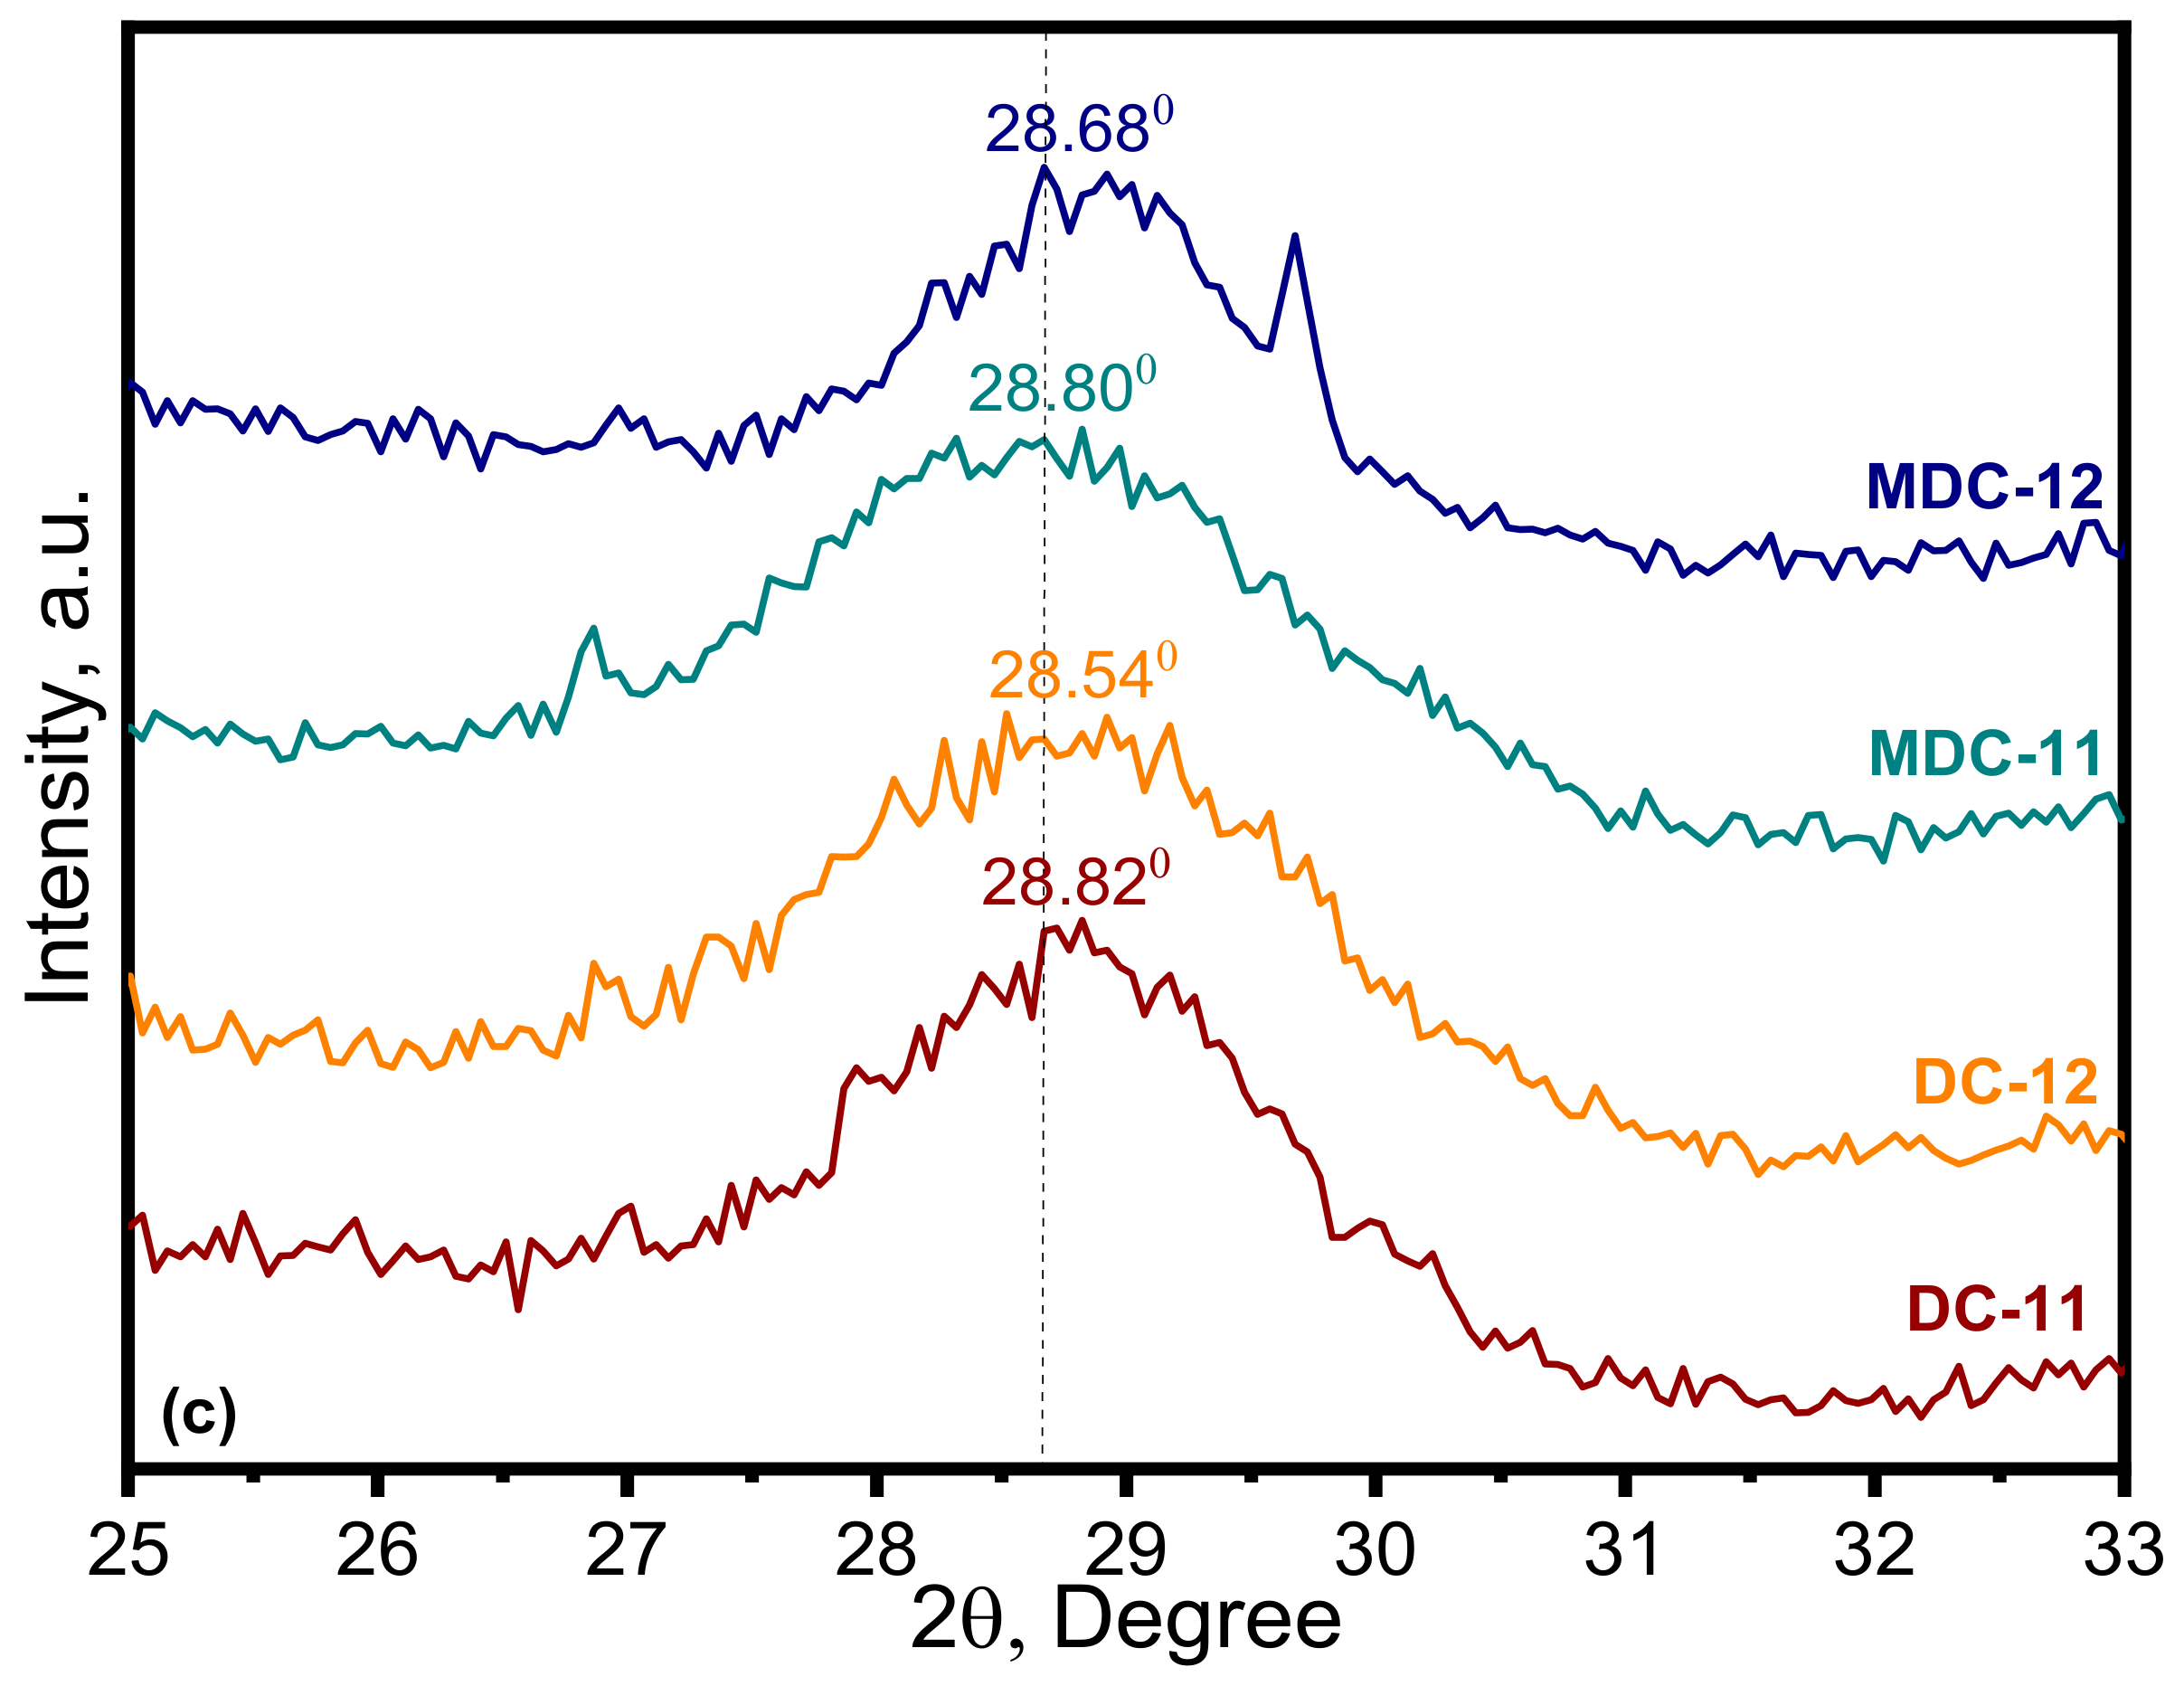
The XRD patterns of CeO2-diatomite composites are shown Figure 3b. The specific diffraction peaks were attributed to CeO2 and D. For MDC-12 composite, 2θ = 28.68°, 33.19°, 47.85°, 56.72°, 59.42°, 69.69°, and 77.12° corresponded to the presence of (111), (200), (220), (311), (222), (400), and (331) planes of CeO2, while the broad diffraction peak at 2θ = 13.23 could be related to the kaolinite-like structure in D. The XRD analysis revealed that CeO2 in composites was consistent with the fluorite-type structure due to the reflection plane of (111) observed at 2θ = 28.68° [64]. The pattern was well-matched with the CeO2 standard card JCPDS NO. 43–1002, as well as with Raman data. The diffraction plane of (222) was not visible for the other three CeO2-diatomite composites. Moreover, there were no extra diffraction peaks related to the formation of new or mixed phases between CeO2 and D. The enlarged (111) diffraction planes of CeO2-diatomite composites were shown in Figure 3c. With increasing amount of D in composites (MDC-11 and MD-11), a gradual 2θ shift towards to higher angles was noted. Compared with DC-12, the diffraction peak of MDC-12 was also shifted to a higher angle due to acid treatment process of D.
The average crystallite sizes (D, nm) of CeO2-diatomite composites were calculated from the peak of the (111) plane of CeO2 using the Scherrer equation (Equation (8)) [65]:
where K = 0.9, λ is the X-ray wavelength (1.5418 Å), θ is the Bragg angle, and β is the full width at half maximum intensity (FWHM, radians).
D = K λ/(β cosθ)
The influence of acid treatment on the crystallite size of CeO2-diatomite composites was also reflected as X-ray line broadening. The diffraction peaks of MDC-12 composite were obviously narrower than those of DC-12 composite, thus indicating a relatively larger crystallite size. Almost equal crystal sizes were calculated as 2.2 and 2.1 nm for DC-11 and MDC-11 composites, respectively. However, the crystallite sizes of CeO2 in DC-12, of 1.9 nm, and MDC-12, of 3.0 nm, displayed an incremental increase, most probably due to the modification of diatomite. This result indicates that the acid treatment affected the crystallite particle sizes of CeO2-diatomite composites as the CeO2 amount was increased.
3.1.4. ESEM Analysis
The ESEM images of D and MD in comparison to CeO2-diatomite composites are presented in Figure 4. An orderly set pore structure in a fold sheet form can be observed in the D image (Figure 4a). The diatom debris grains were arranged dispersedly, resulting in a porous structure [66]. After acid treatment, the morphology was altered, and a more folded sheet form was formed. Moreover, the size of the diatom pores that were clearly visible was increased (Figure 4b). ESEM images of CeO2-diatomite composites revealed an irregularly shaped morphology containing both D and CeO2 particles (Figure 4c–f). The dominant morphology was the porous structure of D for DC-11 composite spreading throughout the composite. It was also clear that a distinctive almost spherical shape of CeO2 particles could be observed [31]. Increasing the CeO2 amount resulted in a decrease in the folded sheets of D in DC-12 composite. With respect to ESEM images of DC-11 and MDC-11 composites, a decrease in both agglomeration and particle size of CeO2 nanoparticles was evident in MDC-11. The pores of D were enlarged, and folded sheets almost disappeared. Similar morphological changes were also observed for DC-12 and MDC-12 composites and the particle size was reduced in the MDC-12 composite. The spherical particles of CeO2 were transformed into various polyhedral particles and MD was deposited onto the particles. The observed variations could be due to the formation of chemical bonds between CeO2 and diatomite with respect to the CeO2 amount in composites.
EDAX spectral elemental composition of D, MD, and corresponding CeO2-diatomite composites are displayed in Figure S1, in Supplementary Materials (SI Part 1, Figure S1a–f). High content of silicium was strongly confirmed by EDAX analyses of D and MD. Si content increased after modification and other elements such as C, O, Na, Mg, Al, Ca, and Fe were also observed. The presence of Cl as detected in the EDAX spectrum of MD could be due to the acid modification of D with HCl treatment. The presence of Ca, Si, and Mg elements could be in the form of CaCO3, silicate, and Mg(OH)2 sediments, as already reported in the materials section (Section 2.1) [67]. More importantly, EDAX spectra (Figure S1c–f) showed that the as-prepared composites were mainly composed of Si, Ce, and O elements.
3.1.5. BET Analysis
BET nitrogen adsorption/desorption isotherms and BJH pore-size distribution curves of D, MD, and representative CeO2-diatomite composites are shown in SI Part 1, Figures S2 and S3. Average pore diameter (d), pore volume (Vp), and specific surface area (SBET) are summarized in Table 1. The nitrogen adsorption/desorption isotherms of D and MD exhibited a type II sorption behavior with an H3 hysteresis loop according to the International Union of Pure and Applied Chemistry (IUPAC) classification [68]. It was clear that the D and MD revealed the same form of isotherms and hysteresis loop. The H3 hysteresis loop was principally related with the filling and emptying of the mesopores by capillary condensation, suggesting that the pores were mostly narrow and slit-shaped, and their sizes were not well-proportioned [69,70]. In addition, the adsorption isotherm curves were significantly increased with the relatively moderate pressure, signifying a gradual pore diameter enhancement. However, acid treatment resulted in a slight enhancement in nitrogen adsorption, indicating that the overflow possessed a higher SBET. It is well-known that acid modification of D leads to an increase in surface area and adsorption capacity [71,72,73,74,75]. The reason for this could be the elimination of minor impurities responsible of pore blockage via acid treatment [73].
The adsorption-desorption isotherms of CeO2-diatomite composites were classified as type IV with an H3 hysteresis loop, implying a typical unfilled mesoporous structure. However, MDC-12 composite corresponded to a typical IV adsorption isotherm with an H2 hysteresis loop due to the existence of the pore blockage or seepage [68] (SI Part 1, Figure S2).
The pore-size distribution curves based on the pore volumes of the BJH adsorption are shown in SI Part 1, Figure S3. A heterogeneous distribution of pore diameters smaller than 40 nm was evidenced for D. The DC-11, DC-12, and MDC-11 composites exhibited narrow pore-size distributions with average pore diameters of 3.82, 2.29, and 1.73 nm, respectively.
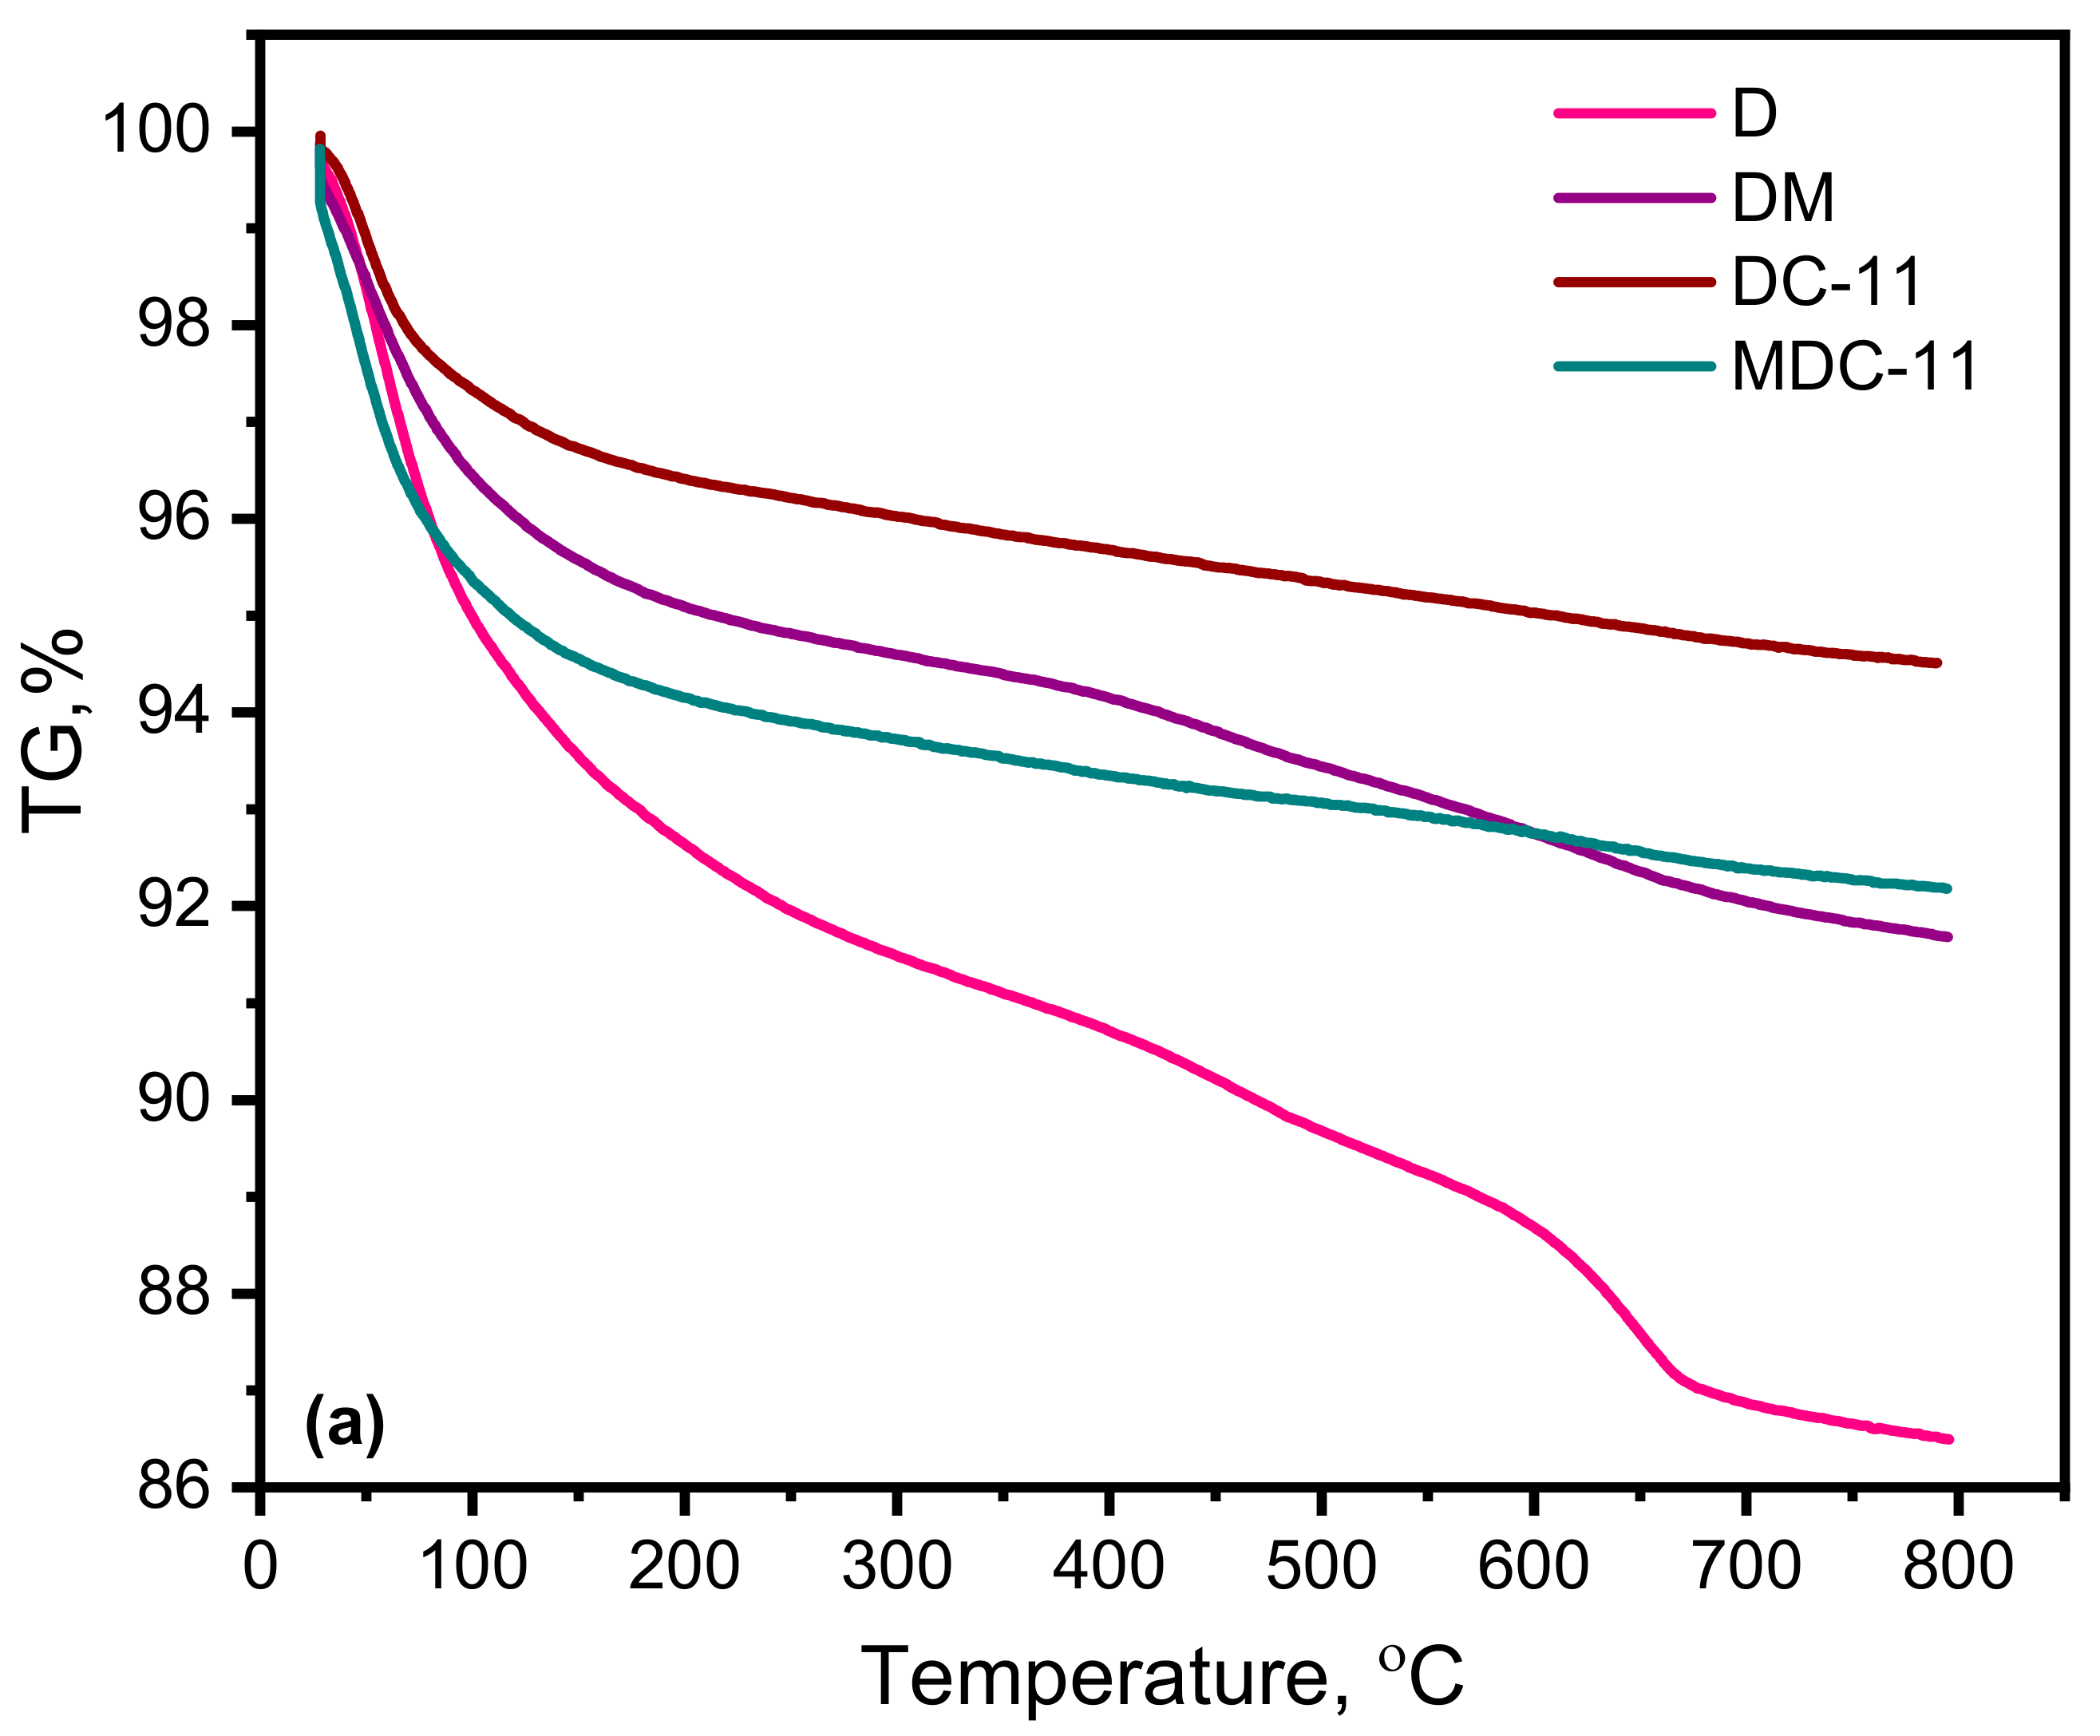
3.1.6. Thermal Analysis
The thermal stability of D and MD and respective DC-11 and MDC-11 composites were determined by TG and DTG analysis (Figure 5a,b). D and MD exhibited three weight-loss steps. The first step of TG curves in the low temperature range of 30–300 °C was attributed to the loss of adsorbed water [76]. The weight loss obtained in this step was 8.5% and 5.4% for D and MD, respectively. The observed peaks at 79 °C (D) and 58 °C (MD) in DTG curves indicated the dehydration process. The second weight loss of D in the temperature range of 350–530 °C with DTG peak was at 458 °C. This MD peak corresponding to condensation of hydroxyl groups, and the dehydroxylation process was slightly shifted to 453 °C [76,77]. The final step was related to the dehydroxylation due to the loss of OH groups surrounding the Al(VI) atom [78]. A similar DTG peak at ~600 °C was observed for M, MD, and corresponding composites (Figure 5b). The dehydration of adsorbed H2O and dehydroxylation were also observed in TG curves of composites. The total weight loss was 13.2%, 8.02%, 5.31%, and 7.94% for D, MD, DC-11, and MDC-11, respectively.
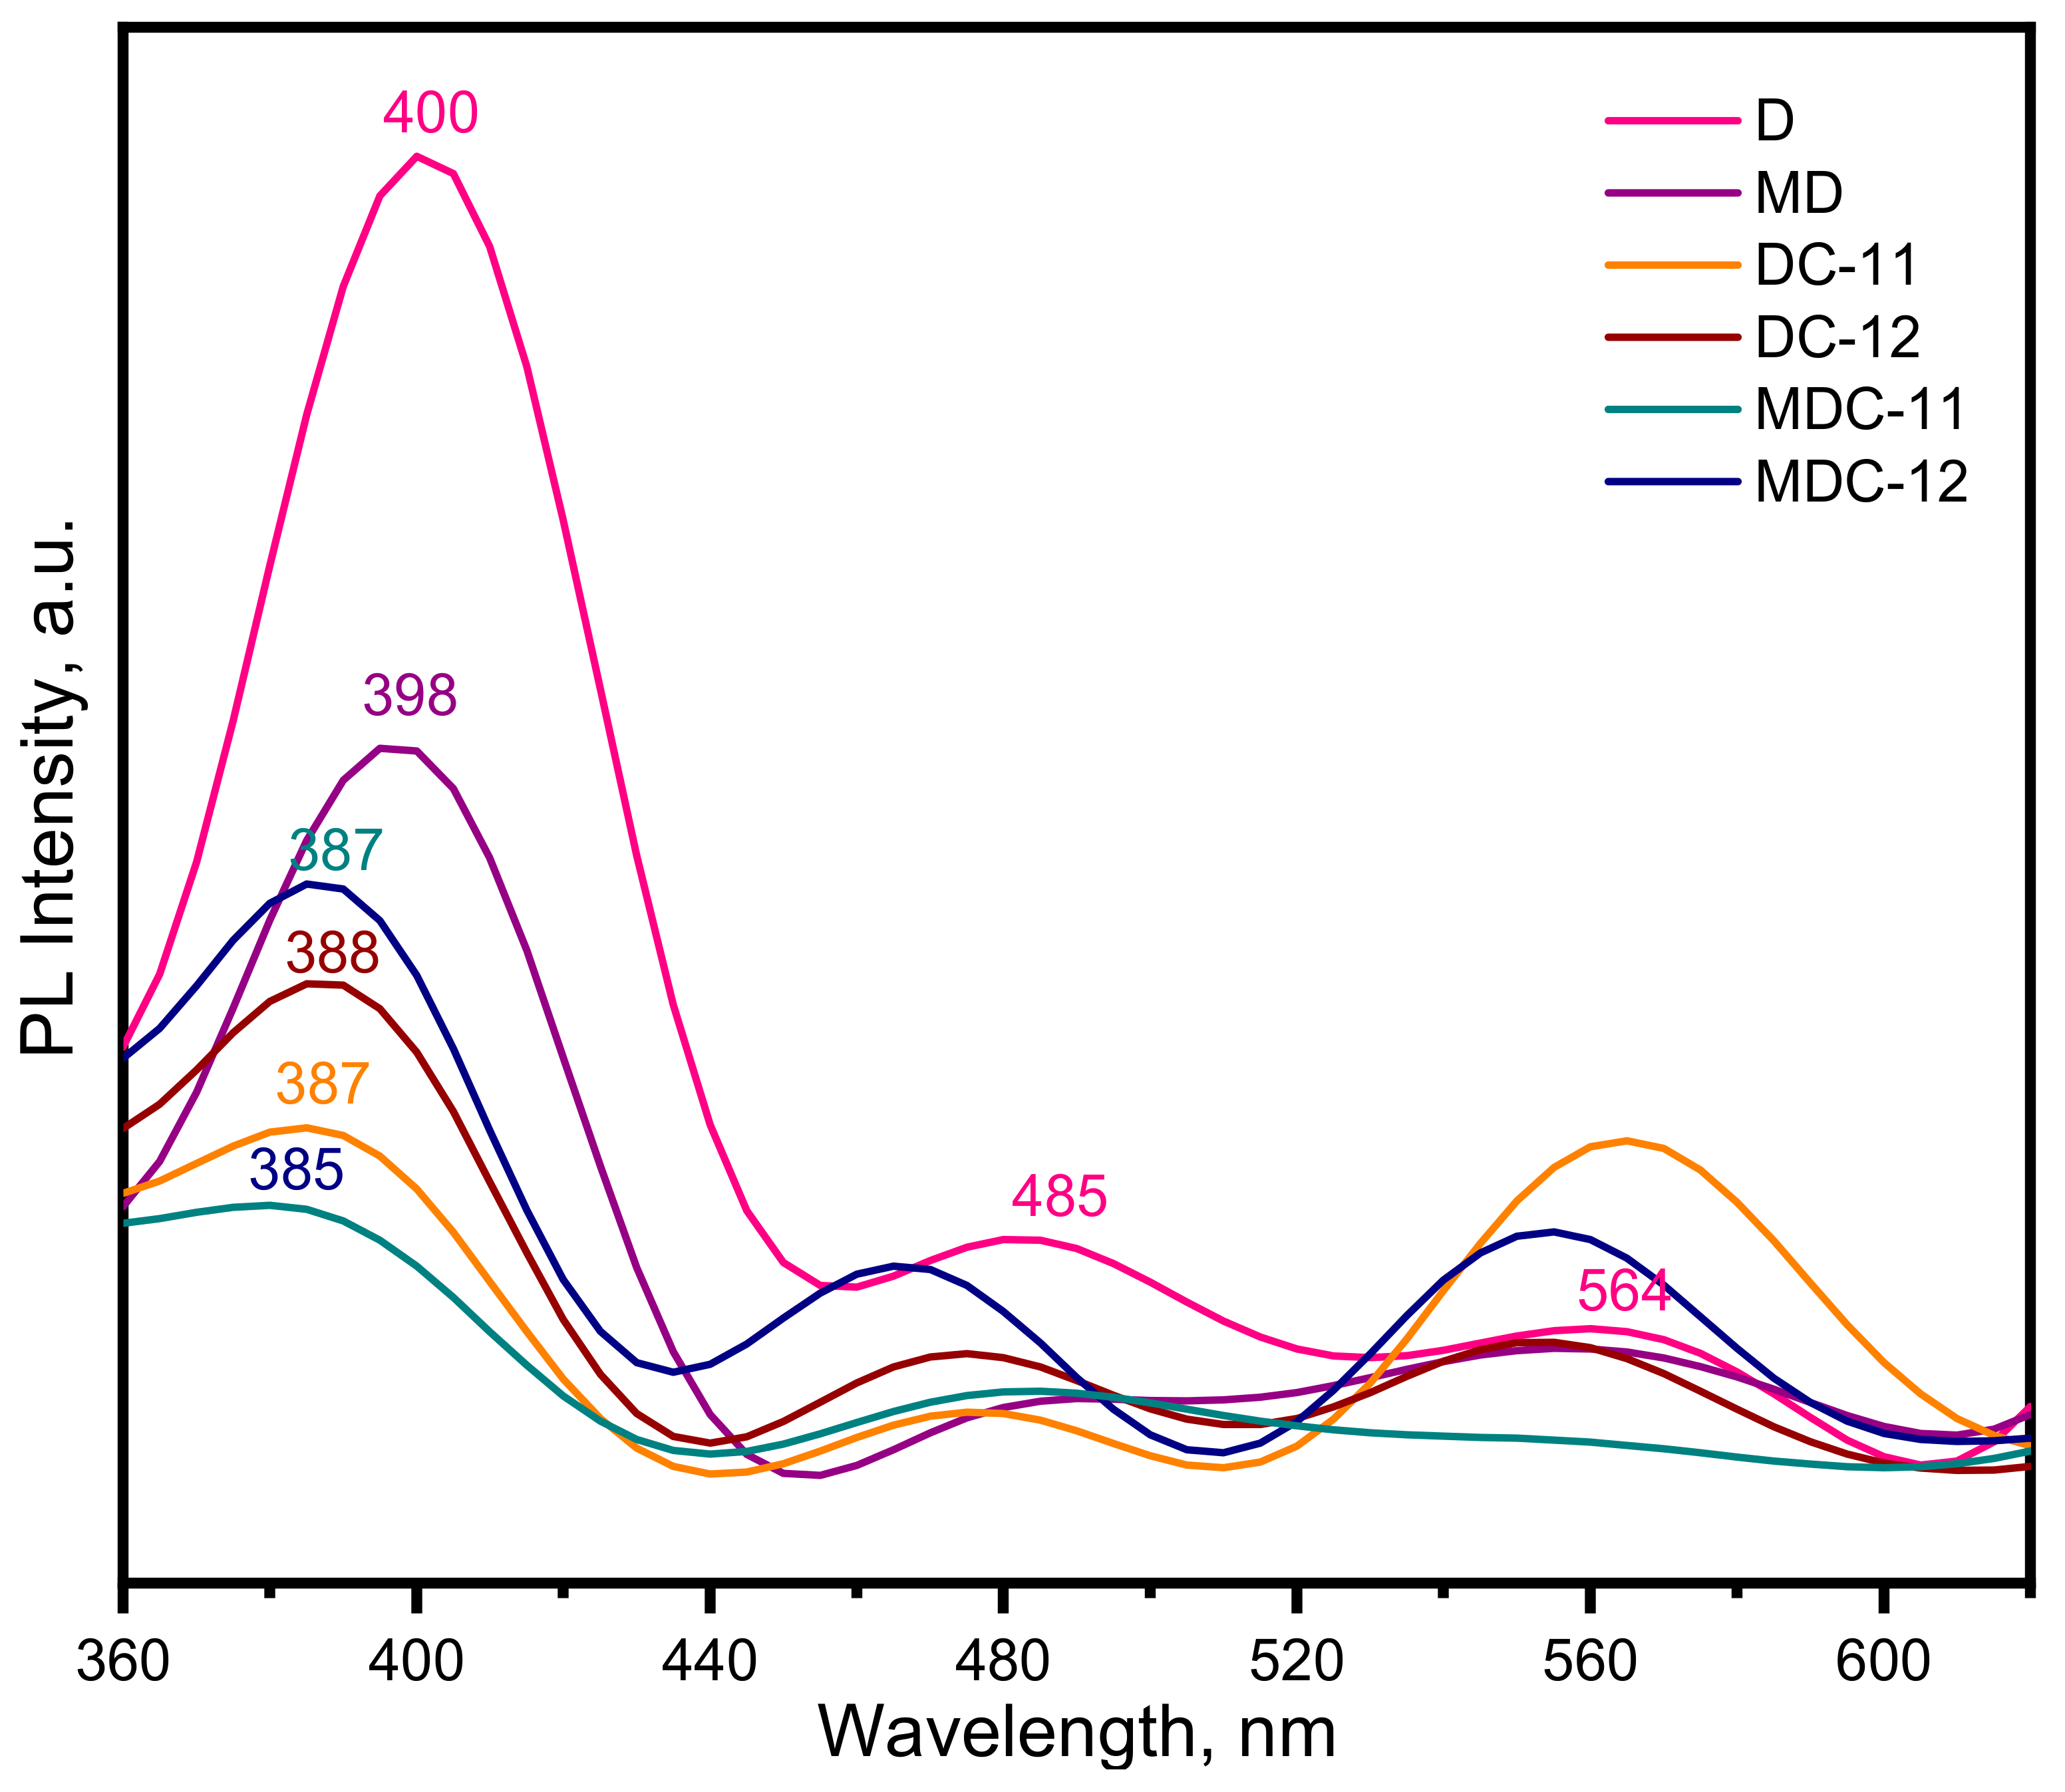
3.1.7. PL Analysis
Diatomites were composed of surfaces rich in reactive silanol (Si–OH) groups [79,80,81]. Figure 6 reveals PL spectra of D, MD, and CeO2-composites. The PL spectrum of D exhibited three main peaks at 400 nm (3.01 eV), 485 nm (2.56 eV), and 564 nm (2.20 eV), while three peaks belonging to MD were located at 398 nm (3.12 eV), 482 nm (2.57 eV), and 560 nm (2.21 eV) [82]. It was demonstrated that the origin of visible emission in the blue and green regions was related to the different defect states, such as oxygen defect centers, indicating non-bridging oxygen hole centers or neutral oxygen vacancy and self-trapped excitons [80]. The broad peaks appeared at three main regions of 365–435 nm, 450–505 nm, and 520–600 nm in the PL spectra of composites with different CeO2 amounts. The observed peaks in PL spectra could belong to the characteristic peaks of CeO2 or D that were also observed in CeO2-diatomite composites with a blue shift. DC-11 composite showed a strong violet/blue light emission peak at 387 nm (3.20 eV), which corresponded to the band-edge free exciton luminescence. The blue-green region of visible range at 467 nm (2.66 eV) was the bound exciton luminescence. The third emission peak was observed at 564 nm (2.20 eV) in the green visible region [83,84]. The emission peaks in the range of 400–500 nm corresponded to the different defect levels between the localized Ce 4f0 state and O 2p valence band [83,85]. PL emission is useful to understand the recombination possibility of excited electrons and holes in photocatalyst. In general, a lower PL intensity indicates a lower recombination rate of electron and hole pairs. Furthermore, an intense PL intensity reveals a higher number of defects and/or oxygen vacancies. The observed PL intensity trend with the CeO2 amount in CeO2-diatomite composites was nonlinear. The reason for this could be particle size, recombination, and presence of defects [23,70,84].
3.1.8. Zeta Potential Analysis
pH-dependent variations in zeta potential (ζ, mV), as an efficient tool denoting the surface charge, are shown in SI Part 1, Figure S4. It was obvious that the zeta potentials of D and MD had negative magnitudes in the pH range of pH = 2–12. The surface of MD was remarkably more negatively charged throughout the pH range compared to D, indicating the presence of a higher number of functional groups. The zeta potentials were dominantly negative in a wide pH range, excluding the presence of any isoelectric potential (IEP) representing pH of zero-point charge (pHpzc) [86]. This result implies the independent pH behavior of D and MD particles. Moreover, the monitored permanent negative charge could be related to the existence of substituted isomorphous alumino-silicate structure, and this observation was consistent with the chemical/mineralogical composition of D [87,88]. Similar results were also reported indicating the absence of IEP [76,89]. In contrast, in several studies, IEP of diatomite was measured as pHpzc = 2 [90,91]. The reason for this could be related to the structure of the diatomite types that contained different minerals, with various ratios correlating with the zeta potential analyzed. The pHpzc values of DC-11, DC-12, MDC-11, and MDC-12 composites were 6.07, 4.57, 5.38, and 5.28, respectively. The results indicate that no remarkable effect of different CeO2 contents was noticed on the surface charges of the MDC-11 and MDC-12 composites. The reason for this could be the favorable attraction between the positive charge of CeO2 (pHpzc = ~7) and negative charge of MD [23].
3.2. Assessment of Photocatalytic Activity
3.2.1. Preliminary Experiments
The UV-vis absorption spectra of MB revealed four absorption peaks. An intense absorption peak at λmax = 664 nm (A664) assigned to MB monomer with a shoulder peak at λ = 612 nm attributed to MB dimer were composed of a sulfur–nitrogen conjugated system expressing the chromophore groups of MB. The two other observed peaks at λ = 292 nm (A292) and λ = 246 nm (A246) were related to the substituted benzene rings, namely, the phenothiazine unit in MB structure [3]. Photocatalytic degradation of MB was expressed by descriptive parameters such as A664, A292, and A246.
The preliminary experiments displayed direct photolysis of MB and surface interactions, revealing MB adsorption onto CeO2-diatomite composites. As a representative parameter of MB, A664 was used unless otherwise stated [92].
Variations in UV-vis spectral features of MB under irradiation due to direct photodegradation were formerly reported by Turkten and colleagues [19]. Accordingly, direct photodegradation of MB was extremely slow due to the non-overlapping trend of UV-vis absorption spectra with the BLF lamp emission spectra.
The effect of pre-contact time prior to initiation of light exposure was determined under dark conditions. D and DC-11 composite (0.25 g/L) were chosen as representative basic specimens and adsorption of MB (5 mg/L) was investigated for a range of contact time (t = 0–8 h). The initial adsorption amount was determined as ~20%, as related to the prevailing interactions between the negatively charged surface of the specimens and cationic dye MB [93]. Slight variations (±10%) were attained during the whole period of dark interactions. Fundamentally, the extent of initial adsorption should sufficiently disclose the free surface area for light absorption required for the initiation of the photocatalytic reaction. Therefore, as an initial dark contact time, 30 min was chosen for photocatalytic treatment of MB using all specimens.
3.2.2. Photocatalytic Degradation of MB using CeO2-Diatomite Composites
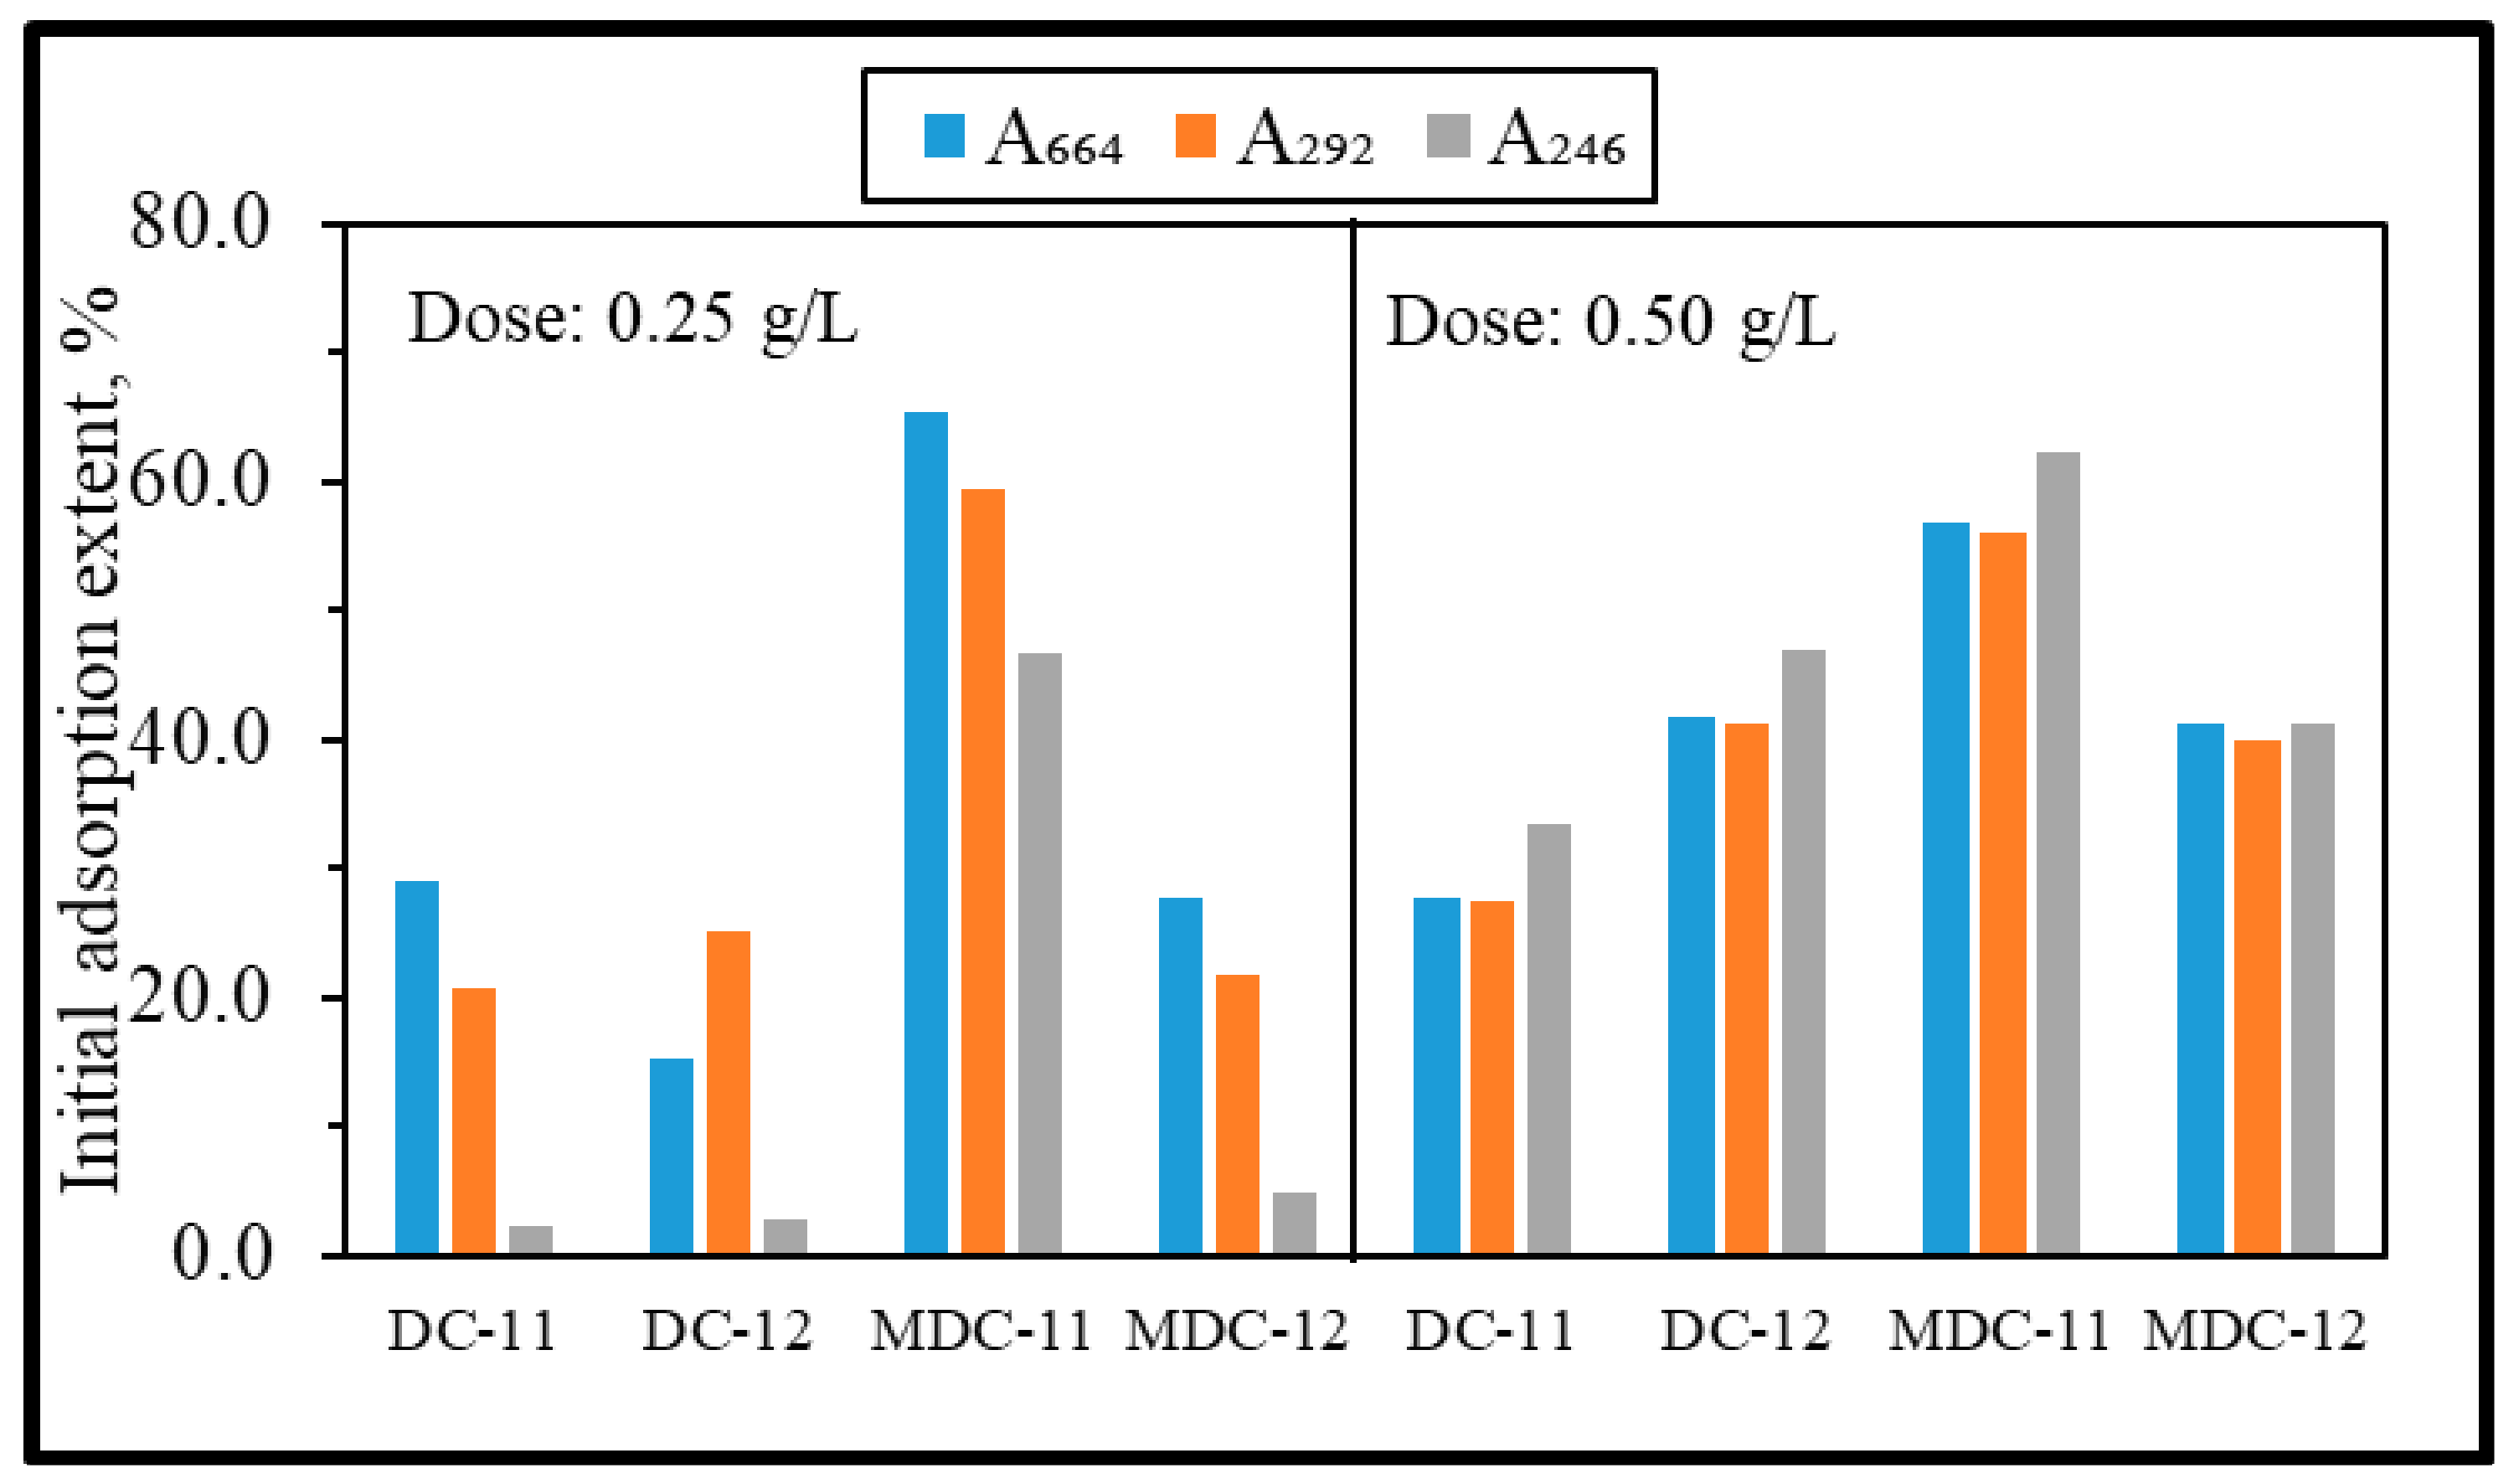
The photocatalytic degradation of MB was studied using CeO2-diatomite composites using two different doses (0.25 and 0.50 g/L). As an effective constraint of the surface-oriented nature of photocatalysis prior to initiation of light exposure, the dose-dependent initial dark adsorption extents of all descriptive parameters are presented in Figure 7.
From a general perspective, coverage of MB onto composites increased with respect to increasing dose for the MDC-11 specimen. Upon use of the lower dose of 0.25 g/L, all descriptive parameters displayed a consistently decreasing trend, irrespective of the composite type. However, for the higher dose of 0.50 g/L, all descriptive parameters displayed similar roles towards the surface of the photocatalyst specimens. The MDC-11 specimen expressed a remarkably different trend as evidenced by the highest surface interaction, most probably due to the counter-balancing effect related to the equal compositional ratio of MD to CeO2.
Upon initiation of irradiation, during the whole duration of photocatalysis (up to 300 min), UV-vis spectral features of MB were followed, as shown in SI Part II, Figure S5 and Figure S6. The gradual decrement in the A664 peak during photocatalysis implied that the sulfur–nitrogen conjugated system was degraded. A blue shift was noticed due to the prolonged exposure of UVA illumination. This result indicated a probable route of N-demethylated degradation of MB derivatives [19,94,95]. A similar progressively decreasing trend in A292 and A246 was also recorded. This outcome indicated the occurrence of oxidative destruction of MB, resulting in a ring-opening reaction of the phenothiazine species. The absence of new peaks suggested that there was no formation of new intermediates converted from the destroyed phenothiazine structure of MB [94,96]. At 300 min of irradiation, all descriptive parameters were diminished and almost a complete disappearance of the A612 was found upon use of the MDC-11 composite. This could be ascribed to the cleavage of benzene rings and the heteropoly aromatic linkage due to the degradation of MB.
The photocatalytic degradation of MB in the presence of the prepared CeO2-diatomite composites followed the pseudo-first-order rate model expressed by Equation (9):
where R is the pseudo-first-order rate (cm−1min−1); Ao is the initial absorbance of MB expressed as A664,o, A292,o and A246,o; A is the absorbance of MB expressed as A664, A292, and A246 at time t; t is the irradiation time (min); and k is the pseudo-first-order reaction rate constant (min−1). All UV-vis parameters, i.e., A664, A292, and A246, exhibited logarithmic decay profiles, revealing kinetic model parameters as presented in Table 2.
Rate (R) = −dA/dt = kA
The MDC-11 composite expressed the highest decolorization rate constant upon use of two different doses, and thus the highest photocatalytic activity. The reason for this could be the larger specific surface area of the MDC-11 composite (SBET = 127 m2/g), providing more available active sites, and hence favorable for the fast adsorption of MB, resulting in a high photocatalytic activity [97].
The photocatalytic degradation rate constants of CeO2-diatomite composites using a 0.25 g/L photocatalyst dose can be presented in decreasing order as:
A664: MDC-11 > DC-12 > MDC-12 > DC-11
A292: MDC-11 = DC-12 > MDC-12 > DC-11
A246: MDC-11 > DC-12 > MDC-12 > DC-11
Upon use of a 0.50 g/L photocatalyst dose, the trend in photocatalytic degradation rate constants can be given in the following order as:
A664: MDC-11 > DC-12 > DC-11 > MDC-12
A292: DC-12 > MDC-11 > DC-11 > MDC-12
A246: MDC-11 > DC-12 > DC-11 > MDC-12
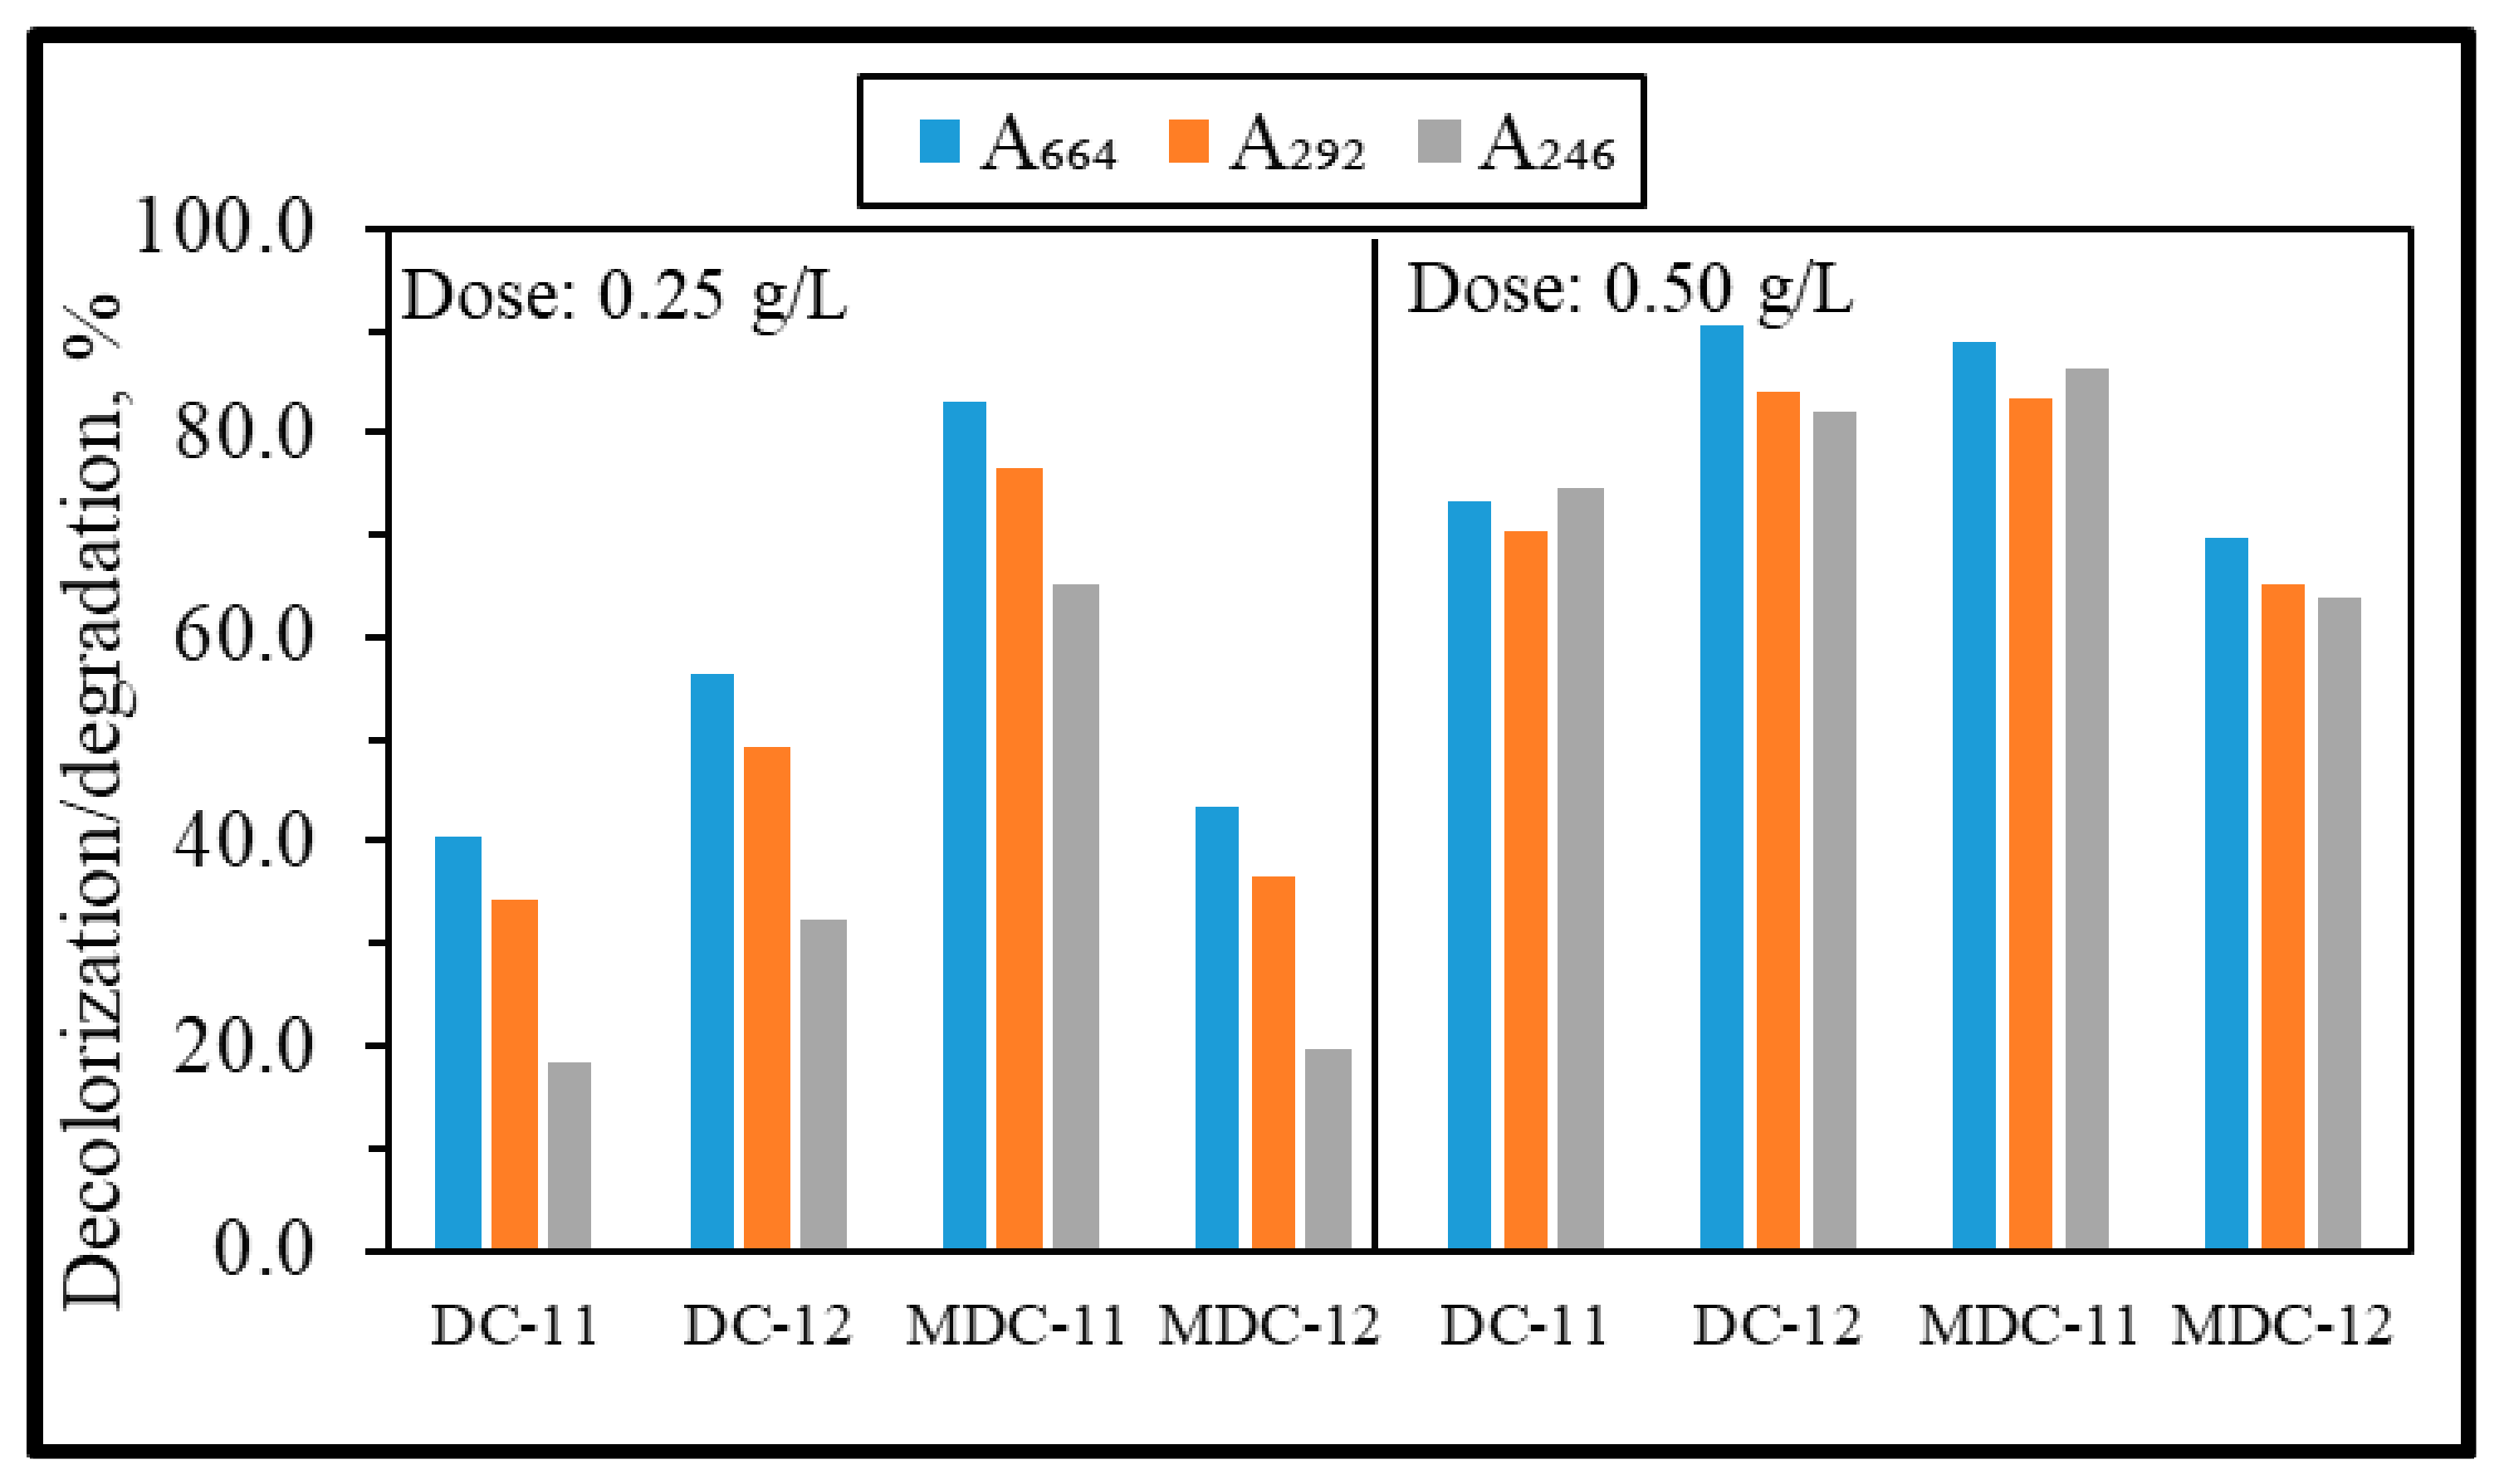
The degree of MB decolorization/degradation using CeO2-diatomite composites, as presented in Figure 8, was also calculated by the represented Equations (10)–(12):
Decolorization664, % = ((A664,o − A664)/A664,o)) × 100
Degradation292, % = ((A292,o − A292)/A292,o)) × 100
Degradation246, % = ((A246,o − A246)/A246,o)) × 100
The degree of MB decolorization/degradation using 0.25 g/L of CeO2-diatomite composites for an irradiation period of 120 min can be presented in a decreasing order as:
A664: MDC-11 > DC-12 > MDC-12 > DC-11
A292: MDC-11 > DC-12 > MDC-12 > DC-11
A246: MDC-11 > DC-12 > MDC-12 > DC-11
The degree of MB decolorization/degradation using 0.50 g/L of CeO2-diatomite composites for an irradiation period of 120 min can be presented in the following order as:
A664: DC-12 > MDC-11 > DC-11 > MDC-12
A292: DC-12 > MDC-11 > DC-11 > MDC-12
A246: MDC-11 > DC-12 > DC-11 > MDC-12
Upon use of 0.25 g/L, the effect of diatomite modification was found to be more pronounced for DC-11 and MDC-11 specimens. The lowest decolorization/degradation efficiency attained for DC-11 can be expressed by the folded diatomite structure (Figure 4a) with a high agglomeration resulting in a negative effect on the photocatalytic efficiency [98].
An increased CeO2 ratio resulted in a retardation effect, as observed for DC-12 and MDC-12; the reason of this could be the lower surface coverage related to the surface morphological properties (Table 1, Figure 7). However, the presence of a higher photocatalyst dose (0.50 g/L) resulted in a pronounced effect due to both diatomite modification and CeO2 content, as well as the available surface area (Figure 8).
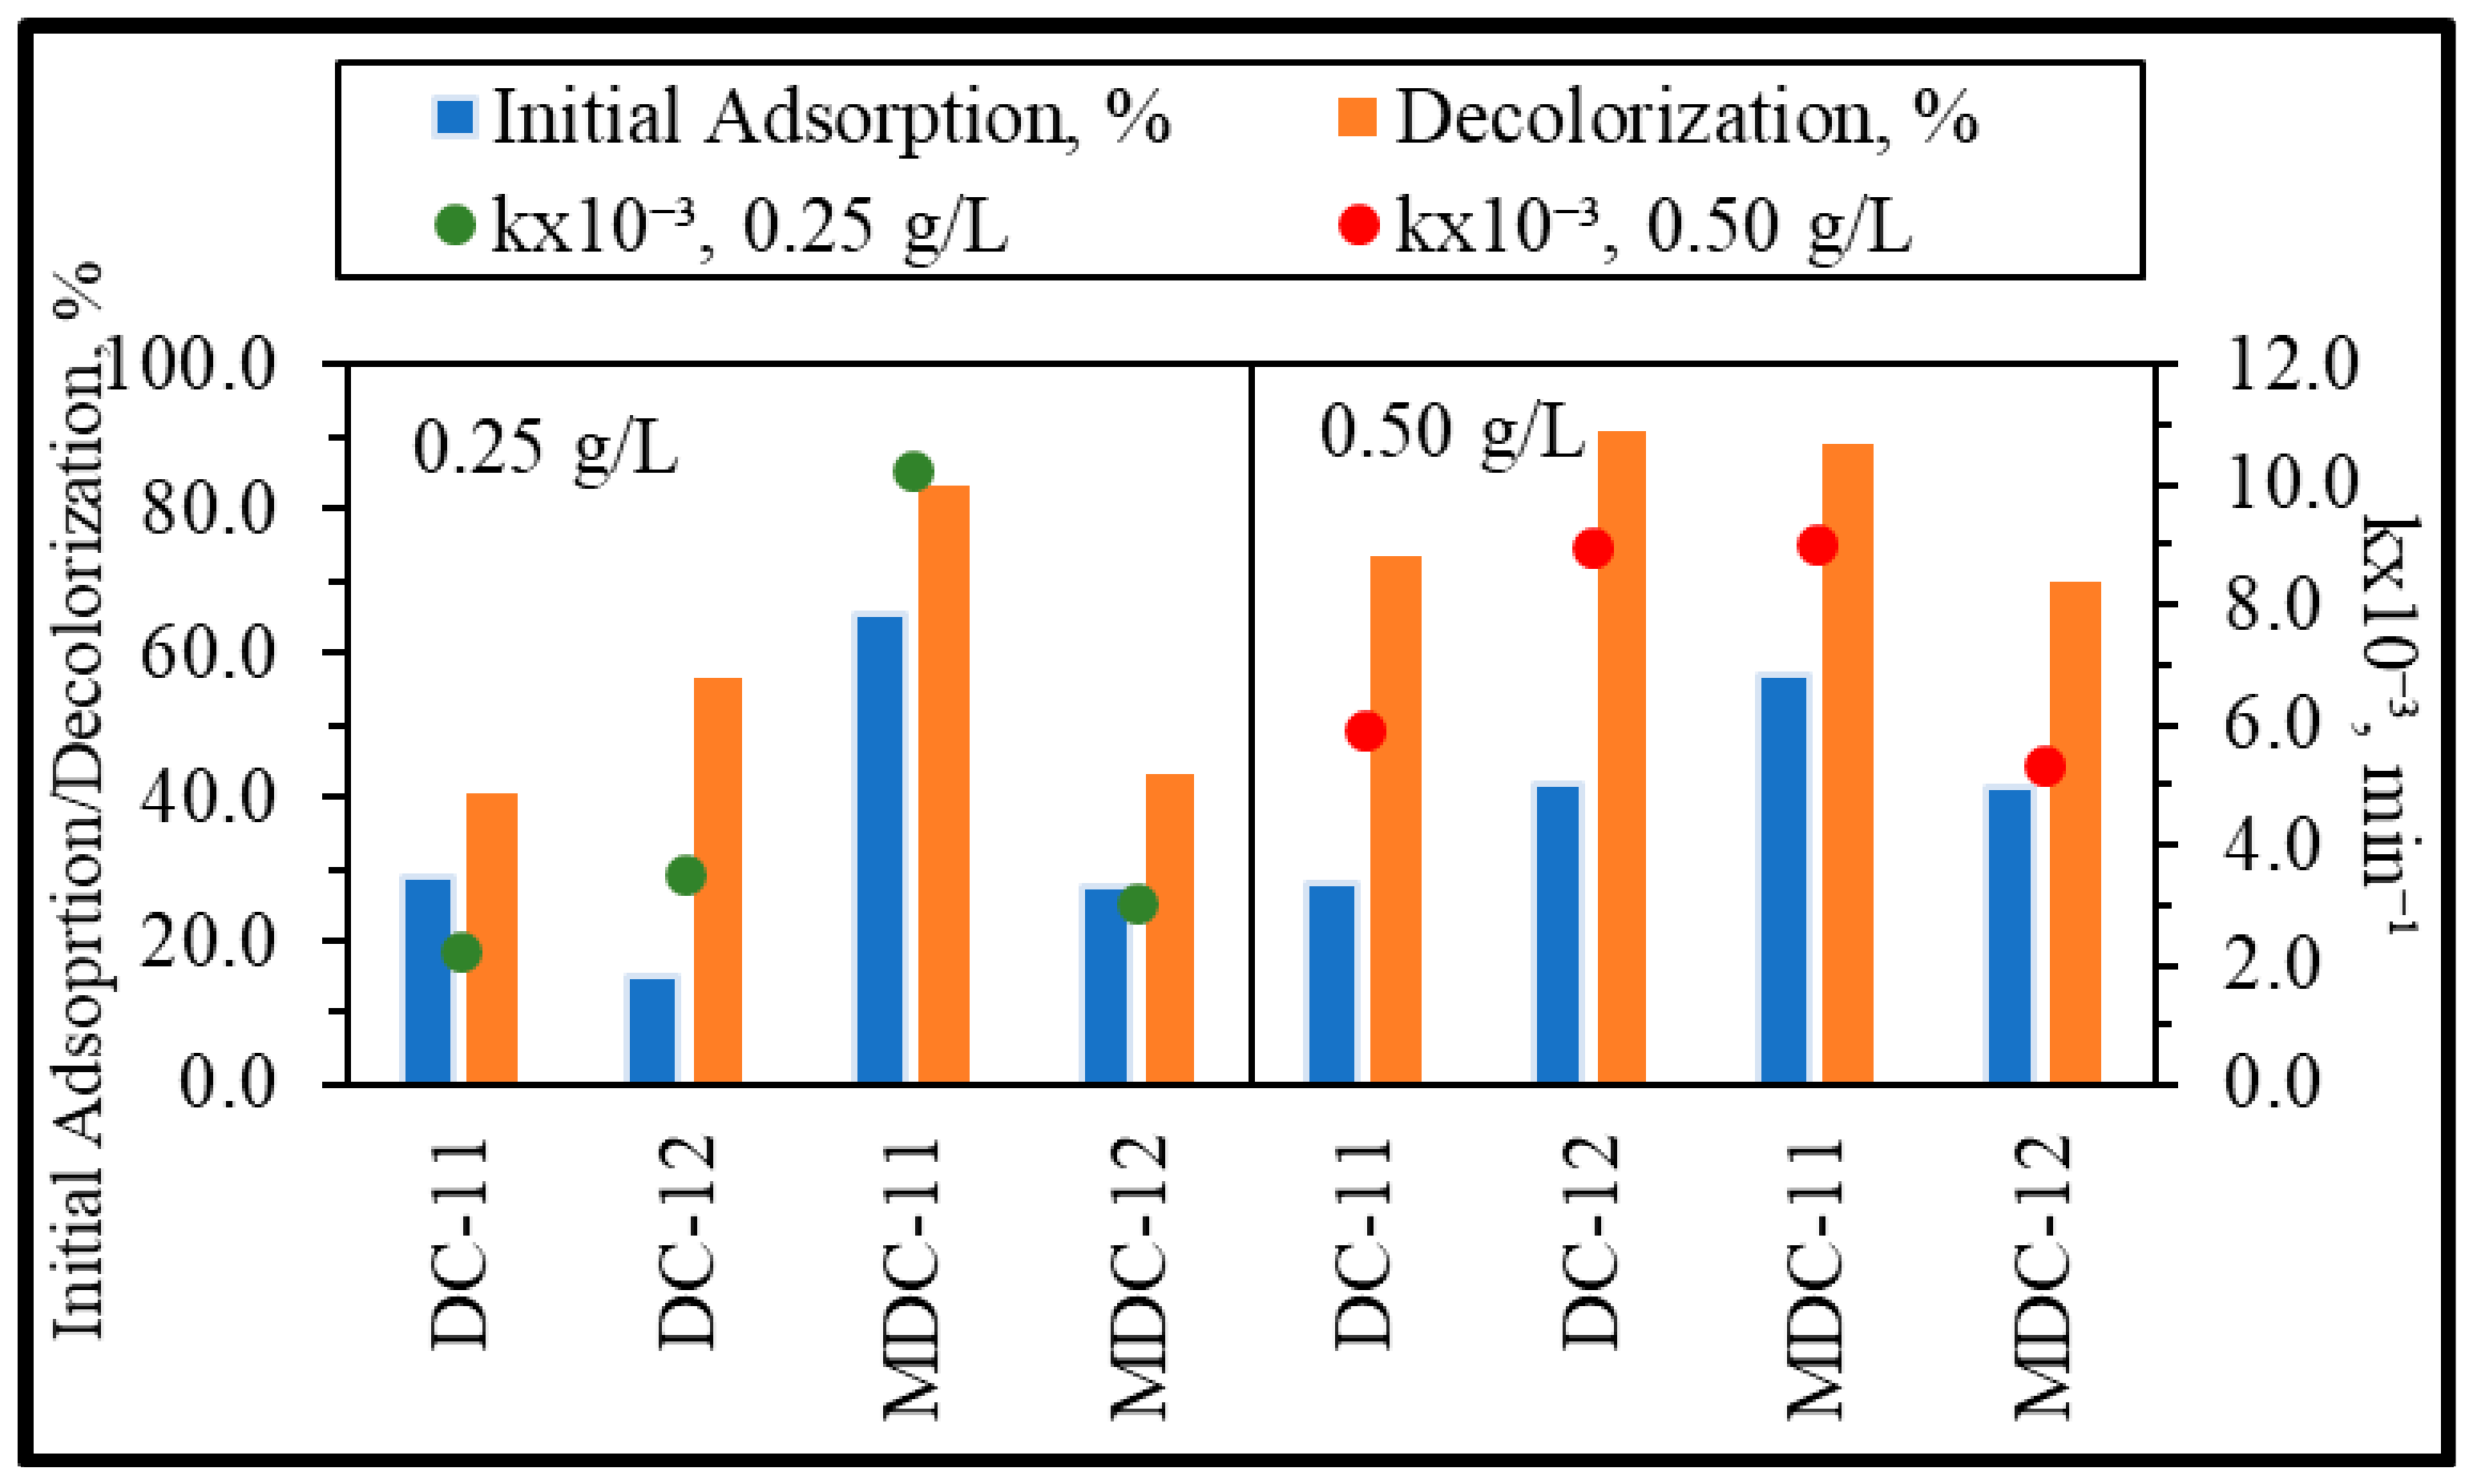
For simplicity purposes, as an indicative parameter of MB, A664 was selected for comparative presentation of kinetics and removal of MB upon use of all photocatalyst specimens (Figure 9).
As can be visualized, upon use of 0.25 g/L, first-order rate constants revealed an inconsistent relationship with surface coverage extents, whereas decolorization efficiencies represented a close resemblance irrespective of the photocatalyst type. The highest rate constant of MDC-11 could not be directly correlated with the surface coverage extent, although decolorization efficiency was found to be in good order. On the other hand, upon use of 0.50 g/L, first-order rate constants indicated differing tendencies with respect to initial adsorption extents; however, they displayed similarity to the observed decolorization efficiencies. Increasing the photocatalyst dose substantially increased degradation rates, especially in the MDC-11 specimen, which could be related to the degradation mechanism resulting in co-operating adsorption based on Langmuir–Hinshelwood kinetics and, in solution, operating in the Eley–Rideal kinetic model.
It should be emphasized that photocatalytic degradation of methylene blue should be followed by all descriptive spectroscopic parameters rather than sole decolorization (A664) due to hydroxylation leading to the aromatic ring opening [92].
4. Conclusions
CeO2-composites were prepared by a simple precipitation method using diatomite and modified diatomite as representative silica sources. The effect of acid treatment resulted in CeO2-composites having different morphological, structural, optical, and thermal features. The application pretreatment of diatomite not only led to the formation of a less-agglomerated folded sheet structure, but also enhanced the surface area and porosity of MDC-11 composite compared to DC-11 composite. The presence of the FTIR bands belonging to the Ce–O–Ce vibration bond and silica groups confirmed the coupled binary system of CeO2 and SiO2 in composites. The XRD and Raman analysis indicated that CeO2 resembled a fluorite-type structure in the composites. The average crystallite sizes of CeO2 in the composites determined through Scherrer’s equation were in the range of 1.9–3.0 nm. The thermal behavior of the composites was related to the dehydration of adsorbed water and dihydroxylation.
The photocatalytic activity of the prepared CeO2-diatomite composites was examined through the degradation of MB, represented by three descriptive absorbances, i.e., A664, A292, and A246. The highest photocatalytic efficiency of MB was obtained using the MDC-11 composite due to the high surface area of 127 m2/g, resulting in enhanced surface contact between MB and the composite.
This study originally described a systematic comparison effect of acid treatment of diatomite on the preparation of CeO2-diatomite composites, as well as photocatalytic activities. Based on the attained results using MB as the substrate, CeO2-diatomite composites could be a promising new affordable and low-cost candidate for photocatalytic applications.
Supplementary Materials
The following supporting information can be downloaded at: https://www.mdpi.com/article/10.3390/w14213373/s1, Figure S1: EDAX spectra of (a) D, (b) MD, (c) DC-11, (d) DC-12, (e) MDC-11, (f) MDC-12; Figure S2: BET adsorption-desorption isotherms of (a) D, (b) MD, (c) DC-11, (d) MDC-11; Figure S3: Pore size distributions of (a) D, (b) MD, (c) DC-11, (d) MDC-11; Figure S4: Zeta potential plots of (a) diatomites, (b) CeO2-diatomite composites as a function of pH; Figure S5: UV-vis absorption spectra of MB using 0.25 mg/mL dose of (a) DC-11, (b) DC-12, (c) MDC-11, and (d) MDC-12; Figure S6: UV-vis absorption spectra of MB using 0.50 mg/mL dose of (a) DC-11, (b) DC-12, (c) MDC-11, and (d) MDC-12.
Funding
This research received no external funding.
Data Availability Statement
The data presented in the study is available on request from the corresponding author.
Acknowledgments
The author is thankful to Beg Tug Mineral, Türkiye for generous support.
Conflicts of Interest
The author declares that she has no known competing financial interests or personal relationships that could have appeared to influence the work reported in this paper.
References
- Waghchaure, R.H.; Adole, V.A.; Jagdale, B.S. Photocatalytic degradation of methylene blue, rhodamine B, methyl orange and Eriochrome black T dyes by modified ZnO nanocatalysts: A concise review. Inorg. Chem. Commun. 2022, 143, 109764. [Google Scholar] [CrossRef]
- Hamad, H.N.; Idrus, S. Recent developments in the application of bio-waste-derived adsorbents for the removal of methylene blue from wastewater: A review. Polymers 2022, 14, 783. [Google Scholar] [CrossRef]
- Khan, I.; Saeed, K.; Zekker, I.; Zhang, B.; Hendi, A.H.; Ahmad, A.; Ahmad, S.; Zada, N.; Ahmad, H.; Shah, L.A.; et al. Review on methylene blue: Its properties, uses, toxicity and photodegradation. Water 2022, 14, 242. [Google Scholar] [CrossRef]
- Rafatullah, M.; Sulaiman, O.; Hashim, R.; Ahmad, A. Adsorption of methylene blue on low-cost adsorbents: A review. J. Hazard. Mater. 2010, 177, 70–80. [Google Scholar] [CrossRef]
- Kuang, Y.; Zhang, X.; Zhou, S. Adsorption of methylene blue in water onto activated carbon by surfactant modification. Water 2020, 12, 587. [Google Scholar] [CrossRef] [Green Version]
- Labena, A.; Abdelhamid, A.E.; Amin, A.S.; Husien, S.; Hamid, L.; Safwat, G.; Diab, A.; Gobouri, A.A.; Azab, E. Removal of methylene blue and congo red using adsorptive membrane impregnated with dried Ulva fasciata and Sargassum dentifolium. Plants 2021, 10, 384. [Google Scholar] [CrossRef]
- Verma, A.K.; Dash, R.R.; Bhunia, P. A review on chemical coagulation/flocculation technologies for removal of colour from textile wastewaters. J. Environ. Manage. 2012, 93, 154–168. [Google Scholar] [CrossRef] [PubMed]
- Gomes, J.; Lincho, J.; Domingues, E.; Quinta-Ferreira, R.M.; Martins, R.C. N–TiO2 Photocatalysts: A Review of Their Characteristics and Capacity for Emerging Contaminants Removal. Water 2019, 11, 373. [Google Scholar] [CrossRef] [Green Version]
- Kumar, M.S.; Sonawane, S.H.; Pandit, A.B. Degradation of methylene blue dye in aqueous solution using hydrodynamic cavitation based hybrid advanced oxidation processes. Chem. Eng. Process. Process Intensif. 2017, 122, 288–295. [Google Scholar] [CrossRef]
- Kurian, M. Advanced oxidation processes and nanomaterials—A review. Cleaner Eng. Technol. 2021, 2, 100090. [Google Scholar] [CrossRef]
- Modi, S.; Yadav, V.K.; Gacem, A.; Ali, I.H.; Dave, D.; Khan, S.H.; Yadav, K.K.; Rather, S.-u.; Ahn, Y.; Son, C.T.; et al. Recent and Emerging Trends in Remediation of Methylene Blue Dye from Wastewater by Using Zinc Oxide Nanoparticles. Water 2022, 14, 1749. [Google Scholar] [CrossRef]
- Hoffmann, M.R.; Martin, S.T.; Choi, W.; Bahnemann, D.W. Environmental Applications of Semiconductor Photocatalysis. Chem. Rev. 1995, 95, 69–96. [Google Scholar] [CrossRef]
- Turchi, C.S.; Ollis, D.F. Photocatalytic degradation of organic water contaminants: Mechanisms involving hydroxyl radical attack. J. Catal. 1990, 122, 178–192. [Google Scholar] [CrossRef]
- Gharbani, P.; Mehrizad, A.; Mosavi, S.A. Optimization, kinetics and thermodynamics studies for photocatalytic degradation of Methylene Blue using cadmium selenide nanoparticles. npJ. Clean Water 2022, 5, 34. [Google Scholar] [CrossRef]
- George, A.; Magimai Antoni Raj, D.; Venci, X.; Dhayal Raj, A.; Albert Irudayaraj, A.; Josephine, R.L.; John Sundaram, S.; Al-Mohaimeed, A.M.; Al Farraj, D.A.; Chen, T.-W.; et al. Photocatalytic effect of CuO nanoparticles flower-like 3D nanostructures under visible light irradiation with the degradation of methylene blue (MB) dye for environmental application. Environ. Res. 2022, 203, 111880. [Google Scholar] [CrossRef] [PubMed]
- Ahmad, A.; Khan, M.; Khan, S.; Luque, R.; Almutairi, T.M.; Karami, A.M. Bio-construction of MgO nanoparticles using Texas sage plant extract for catalytical degradation of methylene blue via photocatalysis. Int. J. Environ. Sci. Technol. 2022, 1–12. [Google Scholar] [CrossRef]
- Perumal, V.; Inmozhi, C.; Uthrakumar, R.; Robert, R.; Chandrasekar, M.; Mohamed, S.B.; Honey, S.; Raja, A.; Al-Mekhlafi, F.A.; Kaviyarasu, K. Enhancing the photocatalytic performance of surface—Treated SnO2 hierarchical nanorods against methylene blue dye under solar irradiation and biological degradation. Environ. Res. 2022, 209, 112821. [Google Scholar] [CrossRef]
- Abbas, N.; Rubab, N.; Sadiq, N.; Manzoor, S.; Khan, M.I.; Fernandez Garcia, J.; Barbosa Aragao, I.; Tariq, M.; Akhtar, Z.; Yasmin, G. Aluminum-Doped Cobalt Ferrite as an Efficient Photocatalyst for the Abatement of Methylene Blue. Water 2020, 12, 2285. [Google Scholar] [CrossRef]
- Turkten, N.; Karatas, Y.; Bekbolet, M. Preparation of PANI Modified ZnO Composites via Different Methods: Structural, Morphological and Photocatalytic Properties. Water 2021, 13, 1025. [Google Scholar] [CrossRef]
- Basumatary, B.; Basumatary, R.; Ramchiary, A.; Konwar, D. Evaluation of Ag@TiO2/WO3 heterojunction photocatalyst for enhanced photocatalytic activity towards methylene blue degradation. Chemosphere 2022, 286, 131848. [Google Scholar] [CrossRef] [PubMed]
- Birben, N.C.; Paganini, M.C.; Calza, P.; Bekbolet, M. Photocatalytic degradation of humic acid using a novel photocatalyst: Ce-doped ZnO. Photochem. Photobiol. Sci. 2017, 16, 24–30. [Google Scholar] [CrossRef] [PubMed]
- Chen, F.; Cao, Y.; Jia, D. Preparation and photocatalytic property of CeO2 lamellar. Appl. Surf. Sci. 2011, 257, 9226–9231. [Google Scholar] [CrossRef]
- Phanichphant, S.; Nakaruk, A.; Channei, D. Photocatalytic activity of the binary composite CeO2/SiO2 for degradation of dye. Appl. Surf. Sci. 2016, 387, 214–220. [Google Scholar] [CrossRef]
- Litter, M.I. Heterogeneous photocatalysis: Transition metal ions in photocatalytic systems. Appl. Catal. B 1999, 23, 89–114. [Google Scholar] [CrossRef]
- Cheng, Z.; Luo, S.; Liu, Z.; Zhang, Y.; Liao, Y.; Guo, M.; Nguyen, T.T. Visible-light-driven hierarchical porous CeO2 derived from wood for effective photocatalytic degradation of methylene blue. Opt. Mater. 2022, 129, 112429. [Google Scholar] [CrossRef]
- Jasim, S.A.; Machek, P.; Abdelbasset, W.K.; Jarosova, M.; Majdi, H.S.; Khalaji, A.D. Solution combustion synthesis of CeO2 nanoparticles for excellent photocatalytic degradation of methylene blue. Appl. Phys. A 2022, 128, 475. [Google Scholar] [CrossRef]
- Majumder, D.; Chakraborty, I.; Mandal, K.; Roy, S. Facet-Dependent Photodegradation of Methylene Blue Using Pristine CeO2 Nanostructures. ACS Omega 2019, 4, 4243–4251. [Google Scholar] [CrossRef] [Green Version]
- Pouretedal, H.R.; Kadkhodaie, A. Synthetic CeO2 Nanoparticle Catalysis of Methylene Blue Photodegradation: Kinetics and Mechanism. Chinese J. Catal. 2010, 31, 1328–1334. [Google Scholar] [CrossRef]
- Reddy Yadav, L.S.; Lingaraju, K.; Daruka Prasad, B.; Kavitha, C.; Banuprakash, G.; Nagaraju, G. Synthesis of CeO2 nanoparticles: Photocatalytic and antibacterial activities. Eur. Phys. J. Plus 2017, 132, 239. [Google Scholar] [CrossRef]
- Saadoon, S.J.; Jarosova, M.; Machek, P.; Kadhim, M.M.; Ali, M.H.; Khalaji, A.D. Methylene blue photodegradation using as-synthesized CeO2 nanoparticles. J. Chin. Chem. Soc. 2022, 69, 280–288. [Google Scholar] [CrossRef]
- Christy, E.J.S.; Alagar, R.; Dhanu, M.; Pius, A. Porous nonhierarchical CeO2/SiO2 monolith for effective degradation of organic pollutants. Environ. Nanotechnol. Monit. Manag. 2020, 14, 100365. [Google Scholar] [CrossRef]
- Dhmees, A.S.; Rashad, A.M.; Eliwa, A.A.; Zawrah, M.F. Preparation and characterization of nano SiO2@CeO2 extracted from blast furnace slag and uranium extraction waste for wastewater treatment. Ceram. Int. 2019, 45, 7309–7317. [Google Scholar] [CrossRef]
- Farrukh, M.A.; Butt, K.M.; Chong, K.-K.; Chang, W.S. Photoluminescence emission behavior on the reduced band gap of Fe doping in CeO2-SiO2 nanocomposite and photophysical properties. J. Saudi Chem. Soc. 2019, 23, 561–575. [Google Scholar] [CrossRef]
- Mohamed, R.M.; Aazam, E.S. Synthesis and Characterization of CeO2-SiO2 Nanoparticles by Microwave-Assisted Irradiation Method for Photocatalytic Oxidation of Methylene Blue Dye. Int. J. Photoenergy 2012, 2012, 928760. [Google Scholar] [CrossRef] [Green Version]
- Rani, N.; Ahlawat, R.; Goswami, B. Annealing effect on bandgap energy and photocatalytic properties of CeO2-SiO2 nanocomposite prepared by sol-gel technique. Mater. Chem. Phys. 2020, 241, 122401. [Google Scholar] [CrossRef]
- Li, X.; Simon, U.; Bekheet, M.F.; Gurlo, A. Mineral-Supported Photocatalysts: A Review of Materials, Mechanisms and Environmental Applications. Energies 2022, 15, 5607. [Google Scholar] [CrossRef]
- Mishra, A.; Mehta, A.; Basu, S. Clay supported TiO2 nanoparticles for photocatalytic degradation of environmental pollutants: A review. J. Environ. Chem. Eng. 2018, 6, 6088–6107. [Google Scholar] [CrossRef]
- Tang, X.; Tang, R.; Xiong, S.; Zheng, J.; Li, L.; Zhou, Z.; Gong, D.; Deng, Y.; Su, L.; Liao, C. Application of natural minerals in photocatalytic degradation of organic pollutants: A review. Sci. Total Environ. 2022, 812, 152434. [Google Scholar] [CrossRef]
- Jiang, H.; Wang, R.; Wang, D.; Hong, X.; Yang, S. SnO2/Diatomite Composite Prepared by Solvothermal Reaction for Low-Cost Photocatalysts. Catalysts 2019, 9, 1060. [Google Scholar] [CrossRef] [Green Version]
- Xiong, C.; Ren, Q.; Chen, S.; Liu, X.; Jin, Z.; Ding, Y. A multifunctional Ag3PO4/Fe3O4/Diatomite composites: Photocatalysis, adsorption and sterilization. Mater. Today Commun. 2021, 28, 102695. [Google Scholar] [CrossRef]
- Zhang, G.; Cai, D.; Wang, M.; Zhang, C.; Zhang, J.; Wu, Z. Microstructural modification of diatomite by acid treatment, high-speed shear, and ultrasound. Microporous Mesoporous Mater. 2013, 165, 106–112. [Google Scholar] [CrossRef]
- Cherrak, R.; Hadjel, M.; Benderdouche, N.; Bellayer, S.; Traisnel, M. Treatment of recalcitrant organic pollutants in water by heterogeneous catalysis using a mixed material (TiO2-diatomite of algeria). Desalination Water Treat. 2016, 57, 17139–17148. [Google Scholar] [CrossRef]
- Zhang, G.; Wang, B.; Sun, Z.; Zheng, S.; Liu, S. A comparative study of different diatomite-supported TiO2 composites and their photocatalytic performance for dye degradation. Desalination Water Treat. 2016, 57, 17512–17522. [Google Scholar] [CrossRef]
- Tanniratt, P.; Wasanapiarnpong, T.; Mongkolkachit, C.; Sujaridworakun, P. Utilization of industrial wastes for preparation of high performance ZnO/diatomite hybrid photocatalyst. Ceram. Int. 2016, 42, 17605–17609. [Google Scholar] [CrossRef]
- Tajmiri, S.; Hosseini, M.R.; Azimi, E. Combined photocatalytic-adsorptive removal of water contaminants using a biologically prepared CdS-diatomite nanocomposite. Mater. Chem. Phys. 2021, 258, 123913. [Google Scholar] [CrossRef]
- Yang, B.; Ma, Z.; Wang, Q.; Yang, J. Synthesis and Photoelectrocatalytic Applications of TiO2/ZnO/Diatomite Composites. Catalysts 2022, 12, 268. [Google Scholar] [CrossRef]
- Zhou, Y.; Xi, W.; Xie, Z.; You, Z.; Jiang, X.; Han, B.; Lang, R.; Wu, C. High-Loading Pt Single-Atom Catalyst on CeO2-Modified Diatomite Support. Chem. Asian J. 2021, 16, 2622–2625. [Google Scholar] [CrossRef] [PubMed]
- Su, C.; Wang, H.; Li, M.; Qu, Y.; Zhu, Y. Tribological behavior and characterization analysis of modified nano-CeO2 filled oily diatomite/PVDF composites. Tribol. Int. 2019, 130, 299–307. [Google Scholar] [CrossRef]
- Seeharaj, P.; Kongmun, P.; Paiplod, P.; Prakobmit, S.; Sriwong, C.; Kim-Lohsoontorn, P.; Vittayakorn, N. Ultrasonically-assisted surface modified TiO2/rGO/CeO2 heterojunction photocatalysts for conversion of CO2 to methanol and ethanol. Ultrason. Sonochem. 2019, 58, 104657. [Google Scholar] [CrossRef]
- Hatchard, C.G.; Parker, C.A.; Bowen, E.J. A new sensitive chemical actinometer—II. Potassium ferrioxalate as a standard chemical actinometer. Proc. R. Soc. Lond. A 1956, 235, 518–536. [Google Scholar] [CrossRef]
- Dai, X.; Zeng, H.; Jin, C.; Rao, J.; Liu, X.; Li, K.; Zhang, Y.; Yu, Y.; Zhang, Y. 2D–3D graphene-coated diatomite as a support toward growing ZnO for advanced photocatalytic degradation of methylene blue. RSC Adv. 2021, 11, 38505–38514. [Google Scholar] [CrossRef] [PubMed]
- Ma, L.; Xu, H.; Xie, Q.; Chen, N.; Yu, Q.; Li, C. Mechanism of As(V) adsorption from aqueous solution by chitosan-modified diatomite adsorbent. J. Dispersion Sci. Technol. 2021, 43, 1512–1524. [Google Scholar] [CrossRef]
- Pu, X.; Dang, Q.; Liu, C.; Xu, Q.; Li, B.; Ji, X.; Liu, H.; Ma, Y.; Zhang, B.; Cha, D. Selective capture of mercury(II) in aqueous media using nanoporous diatomite modified by allyl thiourea. J. Mater. Sci. 2022, 57, 9246–9264. [Google Scholar] [CrossRef]
- Nguyen, Q.-B.; Vahabi, H.; Rios de Anda, A.; Versace, D.-L.; Langlois, V.; Perrot, C.; Nguyen, V.-H.; Naili, S.; Renard, E. Dual UV-Thermal Curing of Biobased Resorcinol Epoxy Resin-Diatomite Composites with Improved Acoustic Performance and Attractive Flame Retardancy Behavior. Sustain. Chem. 2021, 2, 24–48. [Google Scholar] [CrossRef]
- Othman, A.; Vargo, P.; Andreescu, S. Recyclable Adsorbents Based on Ceria Nanostructures on Mesoporous Silica Beads for the Removal and Recovery of Phosphate from Eutrophic Waters. ACS Appl. Nano Mater. 2019, 2, 7008–7018. [Google Scholar] [CrossRef]
- Xie, L.; Ren, Z.; Zhu, P.; Xu, J.; Luo, D.; Lin, J. A novel CeO2–TiO2/PANI/NiFe2O4 magnetic photocatalyst: Preparation, characterization and photodegradation of tetracycline hydrochloride under visible light. J. Solid State Chem. 2021, 300, 122208. [Google Scholar] [CrossRef]
- Laha, S.C.; Mukherjee, P.; Sainkar, S.R.; Kumar, R. Cerium Containing MCM-41-Type Mesoporous Materials and their Acidic and Redox Catalytic Properties. J. Catal. 2002, 207, 213–223. [Google Scholar] [CrossRef]
- Yao, G.; Lei, J.; Zhang, X.; Sun, Z.; Zheng, S.; Komarneni, S. Mechanism of zeolite X crystallization from diatomite. Mater. Res. Bull. 2018, 107, 132–138. [Google Scholar] [CrossRef]
- Reddy, B.M.; Khan, A.; Yamada, Y.; Kobayashi, T.; Loridant, S.; Volta, J.-C. Surface Characterization of CeO2/SiO2 and V2O5/CeO2/SiO2 Catalysts by Raman, XPS, and Other Techniques. J. Phys. Chem. B 2002, 106, 10964–10972. [Google Scholar] [CrossRef]
- Mamontov, G.V.; Grabchenko, M.V.; Sobolev, V.I.; Zaikovskii, V.I.; Vodyankina, O.V. Ethanol dehydrogenation over Ag-CeO2/SiO2 catalyst: Role of Ag-CeO2 interface. Appl. Catal. A 2016, 528, 161–167. [Google Scholar] [CrossRef]
- Weber, W.H.; Hass, K.C.; McBride, J.R. Raman study of CeO2: Second-order scattering, lattice dynamics, and particle-size effects. Phys. Rev. B 1993, 48, 178–185. [Google Scholar] [CrossRef]
- Grabchenko, M.V.; Mamontov, G.V.; Zaikovskii, V.I.; La Parola, V.; Liotta, L.F.; Vodyankina, O.V. Design of Ag-CeO2/SiO2 catalyst for oxidative dehydrogenation of ethanol: Control of Ag-CeO2 interfacial interaction. Catal. Today 2019, 333, 2–9. [Google Scholar] [CrossRef]
- Humbert, B.; Burneau, A.; Gallas, J.P.; Lavalley, J.C. Origin of the Raman bands, D1 and D2, in high surface area and vitreous silicas. J. Non-Cryst. Solids 1992, 143, 75–83. [Google Scholar] [CrossRef]
- Cerrato, E.; Calza, P.; Cristina Paganini, M. Photocatalytic reductive and oxidative ability study of pristine ZnO and CeO2-ZnO heterojunction impregnated with Cu2O. J. Photochem. Photobiol. A 2022, 427, 113775. [Google Scholar] [CrossRef]
- Scherrer, P. Estimation of the size and internal structure of colloidal particles by means of röntgen. Nachr. Ges. Wiss. Göttingen 1918, 2, 96–100. [Google Scholar]
- Gao, L.; Luo, Y.; Kang, Y.; Gao, M.; Abdulhafidh, O. Experimental Study on Physical Mechanical Properties and Microstructure of Diatomite Soil in Zhejiang Province, China. Appl. Sci. 2022, 12, 387. [Google Scholar] [CrossRef]
- Zuo, X.; Wang, L.; He, J.; Li, Z.; Yu, S. SEM-EDX studies of SiO2/PVDF membranes fouling in electrodialysis of polymer-flooding produced wastewater: Diatomite, APAM and crude oil. Desalination 2014, 347, 43–51. [Google Scholar] [CrossRef]
- Sing, K.S.W. Reporting physisorption data for gas/solid systems with special reference to the determination of surface area and porosity (Recommendations 1984). Pure Appl. Chem. 1985, 57, 603–619. [Google Scholar] [CrossRef]
- Rouquerol, F.; Rouquerol, J.; Sing, K.S.W.; Llewellyn, P.; Maurin, G. Adsorption by Powders and Porous Solids, 2nd ed.; Academic Press: Cambridge, MA, USA, 2014. [Google Scholar] [CrossRef]
- Yurdakal, S.; Garlisi, C.; Özcan, L.; Bellardita, M.; Palmisano, G. Chapter 4—(Photo)catalyst Characterization Techniques: Adsorption Isotherms and BET, SEM, FTIR, UV–Vis, Photoluminescence, and Electrochemical Characterizations. In Heterogeneous Photocatalysis; Marcì, G., Palmisano, L., Eds.; Elsevier: Amsterdam, The Netherlands, 2019; pp. 87–152. [Google Scholar] [CrossRef]
- Azimi Pirsaraei, S.R.; Asilian Mahabadi, H.; Jonidi Jafari, A. Airborne toluene degradation by using manganese oxide supported on a modified natural diatomite. J. Porous Mater. 2016, 23, 1015–1024. [Google Scholar] [CrossRef]
- Benkacem, T.; Hamdi, B.; Chamayou, A.; Balard, H.; Calvet, R. Physicochemical characterization of a diatomaceous upon an acid treatment: A focus on surface properties by inverse gas chromatography. Powder Technol. 2016, 294, 498–507. [Google Scholar] [CrossRef] [Green Version]
- Inchaurrondo, N.; Ramos, C.P.; Žerjav, G.; Font, J.; Pintar, A.; Haure, P. Modified diatomites for Fenton-like oxidation of phenol. Microporous Mesoporous Mater. 2017, 239, 396–408. [Google Scholar] [CrossRef] [Green Version]
- Mazidi, M.; Behbahani, R.M.; Fazeli, A. Screening of treated diatomaceous earth to apply as V2O5 catalyst support. Mater. Res. Innovations 2017, 21, 269–278. [Google Scholar] [CrossRef]
- Xia, Y.; Li, F.; Jiang, Y.; Xia, M.; Xue, B.; Li, Y. Interface actions between TiO2 and porous diatomite on the structure and photocatalytic activity of TiO2-diatomite. Appl. Surf. Sci. 2014, 303, 290–296. [Google Scholar] [CrossRef]
- Sprynskyy, M.; Kowalkowski, T.; Tutu, H.; Cukrowska, E.M.; Buszewski, B. Ionic liquid modified diatomite as a new effective adsorbent for uranium ions removal from aqueous solution. Colloids Surf. A Physicochem. Eng. Asp. 2015, 465, 159–167. [Google Scholar] [CrossRef]
- Caliskan, N.; Kul, A.R.; Alkan, S.; Sogut, E.G.; Alacabey, İ. Adsorption of Zinc (II) on diatomite and manganese-oxide-modified diatomite: A kinetic and equilibrium study. J. Hazard. Mater. 2011, 193, 27–36. [Google Scholar] [CrossRef] [PubMed]
- Ilia, I.; Stamatakis, M.; Perraki, T. Mineralogy and technical properties of clayey diatomites from north and central Greece. Open Geosci. 2009, 1, 393–403. [Google Scholar] [CrossRef]
- Kong, X.; Chong, X.; Squire, K.; Wang, A.X. Microfluidic diatomite analytical devices for illicit drug sensing with ppb-Level sensitivity. Sens. Actuators B Chem. 2018, 259, 587–595. [Google Scholar] [CrossRef]
- Rea, I.; De Stefano, L. Recent Advances on Diatom-Based Biosensors. Sensors 2019, 19, 5208. [Google Scholar] [CrossRef] [PubMed] [Green Version]
- Viji, S.; Anbazhagi, M.; Ponpandian, N.; Mangalaraj, D.; Jeyanthi, S.; Santhanam, P.; Devi, A.S.; Viswanathan, C. Diatom-Based Label-Free Optical Biosensor for Biomolecules. Appl. Biochem. Biotechnol. 2014, 174, 1166–1173. [Google Scholar] [CrossRef] [PubMed]
- Rea, I.; Martucci, N.M.; De Stefano, L.; Ruggiero, I.; Terracciano, M.; Dardano, P.; Migliaccio, N.; Arcari, P.; Taté, R.; Rendina, I.; et al. Diatomite biosilica nanocarriers for siRNA transport inside cancer cells. Biochim. Biophys. Acta Gen. Subj. 2014, 1840, 3393–3403. [Google Scholar] [CrossRef] [PubMed]
- Choudhary, S.; Sahu, K.; Bisht, A.; Singhal, R.; Mohapatra, S. Template-free and surfactant-free synthesis of CeO2 nanodiscs with enhanced photocatalytic activity. Appl. Surf. Sci. 2020, 503, 144102. [Google Scholar] [CrossRef]
- Kaviyarasu, K.; Fuku, X.; Mola, G.T.; Manikandan, E.; Kennedy, J.; Maaza, M. Photoluminescence of well-aligned ZnO doped CeO2 nanoplatelets by a solvothermal route. Mater. Lett. 2016, 183, 351–354. [Google Scholar] [CrossRef]
- Wang, G.; Mu, Q.; Chen, T.; Wang, Y. Synthesis, characterization and photoluminescence of CeO2 nanoparticles by a facile method at room temperature. J. Alloys Compd. 2010, 493, 202–207. [Google Scholar] [CrossRef]
- Parks, G.A. Aqueous Surface Chemistry of Oxides and Complex Oxide Minerals. In Equilibrium Concepts in Natural Water Systems; Advances in Chemistry; American Chemical Society: Washington, DC, USA, 1967; Volume 67, pp. 121–160. [Google Scholar]
- Nosrati, A.; Larsson, M.; Lindén, J.B.; Zihao, Z.; Addai-Mensah, J.; Nydén, M. Polyethyleneimine functionalized mesoporous diatomite particles for selective copper recovery from aqueous media. Int. J. Miner. Process. 2017, 166, 29–36. [Google Scholar] [CrossRef]
- Sondi, I.; Bišćan, J.; Pravdić, V. Electrokinetics of Pure Clay Minerals Revisited. J. Colloid Interface Sci. 1996, 178, 514–522. [Google Scholar] [CrossRef]
- Ye, X.; Kang, S.; Wang, H.; Li, H.; Zhang, Y.; Wang, G.; Zhao, H. Modified natural diatomite and its enhanced immobilization of lead, copper and cadmium in simulated contaminated soils. J. Hazard. Mater. 2015, 289, 210–218. [Google Scholar] [CrossRef]
- Gao, B.; Jiang, P.; An, F.; Zhao, S.; Ge, Z. Studies on the surface modification of diatomite with polyethyleneimine and trapping effect of the modified diatomite for phenol. Appl. Surf. Sci. 2005, 250, 273–279. [Google Scholar] [CrossRef]
- Sun, Z.; Yang, X.; Zhang, G.; Zheng, S.; Frost, R.L. A novel method for purification of low grade diatomite powders in centrifugal fields. Int. J. Miner. Process. 2013, 125, 18–26. [Google Scholar] [CrossRef] [Green Version]
- Houas, A.; Lachheb, H.; Ksibi, M.; Elaloui, E.; Guillard, C.; Herrmann, J.M. Photocatalytic degradation pathway of methylene blue in water. Appl. Catal. B 2001, 31, 145–157. [Google Scholar] [CrossRef]
- Al-Qodah, Z.; Lafi, W.K.; Al-Anber, Z.; Al-Shannag, M.; Harahsheh, A. Adsorption of methylene blue by acid and heat treated diatomaceous silica. Desalination 2007, 217, 212–224. [Google Scholar] [CrossRef]
- Zhang, T.; Oyama, T.; Aoshima, A.; Hidaka, H.; Zhao, J.; Serpone, N. Photooxidative N-demethylation of methylene blue in aqueous TiO2 dispersions under UV irradiation. J. Photochem. Photobiol. A 2001, 140, 163–172. [Google Scholar] [CrossRef]
- Zhang, T.; Oyama, T.k.; Horikoshi, S.; Hidaka, H.; Zhao, J.; Serpone, N. Photocatalyzed N-demethylation and degradation of methylene blue in titania dispersions exposed to concentrated sunlight. Sol. Energy Mater. Sol. Cells 2002, 73, 287–303. [Google Scholar] [CrossRef]
- Lin, J.; Luo, Z.; Liu, J.; Li, P. Photocatalytic degradation of methylene blue in aqueous solution by using ZnO-SnO2 nanocomposites. Mater. Sci. Semicond. Process. 2018, 87, 24–31. [Google Scholar] [CrossRef]
- Hao, C.; Li, J.; Zhang, Z.; Ji, Y.; Zhan, H.; Xiao, F.; Wang, D.; Liu, B.; Su, F. Enhancement of photocatalytic properties of TiO2 nanoparticles doped with CeO2 and supported on SiO2 for phenol degradation. Appl. Surf. Sci. 2015, 331, 17–26. [Google Scholar] [CrossRef]
- Melcher, J.; Barth, N.; Schilde, C.; Kwade, A.; Bahnemann, D. Influence of TiO2 agglomerate and aggregate sizes on photocatalytic activity. J. Mater. Sci. 2016, 52, 1047–1056. [Google Scholar] [CrossRef]
Figure 1.
FTIR spectra of (a) D, MD, (b) DC-11, DC-12, MDC-11, and MDC-12.

Figure 2.
Raman spectra of (a) D, MD, (b) DC-11, DC-12, MDC-11, and MDC-12.


Figure 3.
XRD spectra of (a) D, MD, (b) DC-11, DC-12, MDC-11, and MDC-12, (c) enlarged (111) plane of CeO2.
Figure 3.
XRD spectra of (a) D, MD, (b) DC-11, DC-12, MDC-11, and MDC-12, (c) enlarged (111) plane of CeO2.


Figure 4.
ESEM images of (a) D, (b) MD, (c) DC-11, (d) DC-12, (e) MDC-11, (f) MDC-12.

Figure 5.
(a) TG, (b) DTG curves for D, DM, DC-11, and MDC-11.


Figure 6.
PL spectra of D, MD, DC-11, DC-12, MDC-11, and MDC-12.

Figure 7.
Dose dependent initial dark adsorption extents of MB onto DC-11, DC-12, MDC-11, and MDC-12, as expressed by all descriptive parameters.
Figure 7.
Dose dependent initial dark adsorption extents of MB onto DC-11, DC-12, MDC-11, and MDC-12, as expressed by all descriptive parameters.

Figure 8.
Dose-dependent decolorization/degradation efficiencies of MB onto DC-11, DC-12, MDC-11, and MDC-12 as expressed by all descriptive parameters.
Figure 8.
Dose-dependent decolorization/degradation efficiencies of MB onto DC-11, DC-12, MDC-11, and MDC-12 as expressed by all descriptive parameters.

Figure 9.
Comparison of dose-dependent initial adsorption extents and decolorization efficiencies MB, A664 with respect to first-order kinetic rate constants.
Figure 9.
Comparison of dose-dependent initial adsorption extents and decolorization efficiencies MB, A664 with respect to first-order kinetic rate constants.


Table 1.
Surface characteristics properties of diatomites and CeO2-diatomite composites.
| Specimens | SBET *, m2/g | Vp **, cm3/g | D ***, nm |
|---|---|---|---|
| D | 109 | 0.3082 | 4.55 |
| MD | 118 | 0.3478 | 5.05 |
| DC-11 | 76 | 0.0954 | 2.29 |
| DC-12 | 84 | 0.1578 | 1.73 |
| MDC-11 | 127 | 0.2032 | 3.83 |
| MDC-12 | 126 | 0.1792 | 3.49 |
* Specific surface area data calculated by the multi-point BET method. ** Pore volume obtained from the BJH adsorption cumulative volume of pores between 0.36 and 300 nm diameter. *** Adsorption average pore diameter (4 V/A by BET).
Table 2.
Photocatalytic degradation kinetics of MB expressed by A664, A292, and A246.
| First-Order Kinetic Parameters Dose: 0.25 g/L | First-Order Kinetic Parameters Dose: 0.50 g/L | |||||
|---|---|---|---|---|---|---|
| A664 | k × 10−3, min−1 | t1/2, min | R × 10−3, cm−1 min−1 | k × 10−2, min−1 | t1/2, min | R × 10−3, cm−1 min−1 |
| DC-11 | 2.24 | 309 | 2.15 | 5.91 | 117 | 5.68 |
| DC-12 | 3.54 | 196 | 3.40 | 8.98 | 77 | 8.63 |
| MDC-11 | 10.2 | 68 | 9.84 | 9.00 | 77 | 8.65 |
| MDC-12 | 3.05 | 227 | 2.93 | 5.36 | 129 | 5.15 |
| A292 | ||||||
| DC-11 | 1.93 | 359 | 1.05 | 5.00 | 139 | 2.72 |
| DC-12 | 2.76 | 251 | 1.50 | 6.56 | 106 | 3.57 |
| MDC-11 | 2.76 | 251 | 1.50 | 6.11 | 113 | 3.32 |
| MDC-12 | 2.49 | 278 | 1.35 | 4.33 | 160 | 2.35 |
| A246 | ||||||
| DC-11 | 1.42 | 488 | 0.344 | 6.19 | 112 | 1.50 |
| DC-12 | 1.83 | 379 | 0.443 | 7.41 | 94 | 1.80 |
| MDC-11 | 3.77 | 184 | 0.913 | 8.58 | 81 | 2.07 |
| MDC-12 | 1.64 | 423 | 0.397 | 4.22 | 164 | 1.02 |
Publisher’s Note: MDPI stays neutral with regard to jurisdictional claims in published maps and institutional affiliations. |
© 2022 by the author. Licensee MDPI, Basel, Switzerland. This article is an open access article distributed under the terms and conditions of the Creative Commons Attribution (CC BY) license (https://creativecommons.org/licenses/by/4.0/).
Share and Cite
MDPI and ACS Style
Turkten, N. A Novel Low-Cost Photocatalyst: Preparation, Characterization, and Photocatalytic Properties of CeO2-Diatomite Composites. Water 2022, 14, 3373. https://doi.org/10.3390/w14213373
AMA Style
Turkten N. A Novel Low-Cost Photocatalyst: Preparation, Characterization, and Photocatalytic Properties of CeO2-Diatomite Composites. Water. 2022; 14(21):3373. https://doi.org/10.3390/w14213373
Chicago/Turabian StyleTurkten, Nazli. 2022. "A Novel Low-Cost Photocatalyst: Preparation, Characterization, and Photocatalytic Properties of CeO2-Diatomite Composites" Water 14, no. 21: 3373. https://doi.org/10.3390/w14213373
Note that from the first issue of 2016, this journal uses article numbers instead of page numbers. See further details here.