
Assessment of Seasonal Changes on the Carbon Cycle in the Critical Zone of a Surface Water (SW)–Groundwater (GW) System


1
Croatian Geological Survey, Sachsova 2, 10000 Zagreb, Croatia
2
Department of Environmental Sciences, Jožef Stefan Institute, Jamova cesta 39, SI-1000 Ljubljana, Slovenia
*
Author to whom correspondence should be addressed.
Water 2022, 14(21), 3372; https://doi.org/10.3390/w14213372
Submission received: 23 September 2022
/
Revised: 12 October 2022
/
Accepted: 20 October 2022
/
Published: 24 October 2022
(This article belongs to the Section Hydrogeology)
Abstract
:Groundwater is a valuable source of water for human consumption, and its quality is a current issue worldwide. Understanding carbon and water cycling presents the basis of biogeochemical reactions occurring in the aquifer; therefore, understanding their interaction is imperative for sustainable water management. In the paper, this interaction was investigated within the complex surface water (SW)–groundwater (GW) system in the Varaždin region (Croatia) by using a multi-parameter approach: δ13CDIC values, carbon species (DIC, DOC), δ18O and δ2H values, geochemical indicators (T, pH, DO, EC), and δ13C measurements in solids. Both δ18O/δ2H and δ13CDIC were recognized as good indicators to differentiate shallow and deep GW. Transit time of water (TT) was evaluated as an important parameter in controlling carbon cycling within the SW–GW system. Shallow GW is characterized by shorter TT, seasonal changes in carbon species and δ13CDIC, and lower possibility of carbon capture in the system. Deep GW has longer TT without pronounced seasonal changes in carbon species and δ13CDIC. The conceptual model of the carbon cycle revealed major sources and sinks of CO2 in the study area. Our results suggest that GW acts as both source and sink for CO2, depending on the prevailing geochemical process. Surface waters are primarily a source of CO2, excluding the gravel pit, which acts primarily as a sink for CO2. Our study shows that the current SW–GW dynamics regulate carbon balance without having negative impacts on groundwater quality but also demonstrates that implementing carbon cycle in water management studies is of vital importance for sustainable use of groundwater.

1. Introduction
Understanding carbon cycling in the critical zone is of high interest in Earth system sciences, with broad implications regarding water quality and quantity [1], especially nowadays, when climate changes are pronounced and efforts are being made to reduce CO2 emissions into the atmosphere. The concept of the critical zone was introduced by the National Research Council [2] and denotes the zone extending from the top of the vegetation canopy through the soil and down to fresh bedrock, i.e., bottom of the groundwater [3]. The movement of CO2 through the critical zone includes major processes that are sinking CO2 in the global and local scale: conversion from the atmosphere into the ground via photosynthesis, root respiration, dissolving in precipitation towards groundwater where dissolution of carbonates occurs, leading to its storage in groundwater and soil. Conversely, CaCO3 precipitation in soil and groundwater and decomposing of plants (organic matter) are processes that emit CO2 in the atmosphere, alongside other natural (e.g., volcanic eruption) and anthropogenic sources (e.g., emission of fossil fuels, deforestation). Dissolved inorganic carbon (DIC) and its stable isotopic composition (δ13CDIC) are governed by biogeochemical reactions and, therefore, experience seasonal variations [4,5,6,7,8,9,10,11,12]. During the transformation of carbon (leaching from the surface, infiltration, precipitation of carbonate, dissolution of carbonate from different sources), changes in δ13CDIC occur [13,14]. Plants also play a substantial role in transforming carbon via photosynthesis. Three groups of plants are distinguished: C3 (e.g., grass, wheat, potato, pumpkin, and trees), C4 (e.g., maize and cabbage), and CAM (Crassulacean acid metabolism) (e.g., cacti), which have characteristically different carbon isotopic compositions.
Carbon and water cycles are linked in many ways, e.g., ocean–atmosphere exchange, volcanic outgassing, permafrost melting, ocean warming, photosynthesis, respiration, and weathering [15,16]. Because of their link, isotopic compositions of oxygen (O) and hydrogen (H), expressed as δ18O and δ2H, are frequently used in surface water (SW)–groundwater (GW) investigations [17,18,19,20]. The δ18O and δ2H data on atmospheric precipitation, SW, and GW are meaningful for hydrological, climatological, meteorological, and hydrogeological investigation because they give information on the recharge elevation, estimation of transit time, water-sediment interactions, and biogeochemical processes [21,22,23,24,25,26,27,28,29,30].
In this study, δ13CDIC values, carbon species (DIC, DOC), δ18O and δ2H values, and geochemical indicators were used to better understand the link between hydrological conditions and carbon behavior within complex SW–GW systems in the Varaždin region. It encompasses 200 km2 of agricultural land, settlements, mining areas (gravel and sand excavations), a lot of small enterprises and Natura 2000 area (the Drava River). In recent years, knowledge about hydrogeological conditions within the alluvial aquifer and its hydraulic connection with surface waters (the Drava River and accumulation lake) has improved [19,20,31,32]. However, knowledge about carbon behavior in this system does not exist. Since the study area is very “anthropogenically active”, the question arises whether this complex SW–GW system can regulate the release of CO2 into the atmosphere, and will it act as a sink or an additional source of CO2. How would that effect the protected area and groundwater quality? Answers to these questions represent novelty in understanding carbon behavior in investigated SW–GW system and has implementation on a global scale, everywhere where such conditions exist. This knowledge is important for sustainable and effective SW–GW and land management for the future.
The main goals of this paper are: to identify the seasonal and spatial variation of dissolved carbon species and the isotopic composition of dissolved inorganic carbon (δ13CDIC) and investigate their relationship with groundwater hydrodynamics; to define and thermodynamically model carbon sources and sinks; to estimate annual DIC fluxes into deep and shallow GW and SW; and to create a conceptual model of the carbon cycle based on hydrological and isotopic data.
2. Materials and Methods
2.1. Study Area
The study area is positioned in the Drava River valley in the southwestern margin of the Danube basin, upstream of the Varaždin, a city in Northern Croatia (Figure 1). The alluvial aquifer is the only source for community water supply needs in the Varaždin region (approximately 170,000 inhabitants). Groundwater is also used for irrigation and industrial activities. According to the Corine land cover [33], the terrain’s surface is predominantly characterized by agricultural land (68%). Alongside irrigation, inorganic (synthetic), and organic fertilizers (manure) are added to the soil to enhance crop growth. Overfertilization, however, has led to high nitrate content in the groundwater and the shutting down of the Varaždin wellfield. The only active wellfield within the study area is Vinokovšćak, situated between the Drava River and the derivation channel of the hydroelectric power plant Varaždin (Figure 1).
The aquifer is built of Quaternary alluvial deposits [34] dominated by gravel and sand, with silty and clayey lenses and interlayers [35,36]. Minerals that most often occur in deposits are gneiss, quartz, basic and neutral eruptive rocks, feldspars and other silicate minerals (e.g., epidote, amphibole, garnet, rutile, kyanite), limestone, and dolomite [37,38].
The Drava River changed its course many times during the Pleistocene and Holocene, forming numerous channels and meanders, which are still visible (Figure 1). In the old bed of the Drava River, the sedimentation process in still water prevailed for a long time, which resulted in deposition of fine sediments (e.g., clay, silt, and organic matter) and formation of distinctive oxbow facies [38]. The aquifer thickens towards the east, from less than 5 m in the marginal parts of the aquifer to about 65 m below the Varaždin City area (Figure 1, cross-section A–B).
The aquifer is unconfined and characterized by intergranular porosity. According to the conceptual model, it is divided into three layers: upper aquifer, semipermeable interlayer, and lower aquifer [32]. Groundwater generally flows in a SE direction (Figure 1). The bottom of the aquifer consists of impermeable marl, clay, and silt. The covering layer of the aquifer is discontinuous, which allows rapid leaching of contaminants from the surface. The Šijanec gravel pit was formed by excavating gravel-sandy material, and its water level indicates the level of the groundwater in the aquifer. The Varaždin hydroelectric power plant was built in the 1970s and significantly influences the net flow of groundwater. It consists of an accumulation lake, an intake channel, the power plant, and a derivation channel (Figure 1). The aquifer is recharged through percolation from the Drava River and accumulation lake and precipitation infiltration. Karlović et al. [32] modeled long-term precipitation in the study area and concluded that the average annual precipitation is distributed as groundwater recharge, surface runoff, and actual evapotranspiration with 34%, 21%, and 45%, respectively. Groundwater discharge occurs through the derivation channel and the Plitvica stream [32,39].
The climate of the study area is Cfb type based on the Köppen–Geiger classification system [40]. The origin of precipitation is generally from the Atlantic air masses, with Mediterranean influence during cooler periods of the year [19]. Groundwater levels remain relatively stable between normal seasonal fluctuations, controlled mainly by the water level of the accumulation lake and the Drava River. Similarly, the flow rates of the Plitvica stream are also within the expected range, with variations depending on seasonal precipitation and water level. The Drava River flow regime is stable according to the measured flow rates because the flows are controlled by discharging water from the accumulation lake.
2.2. Sampling Procedure
Groundwater and surface water sampling was divided into five sampling campaigns during different hydrological and vegetation seasons between September 2018 and September 2019. Surface water sampling was conducted at four different sites, while groundwater samples were collected by pumping from 10 observation wells (Figure 1, Table 1). Among the sampling sites, four groups were singled out according to hydrological characteristics: (1) SW–Drava River, accumulation lake Varaždin and Plitvica stream; (2) gravel pit; (3) shallow groundwater observation wells (well depth ≤ 8 m); and (4) deep groundwater observation wells (well depth > 8 m) (Table 1). The water level was measured in the wells prior to pumping. The thickness of the unsaturated zone varies both spatially and temporally due to changes in hydrological conditions. Generally, the thickness is greater in the central part of the study area, especially for deeper wells (e.g., up to 8.02 m in PDS-6). In contrast, shallow wells near the study area’s edge have lower unsaturated zone thicknesses (e.g., 2.26 m in P-1556) and fluctuations in groundwater levels within single wells range from 0.41 m in P-2500 to 1.15 m in PDS-6.
More than three volumes of water were pumped out from each observation well (constant electrical conductivity was reached) before sampling to obtain a representative groundwater sample. In situ measurements of electrical conductivity (EC), water temperature (T), pH, and dissolved oxygen (DO) were made using a WTW multi-probe. Samples for major ion analysis were collected in 500 mL HPDE bottles with tight-fitting caps. Samples for dissolved organic and inorganic carbon (DOC, DIC) analyses were filtered through a 0.45 µm PVDF (polyvinylidene fluoride) filter and stored in 100 mL amber glass bottles. Samples for δ13CDIC analyses were filtered through a 0.45 µm PVDF filter and kept in 12 mL Labco glass serum ampoules filled to the top. Monthly composite precipitation samples (producer Palmex Ltd., Zagreb, Croatia) were collected using a rain gauge, transferred into HDPE (1 L) plastic bottles, and refrigerated until analyses. The major ions, DOC, DIC, δ18O and δ2H were measured in the Hydrochemical Laboratory of the Croatian Geological Survey, while δ13CDIC measurements were performed in the Department of Environmental Science laboratory, Jožef Stefan Institute.
Solid samples, e.g., aquifer sediment, soil, plants, and manure (n = 17), were collected across the study area in two field sampling campaigns (July 2018 and September 2019). Homogenized aquifer sediment samples were collected from the Drava riverbed and gravel pit to represent the aquifer carbonate deposits. Homogenized plant samples were taken directly from arable land to represent typical crops grown in the study area: cabbage, corn (grain, leaf), potato, wheat (grain, straw), pumpkin, and grass. Homogenized manure samples were collected from cow and chicken farms. Homogenized soil samples were collected at the surface of the terrain under an orchard and fields of corn, cabbage, and wheat. All samples were immediately stored in sealed polyethylene bags for transport to the Geochemical Laboratory of the Croatian Geological Survey. The preparation of solid samples consisted of freezing, freeze-drying, and grinding of plants, manure, and soil, and grinding carbonates in aquifer sediment into a fine fraction suitable for δ13C analyses. The analyses of δ13C in solid samples were performed in the Department of Environmental Science laboratory, Jožef Stefan Institute.
2.3. Analytical Methods
Determination of the major ions and dissolved carbon (DOC, DIC) in surface water and groundwater samples were analyzed following protocols reported in [31] and for analyses of δ18O and δ2H following protocols in [19].
2.3.1. Determination of δ13CDIC
The Isoprime 100 coupled to a MultiflowBio preparation module was used to determine δ13CDIC values. The method is described in detail in [41,42]. Briefly, 100–200 µL of phosphoric acid (100%) was added to a septum-sealed vial, which was then purged with pure He. Each analysis took approximately 5 min. A 1 mL water sample was then injected, and the headspace CO2 was measured. To determine the optimal extraction procedure, a standard Na2CO3 solution (Carlo Erba reagents, Val de Reuil, France) with a known δ13CDIC value of –10.8 ± 0.2‰ was used. The average sample repeatability was 0.2‰. One-point normalization was performed, and all samples were measured in two repetitions. Stable isotopes are reported in the δ notation [43,44].
2.3.2. Determination of δ13C in Plant and Manure Samples
Ground plant and manure samples (approx. 1 mg) were transferred to tin capsules, and their carbon isotopic composition (δ13C) was measured using an IsoPrime 100 mass spectrometer coupled to a PyroCube preparation module (Elementar Analysensysteme GmbH, Langenselbold, Germany). Measurement repeatability and quality were controlled with the IAEA CH-3 = −24.724 ± 0.041‰, IAEA CH-6 = −10.449 ± 0.033‰ reference materials and, additionally, sugar with a δ13C value of −25.2‰ ± 0.2‰. The results were normalized against the IAEA CH-3 and IAEA CH-6 reference materials. All samples were measured in triplicate.
2.3.3. Determination of δ13Ccarb
About 1 mg of the carbonate sample was weighed in the ampoule and purged with helium. Each sample analysis took about 5 min. Then, 0.2 mL of H3PO4 was added [45]. The resulting CO2 was measured from gas caps with an IsoPrime 100 isotope mass spectrometer coupled to a MultiflowBio preparation module. Repeatability and measurement quality were controlled using two reference materials: IAEA CO-1 (2.492‰ ± 0.030) and NBS19 (1.95‰ ± 0.035). Each sample was measured three times. Unprocessed data were normalized against IAEA CO-1 and NBS19 reference materials.
2.3.4. Determination of δ13Cbulk and δ13Corg in Soil
Approximately 3–5 mg of the soil sample was added and transferred into tin capsules to determine δ13Cbulk. Each sample analysis took about 10 min. To determine δ13Corg, carbonate was first removed with 3M HCl. The samples were analyzed as for plants and manure. All samples were measured in duplicate.
2.4. Data Processing
Saturation indices and CO2 partial pressure (pCO2) were calculated to evaluate chemical speciation and estimate the carbon sequestration pool within the SW–GW system using PHREEQC software [46]. Carbonate fraction in soil was calculated according to the following equation [47]:
where x is (%) of carbonate fraction in soil, δ13Ccarb = −0.1‰ (averaged measured value for carbonate), and δ13Cbulk is measured bulk value of sample.
δ13Cbulk = x δ13Corg + (1 − x) δ13Ccarb,
The flux of inorganic carbon into groundwater [g/m2] was calculated by multiplying DIC [mol/L] with groundwater recharge R [mm/y] and converting units into GtCy−1. The groundwater recharge was calculated using the effective infiltration rate multiplied by average precipitation amount for the monitored period. The flux of inorganic carbon into surface waters [g/m3] was calculated by multiplying the DIC [mol/L] with the discharge Q [m3/s] and converting units into GtCy−1. The inorganic carbon flux was not calculated since there was no information about discharge from the accumulation lake and gravel pit.
All graphical representations were made using a combination of MS Excel 2016, Surfer 7.6, ArcMap 10.2.1, and AutoCAD 2021. The maps are presented in the official reference coordinate system for map projection in Croatia (HTRS96/TM).
3. Results and Discussion
3.1. Hydrochemical and Isotopic Composition of GW and SW
The minimum, maximum, and average physical, physicochemical, chemical, and isotopic δ13CDIC parameters in surface water and groundwater samples from five sampling campaigns (September and December 2018, April, June, and September 2019) are given in Table 2. More details on the isotopic composition of hydrogen and oxygen in precipitation, groundwater, and surface waters are available in [19]. All δ13C data associated with this article are available in Supplementary Material. Additional two-year physical and chemical data for groundwater were presented in [31]. However, physical and chemical data for surface waters were not published in the previous work.
The lowest EC values were measured in the gravel pit and the highest in the shallow GW samples. The high EC values in shallow GW indicate a higher dissolved solid content than in deep GW and SW. The highest temperature variations (∆T = 28.8 °C) were observed in SW, while the lowest ∆T = 1.5 °C was detected in deep GW samples. High temperature variations in SW are related to seasonal changes. Depending on the observation well’s position in the aquifer, the DO in the groundwater samples varied from extremely low (0.2 mg/L) to high (11.8 mg/L). Surface waters were saturated with DO. pH-values varied from slightly acid to slightly alkaline for all sampled waters. Micronutrient (PO43−-P, NO2−, NH4+) concentrations in SW varied from under the detection limit to slightly elevated. The high nitrate concentrations in the groundwater were likely connected with anthropogenic influences, such as agricultural production and waste waters (Karlović et al., 2021a). The highest concentration of Cl- and SO42− was measured in the shallow GW samples, followed by deep GW samples, and the lowest in SW. The silica content (as SiO2) varied in SW, while only a slight variation was observed in GW.
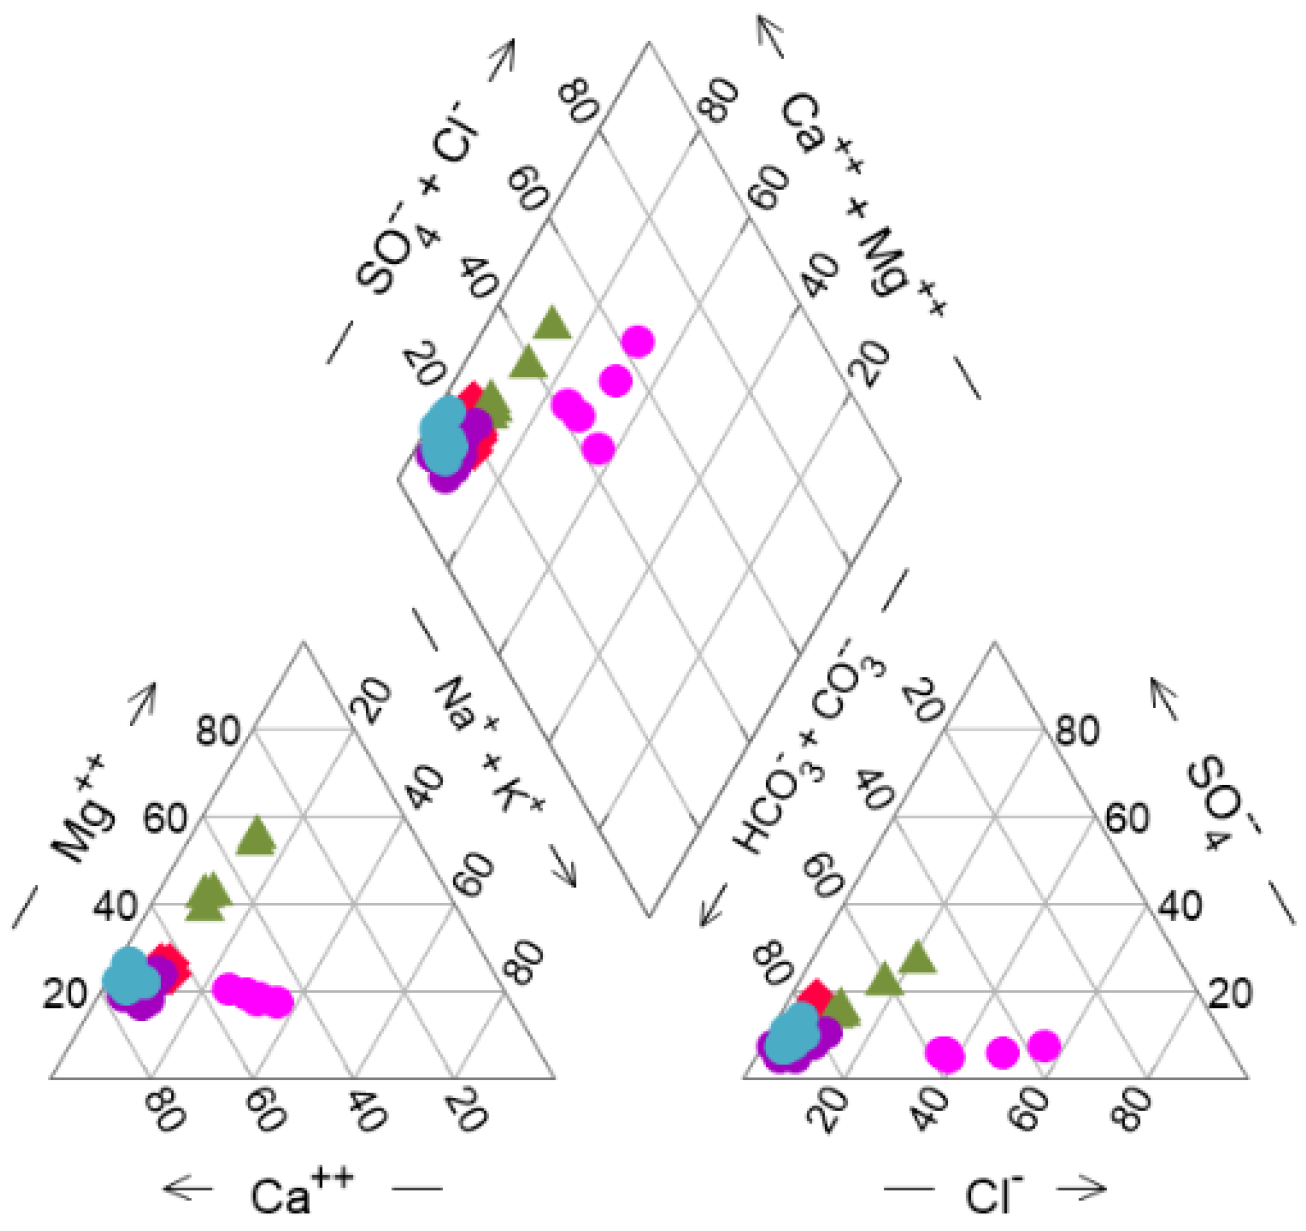
According to the hydrochemical classification based on the major ionic composition, five different water types can be distinguished (Figure 2). GW belongs to the Ca2+-Mg2+–HCO3− hydrochemical type, except for GW from P-4039, which belongs to the Na+-Ca2+-HCO3− and the Na+-Ca2+-HCO3−-Cl- hydrochemical type. Observed hydrochemical types are due to weathering and dissolution of silicate (e.g., micas and feldspar) and carbonate (limestone, dolomite) minerals that compose aquifer sediments [31], which influences the carbon cycle in GW. SW belongs to the Ca2+-Mg2+–HCO3− hydrochemical type, while gravel pit water belongs to the Mg2+-Ca2+–HCO3− hydrochemical type (mainly dolomite) as the consequence of biota activities that are related to the seasonal changes.
The δ18O and δ2H values of GW and SW were distributed along the two LMWLs Varaždin indicating meteoric origin (Figure 3). However, it was observed that values from shallow GW were around the LMWL based on 2017 to 2020 measurements [19], while values from deep GW were close to the LMWL based on 2007 to 2010 measurements [48]. This result indicates that the transit time (TT) of groundwater is different based on the position within the aquifer, i.e., shorter TT (a couple years) in shallow and longer TT (ten or more years) in deep GW. These results are consistent with previous research: Karlović et al. [20] observed the time delay in SW—GW temperature oscillations, indicating longer transit time towards the east where the aquifer deepens; Karlović et al. [49] modeled groundwater flow and nitrate transport and identified inertia regarding nitrate attenuation in deeper part of the aquifer during the 20-year period, which also suggests longer transit time in deep GW. Values from SW, except values from gravel pit where evaporation is expressed, show very good overlapping with GW, especially with the shallow value, indicating recharge in this part of the aquifer.
3.2. Spatial and Seasonal Variation of Carbon Species and Evaluation of Biogeochemical Processes
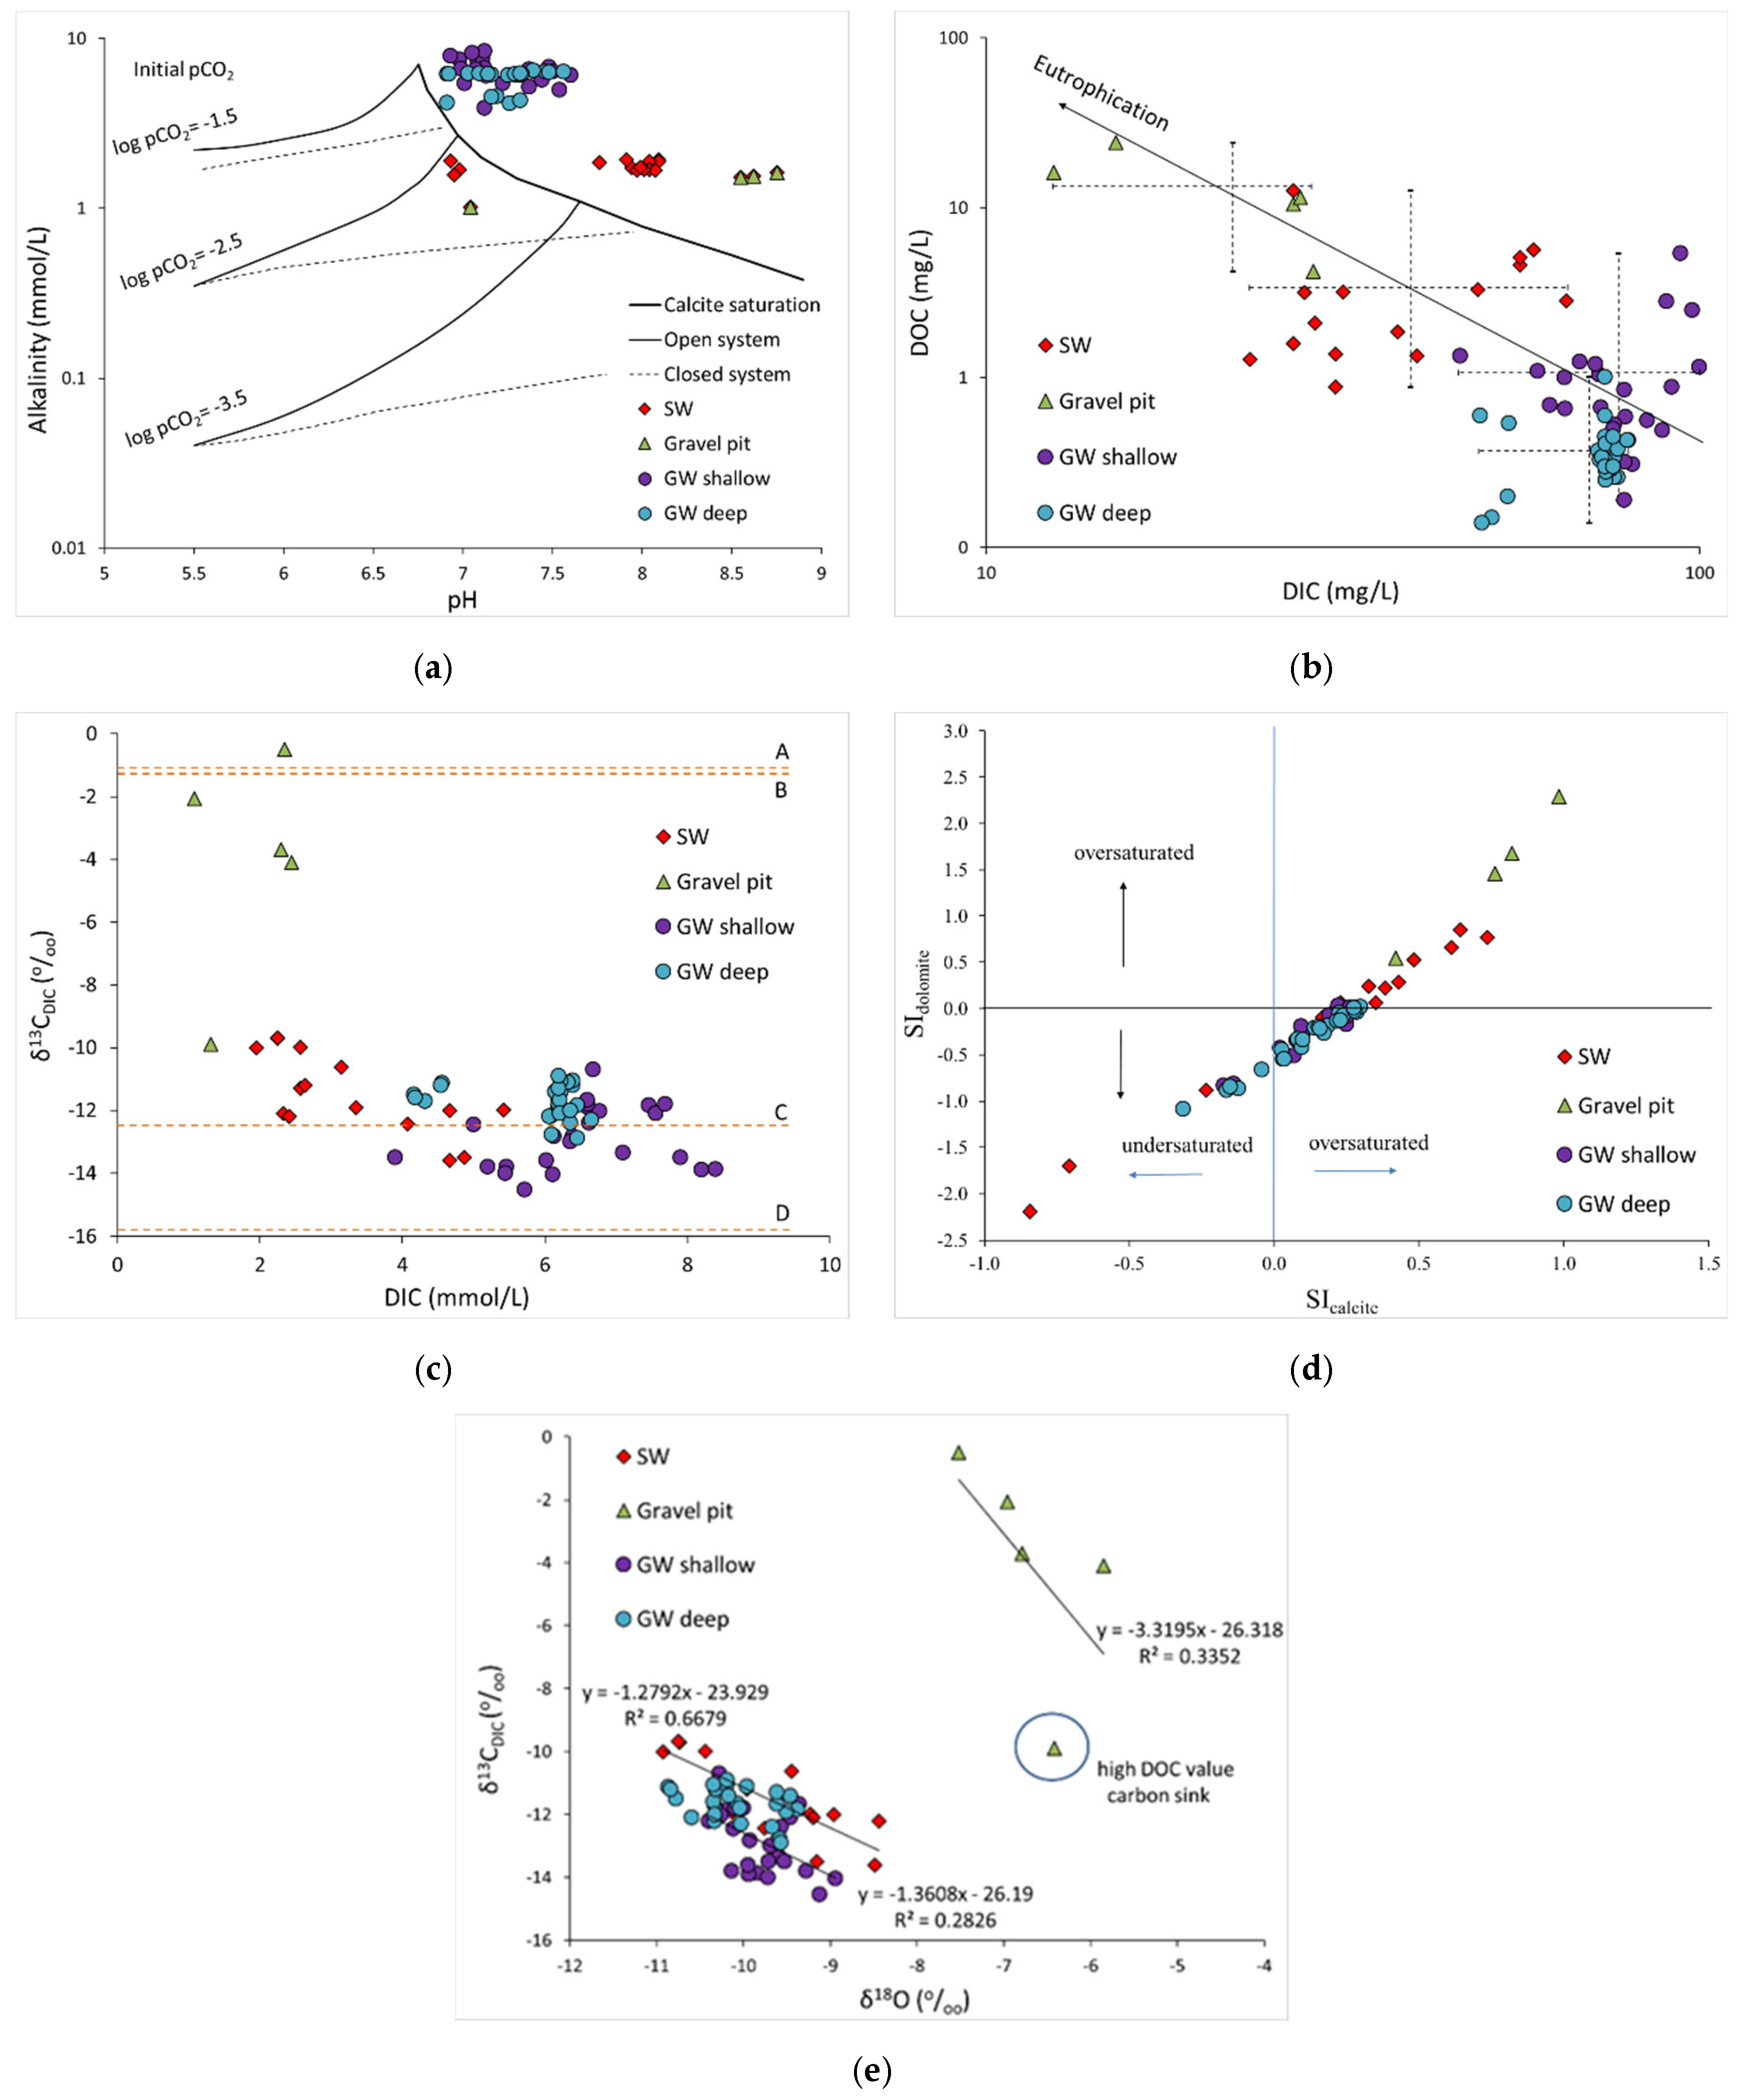
The highest DIC values in GW are observed in the central part of the study area (Figure 4a). The highest DOC values are measured in SW, especially in the gravel pit (Figure 4b). However, DIC values in these waters are low compared to GW (Figure 4a,b). The calculated log pCO2 values are undersaturated with CO2 in gravel pit water, while SW and GW samples are oversaturated with respect to the atmosphere (Figure 4c).
The results show that the spatial distribution of the average values of log pCO2, DIC, and DOC (Figure 4) in the studied SW–GW system depends on the proximity to the river and accumulation lake, GW level, extraction depth (Table 1), presence of oxbow sediments, and land use. Generally, DIC and log pCO2 in GW increased, while DOC concentrations decreased with the distance from the river and lake to the center of the study area (Figure 4). However, these concentrations changed according to land use and the influence of irrigation. The spatial distribution trend of DIC, DOC, and log pCO2 was not entirely in line with the direction of groundwater flow, which indicates that local geochemical processes within the aquifer system have a greater influence on all three parameters than regional groundwater flow.
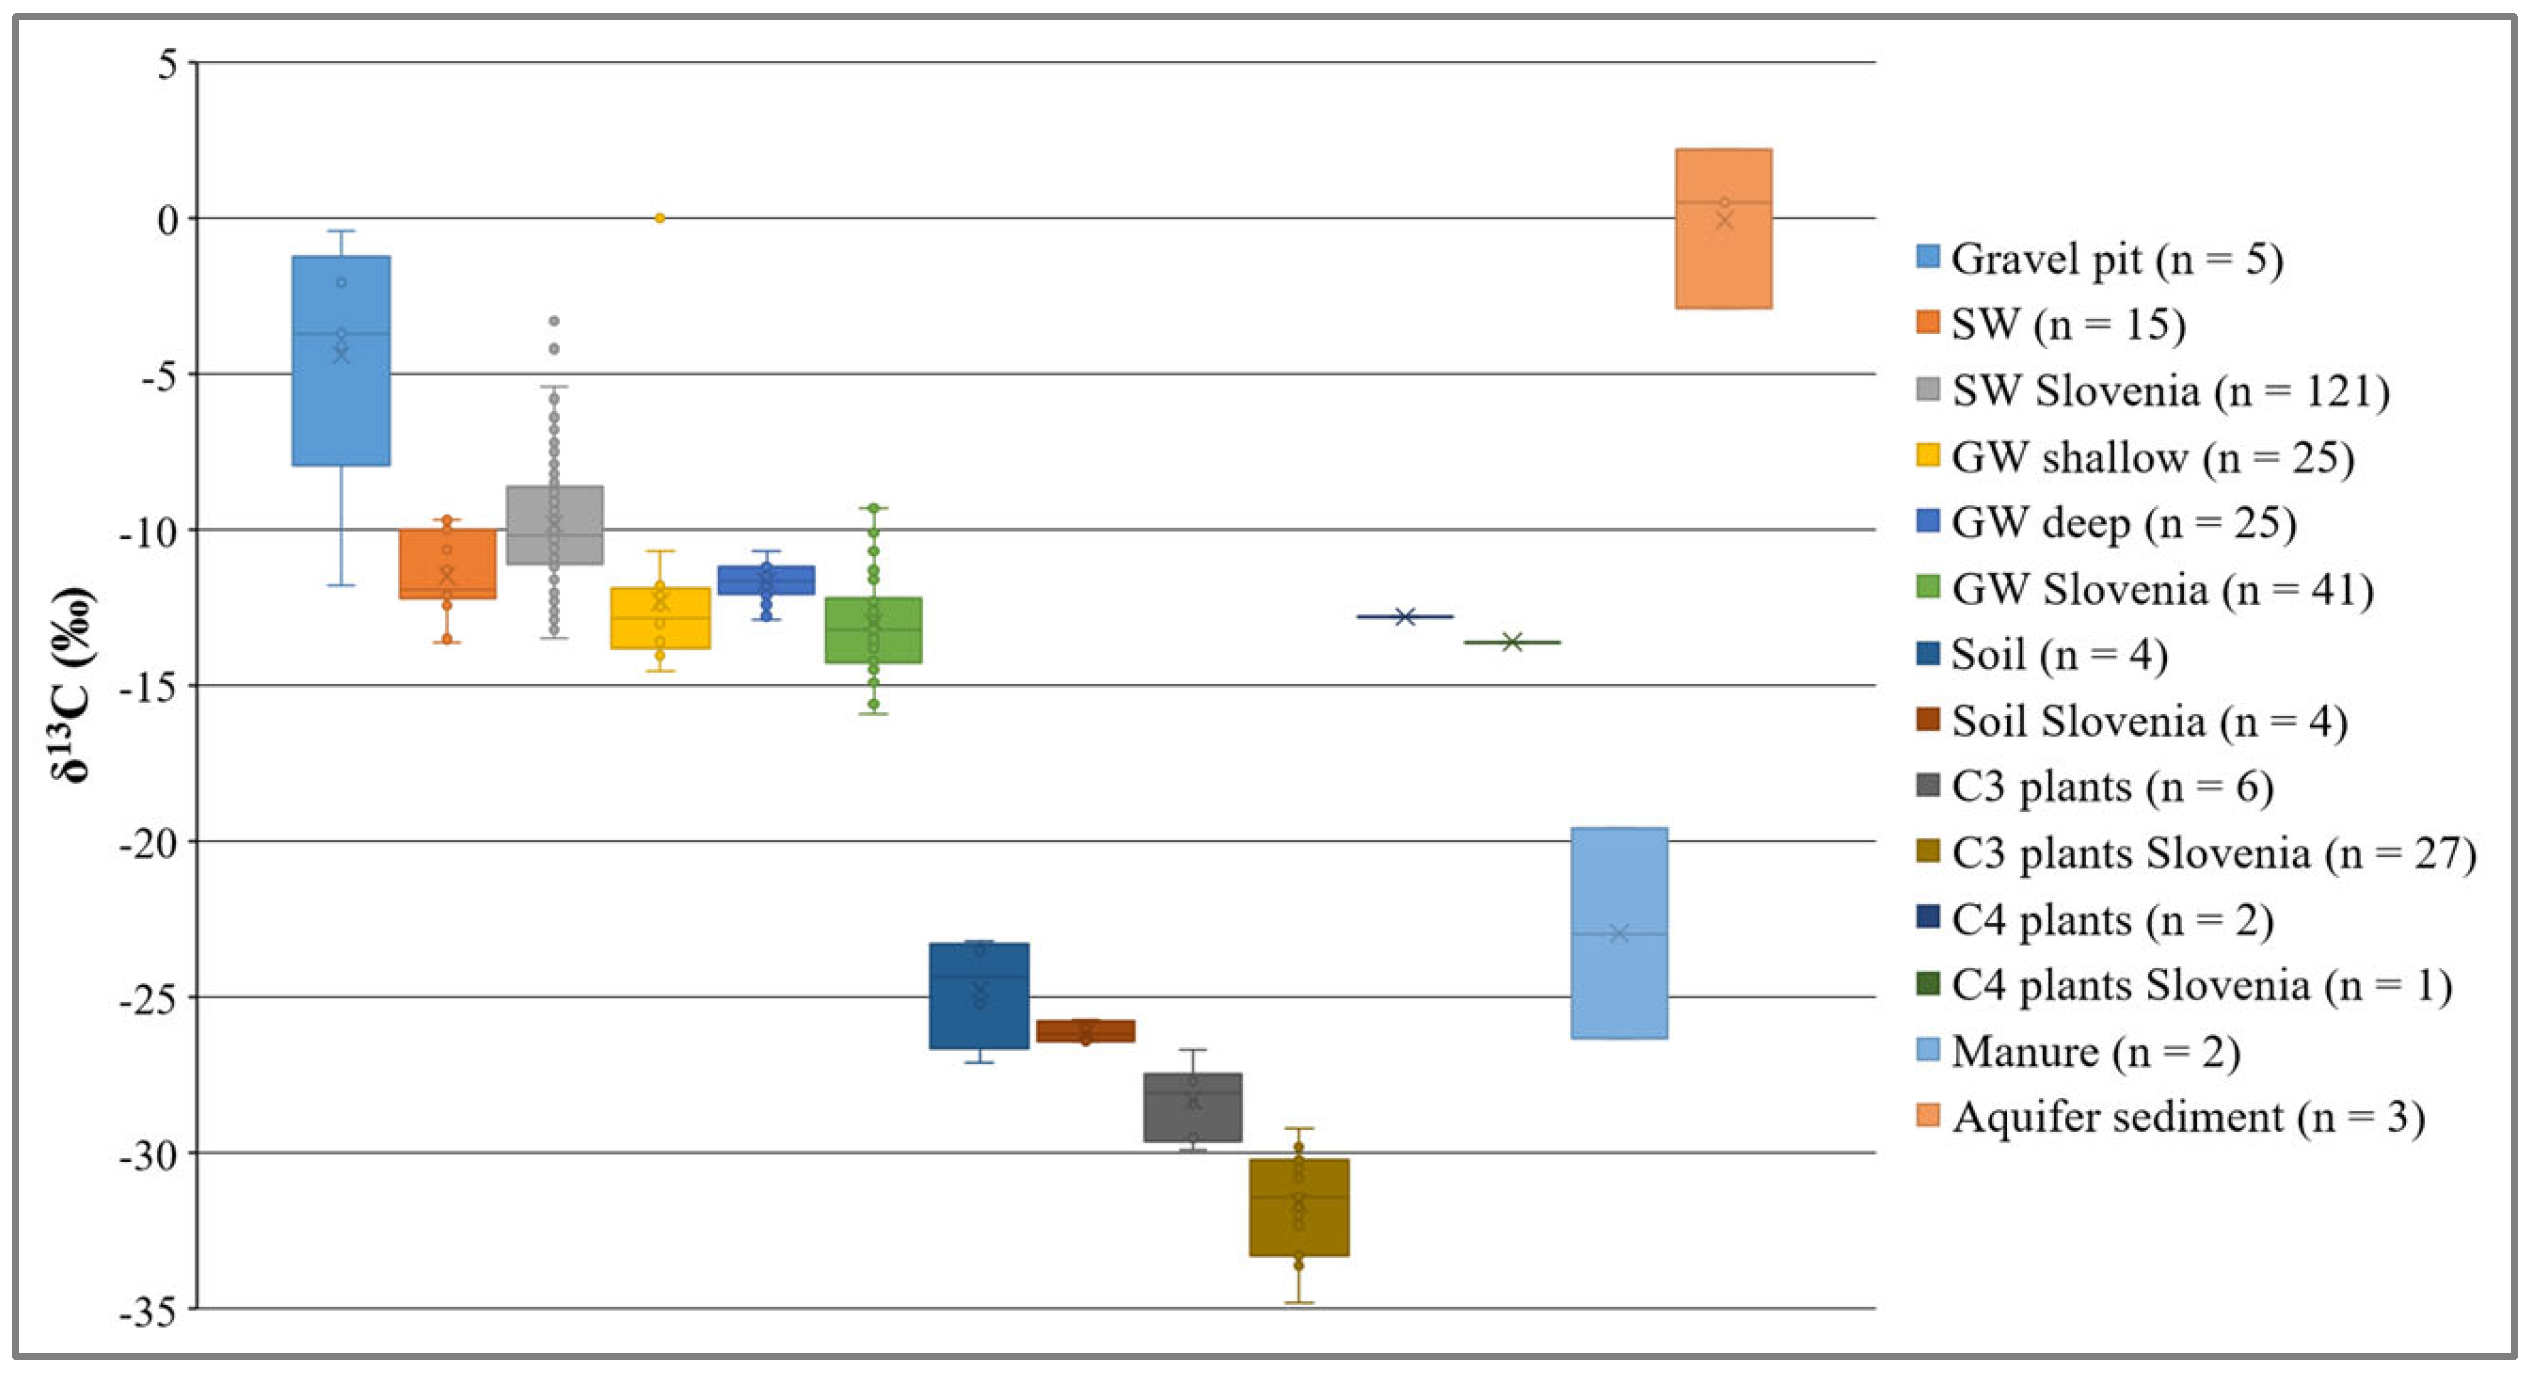
δ13CDIC values varied seasonally from −13.6 to −0.5‰ in SW samples and from −14.5 to −10.7‰ in GW samples (Table 2 and Table S1). The shallow GW samples had more negative δ13CDIC values than samples from GW deep. The δ13Cplant of plant samples ranged from −29.9‰ to 12.8‰ (Figure 5, Table S2). The plants in the studied system were mainly C3 plants, except corn and cabbage, which were C4 plants. The average δ13Ccarb value was −0.1‰, ranging from −2.9‰ to 0.5‰. The average δ13C value in soil samples was −24.8‰, ranging between −27.1 and −23.2‰, while bulk samples had more positive δ13C values and varied from −27.3 to −22.5‰, indicating some carbonate contribution. Considering the average δ13Ccarb value of −0.1‰ (aquifer sediments in Figure 5), the soil carbonate fraction is estimated to be ≤4.3% (Equation (1)). The highest carbonate contribution was observed in soil samples from the Šijanec area, which is attributed to the degradation of cabbage cultivated in this area.
The highest seasonal oscillations of δ13CDIC values, carbon species (DOC, DIC), carbonate cations (Ca2+, Mg2+), and log pCO2 were observed in the gravel pit (Figure S1). Here, the surface water was undersaturated with atmospheric CO2 (Figure 6a). The gravel pit is small, approximately 12,000 m2 with a water depth of 1.5 m to 2.5 m, and it is hydraulically connected with deep GW [52]. The surrounding GW contains high nitrate (60.9 mg/L) and total nitrogen (16.1 mg/L) concentrations [31]. Since this nitrogen-rich groundwater recharges the gravel pit, the pit is full of living microorganisms from April to September (especially in June), containing a large amount of biota, such as eukaryotic algae and Cyanobacteria [52]. The increased input of nutrients into the gravel pit can induce eutrophication (Figure 6b). This biota controls carbon cycling in the gravel pit water by assimilating CO2 from water to the point of CO2 depletion, followed by dissolving atmospheric CO2 in water that is again assimilated. The result is undersaturation in the water regarding log pCO2 in the warmer part of the year (Figure S1). In addition, they produce organic carbon, causing high DOC concentrations (Figure 4b), and can incorporate carbonate on their skeletons, facilitating the precipitation process as nuclei, which are needed for starting the calcite precipitation [53]. These processes cause a decrease in Ca2+ (Figure S1) and DIC levels in the water.
In the Drava River and the accumulation lake, seasonal oscillations of δ13CDIC values, carbon species (DOC, DIC), carbonate cations (Ca2+, Mg2+), and log pCO2 were also observed, but not in such amplitude as in the gravel pit (Figure S1). More negative δ13CDIC values and higher DOC concentrations were also observed during the warmest parts of the year (April to September), which can be attributed to the higher degradation of organic matter leached from terrestrial material into the SW system. Nevertheless, more positive δ13CDIC values were observed during winter and spring due to higher discharge–dilution effect (Table S1). Negligible seasonal oscillations in DOC, DIC, and δ13CDIC were observed in samples from the Plitvica stream, which is attributed to its drainage role in the deeper part of the aquifer [39].
In the shallow GW, more negative δ13CDIC values were measured compared to deep GW, indicating shorter TT of water as it was observed in a case of stable water isotopes values. More negative δ13CDIC values were measured in P-1556 and P-4039 during winter-spring sampling campaigns, which is associated with an increase in groundwater level, interaction of GW with oxbow sediments, and/or rinsing the unsaturated zone. Oxbow sediment contains degrading organic matter, while the unsaturated zone contains organic matter that has migrated from the surface and soil zone. The seasonal variations of log pCO2 (Figure S2) are much more pronounced in shallow GW than in deep GW due to the influence of CO2 from the soil, representing an open system (Figure 6a,c). However, oscillations in DOC, DIC, δ13CDIC, and log pCO2 are less evident in deep GW parts where SW and precipitation are mixed (Figure S2). The transit time of water is an important parameter in controlling carbon cycling within the groundwater system, i.e., shorter time results in rapid changes in carbon species, thus, lowering the possibility of carbon capture in the critical zone system, and vice versa, for longer TT.
3.3. Carbon Sources and Sinks in SW–GW System
Thermodynamic modeling was used to identify whether SW and GW present active sources and sinks for atmospheric CO2 in the Varaždin area. The results indicate that water in the gravel pit acts as an active sink in summer and autumn because log pCO2 is below or close to atmospheric log pCO2 pressure (−3.5 bar), which ensures the dissolution of atmospheric CO2 gas (Figure 6a,d,e). Only in spring and winter, it acts as a source of CO2 to the atmosphere. The water is oversaturated with calcite and dolomite (Figure 6d). During the precipitation of calcite, CO2 is released according to the following equation:
and CO2 consumption during the calcite weathering (see also the Conceptual model):
Ca2+ + 2HCO3− → CaCO3 + CO2(g) + H2O,
CaCO3 + H2O + CO2 → Ca2+ + 2HCO3−
However, existing biota in the water of the gravel pit does not allow the release of the CO2 to the atmosphere via assimilation (photosynthesis), and the eutrophication process is dominant (Figure 6b). In addition, higher δ13CDIC values indicate an open system equilibration with the atmosphere as the most probable process governing δ13CDIC (Figure 6a).
River, lake, and stream waters are oversaturated regarding log pCO2, slightly saturated in calcite, and unsaturated in the case of dolomite for most of the monitored period (Figure 6d). In the Plitvica stream, the eutrophication process is present during the warmer part of the year (red diamonds close to the eutrophication line, Figure 6b). In all three SWs, biota is present, but not in the same amount as in the gravel pit [54]. In the accumulation lake, higher δ13CDIC values indicate that equilibration with air CO2 is the most probable process governing δ13CDIC (Figure 6a). River water samples are scattered around the line C, representing open system equilibration of DIC, with soil CO2 coming from the degradation of organic matter with δ13CCO2 of −24.4‰ (Figure 6c). Consequently, the monitored river, lake, and stream waters act periodically as carbon sinks, but predominantly are carbon sources.
Both shallow and deep GW are oversaturated with respect to log pCO2 and calcite (Figure 6a,d). However, both are undersaturated in dolomite (Figure 6d). The calculated carbonate contribution leached from soil to groundwater is low at about 4%. According to Figure 6c, the minority of shallow and deep GW are around the line C. Most deep GW samples plot above the line C, with δ13Ccarb of −0.1‰, indicative of carbonate dissolution. The shallow GW samples plot mainly above the line, representing nonequilibrium carbonate dissolution by H2CO3 originating in soil (line D). In addition to carbonate minerals, aquifer sediment contains silicate minerals. Weathering of silica minerals in the GW was identified by [31]. The weathering of silica minerals is a longer process than carbonate dissolution [55], and it is typical for aquifers with longer TT. Therefore, this process probably contributes to CO2 formation in the deep GW, causing higher alkalinity of samples (Figure 6a).
3.4. Conceptual Model for Catchment Area Based on Hydrological and Carbon Isotopic Data
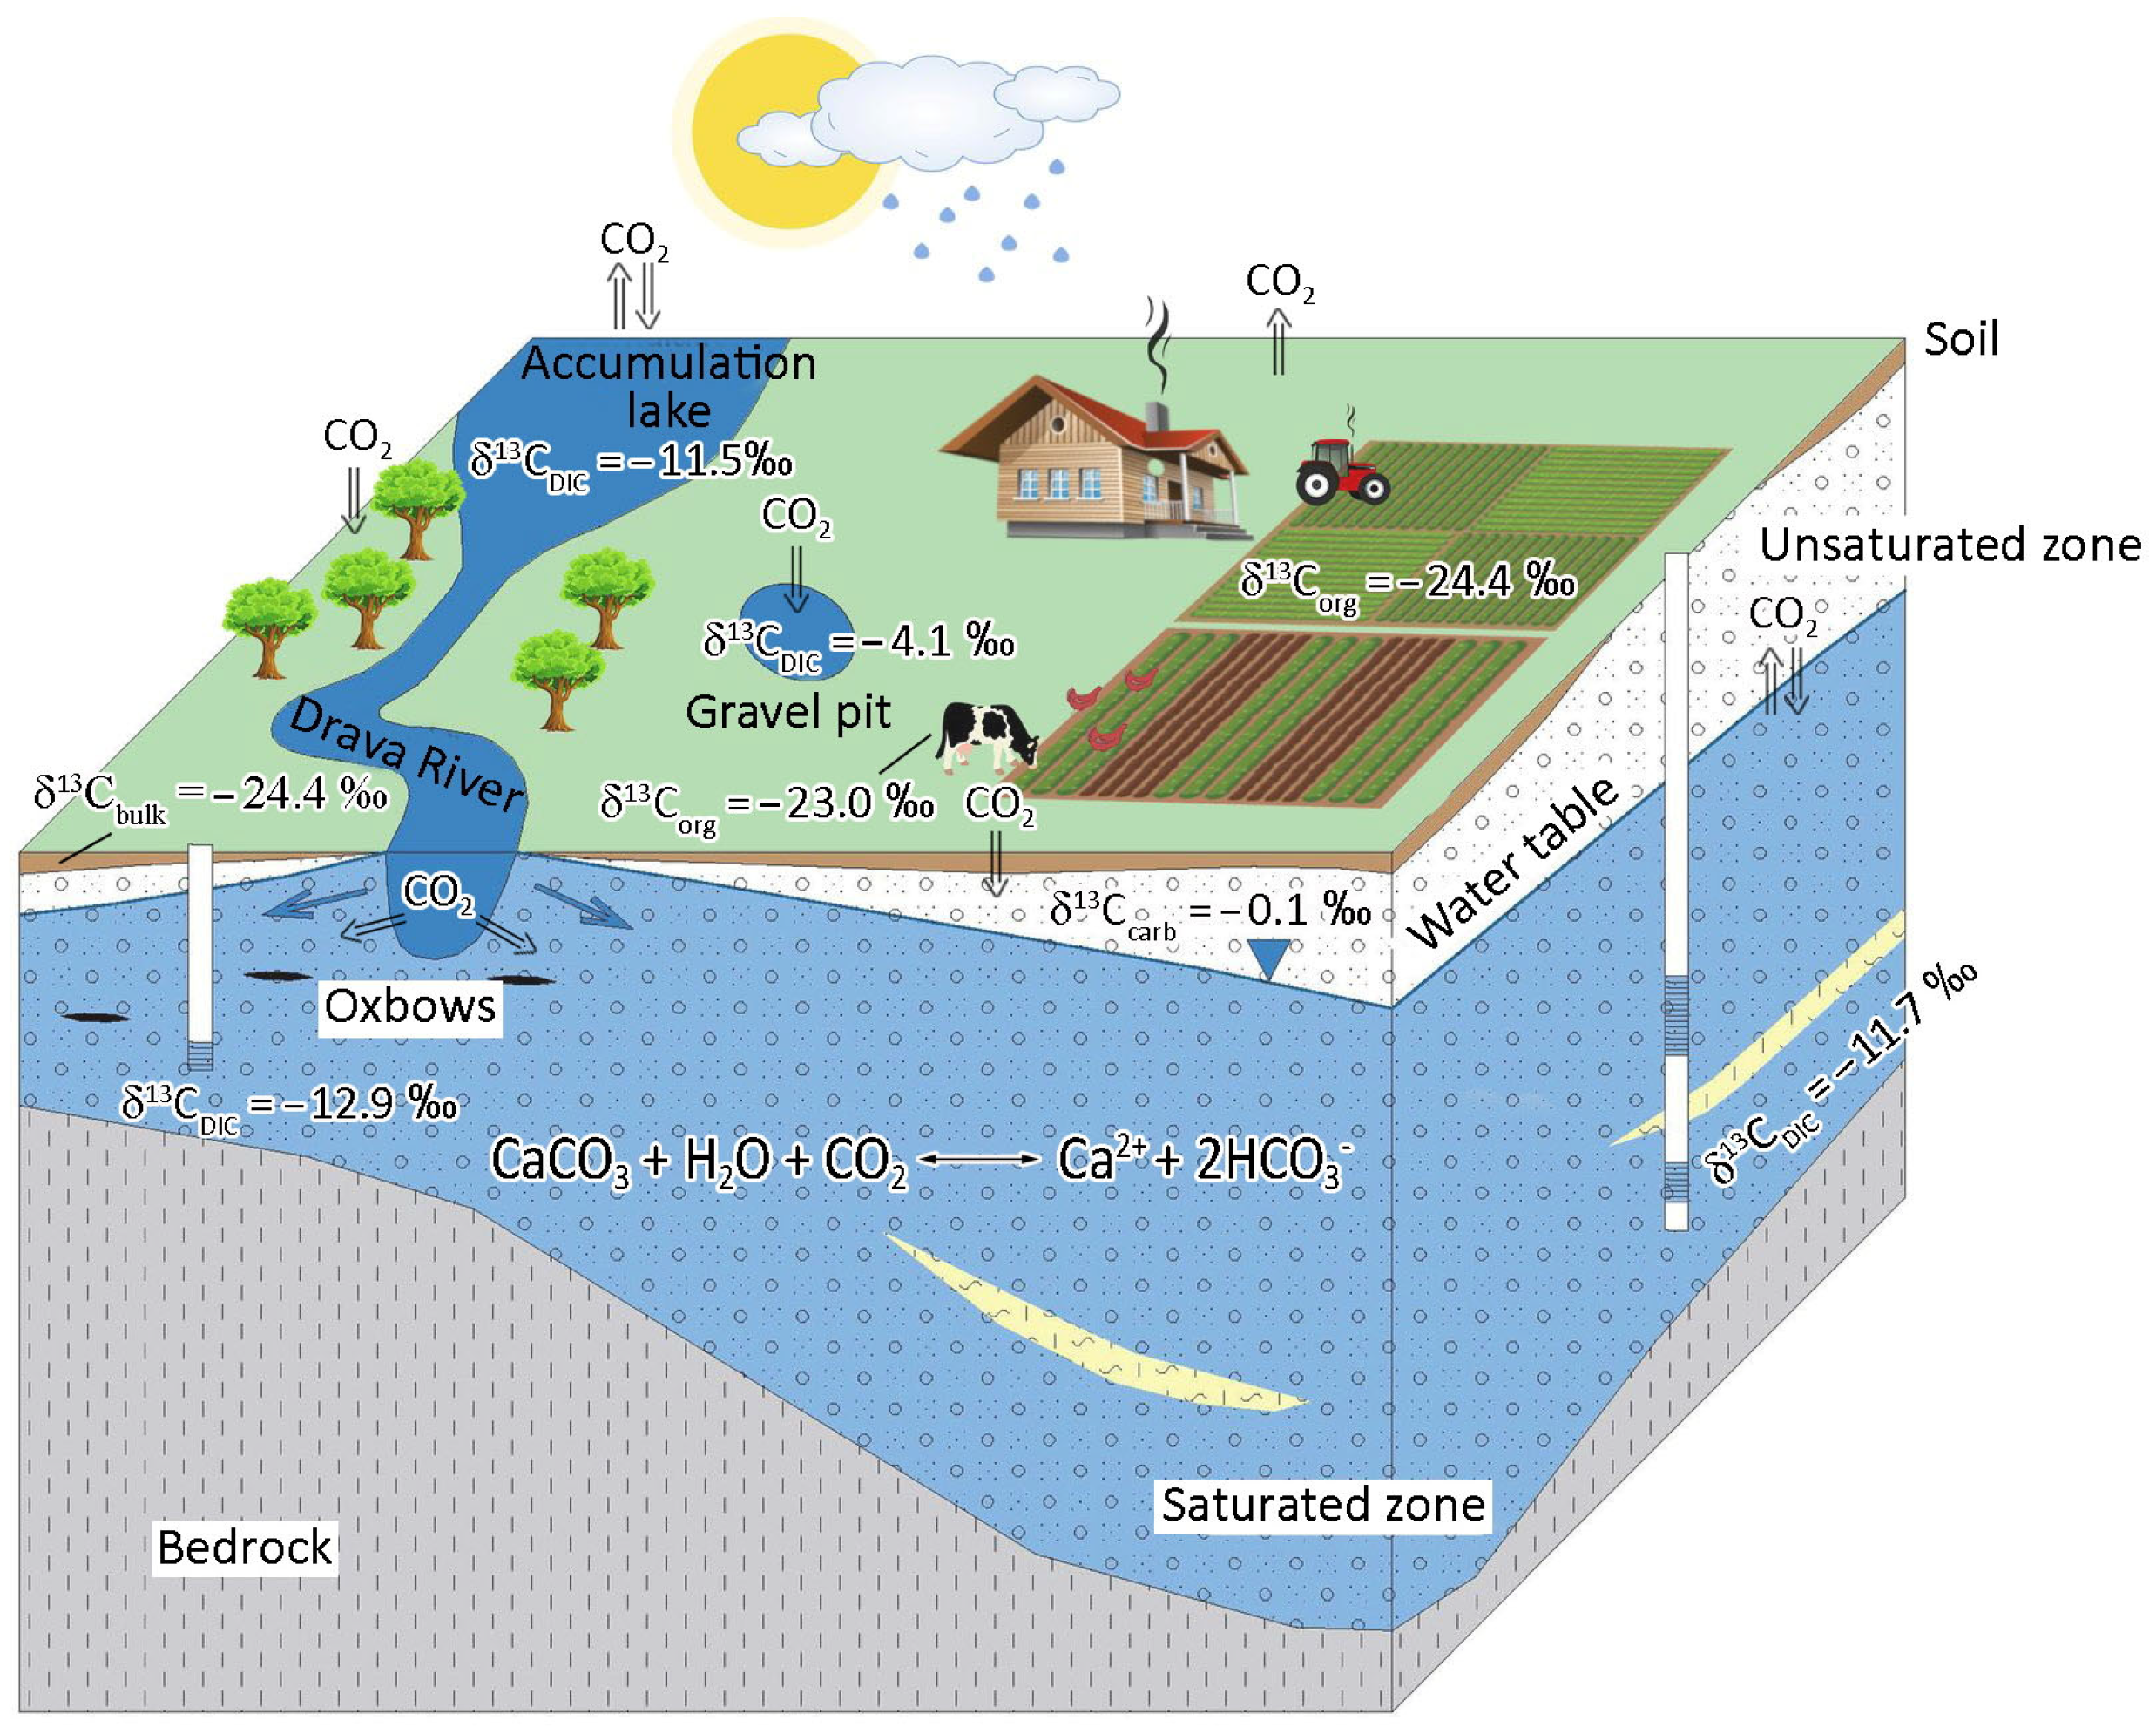
Based on the obtained results, the conceptual model for the critical zone of the Varaždin alluvial aquifer system is created. The sources of carbon in the study area can be divided into two groups: natural (organic matter in soil and sediments, atmosphere) and anthropogenic (fossil fuel consumption, agricultural production, animal and human waste). All aspects of biogeochemical processes (photosynthesis, evaporation/precipitation, leaching, decomposition of organic matter, carbonate precipitation and dissolution) are presented with δ13C values of environmental matrixes in SW, GW, carbonate, soil, manure, plants, and relationships between sources and sinks of CO2 in the Varaždin aquifer (Figure 7).
The studied surface waters (Drava River, Plitvica stream, and accumulation lake) represent the sources of CO2 in the atmosphere and groundwater, while the gravel pit acts as a CO2 sink with slow-moving (standing) water, meaning that CO2 is close to equilibration with atmospheric CO2. Most of the time, groundwater represents a sink, but when precipitation of carbon minerals occurs, it acts as the source of CO2. Groundwater, especially the shallow part, as long as carbonate dissolution occurs, acts as a sink for CO2, not just from soil and the unsaturated zone but also from river and lake waters, because they recharge the groundwater. On the other hand, when carbonate precipitation occurs, GW acts as a source of CO2, which is most of the time.
The estimated DIC flux into groundwater varies from 0.32 GtCy−1 (deep groundwater) to 0.34 GtCy−1 (shallow groundwater). Estimated fluxes of dissolved inorganic carbon for surface water are lower, from 0.02 GtCy−1 in the Plitvica stream to 0.12 GtCy−1 in the Drava River. Estimated carbon fluxes for groundwater are slightly higher than the ones reported by [56]. Alternatively, estimated carbon fluxes for surface water are lower than those for global rivers of 0.4 GtCy−1 [57,58].
4. Conclusions
This paper provides first insights about SW–GW interaction in relation to the aqueous carbon cycle in the study area. Carbon behavior in the SW–GW system was investigated using a multi-parameter approach, within which an evaluation was made of seasonal fluctuations, major biogeochemical processes, the role of CO2 sinks or sources, and carbon fluxes.
Both δ18O/δ2H in water and δ13CDIC have proven to be valuable indicators to distinguish shallow and deep GW, i.e., to differentiate parts of the aquifer according to the transit time of water, which appears to be an important parameter in controlling carbon cycling within the system. Shorter transit time (a couple of years) is characteristic for shallow GW, resulting in rapid changes in carbon species and lower possibility of carbon capture in the system. The lowest δ13CDIC value in shallow GW is related to the influence of CO2 from soil and is subject to seasonal change. Conversely, seasonal changes are not observed in deep GW, where more positive δ13CDIC values are attributed to carbonate dissolution and longer transit time (ten or more years). The spatial variation of dissolved carbon species in groundwater is conditioned by the geometry of the aquifer, which deepens towards the east.
As conceptually illustrated in Figure 7, our results suggest that groundwater acts as both source and sink for CO2, depending on the prevailing geochemical process. Chemical weathering is the main process that drives the carbonate geochemical cycle: in our study the predominant process of CO2 consumption is during weathering (water/rock interactions) in deep GW, while during precipitation of carbonate minerals, the groundwater is a source of CO2 to the atmosphere. The river, lake, and stream waters are primarily a source of CO2, while the gravel pit acts primarily as a sink for CO2. Most positive δ13CDIC value in the gravel pit is a result of eutrophication during the spring/summer season. In comparison to rivers on a global scale, lower estimated carbon fluxes for surface water indicate that the groundwater is not overloaded with carbon from surface water. Our study demonstrates that SW–GW dynamics regulate carbon balance without having negative impacts on groundwater quality by changing the conditions within the aquifer.
The importance of this study is emphasized in the study area, since groundwater is the only source of water for human consumption. Therefore, understanding the interaction between the carbon and water cycles is necessary in any system that relies on sustainable groundwater, since it represents the basis of biogeochemical processes occurring in the aquifer. The methodology used in this study can be implemented by water supply managers in a variety of risk assessments, climate studies, waste managing practice programs, and remediation strategies.
Supplementary Materials
The following are available online at https://www.mdpi.com/article/10.3390/w14213372/s1. Table S1. δ13CDIC values (‰) in water samples; Table S2. δ13C values (‰) in solid samples; Figure S1. Time series of (a) δ13CDIC; (b) DIC; (c) DOC; (d) log pCO2; (e) Ca2+; (f) Mg2+ in surface water; Figure S2. Time series of (a) δ13CDIC; (b) DIC; (c) DOC; (d) log pCO2; (e) Ca2+; (f) Mg2+ in groundwater
Author Contributions
I.K. conceptualization, investigation, data curation, writing—original draft preparation. T.M. conceptualization, investigation, methodology, data curation, formal analysis, visualization, supervision, funding acquisition, writing—original draft preparation. T.K. conceptualization, methodology, data curation, formal analysis, writing—original draft preparation. P.V. conceptualization, visualization, supervision, writing—review and editing. All authors have read and agreed to the published version of the manuscript.
Funding
The present research was supported by the Croatian Scientific Foundation (HRZZ) under grant number HRZZ-IP-2016-06-5365: Origin, fate and TRAnsport modelling of NItrate in the Varaždin ALluvial aquifer“ (TRANITAL); Young Researchers Career Development Project—Training of New PhDs—HRZZ and ESF; COST Action CA19120: WATer isotopeS in the critical zONe: from groundwater recharge to plant transpiration (WATSON), and COST Short Term Scientific Mission under grant number 48561: Hydrogeochemical and isotopic characteristics of Varaždin aquifer.
Institutional Review Board Statement
Not applicable.
Data Availability Statement
The data presented in this study are available in this article and Supplementary Material. Additional data are available on request from the corresponding author.
Conflicts of Interest
The authors declare no conflict of interest.
References
- Sprenger, M.; Stumpp, C.; Weiler, M.; Aeschbach, W.; Allen, S.T.; Benettin, P.; Dubbert, M.; Hartmann, A.; Hrachowitz, M.; Kirchner, J.W.; et al. The demographics of water: A review of water ages in the critical zone. Rev. Geophys. 2019, 57, 800–834. [Google Scholar] [CrossRef] [Green Version]
- National Research Council. Basic Research Opportunities in Earth Science; National Academies Press: Washington, DC, USA, 2001. [Google Scholar]
- Grant, G.E.; Dietrich, W.E. The frontier beneath our feet. Water Resour. Res. 2017, 53, 2605–2609. [Google Scholar] [CrossRef]
- Mayorga, E.; Aufdenkampe, A.K.; Masiello, C.A.; Krusche, A.V.; Hedges, J.I.; Quay, P.D.; Richey, J.E.; Brown, T.A. Young organic matter as a source of carbon dioxide outgassing from Amazonian rivers. Nature 2005, 436, 538–541. [Google Scholar] [CrossRef] [Green Version]
- Kanduč, T.; Szramek, K.; Ogrinc, N.; Walter, L.M. Origin and cycling of riverine inorganic carbon in the Sava River watershed (Slovenia) inferred from major solutes and stable carbon isotopes. Biogeochemistry 2007, 86, 137–154. [Google Scholar] [CrossRef]
- Kanduč, T.; Ogrinc, N.; Mrak, T. Characteristics of suspended matter in the River Sava watershed, Slovenia. Isot. Environ. Health Stud. 2007, 43, 369–385. [Google Scholar] [CrossRef]
- Porowska, D. Determination of the origin of dissolved inorganic carbon in groundwater and reclaimed landfill in Otwock using stable carbon isotopes. Waste Manag. 2015, 39, 216–225. [Google Scholar] [CrossRef]
- Monger, H.C.; Kraimer, R.A.; Khresat, S.; Cole, D.R.; Wang, X.; Wang, J. Sequestration of inorganic carbon in soil and groundwater. Geology 2015, 43, 375–378. [Google Scholar] [CrossRef]
- Druhan, J.L.; Lawrence, C.R.; Coney, A.K.; Giometta, M.G.; Oster, J.L. A reactive transport approach to modelling cave seepage water chemistry I: Carbon isotope transformations. Geochim. Cosmochim. Acta 2021, 311, 374–400. [Google Scholar] [CrossRef]
- Li, C.; Gao, X.; Wang, W.; Zhang, X.; Jiang, C.; Wang, Y. Hydro-biogeochemical processes of surface water: Leakage into groundwater in large scale karst water system: A case study at Jinci, northern China. J. Hydrol. 2021, 596, 125691. [Google Scholar] [CrossRef]
- Zuliani, T.; Kanduč, T.; Novak, R.; Vreča, P. Characterization of bottled waters by multielemental analysis, stable and radiogenic isotopes. Water 2020, 12, 2454. [Google Scholar] [CrossRef]
- Nagode, K.; Kanduč, T.; Zuliani, T.; Bračič-Železnik, B.; Jamnik, B.; Vreča, P. Daily fluctuations in the isotope and elemental composition of tap water in Ljubljana, Slovenia. Water 2021, 13, 1451. [Google Scholar] [CrossRef]
- Atekwana, E.A.; Krishnamurthy, R.V. Seasonal variations of dissolved inorganic carbon and δ13C of surface waters: Application of a modified gas evolution technique. J. Hydrol. 1998, 205, 265–278. [Google Scholar] [CrossRef]
- Colombani, N.; Mostracicco, M.; Costaldelli, G.; Aravena, R. Contrasting biogeochemical processes revealed by stable isotopes of H2O, N, C, S in shallow aquifers underlying agricultural lowlands. Sci. Total Environ. 2019, 691, 1283–1296. [Google Scholar] [CrossRef]
- Berner, R.A. Biological aspects of the long-term carbon cycle. Bull. Inst. Océanogr. 1996, 14, 11–22. [Google Scholar]
- Scholes, R.J.; Monteiro, P.M.; Sabine, C.L.; Canadell, J.G. Systematic long-term observations of the global carbon cycle. Trends Ecol. Evol. 2009, 24, 427–430. [Google Scholar] [CrossRef] [PubMed]
- Kanduč, T.; Šlejkovec, Z.; Vreča, P.; Samardžija, Z.; Verbovšek, T.; Božič, D.; Jamnikar, S.; Solomon, D.K.; Fernandez, D.P.; Eastoe, C.; et al. The effect of geochemical processes on groundwater in the Velenje coal basin, Slovenia: Insights from mineralogy, trace elements and isotope signatures. SN Appl. Sci. 2018, 1, 1518. [Google Scholar] [CrossRef] [Green Version]
- Mahlangu, S.; Lorentz, S.; Diamond, R.; Dippenaar, M. Surface water—Groundwater interaction using tritium and stable water isotopes: A case study of Middelburg, South Africa. J. Afr. Earth Sci. 2020, 171, 103886. [Google Scholar] [CrossRef]
- Marković, T.; Karlović, I.; Perčec Tadić, M.; Larva, O. Application of Stable Water Isotopes to Improve Conceptual Model of Alluvial Aquifer in the Varaždin Area. Water 2020, 12, 379. [Google Scholar] [CrossRef] [Green Version]
- Karlović, I.; Marković, T.; Vujnović, T. Groundwater Recharge Assessment Using Multi Component Analysis: Case Study at the NW Edge of the Varaždin Alluvial Aquifer, Croatia. Water 2022, 14, 42. [Google Scholar] [CrossRef]
- Rozanski, K.; Araguas-Araguas, L.; Gonfiantini, R. Isotopic patterns in modern global precipitation. Continental Isotopic Indicators of Climate. Am. Geophys. Union Monogr. 1993, 78, 1–36. [Google Scholar]
- Vreča, P.; Krajcar Bronić, I.; Horvatinčić, N.; Barešić, J. Isotopic characteristics of precipitation in Slovenia and Croatia: Comparison of continental and maritime stations. J. Hydrol. 2006, 330, 457–469. [Google Scholar] [CrossRef]
- Dotsika, E.; Lykoudis, S.; Poutoukis, D. Spatial distribution of the isotopic composition of precipitation and spring water in Greece. Glob. Planet. Change 2010, 71, 141–149. [Google Scholar] [CrossRef]
- Kanduč, T.; Mori, N.; Kocman, D.; Stibilj, V.; Grassa, F. Hydrogeochemistry of Alpine springs from North Slovenia: Insights from stable isotopes. Chem. Geol. 2012, 300–301, 40–54. [Google Scholar] [CrossRef]
- Lukač Reberski, J.; Marković, T.; Nakić, Z. Definition of the river Gacka springs subcatchment areas on the basis of hydrogeological parameters. Geol. Croat. 2013, 66, 39–53. [Google Scholar] [CrossRef]
- Marković, T.; Brkić, Ž.; Larva, O. Using hydrochemical data and modelling to enhance the knowledge of groundwater flow and quality in an alluvial aquifer of Zagreb, Croatia. Sci. Total Environ. 2013, 458–460, 508–516. [Google Scholar] [CrossRef]
- Kanduč, T.; Grassa, F.; McIntosh, J.; Stibilj, V.; Ulrich-Supovec, M.; Supovec, I.; Jamnikar, S. A geochemical and stable isotope investigation of groundwater/surface water interactions in the Velenje Basin, Slovenia. Hydrogeol. J. 2014, 22, 971–984. [Google Scholar] [CrossRef]
- Cervi, F.; Dadomo, A.; Martinelli, G. The Analysis of Short-Term Dataset of Water Stable Isotopes Provides Information on Hydrological Processes Occurring in Large Catchments from the Northern Italian Apennines. Water 2019, 11, 1360. [Google Scholar] [CrossRef] [Green Version]
- Gross, E.; Andrews, S.; Bergamaschi, B.; Downing, B.; Holleman, R.; Burdick, S.; Durand, D. The Use of Stable Isotope-Based Water Age to Evaluate a Hydrodynamic Model. Water 2019, 11, 2207. [Google Scholar] [CrossRef] [Green Version]
- Hepburn, E.; Cendón, D.I.; Bekele, D.; Currel, M. Environmental isotopes as indications of groundwater recharge, residence times and salinity in a coastal urban redevelopment precinct in Australia. Hydrogeol. J. 2020, 28, 503–520. [Google Scholar] [CrossRef]
- Karlović, I.; Marković, T.; Šparica Miko, M.; Maldini, K. Geochemical Characteristics of Alluvial Aquifer in the Varaždin Region. Water 2021, 13, 1508. [Google Scholar] [CrossRef]
- Karlović, I.; Marković, T.; Vujnović, T.; Larva, O. Development of a Hydrogeological Conceptual Model of the Varaždin Alluvial Aquifer. Hydrology 2021, 8, 19. [Google Scholar] [CrossRef]
- Corine Land Cover. Available online: https://land.copernicus.eu/pan-european/corine-land-cover/clc2018 (accessed on 22 September 2022).
- Prelogović, E.; Velić, I. Quaternary tectonic activity in western part of Drava basin. Geol. Vjesn. 1988, 41, 237–253. [Google Scholar]
- Babić, Ž.; Čakarun, I.; Sokač, A.; Mraz, V. On geological features of quaternary sediments of Drava basin on Croatian territory. Geol. Vjesn. 1978, 30, 43–61. [Google Scholar]
- Urumović, K.; Hlevnjak, B.; Prelogović, E.; Mayer, D. Hydrogeological conditions of Varaždin aquifer. Geol. Vjesn. 1990, 43, 149–158. [Google Scholar]
- Crnički, J. Mineralne sirovine varaždinske regije i njihovo privredno značenje. In Varaždinski Zbornik 1181-1981. Varaždin, Croatia, 1–3 October 1981; Mohorovičić, A., Ed.; Jugoslavenska Akademija Znanosti i Umjetnosti: Zagreb, Croatia, 1983; pp. 75–85. [Google Scholar]
- Mioč, P.; Marković, S. Osnovna Geološka Karta SFRJ 1:100.000. Tumač za List Čakovec L33–57 (Basic Geological Map of SFRY, Scale 1:100.000. The Map Book for Sheet Čakovec L33–57); Geological Survey: Zagreb, Croatia; Geological, Geotechnical and Geophysical Survey: Ljubljana, Slovenia, 1998. (In Croatian) [Google Scholar]
- Karlović, I.; Pavlić, K.; Posavec, K.; Marković, T. Analysis of the hydraulic connection of the Plitvica stream and the groundwater of the Varaždin alluvial aquifer. Geofizika 2021, 38, 15–35. [Google Scholar] [CrossRef]
- Nimac, I.; Perčec Tadić, M. New 1981–2010 Climatological Normals for Croatia and Comparison to Previous 1961–1990 and 1971–2000 Normals, Proceedings from GeoMLA Conference; University of Belgrade—Faculty of Civil Engineering: Belgrade, Serbia, 2016; pp. 79–85. [Google Scholar]
- Miyajima, T.; Yamada, Y.; Hanba, Y.T. Determining the stable isotope ratio of total dissolved inorganic carbon in lake water by GC/C/IRMS. Limnol. Oceanogr. 1995, 40, 994–1000. [Google Scholar] [CrossRef]
- Spötl, C. A robust and fast method of sampling and analysis of δ13C of dissolved inorganic carbon in groundwaters. Isot. Environ. Health Stud. 2005, 41, 217–221. [Google Scholar] [CrossRef]
- Coplen, T.B. New guidances for reporting stable hydrogen, carbon and oxygen isotopes ratio data. Geochim. Cosmochim. Acta 1996, 60, 390–3360. [Google Scholar] [CrossRef]
- Brand, W.A.; Coplen, T.B.; Vogl, J.; Rosner, M.; Prohaska, T. Assessment of international reference materials for isotope-ratio analysis (IUPAC technical report). Pure Appl. Chem. 2014, 86, 425–467. [Google Scholar] [CrossRef] [Green Version]
- McCrea, J.M. On the Isotopic chemistry of carbonates and a paleo temperature Scale. J. Chem. Phys. 1950, 18, 849–857. [Google Scholar] [CrossRef]
- Parkhurst, D.L.; Appelo, C.A.J. Description of Input and Examples for PHREEQC Version 3—A Computer Program for Speciation, Batch-Reaction, One-Dimensional Transport, and Inverse Geochemical Calculations; U.S. Geological Survey Techniques and Methods, Book 6; USGS: Denver, CO, USA, 2013; Chapter A43; p. 497. Available online: https://pubs.usgs.gov/tm/06/a43/ (accessed on 22 September 2022).
- Zhong, J.; Li, S.; Tao, F.; Yue, F.; Liu, C.-Q. Sensitivity of chemical weathering and dissolved carbon dynamics to hydrological conditions in a typical karst river. Sci. Rep. 2017, 7, 42944. [Google Scholar] [CrossRef] [PubMed] [Green Version]
- Hunjak, T.; Lutz, H.O.; Roller-Lutz, Z. Stable isotope composition of the meteoric precipitation in Croatia. Isot. Environ. Health Stud. 2013, 49, 336–345. [Google Scholar] [CrossRef] [PubMed]
- Karlović, I.; Posavec, K.; Larva, O.; Marković, T. Numerical groundwater flow and nitrate transport assessment in alluvial aquifer of Varaždin region, NW Croatia. J. Hydrol. Reg. Stud. 2022, 41, 101084. [Google Scholar] [CrossRef]
- Kanduč, T. Hidrogeokemične Značilnosti in Kroženje Ogljika v Porečju Reke Save v Sloveniji. PhD Thesis, University of Ljubljana, Faculty of Natural Sciences and Engineering, Department of geology, Ljubljana, Slovenia, 2006; p. 141, appendixes. (In Slovenian). [Google Scholar]
- Šturm, M.; Vreča, P.; Krajcar Bronić, I. Carbon isotopic composition (δ13C and 14C activity) of plant samples in the vicinity of the Slovene nuclear power plant. J. Environ. Radioact. 2012, 110, 24–29. [Google Scholar] [CrossRef]
- Kulaš, A.; Marković, T.; Žutinić, P.; Kajan, K.; Karlović, I.; Orlić, S.; Keskin, E.; Filipović, V.; Gligora Udovič, M. Succession of Microbial Community in a Small Water Body within the Alluvial Aquifer of a Large River. Water 2021, 13, 115. [Google Scholar] [CrossRef]
- Barth, J.A.C.; Veizer, J. Carbon cycle in St. Lawrence aquatic ecosystems at Cornwall (Ontario), Canada: Seasonal and spatial variations. Chem. Geol. 1999, 159, 107–128. [Google Scholar] [CrossRef]
- Kulaš, A.; Gligora Udovič, M.; Žutinić, P. Biodervisity Report for Surface Waters Drava River, Accumulation Lake Varaždin, Gravel Pit in Šijanec and Plitvica Stream for the TRANITAL Project; Croatian Geological Survey: Zagreb, Croatia, 2019; 50p. (In Croatian) [Google Scholar]
- Wollast, R.; Chou, L. Rate control of weathering of silicate minerals at room temperature and pressure. In Physical and Chemical Weathering in Geochemical Cycles; Lerman, A., Meybeck, M., Eds.; NATO ASI Series; Springer: Dordrecht, The Netherlands, 1988; Volume 251. [Google Scholar] [CrossRef]
- Kessler, T.J.; Harvey, C.F. The global flux of carbon dioxide into groundwater. Geophys. Res. Lett. 2001, 28, 279–282. [Google Scholar] [CrossRef] [Green Version]
- Cai, W.-J.; Guo, X.; Chen, C.-T.A.; Dai, M.; Zhang, L.; Zhai, W.; Lohrenz, S.E.; Yin, K.; Harrison, P.J.; Wang, Y. A comparative overview of weathering intensity and HCO3− flux in the world’s major rivers with emphasis on the Changjiang, Huanghe, Zhujiang (Pearl) and Mississippi Rivers. Cont. Shelf Res. 2008, 28, 1538–1549. [Google Scholar] [CrossRef]
- Hartmann, J.; Jansen, N.; Dürr, H.H.; Kempe, S.; Köhler, P. Global CO2-consumption by chemical weathering: What is the contribution of highly active weathering regions? Glob. Planet. Change 2009, 69, 185–194. [Google Scholar] [CrossRef]
Figure 1.
Map showing the geographical location of the study area with sampling sites (a), and the representative hydrogeological cross-section A–B (b). Observation wells (black) are located precisely on the cross-section, while the positions of the observation wells (white) are only approximated. The general groundwater flow direction is presented for average groundwater levels [32].

Figure 2.
Piper diagram of sampled waters. Blue circles—GW deep; Violet circles—GW shallow; Pink circles—GW shallow water from P-4039; Red diamonds—SW; Green triangles—gravel pit.
Figure 2.
Piper diagram of sampled waters. Blue circles—GW deep; Violet circles—GW shallow; Pink circles—GW shallow water from P-4039; Red diamonds—SW; Green triangles—gravel pit.

Figure 3.
Distribution of GW and SW δ18O and δ2H values around the LMWLs Varaždin (modified after [19]).
Figure 3.
Distribution of GW and SW δ18O and δ2H values around the LMWLs Varaždin (modified after [19]).

Figure 4.
Spatial distribution of average values within Varaždin SW–GW system: (a) DIC; (b) DOC; (c) log pCO2.
Figure 4.
Spatial distribution of average values within Varaždin SW–GW system: (a) DIC; (b) DOC; (c) log pCO2.

Figure 5.
The δ13C of plants, soil, manure, aquifer sediment, δ13CDIC of SW and GW in the Varaždin aquifer area compared to the δ13C and δ13CDIC values (river water, groundwater) from the nearby Slovenian Sava study area [5,6,50,51].

Figure 6.
Plots of selected chemical and isotopic parameters: (a) Variation of alkalinity vs. pH; (b) DOC vs. DIC; (c) Variation in the δ13CDIC vs. DIC in the groundwater–surface water aquifer system. Orange dashed lines represent fractionation lines: (A) Open system DIC equilibration with the atmosphere with an average value of −1.2‰; (B) Dissolution of carbonate with δ13Ccarb of −0.1‰, providing the δ13CDIC of −1.1‰; (C) Open system equilibration of DIC with soil CO2 originating from degradation of organic matter with δ13CCO2 of −24.4‰; (D) Nonequilibrium carbonate dissolution with δ13CCO2 of −24.4‰; (d) relationship between saturation indices of calcite and dolomite; (e) relationship between δ18O of groundwater and δ13CDIC.

Figure 7.
A conceptual 3D block diagram presenting a conceptual model of the critical zone in the Varaždin SW-GW system.
Figure 7.
A conceptual 3D block diagram presenting a conceptual model of the critical zone in the Varaždin SW-GW system.


Table 1.
Observation Wells Information.
| Observation Well | Latitude (° N) | Longitude (° E) | Elevation (m a.s.l.) | Well Depth (m) | Type of Well | Depth Interval of the Screen (m) | Min Water Level (m a.s.l.) | Max Water Level (m a.s.l.) |
|---|---|---|---|---|---|---|---|---|
| Private well | 46.325158 | 16.293106 | 176.00 | 15.0 | Deep | 5–15 | 169.28 | 169.90 |
| PDS-5 | 46.292462 | 16.25173 | 178.36 | 31.0 | Deep | 13.7–19.7 | 174.25 | 174.86 |
| PDS-6 | 46.324993 | 16.233373 | 184.07 | 25.0 | Deep | 11.7–17.7 | 176.05 | 177.20 |
| PDS-7 | 46.303596 | 16.291492 | 175.71 | 42.5 | Deep | 29.3–32.3 | 170.26 | 170.84 |
| P-1529 | 46.359419 | 16.200068 | 187.32 | 8.0 | Shallow | n.a. 1 | 181.98 | 182.40 |
| P-1530 | 46.337192 | 16.194381 | 183.72 | 7.5 | Shallow | n.a. 1 | 177.46 | 178.31 |
| P-1556 | 46.401421 | 16.142607 | 193.03 | 5.6 | Shallow | n.a. 1 | 190.11 | 190.77 |
| P-2500 | 46.271647 | 16.354878 | 167.81 | 5.2 | Shallow | n.a. 1 | 164.61 | 165.02 |
| P-4039 | 46.264594 | 16.350134 | 167.76 | 8.0 | Shallow | n.a. 1 | 164.62 | 165.29 |
| SPV-11 | 46.351711 | 16.296098 | 177.69 | 40.0 | Deep | 24.5–35.8 | 170.96 | 171.51 |
Note(s): 1 information about screen interval was unavailable.
Table 2.
The minimum, maximum, and average physical, physicochemical, chemical, and isotopic parameters for surface water (SW) and groundwater (GW) for five sampling campaigns.
Table 2.
The minimum, maximum, and average physical, physicochemical, chemical, and isotopic parameters for surface water (SW) and groundwater (GW) for five sampling campaigns.
| Sampling Point | SW | Gravel Pit | GW Shallow | GW Deep | ||||||||
|---|---|---|---|---|---|---|---|---|---|---|---|---|
| Values | Min | Max | Average | Min | Max | Average | Min | Max | Average | Min | Max | Average |
| EC (µS/cm) | 232 | 584 | 403 | 229 | 332 | 283 | 660 | 1091 | 807 | 434 | 769 | 669 |
| T (°C) | 3.3 | 22.7 | 13.9 | 3.0 | 32.1 | 18.3 | 8.8 | 15.6 | 13.3 | 12.1 | 13.6 | 12.8 |
| pH | 6.93 | 8.09 | 7.87 | 7.04 | 10.09 | 8.61 | 6.93 | 7.6 | 7.22 | 6.91 | 7.56 | 7.22 |
| DO (mg/l) | 6.4 | 12.7 | 9.4 | 10.5 | 19.5 | 14.6 | 0.2 | 11.8 | 5.6 | 1.5 | 11 | 7.3 |
| Ca2+ (mg/L) | 38.9 | 85.6 | 55.0 | 13.3 | 35.4 | 25.3 | 87.5 | 136.2 | 111.3 | 74.0 | 120.8 | 104.5 |
| Mg2+ (mg/L) | 6.6 | 17.1 | 11.7 | 14.5 | 17.0 | 16.3 | 16.5 | 25.3 | 20.5 | 16.3 | 21.5 | 19.5 |
| Na+ (mg/L) | 3.5 | 11.4 | 7.6 | 6.0 | 8.9 | 7.3 | 5.3 | 80.0 | 24.2 | 2.4 | 10.4 | 6.1 |
| K+ (mg/L) | 0.7 | 3.3 | 1.9 | 0.6 | 1.1 | 0.9 | 1.1 | 6.7 | 3.4 | 0.4 | 12.6 | 4.1 |
| DIC (mg/L) | 23.4 | 65.0 | 39.3 | 12.4 | 28.7 | 22.2 | 46.2 | 99.9 | 77.0 | 49.3 | 79.1 | 70.0 |
| DOC (mg/L) | 0.9 | 12.6 | 3.4 | 4.2 | 24.3 | 13.3 | 0.2 | 5.4 | 1.0 | 0.1 | 1.0 | 0.4 |
| HCO3− (mg/L) | 122 | 334 | 203 | 66 | 149 | 116 | 238 | 512 | 395 | 254 | 406 | 360 |
| δ13CDIC (‰) | −13.6 | −9.7 | −11.5 | −9.9 | −0.5 | −4.1 | −14.5 | −10.7 | −12.9 | −12.9 | −10.9 | −11.7 |
| δ18O (o/oo) | −10.93 | −8.44 | −9.73 | −7.52 | −5.85 | −6.71 | −10.40 | −8.94 | −9.80 | −10.87 | −9.38 | −10.09 |
| δ2H (o/oo) | −76.2 | −56.6 | −66.9 | −52.7 | −47.4 | −49.6 | −71.5 | −61.2 | −67.1 | −75.6 | −65.3 | −70.7 |
| Cl− (mg/L) | 5.5 | 13.8 | 9.5 | 12.4 | 15.9 | 13.8 | 7.1 | 212.7 | 46.8 | 6.7 | 19.5 | 12.7 |
| SO42− (mg/L) | 18.4 | 27.2 | 22.3 | 22.2 | 27.4 | 24.4 | 20.1 | 35.4 | 26.0 | 22.0 | 33.6 | 26.9 |
| PO43−-P (mg/L) | <0.01 | 0.07 | 0.03 | 0.01 | 0.06 | 0.03 | <0.01 | 0.16 | 0.04 | <0.01 | 0.04 | 0.02 |
| NH4+ (mg/L) | <0.01 | 0.18 | 0.03 | <0.01 | 0.35 | 0.12 | <0.01 | 0.06 | 0.03 | <0.01 | 0.02 | 0.02 |
| NO2− (mg/L) | 0.006 | 0.101 | 0.03 | 0.014 | 0.199 | 0.07 | <0.001 | 0.026 | 0.007 | <0.001 | 0.033 | 0.006 |
| NO3− (mg/L) | 5.3 | 23.2 | 11.3 | 5.1 | 13.7 | 11.2 | <0.1 | 58.9 | 35.5 | <0.1 | 95.6 | 49.0 |
| SiO2 (mg/L) | 1.0 | 18.9 | 10.3 | 3.2 | 25.0 | 12.2 | 10.1 | 24.7 | 14.5 | 11.5 | 18.9 | 14.6 |
Publisher’s Note: MDPI stays neutral with regard to jurisdictional claims in published maps and institutional affiliations. |
© 2022 by the authors. Licensee MDPI, Basel, Switzerland. This article is an open access article distributed under the terms and conditions of the Creative Commons Attribution (CC BY) license (https://creativecommons.org/licenses/by/4.0/).
Share and Cite
MDPI and ACS Style
Karlović, I.; Marković, T.; Kanduč, T.; Vreča, P. Assessment of Seasonal Changes on the Carbon Cycle in the Critical Zone of a Surface Water (SW)–Groundwater (GW) System. Water 2022, 14, 3372. https://doi.org/10.3390/w14213372
AMA Style
Karlović I, Marković T, Kanduč T, Vreča P. Assessment of Seasonal Changes on the Carbon Cycle in the Critical Zone of a Surface Water (SW)–Groundwater (GW) System. Water. 2022; 14(21):3372. https://doi.org/10.3390/w14213372
Chicago/Turabian StyleKarlović, Igor, Tamara Marković, Tjaša Kanduč, and Polona Vreča. 2022. "Assessment of Seasonal Changes on the Carbon Cycle in the Critical Zone of a Surface Water (SW)–Groundwater (GW) System" Water 14, no. 21: 3372. https://doi.org/10.3390/w14213372
Note that from the first issue of 2016, this journal uses article numbers instead of page numbers. See further details here.