Article

Active Pharmaceutical Ingredients Sequestrated from Water Using Novel Mesoporous Activated Carbon Optimally Prepared from Cassava Peels

Department of Mechanical Engineering, College of Engineering, Design, Art and Technology, Makerere University, Kampala P.O. Box 7062, Uganda
*
Author to whom correspondence should be addressed.
Water 2022, 14(21), 3371; https://doi.org/10.3390/w14213371
Submission received: 23 August 2022 / Revised: 22 September 2022 / Accepted: 25 September 2022 / Published: 24 October 2022
(This article belongs to the Section Wastewater Treatment and Reuse)

Abstract

:
The increasing occurrence of active pharmaceutical ingredients (APIs) in water systems coupled with their recalcitrance to conventional water treatment methods calls for research into more eco-friendly and cost-effective curbing media. Mesoporous cassava peel activated carbon (CPAC) was prepared under conditions derived from optimizing the surface area and yield with the temperature and holding time as the model inputs using the response surface methodology. The sequestration potential and mechanisms of the resultant activated carbon (AC) for active pharmaceutical ingredients from wastewater were studied using batch experiments. The CPAC adsorption kinetics and isothermal mechanisms for the three pharmaceuticals (carbamazepine (CBZ), clarithromycin (CLN), and trimethoprim (TRM)) were studied in both wastewater and Milli-Q water. The API concentrations were measured using liquid chromatography coupled to a mass spectrometer (LC-MS) system. The maximum removal efficiencies were 86.00, 58.00, and 68.50% for CBZ, CLN, and TRM for wastewater, which were less than those from the Milli-Q water at 94.25, 73.50, and 84.5%, respectively. The sorption process for the CLN was better explained by the Freundlich model, whereas the CBZ and TRM adsorption processes could suitably be explained by both the Langmuir and Freundlich models. At an initial concentration of 20 mgL−1 for all APIs and a CPAC dosage of 2.0 gL−1, the maximum adsorption capacities were 25.907, 84.034, and 1.487 mgg−1 for CBZ, TRM, and CLN, respectively. These results demonstrated the potential of CPAC to remove APIs from water, with its sequestration potential being more exhibited after the removal of the organic matter owing to the lower competition for active sites by the APIs. Additionally, positive adsorbates were better removed than negatively charged adsorbates due to the dominance of anions in the cassava peel lattice.

1. Introduction

The prevalence of active pharmaceutical ingredients (APIs) in water systems has aroused research interests in their entry routes into the water systems, their physical and chemical nature in the various water systems, their effects on human well-being, their adverse effects on aquatic life, their persistence levels, and their curbing mechanisms. Apparently, pharmaceutical compounds are being found in water systems at trace and moderate concentrations. However, even at trace concentration levels, studies have shown the eco-toxicological effects of these pollutants on both aquatic and human systems. Specifically, regarding human life, they have led to antibiotic resistance and cytostatics. APIs are a class of emerging micropollutants that are quite challenging to curb due to their diversity, structural complexity (mostly characterized by aromatic and heterocyclic rings) [1,2], racemic nature [2], and persistence even over long-term treatments for some remediation methods [3]. Several methods have been and are being applied in the removal of APIs from water systems, including bio-filtration [4], photolytic degradation, ozone biodegradation [5,6], nanomembranes [7], and phytoremediation [8]. However, adsorption has proved to be a more viable API abatement mechanism due to its applicability in discrete or batch [9] and continuous processes [10,11,12,13], its relatively eco-friendly adsorption byproducts, and its possible reuse and regeneration of adsorbents [12,14]. Owing to the nature of APIs, it is pertinent to assess the suitability of a precursor to produce adsorbents based on the key characteristics discussed by researchers [15].
Agricultural wastes have captured much attention in relation to the preparation of adsorbents, although their complexity requires a thorough analysis to qualify their adsorbents for adsorbates [16,17]. Cassava peel is one of the agricultural waste precursors for adsorbents. However, the suitability of its derivative adsorbents for the remediation of APIs has not been empirically studied. Several studies have reported the insignificancy of the physical adsorption of non-activated cassava peel in abating adsorbates such as heavy metals and dyes [18], whereas cassava peel activated carbon (CPAC) has high physical adsorptive capabilities based on its BET surface area and pore volume, as reported by Moreno-Piraján and Giraldo [19]. In practice, testing a particular AC on the exact matrix of a given application, such as treating wastewater, poses cost challenges, meaning characteristic numbers are deployed to give predictive views on the performance and efficiency of the AC. However, the characteristic activated carbon numbers (BET surface area, iodine number, nitrobenzene number) are generally poor indicators of micropollutant removal in wastewater [20]. A review by Kayiwa et al. [21] presented the high potential of cassava peel AC to abate APIs basing on its application in proximate adsorbates such as dyes and heavy metals and highlighted the need to study the key parameters that are characteristic of micropollutant adsorbents
Many studies have elaborated on the suitability of adsorbents to abate APIs from wastewater based on their chemophysical characteristics, including the surface-functional group charge [15], surface area [22], UV254 absorption [15,20,23], bulk density [13,24], mesopore volume [15], and total fluorescence [23]. This study aimed to optimize the preparation of activated carbon from cassava peels through pyrolyzing alkaline pre-leached cassava peels. The optimal pyrolysis conditions were then applied in carbonizing KOH-activated char. Through a batch study of the adsorption of raw effluent water from a pharmaceutical manufacturing company and Milli-Q water spiked with the target APIs, this study sought to evaluate the possibility of using optimally prepared cassava peel AC for API adsorption. Three APIs (carbamazepine (CBZ), clarithromycin (CLN), and trimethoprim (TRM)) were prioritized for this study due to their high prevalence in Ugandan water systems [25] and appearance on the European Union priority list [26].

2. Materials and Methods

2.1. Activated Carbon Preparation

2.1.1. Pre-Leaching and Characterization for the Optimization Experiment

Dry peels of the Narocas 1 cassava variety grown in Uganda were pulverized to an average particle size of 0.5 mm. Then, 20 g of the pulverized peels was soaked in 150 mL of 4.0% w/v NaOH. This was followed by mixing and heating at 400 rpm and 50 °C, respectively, in a Hermle Z326K centrifuge shaker for 3 h, then the samples were allowed to stand for 12 h. The NaOH-pre-treated cassava peel sample was then transferred to a chromatographic column with a filter at its bottom and rinsed with distilled water until a neutral pH was obtained, followed by oven-drying of the sample at 105 °C for 12 h. Next, 10 g of the pre-leached peels was placed in a platinum crucible and heated in hot box oven (Stuart Scientific; S/N: R00002) from ambient temperature to 400 °C at a ramping rate of 20 °C min−1 under a nitrogen flow of 60 mL min−1 and held at the same temperature for 30 min. The heating was continued for temperatures between 400 and 900 °C under self-activation for 20 to 180 min as predetermined by the standard response surface methodology (RSM). The produced activated carbon was then cooled to room temperature. The specific surface area was determined from the nitrogen isotherm at 77.3 K using the BET method. It was calculated following the standard BET equation over a relative pressure range of 0.05 to 0.30. Argon adsorption at −186 °C was used to study the pore distribution from the adsorption isotherms and the DFT software was used to analyze the adsorption data. The yield of the resulting char was expressed as a percentage and calculated using Equation (1):
Weight   of   activated   carbon Weight   of   raw   peels × 100 %

2.1.2. Experiment Design

The experiment was performed using Design-Expert software. The variables were set and studied using the D-optimal response surface methodology. The ranges of independent process variables, activation time (A), and activation temperature (B) were chosen from the preliminary results of the experiment in Section 2.1.1 and benchmarked from the literature. These are shown in Table 1 with their coded levels. The coded value range of −1 to +1 was used to facilitate the regression.

2.1.3. Empirical Model Development, Optimization, and Validation

The optimized responses were the char yield and surface area. A quadratic polynomial was used to relate the input variables with the responses based on the model sum of squares, as shown in Equation (2):
Y   =   ß o + i = 1 k ß i X i + i = 1 k ß ii X i 2 + i < 1 k j k ß i X i X j   + ø
where Y is the result of the response (either char yield or surface area), ßo is the general constant coefficient, Xi and Xj are the independent variables (time and temperature), ßi is the linear coefficient, ßii is the quadratic coefficient, ßij is the interaction coefficient, and ø is the model error. The Design-Expert software was used to conduct the statistical analyses and to obtain the regression models. The statistical significance of the model for each response variable was determined via an analysis of variance (ANOVA) with a focus on the F value and prob. > F. The F value represents the measure of data variance about the mean, which depends on the ratio of the mean square of the group variance due to error. To optimize and validate the model, the function of desirability in the Design-Expert software was used to acquire a compromise between the surface area and yield. This was due to the difference in interest regions of the two variables since an increase in surface area decreases the yield.

2.1.4. Chemical Activation under Optimal Pyrolysis

Here, 10 g portions of pre-leached powdered cassava peel, as detailed in Section 2.1.1 (0.25 mm average particle size), were mixed with KOH at a KOH/peel ratio of 5:2 (mass basis), heated at 60 °C for 2 h, then dried at 100 °C for 24 h. The resultant activated char was carbonized under the optimal conditions from Section 2.1.3 (temperature 782 °C and time 148 min). This was done in triplicate under nitrogen flow in a thermogravimetric analyzer (TA instruments Q500, New Castle, DE, USA).
The resultant activated carbon was washed with hydrochloric acid followed by deionized water and dried at 100 °C for 12 h. The characterization followed the same procedure as detailed in Section 2.1.1. The produced activated carbon was degassed in a vacuum prior to the adsorption experimentation.

2.2. Preparation and Standardization of the Test Solutions

Two pharmaceutical solutions were prepared: with and without organic matter. The first solution, A was prepared from the effluent of a pharmaceutical manufacturing plant with organic matter. This was spiked with target API solutions to 20 mgL−1 of each of the 3 APIs (CBZ, CLN, and TRM) using standard solutions of each API obtained from Sigma-Aldrich, Germany. The physicochemical properties of the APIs are detailed in Table 2. Solution A was used to study the effect of the background organic matter during adsorption. The physicochemical properties of the test solutions A and B were determined following the APHA, AWWA, and WEF standard methods [27].
The second solution, solution B, was prepared by adding 20 mgL−1 of each of the 3 APIs to pure Milli-Q water. This was to study the performance of the CPAC at the final stages of wastewater treatment after all particulate and organic matter had been removed. Each solution’s APIs content was pre-determined using liquid extraction. The two solutions were buffered with an ammonium acetate–ammonium solution at a pH range of 7–8 to control changes in the molecular charge during the experiment. The characteristics of solutions A and B are summarized in Table 3.

2.3. Adsorption Experiment Setup

Batch experiments under agitation were carried out to determine the adsorption of the pharmaceuticals onto the CPAC prepared as outlined in Section 2.1.4 and to evaluate their adsorptive performance. Each pharmaceutical solution (100 mL) was placed in contact with the produced ACs in 250 mL conical flasks and shaken in a shaker (Hermle Z326K, Wehihngen-Germany) at 120 rpm under controlled temperature (25.0 ± 0.1 °C) by means of a thermostatically regulated incubator. The effect of the CPAC dosage was studied by performing experiments at different dosages of 0.05, 0.1, 0.15, 0.2, and 0.25 g of CPAC in 100 mL of solution B. For the contact time effect, the concentration of the AC was set at 2 g/L (each of the solutions contained 0.2 g of AC) in both experiments (for solutions A and B). This was because the CPAC dosage of 0.2 g had been proven to be optimal for the maximum removal of the APIs. Triplicate control experiments with no adsorbent were run in parallel with all adsorption experiments to ensure that the concentrations of the target pharmaceuticals remained stable throughout the duration of the experiments. The solutions were filtered through PVDF filters and immediately analyzed. The conical flasks were progressively withdrawn from the shaker at intervals of 0, 2, 10, 30, 150, 400, and 720 min. Three aliquots of 1 mL each were taken from each flask using a pipette, filtered through PVDF filters to remove any CPAC, and chromatographically analyzed to determine the concentration of the target pharmaceutical. The amount of each pharmaceutical adsorbed at each time, qt (mg g−1), was calculated using a mass balance relationship as follows:
qt = [(C0 − Ct)V/W]
The percentage removal = [(C0 − Ct)/C0] × 100
Hence at equilibrium, qe = [(C0 − Ce) V/W]
where C0 (mg L−1) is the initial liquid-phase concentration of the API, Ct (mg L−1) is the liquid-phase concentration of the API at a time t (min), V is the volume of the solution (L), and W is the mass (g) of the employed adsorbent.
To study the adsorption capacity variations with pH, the pH was adjusted from the initial pH range of 6–7 to 2.5 and 11.5 using 0.1 M HCl and 0.1 M NaOH, respectively.

2.4. Isotherm Experiments

For the isothermal studies, six conical flasks each containing equal concentrations of 20, 25, 35, 40, and 45 mgL−1 for each of the three APIs prepared using Milli-Q water to a total solution volume of 100 mL were shaken at 120 rpm with 0.2 g of CPAC for 720 min as inferred to the times taken for the maximum adsorption of the respective APIs from the kinetics study. The amount of each API adsorbed after 720 minutes was determined following the same procedure as outlined in Section 2.3. Equation (2) was used to study the effect of the initial API concentration on the removal efficiency.
The adsorption equilibrium results were described using the Freundlich and Langmuir models as described by Equations (6) and (7), respectively:
q e =   K F C e 1 / n
q e = q m K L C e 1 + K l C e
where KF is the Freundlich adsorption constant (mg g−1 (mgL−1)1/n), n is the degree of non-linearity, qm is the maximum adsorption capacity (mg g−1), and KL (Lmg−1) is the Langmuir affinity coefficient. For adsorption processes under Langmuir conditions, the separation constant RL (Equation (6)) was used to further evaluate the performance under the Langmuir conditions:
R L = 1 1 + A 0 ×   K L
where A0 is the adsorbent initial concentration (mgL−1) and KL is the Langmuir constant (Lmg−1).

2.5. Chemical Analyses

The APIs were measured using liquid chromatography coupled to a mass spectrometer (LC-MS) system following an identical procedure as that used by Batt et al. (2008). To quantify the molecular ion masses and the retention times of the analytes, a 10 μL solution of each analyte (1000.0 μg mL−1) was injected into the LC-MS system (Agilent 1290 UHPLC and 6460 MS/MS series with Jet Steam ESI source, Agilent, Santa Clara, CA, USA) using a mobile-phase flow rate of 0.5 mL min−1.

2.6. Morphology Analysis of the Spent CPAC

After the adsorption experiments, the CPAC was filtered, dried, and analyzed for morphological changes. The morphology was conducted using an FEI Quanta 600 scanning electronic microscope (SEM) (FEI, Hillsboro, OR, USA).

3. Results and Discussion

3.1. Optimization of Pyrolysis Conditions and Activated Carbon Characterization

3.1.1. Formulation of Model Equations

The surface area and yield ranges were 6.42–756.48 m2 g−1 and 4.6–34.4%, respectively, as shown in Supplementary Table S1.
The responses were found to be best fitted with a quadratic polynomial, as per Design-Expert software. The formula models for areas Y1 (surface) and Y2 (yield) are given in Equations (9) and (10), respectively:
Y1 = 500.29 + 134.81A + 200.26B + 133.5A2 − 350.08B2 + 84.98AB
Y2 = 9.84 − 2.79A − 11.02B − 0.2482A2 + 6.47B2 + 2.07AB

3.1.2. Analysis of Variance

The ANOVA of the models for both the surface area and yield is presented in Supplementary Table S2. The statistical significance of the response models was based on the F-value and Prob. > F. The F-value and Prob. > F for the surface area model were 34.90 and 0.0002, respectively. The model F-value of 34.90 implies that the model was significant [33]. The Prob. > F value was <0.05, and there is only a 0.02% chance that an F-value this large could occur due to noise, further conforming to the model’s statistical significance. The F-value and Prob. > F for the yield model were 103.6 and <0.0001, respectively. Both values showed statistical significance, as with the surface area model. Therefore, A, B, A2, B2, and AB were significant model terms for the carbon surface area and yield responses. The ANOVA analysis showed that both models were significant, and the models were able to predict the surface area and yield within the range of variables. The F-values for the temperature, surface area, and yield were 67.20 and 1039.48, respectively, whereas those of the time were 29.95 and 25.81 for the surface area and yield, respectively. This showed that the activation temperature had a greater impact on the surface area and yield of the activated carbon compared to the activation time. Figure 1a,b shows the actual values versus the predicted values for the surface area and yield, respectively. It shows that the quadratic model of the responses fits to the experimental data, which is reflected in the good predictions of the models.

3.1.3. Process Optimization and Validation

The optimal conditions from the numerical optimization for the highest AC surface area and carbon yield together with the results from the validation experiment are shown in Supplementary Table S3. The experiment was run in triplicate by using the optimal processing condition to further validate the developed model. The chosen optimal condition had the highest value of desirability at 0.943. The predicted and experimental results for the carbon surface area and yield were in good agreement at 756.42 m2g−1 and 4.57% for the surface area and yield, respectively. These results confirmed the prediction of the ANOVA model for both responses under the experimental conditions.

3.1.4. Characteristics of Chemically Activated Carbon Pyrolyzed under Optimal Conditions

The resultant activated carbon had a total pore volume of 0.756 ± 0.01 cm3/g dominated by mesopores at 0.471 ± 0.04 cm3/g and a surface area of 1684 ± 2 m2g−1, as shown in Table 4. The total pore volume was higher than that reported in other studies by Moreno-Piraján and Giraldo [19]. The mesopores are gateways in accessing micropores using the adsorbate molecules, this being especially important in adsorption from solution processes. The high surface area could be attributed to the alkaline pre-leaching that reduced the inorganic content in the peels [34]. The relatively more volatile components that sublimed at 780 °C left more voids, contributing to the higher porosity. Besides alkaline pre-leaching, pyrolyzing and holding the activated char at 780 °C surpassed the boiling point of the K metal from KOH, which was embedded in the char. The gasification of the intercalated K, therefore, led to more pores and in turn improved the surface area [35,36].

3.2. Competitive Removal of APIs by CPAC

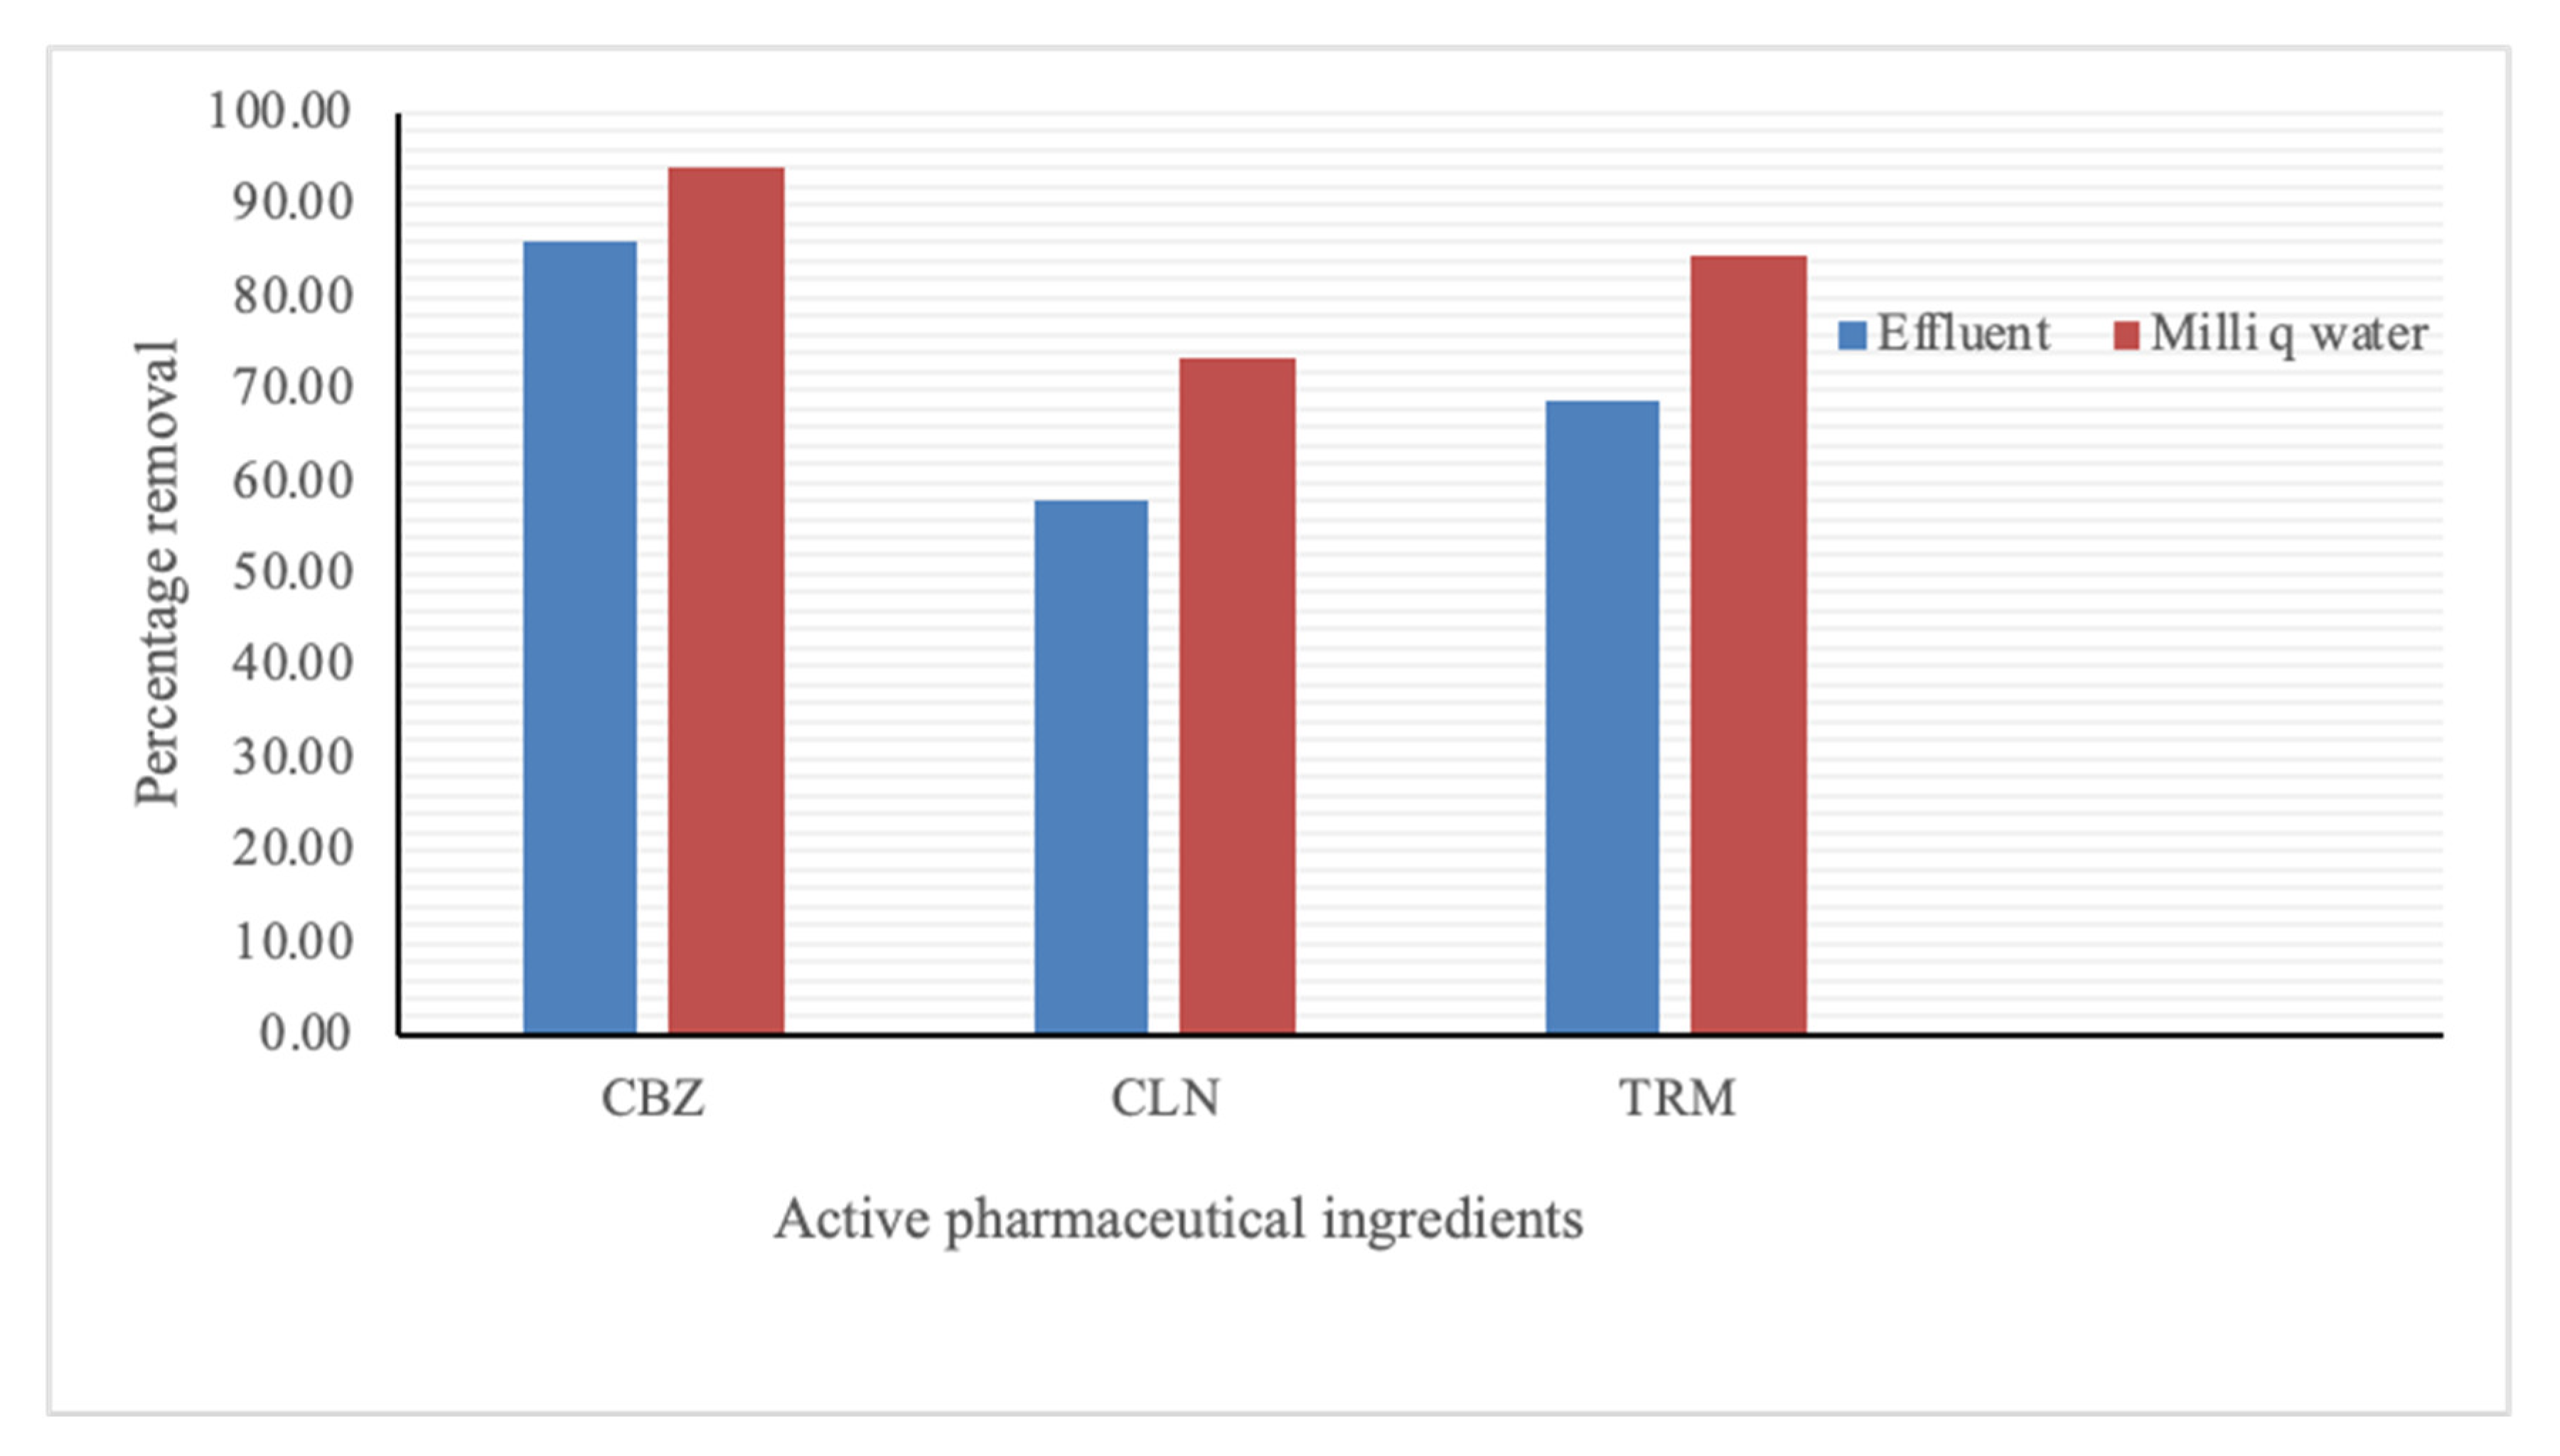
The maximum removal percentages of CBZ, CLN, and TRM from the effluent water were 86.00, 58.00, and 68.75%, respectively. From the Milli-Q water, a similar pattern was observed at 94.25, 73.50, and 84.50% for CBZ, CLN, and TRM, respectively, as shown in Figure 2. The adsorption could have been both chemical (through n-π bonding between the CPAC surface groups and the APIs) and physical (through diffusion into the CPAC sites). The dominant functional groups in the cassava peel activated carbon are hydroxyl and carboxyl groups [37,38,39]. The deprotonated functional groups could have provided vacant pairs of electrons that are favorable for divalent bonding with more protonated APIs. This in turn may have increased the adsorption sites and consequently the electrostatic bonding forces. As shown in Table 2, the hydrogen bond acceptor counts for the studied APIs are in the order CLN > TRM > CBZ and are greater than the hydrogen bond donor counts for both TRM and CLN but equal for CBZ. The implication is that electrostatic interactions occur between APIs and CPAC functional groups with strength values in the order of CBZ > TRM > CLN. These interactions partly explain the adsorption of the APIs in the same order. Moreover, pharmaceuticals with higher proton donor counts have been found to be better removed from solutions compared to those with neutral and lower proton donor counts [12].
Organic hydrophilic micropollutants have in general a lower affinity for AC than hydrophobic micropollutants [40]. The hydrophobic APIs are highly insoluble in water and are better removed from the solutions since they have more affinity for the adsorbents. The high insolubility in the water partly explains why the three-API CBZ was the most sequestrated. Moreover, Kumar and Siril [41] reported CBZ as one of the practically insoluble drugs in water, with an improvement in its solubility being only possible at an ultra-fine nanoparticle size. Trimethoprim, being hydrophilic and highly soluble in water, would be expected to be the least adsorbed API, yet it was sequestrated more than CLN from both the effluent and Milli-Q water. The molecular weight of the CLN outweighed its hydrophobicity and insolubility in water and could not be accommodated effectively in the CPAC pores. Additionally, the steric hindrance due to its large molecules could have weakened the electrostatic interactions with the CPAC molecules [42]. Pore diffusion, therefore, was the dominant mass transfer mechanism [43].

3.2.1. Effect of CPAC Dosage

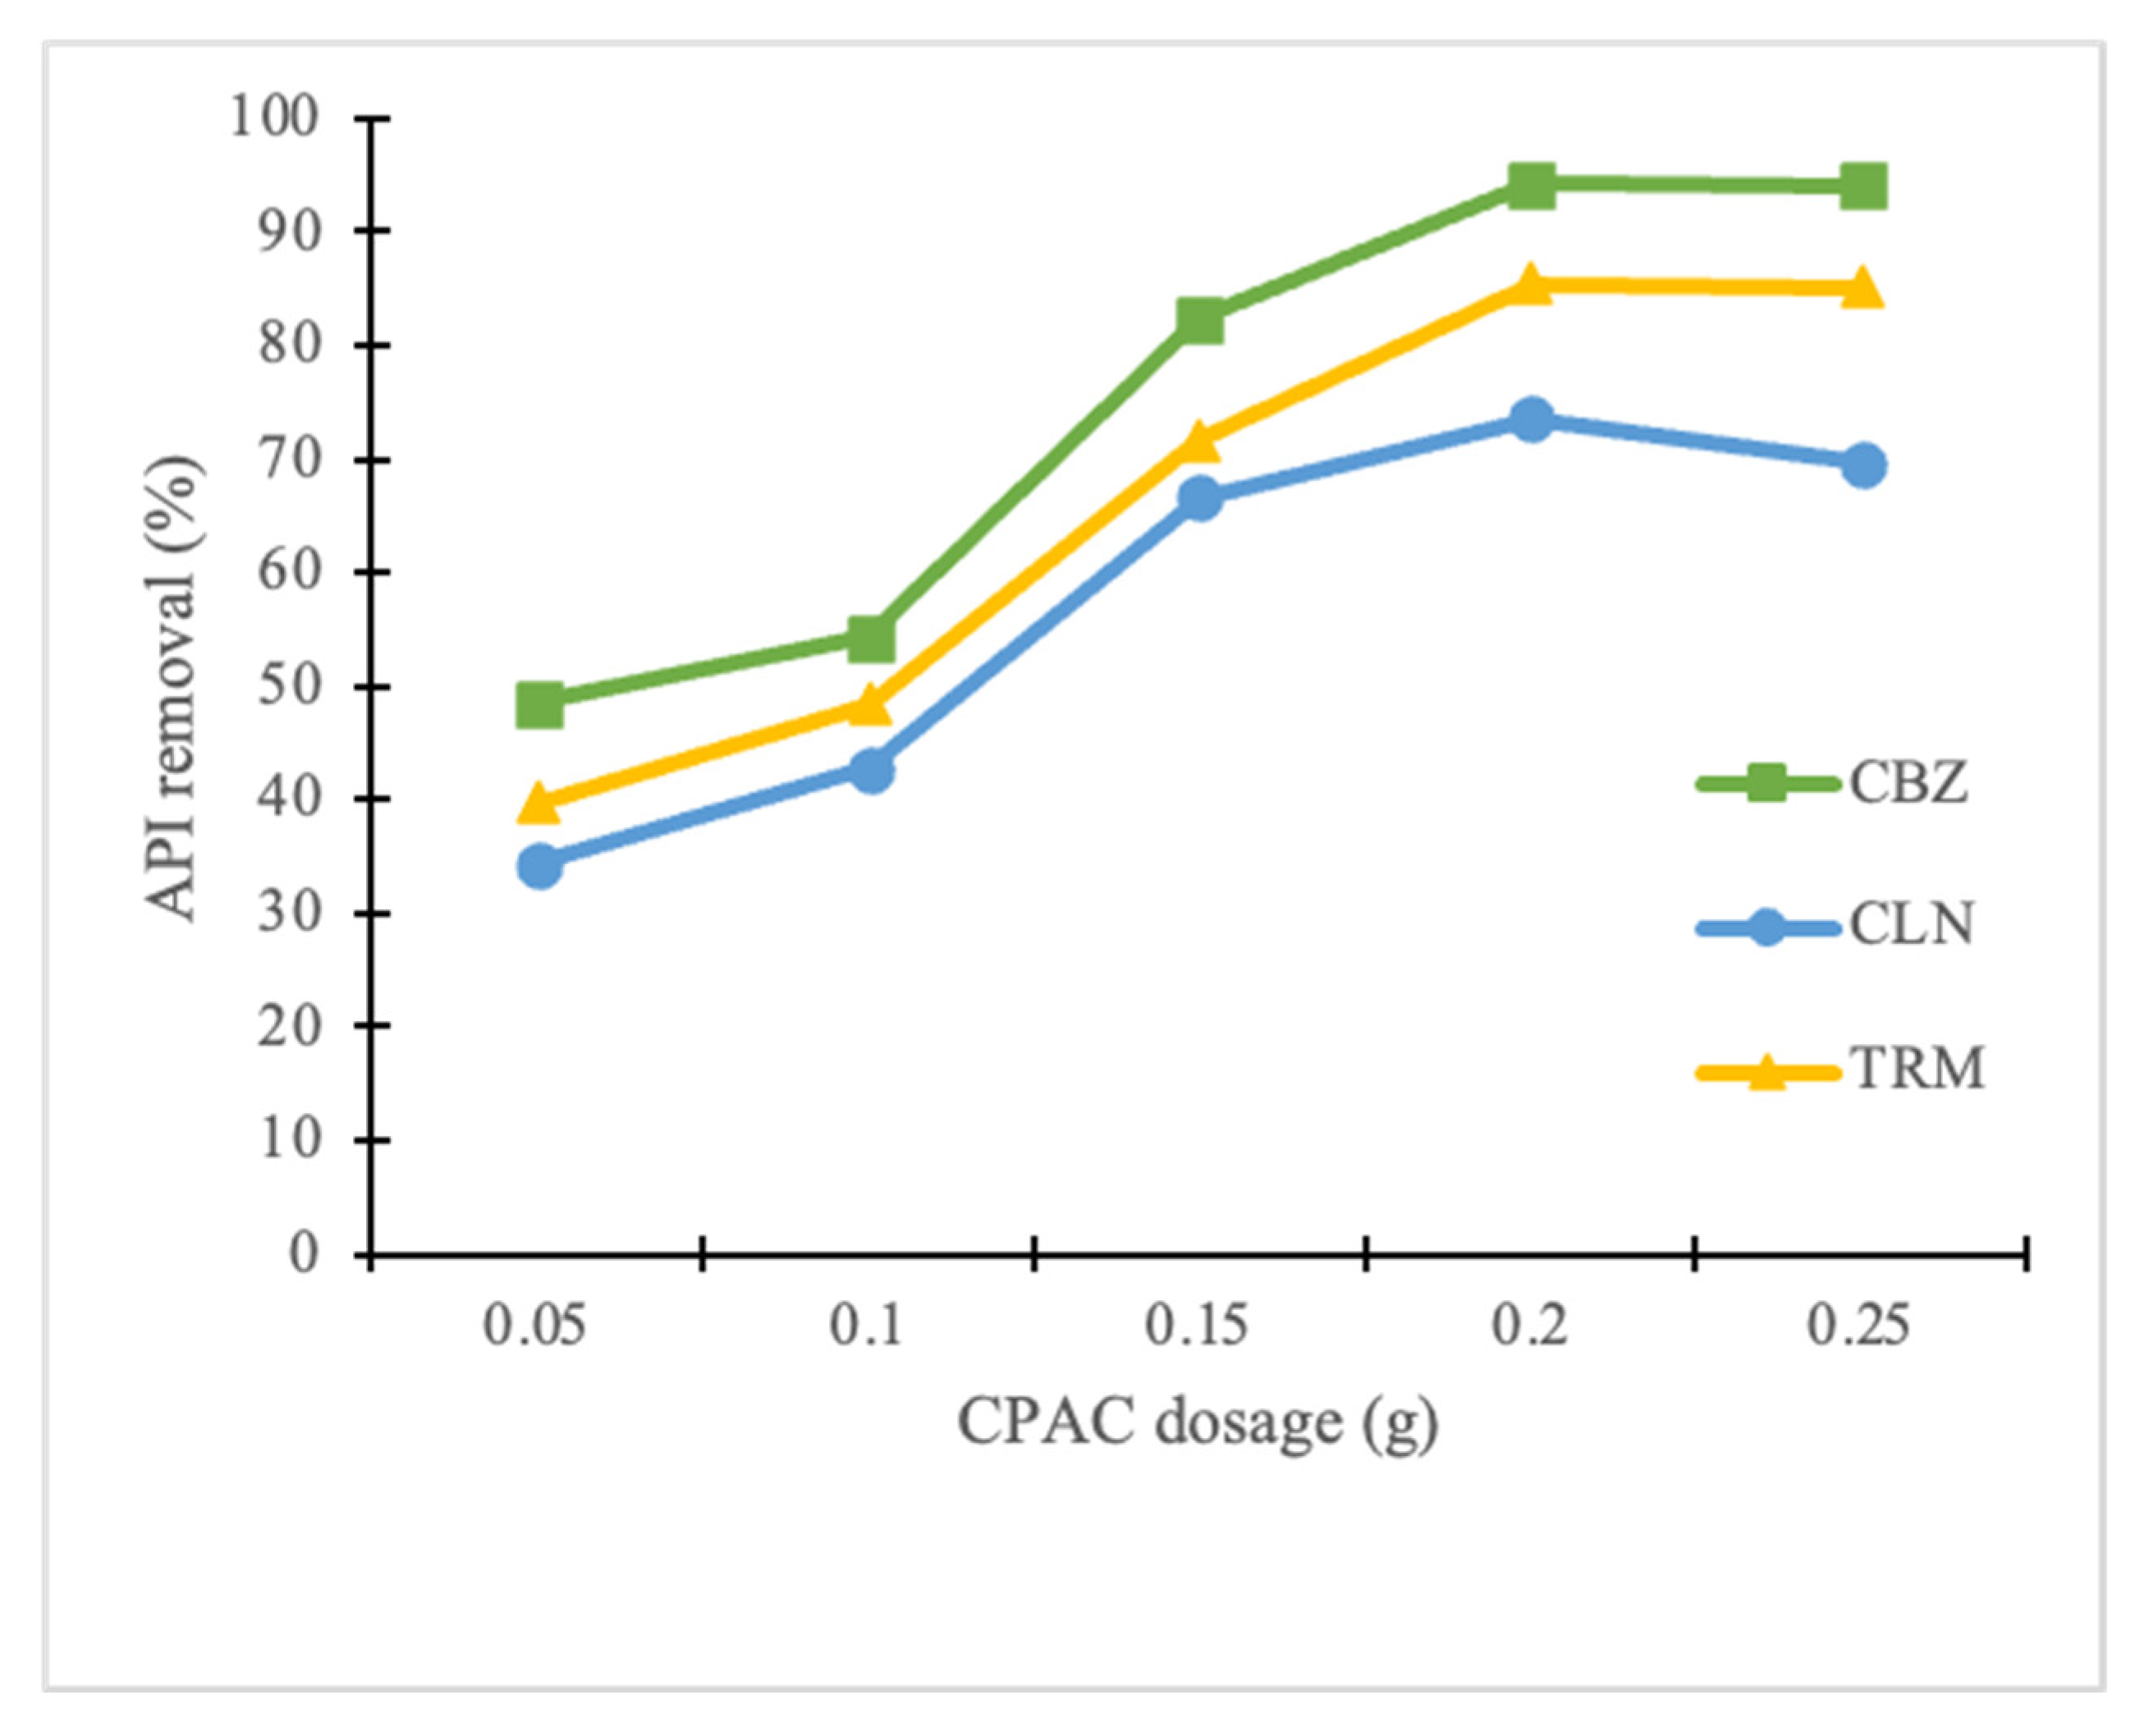
The results showed that when the CPAC dosage increased from 0.05 to 0.25 g, the API removal also increased gradually for all the APIs from 48.5% to 94.3%, 34.4 to 73.6%, and 39.7 to 85.5% for CBZ, CLN, and TRM, respectively, as shown in Figure 3. The increase in CPAC dosage provided a larger surface area and an increase in the number of adsorbing sites on the CPAC [44]. The results from this experiment showed that 0.2 g of CAPC when added to a solution containing 20 mg/L of CBZ, CLN, or TRM solution produces the highest removal efficiency rates for the respective APIs. At the 0.25 g dosage, the removal rates for CBZ and TRM were almost maintained at the same level as for the 0.20 g dosage at 94.1% and 85.2%, respectively, while the CLN removal was remarkably reduced to 69.6%. This implies that increasing the CPAC dosage beyond 0.2 g could not correspondingly increase the percentage removal of the APIs. A similar scenario was observed by Gorzin and Bahri [45] in their study on the adsorption of Cr (VI) from an aqueous solution by an adsorbent prepared from paper mill sludge. This could have been due to the increase in the number of unsaturated CPAC adsorption sites reducing the CPAC adsorption density. This experiment confirmed that the CPAC dosage influences the removal efficiency of APIs from water.

3.2.2. Effect of Contact Time

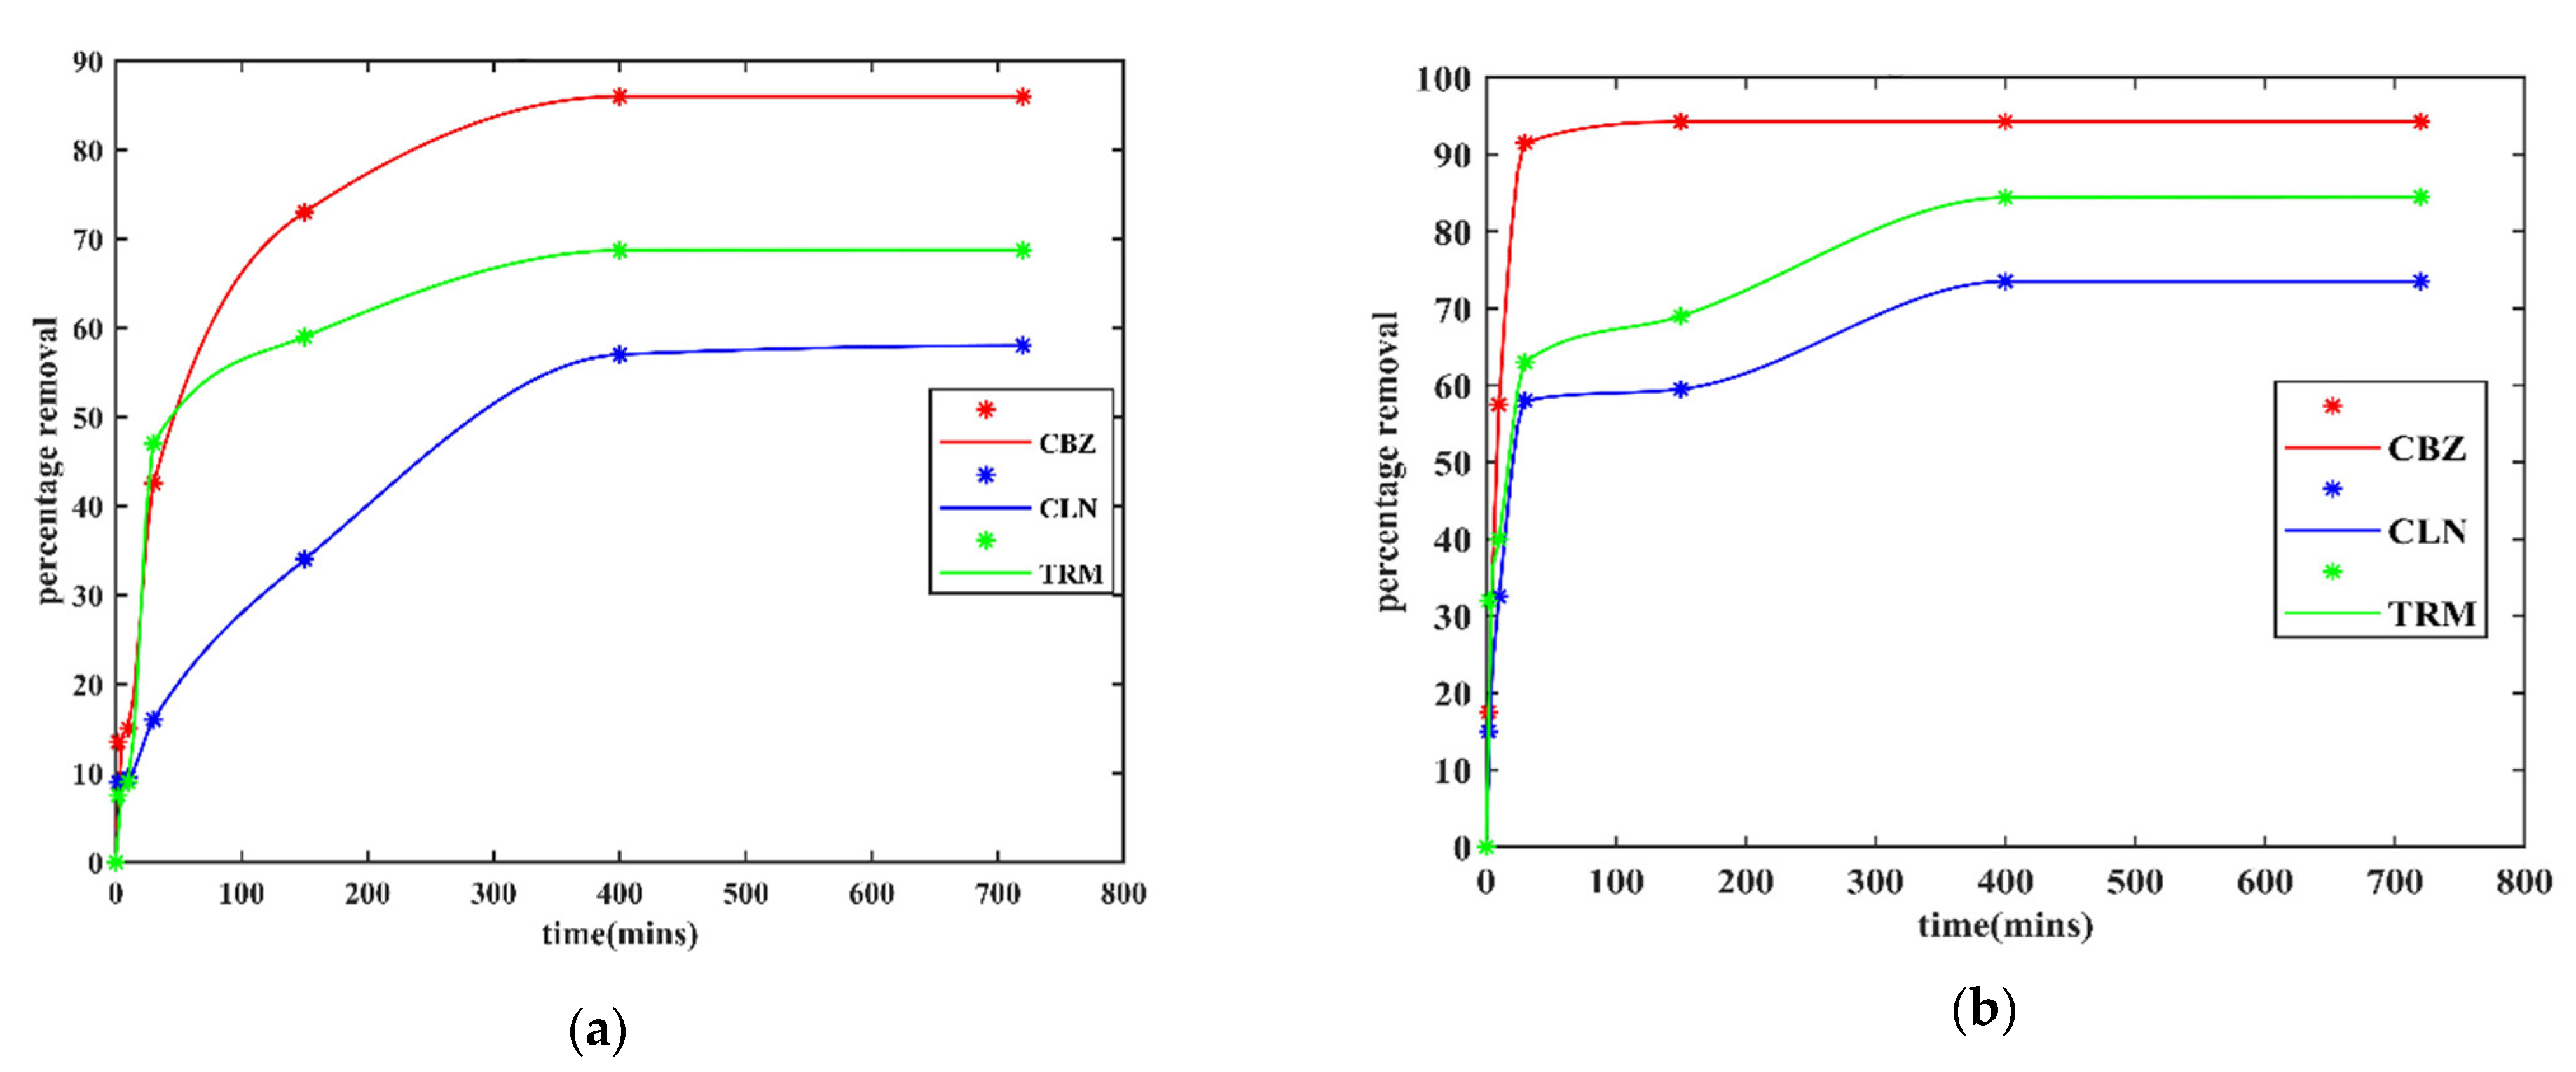
The adsorption rates were fast at the start of both experiments (effluent and Milli-Q water) and decreased as the contact time increased, as shown in Figure 4. This could have been due to the reduction in active sites with time [46]. At the start, all sites were available, the adsorption was fast, and it slowed down due to the intense competition for the remaining active sites. The percentage removal rates for all APIs increased with the contact time. The longer the contact time, the higher the probability of the API molecules reaching a free adsorption site. A longer contact time enables the adsorption of system-suppressed adsorbates. This was evident in the effluent water since the organic matter could have blocked some of the surface gateway sites and necessitated more time to diffuse to the inner CPAC surfaces. Hence, reaching equilibrium in the case of the effluent water took approximately 400 min for all APIs compared to 30 min for the CBZ in Milli-Q water.

3.2.3. Effect of Background Organic Matter on API Adsorption by CPAC

There was a delay in reaching equilibrium for all 3 APIs with effluent water compared to the Milli-Q water solution. This could be due to the adsorption competition and adsorption site obstruction by the organic matter [1,40]. Figure 4b depicts that the removal of CLN was more affected compared to the others. Its adsorption peak was reached far later than for CBZ and TRM. This was probably due to the larger molecules of CLN, which could have limited its adsorption relatively more than for CBZ and TRM. The smaller and fewer pores left due to organic matter clogging could not effectively allow for faster diffusion of the relatively larger molecules of CLN. There is also the possibility of the organic matter having masked the AC surface charge as reported by de Ridder et al. [47]. This could have reduced the AC charge capacity, causing a reduction in the electrostatic attraction between the AC surface and the relatively more positive API molecules.

3.2.4. Effect of Initial API Concentration

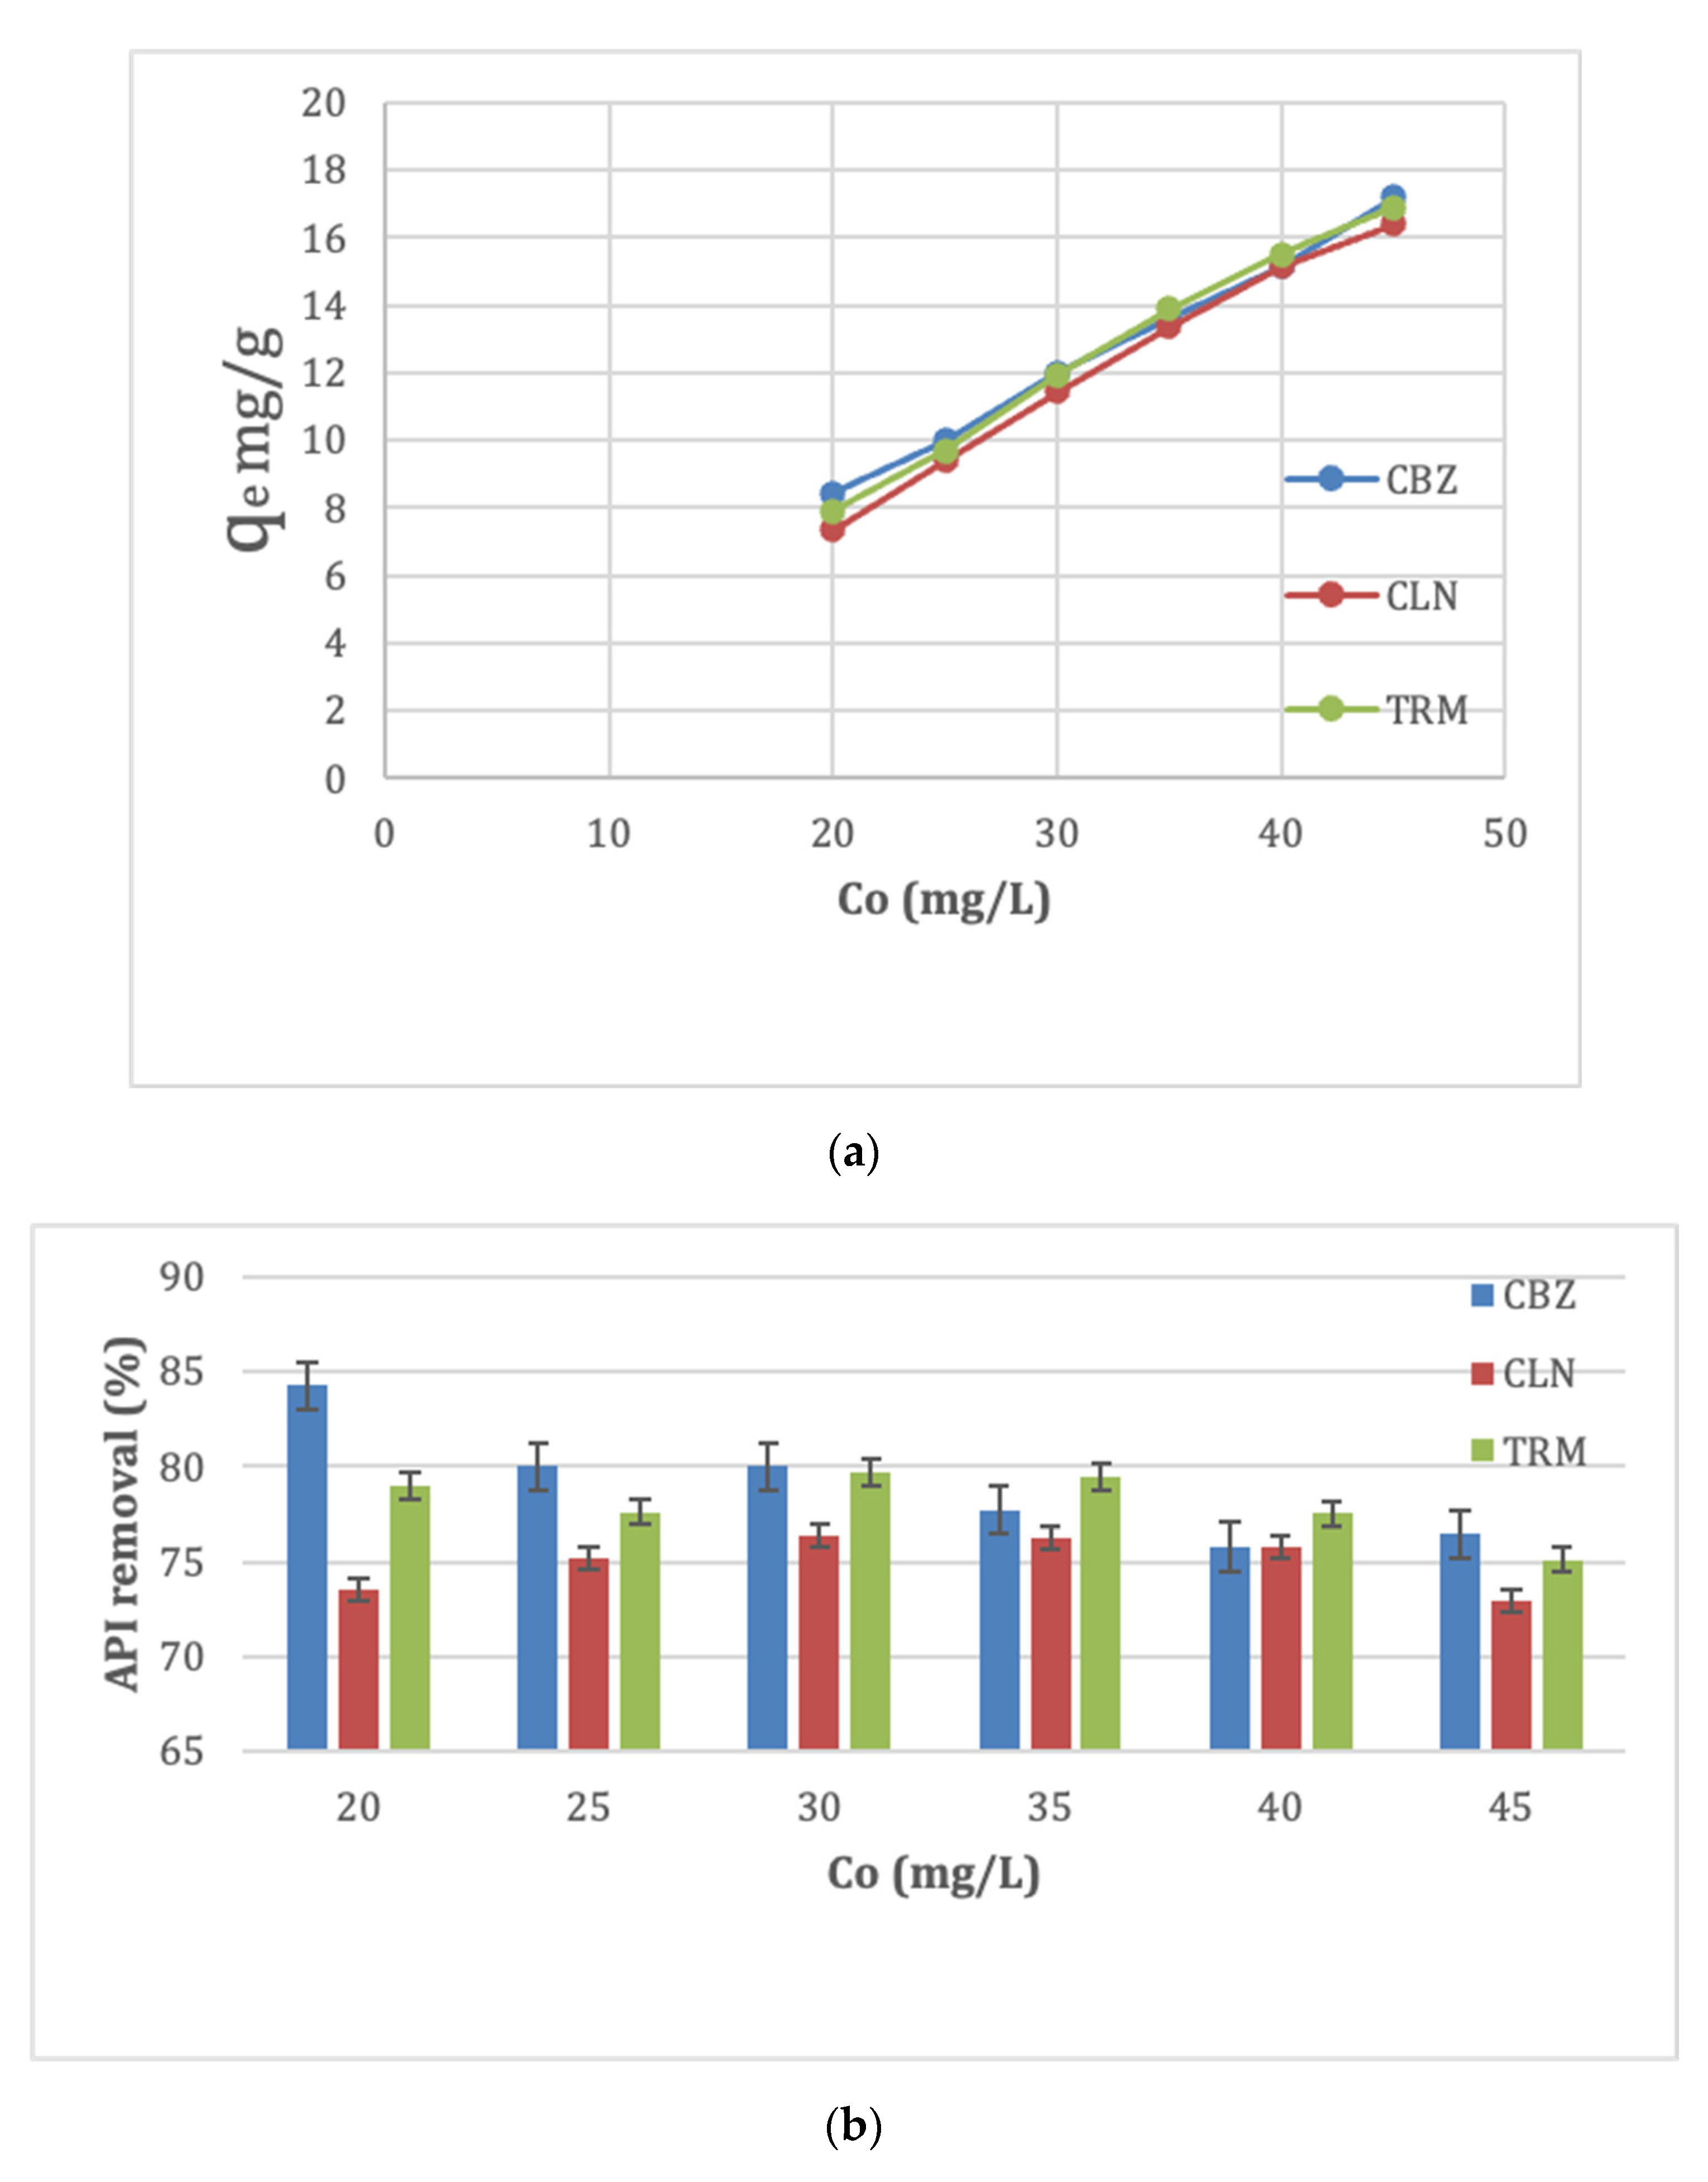
The equilibrium adsorption capacity for all APIs increased with the API concentration, as shown in Figure 5a. This was due to the increased availability of API molecules surrounding the CPAC adsorption sites at higher initial API concentrations, which enhanced the adsorption process. The removal efficiency of the CBZ reduced with the increase in its initial concentration. This is expected of most of the adsorbates, owing to the low ratios of adsorbates to active adsorbent sites at low initial adsorbate concentrations [45]. At low initial adsorbate concentrations, more sites are available for relatively fewer adsorbate molecules, leading to higher removal efficiencies. At higher initial adsorbate concentrations, there are residual adsorbate molecules in the solution due to the limited active sites, thereby lowering the removal efficiency [48]. Figure 5b, however, shows a disagreement to this trend for CLN and TRM in the lower half of the respective initial API concentrations. The removal efficiency of the CLN increased from 73.50 to 76.33 as its initial concentration increased from 20 to 30 mg/L, as that of TRM almost stagnated at 79.66 from 79.00 at 20 and 30 mg/L initial concentrations, respectively. The discrepancy could have been due to the interactive forces between the API and the CPAC sites that outweighed the molecular size effects at low concentrations for CLN and TRM. CLN and TRM have 4 and 2 hydrogen bond donors, respectively, compared to CBZ’s 1. In this regard, a higher tendency to form more bonds with the anions from the CPAC sites could have led to an increase in removal efficiency with the increase in their initial concentrations. However, at concentrations >30 mg/L, the adsorption sites could have been limited, with most of them being occupied by the relatively smaller molecules of CBZ. This limited the intraparticle diffusion of CLN and TRM, in addition to the steric hindrance of the large molecules of CLN and TRM increasing at higher concentrations [49].

3.2.5. Effect of pH Variations on Adsorption Capacity of APIs

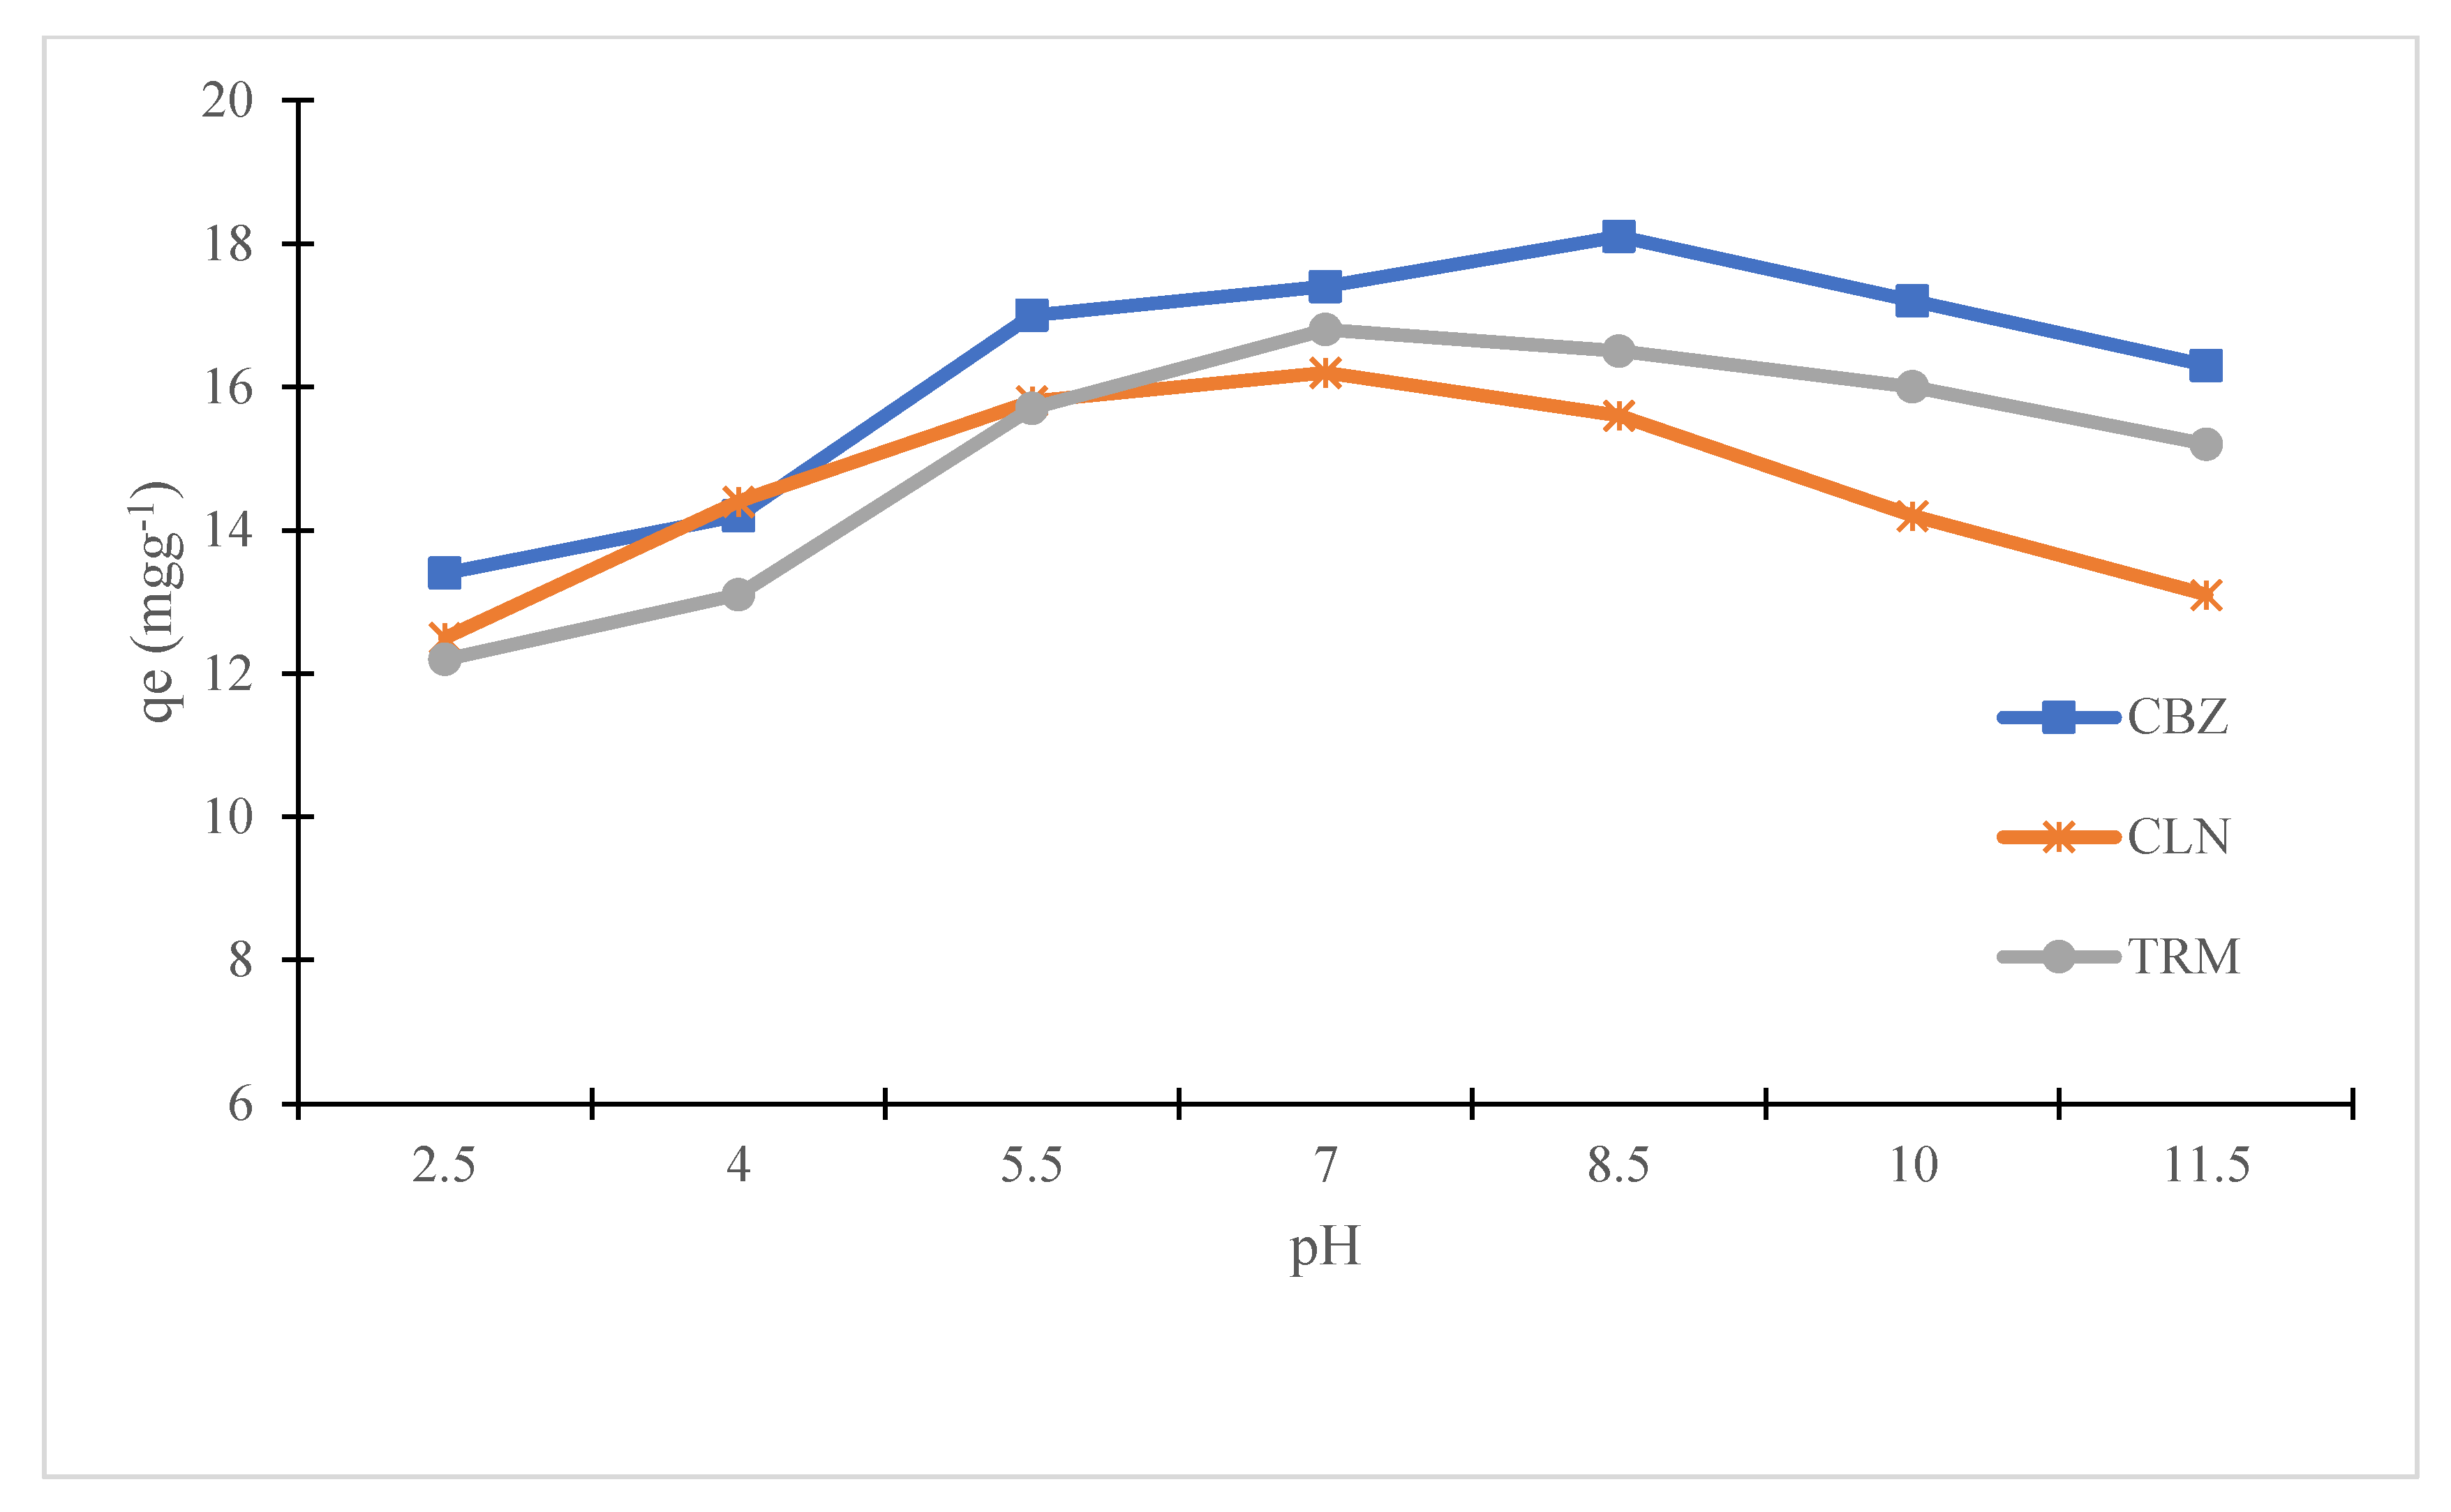
The adsorption capacites of the APIs with different pH values are shown in Figure 6. Generally, the adsorption capacity of the APIs decreases with a decrease in pH. The CPAC used in this study was prepared via KOH activation and its pHzpc most probably could have been in the range of 7.0–8.0, as reported by Alongamo et al. [50]. Reducing the pH below the point of zero charge (pHzpc) could have rendered the CPAC surfaces more positively charged and reduced the electrostatic interaction with the APIs, whereas the increase in pH increased the electrostatic interaction between the CPAC surface and the API molecules due to the increase in the anionic tendency of the CPAC surface groups [51]. The other possible explanation for this trend could have been the dissociation of the API molecules at pH > pHzpc into more hydrophilic species that are negatively charged, thereby initiating electrostatic repulsions with the CPAC surfaces, which may have reduced the adsorption capacities [52].

3.3. Adsorption Isotherm Models

In this study, two isotherm models, the Freundlich and Langmuir models, were explored to characterize the CPAC adsorption on the APIs. The values of qe and Ce were determined. The corresponding KL, qm, and RL values and the KF and 1/n values for the Langmuir and Freundlich isotherm models, respectively, are shown in 
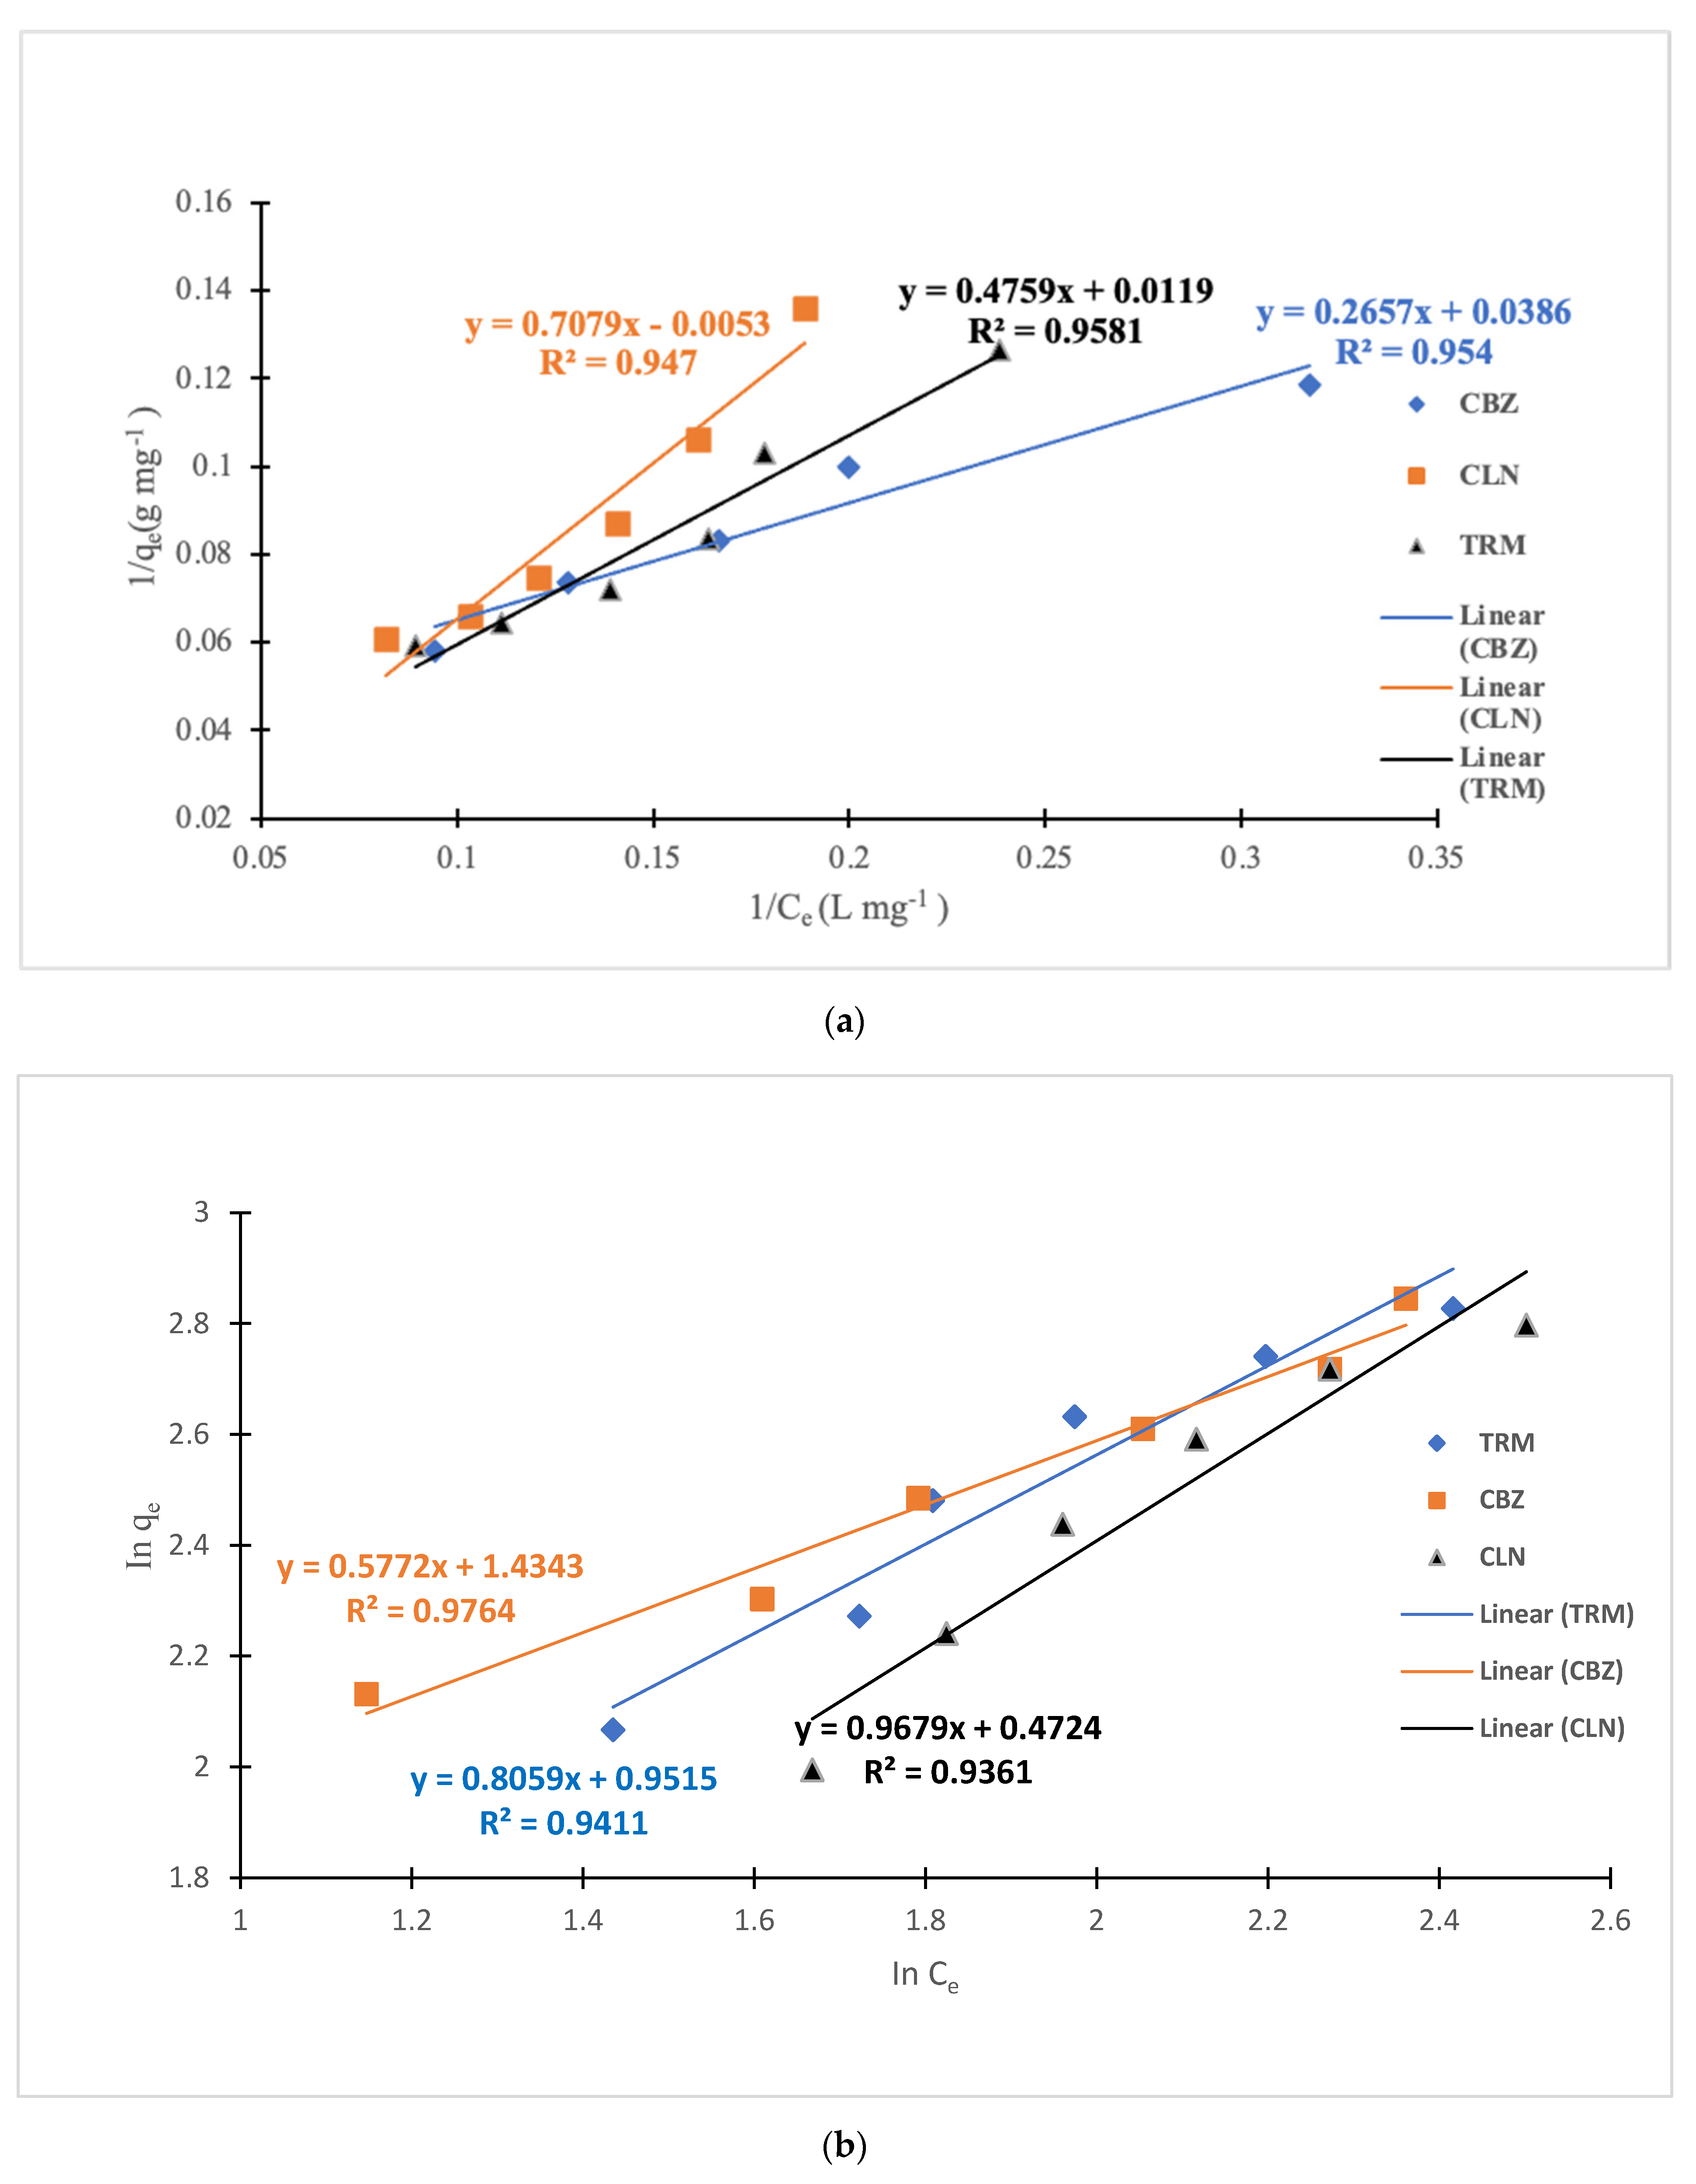
Table 5. The sorption process for CLN was better explained by the Freundlich model, whereas the CBZ and TRM adsorption processes were explained by both models.
The plots of I/qe as a function of 1/Ce and logqe vs. logCe in Figure 7 show appreciable linearity for both the CBZ and TRM based on the R2 values for both models, as shown in Table 5. For the CBZ, the R2 value was 0.954 for the Langmuir model as compared to 0.976 for the Freundlich model, whereas for the TRM the R2 values were 0.958 and 0.9411 for the Langmuir and Freundlich models, respectively. The maximum adsorption capacities (qmax) for the CBZ and TRM were, therefore, chosen based on the Freundlich and Langmuir models, respectively, due to the relatively higher R2 values for the respective models. The adsorption rates for both APIs were also further confirmed as being favorable under Langmuir conditions by the RL value of 0 < RL < 1. The linearity for the I/qe vs. 1/Ce plot for the CLN was more appreciable at R2 of 0.947 compared to the Freundlich model at the R2 of 0.936. However, the negative KL value implied that the adsorption of the CPAC on the CLN could not be described by the Langmuir model. The implication, therefore, is the dominance of chemisorption in the sequestration process, with a possibility of active sites occurring in a monolayer and being uniformly distributed on the CPAC as per the Langmuir model assumptions. There could also be multilayers of the CPAC with heterogenous sites accruing to the Freundlich model. This is partly ascribable to the nature of the CPAC, with extrinsic micro-, macro-, and mesopores, as presented in our earlier work [37].
The affinity rates for the CPAC of the 3 APIs was in the order of CBZ > TRM > CLN based on their KL values. The order of hydrophilicity of the APIs represented by their logDOW shown in Table 2 was TRM > CBZ > CLN. Margot et al. (2013) studied the removal of over 70 APIs using ozone and AC, with the findings showing the most hydrophilic APIs being eliminated to a lesser extent by the AC. Therefore, in line with Margot et al.’s findings, the removal of APIs would be in the order CLN > TRM > CBZ. This, however, was not the case, as per the KL and KF values and the removal percentages shown in Figure 1.
This discrepancy could have been due to the differences in molecular masses of the three APIs. As shown in Table 2, the molecular masses of the 3 APIs in this study were in the order of CLN > TRM > CBZ. The smaller the molecular mass, the higher the diffusion rate and the probability of being accommodated in the adsorbent pores. This further confirms the dominance of chemisorption over physisorption in the sequestration of APIs by CPAC. Another functional characteristic that could have contributed to this adsorption behavior was the functional group structures in the pharmaceuticals. Both TRM and CBZ are planar, with aromatic groups throughout. CLN is bulky, non-planar, and aliphatic. Molecular sieving could have contributed to it having the lowest CPAC adsorption capacity. Aromatic compounds have been reported to be removed more efficiently from wastewater compared to those that have a relatively smaller number of aromatic rings [1]. Overall, the adsorption of CBZ and TRM was favorable owing to the 1/n values < 1. The 1/n value for CLN was >1, implying unfavorable adsorption. This was further evident from the KL values of CBZ and TRM of between 0 and 1, whereas that of CLN was <0. The maximum adsorption capacities for the APIs based on the Langmuir model and Freundlich model were 25.907, 84.034, and 1.487 mgg−1 for CBZ, TRM, and CLN, respectively. This is a remarkable step towards harnessing CPAC for API sequestration. These adsorption capacities differed from those from other studies due to the differences in the process conditions and adsorbent nature, as shown in Table 6. For example, Wang et al. [42] attained a remarkable adsorption capacity of activated carbon fiber for CLN of 70.90 mgg−1 through electrolysis. The greater CBZ adsorption capacity (25.907 mgg−1) in this study compared to that reported by Sekulic et al. [53] at 17.69 mgg−1 was probably due to the lower adsorption time.

3.4. Morphology of Spent CPAC and Suggested Adsorption Mechanisms for APIs

The porosity of the CPAC was reduced after the adsorption, showing that the pores had been filled by API molecules, as shown in Figure 8b,d.
The studied APIs possess aromatic rings that are electron donors. The structure of the CPAC consists of disorganized graphite sheets with π-π inter-linkages. These linkages act as π-acceptors [56]. Suggestively, the active surface groups in the CPAC effect the adsorption through the hydrogen bonds, which could be Yoshida or dipole–dipole bonds [53]. This electron donor π-acceptor relationship is responsible for the adsorption of APIs from wastewater. The pore filling of the CPACs is another mechanism by which APIs are removed from wastewaters. Owing to the large molecular sizes of the APIs, mesopores are preferred to micropores for adsorption of APIs [15]. The larger the mesopore volume compared to the micropore volume, the higher the adsorption capability of an AC on APIs [57].

4. Conclusions

  • Mesoporous cassava peel activated carbon was successfully tested and proven to be a potential adsorbent for pharmaceutical ingredients in water.
  • It is more effective to apply cassava peel activated carbon in the sequestration of active pharmaceutical ingredients after the removal of organic matter. This reduces the organic matter competition for adsorption sites with the intended APIs.
  • Cassava peel activated carbon sequestrates more positively charged APIs than negatively charged molecules owing to the dominance of anions in its active adsorption sites.
  • The solution pH affects the adsorption of the APIs using CPAC through the alteration of the CPAC’s surface chemistry and the APIs’ hydrophilicity. It is most appropriate, therefore, to run the adsorption processes at the point of zero charge of the CPAC.
  • A dosage of 2 g/L of CPAC removes the highest percentages of CBZ, CLN, and TRM at an initial concentration of 20 mgL−1, pH range of 7–8, and contact time of 400 min.

Supplementary Materials

The following supporting information can be downloaded at: https://www.mdpi.com/article/10.3390/w14213371/s1, Table S1: Pyrolysis conditions and responses correlation; Table S2: Analysis of variance for the fitted models; Table S3: Optimization results of possible solutions.

Author Contributions

R.K.—conceptualization, data collection, experimental work, investigation, and writing original draft. H.K.—supervision and writing—review and editing. M.L.—writing—review and editing, validation, resources, and software. J.B.K.—writing—review and methodology. All authors have read and agreed to the published version of the manuscript.

Funding

Africa Centre of Excellence in Materials, Product Development, and Nanotechnology (MAPRONANO ACE); Government of Uganda through the Research and Innovation Fund—Makerere University. Grant No. RIF1/CEDAT/007.

Data Availability Statement

The data and the materials are all available in this article, as well as the Supporting Information.

Acknowledgments

The authors acknowledge the financial support provided by the Africa Centre of Excellence in Materials, Product Development, and Nanotechnology (MAPRONANO) and the Government of Uganda through the Research and Innovation Fund—Makerere University.

Conflicts of Interest

The authors declare no conflict of interest.

References

  1. Alongamo, B.A.A.; Ajifack, L.D.; Ghogomu, J.N.; Nsami, N.J.; Ketcha, J.M. Activated Carbon from the Peelings of Cassava Tubers (Manihot esculenta) for the Removal of Nickel(II) Ions from Aqueous Solution. J. Chem. 2021, 2021, 5545110. [Google Scholar] [CrossRef]
  2. Altmann, J.; Rehfeld, D.; Träder, K.; Sperlich, A.; Jekel, M. Combination of granular activated carbon adsorption and deep-bed filtration as a single advanced wastewater treatment step for organic micropollutant and phosphorus removal. Water Res. 2013, 92, 131–139. [Google Scholar] [CrossRef] [PubMed]
  3. Álvarez-Torrellas, S.; Rodríguez, A.; Ovejero, G.; García, J. Comparative adsorption performance of ibuprofen and tetracycline from aqueous solution by carbonaceous materials. Chem. Eng. J. 2016, 283, 936–947. [Google Scholar] [CrossRef]
  4. Alves, T.C.; Cabrera-Codony, A.; Barceló, D.; Rodriguez-Mozaz, S.; Pinheiro, A.; Gonzalez-Olmos, R. Influencing factors on the removal of pharmaceuticals from water with micro-grain activated carbon. Water Res. 2018, 144, 402–412. [Google Scholar] [CrossRef]
  5. Anjum, M.; Miandad, R.; Waqas, M.; Gehany, F.; Barakat, M.A. Remediation of wastewater using various nano-materials. Arab. J. Chem. 2016, 12, 4897–4919. [Google Scholar] [CrossRef] [Green Version]
  6. Anumol, T.; Sgroi, M.; Park, M.; Roccaro, P.; Snyder, S.A. Predicting trace organic compound breakthrough in granular activated carbon using fluorescence and UV absorbance as surrogates. Water Res. 2015, 76, 76–87. [Google Scholar] [CrossRef] [PubMed]
  7. APHA; AWWA; WEF. Standard Methods for the Examination of Water and Wastewater, 21st ed.; APHA: Washington, DC, USA; AWWA: Denver, CO, USA; WEF: Cologny, Switzerland, 2005; pp. 258–259. [Google Scholar]
  8. Batt, A.L.; Kostich, M.S.; Lazorchak, J.M. Analysis of ecologically relevant pharmaceuticals in wastewater and surface water using selective solid-phase extraction and UPLC-MS/MS. Anal. Chem. 2008, 80, 5021–5030. [Google Scholar] [CrossRef]
  9. Benstoem, F.; Nahrstedt, A.; Boehler, M.; Knopp, G.; Montag, D.; Siegrist, H.; Pinnekamp, J. Performance of granular activated carbon to remove micropollutants from municipal wastewater—A meta-analysis of pilot- and large-scale studies. Chemosphere 2017, 185, 105–118. [Google Scholar] [CrossRef]
  10. Benstoem, F.; Pinnekamp, J. Characteristic numbers of granular activated carbon for the elimination of micropollutants from effluents of municipal wastewater treatment plants. Water Sci. Technol. 2017, 76, 279–285. [Google Scholar] [CrossRef]
  11. Berges, J.; Moles, S.; Ormad, M.P.; Mosteo, R.; Gómez, J. Antibiotics removal from aquatic environments: Adsorption of enrofloxacin, trimethoprim, sulfadiazine, and amoxicillin on vegetal powdered activated carbon. Environ. Sci. Pollut. Res. 2021, 28, 8442–8452. [Google Scholar] [CrossRef]
  12. Chen, D.; Xie, S.; Chen, C.; Quan, H.; Hua, L.; Luo, X.; Guoa, L. Activated biochar derived from pomelo peel as a high-capacity sorbent for removal of carbamazepine from aqueous solution. RSC Adv. 2017, 7, 54969–54979. [Google Scholar] [CrossRef] [Green Version]
  13. Clarithromycin. Tuberculosis 2008, 88, 92–95. [CrossRef]
  14. De Ridder, D.J.; Mcconville, M.; Verliefde, A.R.D.; van der Aa, L.T.J.; Heijman, S.G.J.; Verberk, J.Q.J.C.; Rietveld, L.C.; van Dijk, J.C. Development of a predictive model to determine micropollutant removal using granular activated carbon. Drink. Water Eng. Sci. 2009, 2, 57–62. [Google Scholar] [CrossRef] [Green Version]
  15. De Wilt, A.; van Gijn, K.; Verhoek, T.; Vergnes, A.; Hoek, M.; Rijnaarts, H.; Langenhoff, A. Enhanced pharmaceutical removal from water in a three step bio-ozone-bio process. Water Res. 2018, 138, 97–105. [Google Scholar] [CrossRef]
  16. Delgado, L.F.; Charles, P.; Glucina, K.; Morlay, C. The removal of endocrine disrupting compounds, pharmaceutically activated compounds and cyanobacterial toxins during drinking water preparation using activated carbon—A review. Sci. Total Environ. 2012, 435–436, 509–525. [Google Scholar] [CrossRef]
  17. Delgado, N.; Capparelli, A.; Navarro, A.; Marino, D. Pharmaceutical emerging pollutants removal from water using powdered activated carbon: Study of kinetics and adsorption equilibrium. J. Environ. Manag. 2019, 236, 301–308. [Google Scholar] [CrossRef]
  18. El-Hendawy, A.N.A.; Alexander, A.J.; Andrews, R.J.; Forrest, G. Effects of activation schemes on porous, surface and thermal properties of activated carbons prepared from cotton stalks. J. Anal. Appl. Pyrolysis 2008, 82, 272–278. [Google Scholar] [CrossRef] [Green Version]
  19. Falås, P.; Wick, A.; Castronovo, S.; Habermacher, J.; Ternes, T.A.; Joss, A. Tracing the limits of organic micropollutant removal in biological wastewater treatment. Water Res. 2016, 95, 240–249. [Google Scholar] [CrossRef] [Green Version]
  20. Freihardt, J.; Jekel, M.; Ruhl, A.S. Comparing test methods for granular activated carbon for organic micropollutant elimination. J. Environ. Chem. Eng. 2017, 5, 2542–2551. [Google Scholar] [CrossRef]
  21. Gorzin, F.; Bahri Rasht Abadi, M.M. Adsorption of Cr(VI) from aqueous solution by adsorbent prepared from paper mill sludge: Kinetics and thermodynamics studies. Adsorpt. Sci. Technol. 2018, 36, 149–169. [Google Scholar] [CrossRef] [Green Version]
  22. Gratuito, M.K.B.; Panyathanmaporn, T.; Chumnanklang, R.A.; Sirinuntawittaya, N.; Dutta, A. Production of activated carbon from coconut shell: Optimization using response surface methodology. Bioresour. Technol. 2008, 99, 4887–4895. [Google Scholar] [CrossRef]
  23. Kårelid, V.; Larsson, G.; Björlenius, B. Pilot-scale removal of pharmaceuticals in municipal wastewater: Comparison of granular and powdered activated carbon treatment at three wastewater treatment plants. J. Environ. Manag. 2017, 193, 491–502. [Google Scholar] [CrossRef]
  24. Kayiwa, R.; Kasedde, H.; Lubwama, M.; Kirabira, J.B. Mesoporous activated carbon yielded from pre- leached cassava peels. Bioresour. Bioprocess. 2021, 8, 53. [Google Scholar] [CrossRef]
  25. Kayiwa, R.; Olupot, P.W.; Lubwama, M. Production and Potential of Activated Carbon from Cassava Peels for Remediation of Active Pharmaceutical Ingredients from Wastewater: A Review. J. Mater. Sci. Res. Rev. 2019, 4, 1–24. [Google Scholar]
  26. Kosasih, A.N.; Febrianto, J.; Sunarso, J.; Ju, Y.H.; Indraswati, N.; Ismadji, S. Sequestering of Cu(II) from aqueous solution using cassava peel (Manihot esculenta). J. Hazard. Mater. 2010, 180, 366–374. [Google Scholar] [CrossRef]
  27. Kumar, R.; Siril, P.F. Ultrafine carbamazepine nanoparticles with enhanced water solubility and rate of dissolution. RSC Adv. 2014, 4, 48101–48108. [Google Scholar] [CrossRef]
  28. Kurniawan, A.; Kosasih, A.N.; Febrianto, J.; Ju, Y.H.; Sunarso, J.; Indraswati, N.; Ismadji, S. Evaluation of cassava peel waste as lowcost biosorbent for Ni-sorption: Equilibrium, kinetics, thermodynamics and mechanism. Chem. Eng. J. 2011, 172, 158–166. [Google Scholar] [CrossRef]
  29. Lee, C.O.; Howe, K.J.; Thomson, B.M. Ozone and biofiltration as an alternative to reverse osmosis for removing PPCPs and micropollutants from treated wastewater. Water Res. 2012, 46, 1005–1014. [Google Scholar] [CrossRef]
  30. Li, Y.; Lian, J.; Wu, B.; Zou, H.; Tan, S.K. Phytoremediation of pharmaceutical-contaminated wastewater: Insights into rhizobacterial dynamics related to pollutant degradation mechanisms during plant life cycle. Chemosphere 2020, 253, 126681. [Google Scholar] [CrossRef]
  31. Liu, F.F.; Zhao, J.; Wang, S.; Du, P.; Xing, B. Effects of solution chemistry on adsorption of selected pharmaceuticals and personal care products (PPCPs) by graphenes and carbon nanotubes. Environ. Sci. Technol. 2014, 48, 13197–13206. [Google Scholar] [CrossRef]
  32. Liu, H.; Zhang, J.; Nani, B.; Cheng, C.; Zhang, C.; Liang, R.; Chenglu, Z. Textural properties and surface chemistry of lotus stalk-derived activated carbons prepared using different phosphorus oxyacids: Adsorption of trimethoprim. J. Hazard. Mater. 2012, 235–236, 367–375. [Google Scholar] [CrossRef]
  33. Mailler, R.; Gasperi, J.; Coquet, Y.; Buleté, A.; Vulliet, E.; Deshayes, S.; Zedek, S.; Mirande-Bret, C.; Eudes, V.; Bressy, A.; et al. Removal of a wide range of emerging pollutants from wastewater treatment plant discharges by micro-grain activated carbon in fluidized bed as tertiary treatment at large pilot scale. Sci. Total Environ. 2016, 542, 983–996. [Google Scholar] [CrossRef] [Green Version]
  34. Mailler, R.; Gasperi, J.; Coquet, Y.; Deshayes, S.; Zedek, S.; Cren-Olive, C.; Cartiser, N.; Eudes, V.; Bressy, A.; Caupos, E.; et al. Study of a large scale powdered activated carbon pilot: Removals of a wide range of emerging and priority micropollutants from wastewater treatment plant effluents. Water Res. 2015, 72, 315–330. [Google Scholar] [CrossRef] [Green Version]
  35. Margot, J.; Kienle, C.; Magnet, A.; Weil, M.; Rossi, L.; de Alencastro, L.F.; Abegglen, C.; Thonney, D.; Chèvre, N.; Schärer, M.; et al. Treatment of micropollutants in municipal wastewater: Ozone or powdered activated carbon? Sci. Total Environ. 2013, 461–462, 480–498. [Google Scholar] [CrossRef]
  36. Marques, S.C.R.; Mestre, A.S.; Machuqueiro, M.; Gotvajn, A. Ž.; Marinšek, M.; Carvalho, A.P. Apple tree branches derived activated carbons for the removal of β-blocker atenolol. Chem. Eng. J. 2018, 345, 669–678. [Google Scholar] [CrossRef]
  37. Menya, E.; Olupot, P.W.; Storz, H.; Lubwama, M.; Kiros, Y. Characterization and alkaline pretreatment of rice husk varieties in Uganda for potential utilization as precursors in the production of activated carbon and other value-added products. Waste Manag. 2018, 81, 104–116. [Google Scholar] [CrossRef]
  38. Moreno-Piraján, J.C.; Giraldo, L. Study of activated carbons by pyrolysis of cassava peel in the presence of chloride zinc. J. Anal. Appl. Pyrolysis 2010, 87, 288–290. [Google Scholar] [CrossRef]
  39. Nantaba, F.; Wasswa, J.; Kylin, H.; Palm, W.; Bouwman, H.; Kümmerer, K. Occurrence, distribution, and ecotoxicological risk assessment of selected pharmaceutical compounds in water from Lake Victoria, Uganda. Chemosphere 2020, 239, 124642. [Google Scholar] [CrossRef]
  40. National Center for Biotechnology Information. PubChem Compound Summary for CID 5578, Trimethoprim 2022. Available online: https://pubchem.ncbi.nlm.nih.gov/compound/Trimethoprim (accessed on 30 August 2021).
  41. National Center for Biotechnology Information. PubChem Compound Summary for CID 2554, Carbamazepine. PubChem Compound Summary for CID 2554, Carbamazepine 2022. Available online: https://pubchem.ncbi.nlm.nih.gov/compound/Carbamazepine (accessed on 30 August 2021).
  42. National Center for Biotechnology Information. PubChem Compound Summary for CID 84029, Clarithromycin 2022. Available online: https://pubchem.ncbi.nlm.nih.gov/compound/Clarithromycin (accessed on 30 August 2021).
  43. Nguyen Dang Giang, C.; Sebesvari, Z.; Renaud, F.; Rosendahl, I.; Hoang Minh, Q.; Amelung, W. Occurrence and dissipation of the antibiotics sulfamethoxazole, sulfadiazine, trimethoprim, and enrofloxacin in the Mekong Delta, Vietnam. PLoS ONE 2015, 10, e0131855. [Google Scholar] [CrossRef] [Green Version]
  44. Piai, L.; Dykstra, J.E.; Adishakti, M.G.; Blokland, M.; Langenhoff, A.A.M.; van der Wal, A. Diffusion of hydrophilic organic micropollutants in granular activated carbon with different pore sizes. Water Res. 2019, 162, 518–527. [Google Scholar] [CrossRef] [PubMed]
  45. Reza, R.A.; Ahmaruzzaman, M.; Sil, A.K.; Gupta, V.K. Comparative adsorption behavior of ibuprofen and clofibric acid onto microwave assisted activated bamboo waste. Ind. Eng. Chem. Res. 2014, 53, 9331–9339. [Google Scholar] [CrossRef]
  46. Sbardella, L.; Comas, J.; Fenu, A.; Rodriguez-Roda, I.; Weemaes, M. Advanced biological activated carbon filter for removing pharmaceutically active compounds from treated wastewater. Sci. Total Environ. 2018, 636, 519–529. [Google Scholar] [CrossRef] [PubMed]
  47. Sekulic, M.T.; Boskovic, N.; Slavkovic, A.; Garunovic, J.; Kolakovic, S.; Pap, S. Surface functionalised adsorbent for emerging pharmaceutical removal: Adsorption performance and mechanisms. Process Saf. Environ. Protect. 2019, 125, 50–63. [Google Scholar] [CrossRef]
  48. Singh, A.K. Nanoparticle Ecotoxicology. Engineered Nanoparticles; Elsevier Inc.: Amsterdam, The Netherlands, 2016; pp. 343–450. [Google Scholar] [CrossRef]
  49. Sulaiman, N.S.; Hashim, R.; Amini, M.H.M.; Danish, M.; Sulaiman, O. Optimization of activated carbon preparation from cassava stem using response surface methodology on surface area and yield. J. Clean. Prod. 2018, 198, 1422–1430. [Google Scholar] [CrossRef]
  50. Tran, H.N.; Wen, Y.C.; Wang, Y.F.; You, S.J. Highly efficient removal of hazardous aromatic pollutants by micro-nano spherical carbons synthesized from different chemical activation methods: A comparison study. Environ. Technol. 2018, 40, 1376–1391. [Google Scholar] [CrossRef]
  51. Velusamy, K.; Periyasamy, S.; Kumar, P.S.; Jayaraj, T.; Krishnasamy, R.; Sindhu, J.; Sneka, D.; Subhashini, B.; Vo, D.V.N. Analysis on the removal of emerging ontaminant from aqueous solution using biochar derived from soap nut seeds. Environ. Pollut. 2021, 287, 117632. [Google Scholar] [CrossRef]
  52. Wang, J.; Kaskel, S. KOH activation of carbon-based materials for energy storage. J. Mater. Chem. 2012, 22, 23710–23725. [Google Scholar] [CrossRef]
  53. Wang, S.; Li, X.; Zhao, H.; Quan, X.; Chen, S.; Yu, H. Enhanced adsorption of ionizable antibiotics on activated carbon fiber under electrochemical assistance in continuous-flow modes. Water Res. 2018, 134, 162–169. [Google Scholar] [CrossRef]
  54. Xu, L.; Campos, L.C.; Li, J.; Karu, K.; Ciric, L. Removal of antibiotics in sand, GAC, GAC sandwich and anthracite/sand biofiltration systems. Chemosphere 2021, 275, 130004. [Google Scholar] [CrossRef]
  55. Yang, F.; Sun, L.; Xie, W.; Jiang, Q.; Gao, Y.; Zhang, W.; Zhang, Y. Nitrogen-functionalization biochars derived from wheat straws via molten salt synthesis: An efficient adsorbent for atrazine removal. Sci. Total Environ. 2017, 607–608, 1391–1399. [Google Scholar] [CrossRef]
  56. Zietzschmann, F.; Altmann, J.; Ruhl, A.S.; Dünnbier, U.; Dommisch, I.; Sperlich, A.; Meinel, F.; Jekel, M. Estimating organic micro-pollutant removal potential of activated carbons using UV absorption and carbon characteristics. Water Res. 2014, 56, 48–55. [Google Scholar] [CrossRef]
  57. Zietzschmann, F.; Stützer, C.; Jekel, M. Granular activated carbon adsorption of organic micro-pollutants in drinking water and treated wastewater—Aligning breakthrough curves and capacities. Water Res. 2016, 92, 180–187. [Google Scholar] [CrossRef]
Figure 1. Comparison between the actual and predicted values for the (a) surface area and (b) yield and the response surface plots for the interaction effect of the temperature and time towards the (c) surface area and (d) yield.
Water 14 03371 g001aWater 14 03371 g001b
Figure 2. Percentage sequestration of APIs from affluent and Milli-Q water at equilibrium.
Water 14 03371 g002
Figure 3. Effect of the CPAC dosage on the API removal.
Water 14 03371 g003
Figure 4. Percentage removal rates of APIs with time from (a) effluent and (b) Milli-Q water.
Water 14 03371 g004
Figure 5. Effects of the initial APIs concentration on (a) the equilibrium adsorption capacity and (b) the API removal.
Water 14 03371 g005
Figure 6. Effect of the pH on the API adsorption for CPAC.
Water 14 03371 g006
Figure 7. Plots of (a) Langmuir and (b) Freundlich models for the CPAC on the studied APIs.
Water 14 03371 g007
Figure 8. SEM images of the fresh CPAC (a,c) and spent CPAC applied for both wastewater (b) and Milli-Q water (d).
Water 14 03371 g008
Table 1. Independent variables and their coded levels.
VariableFactorVariable Level
−10+1
Time (min)Xi2090180
Temperature (°C)Xj400625900
Table 2. Physicochemical properties of the pharmaceuticals used in this study.
PropertiesCBZCLNTRM
Molecular structureWater 14 03371 i001Water 14 03371 i002Water 14 03371 i003
Molecular formulaC15H12N2OC38H69NO13 bC14H18N4O3
Molecular weight (g/mol)236.09 d747.953 b290.32 e
CAS ID298-46-4 d81103-11-9 b738-70-5 e
Water solubility at 20 °C (mgL−1)Practically insoluble0.33 b1000 a
pka<2.3; >13.9 d8.99 b6.60 e
log Kow2.453.20.59 a, 0.91 e
Formal/molecular charge0 d0 c0 e
Hydrogen bond donor count1 d4 c2 e
Hydrogen bond acceptor count1 d14 c7 e
Note: a = [28]; b = [29]; c = [30]; d = [31]; e = [32].
Table 3. Characteristics of solutions A and B.
SolutionDOC (mg/L)NH4+ (mg/L)NO3 (mg/L)CODBOD5CLN (mgL−1)CBZ (mgL−1)TRM (mgL−1)
A184.6525.5228.40210.00142.0020.0020.0020.00
B0.000.000.000.000.0020.0020.0020.00
Table 4. Characteristics of the CPAC used in this study.
Specific Surface Area (m2/g)Micropore Volume (cm3/g)Mesopore Volume (cm3/g)Total Pore Volume (cm3/g)
1684 ± 20.281 ± 0.020.471 ± 0.040.756 ± 0.01
Table 5. Langmuir and Freundlich coefficients of adsorption isotherms and the correlation coefficients of the experimental data.
Langmuir Freundlich
APIKL (L/mg)qmax (mg/g)R2KF (mgg−1 (mgL−1) 1/n)1/nR2
CBZ0.145325.90670.9544.196706290.57720.9764
CLN−0.0075−188.67920.9471.486612441.010.9361
TRM0.025084.03360.95812.589591130.80590.9411
Table 6. Maximum adsorption capacities from this study compared with other carbonaceous adsorbents.
APIAdsorbentAdsorption Capacity (mgg−1)Process ConditionsReference
CBZCPAC25.907Adsorbent dose: 2.0 gL−1; pH: 7–8; time: 12 h; Co: 20 mgL−1This study
CBZActivated biochar derived from pomelo peel286.50Adsorbent dose: 200 mgL−1; pH: 6.7; time: 24 h; Co: 100 mgL−1[51]
CBZPhosphorous-doped microporous carbonous material17.69Adsorbent dose: 2.0 gL−1; pH: 6–7; time: 1 h; Co: 50 mgL−1[53]
CLNCPAC1.49Adsorbent dose: 2.0 gL−1; pH: 7–8; time: 12 h; Co: 20 mgL−1This study
CLNGranular activated carbon biofilter0.0072Adsorbent dose: 0.5 gL−1; pH: 3–7; time: 90 days; Co: 5 µgL−1[54]
CLNActivated carbon fiber under electrochemical assistance70.90Adsorbent dose: 10 mgL−1; pH: 8.99; time: 1 h; Co: 50 mgL−1[42]
TRMCPAC84.034Adsorbent dose: 2.0 gL−1; pH: 7–8; time: 12 h; Co: 20 mgL−1This study
TRMLotus stalk-derived activated carbons prepared using phosphorus oxyacids 175.125Adsorbent dose: 0.2 gL−1; pH: 5–7; time: 3 days; Co: 87.10 mgL−1[55]
TRMVegetal powdered activated carbon135.00Adsorbent dose: 100 mgL−1; pH:6.5; time: 60 min; Co: 15 mgL−1[48]
Publisher’s Note: MDPI stays neutral with regard to jurisdictional claims in published maps and institutional affiliations.

