


Assessment of Urbanization-Induced Land-Use Change and Its Impact on Temperature, Evaporation, and Humidity in Central Vietnam

 ,
,  , , and
Abstract
:1. Introduction
2. Data and Method
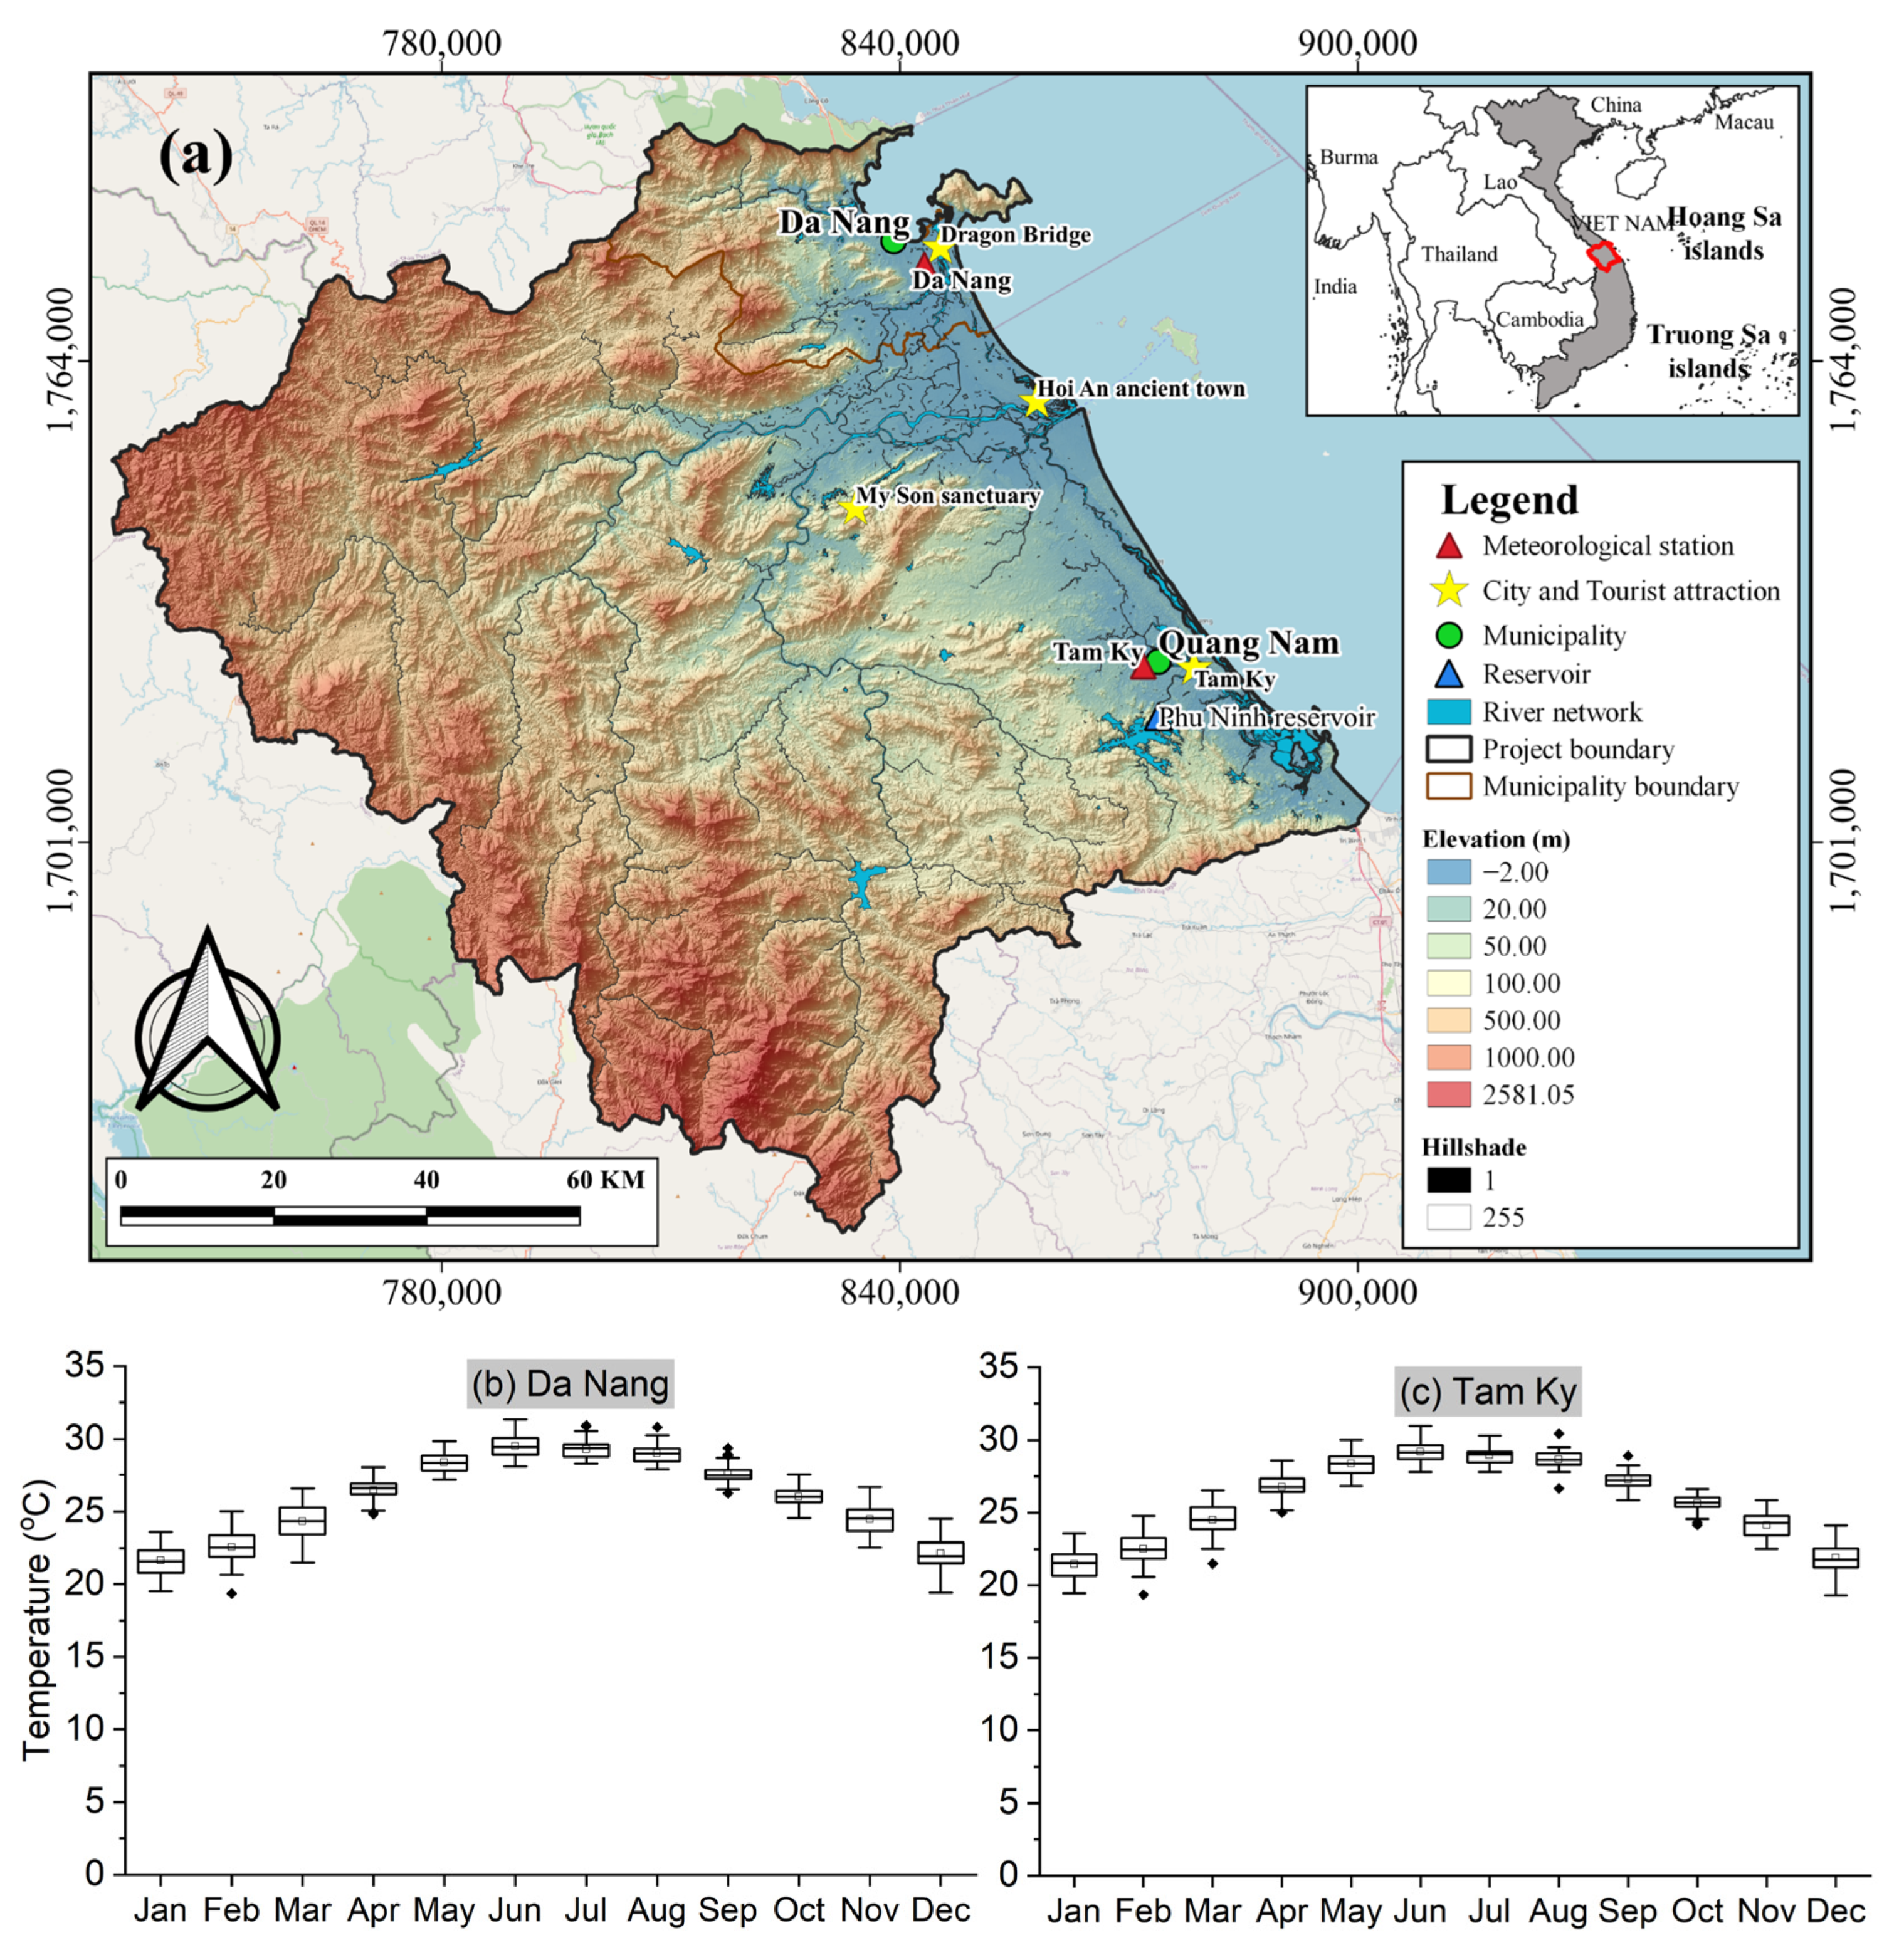
2.1. Study Area
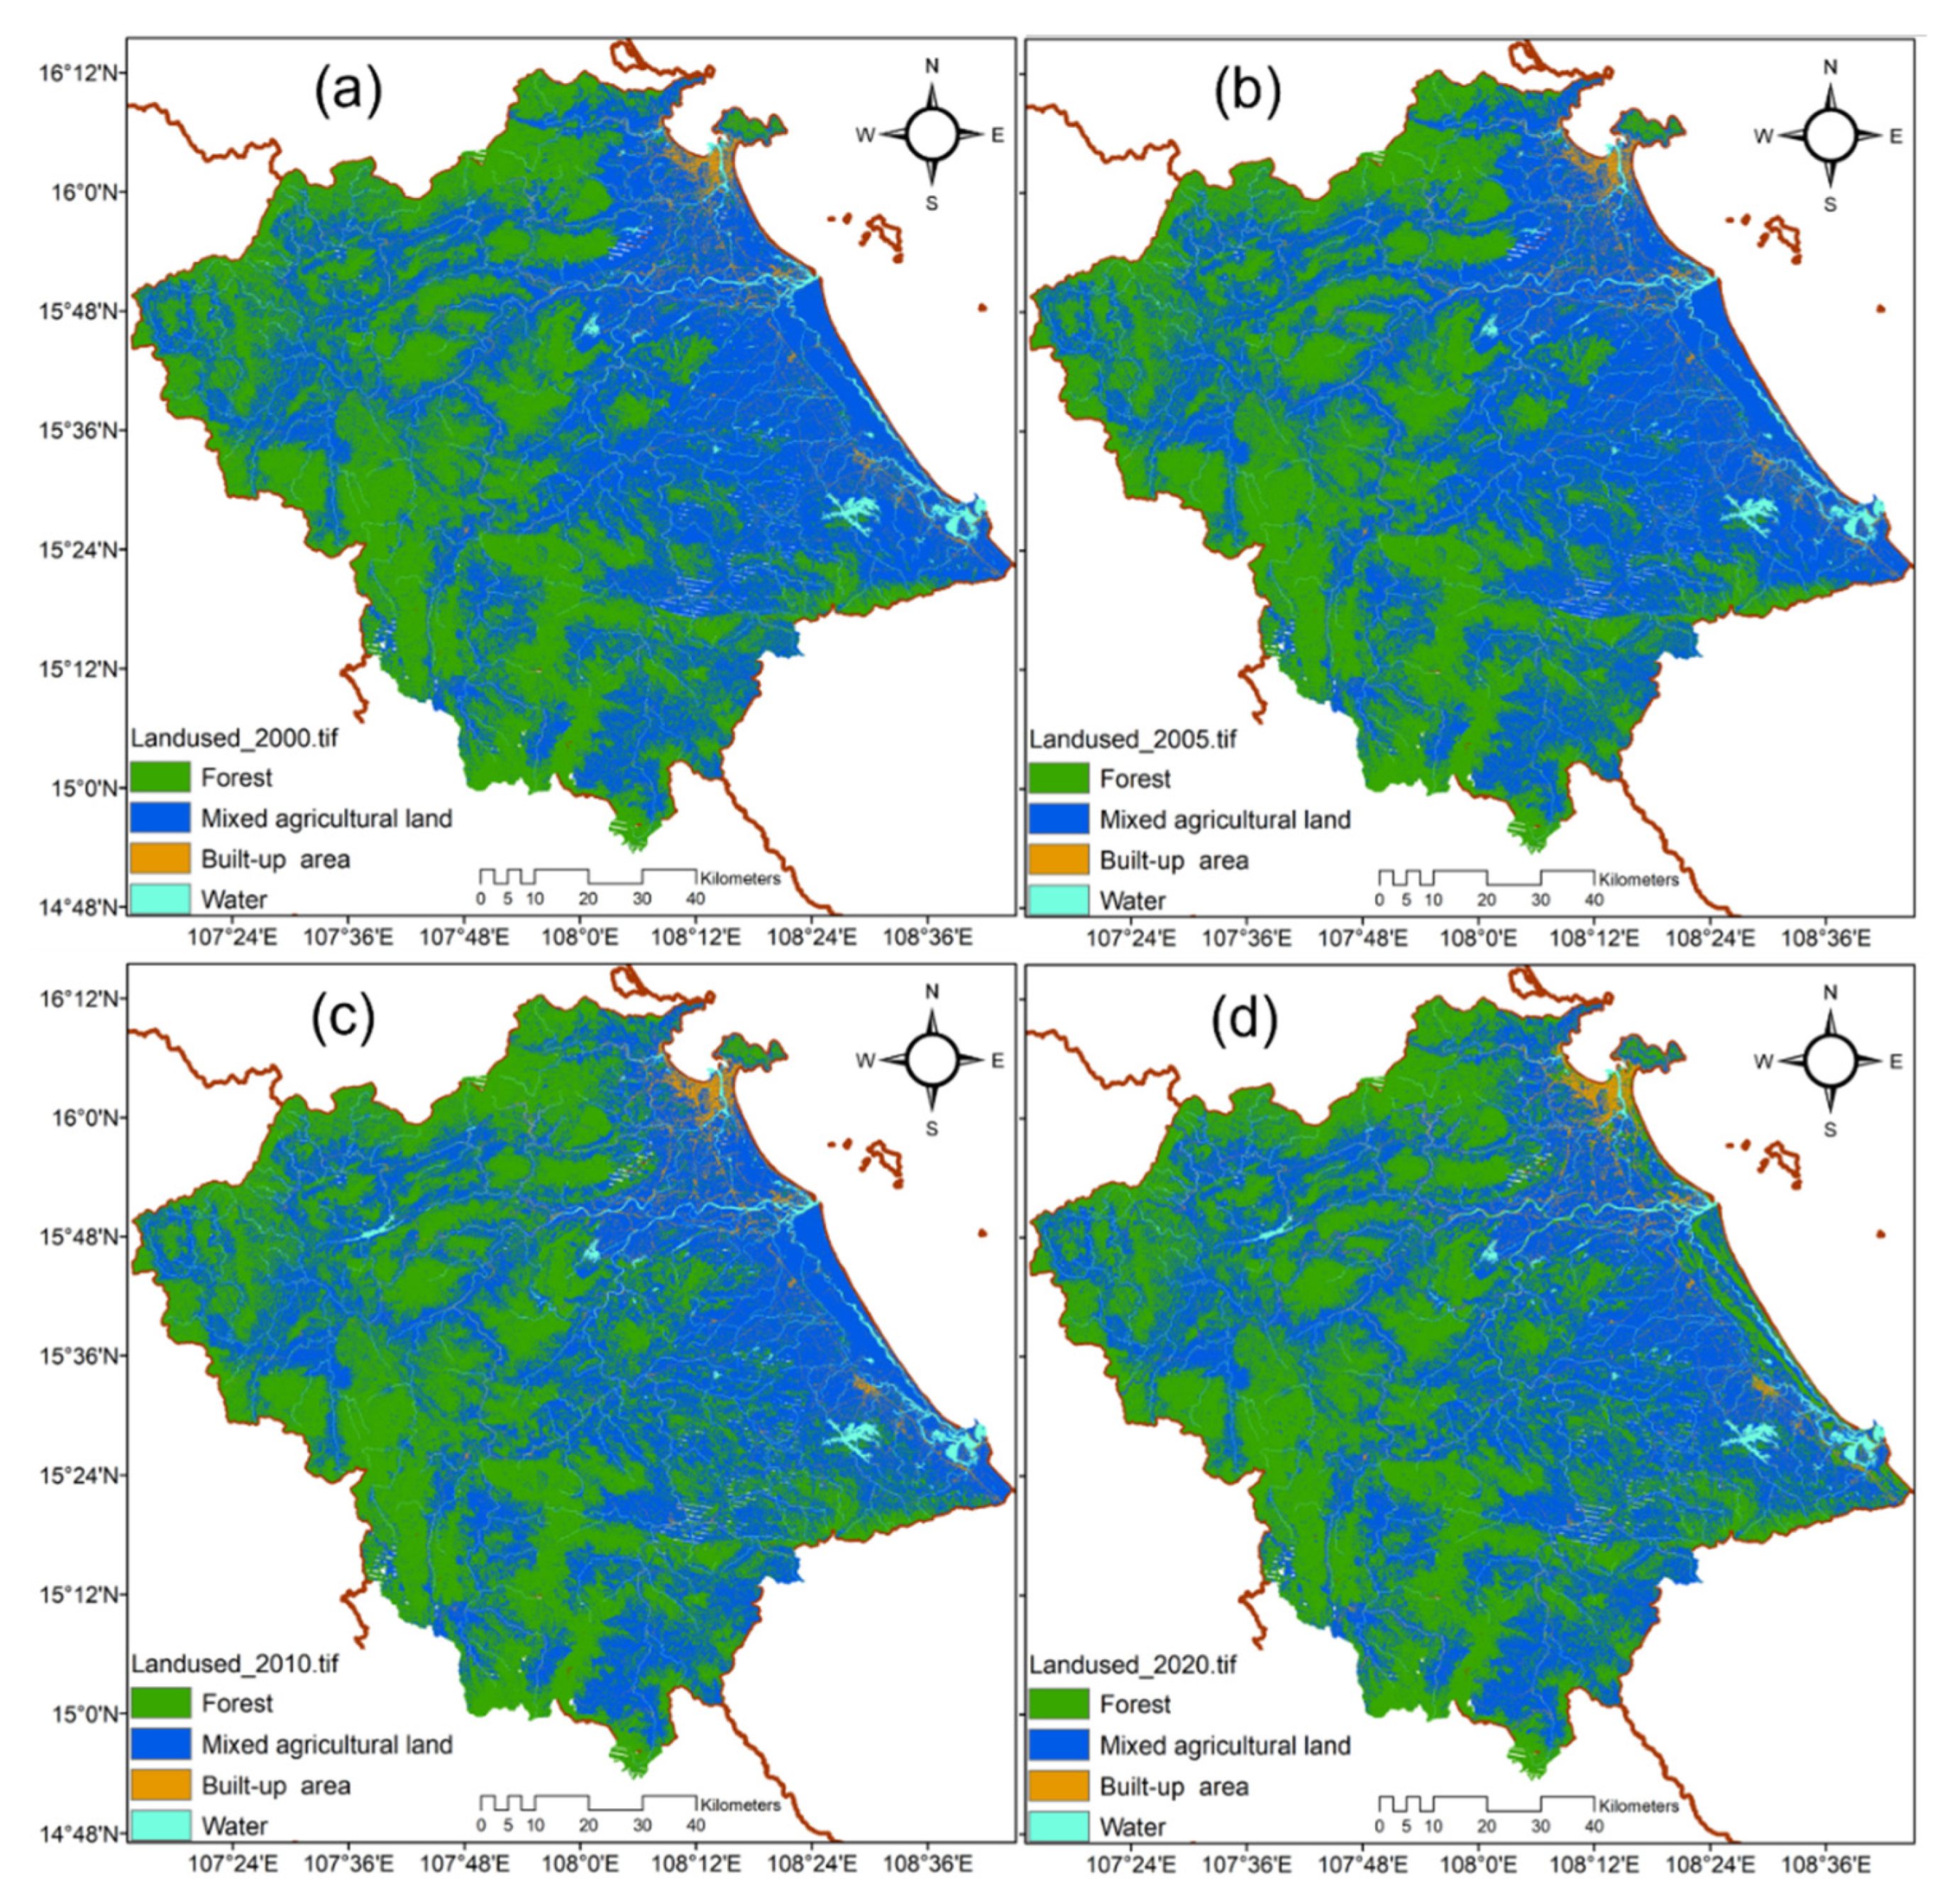
2.2. Land-Use
2.3. Methodology
2.3.1. Trend Analysis Methods
2.3.2. Mann–Kendall Test
2.3.3. Sen’s Slope Estimator
3. Results and Discussions
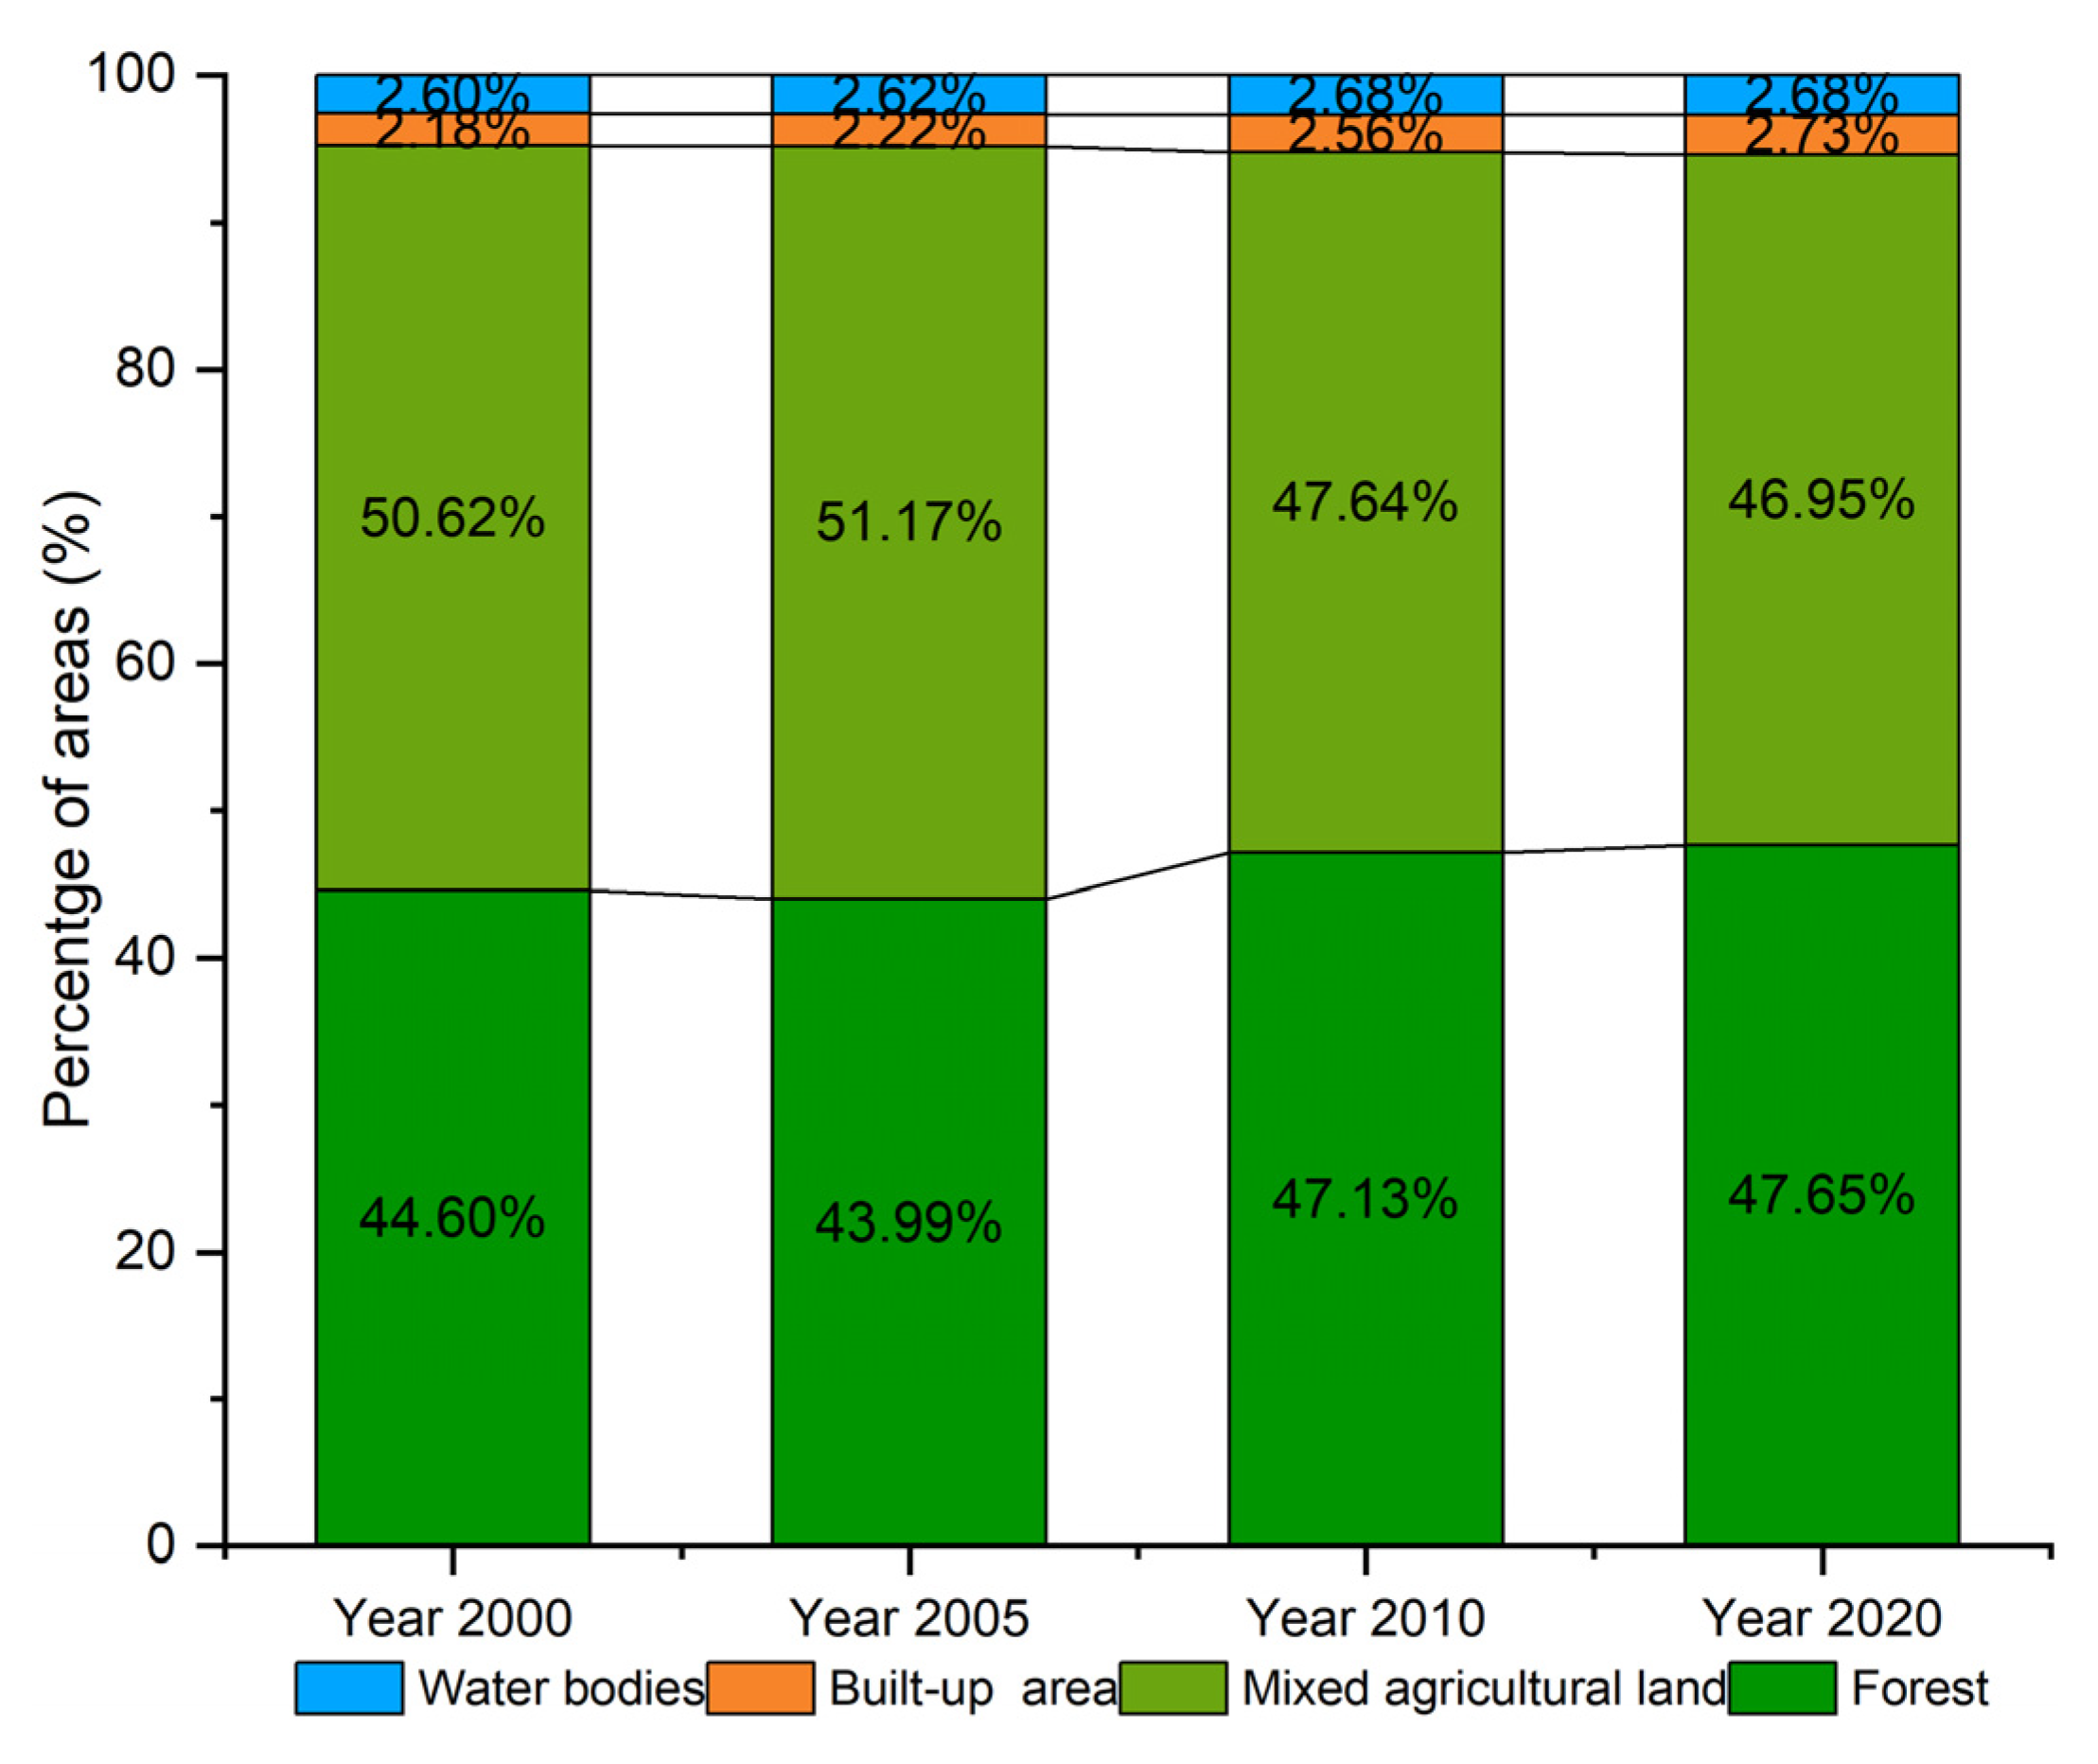
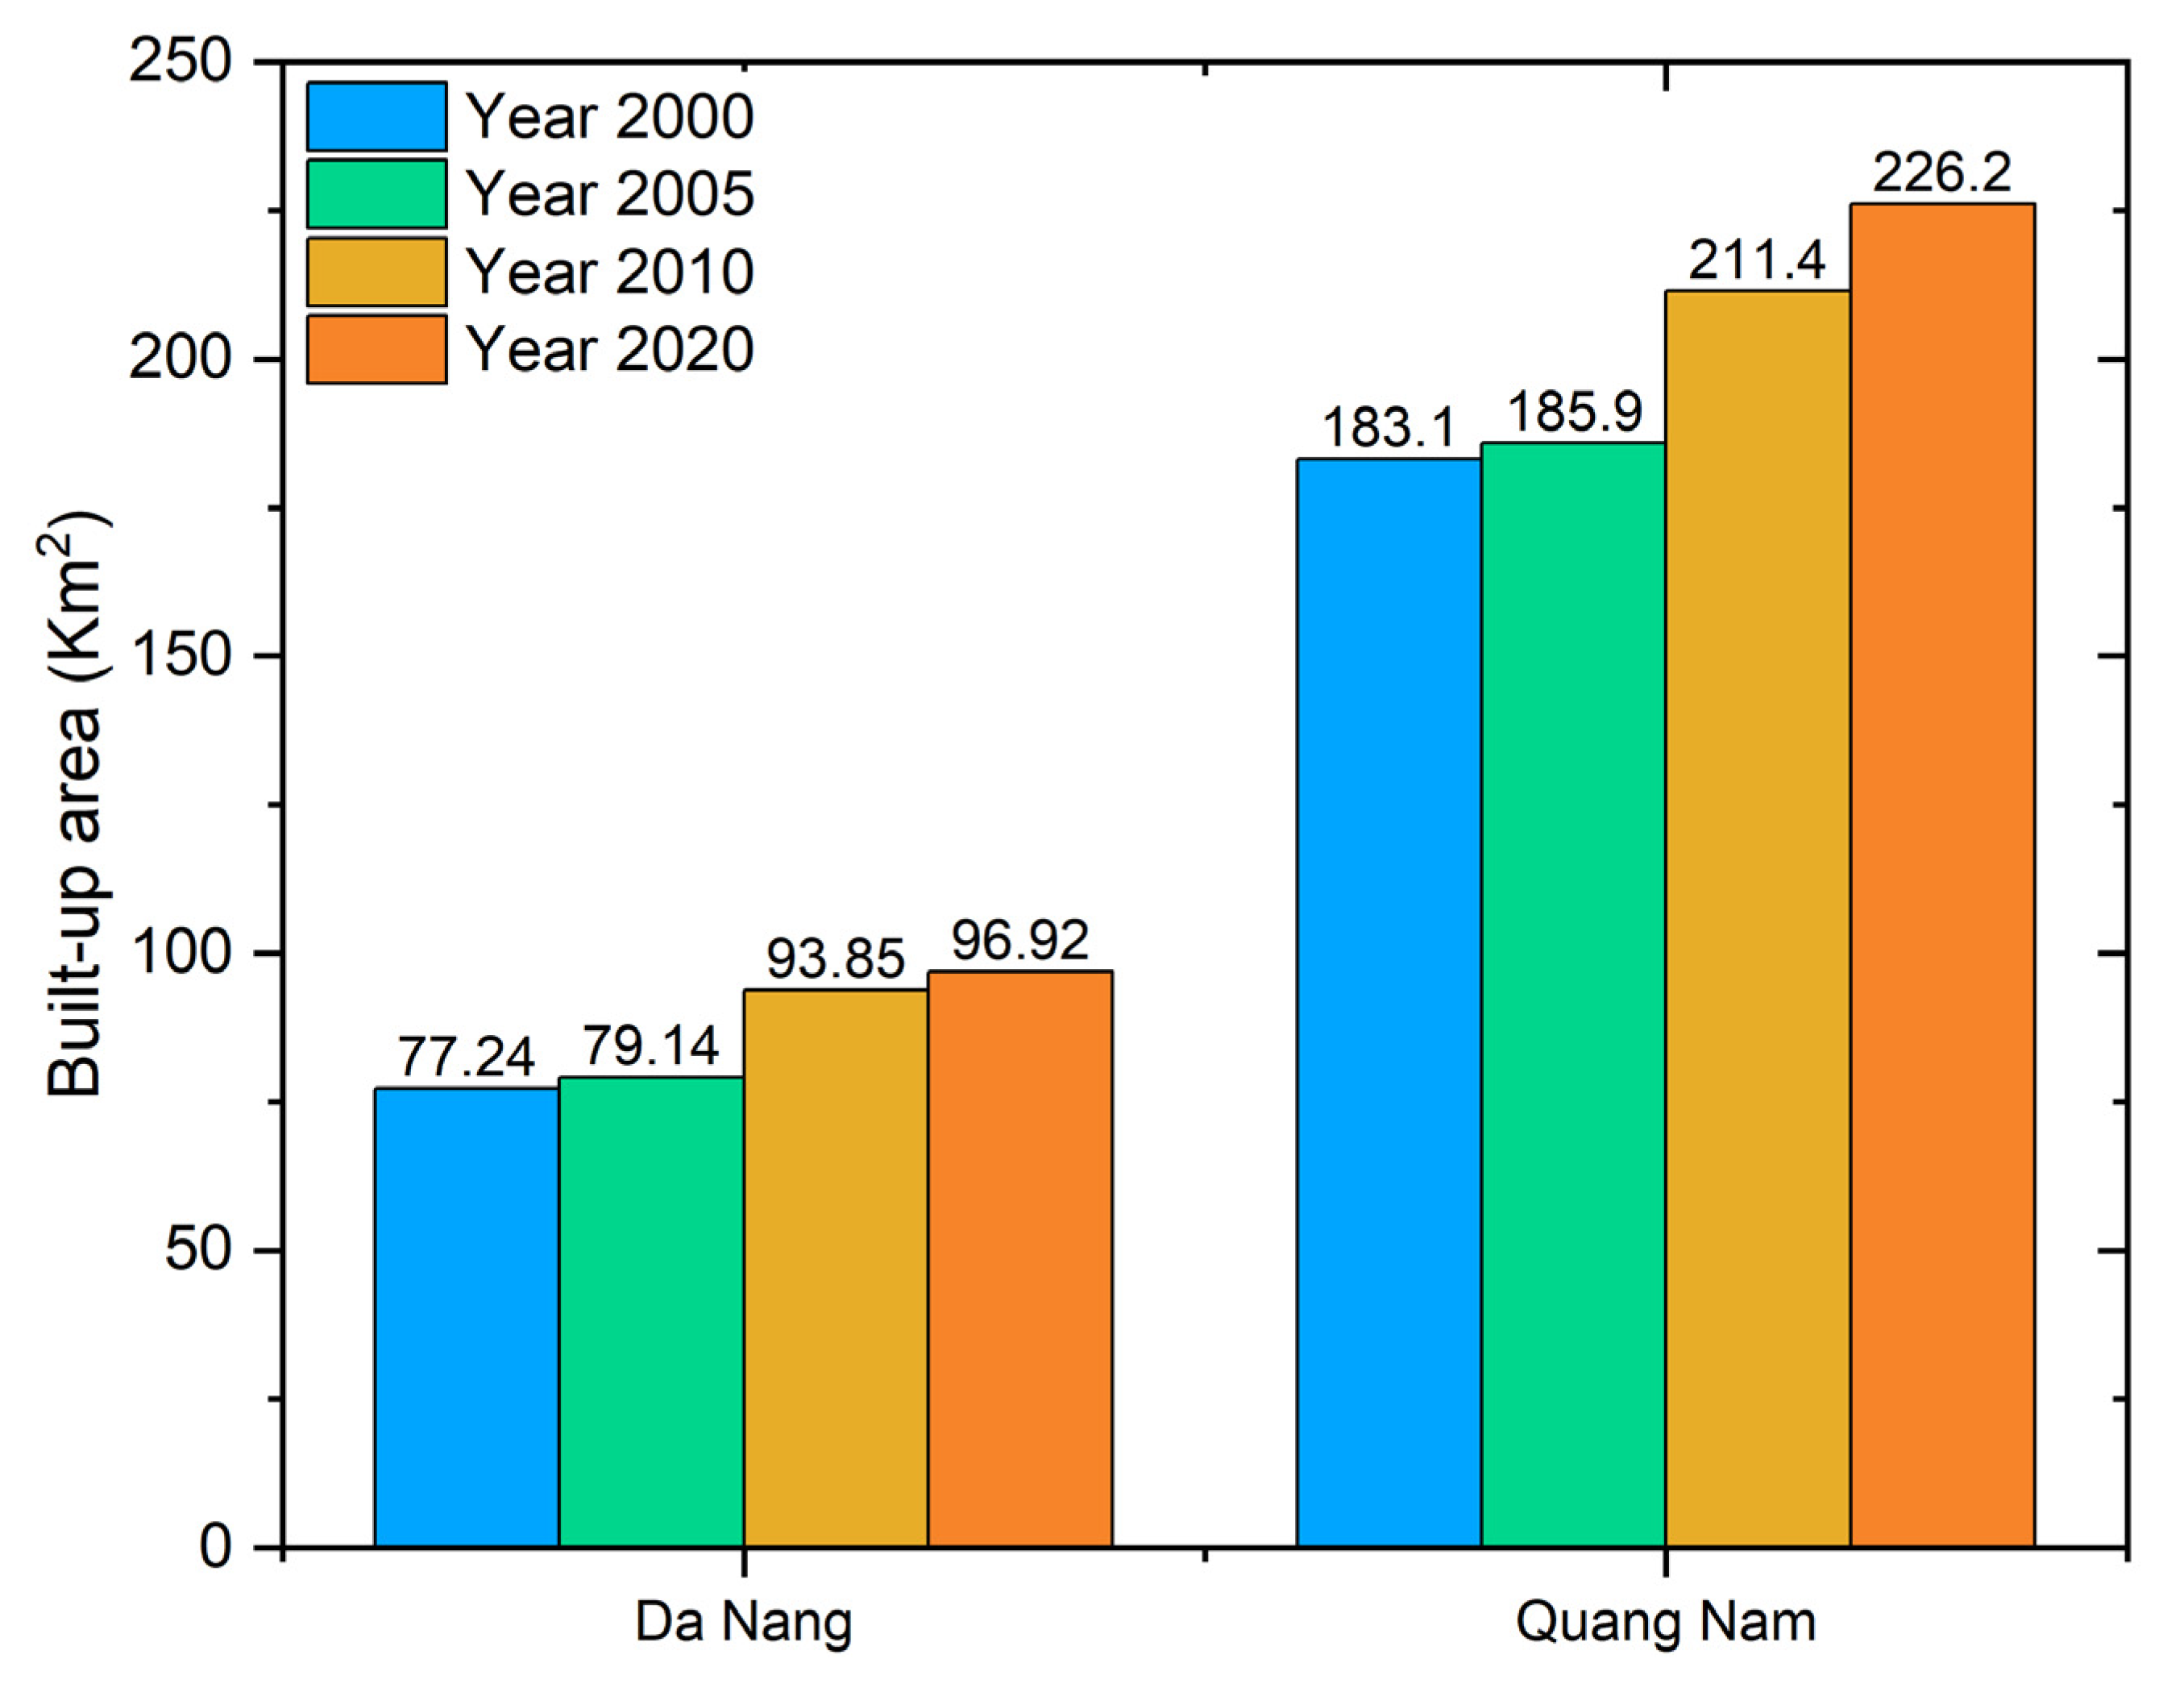
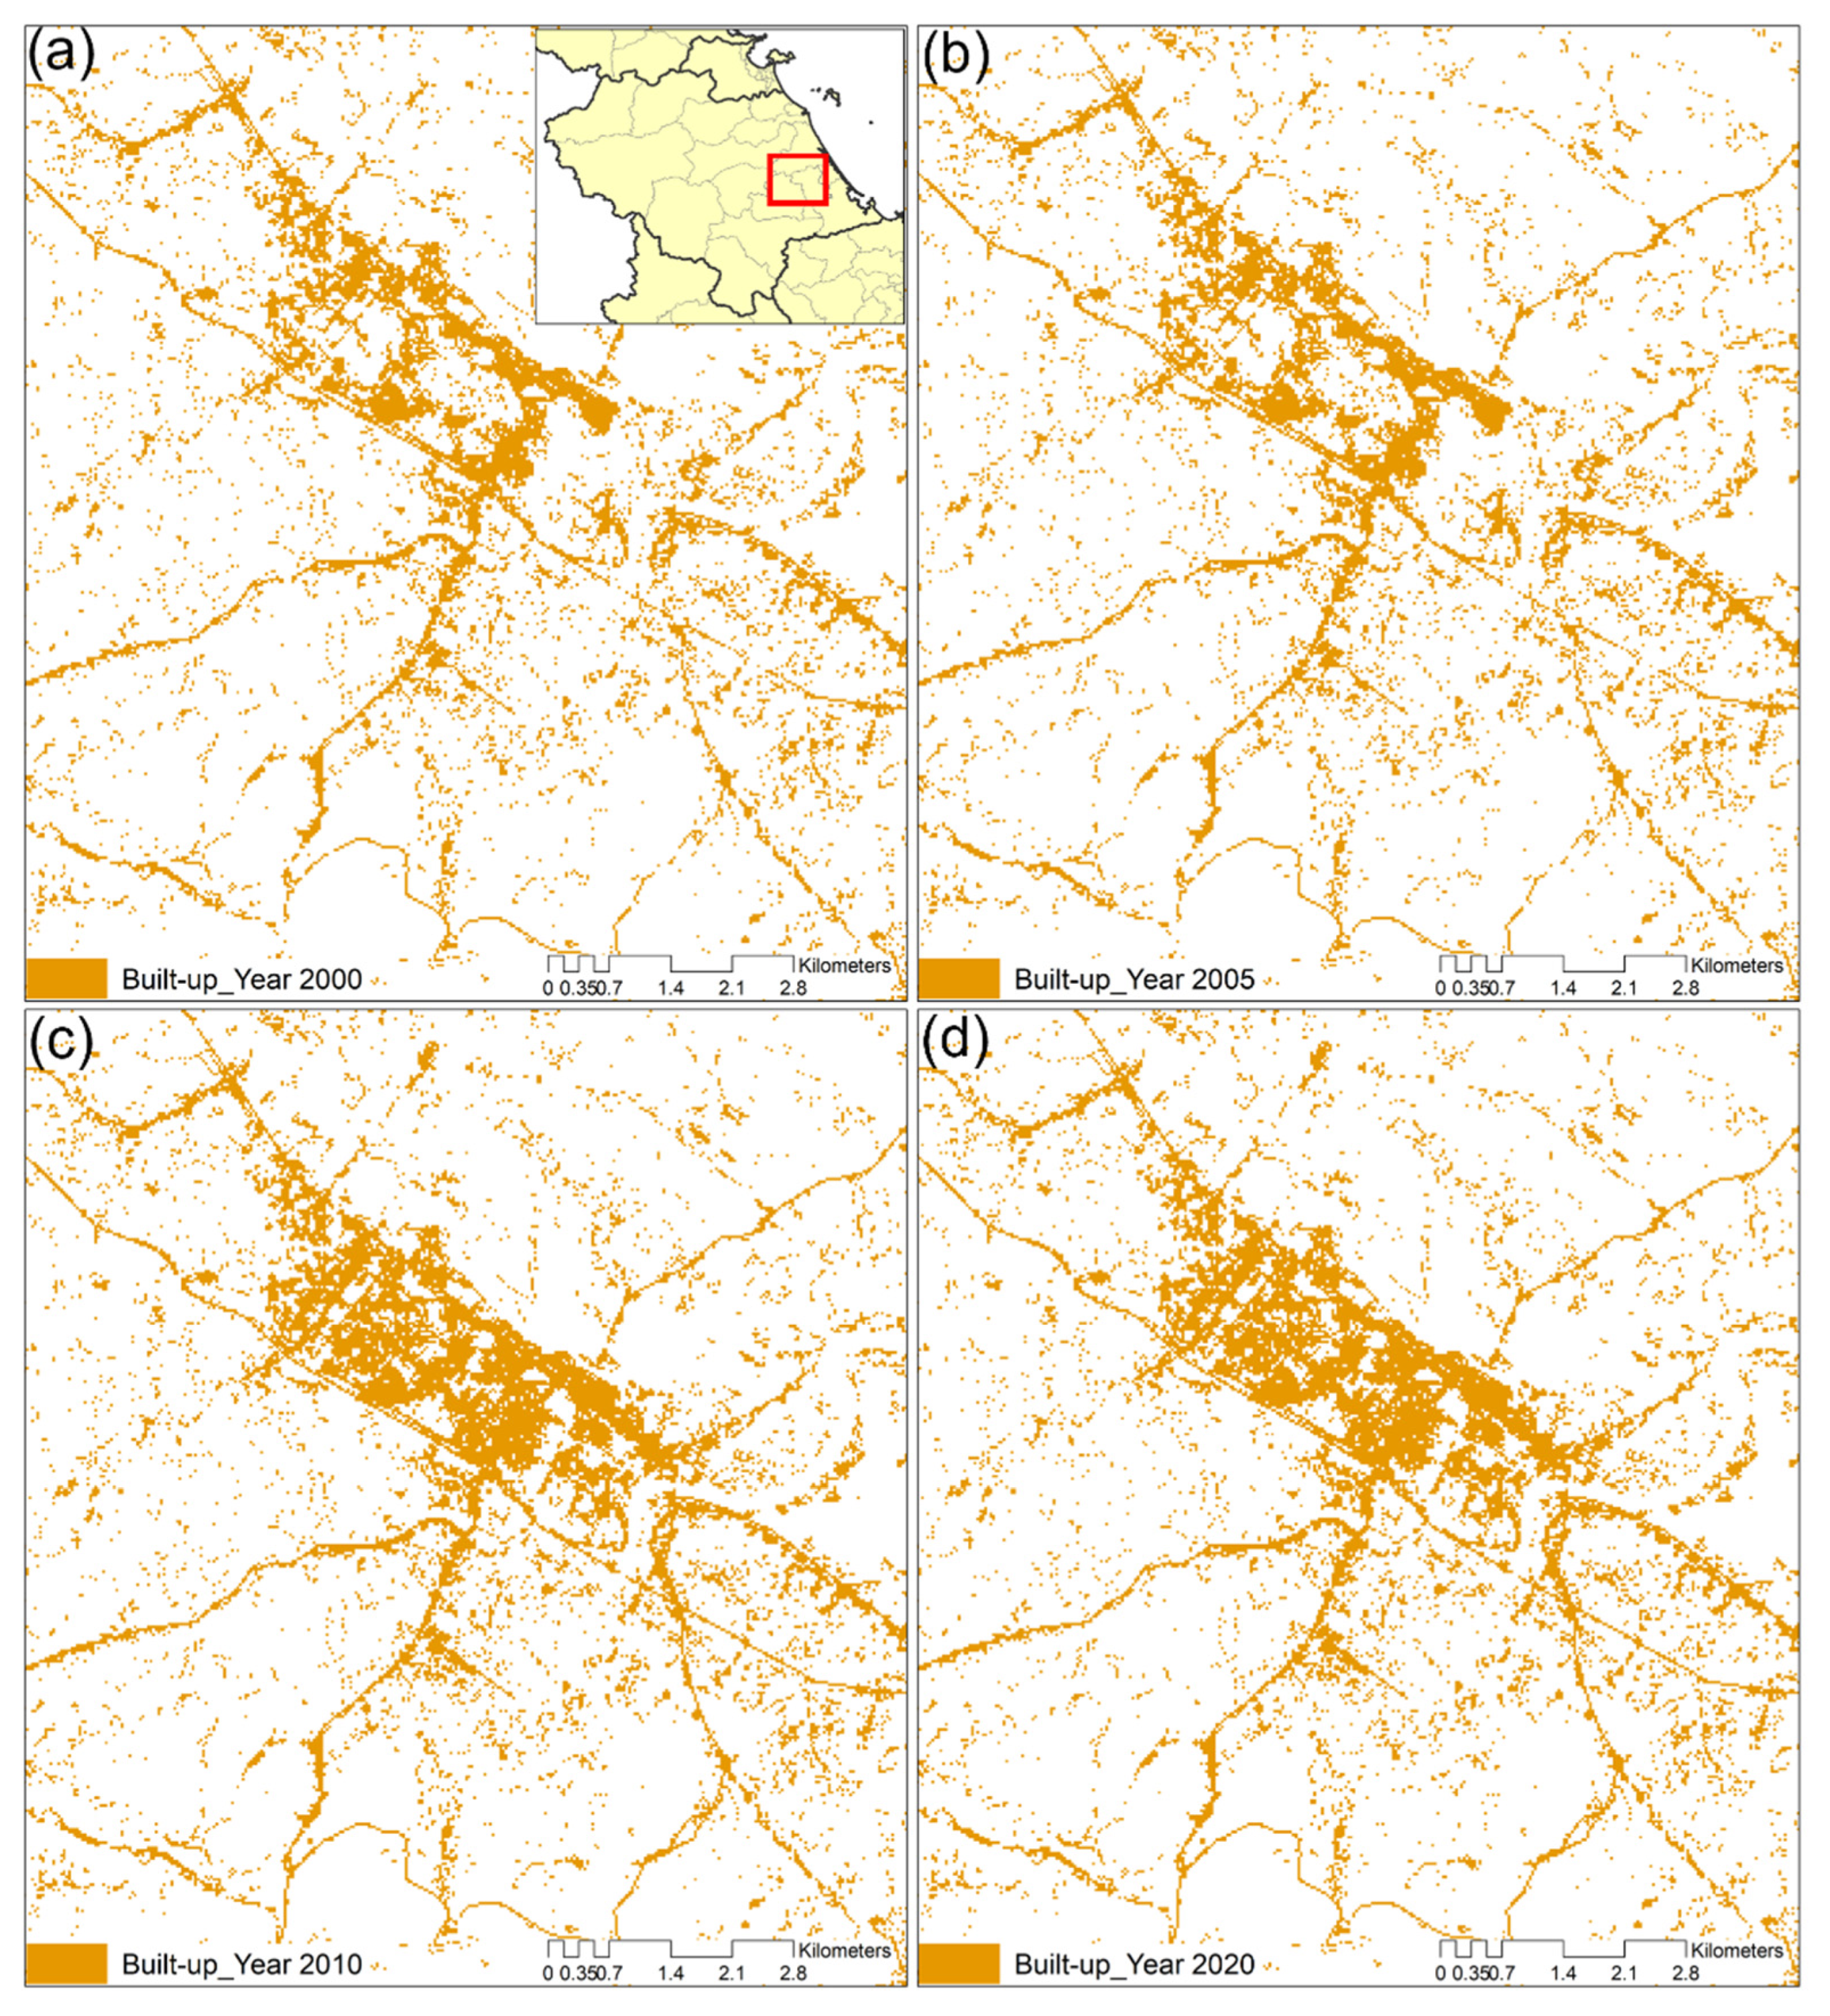
3.1. Land-Use Change in Da Nang City and Quang Nam Province
3.2. Trends in the Meteorological Variables
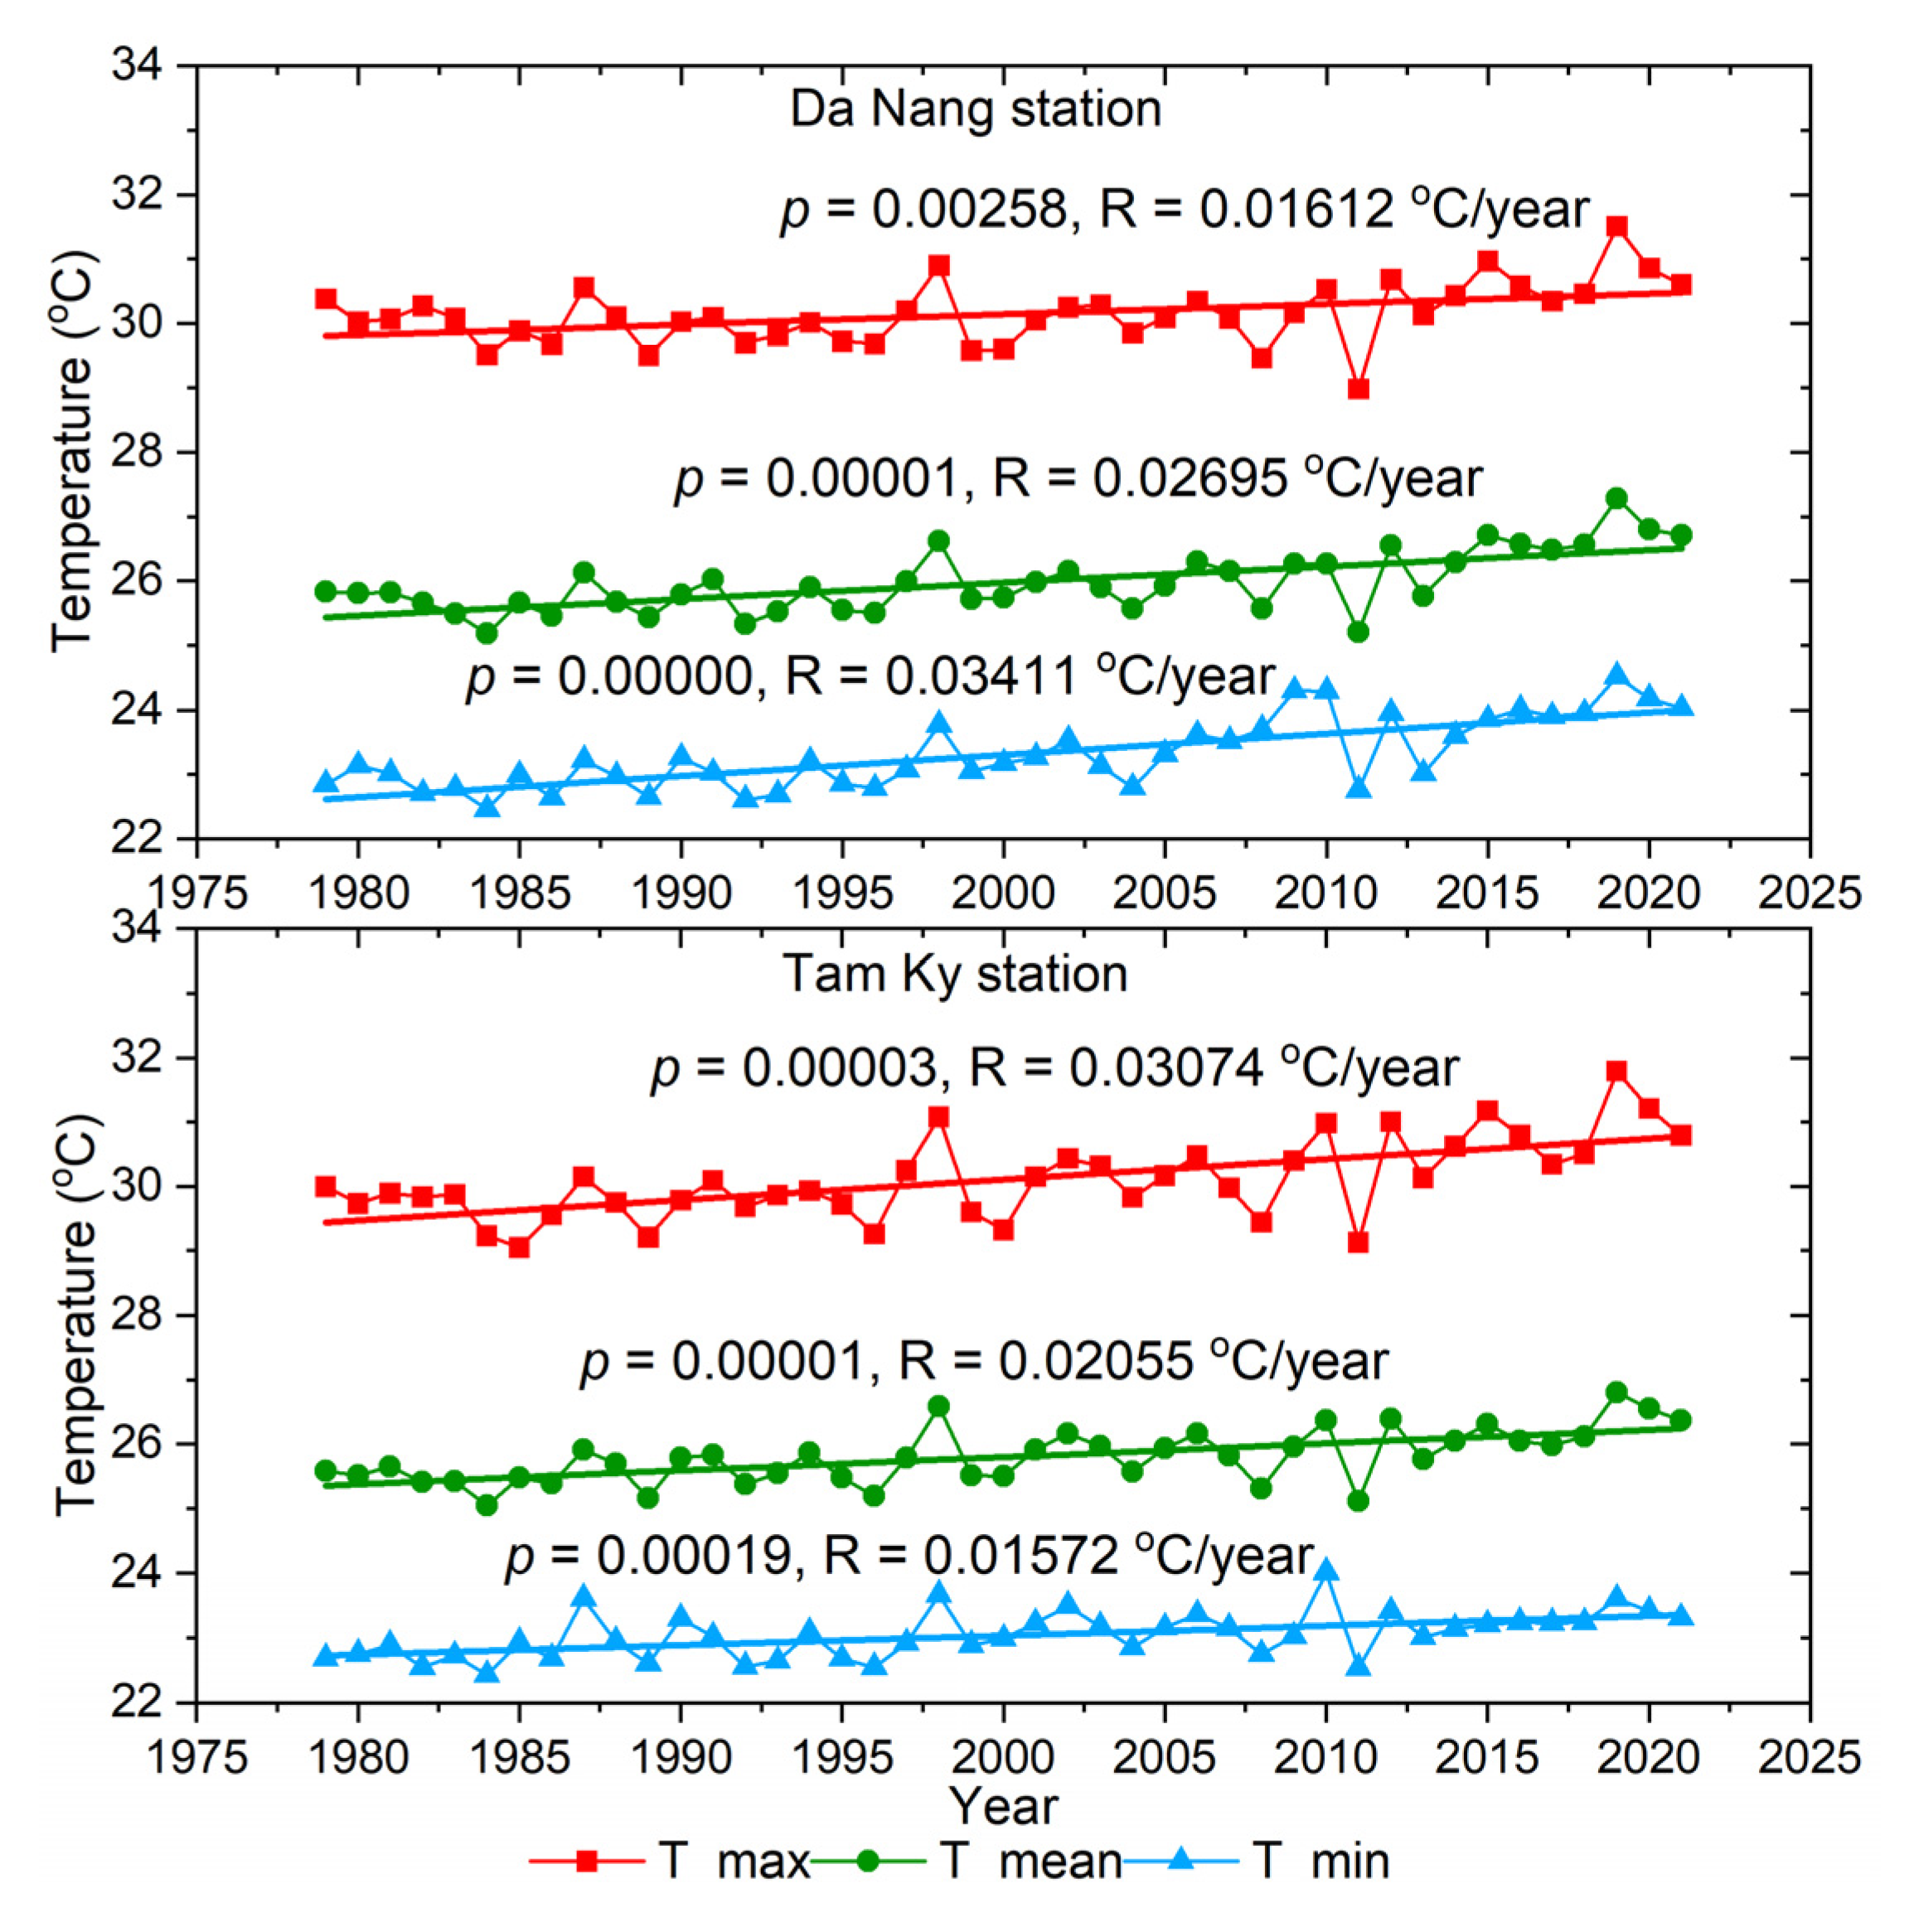
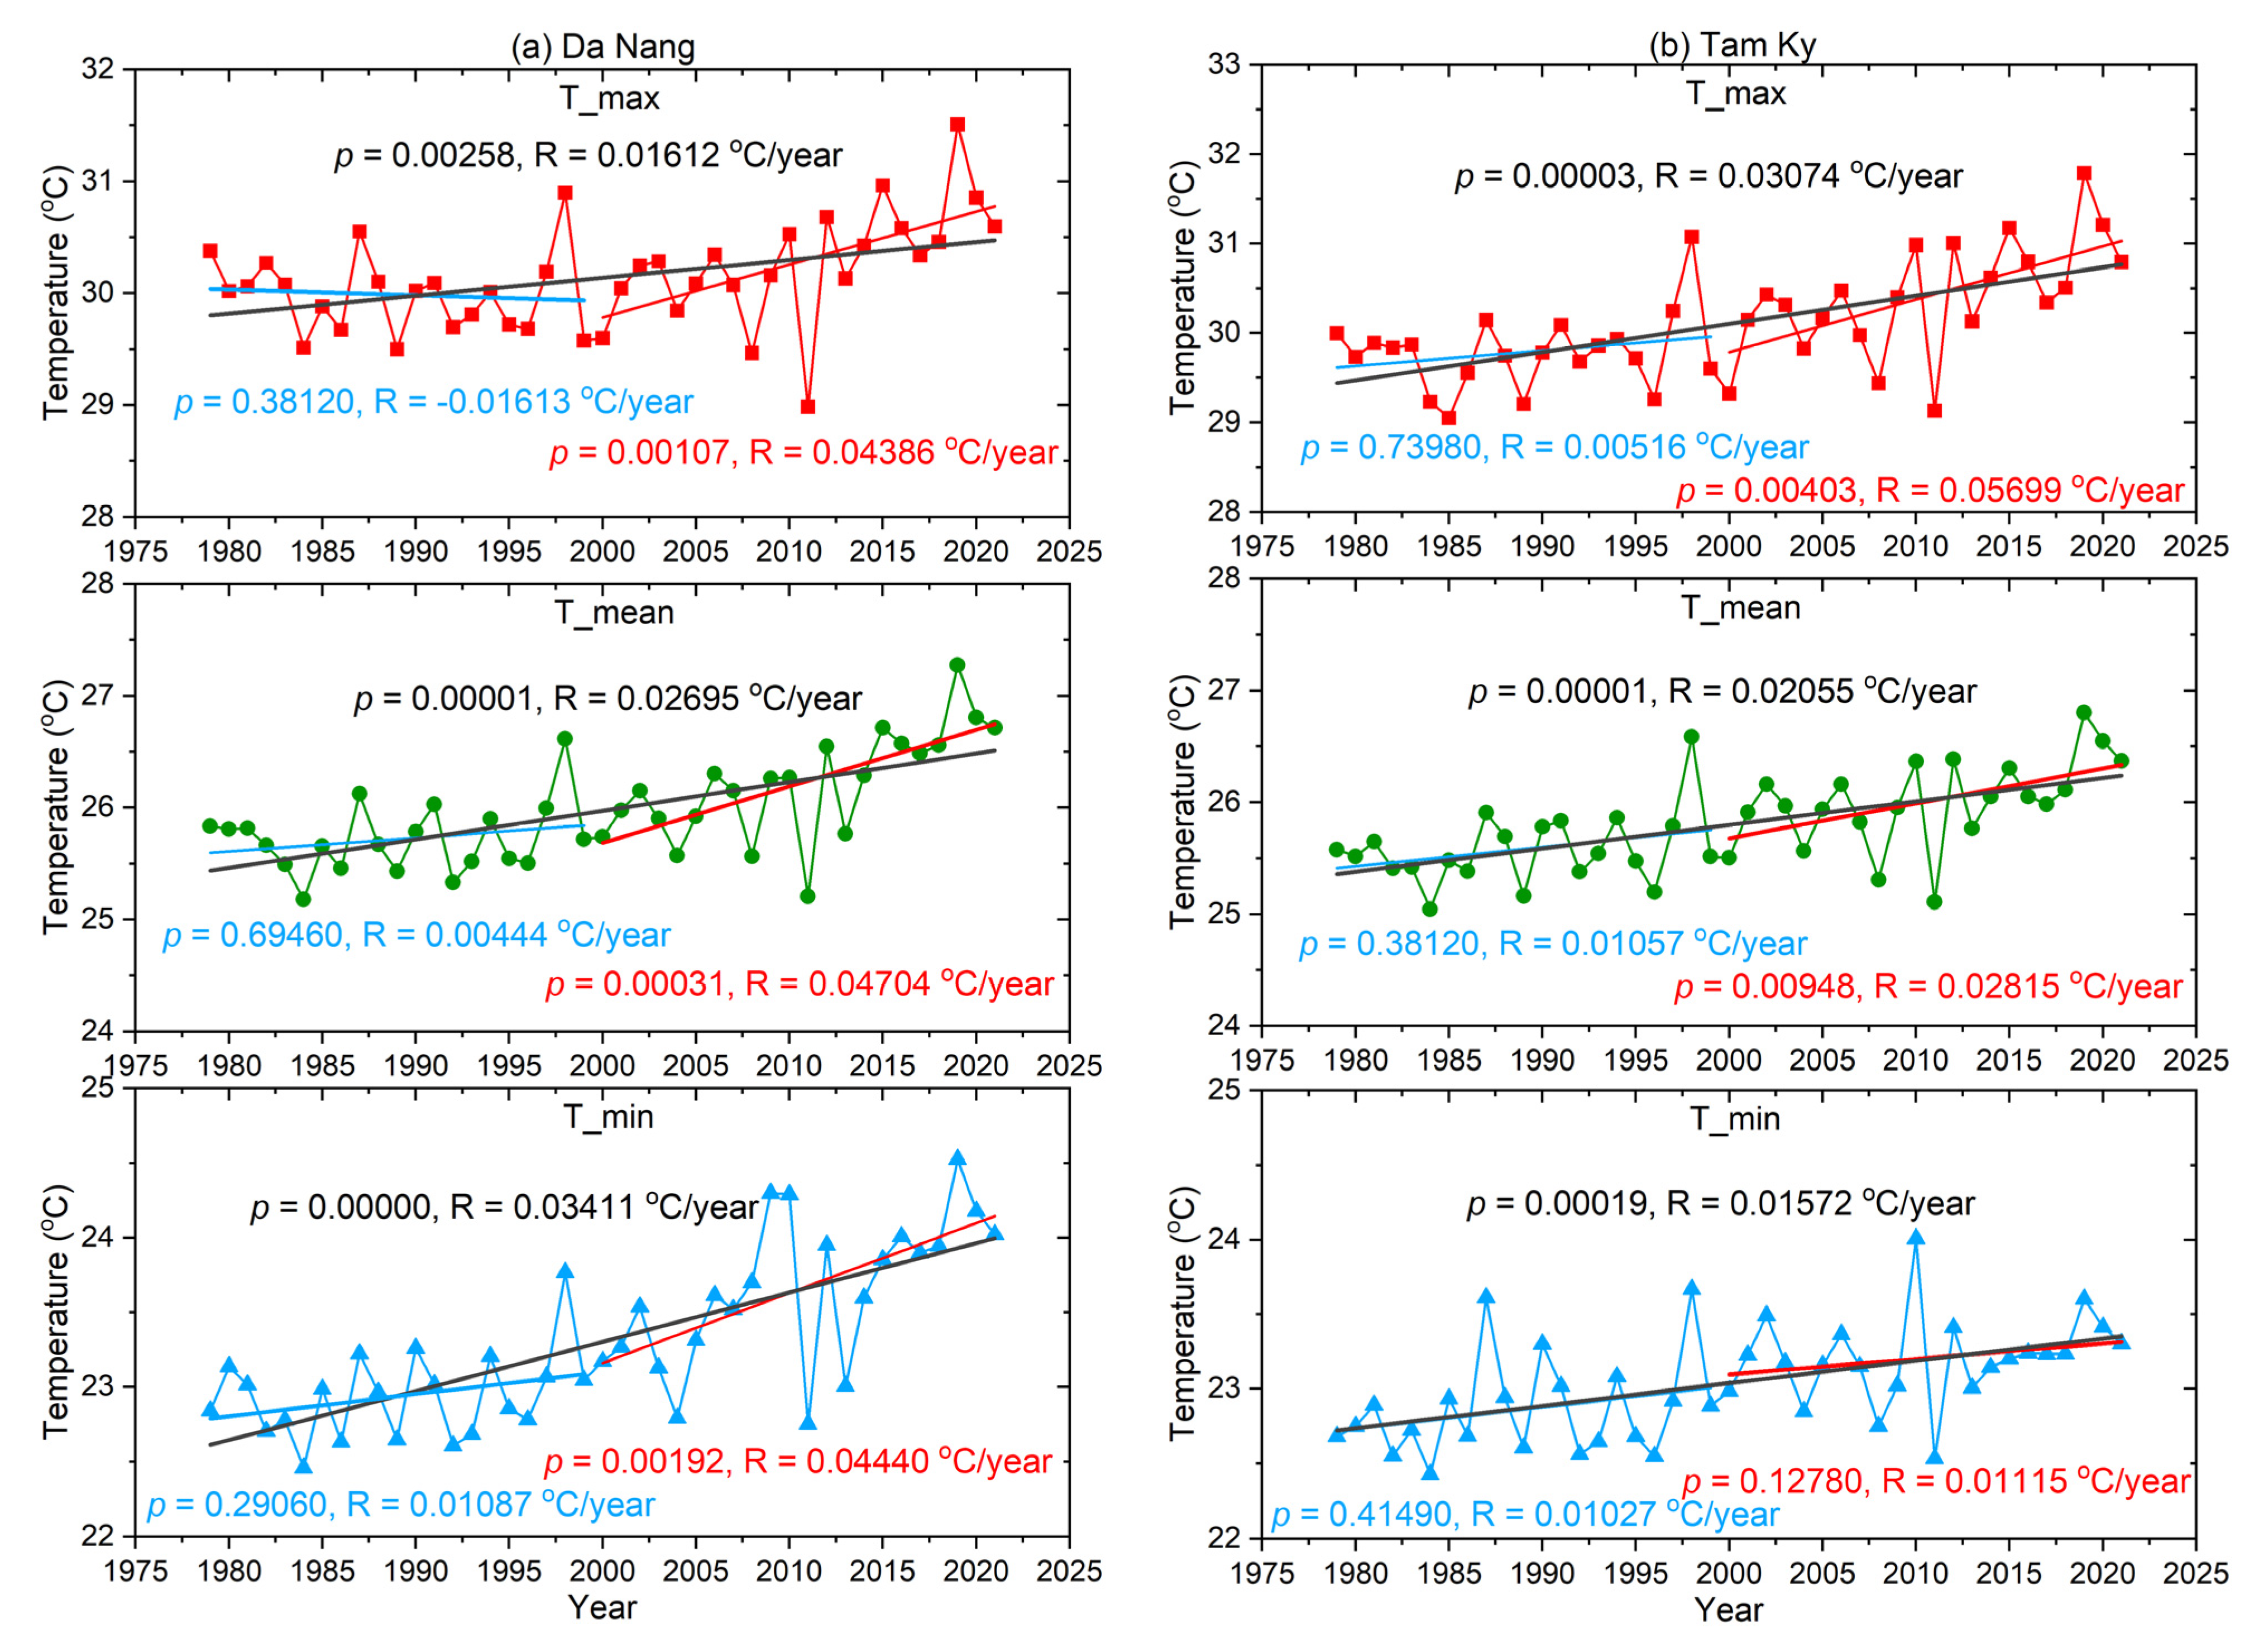
3.2.1. Analysis of Maximum, Minimum, and Mean Temperature
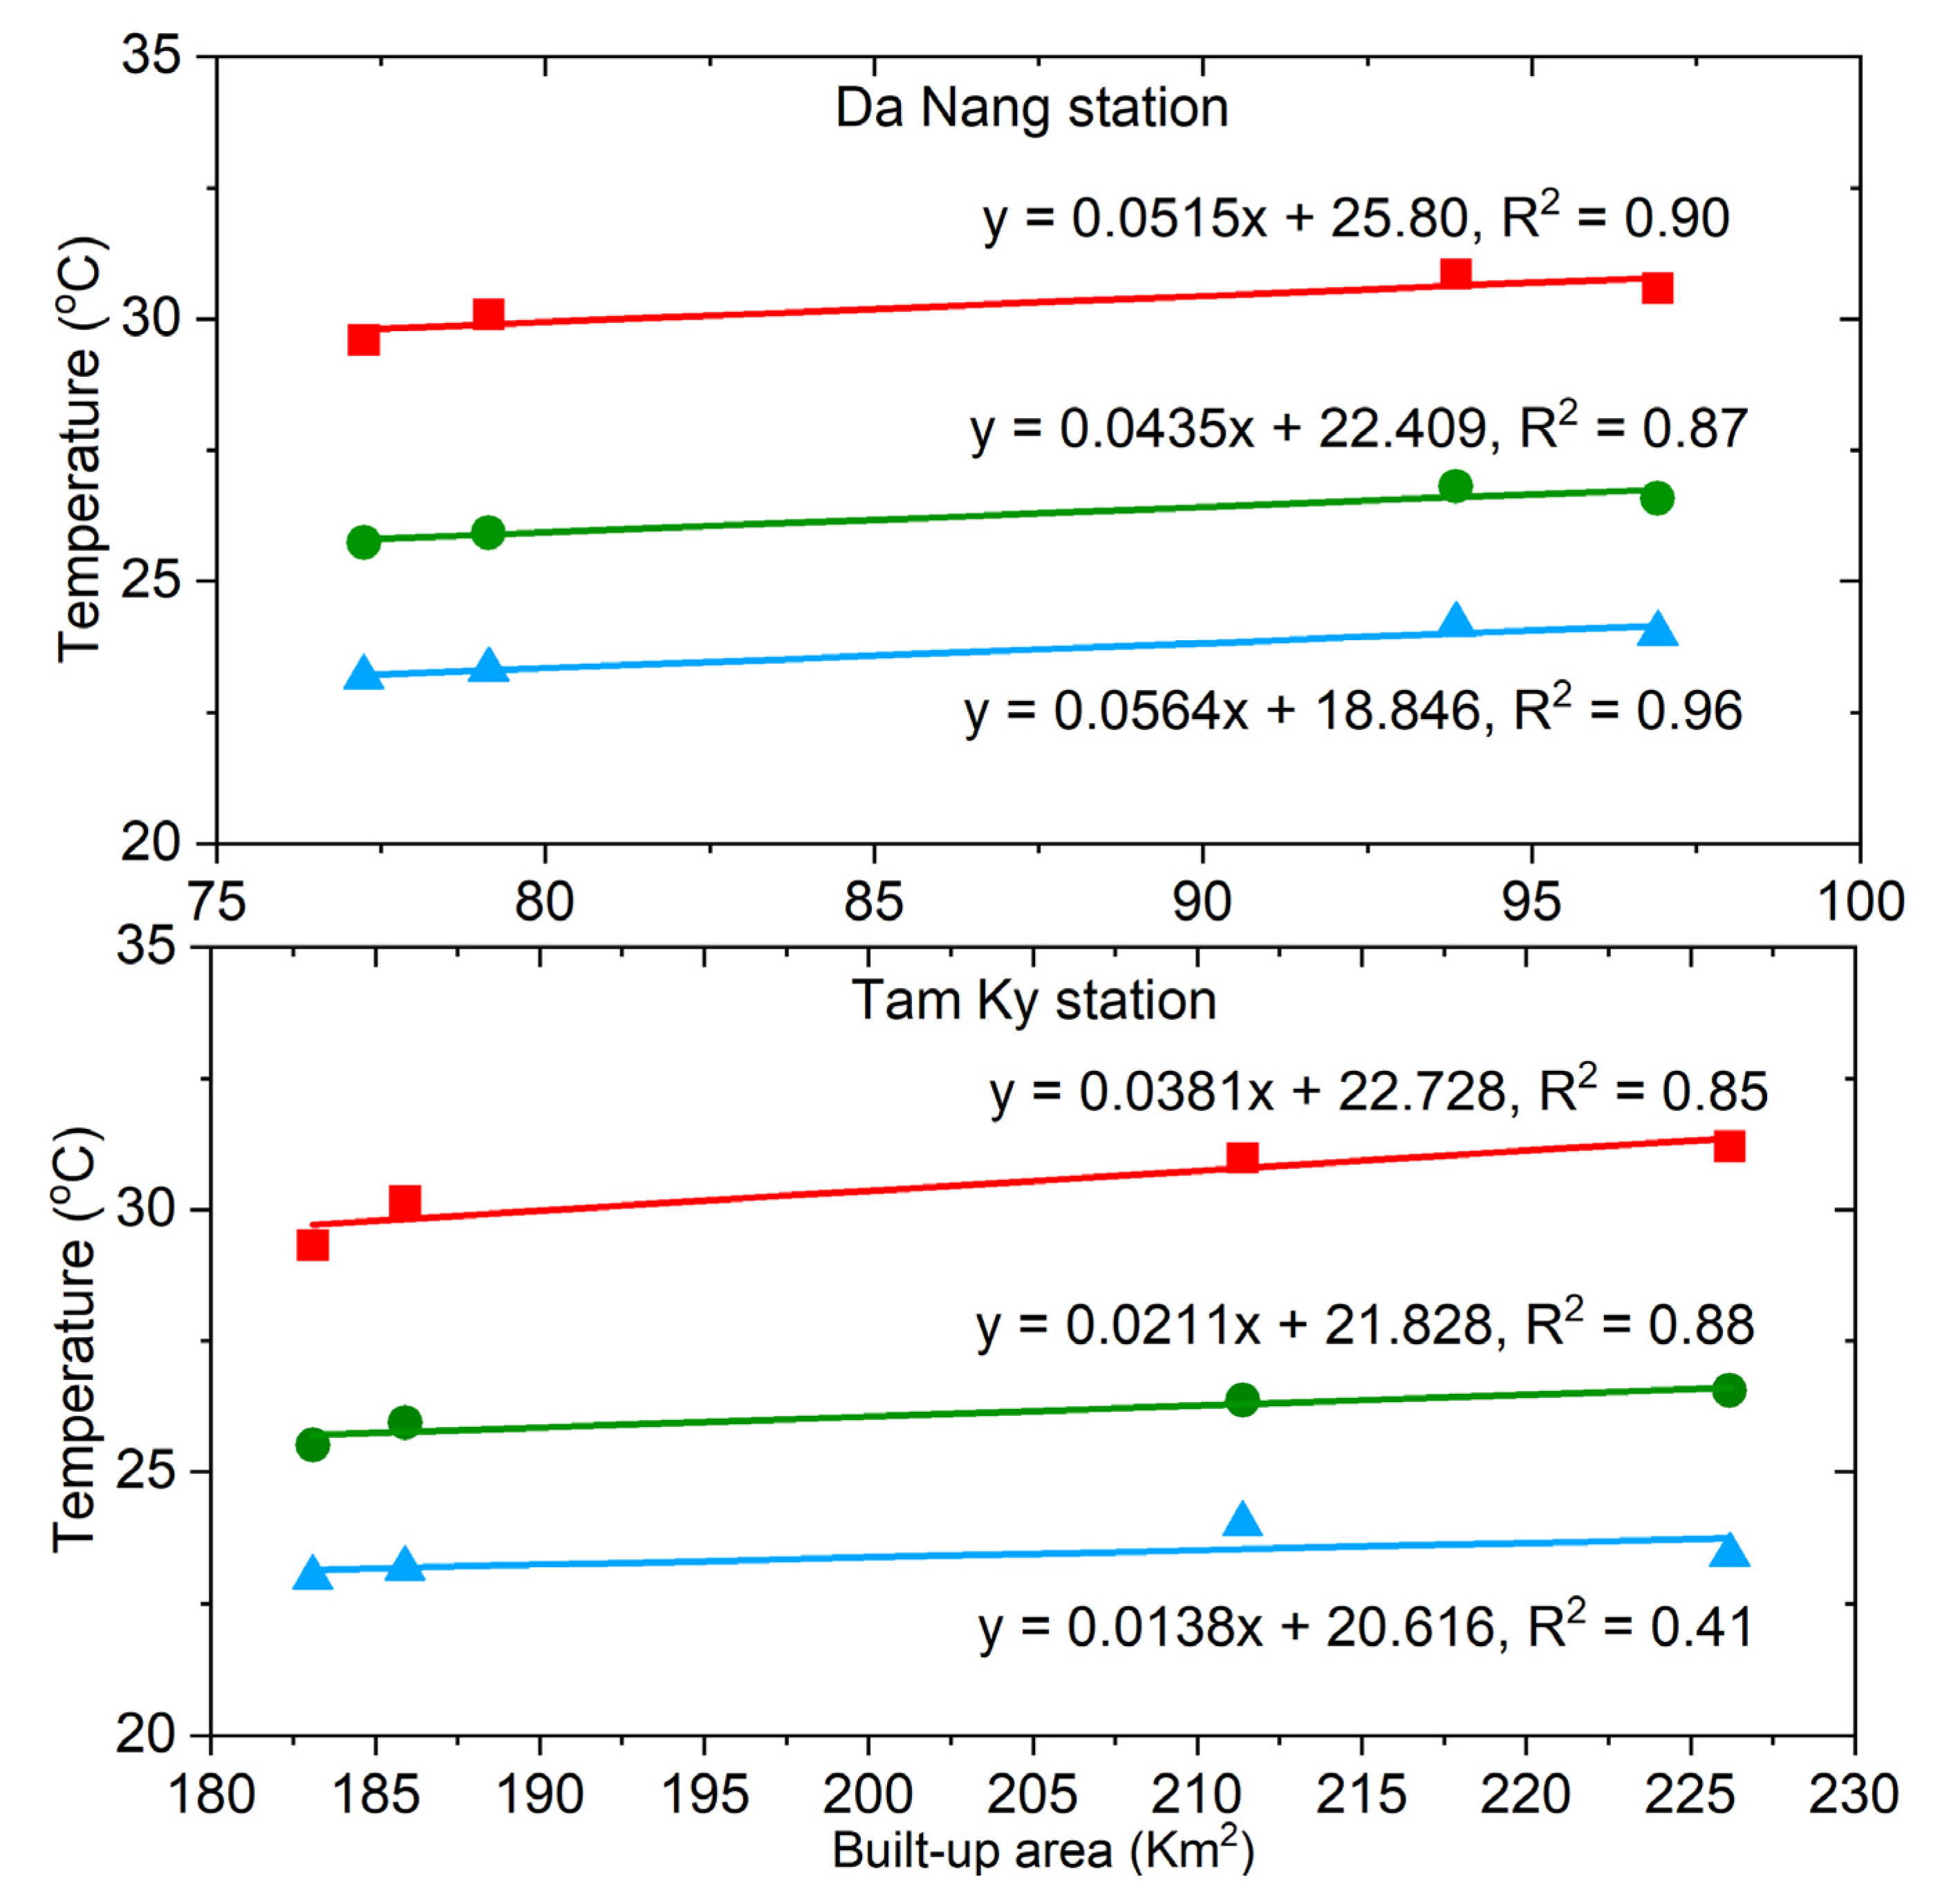
3.2.2. Correlation between Maximum, Minimum, and Mean Temperature and Built-Up Area
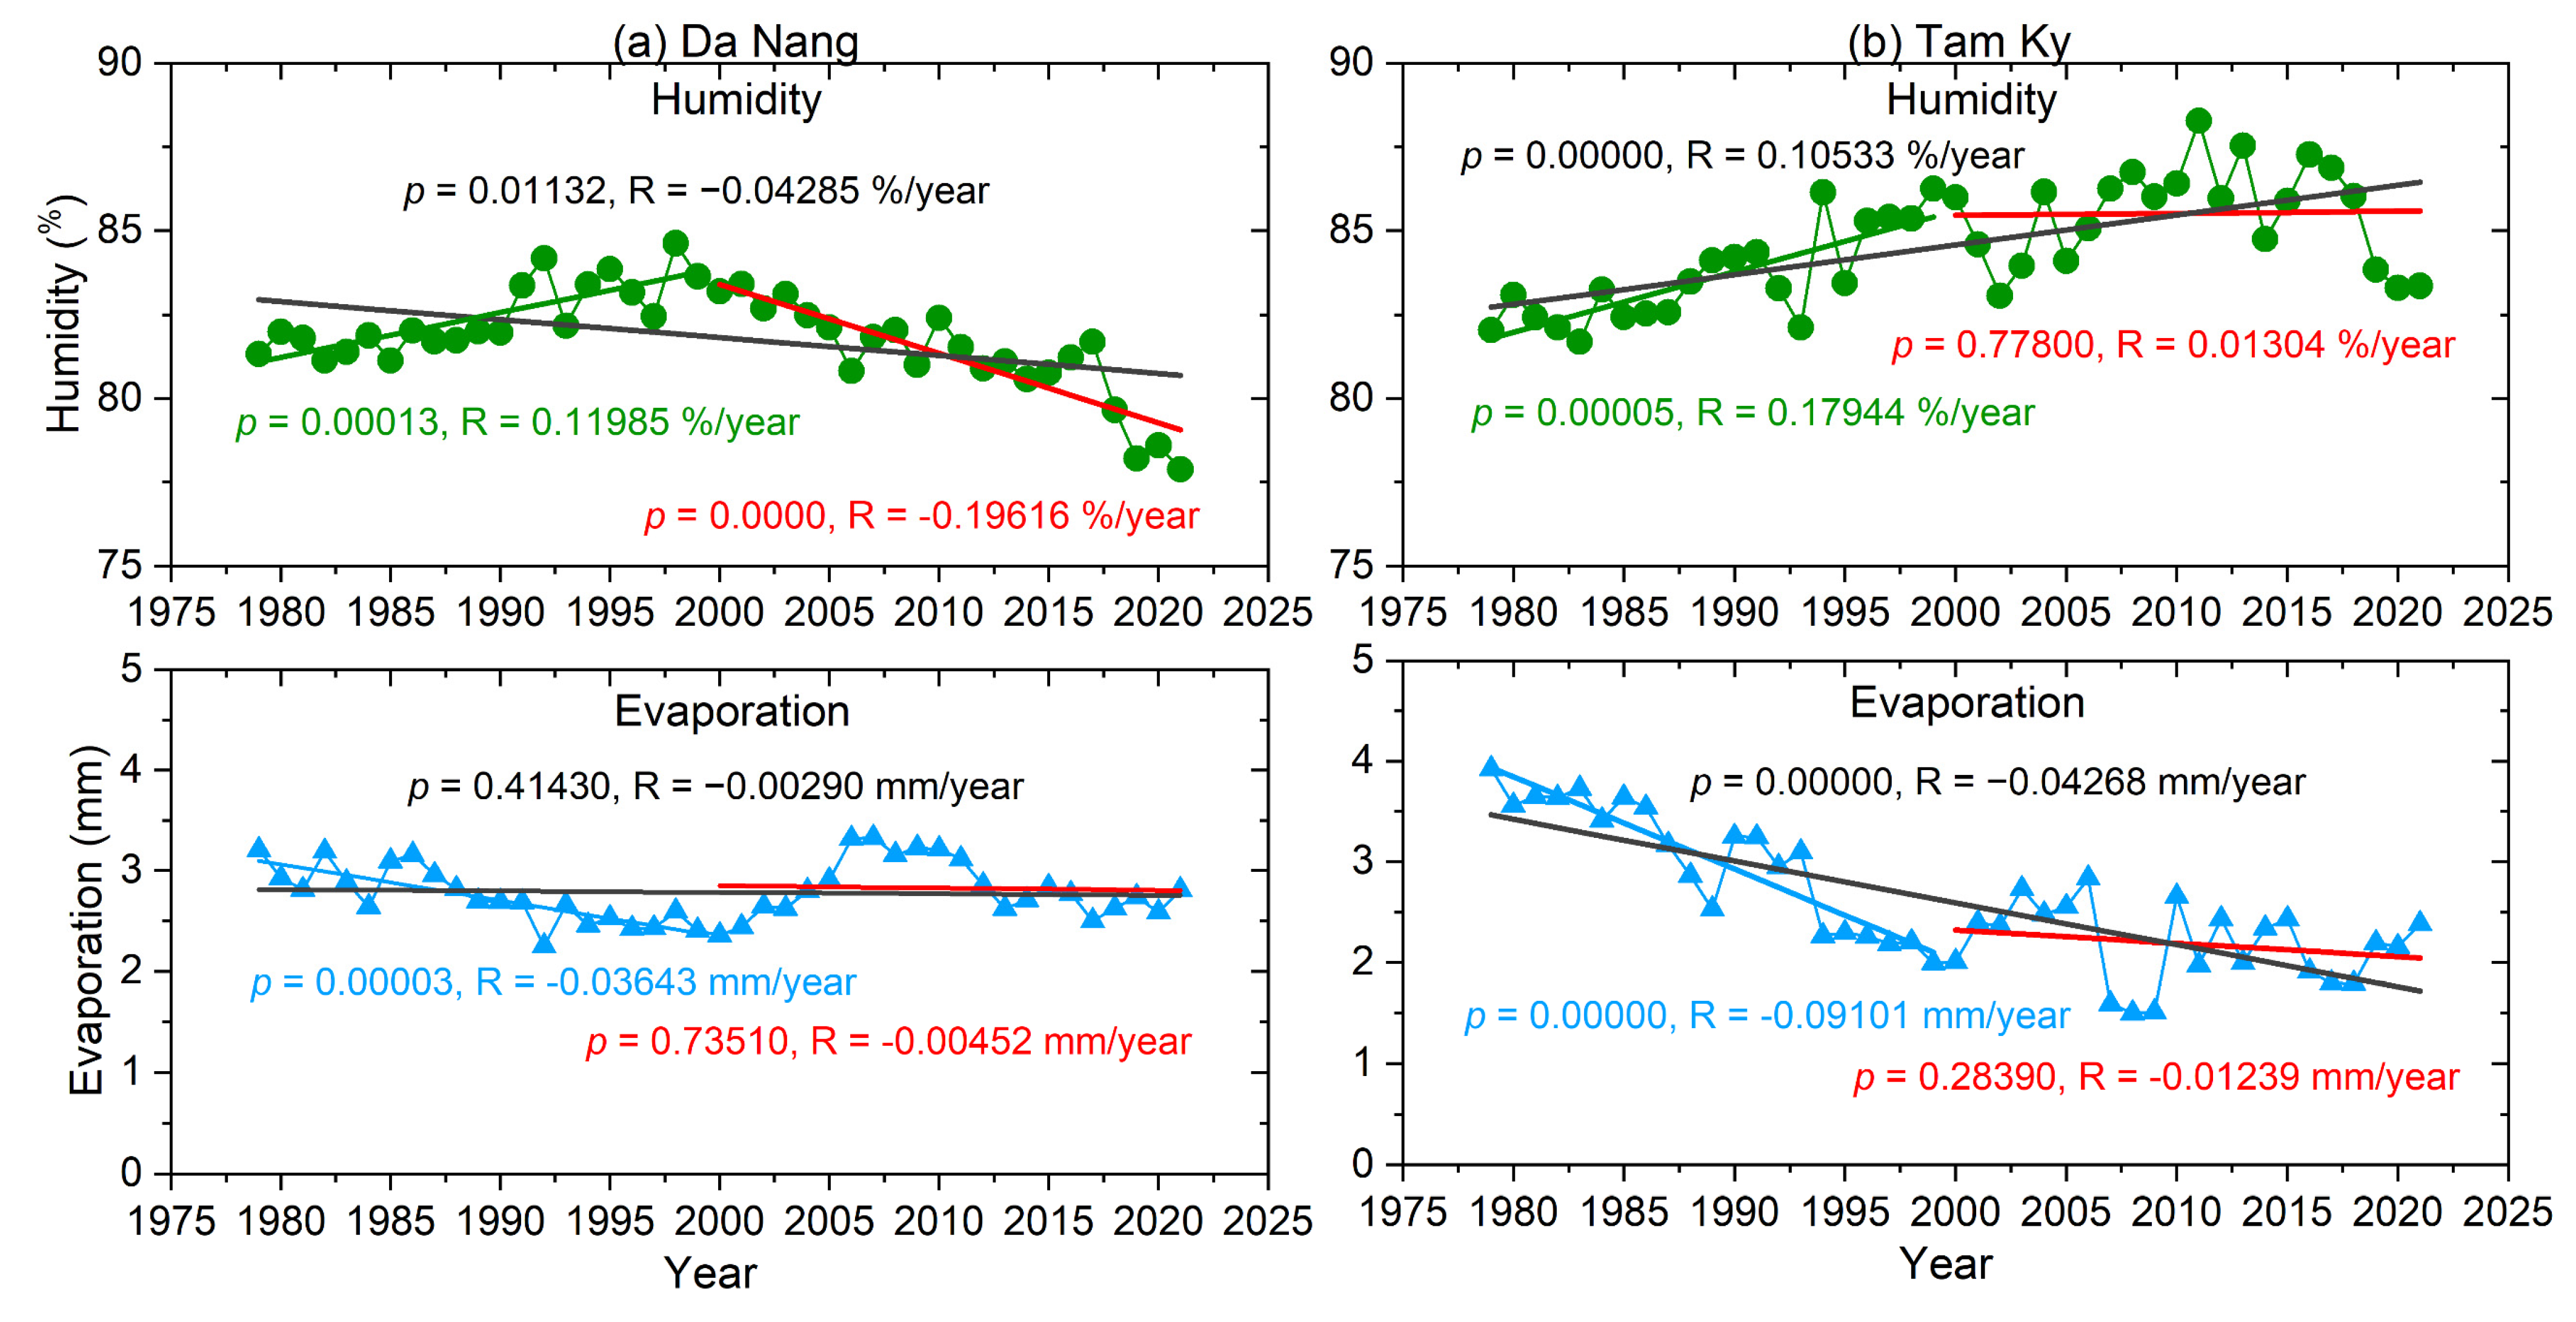
3.2.3. Correlation between Temperature, Relative Humidity, and Evaporation
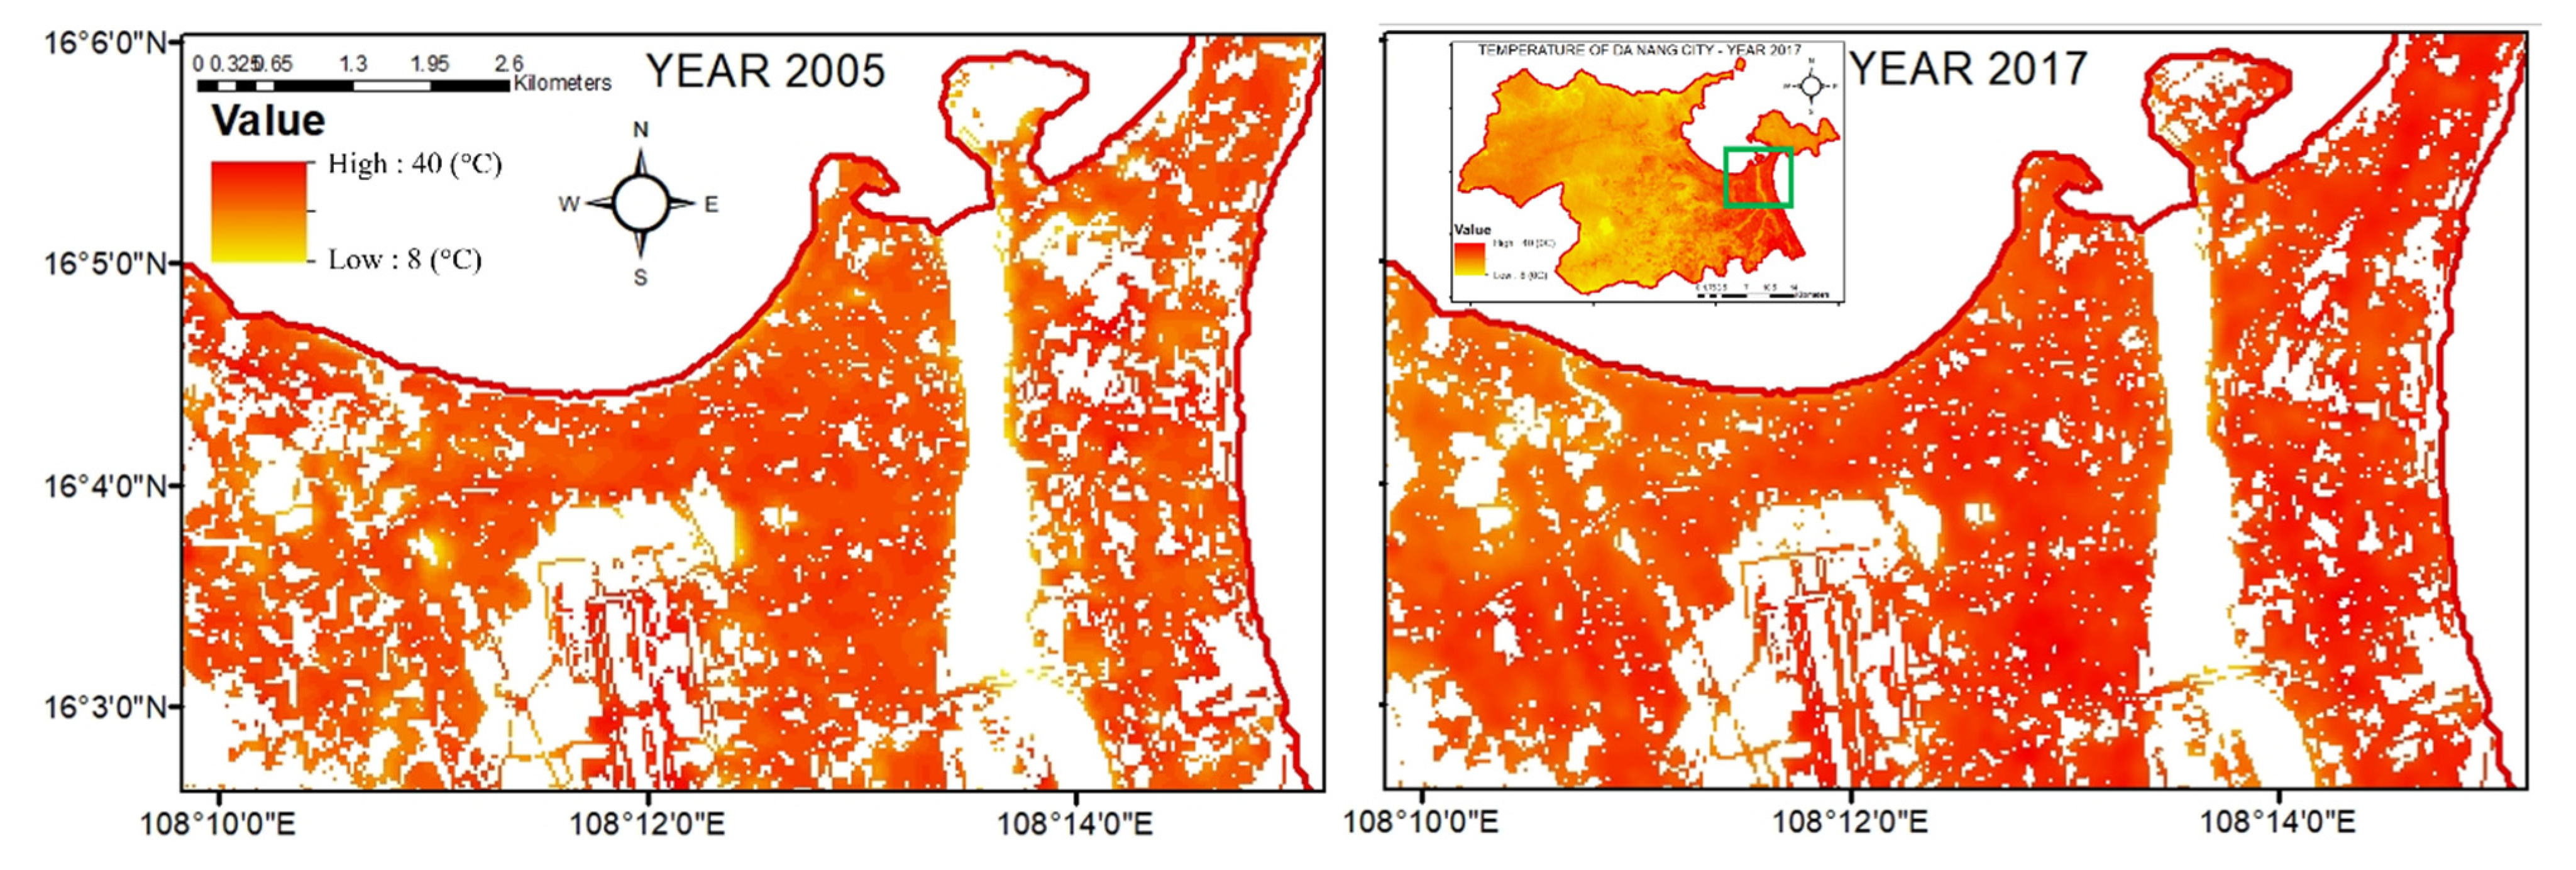
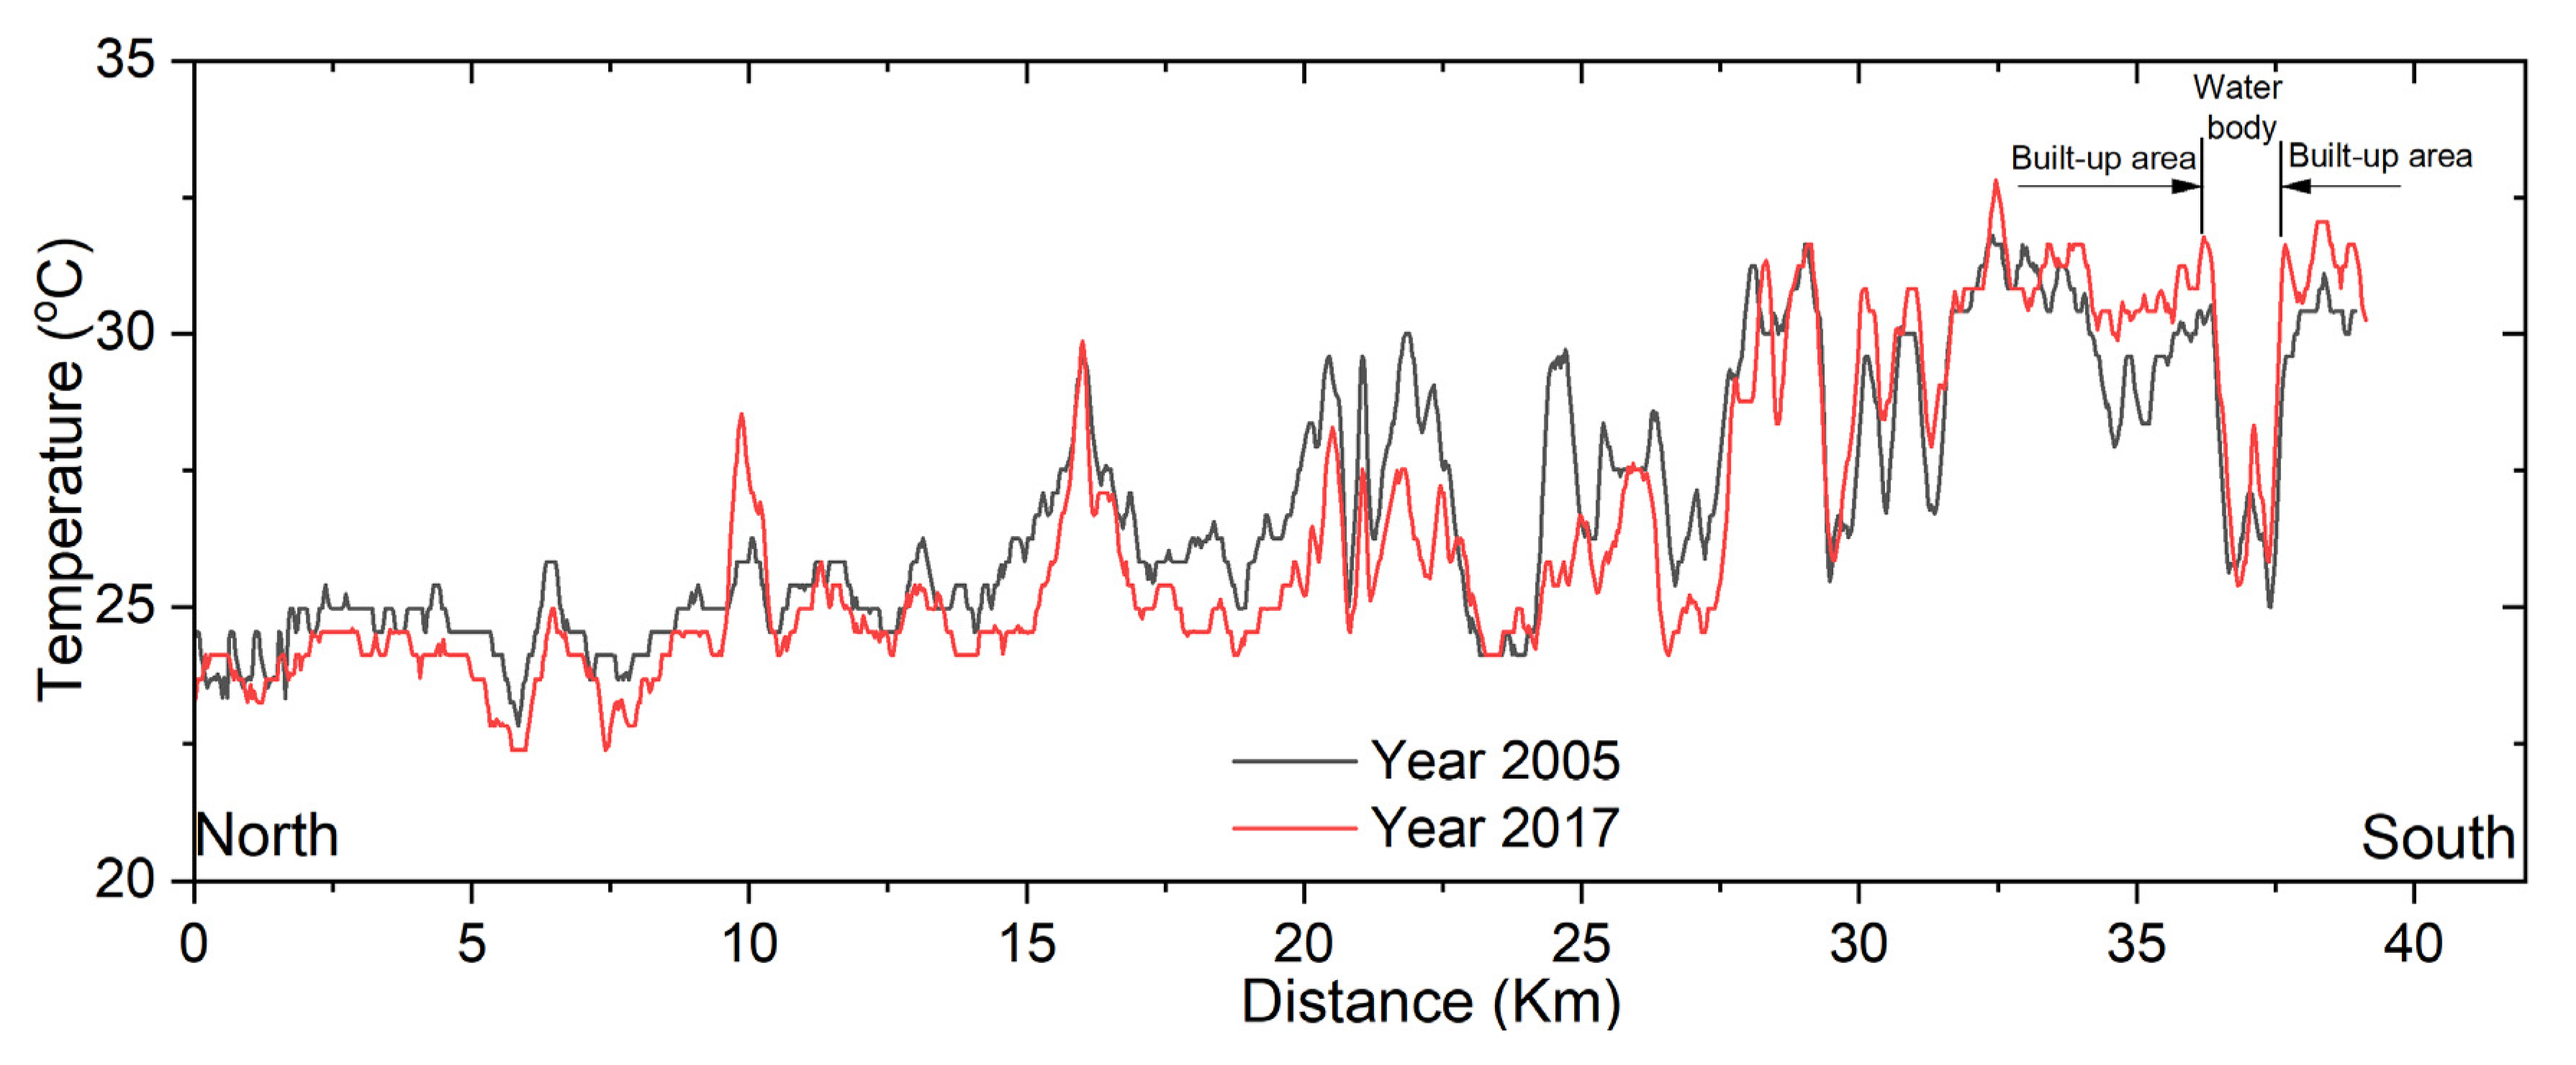
3.3. Spatial Distribution of Temperature
3.4. Limitation of the Study
4. Conclusions
- (1)
- The rapid increase in urbanization resulting from the tourism sector’s development has increased the built-up area by 0.04% from 2.18% (2000) to 2.22% (2005) before increasing 0.34% in 2010 and peaking at 2.73% (2020). Our study showed that temperature has increased in this region with maximum, minimum, and mean temperatures of 29.99 °C, 22.94 °C, and 25.72 °C found between 1979 and 1999, and increased since 2000 by 0.29 °C, 0.71 °C, and 0.50 °C, respectively, in Quang Nam province. Moreover, Da Nang city showed a higher sensitivity in the minimum temperature compared to the Tam Ky station, in which the minimum temperature has increased 0.71 °C between 2000 and 2021, compared to the previous period (1979–1999). Thus, these results indicated a strong correlation between the UHI impacts and the increase in built-up area.
- (2)
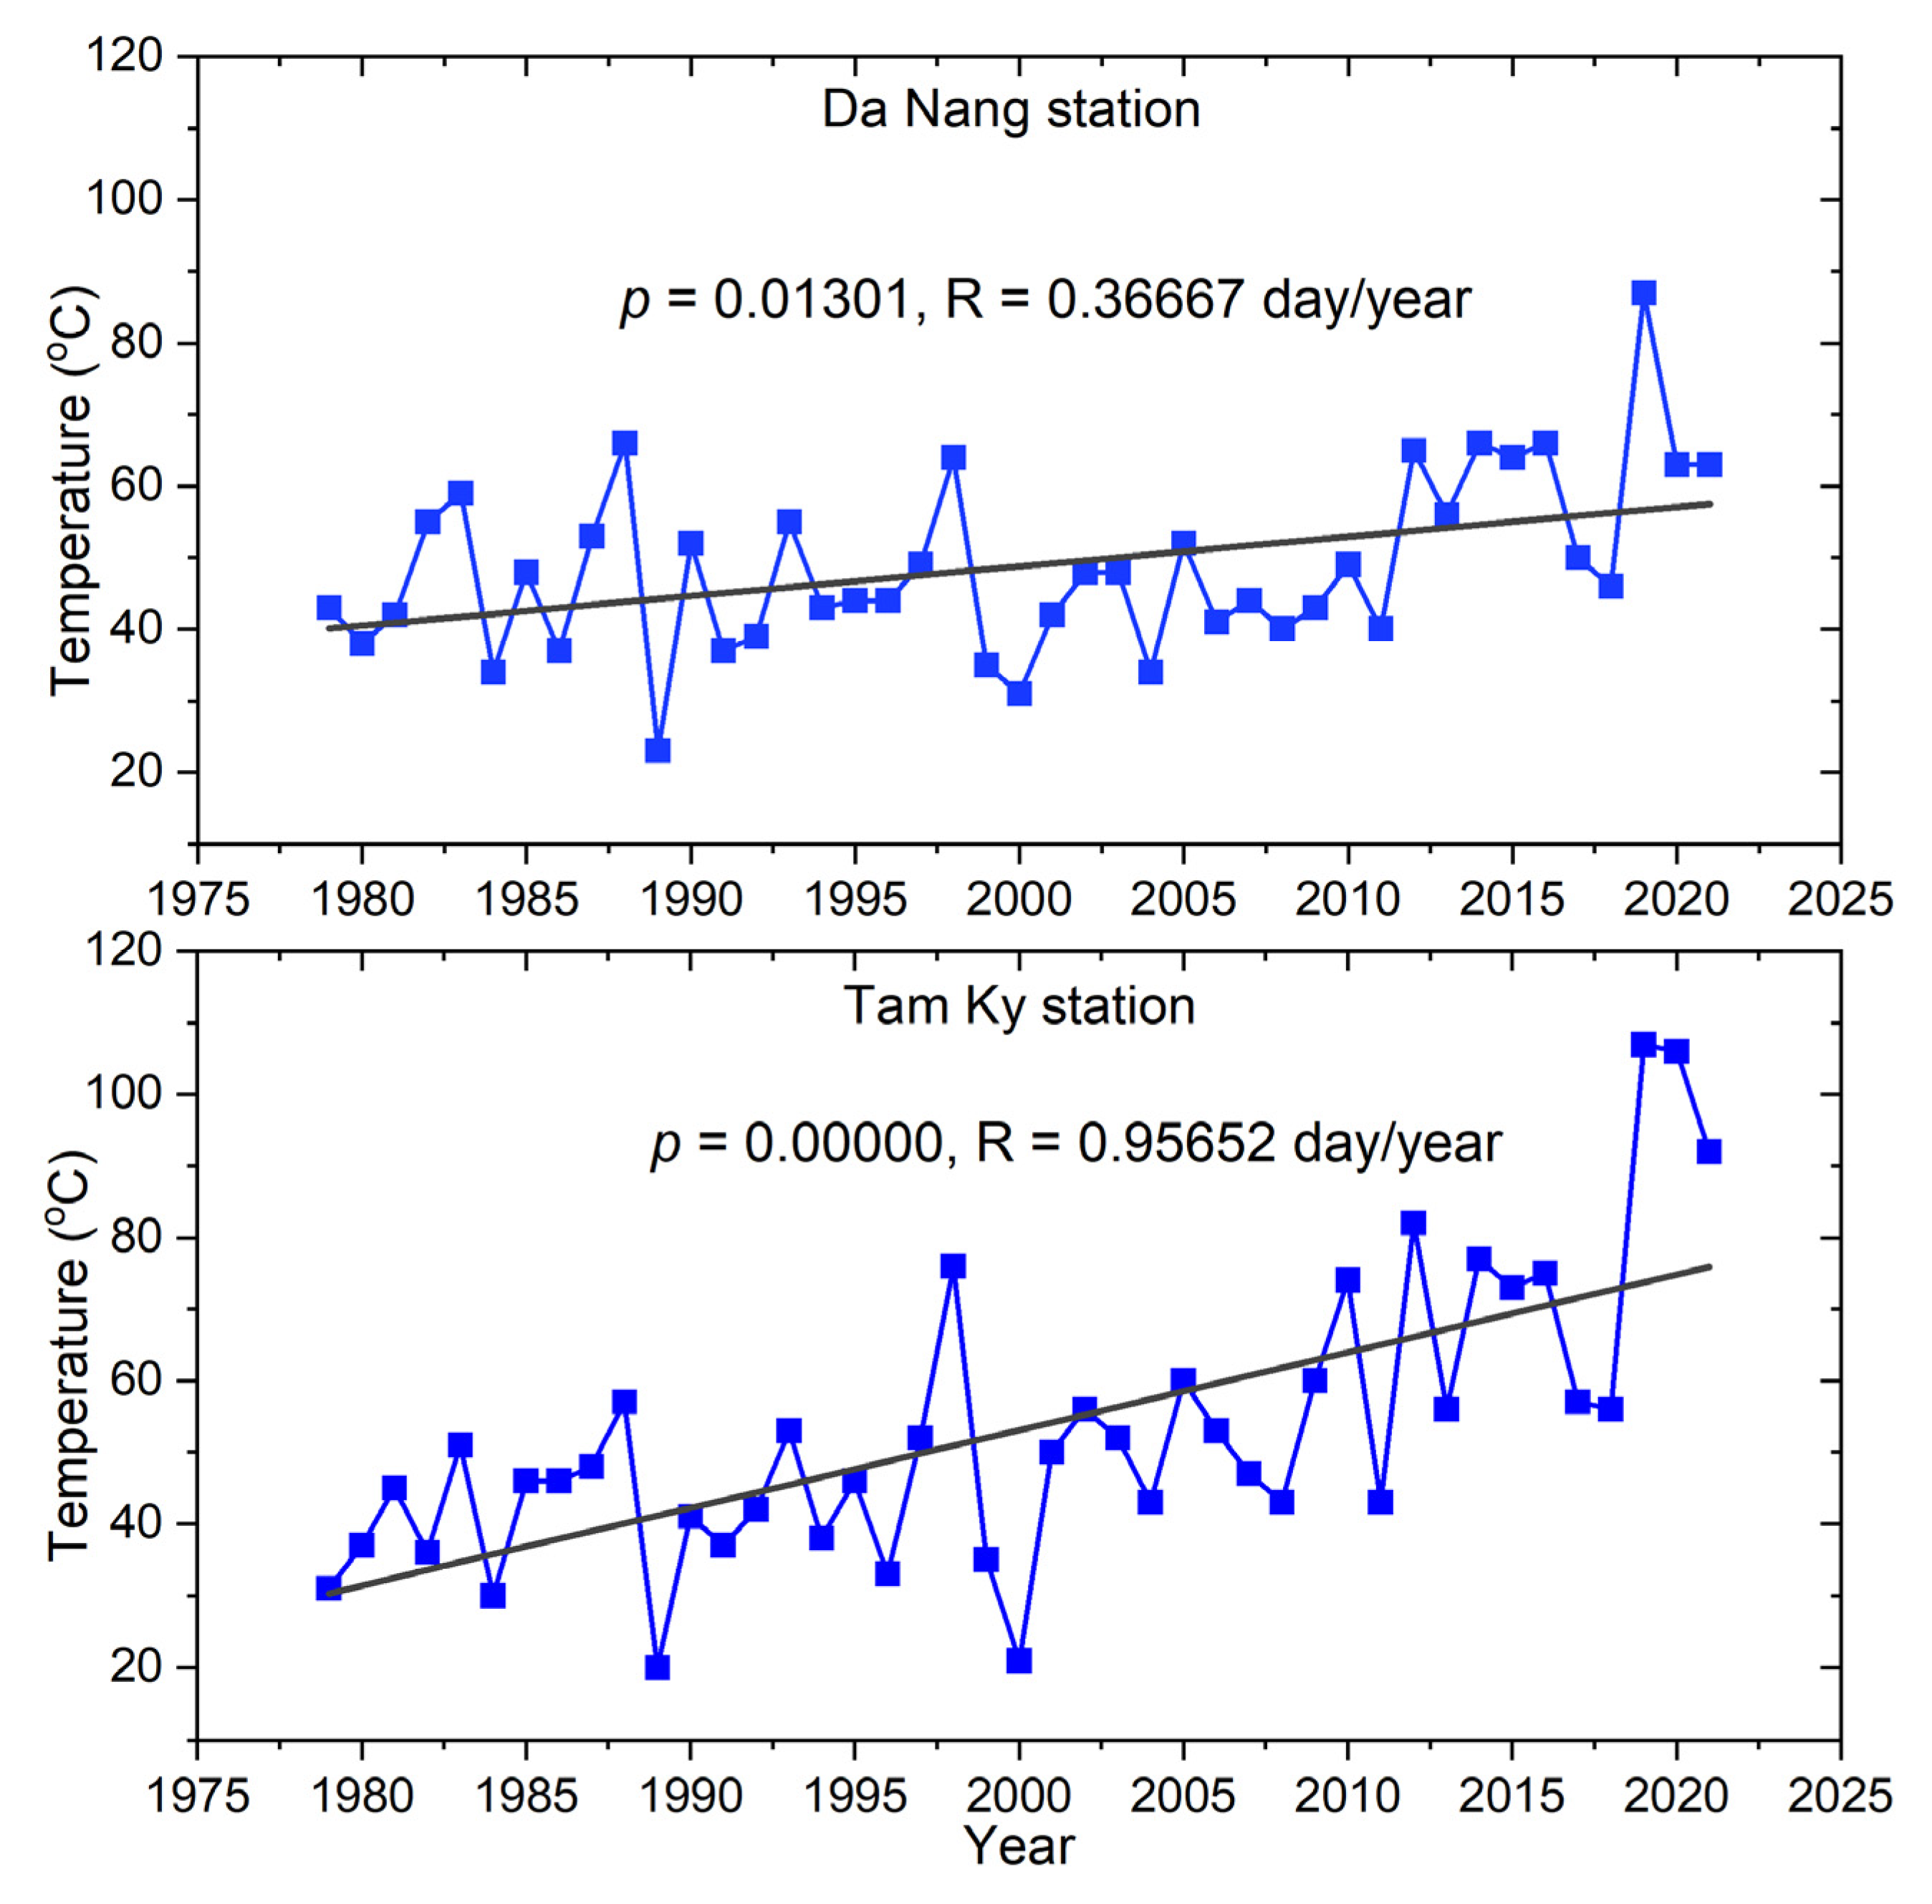
- Between 1979 and 2021, the frequency of days with temperatures exceeding 35 °C has increased, particularly in Quang Nam province. In fact, the number of hot days has increased by two and seven days during the past decade at the meteorological stations in Da Nang and Tam Ky, respectively. The period between 2000 and 2021 also showed a more significant accumulation of hot days than the preceding period (1979–1999). Since 2000, Da Nang city has experienced an increase in the frequency of hot days compared to the previous period (1979–1999).
- (3)
- The results from the Da Nang and Tam Ky meteorological stations indicated interesting results for evaporation, in which main meteorological variables confirmed a consistent trend compared to previous key findings for temperature, evaporation, and relative humidity, whereas Quang Nam province revealed an inconsistent result with the opposite trend in relative humidity, particularly after 2000, marked as the beginning of the province’s urbanization. Nevertheless, they show a consistent trend in relative humidity and evaporation between 2017 and 2021, in which Da Nang city and Quang Nam province experience noticeable increases in evaporation and steady decreases in relative humidity as the result of the summer temperature increase (highest in June and July, lowest in August).
- (4)
- The temperature in Da Nang city varied from 31.80 °C to 32.82 °C over the chosen period, with high temperatures predominantly concentrated in urbanized regions with less coverage of small trees, plants, and water bodies. This finding is consistent with previous studies’ findings, indicating that change of green or water coverage into urban land cover (built-up) would contribute the most to the increase of surface temperature.
Author Contributions
Funding
Data Availability Statement
Acknowledgments
Conflicts of Interest
References
- ESSAP Economic and Social Survey of Asia and the Pacific. Available online: https://www.unescap.org/ (accessed on 2 August 2022).
- UN World Urbanization Prospects; UN: New York, NY, USA, 2014.
- UN Revision of World Urbanization Prospects; UN: New York, NY, USA, 2018.
- UN World Polulation Prospect 2021. 2021. Available online: https://www.un.org/development/desa/pd/sites/www.un.org.development.desa.pd/files/unpd-egm-fer-2020-10-session_ii_b_unpd_2020_wpp2021-adolescentfertility.pdf (accessed on 22 July 2022).
- The World Bank Urban Development. Available online: https://www.worldbank.org/en/topic/urbandevelopment/overview#1 (accessed on 8 December 2022).
- Lo, C.P.; Quattrochi, D.A. Land-use and land-cover change, urban heat island phenomenon, and health implications. Photogramm. Eng. Remote Sens. 2003, 69, 1053–1063. [Google Scholar] [CrossRef]
- Doan, V.Q.; Kusaka, H.; Nguyen, T.M. Roles of Past, Present, and Future Land Use and Anthropogenic Heat Release Changes on Urban Heat Island Effects in Hanoi, Vietnam: Numerical Experiments with a Regional Climate Model. Sustain. Cities Soc. 2019, 47, 101479. [Google Scholar] [CrossRef]
- Srivastava, A.; Kumari, N.; Maza, M. Hydrological Response to Agricultural Land Use Heterogeneity Using Variable Infiltration Capacity Model. Water Resour. Manag. 2020, 34, 3779–3794. [Google Scholar] [CrossRef]
- Maza, M.; Srivastava, A.; Bisht, D.S.; Raghuwanshi, N.S.; Bandyopadhyay, A.; Chatterjee, C.; Bhadra, A. Simulating Hydrological Response of a Monsoon Dominated Reservoir Catchment and Command with Heterogeneous Cropping Pattern Using VIC Model. J. Earth Syst. Sci. 2020, 129. [Google Scholar] [CrossRef]
- GSO. Statistical Yearbook of Vietnam; Statistical Publishing House Hanoi: Ho Chi Minh City, Vietnam, 2019. [Google Scholar]
- UN. World Population Prospects 2022. Available online: https://population.un.org/wpp/ (accessed on 2 August 2022).
- Hansen, J.; Sato, M.; Ruedy, R.; Lo, K.; Lea, D.W.; Medina-Elizade, M. Global Temperature Change. Proc. Natl. Acad. Sci. USA 2006, 103, 14288–14293. [Google Scholar] [CrossRef] [PubMed] [Green Version]
- Son, N.T.; Thanh, B.X. Decadal Assessment of Urban Sprawl and Its Effects on Local Temperature Using Landsat Data in Cantho City, Vietnam. Sustain. Cities Soc. 2018, 36, 81–91. [Google Scholar] [CrossRef]
- NASA. Global Warming; NASA: Washington, DC, USA, 2010. [Google Scholar]
- Change, C. IPCC Publishes Full Report Climate Change 2013: The Physical Science Basis; Cambridge University Press: Cambridge, UK, 2014; pp. 30–32. [Google Scholar]
- Chen, X.L.; Zhao, H.M.; Li, P.X.; Yin, Z.Y. Remote Sensing Image-Based Analysis of the Relationship between Urban Heat Island and Land Use/Cover Changes. Remote Sens. Environ. 2006, 104, 133–146. [Google Scholar] [CrossRef]
- Rinner, C.; Hussain, M. Toronto’s Urban Heat Island-Exploring the Relationship between Land Use and Surface Temperature. Remote Sens. 2011, 3, 1251–1265. [Google Scholar] [CrossRef] [Green Version]
- Tran, D.X.; Pla, F.; Latorre-Carmona, P.; Myint, S.W.; Caetano, M.; Kieu, H.V. Characterizing the Relationship between Land Use Land Cover Change and Land Surface Temperature. ISPRS J. Photogramm. Remote Sens. 2017, 124, 119–132. [Google Scholar] [CrossRef] [Green Version]
- Opitz-Stapleton, S.; Sabbag, L.; Hawley, K.; Tran, P.; Hoang, L.; Nguyen, P.H. Heat Index Trends and Climate Change Implications for Occupational Heat Exposure in Da Nang, Vietnam. Clim. Serv. 2016, 2–3, 41–51. [Google Scholar] [CrossRef]
- Song, J.; Du, S.; Feng, X.; Guo, L. The Relationships between Landscape Compositions and Land Surface Temperature: Quantifying Their Resolution Sensitivity with Spatial Regression Models. Landsc. Urban Plan. 2014, 123, 145–157. [Google Scholar] [CrossRef]
- Grimmond, S. Urbanization and Global Environmental Change: Local Effects of Urban Warming. Geogr. J. 2007, 173, 83–88. [Google Scholar] [CrossRef]
- Kikegawa, Y.; Genchi, Y.; Yoshikado, H.; Kondo, H. Development of a Numerical Simulation System toward Comprehensive Assessments of Urban Warming Countermeasures Including Their Impacts upon the Urban Buildings’ Energy-Demands. Appl. Energy 2003, 76, 449–466. [Google Scholar] [CrossRef]
- Tan, J.; Zheng, Y.; Song, G.; Kalkstein, L.S.; Kalkstein, A.J.; Tang, X. Heat Wave Impacts on Mortality in Shanghai, 1998 and 2003. Int. J. Biometeorol. 2007, 51, 193–200. [Google Scholar] [CrossRef] [PubMed]
- Plocoste, T.; Jacoby-Koaly, S.; Molinié, J.; Petit, R.H. Evidence of the Effect of an Urban Heat Island on Air Quality near a Landfill. Urban Clim. 2014, 10, 745–757. [Google Scholar] [CrossRef]
- Nguyen, T.M.; Lin, T.H.; Chan, H.P. The Environmental Effects of Urban Development in Hanoi, Vietnam from Satellite and Meteorological Observations from 1999-2016. Sustainability 2019, 11, 1768. [Google Scholar] [CrossRef] [Green Version]
- Asgarian, A.; Amiri, B.J.; Sakieh, Y. Assessing the Effect of Green Cover Spatial Patterns on Urban Land Surface Temperature Using Landscape Metrics Approach. Urban Ecosyst. 2015, 18, 209–222. [Google Scholar] [CrossRef]
- Ranagalage, M.; Estoque, R.C.; Murayama, Y. An Urban Heat Island Study of the Colombo Metropolitan Area, Sri Lanka, Based on Landsat Data (1997-2017). ISPRS Int. J. Geo-Inf. 2017, 6, 189. [Google Scholar] [CrossRef] [Green Version]
- Adams, M.P.; Smith, P.L. A Systematic Approach to Model the Influence of the Type and Density of Vegetation Cover on Urban Heat Using Remote Sensing. Landsc. Urban Plan. 2014, 132, 47–54. [Google Scholar] [CrossRef]
- Chun, B.; Guldmann, J.M. Spatial Statistical Analysis and Simulation of the Urban Heat Island in High-Density Central Cities. Landsc. Urban Plan. 2014, 125, 76–88. [Google Scholar] [CrossRef]
- Coseo, P.; Larsen, L. How Factors of Land Use/Land Cover, Building Configuration, and Adjacent Heat Sources and Sinks Explain Urban Heat Islands in Chicago. Landsc. Urban Plan. 2014, 125, 117–129. [Google Scholar] [CrossRef]
- Kourtidis, K.; Georgoulias, A.K.; Rapsomanikis, S.; Amiridis, V.; Keramitsoglou, I.; Hooyberghs, H.; Maiheu, B.; Melas, D. A Study of the Hourly Variability of the Urban Heat Island Effect in the Greater Athens Area during Summer. Sci. Total Environ. 2015, 517, 162–177. [Google Scholar] [CrossRef] [Green Version]
- Li, J.; Song, C.; Cao, L.; Zhu, F.; Meng, X.; Wu, J. Impacts of Landscape Structure on Surface Urban Heat Islands: A Case Study of Shanghai, China. Remote Sens. Environ. 2011, 115, 3249–3263. [Google Scholar] [CrossRef]
- Myint, S.W.; Wentz, E.A.; Brazel, A.J.; Quattrochi, D.A. The Impact of Distinct Anthropogenic and Vegetation Features on Urban Warming. Landsc. Ecol. 2013, 28, 959–978. [Google Scholar] [CrossRef] [Green Version]
- Radhi, H.; Fikry, F.; Sharples, S. Impacts of Urbanisation on the Thermal Behaviour of New Built up Environments: A Scoping Study of the Urban Heat Island in Bahrain. Landsc. Urban Plan. 2013, 113, 47–61. [Google Scholar] [CrossRef]
- Rizwan, A.M.; Dennis, L.Y.C.; Liu, C. A Review on the Generation, Determination and Mitigation of Urban Heat Island. J. Environ. Sci. 2008, 20, 120–128. [Google Scholar] [CrossRef]
- Yuan, F.; Bauer, M.E. Comparison of Impervious Surface Area and Normalized Difference Vegetation Index as Indicators of Surface Urban Heat Island Effects in Landsat Imagery. Remote Sens. Environ. 2007, 106, 375–386. [Google Scholar] [CrossRef]
- Zhou, W.; Qian, Y.; Li, X.; Li, W.; Han, L. Relationships between Land Cover and the Surface Urban Heat Island: Seasonal Variability and Effects of Spatial and Thematic Resolution of Land Cover Data on Predicting Land Surface Temperatures. Landsc. Ecol. 2014, 29, 153–167. [Google Scholar] [CrossRef]
- Kubota, T.; Lee, H.S.; Trihamdani, A.R.; Phuong, T.T.T.; Tanaka, T.; Matsuo, K. Impacts of Land Use Changes from the Hanoi Master Plan 2030 on Urban Heat Islands: Part 1. Cooling Effects of Proposed Green Strategies. Sustain. Cities Soc. 2017, 32, 295–317. [Google Scholar] [CrossRef]
- Lee, H.S.; Trihamdani, A.R.; Kubota, T.; Iizuka, S.; Phuong, T.T.T. Impacts of Land Use Changes from the Hanoi Master Plan 2030 on Urban Heat Islands: Part 2. Influence of Global Warming. Sustain. Cities Soc. 2017, 31, 95–108. [Google Scholar] [CrossRef]
- Tran, T.N.D.; Zeeshan, A.; Vo, N.D. Application of hydrodynamic modelling to assess the efficiency of hurricane protection measure at xom ro dike, phu yen province, vietnam. In Proceedings of the 2nd Conference on Sustainability in Civil Engineering (CSCE) 2020, Islamabad, Pakistan, 12 August 2020; p. 406. [Google Scholar]
- Ercan, M.B.; Maghami, I.; Bowes, B.D.; Morsy, M.M.; Goodall, J.L. Estimating Potential Climate Change Effects on the Upper Neuse Watershed Water Balance Using the SWAT Model. J. Am. Water Resour. Assoc. 2020, 56, 53–67. [Google Scholar] [CrossRef]
- Vo, N.D.; Nguyen, T.H.; Vu, H.C.; Gourbesville, P.; Nguyen, Q.B. Effects of Climate Change on Streamflow in Kon–Ha Thanh River Watershed, Vietnam. EPiC Ser. Eng. 2018, 3, 2224–2233. [Google Scholar] [CrossRef] [Green Version]
- Zotarelli, L.; Dukes, M.D.; Romero, C.C.; Migliaccio, K.W.; Morgan, K.T. Step by Step Calculation of the Penman-Monteith Evapotranspiration (FAO-56 Method); AE459; Institute of Food and Agricultural Sciences, University of Florida: Gainesville, FL, USA, 2014; pp. 1–14. [Google Scholar]
- Nasser, F. Effect of Relative Humidity on Evaporation Rates in Nabatieh Region. Leban. Sci. J. 2018, 19, 59–66. [Google Scholar] [CrossRef]
- Nassif, W.G.; Jasim, F.H.; Al-Taai, O.T. Analysis of Air Temperature, Relative Humidity and Evaporation over Iraq Using ECMWF Reanalysis. Indian J. Ecol. 2021, 48, 446–452. [Google Scholar]
- CCKP. Iraq Climatology-Climate Change Knowledge Portal; CCKP: Los Angeles, CA, USA, 2021. [Google Scholar]
- CCKP. Lebanon Climatology - Climate Change Knowledge Portal; CCKP: Los Angeles, CA, USA, 2021. [Google Scholar]
- Denson, E.; Wasko, C.; Peel, M.C. Decreases in Relative Humidity across Australia. Environ. Res. Lett. 2021, 16, 074023. [Google Scholar] [CrossRef]
- Healey, S.P.; Cohen, W.B.; Yang, Z.; Kenneth Brewer, C.; Brooks, E.B.; Gorelick, N.; Hernandez, A.J.; Huang, C.; Joseph Hughes, M.; Kennedy, R.E.; et al. Mapping Forest Change Using Stacked Generalization: An Ensemble Approach. Remote Sens. Environ. 2018, 204, 717–728. [Google Scholar] [CrossRef]
- CCKP. Australia Climate-Climate Change Knowledge Portal; CCKP: Los Angeles, CA, USA, 2020. [Google Scholar]
- Pham, B.T.; Luu, C.; Van Phong, T.; Nguyen, H.D.; Van Le, H.; Tran, T.Q.; Ta, H.T.; Prakash, I. Flood Risk Assessment Using Hybrid Artificial Intelligence Models Integrated with Multi-Criteria Decision Analysis in Quang Nam Province, Vietnam. J. Hydrol. 2021, 592, 125815. [Google Scholar] [CrossRef]
- Meyfroidt, P.; Vu, T.P.; Hoang, V.A. Trajectories of Deforestation, Coffee Expansion and Displacement of Shifting Cultivation in the Central Highlands of Vietnam. Glob. Environ. Chang. 2013, 23, 1187–1198. [Google Scholar] [CrossRef]
- Vo, N.D.; Nguyen, Q.B.; Gourbesville, P. Semi Distributed Model Application for Evaluating the Impact of Climate Change on Water Resource in Quang Nam-Da Nang Area. EPiC Ser. Eng. 2018, 3, 2205–2216. [Google Scholar] [CrossRef] [Green Version]
- U.S. Geological Survey. Landsat 8 Data Users Handbook. Nasa 2019, 8, 114. [Google Scholar]
- U.S. Geological Survey. Landsat Thematic Mapper (TM) Level 1 (L1) Data Format Control Book (v.3.0); Department of the Interior U.S. Geological Survey: Reston, VA, USA, 2009; Volume 1, p. 113. [Google Scholar]
- Wang, J.; Lu, X.; Zhou, Y. Retrieval of Suspended Sediment Concentrations in the Turbid Water of the Upper Yangtze River Using Landsat ETM+. Chin. Sci. Bull. 2007, 52, 273–280. [Google Scholar] [CrossRef]
- Chavez, P.S. An Improved Dark-Object Subtraction Technique for Atmospheric Scattering Correction of Multispectral Data. Remote Sens. Environ. 1988, 24, 459–479. [Google Scholar] [CrossRef]
- Henry, M. Nonparametric Tests Against Trend. Econometrica 1945, 13, 245–259. [Google Scholar]
- Agarwal, S.; Suchithra, A.S.; Singh, S.P. Analysis and Interpretation of Rainfall Trend Using Mann-Kendall’s and Sen’s Slope Method. Indian J. Ecol. 2021, 48, 453–457. [Google Scholar]
- Atta-ur-Rahman; Dawood, M. Spatio-Statistical Analysis of Temperature Fluctuation Using Mann–Kendall and Sen’s Slope Approach. Clim. Dyn. 2017, 48, 783–797. [Google Scholar] [CrossRef]
- Khalili, K.; Tahoudi, M.N.; Mirabbasi, R.; Ahmadi, F. Investigation of Spatial and Temporal Variability of Precipitation in Iran over the Last Half Century. Stoch. Environ. Res. Risk Assess. 2016, 30, 1205–1221. [Google Scholar] [CrossRef]
- Lacombe, G.; McCartney, M. Uncovering Consistencies in Indian Rainfall Trends Observed over the Last Half Century. Clim. Change 2014, 123, 287–299. [Google Scholar] [CrossRef]
- Mondal, A.; Lakshmi, V.; Hashemi, H. Intercomparison of Trend Analysis of Multisatellite Monthly Precipitation Products and Gauge Measurements for River Basins of India. J. Hydrol. 2018, 565, 779–790. [Google Scholar] [CrossRef]
- Shen, M.; Chen, J.; Zhuan, M.; Chen, H.; Xu, C.Y.; Xiong, L. Estimating Uncertainty and Its Temporal Variation Related to Global Climate Models in Quantifying Climate Change Impacts on Hydrology. J. Hydrol. 2018, 556, 10–24. [Google Scholar] [CrossRef]
- Sen, P.K. Estimates of the Regression Coefficient Based on Kendall’s Tau. J. Am. Stat. Assoc. 1968, 63, 1379–1389. [Google Scholar] [CrossRef]
- Aditya, F.; Gusmayanti, E.; Sudrajat, J. Rainfall Trend Analysis Using Mann-Kendall and Sen’s Slope Estimator Test in West Kalimantan. IOP Conf. Ser. Earth Environ. Sci. 2021, 893, 012006. [Google Scholar] [CrossRef]
- Ali, R.; Rashid Abubaker, S.; Othman Ali, R. Spatio-Temporal Pattern in the Changes in Availability and Sustainability of Water Resources in Afghanistan View Project Water Resources Problem in Huai River Basin View Project Trend Analysis Using Mann-Kendall, Sen’s Slope Estimator Test and Innovative. Int. J. Eng. Technol. 2019, 8, 110–119. [Google Scholar] [CrossRef]
- Gocic, M.; Trajkovic, S. Analysis of Changes in Meteorological Variables Using Mann-Kendall and Sen’s Slope Estimator Statistical Tests in Serbia. Glob. Planet. Chang. 2013, 100, 172–182. [Google Scholar] [CrossRef]
- Robaa, E.S.M.; Al-Barazanji, Z. Mann-Kendall Trend Analysis of Surface Air Temperatures and Rainfall in Iraq. Idojaras 2015, 119, 493–514. [Google Scholar]
- Cong, L.C.; Van Chi, T.T. The Sustainability of Marine Tourism Development in the South Central Coast, Vietnam. Tour. Plan. Dev. 2021, 18, 630–648. [Google Scholar] [CrossRef]
- VNAT Vietnam National Administration of Tourism. 2017. Available online: http://vietnamtourism.gov.vn/english/index.php/items/12422 (accessed on 22 July 2022).
- ESRT European Union-Environmentally and Socially Responsible Tourism. Technical Report: Regional Tourism Product Development. 2015. Available online: http://esrt.vn/data/filedownload/file/FileDownload69.pdf (accessed on 22 July 2022).
- Holladay, P.J.; Dixon, A.W.; Nguyen, M.C.; Nguyen, B.L.; Xu, S.; Price-Howard, K. Stakeholder Perceptions of Da Nang, Vietnam as a Tourism Gateway City. J. Tour. Insights 2020, 10. [Google Scholar] [CrossRef]
- VNAT Quang Nam Promotes Sustainable Tourism Development 2020. Available online: https://vietnamtourism.gov.vn/en/post/14804 (accessed on 22 July 2022).
- Nguyen, X. Da Nang to Receive 5.51 Million Visitors in 2016. 2016. Available online: http://hanoitimes.com.vn/ (accessed on 20 July 2022).
- UNESCO 1999, Hoi An Ancient Town. 1999. Available online: https://whc.unesco.org/en/list/948/ (accessed on 22 July 2022).
- UNESCO 1999, My Son Sanctuary. 1999. Available online: https://whc.unesco.org/en/list/949 (accessed on 22 July 2022).
- Cui, L.; Shi, J. Urbanization and Its Environmental Effects in Shanghai, China. Urban Clim. 2012, 2, 1–15. [Google Scholar] [CrossRef] [Green Version]
- Roderick, T.P.; Wasko, C.; Sharma, A. Atmospheric Moisture Measurements Explain Increases in Tropical Rainfall Extremes. Geophys. Res. Lett. 2019, 46, 1375–1382. [Google Scholar] [CrossRef]
- Stephens, C.M.; McVicar, T.R.; Johnson, F.M.; Marshall, L.A. Revisiting Pan Evaporation Trends in Australia a Decade On. Geophys. Res. Lett. 2018, 45, 11164–11172. [Google Scholar] [CrossRef]


| Station Name | Longitude (E) | Latitude (N) | Elevation (m a.s.l.) |
|---|---|---|---|
| Da Nang | 108°12′ | 16°40′ | 10 |
| Tam Ky | 108°28′ | 15°34′ | 7 |
| Source | Sensor | Cloud Cover (%) | Path/Row | Date | Time Acquired | Cell Size (m) |
|---|---|---|---|---|---|---|
| Landsat 5 | TM | 12 | 125/49 | 20/05/2005 | 02:59:58 | 30 × 30 |
| Landsat 8 | OLI | 2.21 | 124/49 | 01/7/2017 | 03:06:14 | 30 × 30 |
| Da Nang Station | Man-Kendall Test | Sen’s Slope | ||||||
|---|---|---|---|---|---|---|---|---|
| Period | S | Var(S) | z | p | tau | Trend | ||
| Minimum temperature | 1979–2021 | 503 | 9130.333 | 5.25360 | 0.00000 | 0.55703 | + | 0.03411 |
| 1979–1999 | 36 | 1096.667 | 1.05690 | 0.29060 | 0.17143 | + | 0.01087 | |
| 2000–2021 | 111 | 1257.667 | 3.10180 | 0.00192 | 0.48052 | + | 0.04440 | |
| Mean temperature | 1979–2021 | 433 | 9130.333 | 4.52110 | 0.00001 | 0.47951 | + | 0.02695 |
| 1979–1999 | 14 | 1096.667 | 0.39256 | 0.69460 | 0.06667 | + | 0.00444 | |
| 2000–2021 | 129 | 1257.667 | 3.60930 | 0.00031 | 0.55844 | + | 0.04704 | |
| Maximum temperature | 1979–2021 | 289 | 9130.333 | 3.01400 | 0.00258 | 0.32004 | + | 0.01612 |
| 1979–1999 | −30 | 1096.667 | −0.87571 | 0.38120 | −0.14286 | − | −0.01613 | |
| 2000–2021 | 117 | 1257.667 | 3.27100 | 0.00107 | 0.50649 | + | 0.04386 | |
| Relative humidity | 1979–2021 | −243 | 9130.333 | −2.53260 | 0.01132 | −0.26910 | − | −0.04285 |
| 1979–1999 | 128 | 1096.667 | 3.83500 | 0.00013 | 0.60952 | + | 0.11985 | |
| 2000–2021 | −165 | 1257.667 | −4.62450 | 0.00000 | −0.71429 | − | −0.19616 | |
| Evaporation | 1979–2021 | −79 | 9130.333 | −0.81630 | 0.41430 | −0.08749 | − | −0.00290 |
| 1979–1999 | −140 | 1096.667 | −4.19740 | 0.00003 | −0.66667 | − | −0.03643 | |
| 2000–2021 | −13 | 1257.667 | −0.33838 | 0.73510 | −0.05628 | − | −0.00452 | |
| Number of high-temperature | 1979–2021 | 238 | 9106.667 | 2.48350 | 0.01301 | 0.26669 | + | 0.36667 |
| Tam Ky Station | Man-Kendall Test | Sen’s Slope | ||||||
|---|---|---|---|---|---|---|---|---|
| Period | S | Var(S) | z | p | tau | Trend | ||
| Minimum temperature | 1979–2021 | 357 | 9130.333 | 3.72570 | 0.00019 | 0.39535 | + | 0.01572 |
| 1979–1999 | 28 | 1096.667 | 0.81532 | 0.41490 | 0.13333 | + | 0.01027 | |
| 2000–2021 | 55 | 1257.667 | 1.52270 | 0.12780 | 0.23810 | + | 0.01115 | |
| Mean temperature | 1979–2021 | 417 | 9130.333 | 4.35360 | 0.00001 | 0.46179 | + | 0.02055 |
| 1979–1999 | 30 | 1096.667 | 0.87571 | 0.38120 | 0.14286 | + | 0.01057 | |
| 2000–2021 | 93 | 1257.667 | 2.59420 | 0.00948 | 0.40260 | + | 0.02815 | |
| Maximum temperature | 1979–2021 | 403 | 9130.333 | 4.20710 | 0.00003 | 0.44629 | + | 0.03074 |
| 1979–1999 | 12 | 1096.667 | 0.33217 | 0.73980 | 0.05714 | + | 0.00516 | |
| 2000–2021 | 103 | 1257.667 | 2.87620 | 0.00403 | 0.44589 | + | 0.05699 | |
| Relative humidity | 1979–2021 | 441 | 9130.333 | 4.60480 | 0.00000 | 0.48837 | + | 0.10533 |
| 1979–1999 | 136 | 1096.667 | 4.07660 | 0.00005 | 0.64762 | + | 0.17944 | |
| 2000–2021 | 1.1 | 1257.667 | 0.28198 | 0.77800 | 0.04762 | + | 0.01304 | |
| Evaporation | 1979–2021 | −517 | 9130.333 | −5.40020 | 0.00000 | −0.57254 | − | −0.04268 |
| 1979–1999 | −166 | 1096.667 | −4.98250 | 0.00000 | −0.79048 | − | −0.09101 | |
| 2000–2021 | −39 | 1257.667 | −1.07150 | 0.28390 | −0.16883 | − | −0.01239 | |
| Number of high-temperature | 1979–2021 | 457 | 9114.333 | 4.77640 | 0.00000 | 0.51006 | + | 0.95652 |
| Station | Maximum Temperature (°C) | Mean Temperature (°C) | Minimum Temperature (°C) | ||||||
|---|---|---|---|---|---|---|---|---|---|
| 1979–2021 | 1979–1999 | 2000–2021 | 1979–2021 | 1979–1999 | 2000–2021 | 1979–2021 | 1979–1999 | 2000–2021 | |
| Da Nang | 30.14 | 29.99 | 30.28 | 25.97 | 25.72 | 26.22 | 23.30 | 22.94 | 23.65 |
| Tam Ky | 30.11 | 29.79 | 30.41 | 25.80 | 25.58 | 26.01 | 23.04 | 22.86 | 23.21 |
| Temperature increase compared to the 2000–2021 period (°C) | |||||||||
| Da Nang | 0.14 | 0.29 | 0.25 | 0.50 | 0.35 | 0.71 | |||
| Tam Ky | 0.30 | 0.62 | 0.21 | 0.43 | 0.17 | 0.35 | |||
| Season | Max Temperature (°C) | Mean Temperature (°C) | Min Temperature (°C) | ||||||
|---|---|---|---|---|---|---|---|---|---|
| 1979–2021 | 1979–1999 | 2000–2021 | 1979–2021 | 1979–1999 | 2000–2021 | 1979–2021 | 1979–1999 | 2000–2021 | |
| Spring | 28.66 | 28.74 | 28.59 | 24.49 | 24.32 | 24.66 | 22.10 | 21.82 | 22.37 |
| Summer | 34.13 | 33.88 | 34.37 | 29.07 | 28.75 | 29.37 | 25.77 | 25.32 | 26.21 |
| Autumn | 31.83 | 31.64 | 32.01 | 27.56 | 27.35 | 27.76 | 24.68 | 24.37 | 24.97 |
| Winter | 25.89 | 25.66 | 26.11 | 22.73 | 22.41 | 23.03 | 20.63 | 20.21 | 21.03 |
| Temperature difference compared to the 2000–2021 period (°C) (−) indicates lower, (+) indicate higher | |||||||||
| Spring | +0.07 | +0.15 | −0.17 | −0.34 | −0.27 | −0.55 | |||
| Summer | −0.24 | −0.49 | −0.30 | −0.62 | −0.44 | −0.89 | |||
| Autumn | −0.18 | −0.37 | −0.20 | −0.41 | −0.29 | −0.60 | |||
| Winter | −0.22 | −0.45 | −0.30 | −0.62 | −0.40 | −0.82 | |||
| Season | Max Temperature (°C) | Mean Temperature (°C) | Min Temperature (°C) | ||||||
|---|---|---|---|---|---|---|---|---|---|
| 1979–2021 | 1979–1999 | 2000–2021 | 1979–2021 | 1979–1999 | 2000–2021 | 1979–2021 | 1979–1999 | 2000–2021 | |
| Spring | 29.11 | 28.91 | 29.29 | 24.62 | 24.48 | 24.75 | 21.92 | 21.87 | 21.97 |
| Summer | 34.23 | 33.73 | 34.69 | 28.85 | 28.53 | 29.15 | 25.32 | 25.13 | 25.50 |
| Autumn | 31.59 | 31.28 | 31.87 | 27.22 | 27.07 | 27.35 | 24.37 | 24.24 | 24.49 |
| Winter | 25.47 | 25.16 | 25.76 | 22.49 | 22.21 | 22.75 | 20.54 | 20.22 | 20.82 |
| Temperature difference compared to 2000–2021 period (°C) (−) indicates lower, (+) indicate higher | |||||||||
| Spring | −0.18 | −0.38 | −0.13 | −0.27 | −0.05 | −0.10 | |||
| Summer | −0.46 | −0.96 | −0.30 | −0.62 | −0.18 | −0.37 | |||
| Autumn | −0.28 | −0.59 | −0.13 | −0.28 | −0.12 | −0.25 | |||
| Winter | −0.29 | −0.60 | −0.26 | −0.54 | −0.28 | −0.60 | |||
Publisher’s Note: MDPI stays neutral with regard to jurisdictional claims in published maps and institutional affiliations. |
© 2022 by the authors. Licensee MDPI, Basel, Switzerland. This article is an open access article distributed under the terms and conditions of the Creative Commons Attribution (CC BY) license (https://creativecommons.org/licenses/by/4.0/).
Share and Cite
Nguyen, B.Q.; Tran, T.-N.-D.; Grodzka-Łukaszewska, M.; Sinicyn, G.; Lakshmi, V. Assessment of Urbanization-Induced Land-Use Change and Its Impact on Temperature, Evaporation, and Humidity in Central Vietnam. Water 2022, 14, 3367. https://doi.org/10.3390/w14213367
Nguyen BQ, Tran T-N-D, Grodzka-Łukaszewska M, Sinicyn G, Lakshmi V. Assessment of Urbanization-Induced Land-Use Change and Its Impact on Temperature, Evaporation, and Humidity in Central Vietnam. Water. 2022; 14(21):3367. https://doi.org/10.3390/w14213367
Chicago/Turabian StyleNguyen, Binh Quang, Thanh-Nhan-Duc Tran, Maria Grodzka-Łukaszewska, Grzegorz Sinicyn, and Venkataraman Lakshmi. 2022. "Assessment of Urbanization-Induced Land-Use Change and Its Impact on Temperature, Evaporation, and Humidity in Central Vietnam" Water 14, no. 21: 3367. https://doi.org/10.3390/w14213367